pricoa global funding i $15,000,000,000 global … · and analysis of financial condition ... to...
TRANSCRIPT

PRICOA Global Funding I
$15,000,000,000 Global Medium Term Note Program
This base prospectus supplement, including Annexes 1, 2 and 3 attached hereto (this “First Base Prospectus Supplement”), supplements and must be read in conjunction with the Offering Circular dated May 10, 2017 (the “Base Prospectus”), prepared by PRICOA Global Funding I, a statutory trust organized in series under the laws of the State of Delaware (the “Issuer”), under the Program (as defined in the Base Prospectus).
This document constitutes a base prospectus supplement for purposes of Article 16 of Directive 2003/71/EC (the “Prospectus Directive 2003/71/EC”). This First Base Prospectus Supplement has been approved by the Central Bank of Ireland, as competent authority under the Prospectus Directive 2003/71/EC. The Central Bank of Ireland only approves this First Base Prospectus Supplement as meeting the requirements imposed under Irish and EU law pursuant to the Prospectus Directive 2003/71/EC.
Annex 1 of this First Base Prospectus Supplement includes the unaudited financial statements of The Prudential Insurance Company of America, a New Jersey, United States stock life insurance company (“PICA”), as of and for the three months ended March 31, 2017 and 2016, (including any notes thereto, the “First Quarter Financial Statements”), prepared on the basis of statutory accounting principles, and Management’s Discussion and Analysis of Financial Condition and Results of Operations of PICA (prepared based upon the First Quarter Financial Statements), as of and for the three months ended March 31, 2017 and 2016 (the “First Quarter MD&A”).
Annex 2 of this First Base Prospectus Supplement includes the unaudited financial statements of PICA, as of and for the six months ended June 30, 2017 and 2016, (including any notes thereto, the “Second Quarter Financial Statements”), prepared on the basis of statutory accounting principles, and Management’s Discussion and Analysis of Financial Condition and Results of Operations of PICA (prepared based upon the Second Quarter Financial Statements), as of and for the six months ended June 30, 2017 and 2016 (the “Second Quarter MD&A”).
Annex 3 of this First Base Prospectus Supplement includes the Capitalization of the Issuer as of June 30, 2017, prepared in conformity with generally accepted accounting principles in the United States of America (the “Capitalization of the Issuer”).
Copies of the First Quarter Financial Statements, First Quarter MD&A, the Second Quarter Financial Statements, Second Quarter MD&A and Capitalization of the Issuer will also be made available for inspection at the offices of the Irish Listing Agent of the Issuer at A&L Listing Limited, International Financial Services Centre, North Wall Quay, Dublin 1, Ireland.
Moody’s Investors Service, Inc. (“Moody’s”) is not established in the European Economic Area but the ratings assigned by it are endorsed by Moody’s Investors Service Limited.
S&P Global Ratings, acting through Standard & Poor’s Financial Services, LLC (“S&P”), is not established in the European Economic Area but the ratings assigned by it are endorsed by Standard & Poor’s Credit Market Services Europe Limited.
A.M. Best Company (“A.M. Best”) is not established in the European Economic Area but the ratings assigned by it are endorsed by A.M. Best Europe-Rating Services Ltd.
Fitch Ratings, Inc. (“Fitch”) is not established in the European Economic Area but the ratings assigned by it are endorsed by Fitch Ratings Ltd.
Each of Moody’s, S&P, Fitch and A.M. Best is a rating agency not established in the European Economic Area and not registered under Regulation (EC) No. 1060/2009 (the “CRA Regulation”) by the relevant competent authorities and not included in the list of

credit rating agencies published by the European Securities and Market Authority on its website in accordance with the CRA Regulation.
The rating of certain Series of Notes to be issued under the Program may be specified in the applicable Final Terms (as defined in the Base Prospectus). Whether or not each rating applied for in relation to the relevant Series of Notes will be issued by a credit rating agency established in the European Economic Area and registered under the CRA Regulation will be disclosed in the applicable Final Terms.
A rating is not a recommendation to buy, sell or hold securities and may be subject to revision, suspension or withdrawal at any time by the assigning rating agency. In general, European regulated investors are restricted under the CRA Regulation from using credit ratings for regulatory purposes, unless such ratings are issued by a credit rating agency established in the EU and registered under the CRA Regulation (and such registration has not been withdrawn or suspended), subject to transitional provisions that apply in certain circumstances while the registration application is pending. Such general restriction will also apply in the case of credit ratings issued by non-EU credit rating agencies, unless the relevant credit ratings are endorsed by an EU-registered credit rating agency or the relevant non-EU rating agency is certified in accordance with the CRA Regulation (and such endorsement action or certification, as the case may be, has not been withdrawn or suspended).
Except as disclosed in this First Base Prospectus Supplement, there are no significant new factors, material mistakes or inaccuracies relating to the information included in the Base Prospectus affecting the assessment of the Notes to be offered under the Base Prospectus, as so supplemented, that have arisen since the publication of the Base Prospectus. Each of the Issuer and PICA accepts responsibility that, having taken all reasonable care to ensure that such is the case, the information contained in this First Base Prospectus Supplement, to the best of its knowledge, is in accordance with the facts and contains no omission likely to affect the import of such information.
To the extent that there is any inconsistency between any statement in this First Base Prospectus Supplement and any statement in or incorporated by reference in the Base Prospectus, the statements in this First Base Prospectus Supplement will prevail.
The Issuer is not a subsidiary of PICA or of any affiliate of PICA. The obligations of the Issuer evidenced by the Notes will not be obligations of, and will not be guaranteed by, any person, including, but not limited to, PICA or Prudential Financial, Inc. (“PFI”), or any of their respective subsidiaries or affiliates. PICA and PFI of the United States are not affiliated with Prudential plc, which is headquartered in the United Kingdom. THE NOTES HAVE NOT BEEN AND WILL NOT BE REGISTERED UNDER THE UNITED STATES SECURITIES ACT OF 1933, AS AMENDED (THE “SECURITIES ACT”), OR ANY APPLICABLE STATE OR FOREIGN SECURITIES LAWS, AND MAY NOT BE OFFERED OR SOLD EXCEPT TO (1) PERSONS REASONABLY BELIEVED TO BE QUALIFIED INSTITUTIONAL BUYERS (AS DEFINED IN RULE 144A UNDER THE SECURITIES ACT) OR (2) PERSONS WHO ARE NOT U.S. PERSONS (AS DEFINED IN REGULATION S UNDER THE SECURITIES ACT (“REGULATION S”)) OUTSIDE THE UNITED STATES IN ACCORDANCE WITH REGULATION S. All transfers of the Notes in the United States, whether in the initial distribution or in secondary trading, will be limited to transferees who are Qualified Institutional Buyers. The Notes are not transferable except as described in the Base Prospectus, as supplemented, and in the relevant Terms and Conditions of each Series of the Notes.
Supplement dated October 26, 2017

Annex 1

MANAGEMENT’S DISCUSSION AND ANALYSIS
OF FINANCIAL CONDITION AND RESULTS OF OPERATIONS OF PICA
AS OF AND FOR THE THREE MONTHS ENDED MARCH 31, 2017
(See Annex A for definitions of certain terms used in this Management’s Discussion and Analysis)
Summary of Principal Differences between SAP and GAAP
The financial information for The Prudential Insurance Company of America (“PICA”) in this
Management’s Discussion and Analysis has been prepared and presented in accordance with SAP. Certain
differences exist between SAP and GAAP which might be material to the financial information herein. The
matters described below summarize certain differences between SAP and GAAP that may be material. The
Company is responsible for preparing the summary below. The Company has not prepared a complete
reconciliation of its consolidated financial statements and related footnote disclosures between SAP and
GAAP and has not quantified such differences. Accordingly, no assurance is provided that the following
summary of differences between SAP and GAAP is complete. In making an investment decision, investors
must rely upon their own examination of the Company, the terms of the offering and the financial information.
Potential investors should consult their own professional advisors for an understanding of the differences
between SAP and GAAP, and how those differences might affect the financial information herein.
The significant differences between SAP and GAAP are noted below:
The SAP financial statements of PICA do not consolidate its subsidiaries. The equity value of its
subsidiaries are recorded as preferred stock, common stock and other invested assets.
Under SAP, policy acquisition costs, such as commissions, and other costs incurred in connection
with acquiring new business, are expensed when incurred; under GAAP, such costs are deferred
and amortized either over the expected lives of the contracts or based on the level and timing of
either gross margins, gross profits or gross premiums, depending on the type of contract.
Under SAP, CRVM is used for the majority of individual insurance reserves; under GAAP, individual
insurance policyholder liabilities for traditional forms of insurance are generally established using
the net level premium method. For interest-sensitive policies, a liability for policyholder account
balances is established under GAAP based on the contract value that has accrued to the benefit of
the policyholder. Policy valuation assumptions used in the estimation of policyholder liabilities
are generally prescribed under SAP; under GAAP, policy valuation assumptions are based upon
best estimates as of the date the policy is issued, with provisions for the risk of adverse deviation.
Under SAP, CARVM is used for the majority of individual deferred annuity reserves; under GAAP,
individual deferred annuity policyholder liabilities are generally equal to the contract value that
has accrued to the benefit of the policyholder, in addition to liabilities for certain guarantees under
variable annuity contracts.
Under SAP, reinsurance reserve credits taken by ceding entities as a result of reinsurance contracts
are netted against the ceding entity’s policy and claim reserves and unpaid claims; under GAAP,
reinsurance recoverables are reported as assets.
Under SAP, IMR is established to capture realized investment gains and losses, net of tax, on the sale
of bonds and interest-related other-than-temporary impairment of bonds resulting from changes
in the general levels of interest rates, and is amortized into income over the remaining years to

2
expected maturity of the assets sold or impaired; under GAAP, no such reserve is required.
Under SAP, AVR based upon a formula prescribed by the NAIC is established as a liability to offset
potential non-interest related investment losses, and changes in the AVR are charged or credited
directly to surplus; under GAAP, no such reserve is required.
Under SAP, investments in bonds and preferred stocks are generally carried at amortized cost; under
GAAP, investments in bonds and preferred stocks, other than those classified as held to maturity,
are carried at fair value.
Under SAP, certain assets designated as non-admitted are excluded from assets by a direct charge to
surplus; under GAAP, such assets are carried on the balance sheet with appropriate valuation
allowances.
Under SAP, surplus notes are recorded as a component of surplus; under GAAP, surplus notes are
recorded as debt.
Under SAP, an extraordinary distribution approved by PICA’s regulator may be recorded as a return
of capital; under GAAP, the distribution is recorded as a dividend when PICA has undistributed
retained earnings.
Under SAP, goodwill is subject to admissibility limits and is amortized over a period not to exceed
ten years; under GAAP, goodwill is subject to impairment testing and not amortized.
Under SAP, income tax expense is based upon taxes currently payable. Changes in deferred taxes are
generally reported in surplus and subject to admissibility limits; under GAAP, changes in deferred
taxes are generally recorded in income tax expense.
Under SAP, deposits to universal life contracts and immediate annuity contracts without life
contingencies are credited to revenue; under GAAP, such deposits are reported as increases to the
policyholder account balances.
Under SAP, certain contracts, in particular deferred annuities with mortality risk, are considered “life
contracts” and, accordingly, premiums associated with these contracts are reported as revenues.
Under GAAP, the Company’s deferred annuities are classified as either “insurance contracts” or
“investment contracts” and, accordingly, those annuities classified as investment contracts are not
reported as revenues. Amounts received for investment contracts are not reported as policy
liabilities and insurance reserves.
Under SAP, interest-related other-than-temporary impairments for bonds are determined based
primarily upon PICA’s intent to sell or inability to assert its intent and ability to hold the security
until recovery; under GAAP, other-than-temporary impairments for debt securities are based
primarily upon whether PICA intends to sell the security or more likely than not will be required
to sell the security before recovery of its amortized cost basis.
Under SAP, there is no concept of value of business acquired ("VOBA"); under GAAP, VOBA is
recorded as an asset.
Under SAP, an embedded derivative instrument shall not be separated from the host contract and
accounted for separately as a derivative instrument; under GAAP, the accounting and bifurcation
for embedded derivatives follows Accounting Standards Codification ("ASC") 815 - "Derivatives
and Hedging", with the change in fair value during each reporting period recorded within
“Realized investment gains (losses)."

3
Overview
PICA is one of the largest insurance companies in the United States. The principal products and services of
PICA include individual life insurance and annuities, group insurance and pension and retirement products and
related services and administration. The results in the analysis below include the results of the Closed Block
division, which comprises the assets and related liabilities of the Closed Block. The principal executive offices
of PICA are located in Newark, New Jersey.
As of March 31, 2017 and December 31, 2016, PICA's admitted assets were $260 billion (including $136
billion held in separate accounts). Excluding separate accounts, assets were primarily comprised of a mix of
bonds, mortgage loans, contract loans, cash and short-term investments, other invested assets, and equity
investments designed to match the cash flow requirements of insurance liabilities.
Results of Operations
Net Income
2017 to 2016 Three Month Comparison. Net income for the three months ended March 31, 2017 was $228
million compared to $24 million for the three months ended March 31, 2016. The increase of $204 million
between periods includes a $416 million increase in operating income before income taxes, from $76 million for
the three months ended March 31, 2016 to $492 million for the three months ended March 31, 2017, which was
primarily driven by the following:
• A $271 million increase in the individual life and annuity business primarily driven by lower reserves in
the annuities business due to more favorable market conditions in the current period compared to the same
period of 2016. Also, contributing to the increase were higher asset management fees and surrender
charges assumed from an affiliate, PLNJ, partially offset by higher assumed commissions. The
reinsurance agreement with PLNJ became effective in the second quarter of 2016;
• A $146 million increase in the retirement business primarily driven by higher spread income mainly due
to growth in the pension risk transfer business. Also contributing to the increase was higher income from
alternative investments;
• A $23 million increase in the international insurance business primarily driven by the renewal business
assumed from PGFL partially offset by an increase in commissions as a result of growth of U.S. dollar
denominated business assumed from PLICJ;
• A $14 million increase in the group insurance business primarily driven by higher spread income mainly
due to an increase in invested assets as a result of business growth; and
Partially offset by:
• A $38 million decrease in the corporate and other business primarily driven by higher compensation
related expenses.
The above increase in net income was partially offset by a $136 million increase in net realized capital losses,
from $27 million for the three months ended March 31, 2016 to $163 million for the three months ended March
31, 2017. The components of net realized capital losses are discussed below under “Capital (Losses)/Gains.”
Net income also included a $76 million increase in the income tax provision from $25 million for the three
months ended March 31, 2016 to $101 million for the three months ended March 31, 2017, which is further
discussed below under “Income Tax Provision.”

4
Change in Statutory Capital and Surplus
For the three months ended March 31, 2017. Statutory capital (surplus plus AVR) increased $397 million,
from $13,445 million at December 31, 2016 to $13,842 million at March 31, 2017. The increase in capital for the
period ended March 31, 2017 was primarily driven by:
• Net income of $228 million, as discussed above under “Net Income”; and
• A $159 million change in unrealized capital gains (excluding deferred tax) primarily due to gains from
affiliated common stocks. The change in net unrealized capital gains are further discussed below under
“Capital (Losses)/Gains.”
Revenues
2017 to 2016 Three Month Comparison. Total revenues increased $129 million from $6,327 million for the
three months ended March 31, 2016 to $6,456 million for the three months ended March 31, 2017. The increase
in total revenues was primarily driven by a $179 million increase in premiums between periods from $4,565
million for the three months ended March 31, 2016 to $4,744 million for the three months ended March 31, 2017.
The increase in premiums was primarily driven by:
• A $187 million increase in the international insurance business primarily driven by the reinsurance of
PGFL and PLICJ’s U.S. dollar denominated business as a result of business growth;
• A $132 million increase in the individual life and annuity business primarily driven by assumed premiums
from PLNJ in the annuities business;
Partially offset by:
• A $129 million decrease in the retirement business primarily driven by lower sales of structured settlement
contracts; and
• A $16 million decrease in the group insurance business primarily driven by lower premiums on existing
experience rated contracts in the group life business. Partially offsetting this activity were higher sales
in the life and long-term disability businesses.
Additionally, contributing to the increase in total revenue was an increase in net investment income, which
includes IMR amortization, of $86 million from $1,237 million for the three months ended March 31, 2016 to
$1,323 million for the three months ended March 31, 2017. This increase was primarily driven by higher income
from alternative investments in the retirement business. Additionally, net investment income increased in the
international insurance business primarily due to an increase in invested assets as a result of continued business
growth.
Partially offsetting these increases in total revenue was a decrease in other income of $136 million, from $525
million for the three months ended March 31, 2016 to $389 million for the three months ended March 31, 2017.
The decrease in other income was primarily driven by lower gains from separate accounts in the retirement
business.
5
Benefits
2017 to 2016 Three Month Comparison. Total benefits, surrenders and fund withdrawals increased $689
million from $5,908 million for the three months ended March 31, 2016 to $6,597 million for the three months
ended March 31, 2017. The increase in total benefits, surrenders and fund withdrawals was primarily driven by:
• A $593 million increase in the retirement business mainly driven by an increase in separate account
withdrawals and benefits related to the pension risk transfer business;
• A $209 million increase in the individual life and annuity business primarily driven by higher assumed
surrenders and benefits in the annuities business as a result of the reinsurance transaction with PLNJ.
Also, contributing to the increase were higher benefits in the life business driven by unfavorable mortality
experience;
• A $27 million increase in the international insurance business primarily due to higher assumed surrenders
and benefits from PGFL and PLICJ; and
Partially offset by:
• A $145 million decrease in the group insurance business primarily driven by a partial surrender of a large
TOLI contract during the first quarter of 2016.
Net Increase in Reserves
2017 to 2016 Three Month Comparison. Reserves increased $528 million for the three months ended March
31, 2017, compared to an increase of $1,186 million for the three months ended March 31, 2016. The decrease
of $658 million in the change in reserves between years was primarily due to the following:
• A $480 million decrease in the retirement business primarily driven by favorable reserves experience
related to pension risk transfer business;
• A $274 million decrease in the individual life and annuity business primarily driven by lower reserves in
the annuities business due to more favorable market conditions in the current period compared to the same
period of 2016;
Partially offset by:
• A $128 million increase in the international insurance business mainly due to an increase in assumed
reserves from the PGFL and PLICJ U.S. dollar denominated business.
Commissions
2017 to 2016 Three Month Comparison. Commissions increased $59 million from $163 million for the three
months ended March 31, 2016 to $222 million for the three months ended March 31, 2017. The increase was
primarily driven by an increase in commissions in the international insurance business due to growth in U.S. dollar
denominated business assumed from PGFL and PLICJ. Additionally, assumed commissions increased in the
annuities business as a result of the reinsurance transaction with PLNJ.

6
Other Expenses
2017 to 2016 Three Month Comparison. Other expenses increased $39 million from $364 million for the
three months ended March 31, 2016 to $403 million for the three months ended March 31, 2017. The increase
between periods was primarily driven by higher compensation related expenses in the corporate and other
business. Partially offsetting these increases were lower expenses in the annuities business driven by adjustments
on reinsurance assumed related to the reinsurance transaction with PLNJ.
Net Transfer From Separate Accounts
2017 to 2016 Three Month Comparison. The net transfer from the separate accounts was ($1,824) million for
the three months ended March 31, 2017, compared to a net transfer from the separate accounts of ($1,423) million
for the three months ended March 31, 2016. The $401 million change was primarily driven by an increase in
separate account withdrawals as well as the impact of new pension risk transfer transactions in the retirement
business completed since the first quarter of 2016. Partially offsetting this activity was as a partial surrender in
the group insurance business of a large TOLI contract during the first quarter of 2016.
Dividends to Policyholders
2017 to 2016 Three Month Comparison. Dividends to policyholders decreased $15 million from $53 million
for the three months ended March 31, 2016 to $38 million for the three months ended March 31, 2017 primarily
driven by adjustments related to participating contracts in the group insurance business as well as the continued
run-off of the Closed Block.
Income Tax Provision
2017 to 2016 Three Month Comparison. The income tax expense increased $76 million from $25 million for
the three months ended March 31, 2016 to $101 million for the three months ended March 31, 2017 primarily due
to the increase in pretax book income. The income tax provision is calculated in accordance with SSAP No. 101,
Income Taxes. For interim periods, income taxes are computed using an estimated annual effective tax rate. The
rate is computed as the ratio of projected income tax provision for the entire year over projected statutory net gain
from operations for the year.

7
Capital (Losses)/Gains
2017 to 2016 Three Month Comparison. Net realized capital losses, after taxes and contribution to the IMR,
increased $136 million, from $27 million for the three months ended March 31, 2016 to $163 million for the three
months ended March 31, 2017. The following table sets forth the components of net realized capital losses:
Three Months Three Months
Ended
March 31,
Ended
March 31,
2017 2016 Change
Bonds…………………….……………………………… $ (6) $ (111) $ 105
Equity securities…………………………………………. - - -
Derivative instruments…………………………………… (39) 4 (43)
Other invested assets…………………………………….. (10) 1 (11)
Other………………………………….………………….. 3 43 (40)
Gross realized capital losses……….…………………. (52) (63) 11
Less capital gains tax…...………..……..………………… 101 (16) (117)
Less IMR transfers, net of tax ………....………………… 10 (20) (30)
Net realized capital losses……….…...……………….. $ (163) $ (27) $ (136)
Net realized capital losses for the three months ended March 31, 2017 were primarily driven by capital gains
tax, losses on derivatives and other-than-temporary impairments on bonds. For interim periods, the capital gains
tax is derived as the difference between the total tax and the income tax provision. The total tax is a function of
pre-tax book income and the use of the effective tax rate method. Derivative losses of $39 million were primarily
driven by equity swap settlements on short positions due to favorable market conditions in the current period. The
losses on bonds of $6 million include $21 million of other-than-temporary impairments.
Net realized capital losses for the three months ended March 31, 2016 were primarily driven by realized capital
losses on bonds, partially offset by gains on other assets related to short-term investments and real estate. The
losses on bonds of $111 million include $52 million of other-than-temporary bond impairments. The IMR
transfers of $20 million were primarily driven by losses on bonds, partially offset by gains on short-term
investments and derivatives.
Change in net unrealized capital gains was $160 million for the three months ended March 31, 2017, and was
mainly due to affiliated common stock gains primarily driven by admittance of a previously non-admitted loan as
well as earnings from PICA’s insurance subsidiary, PRIAC.
Change in net unrealized capital gains was $646 million for the three months ended March 31, 2016, and was
mainly due to gains from derivatives as a result of a decrease in interest rates during the period. In addition,
affiliated common stock gains were driven by earnings from PICA’s insurance subsidiary, PLI. These gains were
partially offset by deferred taxes.

8
Investment Results
Summary of Investments
PICA's general account investment portfolio consists of public and private bonds, stocks, mortgage loans on
real estate, real estate, contract loans, and other invested assets such as joint ventures and limited partnerships.
The composition of PICA's portfolio reflects, within the discipline provided by its risk management approach, its
need for competitive results and the selection of diverse investment alternatives available primarily through its
asset management segment. The size of PICA's portfolio enables it to invest in asset classes that may be
unavailable to the typical investor.
The following table sets forth the composition of PICA's invested assets as of the dates indicated in accordance
with SAP.
Long-term bonds
Public bonds………………………………………….
$52,816 45.2%
$52,745 45.2%
Private bonds…………………………………………
24,201 20.7%
23,594 20.2%
Preferred stock…………………………………………..
58 0.0%
58 0.0%
Common stock…………………………………………..
6,642 5.7%
6,262 5.4%
Mortgage loans on real estate…………………………
18,270 15.6%
18,122 15.5%
Real estate……………………………………………….
548 0.5%
552 0.5%
Contract loans……………………………………….......
3,007 2.6%
2,969 2.5%
Cash and short-term investments……………………….
3,398 2.9%
4,276 3.7%
Other invested assets……………………………………
4,953 4.2%
4,930 4.2%
Receivables for securities……………………………….
34 0.0%
49 0.0%
Derivatives………………………………………………
3,029 2.6%
3,226 2.8%
Total invested assets……………………………… $116,956 100.0%
$116,783 100.0%
The overall income yield on PICA's invested assets after investment expenses, but excluding net realized
investment gains (losses) and IMR amortization, for the three months ended March 31, 2017 and March 31, 2016
was 4.51% and 4.39%, respectively. The increase in the income yield was primarily driven by higher yield from
non-coupon investments for the three months ended 2017. The following table sets forth the income yield and
investment income, excluding realized investment gains (losses) and IMR amortization, for each major investment
category of PICA for the periods indicated.
March 31, 2017 December 31, 2016
Carrying
Amount
% of
Total
Carrying
Amount
% of
Total
($ in millions)

9
Bonds
PICA held approximately 66% and 65% of its invested general account assets in bonds as of March 31, 2017
and December 31, 2016, respectively. These securities included both publicly-traded and privately-placed debt
securities representing an array of industry categories.
PICA manages its public portfolio to a risk profile directed by the CIO Organization and Risk Management
groups and to a profile that also reflects the local market environment impacting its insurance portfolio. PICA
seeks to employ relative value analysis both in credit selection and in purchasing and selling securities. The return
that PICA earns on the portfolio is reflected both as investment income and also as realized gains or losses on
investments.
PICA uses privately-placed corporate debt securities and commercial mortgage loans, which consist of well-
underwritten mortgages on diversified properties in terms of geography, property type and borrowers, to enhance
yield on its portfolio and to improve the overall diversification of the portfolio. Private placements typically offer
enhanced yields due to an illiquidity premium and generally offer enhanced credit protection in the form of
covenants. PICA’s origination capability offers the opportunity to lead transactions and gives it the opportunity
for better terms, including covenants and call protection, and to take advantage of innovative deal structures.
Three Months Ended
March 31, 2017 March 31, 2016
Yield Amount Yield Amount
($ in millions)
Long-term bonds………………….……………………… 4.45 % $849 4.51%
$788
Stocks………………………………………...…………... 10.98 176 8.75 169
Mortgage loans………………………….………………... 4.33 196 4.71 210
Contract loans…………………………………………….. 5.02 37 4.99 36
Cash and short-term investments........................................ 1.36 13 1.08 11
Other investments………………………….……………... 8.68 186 6.64 134
Total before investment expenses……….…………... 5.02 % $1,457 4.88 %
$1,348
Total after investment expenses……………………... 4.51 %
$1,311 4.39 %
$1,215
10
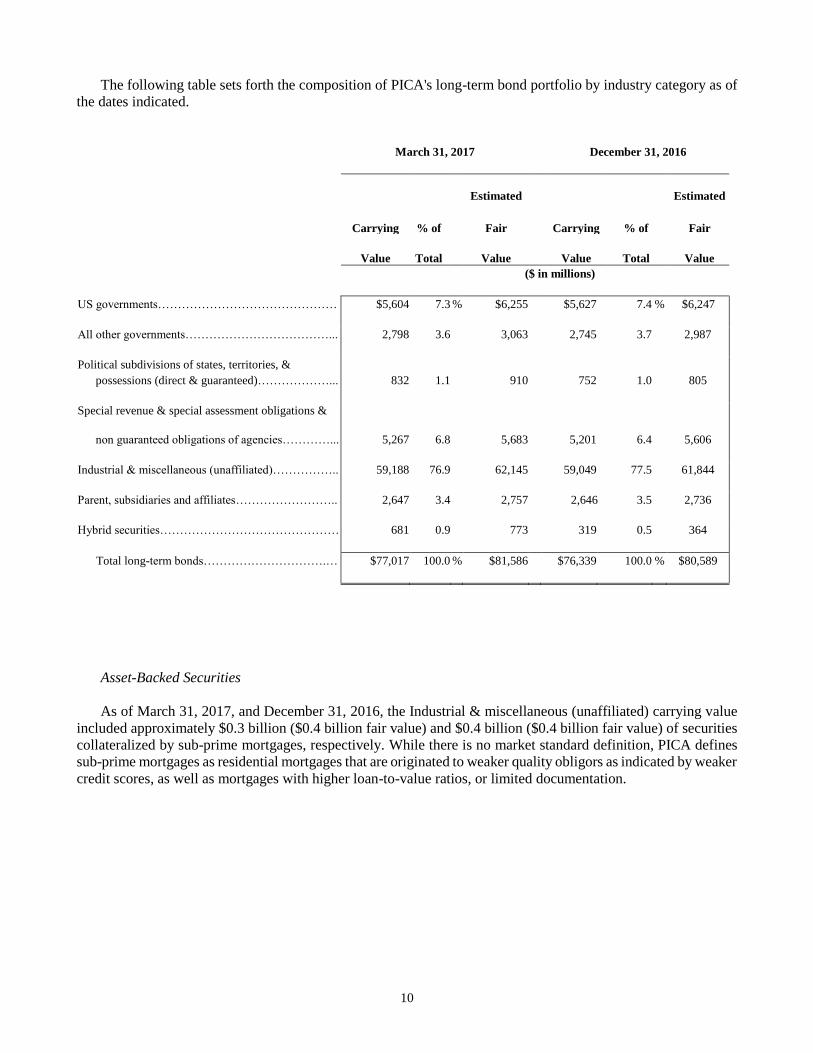
The following table sets forth the composition of PICA's long-term bond portfolio by industry category as of
the dates indicated.
March 31, 2017 December 31, 2016
Estimated Estimated
Carrying % of Fair Carrying % of Fair
Value Total Value Value Total Value
($ in millions)
US governments……………………………………… $5,604 7.3 % $6,255 $5,627 7.4 % $6,247
All other governments………………………………... 2,798 3.6 3,063 2,745 3.7 2,987
Political subdivisions of states, territories, &
possessions (direct & guaranteed)………………... 832 1.1 910 752 1.0 805
Special revenue & special assessment obligations &
non guaranteed obligations of agencies…………... 5,267 6.8 5,683 5,201 6.4 5,606
Industrial & miscellaneous (unaffiliated)…………….. 59,188 76.9 62,145 59,049 77.5 61,844
Parent, subsidiaries and affiliates…………………….. 2,647 3.4 2,757 2,646 3.5 2,736
Hybrid securities……………………………………… 681 0.9 773 319 0.5 364
Total long-term bonds………………………….… $77,017 100.0 % $81,586 $76,339 100.0 % $80,589
Asset-Backed Securities
As of March 31, 2017, and December 31, 2016, the Industrial & miscellaneous (unaffiliated) carrying value
included approximately $0.3 billion ($0.4 billion fair value) and $0.4 billion ($0.4 billion fair value) of securities
collateralized by sub-prime mortgages, respectively. While there is no market standard definition, PICA defines
sub-prime mortgages as residential mortgages that are originated to weaker quality obligors as indicated by weaker
credit scores, as well as mortgages with higher loan-to-value ratios, or limited documentation.

11
The following table sets forth the carrying value and fair value of PICA’s asset-backed securities by credit
quality as of the date indicated.
(1) Bonds are carried at amortized cost, excluding NAIC 6 rated bonds, which are carried at the lower of amortized cost or fair market value.
The table above provides ratings assigned by nationally recognized rating agencies as of March 31, 2017,
including S&P, Moody’s and Fitch. In making its investment decisions, rather than relying solely on the rating
agencies’ evaluations, PICA assigns internal ratings to its asset-backed securities based upon its dedicated asset-
backed securities unit’s independent evaluation of the underlying collateral and securitization structure, including
any guarantees from monoline bond insurers.
The carrying value of asset-backed securities collateralized by sub-prime mortgages decreased from $0.4
billion ($0.4 billion fair value) as of December 31, 2016, to $0.3 billion ($0.4 billion fair value) as of March 31,
2017, primarily reflecting sales and paydowns.
Commercial Mortgage-Backed Securities
As of March 31, 2017, and December 31, 2016, Industrial & miscellaneous (unaffiliated) carrying value
included approximately $4.6 billion ($4.7 billion fair value) and $4.7 billion ($4.8 billion fair value) of commercial
mortgage-backed securities, respectively.
March 31, 2017
Lowest Rating Agency Rating
AAA AA A BBB
BB and
below
Carrying
Value (1)
Total
Fair
Value
(in millions)
Collateralized by sub-prime
mortgages………………………………….. $ 0 $ 0 $ 16 $ 29 $ 293 $ 338 $ 433
Collateralized by auto loans ......... ………… 661
0 0 0 0 661 662
Collateralized by credit cards ...................... 114
0 0 0 0 114 116
Other asset-backed securities ...................... 4,890
408
25
16 42
5,381
5,417
Total asset-backed securities ............... $ 5,665
$ 408
$ 41
$ 45 $ 335 $ 6,494
$ 6,628
12
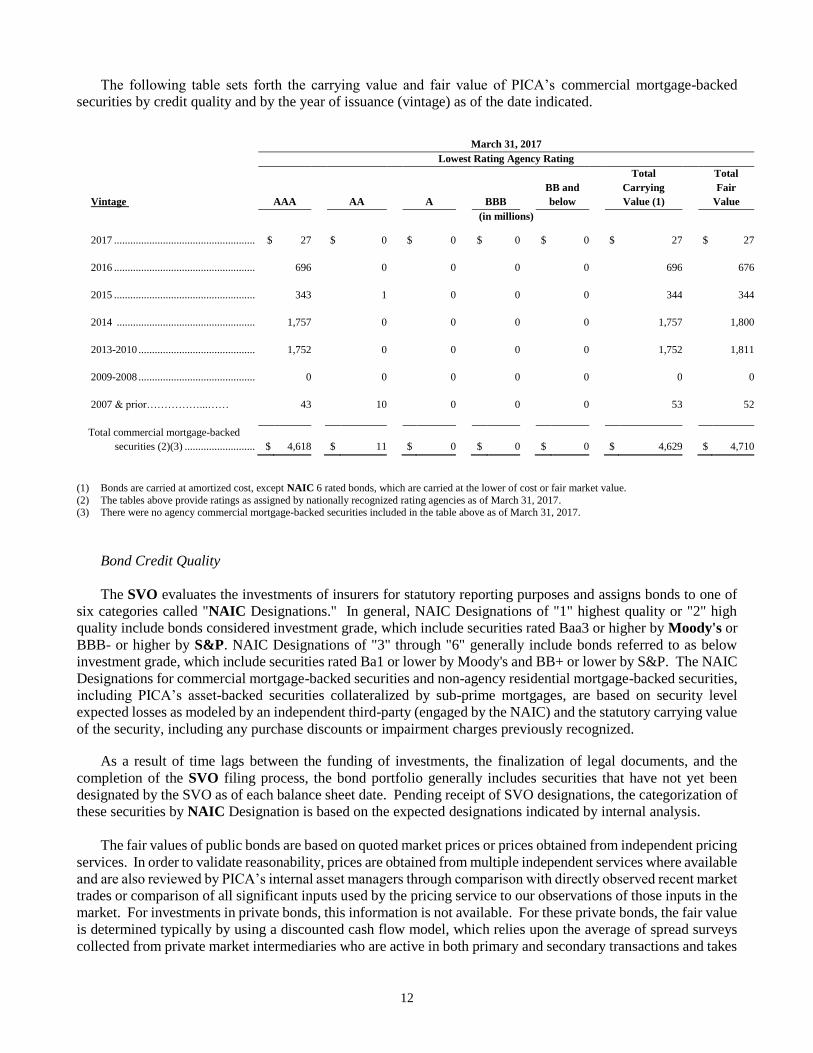
The following table sets forth the carrying value and fair value of PICA’s commercial mortgage-backed
securities by credit quality and by the year of issuance (vintage) as of the date indicated.
(1) Bonds are carried at amortized cost, except NAIC 6 rated bonds, which are carried at the lower of cost or fair market value.
(2) The tables above provide ratings as assigned by nationally recognized rating agencies as of March 31, 2017. (3) There were no agency commercial mortgage-backed securities included in the table above as of March 31, 2017.
Bond Credit Quality
The SVO evaluates the investments of insurers for statutory reporting purposes and assigns bonds to one of
six categories called "NAIC Designations." In general, NAIC Designations of "1" highest quality or "2" high
quality include bonds considered investment grade, which include securities rated Baa3 or higher by Moody's or
BBB- or higher by S&P. NAIC Designations of "3" through "6" generally include bonds referred to as below
investment grade, which include securities rated Ba1 or lower by Moody's and BB+ or lower by S&P. The NAIC
Designations for commercial mortgage-backed securities and non-agency residential mortgage-backed securities,
including PICA’s asset-backed securities collateralized by sub-prime mortgages, are based on security level
expected losses as modeled by an independent third-party (engaged by the NAIC) and the statutory carrying value
of the security, including any purchase discounts or impairment charges previously recognized.
As a result of time lags between the funding of investments, the finalization of legal documents, and the
completion of the SVO filing process, the bond portfolio generally includes securities that have not yet been
designated by the SVO as of each balance sheet date. Pending receipt of SVO designations, the categorization of
these securities by NAIC Designation is based on the expected designations indicated by internal analysis.
The fair values of public bonds are based on quoted market prices or prices obtained from independent pricing
services. In order to validate reasonability, prices are obtained from multiple independent services where available
and are also reviewed by PICA’s internal asset managers through comparison with directly observed recent market
trades or comparison of all significant inputs used by the pricing service to our observations of those inputs in the
market. For investments in private bonds, this information is not available. For these private bonds, the fair value
is determined typically by using a discounted cash flow model, which relies upon the average of spread surveys
collected from private market intermediaries who are active in both primary and secondary transactions and takes
March 31, 2017
Lowest Rating Agency Rating
Vintage AAA AA A BBB
BB and
below
Total
Carrying
Value (1)
Total
Fair
Value
(in millions)
2017 .................................................... $ 27
$ 0
$ 0
$ 0
$ 0
$ 27
$ 27
2016 ....................................................
696
0
0
0
0
696
676
2015 ....................................................
343 1 0 0
0 344 344
2014 ...................................................
1,757 0 0 0
0 1,757 1,800
2013-2010 ...........................................
1,752 0 0 0
0 1,752 1,811
2009-2008 ...........................................
0 0 0 0
0 0 0
2007 & prior……………...……
43 10 0 0
0 53 52
Total commercial mortgage-backed
securities (2)(3) .......................... $ 4,618 $ 11 $ 0 $ 0 $ 0 $ 4,629
$ 4,710

13
into account, among other factors, the credit quality of the issuer and the reduced liquidity associated with private
bonds.
In determining the fair value of certain bonds, the discounted cash flow model may also use unobservable
inputs, which reflect PICA’s own assumptions about the inputs market participants would use in pricing the asset.
The following table sets forth PICA's bond portfolio by NAIC Designation as of the dates indicated.
Bonds by Credit Quality
March 31, 2017 December 31, 2016
Estimated Estimated
Carrying % of Fair Carrying % of Fair
NAIC Designation Value (1) Total Value Value (1) Total Value
($ in millions)
1 $51,584 67.0 % $54,473 $50,994 66.8 % $53,709
2 20,436 26.5 21,860 20,257 26.5 21,555
Subtotal High or Highest Quality Securities (2) 72,020 93.5 76,333 71,251 93.3 75,264
3 3,189 4.1 3,367 3,408 4.5 3,558
4 1,026 1.4 1,035 952 1.3 958
5 564 0.7 593 542 0.7 583
6 218 0.3 258 186 0.2 226
Subtotal Other Securities (3) 4,997 6.5 5,253 5,088 6.7 5,325
Total Bonds $77,017 100.0 % $81,586 $76,339 100.0 % $80,589
(1) Bonds are carried at amortized cost, except NAIC 6 rated bonds, which are carried at the lower of cost or fair market value.
(2) As of March 31, 2017, includes $51,614 million of public bonds and $20,406 million of private bonds and, as of December 31, 2016, includes $51,464 million of public bonds and $19,145 million of private bonds.
(3) As of March 31, 2017, includes $1,202 million of public bonds and $3,795 million of private bonds and, as of December 31, 2016, includes
$1,280 million of public bonds and $3,808 million of private bonds.
Other-Than-Temporary Impairments of Bonds
PICA maintains separate monitoring processes for public and private bonds and creates watch lists to highlight
bonds that require special scrutiny and management. The public bond asset managers review on a quarterly basis
and more frequently when necessary to identify potential credit deterioration whether due to ratings downgrades,
unexpected price variances, and/or company or industry specific concerns.
For private placements, PICA’s credit and portfolio management processes help ensure prudent controls over
valuation and management. PICA has separate pricing and authorization processes to establish "checks and
balances" for new investments. PICA applies consistent standards of credit analysis and due diligence for all
transactions, whether they originate through its own in-house origination staff or through agents. PICA's regional

14
offices closely monitor the portfolios in their regions. PICA sets all valuation standards centrally, and assesses the
fair value of all investments quarterly. PICA’s private bond asset managers formally review all private bond
holdings on a quarterly basis or more frequently when necessary to identify potential credit deterioration whether
due to ratings downgrades, unexpected price variances, and/or company or industry specific concerns.
All bonds with unrealized losses are subject to review to identify other-than-temporary impairments in value.
In evaluating whether a decline in value is other-than-temporary, PICA considers several factors including, but
not limited to, the following:
• the reasons for the decline in value (credit event, currency or interest rate related, including general credit
spread widening);
• PICA's ability and intent to hold its investment for a period of time to allow for recovery of value;
• PICA's intent to sell its investment before recovery of the cost of the investment;
• the financial condition of and near-term prospects of the issuer; and
• the extent and duration of the decline.
In determining whether a decline in value is other-than-temporary, PICA places a greater emphasis on analysis
of the underlying credit versus the extent and duration of a decline in value. PICA’s credit analysis of an
investment includes determining whether the issuer is current on its contractual payments, evaluating whether it
is probable that PICA will be able to collect all amounts due according to the contractual terms of the security,
and analyzing PICA’s overall ability to recover the carrying value of the investment. PICA continues to utilize
valuation declines as a potential indicator of credit deterioration, and applies additional levels of scrutiny in its
analysis as the severity and duration of the decline increases.
Under SSAP No. 43R, an other-than-temporary impairment occurs when the entity does not expect (on a
discounted basis) to recover the entire cost basis of a loan-backed or structured security. The amount of the other-
than-temporary impairment recognized as a realized loss equals the difference between the investment's cost basis
and the present value of cash flows expected to be collected, discounted at the effective interest rate implicit in
the debt security prior to impairment. The present value of cash flows expected to be collected becomes the new
cost basis of the investment. Additionally, if an entity wrote the security down to fair value due to the intent to
sell or because it does not have the ability and intent to hold a security in an unrealized loss position for a period
of time sufficient to recover the cost of the security, the non-interest related portion of the other-than-temporary
impairment losses is recorded through the AVR while the interest related other-than-temporary impairment losses
is recorded through the IMR.
Preferred Stock
PICA held less than 1% of its invested general account assets in preferred stock as of both March 31, 2017
and December 31, 2016.
Common Stocks
PICA held approximately 6% and 5% of its invested general account assets in common stock as of March 31,
2017 and December 31, 2016, respectively. Substantially all of PICA's unaffiliated common stocks are publicly-
traded on national securities exchanges.
Impairments of Common Stocks
Common stocks with unrealized losses are subject to review to identify other-than-temporary impairments in
value. In evaluating whether a decline in value is other-than-temporary, PICA consistently considers several
factors including, but not limited to, the following:

15
• the extent and the duration of the decline; including, but not limited to, the following general guidelines:
o declines in value greater than 20%, maintained for six months or greater;
o declines in value maintained for one year or greater; and
o declines in value greater than 50%.
• the reasons for the decline in value (credit event, currency or market fluctuation);
• PICA’s ability and intent to hold the investment for a period of time to allow for a recovery of value,
including common stock managed by independent third parties where we do not have management
discretion; and
• the financial condition of and near-term prospects of the issuer.
PICA generally recognizes other-than-temporary impairments for securities with declines in value greater
than 50% maintained for six months or greater or with any decline in value maintained for one year or greater. In
addition, in making its determinations PICA continues to analyze the financial condition and near-term prospects
of the issuer, including an assessment of the issuer’s capital position, and considers its ability and intent to hold
the investment for a period of time to allow for a recovery of value.
When it has been determined that there is an other-than-temporary impairment, PICA records a write down
in its Statement of Operations and Changes in Capital and Surplus within "Net Realized Capital Gains (Losses)"
to the estimated fair value, which reduces the cost basis. The new cost basis of an impaired security is not adjusted
for subsequent increases in estimated fair value. Estimated fair values for publicly traded common stock are based
on quoted market prices or prices obtained from independent pricing services. Estimated fair values for privately
traded common stock are determined using valuation and discounted cash flow models that require a substantial
level of judgment.
Mortgage Loans on Real Estate
Investment Mix
PICA held approximately 16% of its invested general account assets in mortgage loans on real estate as of
both March 31, 2017 and December 31, 2016.
The following table sets forth the composition of PICA’s general account investments in mortgage loans on
real estate, as of the dates indicated.
March 31,
December 31,
2017 2016
(in millions)
Commercial mortgage loans……………………... $ 16,770 $ 16,628
Agricultural property loans………………………. 1,498
1,492
Residential property loans………………………..
2
2
Total (1)………………………………………….. $ 18,270 $ 18,122
(1) The portfolio consisted of 1,112 commercial mortgage loans and 459 residential and agricultural loans as of March 31, 2017 and consisted of
1,105 commercial mortgage loans and 461 residential and agricultural loans as of December 31, 2016.
PICA originates mortgage loans on real estate using a dedicated investment staff through various regional
offices in the U.S. and International offices primarily in London. All loans are underwritten consistently to PICA's
standards using a proprietary quality rating system that has been developed from its experience in real estate and
mortgage lending.

16
PICA’s loan portfolio strategy emphasizes diversification by property type and geographic location. The
following table sets forth the breakdown of the mortgage loan portfolio by geographic region as of the dates
indicated.
March 31, 2017 December 31, 2016
Carrying % of Carrying % of
U.S. Regions: (1)
Value Total Value Total
($ in millions)
Pacific $5,947 32.5 % $5,959 32.9 %
South Atlantic 3,445 18.9 3,431 18.9
Middle Atlantic 2,645 14.5 2,647 14.6
West South Central 1,910 10.5 1,914 10.6
East North Central 1,022 5.6 1,032 5.7
Mountain 690 3.8 643 3.5
New England 789 4.3 789 4.4
West North Central 270 1.5 267 1.5
East South Central 238 1.3 235 1.3
Subtotal – U.S. Regions $16,956 92.9 % $16,917 93.4 %
Other 1,314 7.1 1,205 6.6
Total mortgage loans $18,270 100.0 % $18,122 100.0 %
(1) Regions as defined by the United States Census bureau.
PICA’s mortgage loans are geographically dispersed throughout the United States (with the largest
concentrations in California ($4.9 billion), New York ($1.7 billion), and Texas ($1.7 billion)) and include loans
secured by properties in Europe as of March 31, 2017.
As of March 31, 2017, PICA’s investments in mortgage loans had a weighted average debt service coverage
ratio of 2.37 times, and a weighted average loan-to-value ratio of 52%. Loan-to-value and debt service coverage
ratios are measures commonly used to assess the quality of mortgage loans. The loan-to-value ratio compares the
amount of the loan to the fair value of the underlying property collateralizing the loan, and is commonly expressed
as a percentage. A loan-to-value ratio less than 100% indicates an excess of collateral value over the loan amount.
Loan-to-value ratios greater than 100% indicate that the loan amount exceeds the collateral value. The debt service
coverage ratio compares a property’s net operating income to its debt service payments. Debt service coverage
ratios less than 1.0 times indicate that property operations do not generate enough income to cover the loan’s
current debt payments. A debt service coverage ratio greater than 1.0 times indicates an excess of net operating
income over the debt service payments.
The values utilized in calculating these loan-to-value ratios are developed as part of PICA’s periodic review
of the mortgage loan portfolio, which includes an internal evaluation of the underlying collateral value. PICA’s
periodic review also includes a quality re-rating process, whereby it updates the internal quality rating originally
assigned at underwriting based on the proprietary quality rating system mentioned above.
17
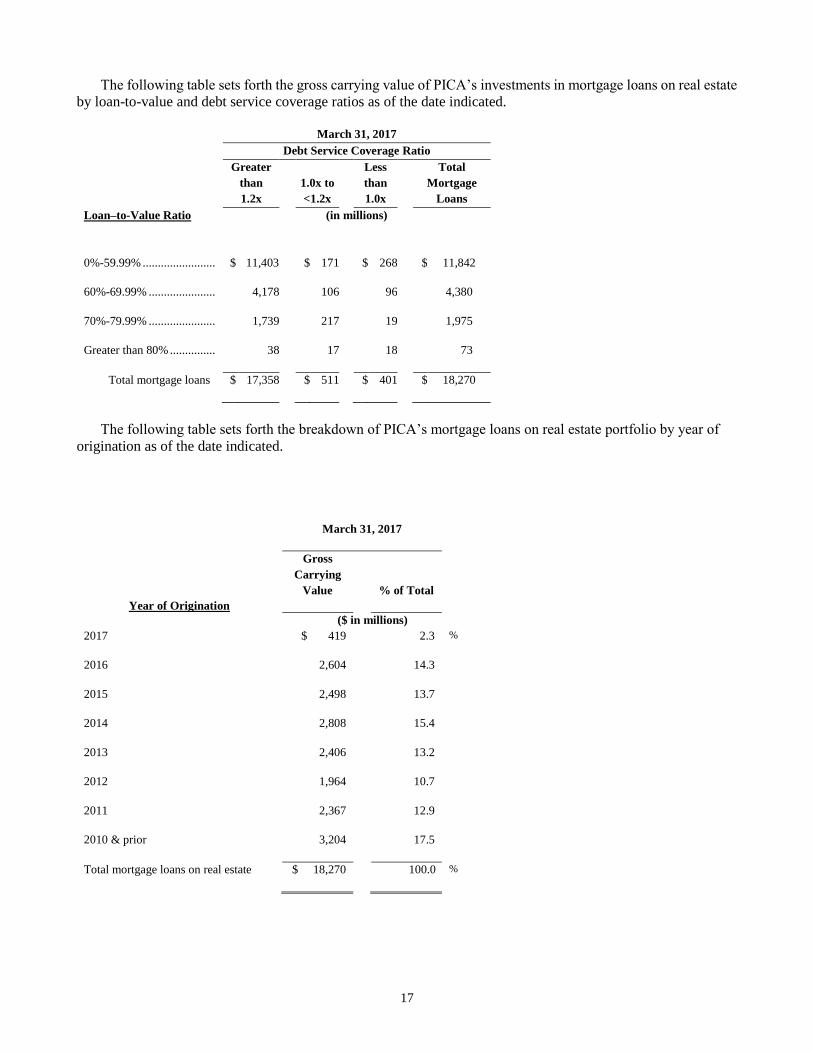
The following table sets forth the gross carrying value of PICA’s investments in mortgage loans on real estate
by loan-to-value and debt service coverage ratios as of the date indicated.
March 31, 2017
Debt Service Coverage Ratio
Greater
than
1.2x
1.0x to
<1.2x
Less
than
1.0x
Total
Mortgage
Loans
Loan–to-Value Ratio (in millions)
0%-59.99% ........................ $
11,403 $ 171 $ 268
$ 11,842
60%-69.99% ......................
4,178
106
96
4,380
70%-79.99% ......................
1,739
217
19
1,975
Greater than 80% ...............
38
17
18
73
Total mortgage loans $ 17,358 $ 511 $ 401 $ 18,270
The following table sets forth the breakdown of PICA’s mortgage loans on real estate portfolio by year of
origination as of the date indicated.
March 31, 2017
Year of Origination
Gross
Carrying
Value
% of Total
($ in millions)
2017 $ 419 2.3 %
2016 2,604 14.3
2015 2,498 13.7
2014 2,808 15.4
2013 2,406 13.2
2012 1,964 10.7
2011 2,367 12.9
2010 & prior 3,204 17.5
Total mortgage loans on real estate $ 18,270 100.0 %

18
Mortgage Loans on Real Estate Quality
Ongoing review of the portfolio is performed and loans are placed on watch list status based on a predefined
set of criteria, where they are assigned to one of the following categories. PICA classifies loans as closely
monitored when it determines there is a collateral deficiency or other credit events that may lead to a potential
loss of principal or interest. Loans not in good standing are those loans where PICA has concluded that there is a
high probability of loss of principal, such as when the loan is in the process of foreclosure or the borrower is in
bankruptcy. PICA’s workout and special servicing professionals manage the loans on the watch list. As described
below, in determining PICA’s allowance for losses, it evaluates each loan on the watch list to determine if it is
probable that amounts due according to the contractual terms of the loan agreement will not be collected.
PICA establishes an allowance for losses to provide for the risk of credit losses inherent in the lending process.
The allowance includes loan-specific reserves for loans that are determined to be impaired as a result of PICA’s
loan review process. PICA defines an impaired loan as a loan for which it estimates it is probable that amounts
due according to the contractual terms of the loan agreement will not be collected. The loan specific loss allowance
is based on PICA’s assessment as to ultimate collectability of loan principal and interest. Valuation allowances
for an impaired loan are recorded based on the present value of expected future cash flows discounted at the loan’s
effective interest rate or based on the fair value of the collateral less the estimated costs to obtain and sell. The
valuation allowance for mortgage loans can increase or decrease from period to period based on these factors.
The following table sets forth the breakdown of PICA's mortgage loans on real estate portfolio by quality as
of the dates indicated.
March 31, December 31,
2017 2016
Carrying Carrying
Value Value
(in millions)
Good standing $ 18,270 $ 18,121
Good standing with restructured terms 0 0
Interest overdue more than three months, not in foreclosure 0 1
Foreclosure in process 0 0
Total mortgage loans $ 18,270 $ 18,122
19
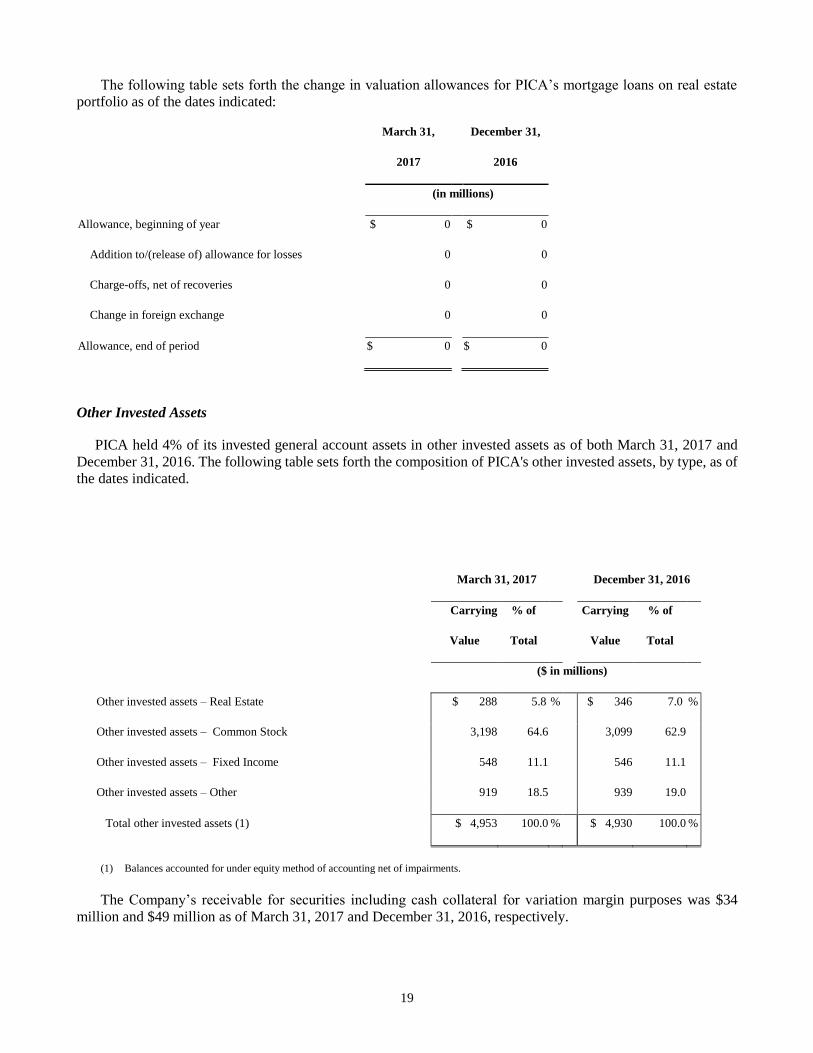
The following table sets forth the change in valuation allowances for PICA’s mortgage loans on real estate
portfolio as of the dates indicated:
March 31, December 31,
2017 2016
(in millions)
Allowance, beginning of year $ 0 $ 0
Addition to/(release of) allowance for losses 0 0
Charge-offs, net of recoveries 0 0
Change in foreign exchange 0 0
Allowance, end of period $ 0 $ 0
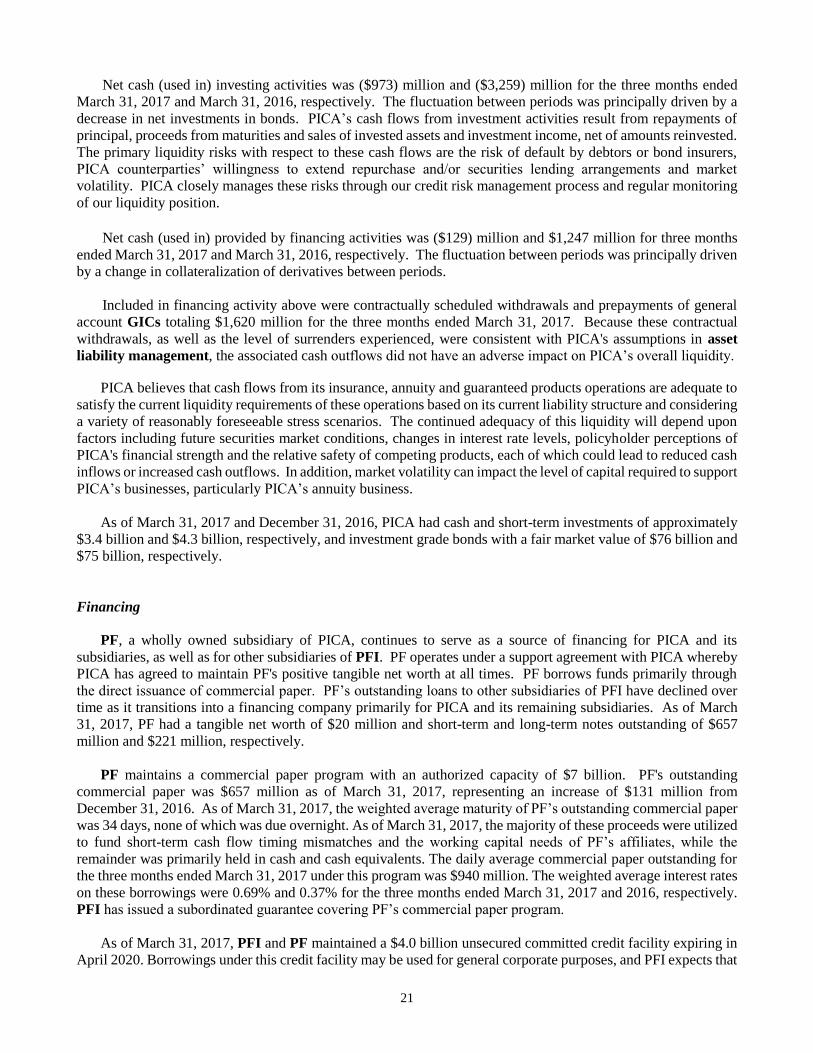
Other Invested Assets
PICA held 4% of its invested general account assets in other invested assets as of both March 31, 2017 and
December 31, 2016. The following table sets forth the composition of PICA's other invested assets, by type, as of
the dates indicated.
March 31, 2017 December 31, 2016
Carrying % of Carrying % of
Value Total Value Total
($ in millions)
Other invested assets – Real Estate $ 288 5.8 % $ 346 7.0 %
Other invested assets – Common Stock 3,198 64.6 3,099 62.9
Other invested assets – Fixed Income 548 11.1 546 11.1
Other invested assets – Other 919 18.5 939 19.0
Total other invested assets (1) $ 4,953 100.0 % $ 4,930 100.0 %
(1) Balances accounted for under equity method of accounting net of impairments.
The Company’s receivable for securities including cash collateral for variation margin purposes was $34
million and $49 million as of March 31, 2017 and December 31, 2016, respectively.

20
Liquidity and Capital Resources
Liquidity
Liquidity refers to the ability to generate sufficient cash resources to meet the payment obligations of PICA.
Capital refers to the long term financial resources available to support the operation of PICA’s businesses, fund
business growth, and provide a cushion to withstand adverse circumstances.
PICA's principal cash flow sources from insurance, annuities and guaranteed products are premiums and
annuity considerations, investment and fee income, and investment maturities and sales. PICA supplements these
cash inflows with financing activities. PICA’s cash outflow requirements principally relate to benefits, claims,
dividends paid to policyholders, and payments to contract holders in connection with surrenders, withdrawals and
net policy loan activity. Benefits include the payment of benefits under life insurance, annuity and guaranteed
products. PICA’s uses of cash also include commissions, general and administrative expenses, purchases of
investments, and debt service and repayments in connection with financing activities, as well as dividend
payments to its parent, PFI.
Some of PICA's products, such as guaranteed products offered to institutional customers, provide for payment
of accumulated funds to the contract holder at a specified maturity date unless the contract holder elects to roll
over the funds into another contract with PICA. PICA regularly monitors its liquidity requirements associated
with policyholder and contract holder obligations so that it can manage cash inflows to match anticipated cash
outflow requirements.
In addition, PICA has several subsidiaries that are subject to regulatory limitations on the payment of
dividends to PICA.
PICA is subject to regulatory limitations on the payment of dividends. New Jersey insurance law provides
that, except in the case of extraordinary dividends (as described below), all dividends or distributions paid by
PICA may be paid only from unassigned surplus, as determined pursuant to SAP, less unrealized capital gains
and revaluation of assets. PICA must give prior notification to the Commissioner of its intent to pay any dividend
or distribution. Also, if any dividend, together with other dividends or distributions made within the preceding
twelve months, exceeds the greater of (i) 10% of the prior calendar year’s statutory surplus or (ii) the prior calendar
year’s statutory net gain from operations (excluding realized capital gains), the dividend is considered to be an
“extraordinary dividend” and the prior approval of the Commissioner is required for payment of the dividend.
Moreover, the Commissioner is authorized to disallow the payment of any dividend or distribution, even if the
dividend is not an “extraordinary dividend”, if it determines that PICA does not have a reasonable surplus as to
policyholders relative to its outstanding liabilities and adequate to its financial needs or if it finds PICA to be in a
hazardous financial condition.
In June 2016, PICA paid a dividend of $900 million to its parent, PFI, of which $463 million was an
extraordinary dividend and $437 million was an ordinary dividend. Of the $900 million dividend, $542 million
was recorded as a return of capital and $358 million was recorded as dividend to stockholders. The extraordinary
dividend was approved by the Commissioner in May 2016.
In April 2016, PICA paid a dividend of $2,118 million to its parent, PFI, of which $1,513 million was an
extraordinary dividend and $605 million was an ordinary dividend. The dividend was recorded as dividend to
stockholders. The extraordinary dividend was approved by the Commissioner in April 2016.
Net cash provided by operations was $224 million and $374 million for the three months ended March 31,
2017 and March 31, 2016, respectively. The fluctuation between periods was primarily driven by a decrease in
other income, partially offset by a decrease in federal income taxes paid.
21
Net cash (used in) investing activities was ($973) million and ($3,259) million for the three months ended
March 31, 2017 and March 31, 2016, respectively. The fluctuation between periods was principally driven by a
decrease in net investments in bonds. PICA’s cash flows from investment activities result from repayments of
principal, proceeds from maturities and sales of invested assets and investment income, net of amounts reinvested.
The primary liquidity risks with respect to these cash flows are the risk of default by debtors or bond insurers,
PICA counterparties’ willingness to extend repurchase and/or securities lending arrangements and market
volatility. PICA closely manages these risks through our credit risk management process and regular monitoring
of our liquidity position.
Net cash (used in) provided by financing activities was ($129) million and $1,247 million for three months
ended March 31, 2017 and March 31, 2016, respectively. The fluctuation between periods was principally driven
by a change in collateralization of derivatives between periods.
Included in financing activity above were contractually scheduled withdrawals and prepayments of general
account GICs totaling $1,620 million for the three months ended March 31, 2017. Because these contractual
withdrawals, as well as the level of surrenders experienced, were consistent with PICA's assumptions in asset
liability management, the associated cash outflows did not have an adverse impact on PICA’s overall liquidity.
PICA believes that cash flows from its insurance, annuity and guaranteed products operations are adequate to
satisfy the current liquidity requirements of these operations based on its current liability structure and considering
a variety of reasonably foreseeable stress scenarios. The continued adequacy of this liquidity will depend upon
factors including future securities market conditions, changes in interest rate levels, policyholder perceptions of
PICA's financial strength and the relative safety of competing products, each of which could lead to reduced cash
inflows or increased cash outflows. In addition, market volatility can impact the level of capital required to support
PICA’s businesses, particularly PICA’s annuity business.
As of March 31, 2017 and December 31, 2016, PICA had cash and short-term investments of approximately
$3.4 billion and $4.3 billion, respectively, and investment grade bonds with a fair market value of $76 billion and
$75 billion, respectively.
Financing
PF, a wholly owned subsidiary of PICA, continues to serve as a source of financing for PICA and its
subsidiaries, as well as for other subsidiaries of PFI. PF operates under a support agreement with PICA whereby
PICA has agreed to maintain PF's positive tangible net worth at all times. PF borrows funds primarily through
the direct issuance of commercial paper. PF’s outstanding loans to other subsidiaries of PFI have declined over
time as it transitions into a financing company primarily for PICA and its remaining subsidiaries. As of March
31, 2017, PF had a tangible net worth of $20 million and short-term and long-term notes outstanding of $657
million and $221 million, respectively.
PF maintains a commercial paper program with an authorized capacity of $7 billion. PF's outstanding
commercial paper was $657 million as of March 31, 2017, representing an increase of $131 million from
December 31, 2016. As of March 31, 2017, the weighted average maturity of PF’s outstanding commercial paper
was 34 days, none of which was due overnight. As of March 31, 2017, the majority of these proceeds were utilized
to fund short-term cash flow timing mismatches and the working capital needs of PF’s affiliates, while the
remainder was primarily held in cash and cash equivalents. The daily average commercial paper outstanding for
the three months ended March 31, 2017 under this program was $940 million. The weighted average interest rates
on these borrowings were 0.69% and 0.37% for the three months ended March 31, 2017 and 2016, respectively.
PFI has issued a subordinated guarantee covering PF’s commercial paper program.
As of March 31, 2017, PFI and PF maintained a $4.0 billion unsecured committed credit facility expiring in
April 2020. Borrowings under this credit facility may be used for general corporate purposes, and PFI expects that

22
it may borrow under this facility from time to time to fund its working capital needs. In addition, amounts under
this credit facility may be drawn in the form of standby letters of credit that can be used to meet PFI’s operating
needs. The credit facility contains customary representations and warranties, covenants and events of default and
borrowings under the facility are not contingent on PFI’s credit ratings nor subject to material adverse change
clauses. As of March 31, 2017, there were no outstanding borrowings under the credit facility.
Borrowings under this credit facility are conditioned on the continued satisfaction of customary financial
covenants, including PFI’s maintenance of consolidated net worth of at least $18.985 billion, which is calculated
as U.S. GAAP equity, excluding accumulated other comprehensive income (loss), equity of noncontrolling
interests and equity attributable to the Closed Block. As of March 31, 2017, PFI was in compliance with the
covenants under this credit facility.
PICA maintains a Funding Agreement Notes Issuance Program pursuant to which Delaware statutory trusts
issue medium-term notes and commercial paper secured by funding agreements issued to the trusts by the
Company. Under this program, the maximum authorized amount is $15 billion of medium-term notes and $3
billion of commercial paper. The outstanding commercial paper and notes have fixed or floating interest rates
that range from 0.0% to 2.6% and original maturities ranging from seven days to five years. As a result, the
medium-term notes and commercial paper are included, along with liabilities relating to other funding agreements,
in the line item “Policyholders’ account balances” and not in the line item “Notes payable and other borrowings”
on PICA’s Statutory Statements of Admitted Assets, Liabilities and Capital and Surplus.
As of March 31, 2017, and December 31, 2016, the outstanding aggregate principal amount of such notes and
commercial paper totaled $4.1 billion and $3.8 billion, respectively. Included in the amounts at March 31, 2017
and December 31, 2016 is the medium-term note liability, which is carried at amortized cost, of $3.2 billion and
$3.2 billion, respectively, and short-term note liability of $0.9 billion and $0.6 billion, respectively.
On September 13, 2016, a Delaware trust issued in a private placement $350 million in aggregate principal
amount of 1.450% Medium-Term Notes due September 13, 2019.
On June 27, 2016, a Delaware trust issued in a private placement $100 million in aggregate principal amount
of Floating Rate Medium-Term Notes due June 27, 2018.
On June 3, 2016, a Delaware trust issued in a private placement $500 million in aggregate principal amount
of 2.200% Medium-Term Notes due June 3, 2021.
PICA’s ability to issue new notes under this program will depend on market conditions. PICA intends to
repay the maturing notes and commercial paper through a combination of cash flows from asset maturities, asset
sales, and internal sources of funds such as PF.
PICA is a member of the FHLBNY. Membership allows PICA access to the FHLBNY’s financial services,
including the ability to obtain collateralized advances and to issue collateralized funding agreements. FHLBNY
borrowings and funding agreements are collateralized by qualifying mortgage-related assets or U.S. Treasury
securities, the fair value of which must be maintained at certain specified levels relative to outstanding borrowings.
FHLBNY membership requires PICA to own member stock and borrowings require the purchase of activity-based
stock in an amount equal to 4.5% of outstanding borrowings. Under FHLBNY guidelines, if PICA’s financial
strength ratings decline below A/A2/A Stable by S&P/Moody’s/Fitch, respectively, and the FHLBNY does not
receive written assurances from the NJDOBI regarding PICA’s solvency, new borrowings from the FHLBNY
would be limited to a term of 90 days or less. Currently there are no restrictions on the term of borrowings from
the FHLBNY. All FHLBNY stock purchased by PICA is classified as restricted general account investments
within “Other invested assets” and the carrying value of these investments was $78 million and $78 million as of
March 31, 2017 and December 31, 2016, respectively.
23
NJDOBI permits PICA to pledge collateral to the FHLBNY in an amount of up to 5% of its prior year-end
statutory net admitted assets, excluding separate account assets. Based on PICA’s statutory net admitted assets as
of December 31, 2016, the 5% limitation equates to a maximum amount of pledged assets of $6.2 billion and an
estimated maximum borrowing capacity (after taking into account required collateralization levels) of
approximately $5.3 billion of which $1 billion was outstanding. Nevertheless, FHLBNY borrowings are subject
to the FHLBNY’s discretion and to the availability of qualifying assets at PICA.
As of March 31, 2017, PICA had pledged assets with a fair value of $1.2 billion supporting outstanding
funding agreements totaling $1.0 billion, which are included in “Policyholders’ account balances.” The fair value
of qualifying assets that were available to PICA, but not pledged, amounted to $5.8 billion as of March 31, 2017.
PICA had no other advances outstanding under the FHLBNY facility as of March 31, 2017.
PRIAC is a member of the FHLBB. Membership allows PRIAC access to collateralized advances. PRIAC’s
membership in FHLBB requires the ownership of member stock and borrowings from FHLBB require the
purchase of FHLBB activity-based stock in an amount between 3.0% and 4.5% of outstanding borrowings,
depending on the maturity date of the obligation. As of March 31, 2017, PRIAC had no advances outstanding
under the FHLBB facility. All FHLBB stock purchased by PRIAC is classified as restricted general account
investments within " Other invested assets" and the carrying value of these investments was $10 million and $10
million as of March 31, 2017 and December 31, 2016, respectively.
Under Connecticut state insurance law, without the prior consent of the Connecticut Insurance Department,
the amount of assets insurers may pledge to secure debt obligations is limited to the lesser of 5% of prior-year
statutory admitted assets or 25% of prior-year statutory surplus, resulting in a maximum borrowing capacity for
PRIAC under the FHLBB facility of approximately $0.2 billion as of March 31, 2017.
Non-Insurance Contractual Obligations
The following table presents PICA's contractual cash flow commitments on notes payable and other
borrowings and surplus notes, excluding interest payable, as of March 31, 2017. This table does not reflect PICA's
obligations under its insurance, annuity and guaranteed products contracts.
Payment Due by Period
Total
Less than 1
Year
1-3 Years
4-5 Years
After 5
Years
($ in millions)
Notes payable and other borrowings (1) ...... $ 273 $ 92 $ — $ — $ 181
Surplus notes (2) ..........................................
850
—
500 — 350
Total ............................................................. $ 1,123 $ 92 $ 500 $ — $ 531
(1) The amounts for notes payable and other borrowings represent scheduled principal repayments on debt. The amount reported on
the balance sheet of the statutory financial statements represents the carrying value. The balance sheet amount was $275 million
and $182 million as of March 31, 2017 and December 31, 2016, respectively. PICA had accrued interest of $2 million outstanding
as of March 31, 2017.
(2) The amounts for surplus notes represent the aggregate principal amounts. The amount reported in the capital and surplus section
of the statutory financial statements represents the current statement value.
In addition to the amounts shown above, PICA is a party to operating leases for which its future minimum
lease payments under non-cancelable leases were $334 million and $341 million as of March 31, 2017 and

24
December 31, 2016, respectively.
During the normal course of its business, PICA utilizes financial instruments with off-balance sheet credit
risk such as commitments and financial guarantees. Commitments primarily include commitments to fund
investments in private placement securities, limited partnerships and other investments, as well as commitments
to originate mortgage loans. As of March 31, 2017 and December 31, 2016, these commitments were $3,385
million and $4,636 million, respectively.
Certain contracts underwritten by the Retirement business include guarantees related to financial assets owned
by the guaranteed party. These contracts are accounted for as derivatives, at fair value. As of March 31, 2017,
these contracts in force carried a total guaranteed value of $78 billion. These guarantees are supported by collateral
that is not reflected on PICA’s balance sheet. This collateral had a fair value of $78 billion as of March 31, 2017.
Contingencies
PICA has entered into reinsurance agreements with PLICJ, PGFL, PLICK, and other foreign entities, all of
which are affiliates of PICA. In each case, PICA has agreed to reinsure certain individual life insurance policies
through excess risk term contracts. Furthermore, PICA has agreed to co-insure U.S. dollar-denominated policies
sold by PLICJ and PGFL. For these reinsurance policies assumed, PICA has retroceded a portion of these risks
to affiliated companies.
PICA has committed to repurchase securities under master repurchase agreements in the amount of $4,921
million and holds cash collateral for loaned securities of $1,210 million as of March 31, 2017. PICA conducts
asset-based or secured financing, including transactions such as securities lending, repurchase agreements and
mortgage dollar rolls, to earn spread income, to borrow funds, or to facilitate trading activity. These programs are
primarily driven by portfolio holdings of securities that are lendable based on counterparty demand for these
securities in the marketplace. The collateral received in connection with these programs is primarily used to
purchase securities in PICA’s short-term spread portfolios. Investments held in the short-term spread portfolio
include cash and cash equivalents, short-term investments, mortgage loans and fixed maturities, including
mortgage- and asset-backed securities, with a weighted average life at time of purchase by the short-term
portfolios of four years or less. Floating rate assets comprise the majority of our short-term spread portfolio.
These short-term portfolios are subject to specific investment policy statements, which among other things, do not
allow for significant asset/liability interest rate duration mismatch.
Capital
The Risk Based Capital, or RBC, ratio is the primary measure by which PICA evaluates its capital adequacy.
PICA’s RBC ratio is managed to a level consistent with a “AA” ratings objective; however, ratings agencies take
into account a variety of factors in assigning ratings to PICA. RBC is determined by statutory formulas that
consider risks related to the type and quality of the invested assets, insurance-related risks associated with an
insurer’s products, interest rate risks and general business risks. The RBC ratio calculations are intended to assist
insurance regulators in measuring the adequacy of an insurer’s statutory capitalization. PICA reported an RBC
ratio of 457% as of December 31, 2016, which exceeds the minimum levels required by applicable insurance
regulations. The level of statutory capital of PICA can be materially impacted by interest rate and equity market
fluctuations, changes in the values of derivatives, the level of impairments recorded, and credit quality migration
of the investment portfolio, among other items. Further, a recapture of business subject to reinsurance
arrangements due to defaults by, or credit quality migration affecting, the reinsurers could result in higher required
statutory capital levels. The level of statutory capital of PICA is also affected by statutory accounting rules, which
are subject to change by insurance regulators. (The inclusion of RBC measures is intended solely for the
information of investors and is not intended for the purpose of ranking any insurance company or for use in
connection with any marketing, advertising or promotional activities.)

25
PICA employs a Capital Protection Framework to ensure that sufficient capital resources are available to
maintain adequate capitalization and competitive RBC ratio and solvency margins under various stress scenarios.
The Capital Protection Framework incorporates the potential impacts from market related stresses, including
equity markets, real estate, interest rates, credit losses, and foreign currency exchange rates. Potential sources of
capital include on-balance sheet capital, derivatives, reinsurance and contingent sources of capital. Although we
continue to enhance our approach, we believe we currently have access to sufficient resources to maintain
adequate capitalization and competitive RBC ratios and solvency margins under a range of potential stress
scenarios.
Ratings Developments
Ratings
Financial strength ratings (which are sometimes referred to as “claims-paying” ratings) and credit ratings are
important factors affecting public confidence in an insurer and its competitive position in marketing products.
PICA’s credit ratings are also important for its ability to raise capital through the issuance of debt and for the cost
of such financing. Nationally Recognized Statistical Ratings Organizations continually review the financial
performance and financial condition of the entities they rate, including PICA and its rated affiliates.
A downgrade in the credit or financial strength ratings of PICA or its rated affiliates could potentially, among
other things, limit PICA’s ability to market products, reduce its competitiveness, increase the number or value of
policy surrenders and withdrawals, increase borrowing costs and potentially make it more difficult to borrow
funds, adversely affect the availability of financial guarantees, such as letters of credit, cause additional collateral
requirements or other required payments under certain agreements, allow counterparties to terminate derivative
agreements and/or hurt PICA’s relationships with creditors, distributors or trading counterparties, thereby
potentially negatively affecting its profitability, liquidity and/or capital. In addition, PICA considers its own risk
of non-performance in determining the fair value of its liabilities. Therefore, changes in its credit or financial
strength ratings may affect the fair value of its liabilities.
Financial strength ratings represent the opinions of rating agencies regarding the financial ability of an
insurance company to meet its obligations under an insurance policy. Credit ratings represent the opinions of
rating agencies regarding an entity’s ability to repay its indebtedness. The following table summarizes the
financial strength ratings for PICA as of March 31, 2017.
S&P(1) Moody's(2)
A.M.
Best(3) Fitch(4)
Financial Strength Ratings: AA- A1 A+ AA-
(1) S&P financial strength ratings for insurance companies range from “AAA (extremely strong)” to “D (default).” A rating of
AA- is the fourth highest of twenty-three rating categories.
(2) Moody's insurance financial strength ratings range from “Aaa (exceptional)” to “C (lowest).” A rating of A1 is the fifth
highest of twenty-one rating categories. Numeric modifiers are used to refer to the ranking within the group—with 1 being
the highest and 3 being the lowest. These modifiers are used to indicate relative strength within a category.
(3) A.M. Best financial strength ratings for insurance companies currently range from “A++ (superior)” to “S (suspended).” A
rating of A+ is the second highest of sixteen rating categories.
(4) Fitch financial strength ratings range from “AAA (exceptionally strong)” to “C (distressed).” A rating of AA- is the fourth
highest of nineteen rating categories.

26
The ratings set forth above reflect current opinions of each rating agency. Each rating should be evaluated
independently of any other rating. These ratings are reviewed periodically and may be changed at any time by
the rating agencies. As a result, there is no assurance that PICA will maintain its current ratings in the future.
Rating agencies use an “outlook” statement for both industry sectors and individual companies. For an
industry sector, a Stable outlook generally implies that over the next 12-18 months, the rating agency expects
ratings to remain unchanged among companies in the sector. This year, Moody’s and A.M. Best changed the
Rating Outlook on the U.S. life insurance industry to Negative from Stable. Fitch and S&P continued to keep the
life insurance industry on Stable outlook; however, Fitch revised its Sector Outlook for U.S. life insurers to
Negative. For a particular company, an outlook generally indicates a medium- or long-term trend (generally six
months to two years) in credit fundamentals, which if continued, may lead to a rating change. These indicators
are not necessarily a precursor of a rating change nor do they preclude a rating agency from changing a rating at
any time without notice. Currently, Fitch has all of the Company’s ratings on Positive outlook; A.M. Best,
Moody’s and S&P have all of PICA’s ratings on Stable outlook.
In May 2017, Fitch affirmed the Company’s ratings and revised the company outlook for Prudential Insurance
and certain other affiliated insurance companies from Negative to Stable. A rating agency company outlook
generally indicates a medium-or long-term trend (generally six months to two years) in credit fundamentals, which
if continued, may lead to a rating change. These indicators are not necessarily a precursor of a rating change nor
do they preclude a rating agency from changing a rating at any time without notice.
On November 15, 2016, Moody’s revised its Rating Outlook on the U.S. life insurance industry to Negative.
Moody’s outlook indicates their expectations for the fundamental credit conditions driving the U.S. life insurance
industry over the next 12-18 months. The change in the outlook is a result of increased pressure on life insurers’
sales, revenues and profitability due to persistent low interest rates and weak economic growth, together with
regulatory pressures on product distribution. The change in outlook back to Stable from Negative can occur with
a gradual, steady increase in long-term interest rates in 2017, underpinned by strong equity market levels and an
improvement in economic growth.
On December 7, 2016, A.M. Best revised its Rating Outlook on the U.S. life insurance industry to Negative.
The revision of the Rating Outlook to Negative reflects A.M. Best’s view that the industry is entering into a period
of increased volatility across both economic and regulatory fronts. A.M. Best’s outlook indicates that there is
uncertainty around the slow premium growth for life and other products, disruption from merger and acquisition
activity, and the industry’s historic slow incremental approach in the face of a rapidly changing landscape.
Requirements to post collateral or make other payments, as a result of ratings downgrades, under certain
agreements, including derivative agreements, can be satisfied in cash or by posting permissible securities held by
PICA and/or its affiliate subject to the agreements. In addition, a ratings downgrade by A.M. Best to "A-" for
PICA would require PICA to either post collateral or a letter of credit in the amount of approximately $1.5 billion,
based on the level of statutory reserves related to the variable annuity business acquired from Allstate Financial.
Management believes that the posting of such collateral would not be a material liquidity event for PICA.
In view of the difficulties experienced in recent years by many financial institutions, the rating agencies have
heightened the level of scrutiny that they apply to such institutions, have increased the frequency and scope of
their credit reviews, have requested additional information from the companies that they rate, and may adjust
upward the capital and other requirements employed in the rating agency models for maintenance of certain ratings
levels, such as the financial strength ratings currently held by PICA. In addition, actions PICA might take to access
third party financing or to realign its capital structure may in turn cause rating agencies to reevaluate PICA’s
ratings.
27
Litigation and Regulatory Matters
PICA is subject to legal and regulatory actions in the ordinary course of its businesses. Pending legal and
regulatory actions include proceedings relating to aspects of PICA’s businesses and operations that are specific to
it and proceedings that are typical of the businesses in which it operates, including in both cases businesses that
have been either divested or placed in wind-down status. Some of these proceedings have been brought on behalf
of various alleged classes of complainants. In certain of these matters, the plaintiffs are seeking large and/or
indeterminate amounts, including punitive or exemplary damages. The outcome of litigation or a regulatory
matter, and the amount or range of potential loss at any particular time, is often inherently uncertain. PICA
establishes accruals for litigation and regulatory matters when it is probable that a loss has been incurred and the
amount of that loss can be reasonably estimated. For litigation and regulatory matters where a loss may be
reasonably possible, but not probable, or is probable but not reasonably estimable, no accrual is established but
the matter, if material, is disclosed. PICA estimates that as of March 31, 2017, the aggregate range of reasonably
possible losses in excess of accruals established for those litigation and regulatory matters for which such an
estimate currently can be made is less than $250 million. Any estimate is not an indication of expected loss, if
any, or PICA’s maximum possible loss exposure on such matters. PICA reviews relevant information with respect
to its litigation and regulatory matters on a quarterly and annual basis and updates its accruals, disclosures and
estimates of reasonably possible loss based on such reviews.
For a discussion of PICA’s litigations and regulatory matters, see “Management’s Discussion and Analysis
of Financial Condition and Results of Operations of PICA as of and for the Year Ended December 31, 2016-
Litigation and Regulatory Matters” in the Offering Circular dated May 10, 2017, relating to the $15,000,000,000
Global Medium Term Note Program of PRICOA Global Funding I.
Summary
PICA’s litigation and regulatory matters are subject to many uncertainties, and given their complexity and
scope, their outcomes cannot be predicted. It is possible that PICA’s results of operations or cash flow in a
particular quarterly or annual period could be materially affected by an ultimate unfavorable resolution of pending
litigation and regulatory matters depending, in part, upon the results of operations or cash flow for such period. In
light of the unpredictability of PICA’s litigation and regulatory matters, it is also possible that in certain cases an
ultimate unfavorable resolution of one or more pending litigation or regulatory matters could have a material
adverse effect on PICA’s financial position. Management believes, however, that, based on information currently
known to it, the ultimate outcome of all pending litigation and regulatory matters, after consideration of applicable
reserves and rights to indemnification is not likely to have a material adverse effect on PICA’s financial position.
Regulatory Developments
For information on the potential impacts of regulation on PICA, see “Business-Regulation” in the Offering
Circular dated May 10, 2017, relating to the $15,000,000,000 Global Medium Term Note Program of PRICOA
Global Funding I.
28
ANNEX A
Definitions
Asset Liability Management – A unit within PFI that develops and implements investment policies, long-term
investment plans and tactical investment strategies for PICA's general account asset portfolios. The unit is
responsible for asset allocation, asset liability matching and designing investment policies and strategies that are
consistent with products sold and developed by PICA's Retirement, Annuity, Individual Insurance and Group
Insurance profit centers.
AVR – Asset Valuation Reserve, established under SAP as a liability to offset potential non-interest related
investment losses. Changes in AVR are charged or credited directly to surplus; no such reserve is required under
GAAP.
Closed Block – PICA’s liabilities for certain participating individual life insurance policies and annuities issued
in the United States were segregated, together with assets which will be used exclusively for the payment of
benefits, policyholder dividends and taxes with respect to these products, in a regulatory mechanism referred to
as the “Closed Block.”
CIO – Chief Investment Officer
CRVM – Commissioner's Reserve Valuation Method
CARVM – Commissioner's Annuity Reserve Valuation Method
Commissioner – State Insurance Department Commissioners and/or the Commissioner of the New Jersey
Department of Banking and Insurance.
FHLBB – Federal Home Loan Bank of Boston
FHLBNY – Federal Home Loan Bank of New York
Fitch – Fitch Ratings, Ltd.
GAAP – Generally Accepted Accounting Principles, in the United States of America.
GICs – Guaranteed Investment Contracts
IMR – Interest Maintenance Reserve, established under SAP, to capture realized investment gains and losses, net
of tax, on the sale of bonds resulting from changes in the general level of interest rates, and is amortized into
income over the remaining years to expected maturity of the assets sold; no such reserve is required under GAAP.
Moody’s – Moody’s Investors Service, Inc.
NAIC – National Association of Insurance Commissioners
NJDOBI – New Jersey Department of Banking and Insurance
PFI – Prudential Financial, Inc., a New Jersey corporation and the ultimate parent company of PICA and all of
their respective subsidiaries or affiliates.
PF – Prudential Funding, LLC, a New Jersey limited liability company and a wholly owned financing subsidiary
of PICA.

29
PGFL – Prudential Gibraltar Financial Limited
PICA – The Prudential Insurance Company of America, a New Jersey stock life insurance company.
PLI – Pruco Life Insurance Company, a wholly owned subsidiary of PICA.
PLIC – Prudential Legacy Insurance Company of New Jersey
PLICJ – The Prudential Life Insurance Company Ltd., an affiliate of PICA. (Located in Japan)
PLICK – The Prudential Life Insurance Company of Korea, Ltd., an affiliate of PICA.
PLNJ – Pruco Life Insurance Company of New Jersey, a wholly owned subsidiary of PLI.
PRIAC – The Prudential Retirement Insurance and Annuity Company, a wholly owned subsidiary of PICA.
SAP – Statutory Accounting Principles
SVO – The Securities Valuation Office, a division of the NAIC.
S&P – S&P Global Ratings
SSAP – Statements of Statutory Accounting Principles
TOLI – Trust owned life insurance

THE PRUDENTIAL INSURANCE COMPANY OF AMERICA
UNAUDITED STATUTORY STATEMENTS OF ADMITTED ASSETS, LIABILITIES AND CAPITAL AND SURPLUS
30
March 31,
2017 December 31,
2016
(in millions)
ASSETS
Bonds ...................................................................................................................................... $ 77,017 $ 76,339
Preferred stocks ....................................................................................................................... 58 58
Common stocks ....................................................................................................................... 6,642 6,262
Mortgage loans on real estate .................................................................................................. 18,270 18,122
Real estate ............................................................................................................................... 548 552
Contract loans ......................................................................................................................... 3,007 2,969
Cash and short-term investments ............................................................................................ 3,398 4,276
Derivatives .............................................................................................................................. 3,029 3,226
Other invested assets ............................................................................................................... 4,987 4,979
Total cash and invested assets .............................................................................................. 116,956 116,783
Premiums due and deferred ..................................................................................................... 2,849 2,705
Accrued investment income .................................................................................................... 909 859
Current federal income tax recoverable .................................................................................. 241 52
Net deferred tax asset .............................................................................................................. 2,389 2,462
Other assets ............................................................................................................................. 1,372 1,130
Separate account assets ........................................................................................................... 135,542 136,303
TOTAL ASSETS ................................................................................................................... $ 260,258 $ 260,294
LIABILITIES AND SURPLUS
Liabilities
Policy liabilities and insurance reserves:
Future policy benefits and claims .......................................................................................... $ 82,629 $ 81,973
Advanced premiums .............................................................................................................. 48 45
Policy dividends..................................................................................................................... 1,973 2,023
Policyholders' account balances ............................................................................................. 12,028 11,605
Notes payable and other borrowings ....................................................................................... 275 182
Asset valuation reserve ........................................................................................................... 2,278 2,271
Interest maintenance reserve ................................................................................................... 98 99
Transfers from separate accounts due or accrued .................................................................... (483 ) (469 )
Securities sold under agreement to repurchase ....................................................................... 4,921 4,829
Cash collateral held for loaned securities ................................................................................ 1,210 1,280
Derivatives .............................................................................................................................. 720 715
Other liabilities ........................................................................................................................ 7,795 8,603
Separate account liabilities ...................................................................................................... 135,202 135,964
Total liabilities ....................................................................................................................... 248,694 249,120
Capital and Surplus
Common capital stock and gross paid in and contributed surplus........................................... 58 44
Surplus notes ........................................................................................................................... 844 844
Special surplus fund ................................................................................................................ 224 226
Unassigned Surplus ................................................................................................................. 10,438 10,060
Total capital and surplus ...................................................................................................... 11,564 11,174
TOTAL LIABILITIES, CAPITAL AND SURPLUS .........................................................
$ 260,258 $ 260,294

THE PRUDENTIAL INSURANCE COMPANY OF AMERICA
UNAUDITED STATUTORY STATEMENTS OF OPERATIONS AND CHANGES IN CAPITAL AND SURPLUS
31
Three Months Ended
March 31,
2017 2016
(in millions)
REVENUE
Premiums and annuity considerations .................................................................................... $ 4,744 $ 4,565
Net investment income ........................................................................................................... 1,323 1,237
Other income .......................................................................................................................... 389 525
Total Revenue ........................................................................................................................ 6,456 6,327
BENEFITS AND EXPENSES
Death benefits ......................................................................................................................... 1,422 1,419
Annuity benefits ..................................................................................................................... 2,597 2,465
Disability benefits ................................................................................................................... 237 230
Other benefits ......................................................................................................................... 6 5
Surrenders, benefits and fund withdrawals ............................................................................. 2,335 1,789
Net increase in reserves .......................................................................................................... 528 1,186
Commissions .......................................................................................................................... 222 163
Net transfer from separate accounts ....................................................................................... (1,824 ) (1,423 )
Other expenses........................................................................................................................ 403 364
Total Benefits and Expenses ................................................................................................ 5,926 6,198
Operating income before dividends and income taxes ........................................................... 530 129
Dividends to policyholders ..................................................................................................... 38 53
Operating income before income taxes .................................................................................. 492 76
Income tax expense ................................................................................................................ 101 25
Income from Operations ...................................................................................................... 391 51
Net Realized Capital Losses ................................................................................................. (163 ) (27 )
NET INCOME ...................................................................................................................... $ 228 $ 24
CAPITAL AND SURPLUS
Capital and Surplus, beginning of year .............................................................................. $ 11,174 $ 11,544
Change in common capital stock and gross paid in and contributed surplus .......................... 14 18
Change in special surplus funds ............................................................................................. (2 ) (2 )
Net income ............................................................................................................................. 228 24
Change in net unrealized capital gains ................................................................................... 160 646
Change in non-admitted assets ............................................................................................... (235 ) 95
Change in asset valuation reserve ........................................................................................... (7 ) (54 )
Change in net deferred income tax ......................................................................................... 129 28
Amortization related to employee retirement plans and other pension adjustments ............... 95 78
Change in special surplus funds ............................................................................................. 2 2
Other changes, net .................................................................................................................. 6 (106 )
Change in unassigned surplus ............................................................................................. 378 713
CAPITAL AND SURPLUS, END OF PERIOD ................................................................. $ 11,564 $ 12,273

THE PRUDENTIAL INSURANCE COMPANY OF AMERICA
UNAUDITED STATUTORY STATEMENTS OF CASH FLOWS
32
Three Months Ended
March 31,
2017 2016
(in millions)
CASH FLOWS FROM OPERATING ACTIVITIES
Premiums and annuity considerations .................................................................................... $ 4,598 $ 4,336
Net investment income ........................................................................................................... 1,192 1,058
Other income .......................................................................................................................... 387 622
Separate account transfers ...................................................................................................... 1,810 1,449
Benefits and claims paid ......................................................................................................... (6,672 ) (6,121 )
Policyholders' dividends paid ................................................................................................. (88 ) (36 )
Federal income taxes .............................................................................................................. (238 ) (328 )
Other operating expenses........................................................................................................ (765 ) (606 )
Net cash provided by operating activities ........................................................................... 224 374
CASH FLOWS FROM INVESTING ACTIVITIES
Proceeds from investments sold, matured or repaid
Bonds .................................................................................................................................... 2,273 2,298
Stocks .................................................................................................................................... 10 48
Mortgage loans on real estate ................................................................................................ 322 442
Real estate ............................................................................................................................. - 18
Other invested assets ............................................................................................................. 243 126
Miscellaneous proceeds ........................................................................................................ 103 81
Payments for investments acquired
Bonds .................................................................................................................................... (2,880 ) (5,174 )
Stocks .................................................................................................................................... (238 ) (293 )
Mortgage loans on real estate ................................................................................................ (456 ) (482 )
Real estate ............................................................................................................................. (7 ) (8 )
Other invested assets ............................................................................................................. (265 ) (220 )
Miscellaneous applications ................................................................................................... (78 ) (95 )
Net cash used in investing activities .................................................................................... (973 ) (3,259 )
CASH FLOWS FROM FINANCING ACTIVITIES
Payments of borrowed money ................................................................................................ (4 ) (2 )
Net deposits on deposit-type contract funds ........................................................................... 354 266
Other financing activities........................................................................................................ (479 ) 983
Net cash (used in) provided by financing activities ............................................................ (129 ) 1,247
Net change in cash and short-term investments ................................................................ (878 ) (1,638 )
Cash and short-term investments, beginning of year .............................................................. 4,276 4,963
CASH AND SHORT-TERM INVESTMENTS, END OF PERIOD ................................. $ 3,398 $ 3,325

THE PRUDENTIAL INSURANCE COMPANY OF AMERICA
UNAUDITED STATUTORY STATEMENTS OF CASH FLOWS
33
The Statutory Statement of Cash Flows excludes the following non-cash transactions.
3/31/2017 3/31/2016
Statutory Statement Reporting Line (in millions) Statement of Admitted Assets, Liabilities and Capital and Surplus Bonds (proceeds) (75) -
Statement of Admitted Assets, Liabilities and Capital and Surplus Common stocks (cost) 5 -
Statement of Admitted Assets, Liabilities and Capital and Surplus Common stocks (proceeds) (35) -
Statement of Admitted Assets, Liabilities and Capital and Surplus Other assets - 41
Statement of Admitted Assets, Liabilities and Capital and Surplus Federal income tax payable 153 34
Statement of Admitted Assets, Liabilities and Capital and Surplus Borrowed money (92) -
Statement of Admitted Assets, Liabilities and Capital and Surplus Other liabilities 47 (35)
Statement of Operations and Changes in Capital and Surplus Commissions (1) -
Statement of Operations and Changes in Capital and Surplus Other expenses 44 -
Statement of Operations and Changes in Capital and Surplus Other changes, net 1 -
Statement of Operations and Changes in Capital and Surplus Net investment income (61) (59)
Statement of Operations and Changes in Capital and Surplus Change in net unrealized capital gains 28 35
Statement of Operations and Changes in Capital and Surplus Change in capital (14) (16)

34
THE PRUDENTIAL INSURANCE COMPANY OF AMERICA
NOTES TO UNAUDITED INTERIM STATUTORY FINANCIAL STATEMENTS
March 31, 2017 and December 31, 2016
1. BUSINESS
The Prudential Insurance Company of America (the “Company”, “Prudential Insurance”
or “PICA”) is a wholly-owned subsidiary of Prudential Financial, Inc. (“Prudential
Financial”). The principal products and services of PICA include individual life insurance
and annuities, group insurance and pension and retirement products and related services
and administration.
Through March 31, 2016, the Company reinsured the majority of its variable annuity living
benefit guarantees to an affiliated reinsurance company, Pruco Reinsurance, Ltd. (“Pruco
Re”). Effective April 1, 2016, the Company recaptured the risks related to its variable
annuity living benefit riders that were previously reinsured to Pruco Re. In addition, the
Company reinsured variable annuity base contracts, along with the living benefit riders,
from Pruco Life Insurance Company of New Jersey ("PLNJ"). This reinsurance agreement
covers new and in force business and excludes business reinsured externally. The product
risks related to the reinsured business are being managed within the Company. In addition,
the living benefit hedging program related to the reinsured living benefit riders is managed
within the Company.
For the coinsurance component of the reinsurance agreement with PLNJ, the Company
received invested assets of approximately $0.7 billion and established reserves of $0.7
billion. For the Modified coinsurance (“Modco”) component of the reinsurance agreement,
the initial Modco transactions were reported on a net basis on the Statement of Operations
and Changes in Capital and Surplus for both the ceding and assuming companies. The
Modco reserve balance on the effective date of this new reinsurance agreement was $8.4
billion.
2. SIGNIFICANT ACCOUNTING POLICIES AND PRINCIPLES
The Company, domiciled in the state of New Jersey, prepares its statutory financial
statements in accordance with accounting practices prescribed or permitted by the New
Jersey Department of Banking and Insurance (the “Department”). Prescribed statutory
accounting practices (“SAP”) include publications of the National Association of Insurance
Commissioners (“NAIC”), state laws, regulations and general administrative rules.
Permitted statutory accounting practices encompass all accounting practices not so
prescribed. NAIC SAP reporting differs from generally accepted accounting principles in
the United States of America (“GAAP”). NAIC SAP is designed to address the concerns
of regulators. GAAP is designed to meet the varying needs of the different users of
financial statements. NAIC SAP is considered to be more conservative than GAAP in
certain respects and attempts to determine at the financial statement date an insurer’s ability
to pay claims in the future. GAAP, on the other hand, stresses measurement of emerging
earnings of a business from period to period, by matching revenue to expense.
Management has assessed the non-insurance entities subject to SSAP No. 97, “Investments
in Subsidiary, Controlled and Affiliated Entities”, and, based upon the amount of capital
that these entities represent and PICA’s strong capital position, management has decided
not to obtain GAAP audits for 23 entities as of March 31, 2017. Management has therefore
valued these entities for purposes of its financial statements at zero. At the end of future
fiscal years, management may decide to obtain U.S. GAAP audits for entities subject to

35
SSAP No. 97 and thereby restore their equity value for purposes of inclusion in capital and
surplus.

Annex 2

MANAGEMENT’S DISCUSSION AND ANALYSIS
OF FINANCIAL CONDITION AND RESULTS OF OPERATIONS OF PICA
AS OF AND FOR THE SIX MONTHS ENDED JUNE 30, 2017
(See Annex A for definitions of certain terms used in this Management’s Discussion and Analysis)
Summary of Principal Differences between SAP and GAAP
The financial information for The Prudential Insurance Company of America (“PICA” or the
“Company”) in this Management’s Discussion and Analysis has been prepared and presented in accordance
with SAP. Certain differences exist between SAP and GAAP which might be material to the financial
information herein. The matters described below summarize certain differences between SAP and GAAP that
may be material. The Company is responsible for preparing the summary below. The Company has not
prepared a complete reconciliation of its consolidated financial statements and related footnote disclosures
between SAP and GAAP and has not quantified such differences. Accordingly, no assurance is provided that
the following summary of differences between SAP and GAAP is complete. In making an investment
decision, investors must rely upon their own examination of the Company, the terms of the offering and the
financial information. Potential investors should consult their own professional advisors for an understanding
of the differences between SAP and GAAP, and how those differences might affect the financial information
herein.
The significant differences between SAP and GAAP are noted below:
The SAP financial statements of PICA do not consolidate its subsidiaries. The equity value of its
subsidiaries are recorded as preferred stock, common stock and other invested assets.
Under SAP, policy acquisition costs, such as commissions, and other costs incurred in connection
with acquiring new business, are expensed when incurred; under GAAP, such costs are deferred
and amortized either over the expected lives of the contracts or based on the level and timing of
either gross margins, gross profits or gross premiums, depending on the type of contract.
Under SAP, CRVM is used for the majority of individual insurance reserves; under GAAP, individual
insurance policyholder liabilities for traditional forms of insurance are generally established using
the net level premium method. For interest-sensitive policies, a liability for policyholder account
balances is established under GAAP based on the contract value that has accrued to the benefit of
the policyholder. Policy valuation assumptions used in the estimation of policyholder liabilities
are generally prescribed under SAP; under GAAP, policy valuation assumptions are based upon
best estimates as of the date the policy is issued, with provisions for the risk of adverse deviation.
Under SAP, CARVM is used for the majority of individual deferred annuity reserves; under GAAP,
individual deferred annuity policyholder liabilities are generally equal to the contract value that
has accrued to the benefit of the policyholder, in addition to liabilities for certain guarantees under
variable annuity contracts.
Under SAP, reinsurance reserve credits taken by ceding entities as a result of reinsurance contracts
are netted against the ceding entity’s policy and claim reserves and unpaid claims; under GAAP,
reinsurance recoverables are reported as assets.
Under SAP, IMR is established to capture realized investment gains and losses, net of tax, on the sale
of bonds and interest-related other-than-temporary impairment of bonds resulting from changes

2
in the general levels of interest rates, and is amortized into income over the remaining years to
expected maturity of the assets sold or impaired; under GAAP, no such reserve is required.
Under SAP, AVR based upon a formula prescribed by the NAIC is established as a liability to offset
potential non-interest related investment losses, and changes in the AVR are charged or credited
directly to surplus; under GAAP, no such reserve is required.
Under SAP, investments in bonds and preferred stocks are generally carried at amortized cost; under
GAAP, investments in bonds and preferred stocks, other than those classified as held to maturity,
are carried at fair value.
Under SAP, certain assets designated as non-admitted are excluded from assets by a direct charge to
surplus; under GAAP, such assets are carried on the balance sheet with appropriate valuation
allowances.
Under SAP, surplus notes are recorded as a component of surplus; under GAAP, surplus notes are
recorded as debt.
Under SAP, an extraordinary distribution approved by PICA’s regulator may be recorded as a return
of capital; under GAAP, the distribution is recorded as a dividend when PICA has undistributed
retained earnings.
Under SAP, goodwill is subject to admissibility limits and is amortized over a period not to exceed
ten years; under GAAP, goodwill is subject to impairment testing and not amortized.
Under SAP, income tax expense is based upon taxes currently payable. Changes in deferred taxes are
generally reported in surplus and subject to admissibility limits; under GAAP, changes in deferred
taxes are generally recorded in income tax expense.
Under SAP, deposits to universal life contracts and immediate annuity contracts without life
contingencies are credited to revenue; under GAAP, such deposits are reported as increases to the
policyholder account balances.
Under SAP, certain contracts, in particular deferred annuities with mortality risk, are considered “life
contracts” and, accordingly, premiums associated with these contracts are reported as revenues.
Under GAAP, the Company’s deferred annuities are classified as either “insurance contracts” or
“investment contracts” and, accordingly, those annuities classified as investment contracts are not
reported as revenues. Amounts received for investment contracts are not reported as policy
liabilities and insurance reserves.
Under SAP, interest-related other-than-temporary impairments for bonds are determined based
primarily upon PICA’s intent to sell or inability to assert its intent and ability to hold the security
until recovery; under GAAP, other-than-temporary impairments for debt securities are based
primarily upon whether PICA intends to sell the security or more likely than not will be required
to sell the security before recovery of its amortized cost basis.
Under SAP, there is no concept of value of business acquired ("VOBA"); under GAAP, VOBA is
recorded as an asset.
Under SAP, an embedded derivative instrument shall not be separated from the host contract and
accounted for separately as a derivative instrument; under GAAP, the accounting and bifurcation
for embedded derivatives follows Accounting Standards Codification ("ASC") 815 - "Derivatives
and Hedging", with the change in fair value during each reporting period recorded within
“Realized investment gains (losses)."

3
Overview
PICA is one of the largest insurance companies in the United States. The principal products and services of
PICA include individual life insurance and annuities, group insurance and pension and retirement products and
related services and administration. The results in the analysis below include the results of the Closed Block
division, which comprises the assets and related liabilities of the Closed Block. The principal executive offices
of PICA are located in Newark, New Jersey.
As of June 30, 2017, PICA's admitted assets were $261 billion (including $136 billion held in separate
accounts), compared to $260 billion (including $136 billion held in separate accounts) as of December 31, 2016.
Excluding separate accounts, assets were primarily comprised of a mix of bonds, mortgage loans, contract loans,
cash and short-term investments, other invested assets, and equity investments designed to match the cash flow
requirements of insurance liabilities.
Results of Operations
Net Income
2017 to 2016 Six Month Comparison. Net income for the six months ended June 30, 2017 was $463 million
compared to $1,662 million for the six months ended June 30, 2016. The decrease of $1,199 million between
periods includes a $1,518 million decrease in operating income before income taxes, from $2,507 million for the
six months ended June 30, 2016 to $989 million for the six months ended June 30, 2017, which was primarily
driven by the following:
• A $1,659 million decrease in the individual life and annuity business primarily driven by a dividend of
$2,594 million from PICA’s subsidiary, PLI, in the second quarter of 2016. This decrease was partially
offset by an increase in reserves in the prior year due to a reserve methodology change in conjunction
with a 2016 reinsurance transaction with an affiliate, PLNJ, in the annuities business, as well as lower
reserves in 2017 due to favorable market conditions; and
• A $12 million decrease in the corporate and other business primarily driven by higher compensation
related expenses;
Partially offset by:
• A $82 million increase in the retirement business primarily driven by higher spread income mainly due
to growth in the pension risk transfer business. Also contributing to the increase was higher income in
2017 from alternative investments. Partially offsetting these increases was a dividend of $147 million
from PICA’s subsidiary, PRIAC, in the second quarter of 2016 as well as higher compensation related
expenses in the current period;
• A $39 million increase in the group insurance business primarily driven by favorable underwriting
experience in the life and disability businesses. Additionally, spread income increased mainly due to an
increase in invested assets as a result of business growth; and
• A $32 million increase in the international insurance business primarily driven by the renewal business
assumed from PGFL partially offset by an increase in commissions as a result of growth of U.S. dollar
denominated business assumed from PLICJ.
The above decrease in net income was partially offset by a $198 million decrease in the income tax provision
from $433 million for the six months ended June 30, 2016 to $235 million for the six months ended June 30, 2017,
which is further discussed below under “Income Tax Provision.”

4
Net income also included a $121 million decrease in net realized capital losses, from $412 million for the six
months ended June 30, 2016 to $291 million for the six months ended June 30, 2017. The components of net
realized capital losses are discussed below under “Capital (Losses)/Gains.”
Change in Statutory Capital and Surplus
For the six months ended June 30, 2017. Statutory capital (surplus plus AVR) increased $303 million, from
$13,445 million at December 31, 2016 to $13,748 million at June 30, 2017. The increase in capital for the period
ended June 30, 2017 was primarily driven by:
• A $749 million change in unrealized capital gains (excluding deferred tax) primarily due to gains from
affiliated common stocks, derivatives and other long-term invested assets. The change in net unrealized
capital gains is further discussed below under “Capital (Losses)/Gains”; and
• Net income of $463 million, as discussed above under “Net Income”;
Partially offset by:
• A $1,000 million dividend paid by PICA to its parent, PFI, during the second quarter of 2017. The
dividend is further discussed below under “Liquidity.”
Revenues
2017 to 2016 Six Month Comparison. Total revenues decreased $1,565 million from $16,304 million for the
six months ended June 30, 2016 to $14,739 million for the six months ended June 30, 2017. The decrease in total
revenues was primarily driven by a $2,670 million decrease in net investment income, which includes IMR
amortization, from $5,200 million for the six months ended June 30, 2016 to $2,530 million for the six months
ended June 30, 2017. This decrease was primarily driven by dividends from PICA’s subsidiaries, PLI and PRIAC
in the second quarter of 2016, as discussed above under “Net Income.” Additionally, contributing to the decrease
in total revenue was a decrease in other income of $149 million, from $845 million for the six months ended June
30, 2016 to $696 million for the six months ended June 30, 2017. The decrease in other income was primarily
driven by lower gains from separate accounts in the retirement business.
Partially offsetting these decreases in total revenues was an increase in premiums of $1,254 million, from
$10,259 million for the six months ended June 30, 2016 to $11,513 million for the six months ended June 30,
2017. The increase in premiums was primarily driven by:
• A $1,586 million increase in the retirement business primarily due to a significant pension risk transfer
transaction completed in the second quarter of 2017 as well as an increase in separate account deposits.
There was no comparable pension risk transfer transaction during the first half of 2016; and
• A $303 million increase in the international insurance business driven by the reinsurance of PGFL and
PLICJ’s U.S. dollar denominated business as a result of business growth;
Partially offset by:
• A $615 million decrease in the individual life and annuity business primarily driven by premiums initially
assumed as part of the reinsurance transaction with PLNJ in the annuities business in the second quarter
of 2016; and
5
• A $28 million decrease in the group insurance business primarily driven by premium returns related to
TOLI contracts, partially offset by higher sales in the life and disability businesses.
Benefits
2017 to 2016 Six Month Comparison. Total benefits, surrenders and fund withdrawals increased $1,062
million from $12,370 million for the six months ended June 30, 2016 to $13,432 million for the six months ended
June 30, 2017. The increase in total benefits, surrenders and fund withdrawals was primarily driven by:
• A $692 million increase in the retirement business primarily driven by an increase in separate account
withdrawals as well as benefit payments related to the pension risk transfer business;
• A $303 million increase in the individual life and annuity business primarily driven by higher assumed
surrenders and benefits in the annuities business as a result of the reinsurance transaction with PLNJ.
Also contributing to the increase were higher benefits in the life business driven by unfavorable mortality
experience;
• A $48 million increase in the international insurance business primarily due to higher assumed surrenders
and benefits from PGFL and PLICJ; and
• A $10 million increase in the group insurance business primarily driven by higher separate account
withdrawals between periods, partially offset by lower benefits due to favorable mortality experience.
Net Increase in Reserves
2017 to 2016 Six Month Comparison. Reserves increased $832 million for the six months ended June 30,
2017, compared to an increase of $3,158 million for the six months ended June 30, 2016. The decrease of $2,326
million in the change in reserves between years was primarily due to the following:
• A $1,595 million decrease in the individual life and annuity business primarily driven by the reinsurance
transaction with PLNJ in the annuities business effective in the second quarter of 2016 as well as
favorable equity markets in 2017;
• A $773 million decrease in the retirement business primarily driven by favorable reserve experience
related to pension risk transfer business; and
• A $154 million decrease in the group insurance business primarily due to a repayment of a large policy
loan;
Partially offset by:
• A $205 million increase in the international insurance business due to an increase in assumed reserves
from the PGFL and PLICJ U.S. dollar denominated business.
Commissions
2017 to 2016 Six Month Comparison. Commissions decreased $279 million from $724 million for the six
months ended June 30, 2016 to $445 million for the six months ended June 30, 2017. The decrease was primarily
driven by the initial ceding commission related to the reinsurance transaction in the annuities business with PLNJ

6
in the second quarter of 2016. Partially offsetting this decrease are higher commissions in the international
insurance business due to growth in U.S. dollar denominated business assumed from PLICJ and PGFL.
Other Expenses
2017 to 2016 Six Month Comparison. Other expenses decreased $189 million from $871 million for the six
months ended June 30, 2016 to $682 million for the six months ended June 30, 2017. The decrease between
periods was primarily driven by lower expenses in the individual life and annuity business mainly due to
adjustments on reinsurance assumed related to reinsurance transactions with PLNJ and The Hartford Financial
Services Group. This increase was partially offset by an increase in the retirement and corporate and other
businesses primarily due to higher compensation related expenses.
Net Transfer From Separate Accounts
2017 to 2016 Six Month Comparison. The net transfer from the separate accounts was ($1,666) million for
the six months ended June 30, 2017, compared to a net transfer from the separate accounts of ($3,377) million for
the six months ended June 30, 2016. The $1,711 million change was primarily driven by the impact of a significant
pension risk transfer transaction in the retirement business completed in the second quarter of 2017. Also
contributing to the change in net transfers from separate accounts was the initial CARVM benefit in the annuities
business as a result of the reinsurance transaction with PLNJ during the second quarter of 2016. Furthermore,
there was a partial surrender in the group insurance business of a large TOLI contract during the first quarter of
2016.
Dividends to Policyholders
2017 to 2016 Six Month Comparison. Dividends to policyholders decreased $26 million from $51 million for
the six months ended June 30, 2016 to $25 million for the six months ended June 30, 2017 primarily driven by a
reclassification of premium refunds related to participating contracts in the group insurance business. Effective
in the first quarter of 2017, group insurance premium returns related to participating contracts which were
previously reported as dividends to policyholders are now recorded as a reduction of premiums in accordance
with SSAP 66 “Retrospectively rated contracts.”
Income Tax Provision
2017 to 2016 Six Month Comparison. The income tax expense decreased $198 million from $433 million for
the six months ended June 30, 2016 to $235 million for the six months ended June 30, 2017 primarily due to the
decrease in pretax book income. The income tax provision is calculated in accordance with SSAP No. 101,
Income Taxes. For interim periods, income taxes are computed using an estimated annual effective tax rate. The
rate is computed as the ratio of projected income tax provision for the entire year over projected statutory net gain
from operations for the year.

7
Capital (Losses)/Gains
2017 to 2016 Six Month Comparison. Net realized capital losses, after taxes and contribution to the IMR,
decreased $121 million, from $412 million for the six months ended June 30, 2016 to $291 million for the six
months ended June 30, 2017. The following table sets forth the components of net realized capital losses:
Six Months Six Months
Ended
June 30,
Ended
June 30,
2017 2016 Change
Bonds…………………….……………………………….. $ 3 $ (111) $ 114
Equity securities…………………………………………... 2 1 1
Derivative instruments……………………………………. (53) (30) (23)
Mortgage loans……………………………………………. - (5) 5
Other invested assets…………………………………….... (25) - (25)
Other………………………………….…………………... 3 53 (50)
Gross realized capital losses……….………………….. (70) (92) 22
Less capital gains tax…...……….…….…………………... 167 346 (179)
Less IMR transfers, net of tax ………....…………………. 54 (26) 80
Net realized capital losses……….…...……………….. $ (291) $ (412) $ 121
Net realized capital losses for the six months ended June 30, 2017 were primarily driven by capital gains tax,
IMR transfers and losses on derivatives. For interim periods, the capital gains tax is derived as the difference
between the total tax and the income tax provision. The total tax is a function of pre-tax book income and the use
of the effective tax rate method. The IMR transfers of $54 million during the period were mainly driven by interest
related trading gains on derivatives due to net long treasury futures as a result of a decrease in interest rates during
the period. Derivative losses, excluded from IMR transfers, were $53 million and primarily driven by equity swap
settlements on short positions due to favorable equity market conditions. The gains on bonds of $3 million include
$39 million of other-than-temporary impairments.
Net realized capital losses for the six months ended June 30, 2016 were primarily driven by capital gains tax.
Additionally, realized capital losses on bonds were partially offset by gains on other assets related to short-term
investments and real estate. The IMR transfers of $26 million during the period were primarily driven by losses
on bonds and derivatives, partially offset by gains on short term investments. The losses on bonds in the first half
of 2016 of $111 million include $55 million of other-than-temporary impairments.
Change in net unrealized capital gains was $614 million for the six months ended June 30, 2017. The change
was mainly due to $301 million of affiliated common stock gains primarily driven by earnings from PICA’s
subsidiaries, PRIAC, COLICO and PLI. Additionally, unrealized gains reflect $222 million in derivatives gains
due net long interest rate swaps as a result of a decrease in interest rates during the period. Unrealized gains of
$48 million in other long-term invested assets also contributed to the change in unrealized capital gains.
Change in net unrealized capital losses was $1,040 million for the six months ended June 30, 2016. The
change was mainly due to $1,815 million of affiliated common stock unrealized losses which primarily reflect
dividends that were distributed in the second quarter of 2016 by PICA’s subsidiaries, PLI, PRIAC and PLIC.
Additionally, unrealized losses reflect $417 million in deferred taxes. Partially offsetting these losses was $1,185
million of gains from derivatives as a result of a decrease in interest rates during the period.
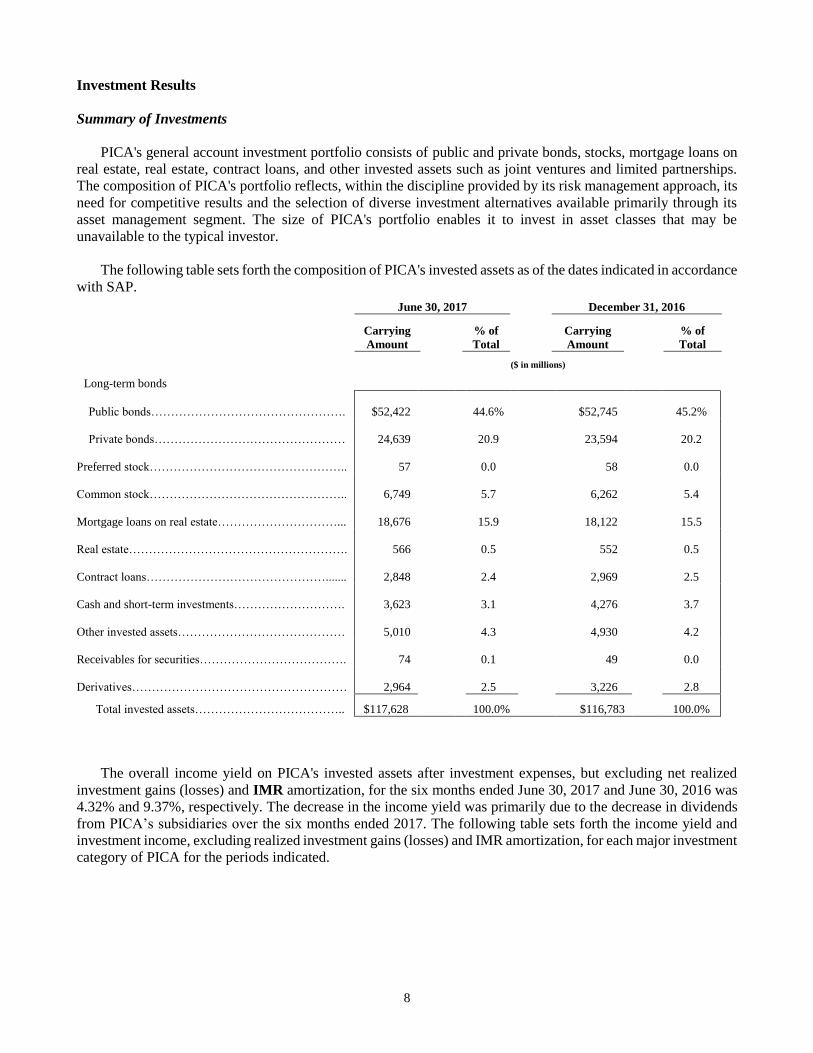
8
Investment Results
Summary of Investments
PICA's general account investment portfolio consists of public and private bonds, stocks, mortgage loans on
real estate, real estate, contract loans, and other invested assets such as joint ventures and limited partnerships.
The composition of PICA's portfolio reflects, within the discipline provided by its risk management approach, its
need for competitive results and the selection of diverse investment alternatives available primarily through its
asset management segment. The size of PICA's portfolio enables it to invest in asset classes that may be
unavailable to the typical investor.
The following table sets forth the composition of PICA's invested assets as of the dates indicated in accordance
with SAP.
Long-term bonds
Public bonds………………………………………….
$52,422
44.6%
$52,745 45.2%
Private bonds…………………………………………
24,639 20.9
23,594 20.2
Preferred stock…………………………………………..
57 0.0
58 0.0
Common stock…………………………………………..
6,749 5.7
6,262 5.4
Mortgage loans on real estate…………………………...
18,676 15.9
18,122 15.5
Real estate……………………………………………….
566 0.5
552 0.5
Contract loans……………………………………….......
2,848 2.4
2,969 2.5
Cash and short-term investments……………………….
3,623 3.1
4,276 3.7
Other invested assets……………………………………
5,010 4.3
4,930 4.2
Receivables for securities……………………………….
74 0.1
49 0.0
Derivatives………………………………………………
2,964 2.5
3,226 2.8
Total invested assets……………………………….. $117,628 100.0% $116,783 100.0%
The overall income yield on PICA's invested assets after investment expenses, but excluding net realized
investment gains (losses) and IMR amortization, for the six months ended June 30, 2017 and June 30, 2016 was
4.32% and 9.37%, respectively. The decrease in the income yield was primarily due to the decrease in dividends
from PICA’s subsidiaries over the six months ended 2017. The following table sets forth the income yield and
investment income, excluding realized investment gains (losses) and IMR amortization, for each major investment
category of PICA for the periods indicated.
June 30, 2017 December 31, 2016
Carrying
Amount
% of
Total
Carrying
Amount
% of
Total
($ in millions)
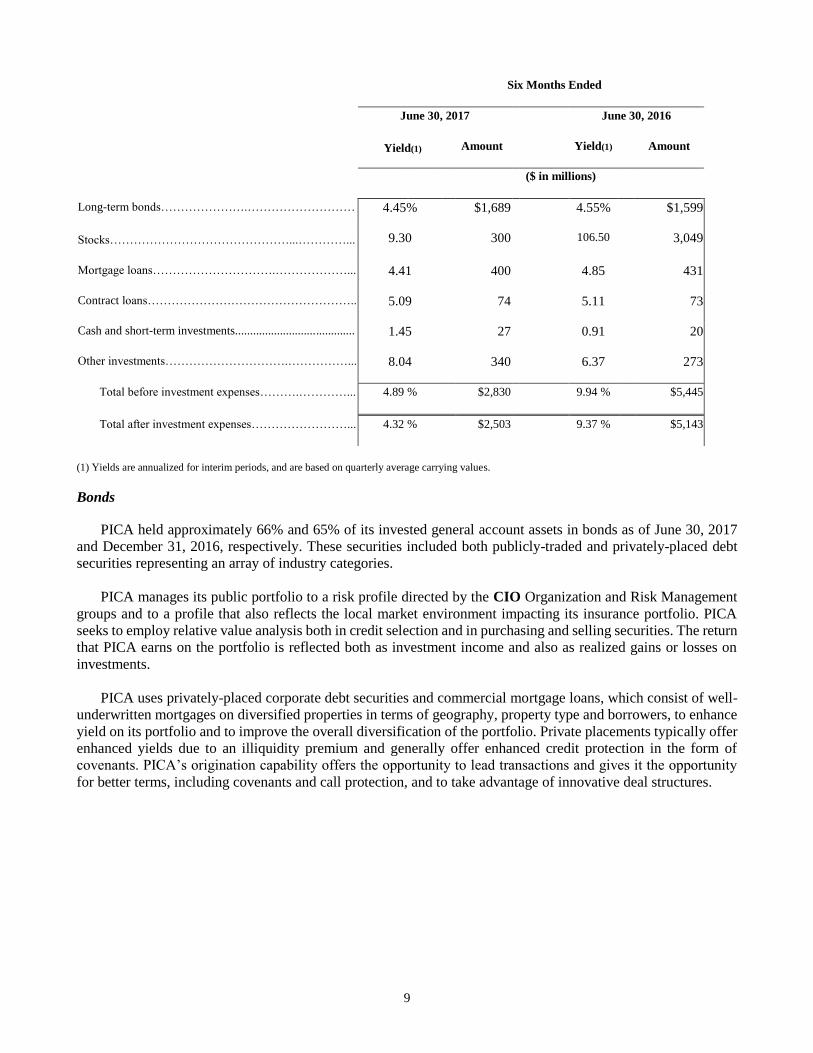
9
(1) Yields are annualized for interim periods, and are based on quarterly average carrying values.
Bonds
PICA held approximately 66% and 65% of its invested general account assets in bonds as of June 30, 2017
and December 31, 2016, respectively. These securities included both publicly-traded and privately-placed debt
securities representing an array of industry categories.
PICA manages its public portfolio to a risk profile directed by the CIO Organization and Risk Management
groups and to a profile that also reflects the local market environment impacting its insurance portfolio. PICA
seeks to employ relative value analysis both in credit selection and in purchasing and selling securities. The return
that PICA earns on the portfolio is reflected both as investment income and also as realized gains or losses on
investments.
PICA uses privately-placed corporate debt securities and commercial mortgage loans, which consist of well-
underwritten mortgages on diversified properties in terms of geography, property type and borrowers, to enhance
yield on its portfolio and to improve the overall diversification of the portfolio. Private placements typically offer
enhanced yields due to an illiquidity premium and generally offer enhanced credit protection in the form of
covenants. PICA’s origination capability offers the opportunity to lead transactions and gives it the opportunity
for better terms, including covenants and call protection, and to take advantage of innovative deal structures.
Six Months Ended
June 30, 2017 June 30, 2016
Yield(1) Amount Yield(1) Amount
($ in millions)
Long-term bonds………………….……………………… 4.45% $1,689 4.55%
$1,599
Stocks………………………………………...…………... 9.30 300 106.50 3,049
Mortgage loans………………………….………………... 4.41 400 4.85 431
Contract loans…………………………………………….. 5.09 74 5.11 73
Cash and short-term investments........................................ 1.45 27 0.91 20
Other investments………………………….……………... 8.04 340 6.37 273
Total before investment expenses……….…………... 4.89 % $2,830 9.94 %
$5,445
Total after investment expenses……………………... 4.32 %
$2,503 9.37 %
$5,143

10
The following table sets forth the composition of PICA's long-term bond portfolio by industry category as of
the dates indicated.
Asset-Backed Securities
As of June 30, 2017, and December 31, 2016, the Industrial & miscellaneous (unaffiliated) carrying value
included approximately $0.3 billion ($0.4 billion fair value) and $0.4 billion ($0.4 billion fair value) of securities
collateralized by sub-prime mortgages, respectively. While there is no market standard definition, PICA defines
sub-prime mortgages as residential mortgages that are originated to weaker quality obligors as indicated by weaker
credit scores, as well as mortgages with higher loan-to-value ratios, or limited documentation.
June 30, 2017 December 31, 2016
Estimated Estimated
Carrying % of Fair Carrying % of Fair
Value Total Value Value Total Value
($ in millions)
US governments……………………………………… $5,398 7.0%
$6,204 $5,627 7.4%
$6,247
All other governments………………………………... 2,997 3.9 3,303 2,745 3.7 2,987
Political subdivisions of states, territories, &
possessions (direct & guaranteed)………………........ 811 1.1 911 752 1.0 805
Special revenue & special assessment obligations &
non guaranteed obligations of agencies…………....... 5,212 6.8 5,719 5,201 6.4 5,606
Industrial & miscellaneous (unaffiliated)…………….. 59,588 77.2 63,238 59,049 77.5
61,844
Parent, subsidiaries and affiliates…………………….. 2,613 3.4 2,747 2,646 3.5 2,736
Hybrid securities……………………………………… 442 0.6 523 319 0.5 364
Total long-term bonds………………………….… $77,061 100.0%
$82,645 $76,339 100.0%
$80,589

11
Commercial Mortgage-Backed Securities
At both June 30, 2017, and December 31, 2016, Industrial & miscellaneous (unaffiliated) carrying value
included approximately $4.7 billion ($4.8 billion fair value) of commercial mortgage-backed securities.
The following table sets forth the carrying value and fair value of PICA’s asset-backed securities and
commercial mortgage-backed securities by credit quality as of the date indicated.
June 30, 2017
Asset-Backed Securities
Commercial Mortgage-Backed
Securities
Carrying
Amount
Fair
Value
Carrying
Amount Fair Value
($ in millions)
AAA $ 5,698 $ 5,713 $ 4,694 $ 4,799
AA 402 417 1 1
A 37 41 - -
BBB 55 56 - -
BB and below 273 379 - -
Total $ 6,465 $ 6,606 $ 4,694 $ 4,800
(1) Bonds are carried at amortized cost, except NAIC 6 rated bonds, which are carried at the lower of cost or fair market value.
(2) The tables above provide ratings as assigned by nationally recognized rating agencies as of June 30, 2017. (3) There were no agency commercial mortgage-backed securities included in the table above as of June 30, 2017.
The table above provides ratings assigned by nationally recognized rating agencies as of June 30, 2017,
including S&P, Moody’s and Fitch. In making its investment decisions, rather than relying solely on the rating
agencies’ evaluations, PICA assigns internal ratings to its asset-backed securities based upon its dedicated asset-
backed securities unit’s independent evaluation of the underlying collateral and securitization structure, including
any guarantees from monoline bond insurers.
The amortized cost of asset-backed securities collateralized by sub-prime mortgages decreased from $0.4
billion ($0.4 billion fair value) as of December 31, 2016, to $0.3 billion ($0.4 billion fair value) as of June 30,
2017, primarily reflecting sales and paydowns.
Bond Credit Quality
The SVO evaluates the investments of insurers for statutory reporting purposes and assigns bonds to one of
six categories called "NAIC Designations." In general, NAIC Designations of "1" highest quality or "2" high
quality include bonds considered investment grade, which include securities rated Baa3 or higher by Moody's or
BBB- or higher by S&P. NAIC Designations of "3" through "6" generally include bonds referred to as below
investment grade, which include securities rated Ba1 or lower by Moody's and BB+ or lower by S&P. The NAIC
Designations for commercial mortgage-backed securities and non-agency residential mortgage-backed securities,
including PICA’s asset-backed securities collateralized by sub-prime mortgages, are based on security level
expected losses as modeled by an independent third-party (engaged by the NAIC) and the statutory carrying value
of the security, including any purchase discounts or impairment charges previously recognized.
As a result of time lags between the funding of investments, the finalization of legal documents, and the
completion of the SVO filing process, the bond portfolio generally includes securities that have not yet been
designated by the SVO as of each balance sheet date. Pending receipt of SVO designations, the categorization of
these securities by NAIC Designation is based on the expected ratings indicated by internal analysis.
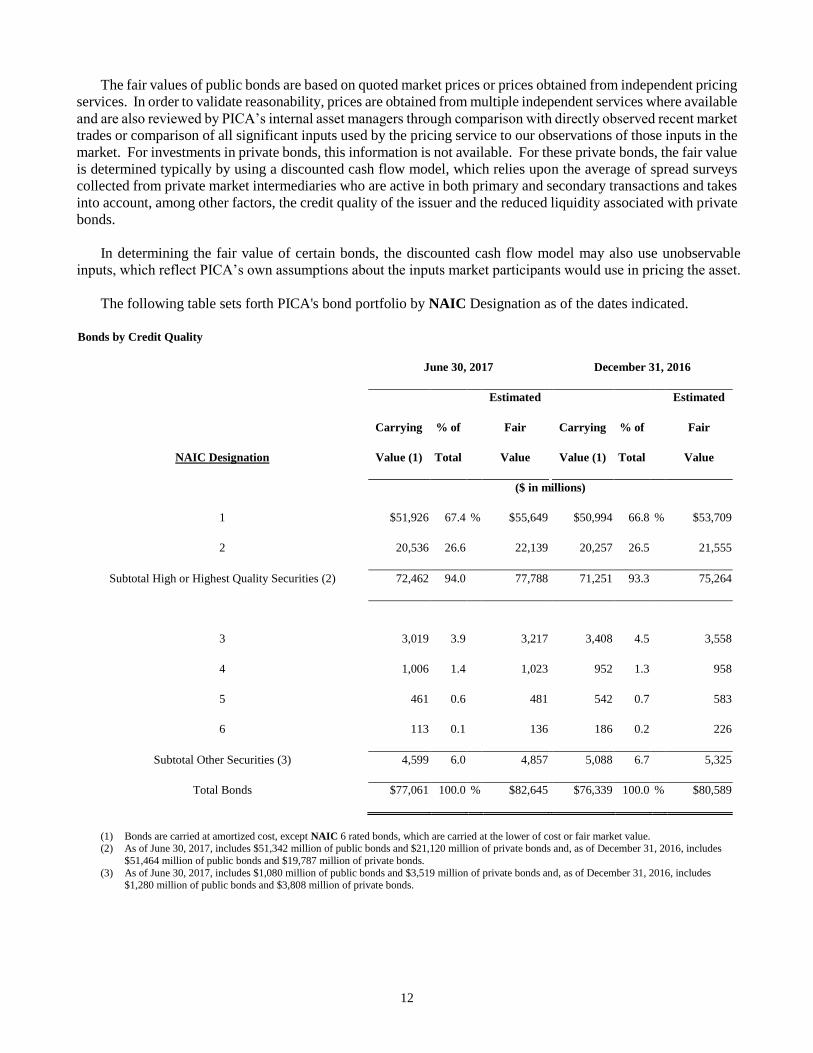
12
The fair values of public bonds are based on quoted market prices or prices obtained from independent pricing
services. In order to validate reasonability, prices are obtained from multiple independent services where available
and are also reviewed by PICA’s internal asset managers through comparison with directly observed recent market
trades or comparison of all significant inputs used by the pricing service to our observations of those inputs in the
market. For investments in private bonds, this information is not available. For these private bonds, the fair value
is determined typically by using a discounted cash flow model, which relies upon the average of spread surveys
collected from private market intermediaries who are active in both primary and secondary transactions and takes
into account, among other factors, the credit quality of the issuer and the reduced liquidity associated with private
bonds.
In determining the fair value of certain bonds, the discounted cash flow model may also use unobservable
inputs, which reflect PICA’s own assumptions about the inputs market participants would use in pricing the asset.
The following table sets forth PICA's bond portfolio by NAIC Designation as of the dates indicated.
Bonds by Credit Quality
June 30, 2017 December 31, 2016
Estimated Estimated
Carrying % of Fair Carrying % of Fair
NAIC Designation Value (1) Total Value Value (1) Total Value
($ in millions)
1 $51,926 67.4 % $55,649 $50,994 66.8 % $53,709
2 20,536 26.6 22,139 20,257 26.5 21,555
Subtotal High or Highest Quality Securities (2) 72,462 94.0 77,788 71,251 93.3 75,264
3 3,019 3.9 3,217 3,408 4.5 3,558
4 1,006 1.4 1,023 952 1.3 958
5 461 0.6 481 542 0.7 583
6 113 0.1 136 186 0.2 226
Subtotal Other Securities (3) 4,599 6.0 4,857 5,088 6.7 5,325
Total Bonds $77,061 100.0 % $82,645 $76,339 100.0 % $80,589
(1) Bonds are carried at amortized cost, except NAIC 6 rated bonds, which are carried at the lower of cost or fair market value. (2) As of June 30, 2017, includes $51,342 million of public bonds and $21,120 million of private bonds and, as of December 31, 2016, includes
$51,464 million of public bonds and $19,787 million of private bonds.
(3) As of June 30, 2017, includes $1,080 million of public bonds and $3,519 million of private bonds and, as of December 31, 2016, includes $1,280 million of public bonds and $3,808 million of private bonds.
13
Other-Than-Temporary Impairments of Bonds
PICA maintains separate monitoring processes for public and private bonds and creates watch lists to highlight
bonds that require special scrutiny and management. The public bond asset managers review on a quarterly basis
and more frequently when necessary to identify potential credit deterioration whether due to ratings downgrades,
unexpected price variances, and/or company or industry specific concerns.
For private placements, PICA’s credit and portfolio management processes help ensure prudent controls over
valuation and management. PICA has separate pricing and authorization processes to establish "checks and
balances" for new investments. PICA applies consistent standards of credit analysis and due diligence for all
transactions, whether they originate through its own in-house origination staff or through agents. PICA's regional
offices closely monitor the portfolios in their regions. PICA sets all valuation standards centrally, and assesses the
fair value of all investments quarterly. PICA’s private bond asset managers formally review all private bond
holdings on a quarterly basis or more frequently when necessary to identify potential credit deterioration whether
due to ratings downgrades, unexpected price variances, and/or company or industry specific concerns.
All bonds with unrealized losses are subject to review to identify other-than-temporary impairments in value.
In evaluating whether a decline in value is other-than-temporary, PICA considers several factors including, but
not limited to, the following:
• the reasons for the decline in value (credit event, currency or interest rate related, including general credit
spread widening);
• PICA's ability and intent to hold its investment for a period of time to allow for recovery of value;
• PICA's intent to sell its investment before recovery of the cost of the investment;
• the financial condition of and near-term prospects of the issuer; and
• the extent and duration of the decline.
In determining whether a decline in value is other-than-temporary, PICA places a greater emphasis on analysis
of the underlying credit versus the extent and duration of a decline in value. PICA’s credit analysis of an
investment includes determining whether the issuer is current on its contractual payments, evaluating whether it
is probable that PICA will be able to collect all amounts due according to the contractual terms of the security,
and analyzing PICA’s overall ability to recover the carrying value of the investment. PICA continues to utilize
valuation declines as a potential indicator of credit deterioration, and applies additional levels of scrutiny in its
analysis as the severity and duration of the decline increases.
Under SSAP No. 43R, an other-than-temporary impairment occurs when the entity does not expect (on a
discounted basis) to recover the entire cost basis of a loan-backed or structured security. The amount of the other-
than-temporary impairment recognized as a realized loss equals the difference between the investment's cost basis
and the present value of cash flows expected to be collected, discounted at the effective interest rate implicit in
the debt security prior to impairment. The present value of cash flows expected to be collected becomes the new
cost basis of the investment. Additionally, if an entity wrote the security down to fair value due to the intent to
sell or because it does not have the ability and intent to hold a security in an unrealized loss position for a period
of time sufficient to recover the cost of the security, the non-interest related portion of the other-than-temporary
impairment losses is recorded through the AVR while the interest related other-than-temporary impairment losses
is recorded through the IMR.

14
Preferred Stock
PICA held less than 1% of its invested general account assets in preferred stock as of both June 30, 2017 and
December 31, 2016.
Common Stocks
PICA held approximately 6% and 5% of its invested general account assets in common stock as of June 30,
2017 and December 31, 2016, respectively. Substantially all of PICA's unaffiliated common stocks are publicly-
traded on national securities exchanges.
Impairments of Common Stocks
Common stocks with unrealized losses are subject to review to identify other-than-temporary impairments in
value. In evaluating whether a decline in value is other-than-temporary, PICA consistently considers several
factors including, but not limited to, the following:
• the extent and the duration of the decline; including, but not limited to, the following general guidelines:
o declines in value greater than 20%, maintained for six months or greater;
o declines in value maintained for one year or greater; and
o declines in value greater than 50%.
• the reasons for the decline in value (credit event, currency or market fluctuation);
• PICA’s ability and intent to hold the investment for a period of time to allow for a recovery of value,
including common stock managed by independent third parties where we do not have management
discretion; and
• the financial condition of and near-term prospects of the issuer.
PICA generally recognizes other-than-temporary impairments for securities with declines in value greater
than 50% maintained for six months or greater or with any decline in value maintained for one year or greater. In
addition, in making its determinations PICA continues to analyze the financial condition and near-term prospects
of the issuer, including an assessment of the issuer’s capital position, and considers its ability and intent to hold
the investment for a period of time to allow for a recovery of value.
When it has been determined that there is an other-than-temporary impairment, PICA records a write down
in its Statement of Operations and Changes in Capital and Surplus within "Net Realized Capital Gains (Losses)"
to the estimated fair value, which reduces the cost basis. The new cost basis of an impaired security is not adjusted
for subsequent increases in estimated fair value. Estimated fair values for publicly traded common stock are based
on quoted market prices or prices obtained from independent pricing services. Estimated fair values for privately
traded common stock are determined using valuation and discounted cash flow models that require a substantial
level of judgment.
Mortgage Loans on Real Estate
Investment Mix
PICA held approximately 16% of its invested general account assets in mortgage loans on real estate as of
both June 30, 2017 and December 31, 2016.

15
The following table sets forth the composition of PICA’s general account investments in commercial
mortgage loans on real estate, as of the dates indicated.
June 30,
December 31,
2017 2016
(in millions)
Commercial mortgage loans……………………... $ 17,069 $ 16,628
Agricultural property loans………………………. 1,605
1,492
Residential property loans………………………..
2
2
Total (1)………………………………………….. $ 18,676 $ 18,122
(1) The portfolio consisted of 1,113 commercial mortgage loans and 472 residential and agricultural loans as of June 30, 2017 and consisted of 1,105 commercial mortgage loans and 461 residential and agricultural loans as of December 31, 2016.
PICA originates mortgage loans on real estate using a dedicated investment staff through various regional
offices in the U.S. and International offices primarily in London. All loans are underwritten consistently to PICA's
standards using a proprietary quality rating system that has been developed from its experience in real estate and
mortgage lending.
PICA’s loan portfolio strategy emphasizes diversification by property type and geographic location. The
following table sets forth the breakdown of the mortgage loan portfolio by geographic region as of the dates
indicated. June 30, 2017 December 31, 2016
Carrying % of Carrying % of
U.S. Regions: (1)
Value Total Value Total
($ in millions)
Pacific $5,850 31.3 % $5,959 32.9 %
South Atlantic 3,564 19.1 3,431 18.9
Middle Atlantic 2,666 14.3 2,647 14.6
West South Central 1,985 10.6 1,914 10.6
East North Central 1,086 5.8 1,032 5.7
Mountain 779 4.2 643 3.5
New England 776 4.2 789 4.4
West North Central 274 1.5 267 1.5
East South Central 263 1.4 235 1.3
Subtotal – U.S. Regions $17,243 92.4 % $16,917 93.4 %
Other 1,433 7.6 1,205 6.6
Total mortgage loans $18,676 100.0 % $18,122 100.0 %
(1) Regions as defined by the United States Census bureau.
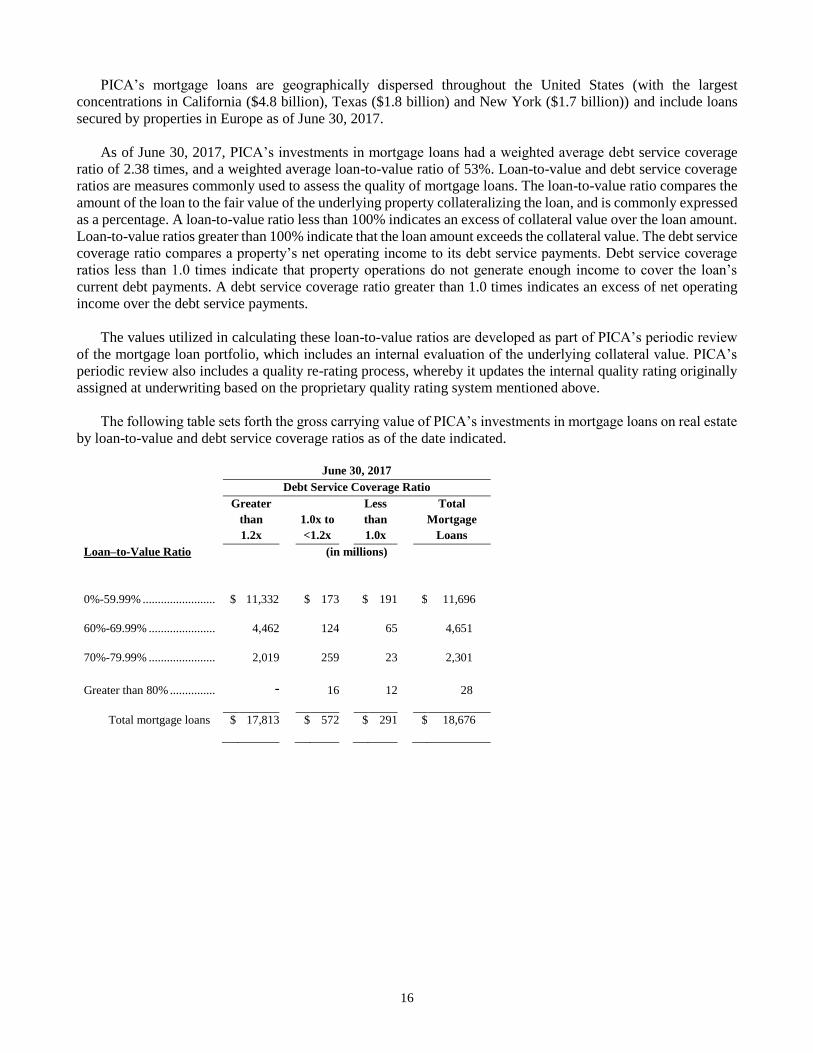
16
PICA’s mortgage loans are geographically dispersed throughout the United States (with the largest
concentrations in California ($4.8 billion), Texas ($1.8 billion) and New York ($1.7 billion)) and include loans
secured by properties in Europe as of June 30, 2017.
As of June 30, 2017, PICA’s investments in mortgage loans had a weighted average debt service coverage
ratio of 2.38 times, and a weighted average loan-to-value ratio of 53%. Loan-to-value and debt service coverage
ratios are measures commonly used to assess the quality of mortgage loans. The loan-to-value ratio compares the
amount of the loan to the fair value of the underlying property collateralizing the loan, and is commonly expressed
as a percentage. A loan-to-value ratio less than 100% indicates an excess of collateral value over the loan amount.
Loan-to-value ratios greater than 100% indicate that the loan amount exceeds the collateral value. The debt service
coverage ratio compares a property’s net operating income to its debt service payments. Debt service coverage
ratios less than 1.0 times indicate that property operations do not generate enough income to cover the loan’s
current debt payments. A debt service coverage ratio greater than 1.0 times indicates an excess of net operating
income over the debt service payments.
The values utilized in calculating these loan-to-value ratios are developed as part of PICA’s periodic review
of the mortgage loan portfolio, which includes an internal evaluation of the underlying collateral value. PICA’s
periodic review also includes a quality re-rating process, whereby it updates the internal quality rating originally
assigned at underwriting based on the proprietary quality rating system mentioned above.
The following table sets forth the gross carrying value of PICA’s investments in mortgage loans on real estate
by loan-to-value and debt service coverage ratios as of the date indicated.
June 30, 2017
Debt Service Coverage Ratio
Greater
than
1.2x
1.0x to
<1.2x
Less
than
1.0x
Total
Mortgage
Loans
Loan–to-Value Ratio (in millions)
0%-59.99% ........................ $
11,332 $ 173 $ 191
$ 11,696
60%-69.99% ......................
4,462
124
65
4,651
70%-79.99% ......................
2,019
259
23
2,301
Greater than 80% ...............
-
16
12
28
Total mortgage loans $ 17,813 $ 572 $ 291 $ 18,676

17
The following table sets forth the breakdown of PICA’s mortgage loans on real estate portfolio by year of
origination as of the date indicated.
Mortgage Loans on Real Estate Quality
Ongoing review of the portfolio is performed and loans are placed on watch list status based on a predefined
set of criteria, where they are assigned to one of the following categories. PICA classifies loans as closely
monitored when it determines there is a collateral deficiency or other credit events that may lead to a potential
loss of principal or interest. Loans not in good standing are those loans where PICA has concluded that there is a
high probability of loss of principal, such as when the loan is in the process of foreclosure or the borrower is in
bankruptcy. PICA’s workout and special servicing professionals manage the loans on the watch list. As described
below, in determining PICA’s allowance for losses, it evaluates each loan on the watch list to determine if it is
probable that amounts due according to the contractual terms of the loan agreement will not be collected.
PICA establishes an allowance for losses to provide for the risk of credit losses inherent in the lending process.
The allowance includes loan-specific reserves for loans that are determined to be impaired as a result of PICA’s
loan review process. PICA defines an impaired loan as a loan for which it estimates it is probable that amounts
due according to the contractual terms of the loan agreement will not be collected. The loan specific loss allowance
is based on PICA’s assessment as to ultimate collectability of loan principal and interest. Valuation allowances
for an impaired loan are recorded based on the present value of expected future cash flows discounted at the loan’s
effective interest rate or based on the fair value of the collateral less the estimated costs to obtain and sell. The
valuation allowance for mortgage loans can increase or decrease from period to period based on these factors.
June 30, 2017
Year of Origination
Gross
Carrying
Value
% of Total
($ in millions)
2017 $ 1,471 7.9 %
2016 2,588 13.9
2015 2,494 13.4
2014 2,799 15.0
2013 2,311 12.4
2012 1,887 10.1
2011 2,228 11.9
2010 & prior 2,898 15.4
Total mortgage loans on real estate $ 18,676 100.0 %
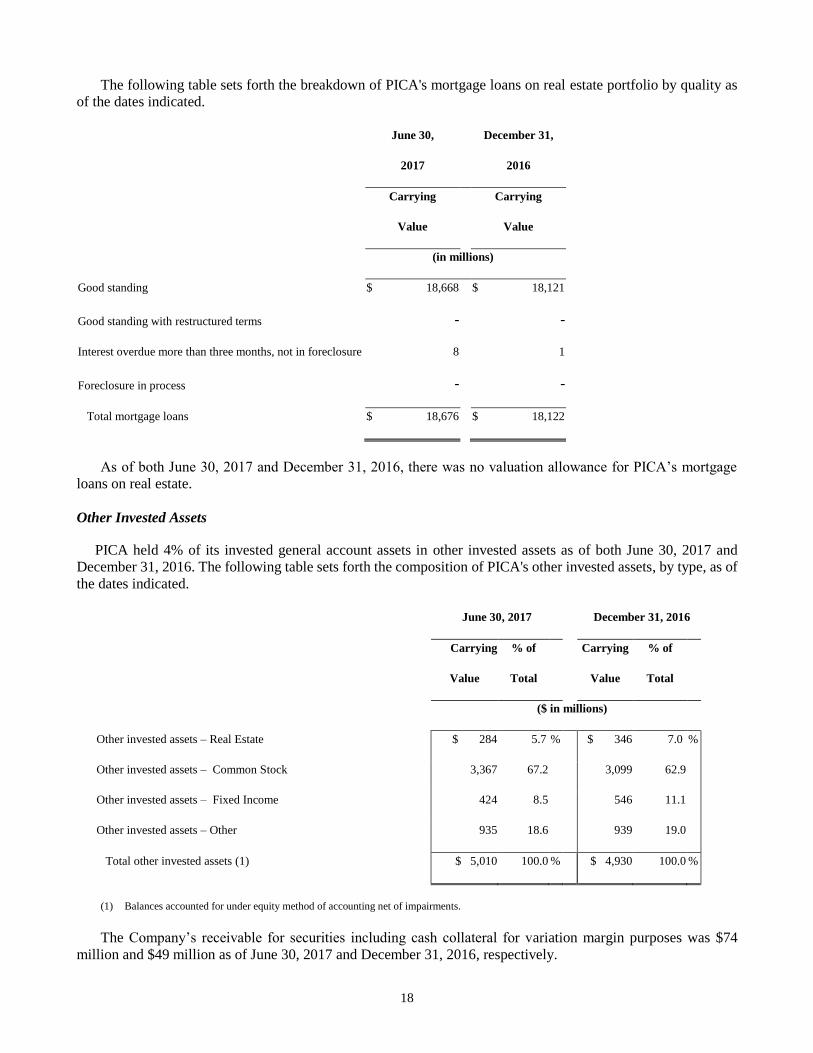
18
The following table sets forth the breakdown of PICA's mortgage loans on real estate portfolio by quality as
of the dates indicated.
June 30, December 31,
2017 2016
Carrying Carrying
Value Value
(in millions)
Good standing $ 18,668 $ 18,121
Good standing with restructured terms - -
Interest overdue more than three months, not in foreclosure 8 1
Foreclosure in process - -
Total mortgage loans $ 18,676 $ 18,122
As of both June 30, 2017 and December 31, 2016, there was no valuation allowance for PICA’s mortgage
loans on real estate.
Other Invested Assets
PICA held 4% of its invested general account assets in other invested assets as of both June 30, 2017 and
December 31, 2016. The following table sets forth the composition of PICA's other invested assets, by type, as of
the dates indicated.
June 30, 2017 December 31, 2016
Carrying % of Carrying % of
Value Total Value Total
($ in millions)
Other invested assets – Real Estate $ 284 5.7 % $ 346 7.0 %
Other invested assets – Common Stock 3,367 67.2 3,099 62.9
Other invested assets – Fixed Income 424 8.5 546 11.1
Other invested assets – Other 935 18.6 939 19.0
Total other invested assets (1) $ 5,010 100.0 % $ 4,930 100.0 %
(1) Balances accounted for under equity method of accounting net of impairments.
The Company’s receivable for securities including cash collateral for variation margin purposes was $74
million and $49 million as of June 30, 2017 and December 31, 2016, respectively.
19
Liquidity and Capital Resources
Liquidity
Liquidity refers to the ability to generate sufficient cash resources to meet the payment obligations of PICA.
Capital refers to the long term financial resources available to support the operations of PICA’s businesses, fund
business growth, and provide a cushion to withstand adverse circumstances. PICA’s ability to generate and
maintain sufficient liquidity and capital depends on the profitability of its businesses, general economic conditions
and its access to the capital markets including through its affiliates as described herein.
PICA's principal cash flow sources from insurance, annuities and guaranteed products are premiums and
annuity considerations, investment and fee income, and investment maturities and sales. PICA supplements these
cash inflows with financing activities. PICA’s cash outflow requirements principally relate to benefits, claims,
dividends paid to policyholders, and payments to contract holders in connection with surrenders, withdrawals and
net policy loan activity. Benefits include the payment of benefits under life insurance, annuity and guaranteed
products. PICA’s uses of cash also include commissions, general and administrative expenses, purchases of
investments, and debt service and repayments in connection with financing activities, as well as dividend
payments to its parent, PFI.
Some of PICA's products, such as guaranteed products offered to institutional customers, provide for payment
of accumulated funds to the contract holder at a specified maturity date unless the contract holder elects to roll
over the funds into another contract with PICA. PICA regularly monitors its liquidity requirements associated
with policyholder and contract holder obligations so that it can manage cash inflows to match anticipated cash
outflow requirements.
In addition, PICA has several subsidiaries that are subject to regulatory limitations on the payment of
dividends to PICA.
PICA is subject to regulatory limitations on the payment of dividends. New Jersey insurance law provides
that, except in the case of extraordinary dividends (as described below), all dividends or distributions paid by
PICA may be paid only from unassigned surplus, as determined pursuant to SAP, less unrealized capital gains
and revaluation of assets. PICA must give prior notification to the Commissioner of its intent to pay any dividend
or distribution. Also, if any dividend, together with other dividends or distributions made within the preceding
twelve months, exceeds the greater of (i) 10% of the prior calendar year’s statutory surplus or (ii) the prior calendar
year’s statutory net gain from operations (excluding realized capital gains), the dividend is considered to be an
“extraordinary dividend” and the prior approval of the Commissioner is required for payment of the dividend.
Moreover, the Commissioner is authorized to disallow the payment of any dividend or distribution, even if the
dividend is not an “extraordinary dividend”, if it determines that PICA does not have a reasonable surplus as to
policyholders relative to its outstanding liabilities and adequate to its financial needs or if it finds PICA to be in a
hazardous financial condition.
In June 2017, PICA paid an ordinary dividend of $1,000 million to its parent, PFI, which was approved by
the Commissioner in June 2017.
In June 2016, PICA paid a dividend of $900 million to its parent, PFI, of which $463 million was an
extraordinary dividend and $437 million was an ordinary dividend. Of the $900 million dividend, $542 million
was recorded as a return of capital and $358 million was recorded as dividend to stockholders. The extraordinary
dividend was approved by the Commissioner in May 2016.
In April 2016, PICA paid a dividend of $2,118 million to its parent, PFI, of which $1,513 million was an
extraordinary dividend and $605 million was an ordinary dividend. The dividend was recorded as dividend to
stockholders. The extraordinary dividend was approved by the Commissioner in April 2016.

20
Net cash provided by operations was $1,554 million and $2,330 million for the six months ended June 30,
2017 and June 30, 2016, respectively. The fluctuation between periods was primarily driven by an increase in
benefits and claims paid, partially offset by an increase in premiums.
Net cash (used in) investing activities was ($604) million and ($4,746) million for the six months ended June
30, 2017 and June 30, 2016, respectively. The fluctuation between periods was principally driven by a decrease
in net investments in bonds. PICA’s cash flows from investment activities result from repayments of principal,
proceeds from maturities and sales of invested assets and investment income, net of amounts reinvested. The
primary liquidity risks with respect to these cash flows are the risk of default by debtors or bond insurers, PICA
counterparties’ willingness to extend repurchase and/or securities lending arrangements and market volatility.
PICA closely manages these risks through our credit risk management process and regular monitoring of our
liquidity position.
Net cash (used in) provided by financing activities was ($1,603) million and $2,233 million for the six months
ended June 30, 2017 and June 30, 2016, respectively. The fluctuation between periods was principally driven by
a reduction in collateralization of derivatives between periods. Additionally, contributing to the change was a $1
billion dividend payment by PICA to PFI in the second quarter of 2017.
Included in operating activity above were contractually scheduled withdrawals and prepayments of general
account GICs totaling $3,110 million for the six months ended June 30, 2017. Because these contractual
withdrawals, as well as the level of surrenders experienced, were consistent with PICA's assumptions in asset
liability management, the associated cash outflows did not have an adverse impact on PICA’s overall liquidity.
PICA believes that cash flows from its insurance, annuity and guaranteed products operations are adequate to
satisfy the current liquidity requirements of these operations based on its current liability structure and considering
a variety of reasonably foreseeable stress scenarios. The continued adequacy of this liquidity will depend upon
factors including future securities market conditions, changes in interest rate levels, policyholder perceptions of
PICA's financial strength and the relative safety of competing products, each of which could lead to reduced cash
inflows or increased cash outflows. In addition, market volatility can impact the level of capital required to support
PICA’s businesses, particularly PICA’s annuity business.
As of June 30, 2017 and December 31, 2016, PICA had cash and short-term investments of approximately
$3.6 billion and $4.3 billion, respectively, and investment grade bonds with a fair market value of $78 billion and
$75 billion, respectively.
Financing
PF, a wholly owned subsidiary of PICA, continues to serve as a source of financing for PICA and its
subsidiaries, as well as for other subsidiaries of PFI. PF operates under a support agreement with PICA whereby
PICA has agreed to maintain PF's positive tangible net worth at all times. PF borrows funds primarily through
the direct issuance of commercial paper. PF’s outstanding loans to other subsidiaries of PFI have declined over
time as it transitions into a financing company primarily for PICA and its remaining subsidiaries. As of June 30,
2017, PF had a tangible net worth of $21 million and short-term and long-term notes outstanding of $817 million
and $221 million, respectively.
PF maintains a commercial paper program with an authorized capacity of $7 billion. PF's outstanding
commercial paper was $817 million as of June 30, 2017, representing an increase of $292 million from December
31, 2016. As of June 30, 2017, the weighted average maturity of PF’s outstanding commercial paper was 26 days,
none of which was due overnight. As of June 30, 2017, the majority of these proceeds were utilized to fund short-
term cash flow timing mismatches and the working capital needs of PF’s affiliates, while the remainder was
primarily held in cash and cash equivalents. The daily average commercial paper outstanding for the six months
ended June 30, 2017 under this program was $1,013 million. The weighted average interest rates on these

21
borrowings were 0.82% and 0.38% for the six months ended June 30, 2017 and 2016, respectively. PFI has issued
a subordinated guarantee covering PF’s commercial paper program.
In July 2017, PFI amended and restated its $4.0 billion five-year credit facility that has both PFI and PF as
borrowers and a syndicate of financial institutions as lenders, extending the term of the facility to July 2022.
Borrowings under this credit facility may be used for general corporate purposes, and PFI expects that it may
borrow under the facility from time to time to fund its working capital needs and those of its subsidiaries. In
addition, amounts under the credit facility may be drawn in the form of standby letters of credit that can be used
to meet the operating needs of PFI and its subsidiaries. The credit facility contains representations and warranties,
covenants and events of default that are customary for facilities of this type, and borrowings under the facility are
not contingent on the borrowers’ credit ratings nor subject to material adverse change clauses. Borrowings under
the credit facility are conditioned on the continued satisfaction of customary conditions, including the maintenance
by PFI of consolidated net worth of at least $20.958 billion, which for this purpose is calculated as U.S. GAAP
equity, excluding accumulated other comprehensive income (loss), equity of noncontrolling interests and equity
attributable to the Closed Block. As of June 30, 2017, PFI was in compliance with the covenants under the credit
facility. As of June 30, 2017, there were no outstanding borrowings under the credit facility.
PICA maintains a Funding Agreement Notes Issuance Program under which Delaware statutory trusts issue
medium-term notes and/or short-term commercial paper to investors that are secured by funding agreements
issued to the trusts by the Company. Under this program, the maximum authorized amount is $15 billion of
medium-term notes and $3 billion of commercial paper. The outstanding commercial paper and notes have fixed
or floating interest rates that range from 0.0% to 2.6% and original maturities ranging from twelve days to five
years. Under SAP, the medium-term notes and commercial paper are included, along with liabilities relating to
other funding agreements, in the line item “Policyholders’ account balances” and not in the line item “Notes
payable and other borrowings” on PICA’s Statutory Statements of Admitted Assets, Liabilities and Capital and
Surplus.
As of June 30, 2017, and December 31, 2016, the outstanding aggregate principal amount of such notes and
commercial paper totaled $4.1 billion and $3.8 billion, respectively. Included in the amounts at June 30, 2017
and December 31, 2016 is the medium-term note liability, which is carried at amortized cost, of $3.2 billion and
$3.2 billion, respectively, and short-term note liability of $0.9 billion and $0.6 billion, respectively.
On September 13, 2016, a Delaware trust issued in a private placement $350 million in aggregate principal
amount of 1.450% Medium-Term Notes due September 13, 2019.
On June 27, 2016, a Delaware trust issued in a private placement $100 million in aggregate principal amount
of Floating Rate Medium-Term Notes due June 27, 2018.
On June 3, 2016, a Delaware trust issued in a private placement $500 million in aggregate principal amount
of 2.200% Medium-Term Notes due June 3, 2021.
PICA’s ability to issue new notes under this program will depend on market conditions. PICA intends to
repay the maturing notes and commercial paper through a combination of cash flows from asset maturities, asset
sales, and internal sources of funds such as PF.
PICA is a member of the FHLBNY. Membership allows PICA access to the FHLBNY’s financial services,
including the ability to obtain collateralized advances and to issue collateralized funding agreements. FHLBNY
borrowings and funding agreements are collateralized by qualifying mortgage-related assets or U.S. Treasury
securities, the fair value of which must be maintained at certain specified levels relative to outstanding borrowings.
FHLBNY membership requires PICA to own member stock and borrowings require the purchase of activity-based
stock in an amount equal to 4.5% of outstanding borrowings. Under FHLBNY guidelines, if PICA’s financial
strength ratings decline below A/A2/A Stable by S&P/Moody’s/Fitch, respectively, and the FHLBNY does not
receive written assurances from the NJDOBI regarding PICA’s solvency, new borrowings from the FHLBNY

22
would be limited to a term of 90 days or less. Currently there are no restrictions on the term of borrowings from
the FHLBNY. All FHLBNY stock purchased by PICA is classified as restricted general account investments
within “Other invested assets” and the carrying value of these investments was $80 million and $78 million as of
June 30, 2017 and December 31, 2016, respectively.
NJDOBI permits PICA to pledge collateral to the FHLBNY in an amount of up to 5% of its prior year-end
statutory net admitted assets, excluding separate account assets. Based on PICA’s statutory net admitted assets as
of December 31, 2016, the 5% limitation equates to a maximum amount of pledged assets of $6.2 billion and an
estimated maximum borrowing capacity (after taking into account required collateralization levels) of
approximately $5.3 billion of which $1 billion was outstanding. Nevertheless, FHLBNY borrowings are subject
to the FHLBNY’s discretion and to the availability of qualifying assets at PICA.
As of June 30, 2017, PICA had pledged assets with a fair value of $1.3 billion supporting outstanding funding
agreements totaling $1.0 billion, which are included in “Policyholders’ account balances.” The fair value of
qualifying assets that were available to PICA, but not pledged, amounted to $6.0 billion as of June 30, 2017. PICA
had no other advances outstanding under the FHLBNY facility as of June 30, 2017.
PRIAC is a member of the FHLBB. Membership allows PRIAC access to collateralized advances. PRIAC’s
membership in FHLBB requires the ownership of member stock and borrowings from FHLBB require the
purchase of FHLBB activity-based stock in an amount between 3.0% and 4.5% of outstanding borrowings,
depending on the maturity date of the obligation. As of June 30, 2017, PRIAC had no advances outstanding under
the FHLBB facility. All FHLBB stock purchased by PRIAC is classified as restricted general account investments
within " Other invested assets" and the carrying value of these investments was $9 million and $10 million as of
June 30, 2017 and December 31, 2016, respectively.
Under Connecticut state insurance law, without the prior consent of the Connecticut Insurance Department,
the amount of assets insurers may pledge to secure debt obligations is limited to the lesser of 5% of prior-year
statutory admitted assets or 25% of prior-year statutory surplus, resulting in a maximum borrowing capacity for
PRIAC under the FHLBB facility of approximately $0.2 billion as of June 30, 2017.
Non-Insurance Contractual Obligations
The following table presents PICA's contractual cash flow commitments on notes payable and other
borrowings and surplus notes, excluding interest payable, as of June 30, 2017. This table does not reflect PICA's
obligations under its insurance, annuity and guaranteed products contracts.
Payment Due by Period
Total
Less than 1
Year
1-3 Years
4-5 Years
After 5
Years
($ in millions)
Notes payable and other borrowings (1) ...... $ 250 $ 69 $ — $ — $ 181
Surplus notes (2) .......................................... 850 — 500 — 350
Total ............................................................. $ 1,100 $ 69 $ 500 $ — $ 531
(1) The amounts for notes payable and other borrowings represent scheduled principal repayments on debt. The amount reported on
the balance sheet of the statutory financial statements represents the carrying value. The balance sheet amount was $251 million
and $182 million as of June 30, 2017 and December 31, 2016, respectively. PICA had accrued interest of $1 million outstanding
as of June 30, 2017.
23
(2) The amounts for surplus notes represent the aggregate principal amounts. The amount reported in the capital and surplus section
of the statutory financial statements represents the current statement value.
In addition to the amounts shown above, PICA is a party to operating leases for which its future minimum
lease payments under non-cancelable leases were $360 million and $341 million as of June 30, 2017 and
December 31, 2016, respectively.
During the normal course of its business, PICA utilizes financial instruments with off-balance sheet credit
risk such as commitments and financial guarantees. Commitments primarily include commitments to fund
investments in private placement securities, limited partnerships and other investments, as well as commitments
to originate mortgage loans. As of June 30, 2017 and December 31, 2016, these commitments were $4,544 million
and $4,636 million, respectively.
Certain contracts underwritten by the Retirement business include guarantees related to financial assets owned
by the guaranteed party. These contracts are accounted for as derivatives, at fair value. As of June 30, 2017, these
contracts in force carried a total guaranteed value of $77 billion. These guarantees are supported by collateral that
is not reflected on PICA’s balance sheet. This collateral had a fair value of $78 billion as of June 30, 2017.
Contingencies
PICA has entered into reinsurance agreements with PLICJ, PGFL, PLICK, and other foreign entities, all of
which are affiliates of PICA. In each case, PICA has agreed to reinsure certain individual life insurance policies
through excess risk term contracts. Furthermore, PICA has agreed to co-insure U.S. dollar-denominated policies
sold by PLICJ and PGFL. For these reinsurance policies assumed, PICA has retroceded a portion of these risks
to affiliated companies.
PICA has committed to repurchase securities under master repurchase agreements in the amount of $4,764
million and holds cash collateral for loaned securities of $1,650 million as of June 30, 2017. PICA conducts asset-
based or secured financing, including transactions such as securities lending, repurchase agreements and mortgage
dollar rolls, to earn spread income, to borrow funds, or to facilitate trading activity. These programs are primarily
driven by portfolio holdings of securities that are lendable based on counterparty demand for these securities in
the marketplace. The collateral received in connection with these programs is primarily used to purchase securities
in PICA’s short-term spread portfolios. Investments held in the short-term spread portfolio include cash and cash
equivalents, short-term investments, mortgage loans and fixed maturities, including mortgage- and asset-backed
securities, with a weighted average life at time of purchase by the short-term portfolios of four years or less.
Floating rate assets comprise the majority of our short-term spread portfolio. These short-term portfolios are
subject to specific investment policy statements, which among other things, do not allow for significant
asset/liability interest rate duration mismatch.
Capital
The Risk Based Capital, or RBC, ratio is the primary measure by which PICA evaluates its capital adequacy.
PICA’s RBC ratio is managed to a level consistent with a “AA” ratings objective; however, ratings agencies take
into account a variety of factors in assigning ratings to PICA. RBC is determined by statutory formulas that
consider risks related to the type and quality of the invested assets, insurance-related risks associated with an
insurer’s products, interest rate risks and general business risks. The RBC ratio calculations are intended to assist
insurance regulators in measuring the adequacy of an insurer’s statutory capitalization. PICA reported an RBC
ratio of 457% as of December 31, 2016, which exceeds the minimum levels required by applicable insurance
regulations. The level of statutory capital of PICA can be materially impacted by interest rate and equity market
fluctuations, changes in the values of derivatives, the level of impairments recorded, and credit quality migration
of the investment portfolio, among other items. Further, a recapture of business subject to reinsurance

24
arrangements due to defaults by, or credit quality migration affecting, the reinsurers could result in higher required
statutory capital levels. The level of statutory capital of PICA is also affected by statutory accounting rules, which
are subject to change by insurance regulators. The inclusion of RBC measures is intended solely for the
information of investors and is not intended for the purpose of ranking any insurance company or for use in
connection with any marketing, advertising or promotional activities.
PICA employs a “Capital Protection Framework” to ensure that sufficient capital resources are available to
maintain adequate capitalization and competitive RBC ratio and solvency margins under various stress scenarios.
The Capital Protection Framework incorporates the potential impacts from market related stresses, including
equity markets, real estate, interest rates, credit losses, and foreign currency exchange rates. In evaluating these
potential impacts, the Company assesses risk holistically at the enterprise level, recognizing that its business mix
may produce results that partially offset on a net basis. The Capital Protection Framework accommodates periodic
volatility within ranges that we deem acceptable, while also providing for potential sources of capital, including
on-balance sheet capital, derivatives, reinsurance and contingent sources of capital. We believe we currently have
access to sufficient resources to maintain adequate capitalization and competitive RBC ratios and solvency
margins under a range of potential stress scenarios.
Ratings Developments
Ratings
Financial strength ratings (which are sometimes referred to as “claims-paying” ratings) and credit ratings are
important factors affecting public confidence in an insurer and its competitive position in marketing products.
PICA’s credit ratings are also important for its ability to raise capital through the issuance of debt and for the cost
of such financing. Nationally Recognized Statistical Ratings Organizations continually review the financial
performance and financial condition of the entities they rate, including PICA and its rated affiliates.
A downgrade in the credit or financial strength ratings of PICA or its rated affiliates could potentially, among
other things, limit PICA’s ability to market products, reduce its competitiveness, increase the number or value of
policy surrenders and withdrawals, increase borrowing costs and potentially make it more difficult to borrow
funds, adversely affect the availability of financial guarantees, such as letters of credit, cause additional collateral
requirements or other required payments under certain agreements, allow counterparties to terminate derivative
agreements and/or hurt PICA’s relationships with creditors, distributors or trading counterparties, thereby
potentially negatively affecting its profitability, liquidity and/or capital. In addition, PICA considers its own risk
of non-performance in determining the fair value of its liabilities. Therefore, changes in its credit or financial
strength ratings may affect the fair value of its liabilities.
Financial strength ratings represent the opinions of rating agencies regarding the financial ability of an
insurance company to meet its obligations under an insurance policy. Credit ratings represent the opinions of
rating agencies regarding an entity’s ability to repay its indebtedness. The following table summarizes the
financial strength ratings for PICA as of June 30, 2017.
S&P(1) Moody's(2)
A.M.
Best(3) Fitch(4)
Financial Strength Ratings: AA- A1 A+ AA-
(1) S&P financial strength ratings for insurance companies range from “AAA (extremely strong)” to “D (default).” A rating of
AA- is the fourth highest of twenty-three rating categories.
(2) Moody's insurance financial strength ratings range from “Aaa (exceptional)” to “C (lowest).” A rating of A1 is the fifth
highest of twenty-one rating categories. Numeric modifiers are used to refer to the ranking within the group—with 1 being
the highest and 3 being the lowest. These modifiers are used to indicate relative strength within a category.

25
(3) A.M. Best financial strength ratings for insurance companies currently range from “A++ (superior)” to “S (suspended).” A
rating of A+ is the second highest of sixteen rating categories.
(4) Fitch financial strength ratings range from “AAA (exceptionally strong)” to “C (distressed).” A rating of AA- is the fourth
highest of nineteen rating categories.
The ratings set forth above reflect current opinions of each rating agency. Each rating should be evaluated
independently of any other rating. These ratings are reviewed periodically and may be changed at any time by
the rating agencies. As a result, there is no assurance that PICA will maintain its current ratings in the future.
Rating agencies use an “outlook” statement for both industry sectors and individual companies. For an
industry sector, a Stable outlook generally implies that over the next 12-18 months, the rating agency expects
ratings to remain unchanged among companies in the sector. This year, Moody’s and A.M. Best changed the
Rating Outlook on the U.S. life insurance industry to Negative from Stable. Fitch and S&P continued to keep the
life insurance industry on Stable outlook; however, Fitch revised its Sector Outlook for U.S. life insurers to
Negative. For a particular company, an outlook generally indicates a medium- or long-term trend (generally six
months to two years) in credit fundamentals, which if continued, may lead to a rating change. These indicators
are not necessarily a precursor of a rating change nor do they preclude a rating agency from changing a rating at
any time without notice. Currently, Fitch has all of the Company’s ratings on Positive outlook; A.M. Best,
Moody’s and S&P have all of PICA’s ratings on Stable outlook.
In May 2017, Fitch affirmed the Company’s ratings and revised the company outlook for Prudential Insurance
and certain other affiliated insurance companies from Negative to Stable. A rating agency company outlook
generally indicates a medium-or long-term trend (generally six months to two years) in credit fundamentals, which
if continued, may lead to a rating change. These indicators are not necessarily a precursor of a rating change nor
do they preclude a rating agency from changing a rating at any time without notice.
On November 15, 2016, Moody’s revised its Rating Outlook on the U.S. life insurance industry to Negative.
Moody’s outlook indicates their expectations for the fundamental credit conditions driving the U.S. life insurance
industry over the next 12-18 months. The change in the outlook is a result of increased pressure on life insurers’
sales, revenues and profitability due to persistent low interest rates and weak economic growth, together with
regulatory pressures on product distribution. The change in outlook back to Stable from Negative can occur with
a gradual, steady increase in long-term interest rates in 2017, underpinned by strong equity market levels and an
improvement in economic growth.
On December 7, 2016, A.M. Best revised its Rating Outlook on the U.S. life insurance industry to Negative.
The revision of the Rating Outlook to Negative reflects A.M. Best’s view that the industry is entering into a period
of increased volatility across both economic and regulatory fronts. A.M. Best’s outlook indicates that there is
uncertainty around the slow premium growth for life and other products, disruption from merger and acquisition
activity, and the industry’s historic slow incremental approach in the face of a rapidly changing landscape.
Requirements to post collateral or make other payments, as a result of ratings downgrades, under certain
agreements, including derivative agreements, can be satisfied in cash or by posting permissible securities held by
PICA and/or its affiliate subject to the agreements. In addition, a ratings downgrade by A.M. Best to "A-" for
PICA would require PICA to either post collateral or a letter of credit in the amount of approximately $1.5 billion,
based on the level of statutory reserves related to the variable annuity business acquired from Allstate Financial.
Management believes that the posting of such collateral would not be a material liquidity event for PICA.
In view of the difficulties experienced in recent years by many financial institutions, the rating agencies have
heightened the level of scrutiny that they apply to such institutions, have increased the frequency and scope of
their credit reviews, have requested additional information from the companies that they rate, and may adjust
upward the capital and other requirements employed in the rating agency models for maintenance of certain ratings
levels, such as the financial strength ratings currently held by PICA. In addition, actions PICA might take to access

26
third party financing or to realign its capital structure may in turn cause rating agencies to reevaluate PICA’s
ratings.
Litigation and Regulatory Matters
PICA is subject to legal and regulatory actions in the ordinary course of its businesses. Pending legal and
regulatory actions include proceedings relating to aspects of PICA’s businesses and operations that are specific to
it and proceedings that are typical of the businesses in which it operates, including in both cases businesses that
have been either divested or placed in wind-down status. Some of these proceedings have been brought on behalf
of various alleged classes of complainants. In certain of these matters, the plaintiffs are seeking large and/or
indeterminate amounts, including punitive or exemplary damages. The outcome of litigation or a regulatory
matter, and the amount or range of potential loss at any particular time, is often inherently uncertain. PICA
establishes accruals for litigation and regulatory matters when it is probable that a loss has been incurred and the
amount of that loss can be reasonably estimated. For litigation and regulatory matters where a loss may be
reasonably possible, but not probable, or is probable but not reasonably estimable, no accrual is established but
the matter, if material, is disclosed. PICA estimates that as of June 30, 2017, the aggregate range of reasonably
possible losses in excess of accruals established for those litigation and regulatory matters for which such an
estimate currently can be made is less than $250 million. Any estimate is not an indication of expected loss, if
any, or PICA’s maximum possible loss exposure on such matters. PICA reviews relevant information with respect
to its litigation and regulatory matters on a quarterly and annual basis and updates its accruals, disclosures and
estimates of reasonably possible loss based on such reviews.
The following discussion of litigation and regulatory matters provides an update of those matters discussed in
PICA’s Offering Circular dated May 10, 2017 and should be read in conjunction with the complete descriptions
provided in the Offering Circular.
Rosen, et al. v. PRIAC, et al.
In March 2017, Plaintiff filed a voluntary notice of dismissal with prejudice as to Ferguson Enterprises, Inc.
and Capital Partners, LLC d/b/a Captrust Financial Advisors.
Bouder v. PFI
In August 2017, the Court issued an order granting preliminary approval of the parties’ class action
settlement.
Residential Mortgage-Backed Securities (“RMBS”) Trustee Litigation
PICA et al. v. Citibank N.A.
In April 2017, Citibank filed a motion for summary judgment in the federal court action. In June 2017, the
state court issued a decision regarding Defendants’ motion to dismiss the amended complaint: (i) sustaining
Plaintiffs’ breach of contract claims concerning Citibank’s pre-Event of Default obligations; (ii) dismissing
Plaintiffs’ breach of contract claims concerning Citibank’s post-Event of Default obligations; (iii) sustaining
Plaintiffs’ implied covenant of good faith and fair dealing claim; (iv) dismissing Plaintiffs’ claim for breach of
fiduciary duty; and (v) dismissing Plaintiffs’ claim for breach of duty to avoid conflicts of interest. In July 2017,
Citibank filed an appeal to the Appellate Division of the Supreme Court of New York, First Department, from the
June 2017 decision denying, in part, its motion to dismiss.

27
PICA et al. v. Deutsche Bank, et al.
In February 2017, the Court issued a decision regarding Defendants’ motion to dismiss the amended
complaint: (i) sustaining Plaintiffs’ breach of contract claims concerning the failure to remedy known servicing
violations as to all sixty two trusts at issue; (ii) sustaining Plaintiffs’ breach of contract claims concerning the
failure to enforce seller representation and warranty claims as to forty one trusts, and dismissing such claims as to
the remaining twenty one trusts; (iii) dismissing Plaintiffs’ claim for breach of fiduciary duty; and (iv) dismissing
Plaintiffs’ claim for breach of duty to avoid conflicts of interest.
PICA et al. v. HSBC, et al.
In January 2017, Plaintiffs filed a motion seeking class certification and appointing class representatives and
class counsel.
PICA et al. v. Wells Fargo Bank, et al.
In March 2017, the federal court issued an order concerning Defendant’s motion to dismiss as to the Indenture
trusts: (i) sustaining plaintiffs’ breach of contract claims; plaintiffs’ claims for violations of the Trust Indenture
Act of 1939; and plaintiffs’ claims for breach of the duty to avoid conflicts of interest; and (ii) dismissing plaintiffs’
claims for breach of fiduciary duty as duplicative of the sustained contract claims. In May 2017, Wells Fargo filed
a third-party complaint for contribution against PGIM, Inc., alleging that, in the event the Prudential Plaintiff
Funds prevail on their claims for damages against Wells Fargo, PGIM must contribute to the award due to PGIM’s
alleged breach of duties owed to the Funds in managing the Funds’ RMBS investments. In June 2017, Wells Fargo
filed a motion to dismiss the complaint in New York state court.
On an ongoing basis, PICA’s internal supervisory and control functions review the quality of sales, marketing
and other customer interface procedures and practices and may recommend modifications or enhancement. From
time to time, this review process results in the discovery of product administration, servicing or other errors,
including errors relating to the timing or amount of payments or contract values due to customers or other parties.
In certain cases, if appropriate, PICA may offer customers remediation and may incur charges, including the cost
of such remediation, administrative costs and regulatory fines.
Summary
PICA’s litigation and regulatory matters are subject to many uncertainties, and given their complexity and
scope, their outcome cannot be predicted. It is possible that PICA’s results of operations or cash flow in a
particular quarterly or annual period could be materially affected by an ultimate unfavorable resolution of pending
litigation and regulatory matters depending, in part, upon the results of operations or cash flow for such period. In
light of the unpredictability of PICA’s litigation and regulatory matters, it is also possible that in certain cases an
ultimate unfavorable resolution of one or more pending litigation or regulatory matters could have a material
adverse effect on PICA’s financial position. Management believes, however, that, based on information currently
known to it, the ultimate outcome of all pending litigation and regulatory matters, after consideration of applicable
reserves and rights to indemnification is not likely to have a material adverse effect on PICA’s financial position.
Regulatory Developments
Fiduciary Rules
The U.S. Department of Labor’s (“DOL”) new fiduciary rules became applicable, in part, on June 9, 2017,
with certain additional provisions scheduled to become applicable on January 1, 2018. In connection with the
ongoing examination of the rules as directed by President Trump in February 2017, the DOL has issued a request
for information seeking public comment on the rules and a possible delay of the January 1, 2018 applicability
28
date. The Secretary of Labor has also stated that he will seek to engage with the U.S. Securities and Exchange
Commission (the “SEC”) on the rules and, in June 2017, the Chairman of the SEC issued a public statement
soliciting comments on the standard of conduct for investment advisers and broker-dealers when they provide
advice to retail investors. In addition, the National Association of Insurance Commissioners (“NAIC”) has formed
an Annuity Suitability Working Group which is considering the development of enhanced standards for the sale
of annuities. PICA cannot predict what impact these developments will have on the rules or the standard of
conduct applicable to some of its businesses.
Regulation as a Designated Financial Company
Presidential Memorandum Regarding the Financial Stability Oversight Council—In April 2017, President
Trump issued a memorandum directing the Secretary of the Treasury, among other things, to conduct a review of
the Financial Stability Oversight Council's (the “Council”) process for designating non-bank financial companies
(“Designated Financial Companies”) for supervision by the Board of Governors of the Federal Reserve
System (the “FRB”) and to report conclusions to the President within 180 days regarding issues raised in the
memorandum, and recommendations for process improvements, including necessary legislative changes. PICA
cannot predict what impact the review will ultimately have on the designation process or PICA.
The Financial CHOICE Act—In June 2017, the U.S. House of Representatives passed the Financial CHOICE
Act, which would amend certain provisions of the Dodd-Frank Wall Street Reform and Consumer Protection Act
(“Dodd-Frank”), including the authority of the Council to designate non-bank financial companies for FRB
supervision. PICA cannot predict whether this or other legislation impacting Dodd-Frank will ultimately be passed
into law, or how such legislation will impact PICA.
Resolution Planning—In July 2017, the FRB and the Federal Deposit Insurance Corporation announced that
for Designated Financial Companies the next resolution plan filing deadline will be delayed from December 31,
2017 to December 31, 2018.
For additional information on the potential impacts of regulation on PICA, see “Business-Regulation” and
“Risk Factors” in the Offering Circular dated May 10, 2017, relating to the $15,000,000,000 Global Medium
Term Note Program of PRICOA Global Funding I.
29
ANNEX A
Definitions
Asset Liability Management – A unit within PFI that develops and implements investment policies, long-term
investment plans and tactical investment strategies for PICA's general account asset portfolios. The unit is
responsible for asset allocation, asset liability matching and designing investment policies and strategies that are
consistent with products sold and developed by PICA's Retirement, Annuity, Individual Insurance and Group
Insurance profit centers.
AVR – Asset Valuation Reserve, established under SAP as a liability to offset potential non-interest related
investment losses. Changes in AVR are charged or credited directly to surplus; no such reserve is required under
GAAP.
Closed Block – PICA’s liabilities for certain participating individual life insurance policies and annuities issued
in the United States were segregated, together with assets which will be used exclusively for the payment of
benefits, policyholder dividends and taxes with respect to these products, in a regulatory mechanism referred to
as the “Closed Block.”
CIO – Chief Investment Officer
COLICO – COLICO Inc., an affiliate of PICA.
CRVM – Commissioner's Reserve Valuation Method
CARVM – Commissioner's Annuity Reserve Valuation Method
Commissioner – State Insurance Department Commissioners and/or the Commissioner of the New Jersey
Department of Banking and Insurance.
FHLBB – Federal Home Loan Bank of Boston
FHLBNY – Federal Home Loan Bank of New York
Fitch – Fitch Ratings, Ltd.
GAAP – Generally Accepted Accounting Principles, in the United States of America.
GICs – Guaranteed Investment Contracts
IMR – Interest Maintenance Reserve, established under SAP, to capture realized investment gains and losses, net
of tax, on the sale of bonds resulting from changes in the general level of interest rates, and is amortized into
income over the remaining years to expected maturity of the assets sold; no such reserve is required under GAAP.
Moody’s – Moody’s Investors Service, Inc.
NAIC – National Association of Insurance Commissioners
NJDOBI – New Jersey Department of Banking and Insurance
PFI – Prudential Financial, Inc., a New Jersey corporation and the ultimate parent company of PICA and all of
their respective subsidiaries or affiliates.

30
PF – Prudential Funding, LLC, a New Jersey limited liability company and a wholly owned financing subsidiary
of PICA.
PGFL – Prudential Gibraltar Financial Limited
PICA – The Prudential Insurance Company of America, a New Jersey stock life insurance company.
PLI – Pruco Life Insurance Company, a wholly owned subsidiary of PICA.
PLIC – Prudential Legacy Insurance Company of New Jersey
PLICJ – The Prudential Life Insurance Company Ltd., an affiliate of PICA. (Located in Japan)
PLICK – The Prudential Life Insurance Company of Korea, Ltd., an affiliate of PICA.
PLNJ – Pruco Life Insurance Company of New Jersey, a wholly owned subsidiary of PLI.
PRIAC – The Prudential Retirement Insurance and Annuity Company, a wholly owned subsidiary of PICA.
SAP – Statutory Accounting Principles
SVO – The Securities Valuation Office, a division of the NAIC.
S&P – S&P Global Ratings
SSAP – Statements of Statutory Accounting Principles
TOLI – Trust owned life insurance

THE PRUDENTIAL INSURANCE COMPANY OF AMERICA
UNAUDITED STATUTORY STATEMENTS OF ADMITTED ASSETS, LIABILITIES AND CAPITAL AND SURPLUS
31
June 30,
2017 December 31,
2016
(in millions)
ASSETS
Bonds ...................................................................................................................................... $ 77,061 $ 76,339
Preferred stocks ....................................................................................................................... 57 58
Common stocks ....................................................................................................................... 6,749 6,262
Mortgage loans on real estate .................................................................................................. 18,676 18,122
Real estate ............................................................................................................................... 566 552
Contract loans ......................................................................................................................... 2,848 2,969
Cash and short-term investments ............................................................................................ 3,623 4,276
Derivatives .............................................................................................................................. 2,964 3,226
Other invested assets ............................................................................................................... 5,084 4,979
Total cash and invested assets .............................................................................................. 117,628 116,783
Premiums due and deferred ..................................................................................................... 2,682 2,705
Accrued investment income .................................................................................................... 841 859
Current federal income tax recoverable .................................................................................. - 52
Net deferred tax asset .............................................................................................................. 2,397 2,462
Other assets ............................................................................................................................. 1,620 1,130
Separate account assets ........................................................................................................... 136,281 136,303
TOTAL ASSETS ................................................................................................................... $ 261,449 $ 260,294
LIABILITIES AND SURPLUS
Liabilities
Policy liabilities and insurance reserves:
Future policy benefits and claims .......................................................................................... $ 82,892 $ 81,973
Advanced premiums .............................................................................................................. 49 45
Policy dividends..................................................................................................................... 1,944 2,023
Policyholders' account balances ............................................................................................. 12,160 11,605
Notes payable and other borrowings ....................................................................................... 251 182
Asset valuation reserve ........................................................................................................... 2,321 2,271
Federal income tax payable ..................................................................................................... 130 -
Interest maintenance reserve ................................................................................................... 127 99
Transfers from separate accounts due or accrued .................................................................... (475 ) (469 )
Securities sold under agreement to repurchase ....................................................................... 4,764 4,829
Cash collateral held for loaned securities ................................................................................ 1,650 1,280
Derivatives .............................................................................................................................. 761 715
Other liabilities ........................................................................................................................ 7,509 8,603
Separate account liabilities ...................................................................................................... 135,939 135,964
Total liabilities ....................................................................................................................... 250,022 249,120
Capital and Surplus
Common capital stock and gross paid in and contributed surplus........................................... 58 44
Surplus notes ........................................................................................................................... 844 844
Special surplus fund ................................................................................................................ 223 226
Unassigned Surplus ................................................................................................................. 10,302 10,060
Total capital and surplus ...................................................................................................... 11,427 11,174
TOTAL LIABILITIES, CAPITAL AND SURPLUS ......................................................... $ 261,449 $ 260,294
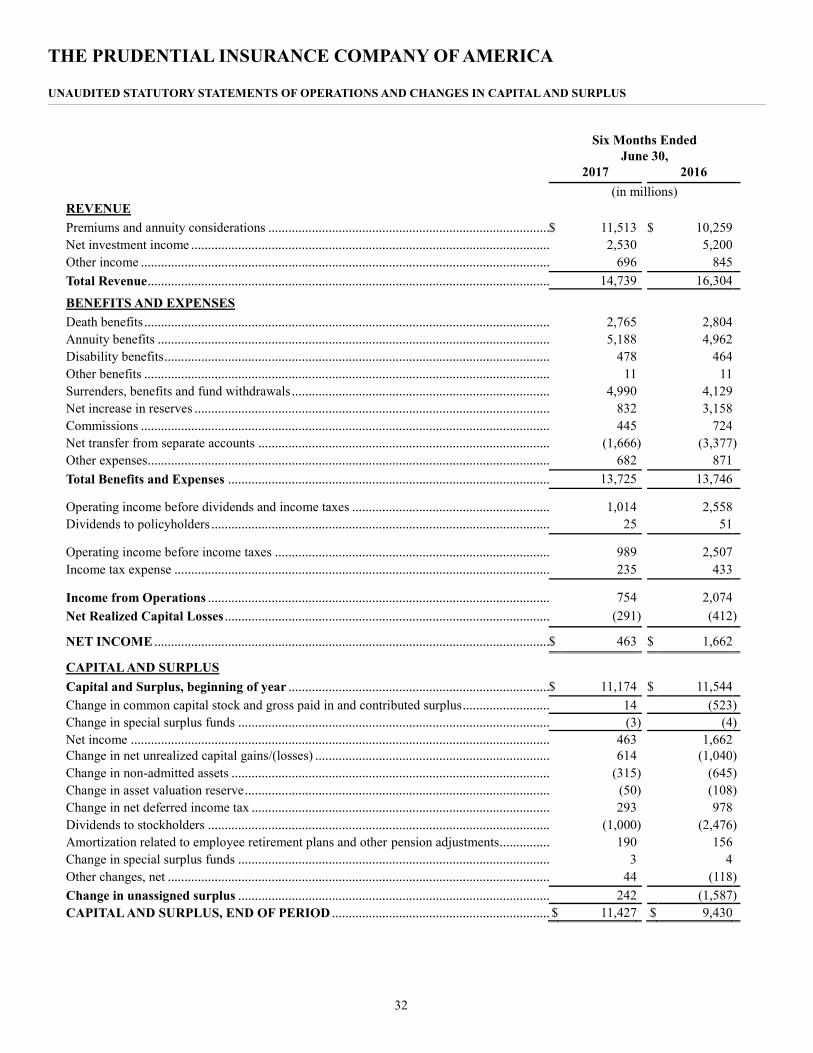
THE PRUDENTIAL INSURANCE COMPANY OF AMERICA
UNAUDITED STATUTORY STATEMENTS OF OPERATIONS AND CHANGES IN CAPITAL AND SURPLUS
32
Six Months Ended
June 30,
2017 2016
(in millions)
REVENUE
Premiums and annuity considerations .................................................................................... $ 11,513 $ 10,259
Net investment income ........................................................................................................... 2,530 5,200
Other income .......................................................................................................................... 696 845
Total Revenue ........................................................................................................................ 14,739 16,304
BENEFITS AND EXPENSES
Death benefits ......................................................................................................................... 2,765 2,804
Annuity benefits ..................................................................................................................... 5,188 4,962
Disability benefits ................................................................................................................... 478 464
Other benefits ......................................................................................................................... 11 11
Surrenders, benefits and fund withdrawals ............................................................................. 4,990 4,129
Net increase in reserves .......................................................................................................... 832 3,158
Commissions .......................................................................................................................... 445 724
Net transfer from separate accounts ....................................................................................... (1,666 ) (3,377 )
Other expenses........................................................................................................................ 682 871
Total Benefits and Expenses ................................................................................................ 13,725 13,746
Operating income before dividends and income taxes ........................................................... 1,014 2,558
Dividends to policyholders ..................................................................................................... 25 51
Operating income before income taxes .................................................................................. 989 2,507
Income tax expense ................................................................................................................ 235 433
Income from Operations ...................................................................................................... 754 2,074
Net Realized Capital Losses ................................................................................................. (291 ) (412 )
NET INCOME ...................................................................................................................... $ 463 $ 1,662
CAPITAL AND SURPLUS
Capital and Surplus, beginning of year .............................................................................. $ 11,174 $ 11,544
Change in common capital stock and gross paid in and contributed surplus .......................... 14 (523 )
Change in special surplus funds ............................................................................................. (3 ) (4 )
Net income ............................................................................................................................. 463 1,662
Change in net unrealized capital gains/(losses) ...................................................................... 614 (1,040 )
Change in non-admitted assets ............................................................................................... (315 ) (645 )
Change in asset valuation reserve ........................................................................................... (50 ) (108 )
Change in net deferred income tax ......................................................................................... 293 978
Dividends to stockholders ...................................................................................................... (1,000 ) (2,476 )
Amortization related to employee retirement plans and other pension adjustments ............... 190 156
Change in special surplus funds ............................................................................................. 3 4
Other changes, net .................................................................................................................. 44 (118 )
Change in unassigned surplus ............................................................................................. 242 (1,587 )
CAPITAL AND SURPLUS, END OF PERIOD ................................................................. $ 11,427 $ 9,430
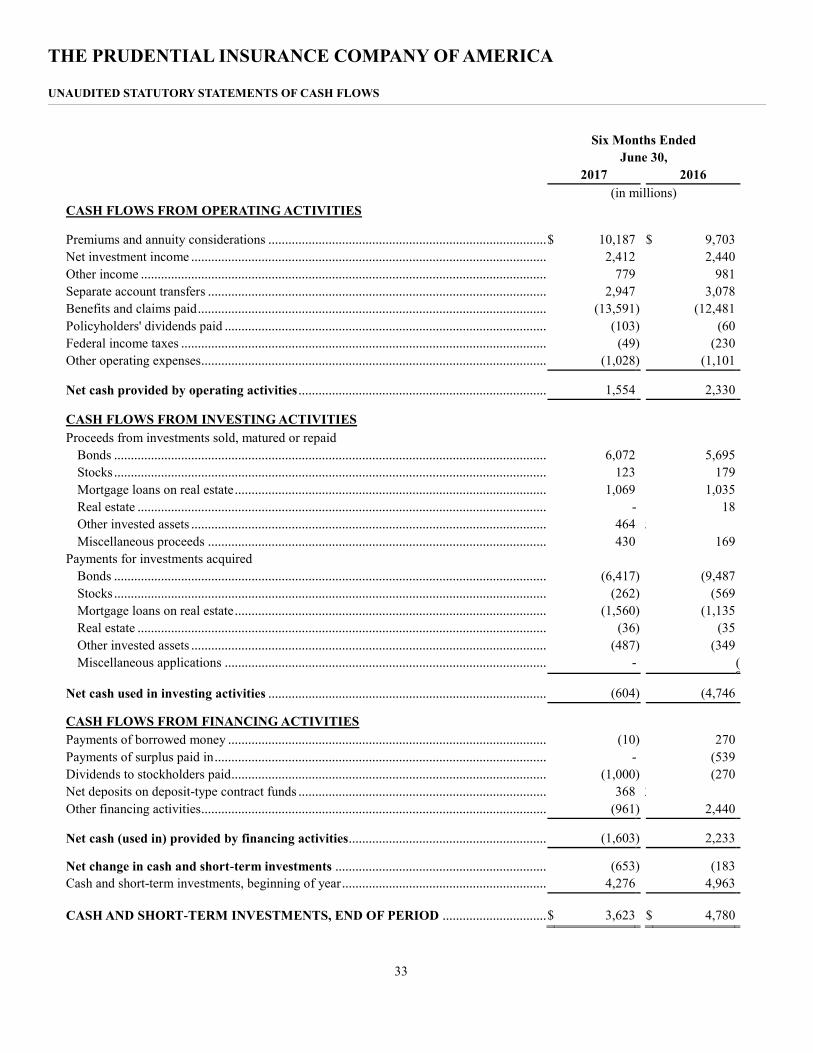
THE PRUDENTIAL INSURANCE COMPANY OF AMERICA
UNAUDITED STATUTORY STATEMENTS OF CASH FLOWS
33
Six Months Ended
June 30,
2017 2016
(in millions)
CASH FLOWS FROM OPERATING ACTIVITIES
Premiums and annuity considerations .................................................................................... $ 10,187 $ 9,703
Net investment income ........................................................................................................... 2,412 2,440
Other income .......................................................................................................................... 779 981
Separate account transfers ...................................................................................................... 2,947 3,078
Benefits and claims paid ......................................................................................................... (13,591 ) (12,481
Policyholders' dividends paid ................................................................................................. (103 ) (60
Federal income taxes .............................................................................................................. (49 ) (230
Other operating expenses........................................................................................................ (1,028 ) (1,101
Net cash provided by operating activities ........................................................................... 1,554 2,330
CASH FLOWS FROM INVESTING ACTIVITIES
Proceeds from investments sold, matured or repaid
Bonds .................................................................................................................................... 6,072 5,695
Stocks .................................................................................................................................... 123 179
Mortgage loans on real estate ................................................................................................ 1,069 1,035
Real estate ............................................................................................................................. - 18
Other invested assets ............................................................................................................. 464 552
Miscellaneous proceeds ........................................................................................................ 430 169
Payments for investments acquired
Bonds .................................................................................................................................... (6,417 ) (9,487
Stocks .................................................................................................................................... (262 ) (569
Mortgage loans on real estate ................................................................................................ (1,560 ) (1,135
Real estate ............................................................................................................................. (36 ) (35
Other invested assets ............................................................................................................. (487 ) (349
Miscellaneous applications ................................................................................................... - (819
Net cash used in investing activities .................................................................................... (604 ) (4,746
CASH FLOWS FROM FINANCING ACTIVITIES
Payments of borrowed money ................................................................................................ (10 ) 270
Payments of surplus paid in .................................................................................................... - (539
Dividends to stockholders paid ............................................................................................... (1,000 ) (270
Net deposits on deposit-type contract funds ........................................................................... 368 332
Other financing activities........................................................................................................ (961 ) 2,440
Net cash (used in) provided by financing activities ............................................................ (1,603 ) 2,233
Net change in cash and short-term investments ................................................................ (653 ) (183
Cash and short-term investments, beginning of year .............................................................. 4,276 4,963
CASH AND SHORT-TERM INVESTMENTS, END OF PERIOD ................................ $ 3,623 $ 4,780

THE PRUDENTIAL INSURANCE COMPANY OF AMERICA
UNAUDITED STATUTORY STATEMENTS OF CASH FLOWS
34
The following non-cash increases/(decreases) were excluded from the Statutory Statement of Cash Flow for the six months ended June 30, 2017 and June 30, 2016 respectively:
6/30/2017 6/30/2016
Statutory Statement Reporting Line (in millions)
Statement of Admitted Assets, Liabilities and Capital and Surplus Bonds (proceeds) (75) -
Statement of Admitted Assets, Liabilities and Capital and Surplus Bonds (cost) - 288
Statement of Admitted Assets, Liabilities and Capital and Surplus Common stocks (proceeds) (45) (25)
Statement of Admitted Assets, Liabilities and Capital and Surplus Common stocks (cost) 5 7
Statement of Admitted Assets, Liabilities and Capital and Surplus Mortgage loans on real estate (cost) - 50
Statement of Admitted Assets, Liabilities and Capital and Surplus Other invested assets (2) (32)
Statement of Admitted Assets, Liabilities and Capital and Surplus Other liabilities 19 (71)
Statement of Admitted Assets, Liabilities and Capital and Surplus Notes payable and other borrowings (69) (116)
Statement of Admitted Assets, Liabilities and Capital and Surplus Federal income tax payable 170 186
Statement of Operations and Changes in Capital and Surplus Premium and annuity considerations (1,287) (327)
Statement of Operations and Changes in Capital and Surplus Net investment income (99) (2,632)
Statement of Operations and Changes in Capital and Surplus Commissions (3) 371
Statement of Operations and Changes in Capital and Surplus Other expenses 54 41
Statement of Operations and Changes in Capital and Surplus Change in capital (14) (16)
Statement of Operations and Changes in Capital and Surplus Dividends to stockholders - 2,205
Statement of Operations and Changes in Capital and Surplus Change in net unrealized capital gains/(losses) 56 71
Statement of Operations and Changes in Capital and Surplus Other changes, net 3 -
Statement of Operations and Changes in Capital and Surplus Net transfers from separate accounts 1,287 -
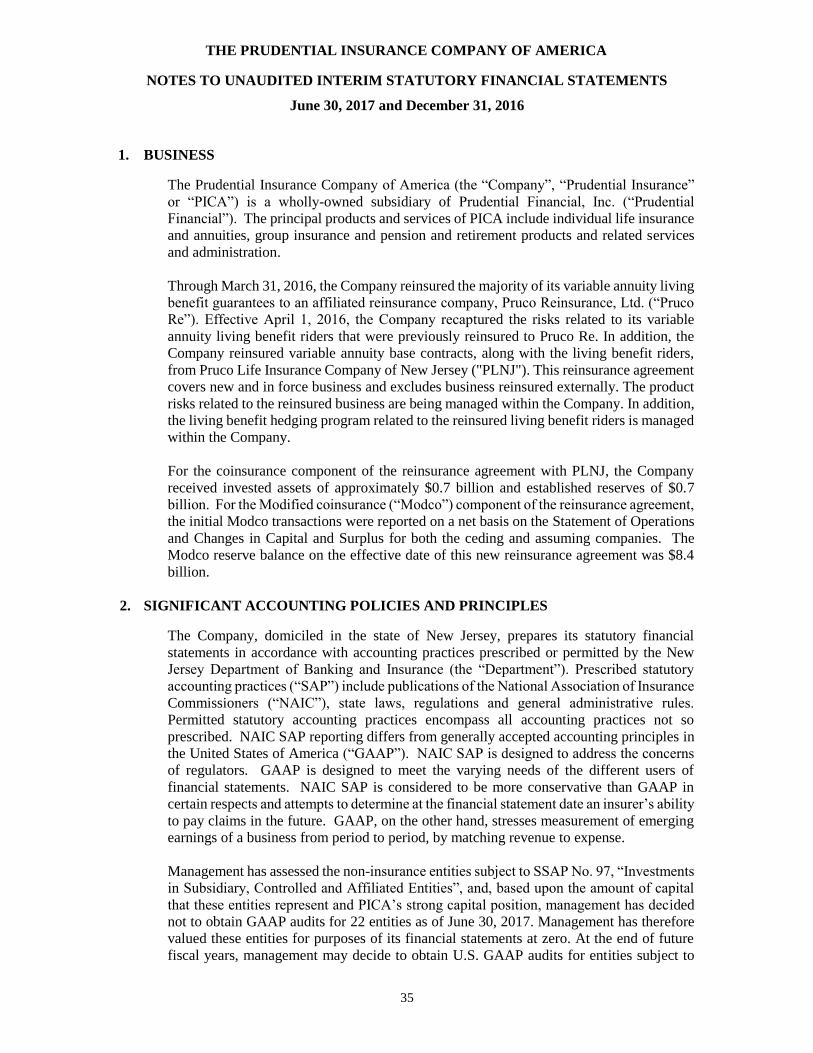
35
THE PRUDENTIAL INSURANCE COMPANY OF AMERICA
NOTES TO UNAUDITED INTERIM STATUTORY FINANCIAL STATEMENTS
June 30, 2017 and December 31, 2016
1. BUSINESS
The Prudential Insurance Company of America (the “Company”, “Prudential Insurance”
or “PICA”) is a wholly-owned subsidiary of Prudential Financial, Inc. (“Prudential
Financial”). The principal products and services of PICA include individual life insurance
and annuities, group insurance and pension and retirement products and related services
and administration.
Through March 31, 2016, the Company reinsured the majority of its variable annuity living
benefit guarantees to an affiliated reinsurance company, Pruco Reinsurance, Ltd. (“Pruco
Re”). Effective April 1, 2016, the Company recaptured the risks related to its variable
annuity living benefit riders that were previously reinsured to Pruco Re. In addition, the
Company reinsured variable annuity base contracts, along with the living benefit riders,
from Pruco Life Insurance Company of New Jersey ("PLNJ"). This reinsurance agreement
covers new and in force business and excludes business reinsured externally. The product
risks related to the reinsured business are being managed within the Company. In addition,
the living benefit hedging program related to the reinsured living benefit riders is managed
within the Company.
For the coinsurance component of the reinsurance agreement with PLNJ, the Company
received invested assets of approximately $0.7 billion and established reserves of $0.7
billion. For the Modified coinsurance (“Modco”) component of the reinsurance agreement,
the initial Modco transactions were reported on a net basis on the Statement of Operations
and Changes in Capital and Surplus for both the ceding and assuming companies. The
Modco reserve balance on the effective date of this new reinsurance agreement was $8.4
billion.
2. SIGNIFICANT ACCOUNTING POLICIES AND PRINCIPLES
The Company, domiciled in the state of New Jersey, prepares its statutory financial
statements in accordance with accounting practices prescribed or permitted by the New
Jersey Department of Banking and Insurance (the “Department”). Prescribed statutory
accounting practices (“SAP”) include publications of the National Association of Insurance
Commissioners (“NAIC”), state laws, regulations and general administrative rules.
Permitted statutory accounting practices encompass all accounting practices not so
prescribed. NAIC SAP reporting differs from generally accepted accounting principles in
the United States of America (“GAAP”). NAIC SAP is designed to address the concerns
of regulators. GAAP is designed to meet the varying needs of the different users of
financial statements. NAIC SAP is considered to be more conservative than GAAP in
certain respects and attempts to determine at the financial statement date an insurer’s ability
to pay claims in the future. GAAP, on the other hand, stresses measurement of emerging
earnings of a business from period to period, by matching revenue to expense.
Management has assessed the non-insurance entities subject to SSAP No. 97, “Investments
in Subsidiary, Controlled and Affiliated Entities”, and, based upon the amount of capital
that these entities represent and PICA’s strong capital position, management has decided
not to obtain GAAP audits for 22 entities as of June 30, 2017. Management has therefore
valued these entities for purposes of its financial statements at zero. At the end of future
fiscal years, management may decide to obtain U.S. GAAP audits for entities subject to

36
SSAP No. 97 and thereby restore their equity value for purposes of inclusion in capital and
surplus.

Annex 3

CAPITALIZATION OF THE ISSUER
This table presents PRICOA Global Funding I’s (the “Issuer”) capitalization as of June 30, 2017 prepared in
conformity with generally accepted accounting principles in the United States of America.
June 30,
2017
(Unaudited)
Debt:
Short-term debt ....................................................................................................................... $ —
Long-term debt:
$500,000,000 1.60% Fixed Rate Notes due 2018............................................................
$500,000,000 2.20% Fixed Rate Notes due 2019............................................................
$500,000,000 1.35% Fixed Rate Notes due 2017............................................................
$350,000,000 1.90% Fixed Rate Notes due 2018............................................................
$400,000,000 2.55% Fixed Rate Notes due 2020............................................................
$500,000,000 2.20% Fixed Rate Notes due 2021............................................................
$100,000,000 Floating Rate Notes due 2018 ...................................................................
$350,000,000 1.450% Fixed Rate Notes due 2019 ..........................................................
500,000,000
500,000,000
500,000,000
350,000,000
400,000,000
500,000,000
100,000,000
350,000,000
Total debt ................................................................................................................. 3,200,000,000
Equity:
Paid in capital ......................................................................................................................... 1,000
Retained earnings ................................................................................................................... —
Accumulated other comprehensive income ............................................................................ ————————
Total equity .............................................................................................................. 1,000
Total capitalization ................................................................................................... $3,200,001,000
On August 18, 2017, the $500,000,000 1.35% Fixed Rate Notes due 2017 matured. On September 21, 2017, the
Issuer issued in a private placement $500,000,000 in aggregate principal amount of 2.450% Fixed Rate Notes due
2022. The Issuer had no capital stock as of October 20, 2017.