primary care medication safety surveillance with ... · original research article primary care...
TRANSCRIPT

ORIGINAL RESEARCH ARTICLE
Primary Care Medication Safety Surveillance with IntegratedPrimary and Secondary Care Electronic Health Records:A Cross-Sectional Study
Artur Akbarov1 • Evangelos Kontopantelis1,2 • Matthew Sperrin1 • Susan J. Stocks3 •
Richard Williams1,3 • Sarah Rodgers4 • Anthony Avery4 • Iain Buchan1,3 •
Darren M. Ashcroft3,5
Published online: 23 June 2015
� The Author(s) 2015. This article is published with open access at Springerlink.com
Abstract
Introduction The extent of preventable medication-re-
lated hospital admissions and medication-related issues in
primary care is significant enough to justify developing
decision support systems for medication safety surveil-
lance. The prerequisite for such systems is defining a rel-
evant set of medication safety-related indicators and
understanding the influence of both patient and general
practice characteristics on medication prescribing and
monitoring.
Objective The aim of the study was to investigate the
feasibility of linked primary and secondary care electronic
health record data for surveillance of medication safety,
examining not only prescribing but also monitoring, and
associations with patient- and general practice-level
characteristics.
Methods A cross-sectional study was conducted using
linked records of patients served by one hospital and over
50 general practices in Salford, UK. Statistical analysis
consisted of mixed-effects logistic models, relating pre-
scribing safety indicators to potential determinants.
Results The overall prevalence (proportion of patients
with at least one medication safety hazard) was 5.45 % for
prescribing indicators and 7.65 % for monitoring indica-
tors. Older patients and those on multiple medications were
at higher risk of prescribing hazards, but at lower risk of
missed monitoring. The odds of missed monitoring among
all patients were 25 % less for males, 50 % less for patients
in practices that provide general practitioner training, and
threefold higher in practices serving the most deprived
compared with the least deprived areas. Practices with
more prescribing hazards did not tend to show more
monitoring issues.
Conclusions Systematic collection, collation, and analy-
sis of linked primary and secondary care records produce
plausible and useful information about medication safety
for a health system. Medication safety surveillance systems
should pay close attention to patient age and polypharmacy
Key Points
Linked primary and secondary health care data are
important for comprehensive medication safety
surveillance.
Medication prescribing and monitoring should be
treated as different statistical processes.
Electronic supplementary material The online version of thisarticle (doi:10.1007/s40264-015-0304-x) contains supplementarymaterial, which is available to authorized users.
& Darren M. Ashcroft
Artur Akbarov
1 Centre for Health Informatics, Institute of Population Health,
University of Manchester, Vaughan House, Portsmouth St,
Manchester M13 9GB, UK
2 NIHR School for Primary Care Research, University of
Manchester, Oxford Road, Manchester M13 9PL, UK
3 NIHR Greater Manchester Primary Care Patient Safety
Translational Research Centre, University of Manchester,
Oxford Road, Manchester M13 9PL, UK
4 Division of Primary Care, School of Medicine, University of
Nottingham, Queen’s Medical Centre, Nottingham
NG7 2UH, UK
5 Centre for Pharmacoepidemiology and Drug Safety,
Manchester Pharmacy School, University of Manchester,
Oxford Road, Manchester M13 9PT, UK
Drug Saf (2015) 38:671–682
DOI 10.1007/s40264-015-0304-x

with respect to both prescribing and monitoring failures;
treat prescribing and monitoring as different statistical
processes, rather than a combined measure of prescribing
safety; and audit the socio-economic equity of missed
monitoring.
1 Introduction
Prescribing and monitoring of drug therapies are important
areas for clinical quality improvement. Among drug-re-
lated hospital admissions, around 59 % are thought to be
preventable; this represents approximately 4 % of all hos-
pital admissions [1, 2]. The majority of these admissions
involved antiplatelet drugs, diuretics, non-steroidal anti-
inflammatory drugs, or anticoagulants [2].
There have been numerous studies from different
countries that addressed the issue of inappropriate pre-
scribing. Different prevalence rates have been reported:
13.9 % [3], 14.6 % [4], 22 % [5], and 31.9 % [6]. Most
studies focused on prescribing indicators and/or elderly
patients; medication monitoring received much less
attention. The reported extent of inappropriate medication
therapies clearly warrants systematic intervention [3, 7,
8]. A pharmacist-led intervention, Pharmacist-led ITbased
iNtervention with simple feedback in reducing rates of
Clinically important ERrors (PINCER) [8], using UK
primary care data showed that prescribing errors could be
reduced through surveillance and pharmacy-led feedback
to general practitioners. Data that might be used to sup-
port safer therapy in real time exist in electronic health
records; however, most health care data is spread across
multiple, unlinked databases. In this study, we used linked
secondary and primary care records, an early instance of
the global trend in electronic health record development,
from the population of Salford, UK. Salford, a city and
one of the ten metropolitan boroughs of Greater Manch-
ester in the North West of England, is a relatively
deprived population of approximately 234,000 [9] (usual
residents) served by a single hospital and over 50 general
practices.
This study aimed to investigate the feasibility of wide-
ranging medication safety surveillance using a linked
database. Future quality improvement interventions based
on such surveillance will require detailed, local under-
standing of factors that drive medication safety. There-
fore, the objectives of this study included assessing the
prevalence of 22 medication safety indicators, investi-
gating associations with patient and practice characteris-
tics, and investigating variation between general
practices.
2 Methods
2.1 Data Source
Over the past 20 years, the National Health Service (NHS)
in Salford, UK, has been working toward integrating hos-
pital- and community-based services, starting with shared
information about patients—initially a series of chronic
disease registers, later merging into the Salford Integrated
Record (SIR). SIR now draws data on a daily basis from
primary care practices and the hospital at the Salford Royal
NHS Foundation Trust. The integrated record is available
to clinicians via the hospital’s electronic patient record
system for individual patients, for example, to check pri-
mary care records of allergy in a patient presenting at the
emergency department. SIR is also available in linked,
anonymised form for research and service development
purposes.
2.2 Indicator Definition
We define an indicator of medication safety as the pro-
portion of patients for whom an appropriate medication
policy has not been followed, or not recorded as such in the
electronic health record, in a given at-risk group/context.
The denominator consists of all patients for whom the
medication policy should be followed; the numerator
consists of the subgroup of patients in the denominator for
whom the medication policy has not been followed. The
appropriateness of such policies were derived from best-
practice guidelines or determined via consensus methods
by a panel of experts [10, 11]. We considered 18 pre-
scribing and four monitoring indicators. These indicators
are described in Table 1 and have been reported by Avery
et al. [10] and Spencer et al. [11]. They were developed
through an extensive literature review and a rigorous
consensus process and were deemed to be most likely
associated with preventable drug-related morbidity when
applied to electronic health records in primary care in the
UK [2, 10, 11]. Some other indicator sets include the Beers
criteria [12], Assessing Care Of Vulnerable Elders
(ACOVE) [13], and Screening Tool of Older Persons’
potentially inappropriate Prescriptions (STOPP) [14, 15] to
name a few. We had to exclude some of the indicators from
the sets reported in [8, 10, 11] from our analysis because
SIR filters mental and sexual health records to preserve
patient privacy.
All indicators were defined with respect to a given audit
date—reference date. For the primary analysis, we chose 1
April 2012 as the reference date because it aligns with the
start of the 2012/2013 NHS financial year. For the analyses
672 A. Akbarov et al.

using alternative reference dates, please see the electronic
supplementary material (online resource 1).
2.3 Covariates
Patient-level covariates considered in this study were age,
gender, patient’s overall Index of Multiple Deprivation
(IMD) [16] for the year 2010, and polypharmacy. The IMD
is a weighted combination of the following seven distinct
deprivation domains (weight): income deprivation
(22.5 %), employment deprivation (22.5 %), health depri-
vation and disability (13.5 %), education skills and training
deprivation (13.5 %), barriers to housing and services
(9.3 %), living environment deprivation (9.3 %), and crime
(9.3 %). It is measured at the level of small areas, lower
layer super output areas (LSOAs), of approximately equal
size—on average 1500 people. Lower values of IMD are
associated with less deprivation. Polypharmacy, the num-
ber of simultaneous repeat prescriptions at the reference
date, was calculated as the number of drugs with at least
two electronic records of prescription on different days
within the last 12 months; different doses and switching
between different brands of the same medication were not
counted.
Practice-level covariates were number of patients per
general practice (list size), clinical software used (Vision
vs. EMIS), whether a practice is involved in providing
general practitioner training or not, average age of the
Table 1 Indicators of unsafe medication practice
ID Potential hazard/at-risk patient group (1 April 2012) Prevalence ICC
Prescribing P1 Prescribed aspirin or clopidogrel/patients not prescribed gastro-protection who have a
history of peptic ulcer
12.31 % (216/1755) 0.004
P2 Prescribed aspirin/patients prescribed warfarin without co-prescription of gastro-protection 4.52 % (77/1705) 0
P3 Prescribed an NSAID/patients prescribed warfarin 5.20 % (159/3060) 0.006
P4 Prescribed an NSAID/patients not prescribed gastro-protection who have a history of
peptic ulcer
5.53 % (97/1755) 0
P5 Prescribed an NSAID/patients aged 65 or older without prescription of gastro-protection 6.20 % (1563/25,228) 0.023
P6 Prescribed an NSAID/patients with diagnosis of CKD (3b, 4, 5) or with latest eGFR\45 3.03 % (108/3570) 0.013
P7 Prescribed an NSAID/patients with diagnosis of CKD (3b, 4, 5) or with latest eGFR\45
who have been prescribed an ACEi
4.01 % (70/1746) 0.021
P8 Prescribed an NSAID/patients with diagnosis of CKD (3b, 4, 5) or with latest eGFR\45
who are prescribed an ACEi and a loop diuretic
3.99 % (27/677) 0
P9 Prescribed metformin/patients with diagnosis of CKD (4, 5) or with latest eGFR\30 3.71 % (46/1241) 0
P10 Prescribed digoxin at a daily dose of[125/patients with a diagnosis of CKD (3b, 4, 5) or
with latest eGFR\45
0.31 % (11/3570) 0
P11 Prescribed an NSAID/patients with heart failure 3.17 % (94/2964) 0.003
P12 Prescribed glitazone/patients with heart failure 1.89 % (56/2964) 0.001
P13 Prescribed b-blockers/patients with unresolved asthma 4.73 % (1258/26,607) 0.002
P14 Not prescribed inhaled corticosteroid/patients with asthma prescribed a long-acting
b-agonist1.65 % (79/4796) 0.007
P15 Prescribed combined hormonal contraceptive/women with history of venous or arterial
thrombosis
0.13 % (14/10,889) 0
P16 Prescribed combined hormonal contraceptive/women with a body mass index of C40 2.78 % (109/3927) 0.012
P17 Prescribed combined hormonal contraceptive/women aged C35 who are current smokers 1.12 % (171/15,286) 0.004
P18 Prescribed oral or transdermal oestrogens/women with a history of breast cancer 1.33 % (23/1724) 0.002
Monitoring M1 Missing renal function and electrolytes in the past 15 months/patients aged C75 on a long-
term ACEi or loop diuretic
5.06 % (411/8123) 0.037
M2 Missing full blood count or liver function test in the past 3 months/patients receiving
repeat methotrexate
6.74 % (31/460) 0.079
M3 Missing International Normalised Ratio test in the past 3 months/patients receiving repeat
warfarin
9.95 % (244/2452) 0.213
M4 Missing thyroid function test in the past 6 months/patients receiving repeat amiodarone 38.01 % (103/271) 0.047
ACEi angiotensin converting enzyme inhibitor, CKD chronic kidney disease, eGFR estimated glomerular filtration rate, ICC intra-class cor-
relation coefficient (proportion of the total variation explained by the variation between practices), NSAID non-steroidal anti-inflammatory drug
(only non-selective considered)
Medication Surveillance Using Primary and Secondary Care Data 673
patient population, and practice level deprivation. The
latter was calculated as the average of individual patient
IMD values.
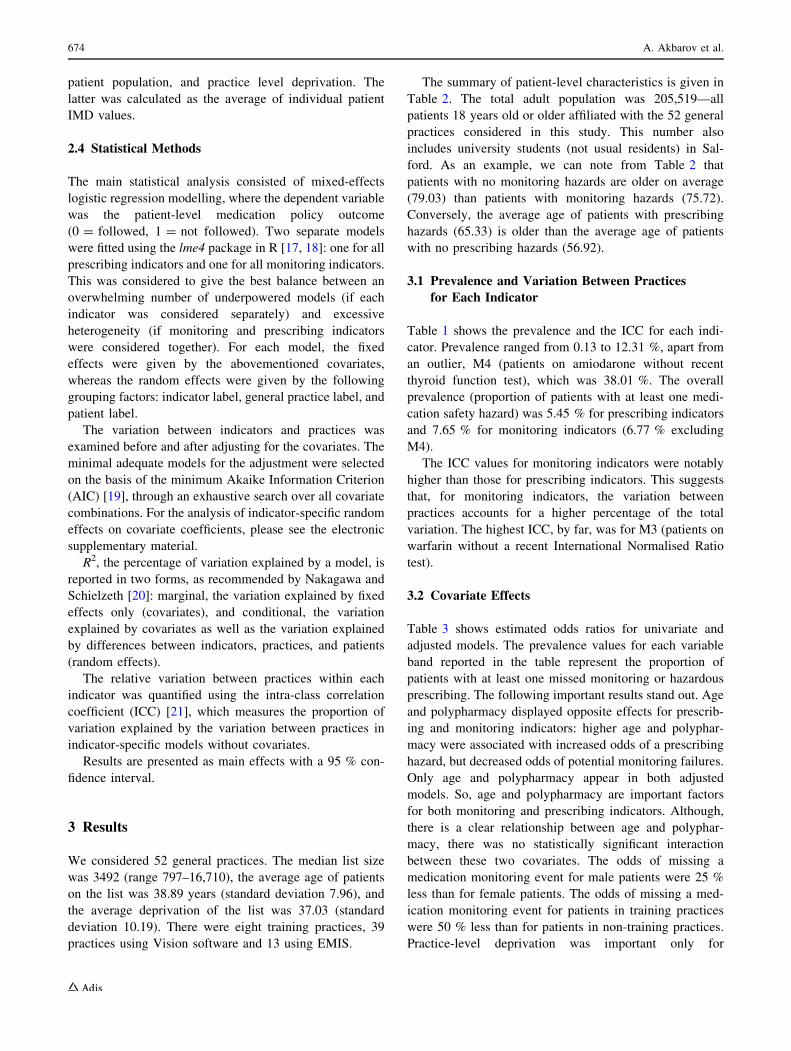
2.4 Statistical Methods
The main statistical analysis consisted of mixed-effects
logistic regression modelling, where the dependent variable
was the patient-level medication policy outcome
(0 = followed, 1 = not followed). Two separate models
were fitted using the lme4 package in R [17, 18]: one for all
prescribing indicators and one for all monitoring indicators.
This was considered to give the best balance between an
overwhelming number of underpowered models (if each
indicator was considered separately) and excessive
heterogeneity (if monitoring and prescribing indicators
were considered together). For each model, the fixed
effects were given by the abovementioned covariates,
whereas the random effects were given by the following
grouping factors: indicator label, general practice label, and
patient label.
The variation between indicators and practices was
examined before and after adjusting for the covariates. The
minimal adequate models for the adjustment were selected
on the basis of the minimum Akaike Information Criterion
(AIC) [19], through an exhaustive search over all covariate
combinations. For the analysis of indicator-specific random
effects on covariate coefficients, please see the electronic
supplementary material.
R2, the percentage of variation explained by a model, is
reported in two forms, as recommended by Nakagawa and
Schielzeth [20]: marginal, the variation explained by fixed
effects only (covariates), and conditional, the variation
explained by covariates as well as the variation explained
by differences between indicators, practices, and patients
(random effects).
The relative variation between practices within each
indicator was quantified using the intra-class correlation
coefficient (ICC) [21], which measures the proportion of
variation explained by the variation between practices in
indicator-specific models without covariates.
Results are presented as main effects with a 95 % con-
fidence interval.
3 Results
We considered 52 general practices. The median list size
was 3492 (range 797–16,710), the average age of patients
on the list was 38.89 years (standard deviation 7.96), and
the average deprivation of the list was 37.03 (standard
deviation 10.19). There were eight training practices, 39
practices using Vision software and 13 using EMIS.
The summary of patient-level characteristics is given in
Table 2. The total adult population was 205,519—all
patients 18 years old or older affiliated with the 52 general
practices considered in this study. This number also
includes university students (not usual residents) in Sal-
ford. As an example, we can note from Table 2 that
patients with no monitoring hazards are older on average
(79.03) than patients with monitoring hazards (75.72).
Conversely, the average age of patients with prescribing
hazards (65.33) is older than the average age of patients
with no prescribing hazards (56.92).
3.1 Prevalence and Variation Between Practices
for Each Indicator
Table 1 shows the prevalence and the ICC for each indi-
cator. Prevalence ranged from 0.13 to 12.31 %, apart from
an outlier, M4 (patients on amiodarone without recent
thyroid function test), which was 38.01 %. The overall
prevalence (proportion of patients with at least one medi-
cation safety hazard) was 5.45 % for prescribing indicators
and 7.65 % for monitoring indicators (6.77 % excluding
M4).
The ICC values for monitoring indicators were notably
higher than those for prescribing indicators. This suggests
that, for monitoring indicators, the variation between
practices accounts for a higher percentage of the total
variation. The highest ICC, by far, was for M3 (patients on
warfarin without a recent International Normalised Ratio
test).
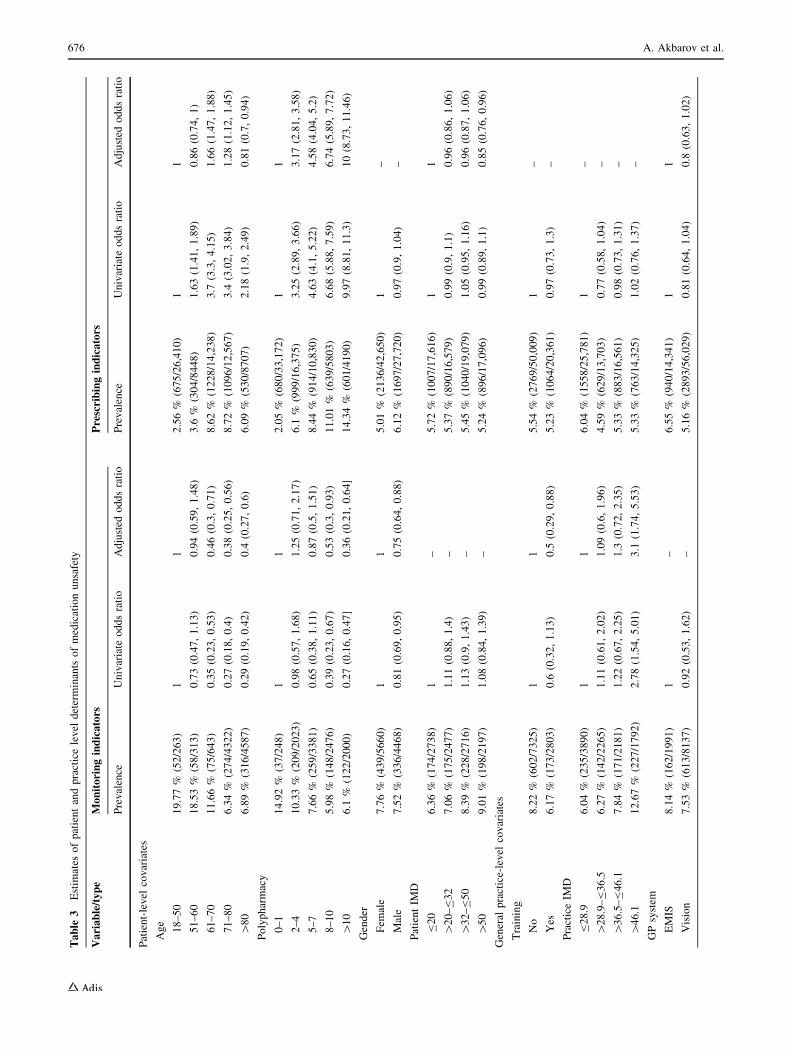
3.2 Covariate Effects
Table 3 shows estimated odds ratios for univariate and
adjusted models. The prevalence values for each variable
band reported in the table represent the proportion of
patients with at least one missed monitoring or hazardous
prescribing. The following important results stand out. Age
and polypharmacy displayed opposite effects for prescrib-
ing and monitoring indicators: higher age and polyphar-
macy were associated with increased odds of a prescribing
hazard, but decreased odds of potential monitoring failures.
Only age and polypharmacy appear in both adjusted
models. So, age and polypharmacy are important factors
for both monitoring and prescribing indicators. Although,
there is a clear relationship between age and polyphar-
macy, there was no statistically significant interaction
between these two covariates. The odds of missing a
medication monitoring event for male patients were 25 %
less than for female patients. The odds of missing a med-
ication monitoring event for patients in training practices
were 50 % less than for patients in non-training practices.
Practice-level deprivation was important only for
674 A. Akbarov et al.

monitoring indicators. The main difference was between
least deprived practices and most deprived practices, where
the odds of potential monitoring failure in the latter were
threefold higher. Patient-level deprivation was found to be
important only for prescribing indicators. The only sig-
nificant difference was between least deprived and most
deprived patients, where the odds of a hazardous pre-
scribing event for the latter were 15 % less. This result
should be treated with caution as there were no significant
differences between different patient deprivation groups in
the univariate model. Additional analyses showed that the
estimates for patient-level deprivation were mostly affected
by adjusting for polypharmacy. The odds of having a
prescribing hazard apparent in Vision-derived data
appeared to be 20 % less than in EMIS-derived data.
However, the difference was not statistically significant at a
5 % significance level.
The marginal R2, which measures the variation
explained by covariates in the adjusted models, was 11.1 %
for prescribing indicators and 7.6 % for monitoring. Sim-
ilar results were reported in Guthrie et al. [3], where
adjusted models for high-risk prescribing explained around
8–9 % of the total variation.
The conditional R2 was 49.8 % for prescribing indica-
tors and 43.6 % for monitoring. That is, 49.8 % of the
variation for prescribing indicators was explained by both
fixed and random effects of the adjusted model; similarly
for monitoring indicators.
3.3 Variation Between Practices
The variation between practices, measured by the variance
of random effects for practice labels, before adjusting for
covariates was 0.65 and 0.14 (on log odds scale) for
monitoring and prescribing indicators, respectively. In the
adjusted models, this variation reduced to 0.44 and 0.12,
respectively.
The variation between practices in the adjusted models
is depicted in Fig. 1 [22]. It shows, for each practice,
practice-specific effects not captured by covariates con-
sidered in this study (the effects are on a log odds scale).
Practices with values below zero are less likely to be
associated with medication safety indicators than practices
with values above zero. The 95 % prediction intervals
reflect the uncertainty about the predicted random effects.
The most interesting thing to note from Fig. 1 is that high
prevalence for prescribing safety indicators does not nec-
essarily go hand in hand with high prevalence for medi-
cation monitoring indicators. The correlation between the
practice-level random effects for monitoring and prescrib-
ing indicators was -0.056.
3.4 Importance of Secondary Care Data in SIR
The univariate models were re-fitted to the SIR data
excluding secondary care data. Figures 2 and 3 show that
using linked primary and secondary care data compared
with using primary care data alone only affects the results
for the monitoring indicators. This is mainly because some
of the test results associated with monitoring indicators
appear only in secondary care data.
4 Discussion
4.1 Main Results
We considered 18 prescribing and four monitoring medi-
cation safety indicators. For prescribing indicators,
increasing age and polypharmacy increased the odds of
Table 2 Adult population (18 years old or older) characteristics by medication hazard types; average (standard deviation)
All Monitoring Prescribing Monitoring and prescribing
No
hazards*
At least
one hazard
No
hazards*
At least
one hazard
No
hazards*
At least one combination
of monitoring and
prescribing hazard
Number 205,519 9353 775 66,537 3833 7338 71
Age 46.21 (19.3) 79.03 (9.53) 75.72 (13.95) 56.92 (20.19) 65.33 (16.03) 79.42 (9.23) 74.68 (13.46)
IMD 35.17 (18.83) 33.56 (18.47) 36.65 (18.97) 35.22 (18.82) 34.47 (18.97) 33.64 (18.44) 36.68 (20.65)
Polypharmacy 2.1 (3.5) 8.63 (4.33) 7.59 (4.27) 3.73 (4.28) 7.12 (5.14) 8.42 (4.31) 8.55 (4.16)
Males (%) 51 44 43 39 44 44 52
IMD Index of Multiple Deprivation
* The ‘‘no hazards’’ columns are not the denominator values; they represent the number of patients who were in the denominator but not in the
numerator of any of the indicators
Medication Surveillance Using Primary and Secondary Care Data 675
Table
3Estim
ates
ofpatientandpracticelevel
determinants
ofmedicationunsafety
Variable/type
Monitoringindicators
Prescribingindicators
Prevalence
Univariate
oddsratio
Adjusted
oddsratio
Prevalence
Univariate
oddsratio
Adjusted
oddsratio
Patient-level
covariates
Age
18–50
19.77%
(52/263)
11
2.56%
(675/26,410)
11
51–60
18.53%
(58/313)
0.73(0.47,1.13)
0.94(0.59,1.48)
3.6
%(304/8448)
1.63(1.41,1.89)
0.86(0.74,1)
61–70
11.66%
(75/643)
0.35(0.23,0.53)
0.46(0.3,0.71)
8.62%
(1228/14,238)
3.7
(3.3,4.15)
1.66(1.47,1.88)
71–80
6.34%
(274/4322)
0.27(0.18,0.4)
0.38(0.25,0.56)
8.72%
(1096/12,567)
3.4
(3.02,3.84)
1.28(1.12,1.45)
[80
6.89%
(316/4587)
0.29(0.19,0.42)
0.4
(0.27,0.6)
6.09%
(530/8707)
2.18(1.9,2.49)
0.81(0.7,0.94)
Polypharmacy
0–1
14.92%
(37/248)
11
2.05%
(680/33,172)
11
2–4
10.33%
(209/2023)
0.98(0.57,1.68)
1.25(0.71,2.17)
6.1
%(999/16,375)
3.25(2.89,3.66)
3.17(2.81,3.58)
5–7
7.66%
(259/3381)
0.65(0.38,1.11)
0.87(0.5,1.51)
8.44%
(914/10,830)
4.63(4.1,5.22)
4.58(4.04,5.2)
8–10
5.98%
(148/2476)
0.39(0.23,0.67)
0.53(0.3,0.93)
11.01%
(639/5803)
6.68(5.88,7.59)
6.74(5.89,7.72)
[10
6.1
%(122/2000)
0.27(0.16,0.47]
0.36(0.21,0.64]
14.34%
(601/4190)
9.97(8.81,11.3)
10(8.73,11.46)
Gender
Fem
ale
7.76%
(439/5660)
11
5.01%
(2136/42,650)
1–
Male
7.52%
(336/4468)
0.81(0.69,0.95)
0.75(0.64,0.88)
6.12%
(1697/27,720)
0.97(0.9,1.04)
–
PatientIM
D
B20
6.36%
(174/2738)
1–
5.72%
(1007/17,616)
11
[20–B32
7.06%
(175/2477)
1.11(0.88,1.4)
–5.37%
(890/16,579)
0.99(0.9,1.1)
0.96(0.86,1.06)
[32–B50
8.39%
(228/2716)
1.13(0.9,1.43)
–5.45%
(1040/19,079)
1.05(0.95,1.16)
0.96(0.87,1.06)
[50
9.01%
(198/2197)
1.08(0.84,1.39)
–5.24%
(896/17,096)
0.99(0.89,1.1)
0.85(0.76,0.96)
General
practice-level
covariates
Training
No
8.22%
(602/7325)
11
5.54%
(2769/50,009)
1–
Yes
6.17%
(173/2803)
0.6
(0.32,1.13)
0.5
(0.29,0.88)
5.23%
(1064/20,361)
0.97(0.73,1.3)
–
PracticeIM
D
B28.9
6.04%
(235/3890)
11
6.04%
(1558/25,781)
1–
[28.9–B36.5
6.27%
(142/2265)
1.11(0.61,2.02)
1.09(0.6,1.96)
4.59%
(629/13,703)
0.77(0.58,1.04)
–
[36.5–B46.1
7.84%
(171/2181)
1.22(0.67,2.25)
1.3
(0.72,2.35)
5.33%
(883/16,561)
0.98(0.73,1.31)
–
[46.1
12.67%
(227/1792)
2.78(1.54,5.01)
3.1
(1.74,5.53)
5.33%
(763/14,325)
1.02(0.76,1.37)
–
GPsystem
EMIS
8.14%
(162/1991)
1–
6.55%
(940/14,341)
11
Vision
7.53%
(613/8137)
0.92(0.53,1.62)
–5.16%
(2893/56,029)
0.81(0.64,1.04)
0.8
(0.63,1.02)
676 A. Akbarov et al.

experiencing a prescribing hazard. Similar results were
reported by previous studies [3, 5, 6]. Although polyphar-
macy is the most important risk factor for prescribing
hazards, it should be noted that patients’ co-morbidities,
previous medication therapies (especially unsuccessful
ones), treatment goals, and current health status were not
taken into account. These are important contextual factors
for analysing prescribing errors [23]; however, with the
exception of co-morbidities, these factors are not readily
accessible or quantifiable. Some apparent prescribing
errors may be the only viable or necessary course of
medication therapy in certain cases. This is especially
relevant to elderly patients as the clinical trials underpin-
ning many drug therapies exclude frail and elderly patients,
thus, creating significant uncertainty around the effects of
pharmacotherapy in elderly patients [23, 24].
Monitoring indicators are not usually discussed in their
own right in the literature. Increasing age, polypharmacy,
and being male decreased the likelihood of missed moni-
toring. The effect of a practice being a training practice was
significant only in the adjusted model; patients in such
practices were less likely to miss monitoring. Also, prac-
tices in the most deprived areas exhibited much higher
levels of missed monitoring. This issue warrants further
research to trace the origins of the inequity, through deeper,
quantitative and qualitative study of patient- and practice-
level determinants.
The observed effects for age and polypharmacy, better
monitoring and worse prescribing rates, are not surprising.
Given this, we would expect that the increased morbidity
burden for the elderly leads to more consultations and
higher levels of polypharmacy. Within this context, it may
be more relevant to apply prescribing quality standards for
the elderly/high polypharmacy groups, as these groups
receive numerous interventions and are, on average,
exposed to more risks.
The PINCER study [8] reported high prevalence values
for several monitoring indicators, namely, M2 (blood/liver
function test for patients on methotrexate) 35–36 % and
M4 (thyroid function test for patients on amiodarone)
46 %. In our study, M2 was 6.74 % and M4 was 38.01 %.
The large difference in the prevalence values of M2 could
be explained by additional test data captured by secondary
care data in SIR. However, the question that remains
unanswered is whether these additional test data were
originally requested by practices and simply did not make
it into primary care records or whether they were recorded
as a result of patients visiting the hospital. The latter seems
to be more likely as both the blood and the renal function
tests are common tests in the hospital, whereas the thyroid
function test is not as common and, hence, the smaller
difference in prevalence values of M4. Unless the tests are
directly related to the cause of attending the hospital, theyTable
3continued
Variable/type
Monitoringindicators
Prescribingindicators
Prevalence
Univariate
oddsratio
Adjusted
oddsratio
Prevalence
Univariate
oddsratio
Adjusted
oddsratio
Listsize
B2.4
K11.77%
(121/1028)
1–
5.62%
(373/6637)
1–
[2.4
K–B3.29K
10.76%
(127/1180)
0.73(0.37,1.43)
–6.06%
(561/9255)
1.13(0.82,1.55)
–
[3.29K–B6.47K
5.52%
(152/2753)
0.4
(0.21,0.77)
–5.63%
(1008/17,915)
0.98(0.72,1.33)
–
[6.47K
7.26%
(375/5167)
0.57(0.3,1.08)
–5.17%
(1891/36,563)
0.91(0.67,1.23)
–
Meanage
B35.5
8.31%
(113/1360)
1–
4.17%
(525/12,584)
1–
[35.5–B39.0
8.53%
(177/2075)
0.77(0.37,1.59)
–5.56%
(902/16,220)
1.42(1.03,1.95)
–
[39.0–B41.2
7.5
%(239/3187)
0.88(0.43,1.8)
–5.59%
(1199/21,432)
1.32(0.96,1.81)
–
[41.2
7.02%
(246/3506)
0.66(0.32,1.36)
–5.99%
(1207/20,134)
1.31(0.95,1.79)
–
IMD
Index
ofMultiple
Deprivation
Medication Surveillance Using Primary and Secondary Care Data 677

are unlikely to be communicated to a practice, although
general practitioners in Salford can access the hospital
results, if required. The fragmentation of monitoring
medication-related biomarkers needs further investigation
especially as there might be some missed opportunities
when tests done in secondary care are not evaluated against
a patient’s long-term medication. The results of this study
related to monitoring indicators require further investiga-
tion and should be interpreted with caution.
Analysis using only primary care data in SIR showed
that the univariate effect of age for monitoring indicators
was no longer significant. This might be due to excluding
secondary care test data resulting from more frequent
hospital visits by older patients. Polypharmacy was still a
significant factor for monitoring indicators. As polyphar-
macy exhibits opposite effects for monitoring and pre-
scribing indicators, it is clear that combining the two would
dilute its effect. Also, the univariate effect of software
system became significant, where Vision-derived data
seemed to indicate higher levels of missed monitoring. This
might be explained by the differences in data linkage
between practice software systems and the hospital’s
information system. However, differences in performance
across systems are not unprecedented and can be driven by
Fig. 1 Log-odds of prescribing
and monitoring indicators by
practice
678 A. Akbarov et al.

Fig. 2 Univariate odds ratios for prescribing indicators by patient and practice factors. CI confidence interval, IMD Index of Multiple
Deprivation, PC primary care subset of SIR, SIR Salford Integrated Record (an electronic health record across primary and secondary care)
Medication Surveillance Using Primary and Secondary Care Data 679

Fig. 3 Univariate odds ratios for medication monitoring indicators
by patient and practice factors. CI confidence interval, IMD Index of
Multiple Deprivation, PC primary care subset of SIR, SIR Salford
Integrated Record (an electronic health record across primary and
secondary care)
680 A. Akbarov et al.

usability and intuitiveness, use of alerts and notifications,
dismissability of reminders, support and training, or
adaptability [25].
Adjusting for covariates reduced the variation between
practices by 14 and 32 % for prescribing and monitoring
indicators, respectively. Clearly, there are other factors that
affect the apparent differences in performance between
practices. Also, practices with high numbers of prescribing
safety issues do not necessarily have high numbers of
monitoring issues. This indicates that the procedural and
clinical context of medication prescribing and monitoring
are different and the two processes should be investigated
separately.
4.2 Strengths and Limitations of the Study
The main strength of this study is the comprehensive
analysis of medication monitoring as well as prescribing
safety indicators for a well-researched set of indicators and
a defined population with linked primary and secondary
care records. We have shown that linked secondary care
data are important for medication safety surveillance in
primary care. In addition, we have demonstrated the dif-
ferent statistical characteristics of monitoring compared
with prescribing indicators, and shown how surveillance
systems might deal with this.
One of the main limitations of this study is its cross-
sectional nature. Although we have provided some results
using alternative reference dates (please see electronic
supplementary material), more detailed longitudinal studies
could be pursued. The variation in the outcomes within
individual patients could change over time as concordance
with medication policies change—a highly complex lon-
gitudinal picture.
There are also other important covariates that were not
considered in this study, such as practitioner-level covari-
ates like clinical experience. The extract of SIR we had
access to did not contain practitioner-level data. In addi-
tion, a more complete picture of co-morbidity could be
studied alongside polypharmacy, attempting to identify
more detailed targets for quality improvement and, poten-
tially, clinical decision-support systems.
Polypharmacy as a measure of medication exposure can
be difficult to quantify, especially from integrated data
such as that in SIR, where dosage and intake instructions
need to be inferred through text mining. This requires
further work, especially as a more accurate medication
exposure measure would need to take into account whether
drugs that have been prescribed are actually taken by
patients, which could vary significantly depending on the
type of medication.
We used a particular set of prescribing indicators which
is not exhaustive of the safety concerns in prescribing and
monitoring practice. Some of the indicators we investigated
related to very small patient groups; hence, it is unlikely
these indicators on their own will be adequate in quanti-
fying practice prescribing safety. However, they should be
adequate for this task as part of a larger indicator group.
The NHS is by far the largest health provider in the UK,
although, alternative private providers do exist. The data
we analysed only pertained to the NHS, and our findings
are not necessarily generalisable to private health
providers.
Although one of the ultimate aims of this study is to
improve medication safety through computerised inter-
vention, it should be noted that this is a two-way process. A
computerised intervention with a feedback loop should aim
at finding the contextual circumstances that lead to medi-
cation errors and not aim at providing punitive/summative
assessments of practitioners’ medication practice. In the
context of manageable two-way interventions, the initial
set of indicators is likely to be restricted. Having a large
number of indicators can run the risk of over-whelming
general practitioners with alerts and lead to ‘‘alert fatigue’’
where practitioners may override the alerts or stop pro-
viding feedback [26].
4.3 Future Work
As a follow-up to the current study, we are currently
planning to roll out and evaluate an electronic audit and
feedback intervention to improve medication safety in
Salford primary care. The intervention, based on the PIN-
CER trial [8], will interrogate linked electronic health
record data to continuously assess the prescribing and
monitoring indicators studied here. Each participating
general practice will receive access to their own safety
scores through a web-based dashboard application and will
be visited by a trained pharmacist to review the indicator
scores and initiate appropriate action. The results of this
intervention study are expected by late 2016.
5 Conclusion
Linked primary and secondary care records reveal impor-
tant areas for quality improvement in health systems.
Surveillance of prescribing and monitoring hazards ought
to use linked primary and secondary care data. Surveillance
systems built on integrated care record systems should be
vigilant for inequities in age (older patients more often
affected), examine polypharmacy (patients on multiple
medications more often affected), treat prescribing and
monitoring as different statistical processes (otherwise
cross-contaminated effects will dilute potentially important
signals), not assume that practices with higher prescribing
Medication Surveillance Using Primary and Secondary Care Data 681

hazards have more missed monitoring (uncorrelated here),
and be vigilant for socio-economic inequity in monitoring
(more missed monitoring in deprived areas).
Acknowledgments Permission to use the SIR data for the analysis
was granted via the SIR approval board, which incorporates all the
appropriate information governance. Further ethical approval was not
required, because of the anonymised nature of the data. We would
like to thank the SIR board for providing the SIR data for the analysis.
Compliance with Ethical Standards
Funding This work was supported by the University of Manch-
ester’s Health eResearch Centre (HeRC), funded by the Medical
Research Council (MRC) Grant MR/K006665/1, and by the National
Institute for Health Research Greater Manchester Primary Care
Patient Safety Translational Research Centre (NIHR GM PSTRC).
The views expressed are those of the authors and not necessarily those
of the MRC, NHS, the NIHR, or the Department of Health.
Conflict of interest Artur Akbarov, Evangelos Kontopantelis,
Matthew Sperrin, Susan J. Stocks, Richard Williams, Sarah Rodgers,
Anthony Avery, Iain Buchan, and Darren M. Ashcroft have no con-
flicts of interest that are directly relevant to the content of this study.
Open Access This article is distributed under the terms of the
Creative Commons Attribution-NonCommercial 4.0 International
License (http://creativecommons.org/licenses/by-nc/4.0/), which per-
mits any noncommercial use, distribution, and reproduction in any
medium, provided you give appropriate credit to the original
author(s) and the source, provide a link to the Creative Commons
license, and indicate if changes were made.
References
1. Winterstein AG, Sauer BC, Hepler CD, Poole C. Preventable
drug-related hospital admissions. Ann Pharmacother.
2002;36:1238–48.
2. Howard RL, Avery AJ, Slavenburg S, Royal S, Pipe G, Lucassen
P, et al. Which drugs cause preventable admissions to hospital? A
systematic review. Br J Clin Pharmacol. 2007;63:136–47.
3. Guthrie B, McCowan C, Davey P, Simpson CR, Dreischulte T,
Barnett K. High risk prescribing in primary care patients partic-
ularly vulnerable to adverse drug events: cross sectional popu-
lation database analysis in Scottish general practice. BMJ.
2011;342:d3514.
4. Galvin R, Moriarty F, Cousins G, Cahir C, Motterlini N, Bradley
M, et al. Prevalence of potentially inappropriate prescribing and
prescribing omissions in older Irish adults: findings from The
Irish LongituDinal Study on Ageing study (TILDA). Eur J Clin
Pharmacol. 2014;70:599–606.
5. Schubert I, Kupper-Nybelen J, Ihle P, Thurmann P. Prescribing
potentially inappropriate medication (PIM) in Germany’s elderly
as indicated by the PRISCUS list. An analysis based on regional
claims data: prescribing potentially inappropriate medication.
Pharmacoepidemiol Drug Saf. 2013;22:719–27.
6. Holmes HM, Luo R, Kuo Y-F, Baillargeon J, Goodwin JS.
Association of potentially inappropriate medication use with
patient and prescriber characteristics in Medicare Part D: Inap-
propriate Medications and Part D. Pharmacoepidemiol Drug Saf.
2013;22:728–34.
7. Morris CJ. Indicators for preventable drug related morbidity:
application in primary care. Qual Saf Health Care.
2004;13:181–5.
8. Avery AJ, Rodgers S, Cantrill JA, Armstrong S, Cresswell K,
Eden M, et al. A pharmacist-led information technology inter-
vention for medication errors (PINCER): a multicentre, cluster
randomised, controlled trial and cost-effectiveness analysis.
Lancet. 2012;379:1310–9.
9. 2011 Census datasets: QS102EW Population density [Internet].
Office for National Statistics; Available from: http://www.ons.
gov.uk/ons/index.html. Accessed 1 May 2015.
10. Avery AJ, Dex GM, Mulvaney C, Serumaga B, Spencer R, Lester
HE, et al. Development of prescribing-safety indicators for GPs
using the RAND Appropriateness Method. Br J Gen Pract.
2011;61:e526–36.
11. Spencer R, Bell B, Avery AJ, Gookey G, Campbell SM. Identi-
fication of an updated set of prescribing-safety indicators for GPs.
Br J Gen Pract. 2014;64:e181–90.
12. Beers MH, Ouslander JG, Rollingher I, Reuben DB, Brooks J,
Beck JC. Explicit criteria for determining inappropriate medica-
tion use in nursing home residents. UCLA Division of Geriatric
Medicine. Arch Int Med. 1991;151:1825–32.
13. Wenger NS, Shekelle PG. Assessing care of vulnerable elders:
ACOVE project overview. Ann Int Med. 2001;135:642–6.
14. Gallagher P, Ryan C, Byrne S, Kennedy J, O’Mahony D. STOPP
(Screening Tool of Older Person’s Prescriptions) and START
(Screening Tool to Alert doctors to Right Treatment). Consensus
validation. Int J Clin Pharmacol Ther. 2008;46:72–83.
15. Gallagher P, O’Mahony D. STOPP (Screening Tool of Older
Persons’ potentially inappropriate Prescriptions): application to
acutely ill elderly patients and comparison with Beers’ criteria.
Age Ageing. 2008;37:673–9.
16. Communities and Local Government. The English indices of
deprivation 2010: technical report. 2011.
17. R Core Team. R: A language and environment for statistical
computing [Internet]. Vienna: R Foundation for Statistical
Computing; 2014. Available from: http://www.R-project.org/.
Accessed 12 Jan 2015.
18. Bates D, Maechler M, Bolker B, Walker S. lme4: Linear mixed-
effects models using Eigen and S4 [Internet]. R package version
1.0-5; 2013. Available from: http://CRAN.R-project.org/
package=lme4. Accessed 12 Jan 2015.
19. Akaike H. A new look at the statistical model identification.
Autom Control IEEE Trans On. 1974;19:716–23.
20. Nakagawa S, Schielzeth H. A general and simple method for
obtaining R2 from generalized linear mixed-effects models.
Methods Ecol Evol. 2013;4:133–42.
21. Lesnoff, M. aod: Analysis of Overdispersed Data [Internet]. R
package version 1.3; 2012. Available from: http://cran.r-project.
org/package=aod. Accessed 12 Jan 2015.
22. Wickham H. ggplot2: elegant graphics for data analysis. New
York: Springer; 2009.
23. O’Connor MN, Gallagher P, O’Mahony D. Inappropriate pre-
scribing. Drugs Aging. 2012;29:437–52.
24. Penge J, Crome P. Appropriate prescribing in older people. Rev
Clin Gerontol. 2014;24:58–77.
25. Kontopantelis E, Buchan I, Reeves D, Checkland K, Doran T.
Relationship between quality of care and choice of clinical
computing system: retrospective analysis of family practice per-
formance under the UK’s quality and outcomes framework. BMJ
Open. 2013;3:e003190.
26. Nanji KC, Slight SP, Seger DL, Cho I, Fiskio JM, Redden LM,
et al. Overrides of medication-related clinical decision support
alerts in outpatients. J Am Med Inform Assoc. 2014;21:487–91.
682 A. Akbarov et al.