priming the soil - sbp.org.za€¦ · behind china (14.4%) and brazil (17.5%). however, when...
TRANSCRIPT

HEADLINE REPORT OF SBP’S
SME GROWTH INDEX™
PRIMING THE SOILSMALL BUSINESS IN SOUTH AFRICA
NOVEMBER 2011
79 Oxford RoadSaxonwoldJohannesburgSouth Africa
P O Box 1051Houghton 2041JohannesburgSouth Africa
T +27 11 486 0797F +27 11 486 0810
www.sbp.org.zawww.smegrowthindex.co.za
©SBP 2011
All rights reserved. The material in
this publication may not be copied,
stored or transmitted without the
prior permission of SBP. Short
extracts may be quoted, provided
the source is fully acknowledged

Agriculture, the process of raising life from the soil, provides an insight applicable
to all economic endeavours: all things being equal, the quality of inputs will
be refl ected in the quality of outputs. The fertility of the soil, the weather, the
availability of water, and the quality of the seed will all determine how bountiful
the crop will be. A diffi cult environment is likely to produce disappointing yields.
However, experience demonstrates that, while many of these conditions are
beyond the farmer’s control, a poor environment need not be a fatal constraint.
Skill, perseverance, understanding of the environment, and the application of
technology in the form of irrigation, fertilisation and choice of crop can produce
remarkable results, even where the soil is not promising.
Application of the agricultural metaphor to the national economy sees South
Africa looking dry and dusty at present. Optimism about the future in the
wake of the political transition has given way to open concerns about failure.
Fundamental to this has been the failure to match the political transition with
an equivalent economic transition, to lift the millions of poor people out of
poverty and to ensure a sustainable economic stake for all. GDP growth is far
short of the 7 percent level required to support job creation on a meaningful
scale. At least a quarter of the population is unemployed (the number rises to
nearly 40 percent if those who have given up looking for work are included).
Current trends indicate that as many as half of South Africa’s youth may never
have a job. This leaves an alarming proportion of our population frustrated and
alienated - and threatens the economic success of the country as a whole.
It is increasingly common cause that unless the trajectory is altered, the
prospect of economic desertifi cation looms.
A MEAGRE HARVEST?
The challenge before South Africa, then, is to fi nd a new method of cultivation,
one that will expand the fruits of the economy exponentially. This will mean
understanding the nature of the environment, and the available inputs. How
fertile is the soil in which the economy as a whole grows? And how does this
impact on those who till it?
In his recent medium term budget policy statement, fi nance minister Pravin
Gordhan spoke quite frankly about the problems ailing South Africa’s economy
and the shortcomings of the government’s attempts to deal with them. While
there was understandably much emphasis on the state of the global economy,
an environmental condition largely outside South Africa’s control, the clear
subtext was that South Africa needs to do things differently. Our economy is
shedding jobs, and those that are being created are disproportionately in the
public sector. Yet the public service wage bill has risen beyond expectations,
currently consuming 42 percent of revenue, up from 31 percent just four years
ago. Room for manoeuvre is limited.
INTRODUCTION
02
1
Rapid and sustained economic growth is critical to stem the tide of job losses.
Our prospects of achieving such growth are highly dependent on the economy’s
entrepreneurs and businesses. Without a strong business sector and bold
entrepreneurs, we have as little chance of prospering as an oak tree in the Karoo.
Meeting this challenge will require an expansion in the number of businesses
– tilling virgin soil. By one estimate, to achieve the 5 million jobs that the
government has set as its target over the coming decade, South Africa will
need to produce around 13 600 new manufacturing businesses alone (in rough
terms, the country probably needs around 100 000 new fi rms to achieve this
goal). Indeed, South Africa will need a veritable fl owering of entrepreneurial
endeavour. At present, this is not happening.
Evidence from the Global Entrepreneurship Monitor shows that 8.9 percent
of adult South Africans are involved in what it describes as “early-stage
entrepreneurship,” in other words, setting up a business or running a new
business. Generally, this percentage tends to be larger for less developed
economies, and smaller for more developed ones. South Africa’s rate is fair,
comparable with Turkey (8.6%), Pakistan (9.1%), and Mexico (10.5%), but far
behind China (14.4%) and Brazil (17.5%). However, when established business
ownership is considered, South Africa’s ranking falls precipitously. Established
business ownership describes adults who are owner-managers of established
businesses of 42 months or older. In South Africa, this applies to just 2.1 percent
of the population. Across the entire sample of 83 countries only Mexico scores
signifi cantly worse, at 0.4 percent. South Africa is comparable to Romania and
Palestine, and it is far outdone by comparator countries such as Argentina
(12.4%), Brazil (15.3%), China (13.8%), Columbia (12.2%), and Malaysia (7.9%).
Even economies not noted for their entrepreneurial ethos, owing to statist or
“rent-seeking” traditions, such as Russia and Saudi Arabia, do better.
Our efforts to expand the number of small businesses need to be located within
an understanding of the nature of businesses that the economy can best support.
No two economies have identical sets of advantages. As such, the nature of
03
Smaller fi rms are the
primary drivers of job growth

04
economic activities that can profi tably and sustainably be conducted will vary
from country to country. Investment needs to be appropriately directed. It is
also true that within an economy, different businesses will function differently,
strive for and achieve different growth ambitions. Some will make a bigger
contribution than others – some will aim to expand and create much needed
jobs, others will choose, for a variety of sound reasons, to remain small.
The small and medium enterprises (SME) sector is routinely hailed as the
indispensible ingredient for resolving South Africa’s economic impasse. SMEs
have featured prominently in South Africa’s various economic strategies: from
the RDP in 1994, through Gear and Asgisa, to the New Growth Path in 2010.
In an October 2011 speech to the South African Chamber of Commerce and
Industry, Minister Gordhan noted that: “Small and medium sized fi rms are
critical for overall employment and job creation.… Labour Force data shows
that about 70 percent of private employment is in fi rms with fewer than 50
workers. In addition, smaller fi rms account for a disproportionate share of
gross job creation with almost 80 percent of all new jobs being created in fi rms
with fewer than 50 workers. Addressing the employment challenge facing our
country will be diffi cult without a sustained upward shift in the number of fi rms
operating in the country and the expansion of jobs created in smaller fi rms.”
That smaller fi rms are the primary drivers of job growth is a view well supported
by evidence from around the world (see SBP Alert, Growing Small Firms,
Growing Employment, March 2011). What is less clear, and remains the subject
of dispute among business scholars, is why this is so, what concurrent factors
might be co-drivers of job growth, and what policy responses and stimuli are
most appropriate.
THE SME GROWTH INDEX
SBP’s SME Growth Index is a response to this. Despite acknowledgment of
SMEs’ potential as employment generators, they are a poorly understood and
inadequately documented sector. Even information on the number of SMEs
is unreliable. State efforts to assist the sector have had very limited success.
Moreover, partly due to the lack of robust data, the debate around SMEs and
their ability to assist in employment growth has become heavily weighted with
ideology, assumptions and anecdotes.
A number of international examples demonstrate that organised efforts to
support small business to boost their performance can be effective. Brazil’s
Sabrae agency is a case in point. But before such measures can be instituted,
a clear understanding of the issues, and SMEs’ own articulation of their needs,
is essential. So too is a recognition of the diversity of the sector – SMEs operate
in different environments, and are owned and managed by people with a wide
range of motivations and aspirations.
The SME Growth Index is the fi rst and largest study of its kind to be undertaken
in South Africa. It differs from previous studies in breadth, scope and intent. It is
based on the experiences and perspectives of a Panel of 500 small businesses,
across South Africa’s three major metropolitan areas. It delves into the wide
spectrum of factors germane to the operation of a business. It also focuses
on drivers behind SME survival and growth. While much of the government’s
attention has been on supporting the establishment of new small businesses,
the Index emphasises the enormous and sometimes unacknowledged
contribution made by established enterprises with the potential to expand,
generate wealth and take on additional employees.
In 2011, in the fi rst of a series of annual surveys, the research underpinning the
Index gathered over 65 000 data points – the most comprehensive picture yet
assembled of the sector.
Importantly, the Index is longitudinal. It will run for an initial period of at least
three years. It will establish a set of comparative analytical data at particular
points in time, thereby enabling assessment of the impacts of changes in the
operating and regulatory environment, identifi cation of patterns in fi rm growth,
and analysis of the types of internal and external variables that differentiate
between fi rms that are creating jobs, and those that are not.
The Index also investigates the growth experiences and aspirations of fi rms at
different points along the age continuum. In several areas, including access to
fi nance, established fi rms have an advantage over younger fi rms. The Index
tracks and compares the experiences of young fi rms (those operating between
two and fi ve years), established fi rms (six to twenty years), and mature fi rms
(over twenty years). It looks at their different characteristics and experiences,
how they started, how they access markets, how they approach innovation and
competition, their access to resources such as skills, capital, fi nance, the extent
and scale of employee growth, and their aspirations for future growth. This
comparison by age of business highlights how factors infl uencing employee
growth vary at different stages along the continuum. It also uncovers the
extent to which businesses tend to employ more people as they grow older –
highlighting the importance of policies to encourage business longevity, rather
than focusing exclusively on support for business start-ups.
Above all, the Index aims to support evidence-based policy-making for the SME
sector. Our goal is to support the types of policy and practical interventions
that will best ensure that South Africa provides the soil in which a strong and
durable SME economy can fl ourish.
05
The research underpinning the
Index gathered over 65 000
data points

06
2THE PANEL
BY SECTOR
Manufacturing
Other
Business services
Tourism
PANEL
The SME Growth Index Panel consists of a representative panel of 500 fi rms,
each with ten to 49 employees (this defi nition of ‘SME’ is in line with international
norms, enabling comparative assessment across countries). Given the focus on
employment generation and growth potential, the Panel is limited to fi rms that
have been operating for at least two years. To enable analysis of fi rms along the
age continuum, we have classifi ed Panel members as young (fi rms operating
for two to fi ve years), established (six to 20 years) and mature (operating for
over 20 years).
The fi rms are concentrated in three core geographical areas, Cape Town, Durban
and Johannesburg, each of which has a high concentration of small businesses
activity (a small proportion of Panel members are located in the North West and
Limpopo). The Index focuses on three economic sectors - business services,
manufacturing and tourism. These sectors have high volumes of SME activity,
have been prioritised by government as critical economic growth areas, and
offer the potential for SME growth.

33%
26%
33%
4%
4%
Johannesburg
Limpopo
Cape Town
North West
Durban / KZN
The SME Growth Index Panel consists
of a representative panel of 500
fi rms, each with ten to 49 employees
PANEL
07
BY GEOGRAPHICAL
LOCATION
Among the tourism fi rms, a subgroup of 130 is currently receiving business
development support through the Tourism Enterprise Partnership (TEP). These
fi rms, many of which are young according to our age continuum, were selected
in order to enable comparisons of performance among fi rms receiving support,
and those that are not. These fi rms, many of which are young according to our
age continuum, were selected in order to enable comparisons of performance
among fi rms receiving support, and those that are not.
60
50
2 to 5 6 to 10 11 to 15 16 to 20 21 to 25 26 to 30 31 to 40 41 to 50 over 51
%
40
30
20
10
0
Business Services
Manufacturing
Tourism
TEP
YEARS IN OPERATION
BY SECTOR
08
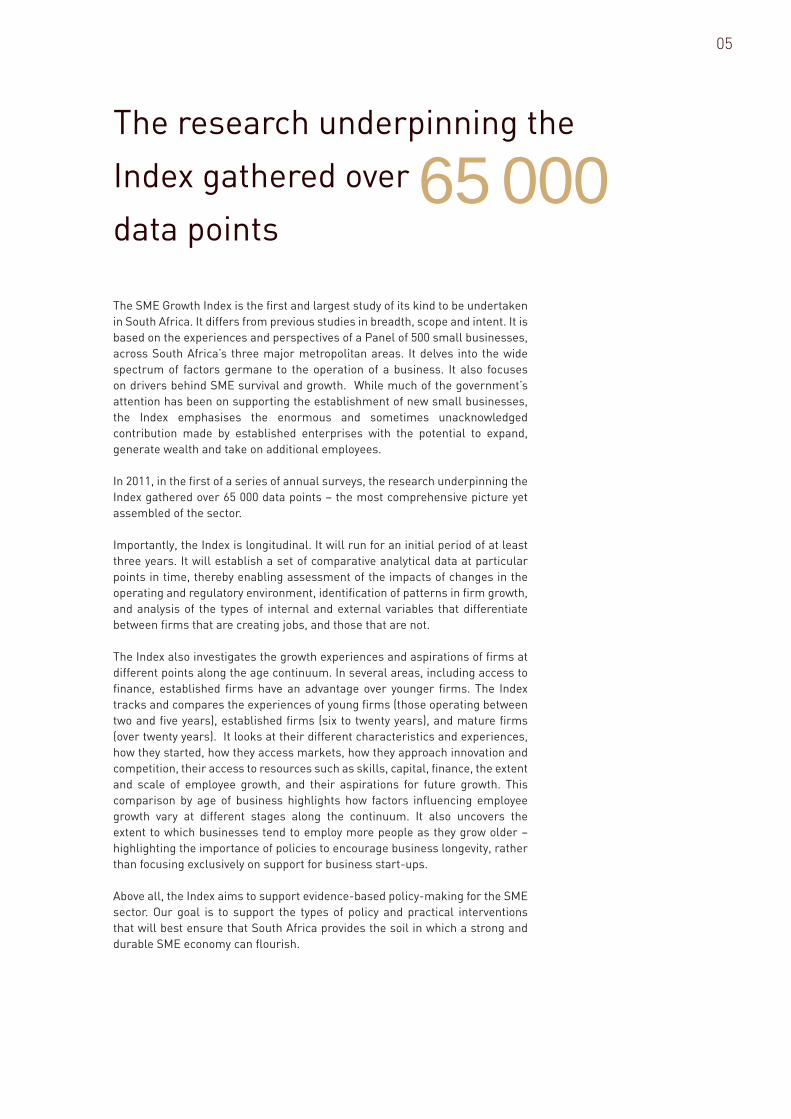
Across the Panel, fi rms show variable longevity. Tourism fi rms are more likely
to be young – over half the TEP-supported tourism fi rms are under fi ve years
old, while 45 percent of non-supported tourism fi rms are under ten. Some 60
percent of business services panellists are established, while manufacturing
fi rms are for the most part mature – over half have been operating over 20 years.
Closed corporations were the registration model of choice for half of our
Panellists, while 43 percent are registered as private limited companies. It will
be interesting to track changes to registration data over time, given that the
Closed Corporation model is no longer available to new businesses.
The large majority of business owners are South African citizens. Two thirds of
business owners on the Panel are white, 19 percent are black, 11 percent are
Asian, and 5 percent are Coloured. These proportions are broadly comparable
to DTI statistics for the SMME sector. The Annual Review of Small Business
in South Africa 2005 – 2007 estimates that Black Africans represent about 31
percent of SMME owners in the formal sector. The under-representation of
black business owners is of course a product of South Africa’s history – almost
half the businesses on the Panel were established before the political transition
in 1994.
Well over two thirds of the business owners are men, with women comprising
29 percent of the Panel. This is also comparable to DTI fi gures, which indicate
that women comprise 31 percent of formal sector SMME owners.
09
14% 61-70
3% Over 70
5% 20-30
20% 31-40
32% 41-50
26% 51-60
AGE OF BUSINESS OWNER
504540
2 to 5 6 to 10 11 to 15 16 to 20 21 to 25 26 to 30
%
353025
1520
1050
Business Services
Manufacturing
Tourism
TEP
BUSINESS OWNER AGEBY SECTOR
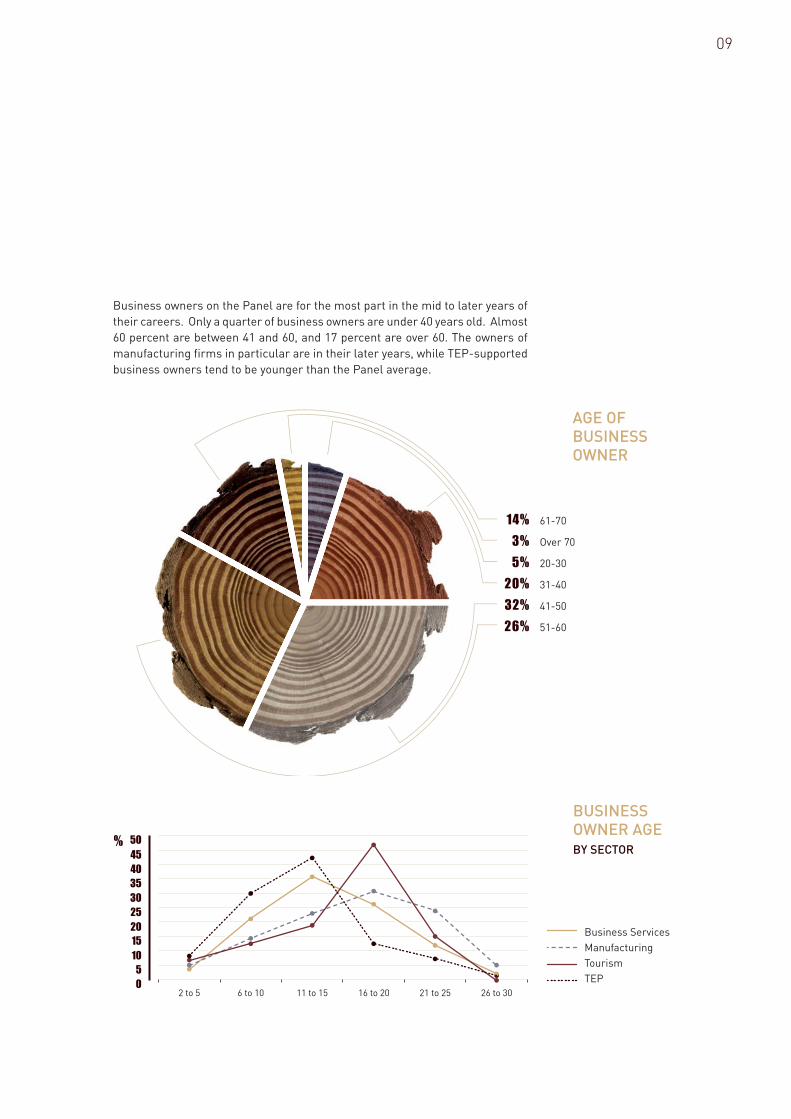
Business owners on the Panel are for the most part in the mid to later years of
their careers. Only a quarter of business owners are under 40 years old. Almost
60 percent are between 41 and 60, and 17 percent are over 60. The owners of
manufacturing fi rms in particular are in their later years, while TEP-supported
business owners tend to be younger than the Panel average.
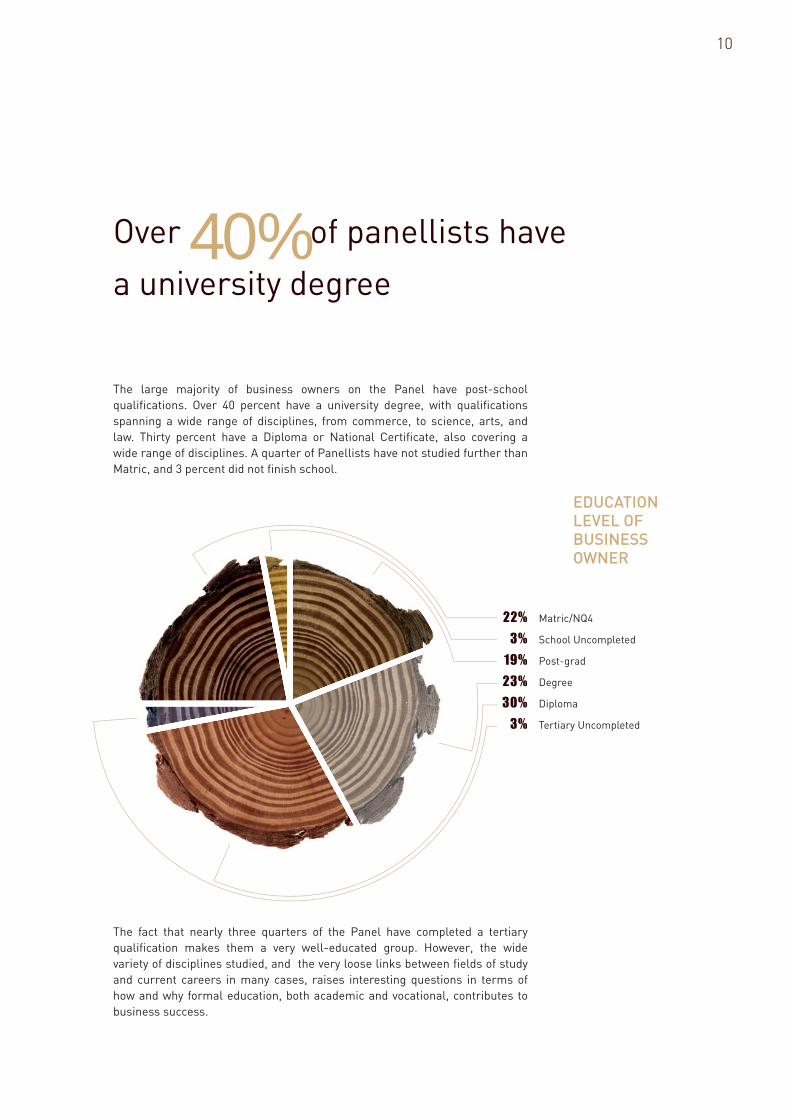
The large majority of business owners on the Panel have post-school
qualifi cations. Over 40 percent have a university degree, with qualifi cations
spanning a wide range of disciplines, from commerce, to science, arts, and
law. Thirty percent have a Diploma or National Certifi cate, also covering a
wide range of disciplines. A quarter of Panellists have not studied further than
Matric, and 3 percent did not fi nish school.
The fact that nearly three quarters of the Panel have completed a tertiary
qualifi cation makes them a very well-educated group. However, the wide
variety of disciplines studied, and the very loose links between fi elds of study
and current careers in many cases, raises interesting questions in terms of
how and why formal education, both academic and vocational, contributes to
business success.
22%
3%
19%
23%
30%
3%
Matric/NQ4
School Uncompleted
Post-grad
Degree
Diploma
Tertiary Uncompleted
10
EDUCATION LEVEL OF BUSINESS OWNER
Over 40% of panellists have
a university degree
PROFILE OF THE PANELLISTS
3
11
3.1 BUSINESS SERVICESThe business services fi rms on the Panel are concentrated in the IT sector
(consulting and services, software development and programming); fi nancial
services (including insurance brokers, accounting and tax consultant fi rms); and
advertising, communications and marketing. Other sub-sectors represented
in smaller numbers include suppliers of engineering services and equipment;
research providers; HR service providers, business support services and legal
services.
Sixty percent of fi rms are established, 30 percent are mature, and 11 percent
are young. Seventy percent have BEE accreditation.
The average business services Panellist is a white male, aged between 41 and
50, with a post-graduate university degree. He is most likely to associate risk
with opportunity, and to feel positive about prospects for business growth.
The average business services fi rm has a median turnover of R11 million,
22 permanent staff and four temporary or contract staff, the large majority
of whom are skilled. Just over a third of business services have grown their
employee numbers in the past year, 44 percent have remained constant, and
20 percent have reduced their staff numbers. Growth over the past fi ve years
is even higher – 54 percent have increased staff numbers since 2006. Just over
half expect to increase their staff numbers further in 2012.
For business services, the key external vulnerability – aside from market
contraction – is change in the regulatory environment. This result is strongly
infl uenced by the impact of regulations under the Financial Advisory and
Intermediary Services Act on Panellists in the fi nancial sector. The regulations
introduce stringent new examination and accreditation requirements, which
are currently being implemented.
3.2. MANUFACTURING The majority of manufacturers work in plastics or food, steel and metal,
and wood manufacturing, printing, and manufacturing for the construction
industry. Smaller numbers operate in industries including chemicals, industrial
equipment, clothing and textiles, rubber, packaging, sports equipment and
pharmaceuticals.
Manufacturing fi rms have the highest longevity on the Panel. Over half are
mature, and 40 percent are established. Only six percent have been operating
less than fi ve years. Sixty two percent have BEE accreditation.
The average manufacturing Panellist is a white male, with a Diploma or a
Matric. He is most likely to associate risk with uncertainty. The large majority of
manufacturing panellists are over 50, and many are past retirement age. Less
12
than a fi fth are under 40. Most plan to retire in the next ten to twenty years – in
some cases with very limited prospects for a profi table sale of the business or
a succession plan.
The average manufacturing fi rm has a median turnover of R10 million, and
employs 29 permanent employees, and three temporary workers. About half
the employees in the average fi rm are skilled, and half are semi-skilled or
unskilled. Just over a third have decreased employee numbers in the past year,
while just under a third have increased staff. This is a relatively new pattern
– in the past fi ve years 43 percent have grown staff numbers and 31 percent
have shrunk. The majority expect to keep employee numbers stable in 2012, 35
percent hope to grow, and 10 percent expect to reduce staff numbers.
Manufacturers were more likely than other Panellists to be reeling from
increased input prices, particularly in relation to rising electricity and fuel
costs, and the rising cost of imported components. Many also express a distinct
lack of confi dence in the long-term future of manufacturing, and very limited
prospects for entry by new entrepreneurs. This is particularly concerning given
the prominence assigned to manufacturing in the New Growth Path. President
Jacob Zuma recently stressed the need for “authentic black entrepreneurs who
own factories and manufacture textiles, furniture, metal products or whatever
the market requires.” The disillusionment evident among manufacturing
Panellists appears to raise questions about whether such ambitions are
misplaced.
Business services fi rms are positive
about growth prospects, while manufacturers are disillusioned
13
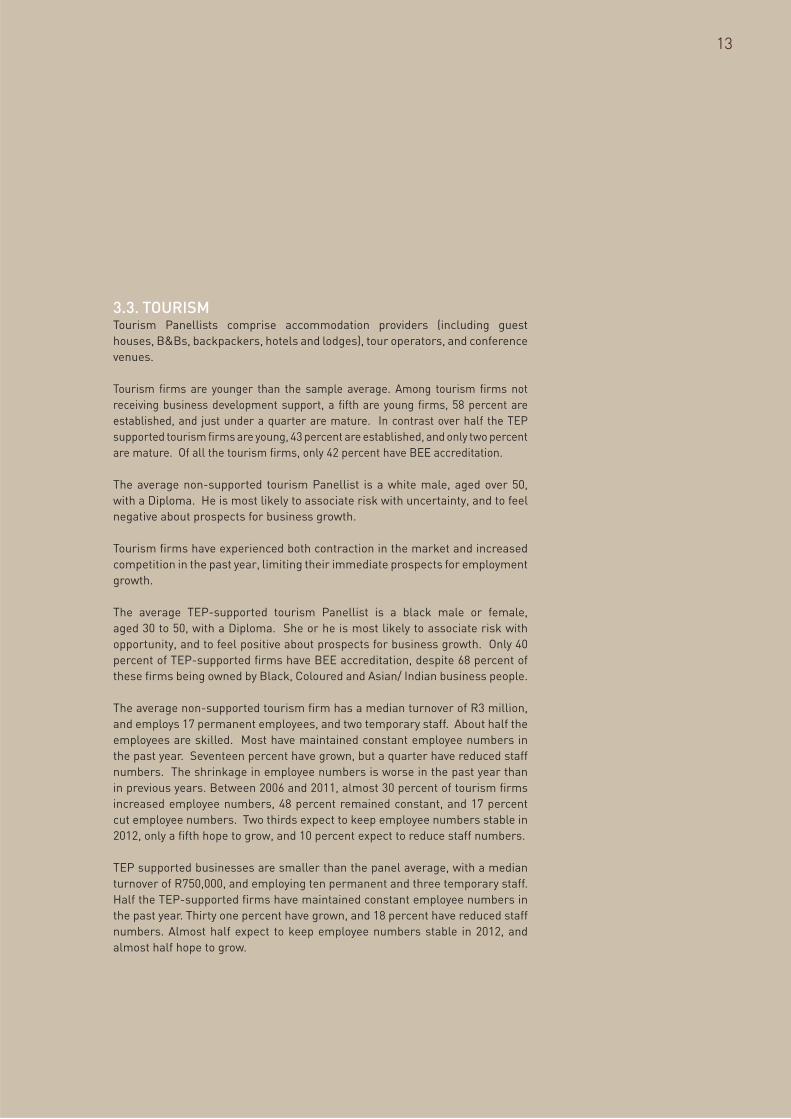
3.3. TOURISM Tourism Panellists comprise accommodation providers (including guest
houses, B&Bs, backpackers, hotels and lodges), tour operators, and conference
venues.
Tourism fi rms are younger than the sample average. Among tourism fi rms not
receiving business development support, a fi fth are young fi rms, 58 percent are
established, and just under a quarter are mature. In contrast over half the TEP
supported tourism fi rms are young, 43 percent are established, and only two percent
are mature. Of all the tourism fi rms, only 42 percent have BEE accreditation.
The average non-supported tourism Panellist is a white male, aged over 50,
with a Diploma. He is most likely to associate risk with uncertainty, and to feel
negative about prospects for business growth.
Tourism fi rms have experienced both contraction in the market and increased
competition in the past year, limiting their immediate prospects for employment
growth.
The average TEP-supported tourism Panellist is a black male or female,
aged 30 to 50, with a Diploma. She or he is most likely to associate risk with
opportunity, and to feel positive about prospects for business growth. Only 40
percent of TEP-supported fi rms have BEE accreditation, despite 68 percent of
these fi rms being owned by Black, Coloured and Asian/ Indian business people.
The average non-supported tourism fi rm has a median turnover of R3 million,
and employs 17 permanent employees, and two temporary staff. About half the
employees are skilled. Most have maintained constant employee numbers in
the past year. Seventeen percent have grown, but a quarter have reduced staff
numbers. The shrinkage in employee numbers is worse in the past year than
in previous years. Between 2006 and 2011, almost 30 percent of tourism fi rms
increased employee numbers, 48 percent remained constant, and 17 percent
cut employee numbers. Two thirds expect to keep employee numbers stable in
2012, only a fi fth hope to grow, and 10 percent expect to reduce staff numbers.
TEP supported businesses are smaller than the panel average, with a median
turnover of R750,000, and employing ten permanent and three temporary staff.
Half the TEP-supported fi rms have maintained constant employee numbers in
the past year. Thirty one percent have grown, and 18 percent have reduced staff
numbers. Almost half expect to keep employee numbers stable in 2012, and
almost half hope to grow.
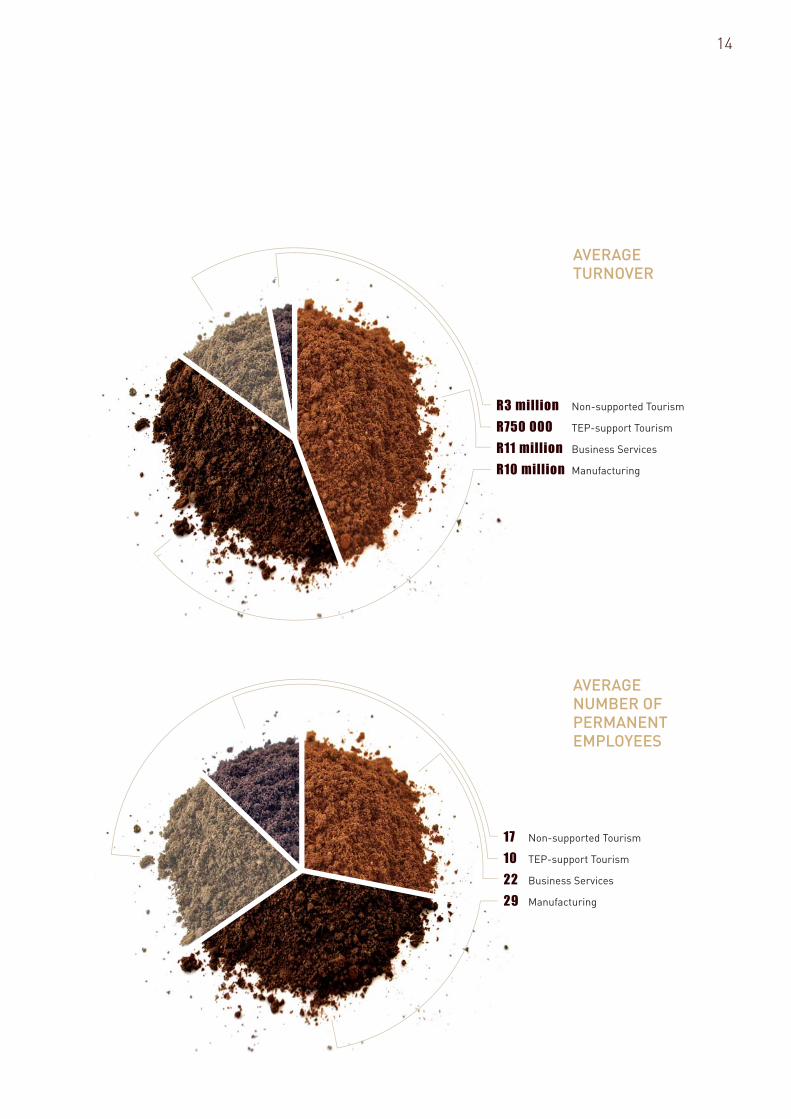
17 Non-supported Tourism
10 TEP-support Tourism
22 Business Services
29 Manufacturing
AVERAGETURNOVER
AVERAGENUMBER OF PERMANENT EMPLOYEES
14
R3 million Non-supported Tourism
R750 000 TEP-support Tourism
R11 million Business Services
R10 million Manufacturing
Co
nsu
ltan
t/free
lan
ce
r
No
pre
viou
s b
usin
ess e
xp
erie
nce
Em
plo
y ee
in p
ub
lic s
ecto
r
Em
plo
yee
in m
ed
ium
/larg
e firm
Em
plo
yee
in s
ma
ll bu
sin
ess
Invo
lved
in fa
mily b
usin
ess
Ow
ne
d a
no
the
r bu
sin
ess
0%
10%
20%
30%
40%
50%
15
CAREER HISTORY
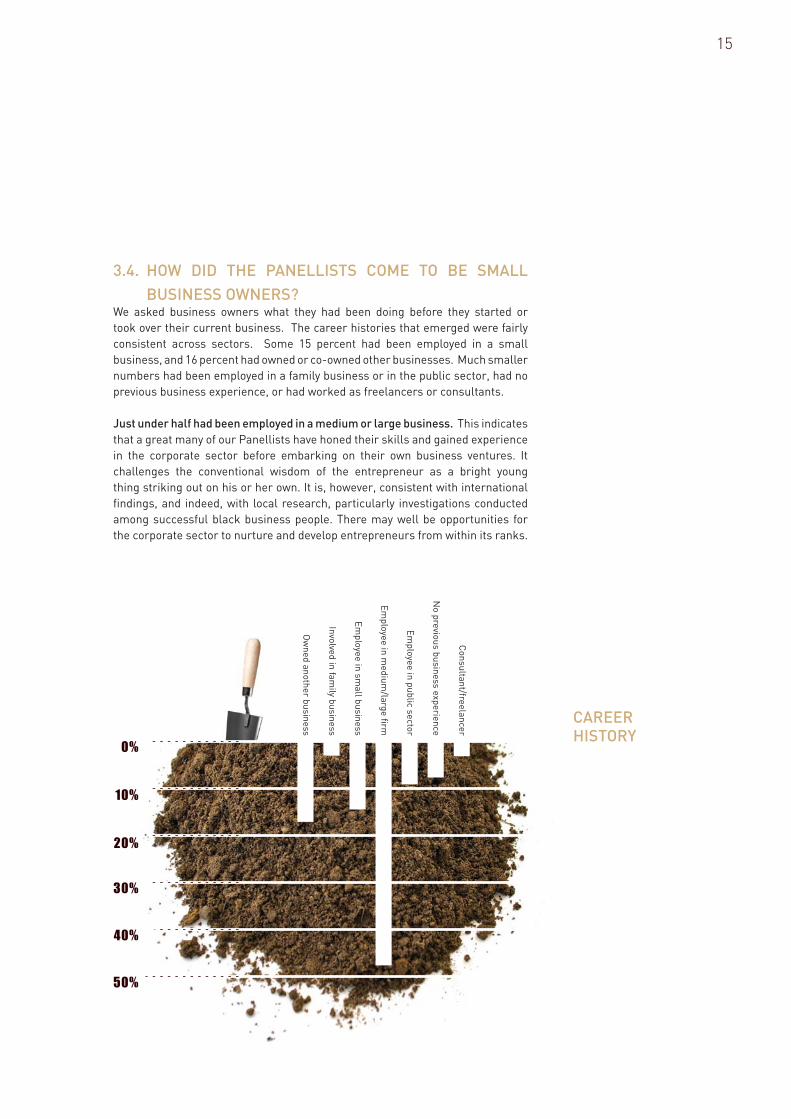
3.4. HOW DID THE PANELLISTS COME TO BE SMALL
BUSINESS OWNERS?We asked business owners what they had been doing before they started or
took over their current business. The career histories that emerged were fairly
consistent across sectors. Some 15 percent had been employed in a small
business, and 16 percent had owned or co-owned other businesses. Much smaller
numbers had been employed in a family business or in the public sector, had no
previous business experience, or had worked as freelancers or consultants.
Just under half had been employed in a medium or large business. This indicates
that a great many of our Panellists have honed their skills and gained experience
in the corporate sector before embarking on their own business ventures. It
challenges the conventional wisdom of the entrepreneur as a bright young
thing striking out on his or her own. It is, however, consistent with international
fi ndings, and indeed, with local research, particularly investigations conducted
among successful black business people. There may well be opportunities for
the corporate sector to nurture and develop entrepreneurs from within its ranks.

16
Almost 60% were
motivated by pull factors
We asked Panellists what had prompted them to start or buy their current
business. Almost 60 percent were motivated by pull factors. Of these, 20
percent had seen an opportunity to exploit, while 12 percent had always wanted
to own their own businesses, and had worked toward this. Some 14 percent had
achieved success in their chosen careers, and saw an opportunity to go out on
their own in that particular fi eld. In the tourism industry in particular, people
had been motivated by a passion for the sector, and had opened businesses as
a means of moving into the tourism industry. Four percent had taken over the
business in which they had previously been employed.
A fi fth of Panellists were motivated by situational factors – 11 percent had joined
the family business, four percent had owned several small businesses, and fi ve
percent were pulled along by circumstances.
A fi fth were motivated primarily by push factors – eight percent were tired of the
stress of the corporate world, six percent were concerned about job security, or
had been retrenched, four percent lacked alternatives, and two percent opened
small businesses to relocate to another city.
Overall, the picture that emerges across the Panel is one of opportunity based
entrepreneurship. Even among those motivated primarily by push factors,
many expressed positive sentiments towards small businesses ownership as
a career. This suggests that the viability of a fi rm is linked to the motivation
of the entrepreneur. This is not a novel insight, and has been identifi ed in
many local and international studies. It is however an important one – the
evidence strongly indicates that small businesses are more likely to survive
and thrive when the entrepreneur is motivated by pull factors. This implies
the need for educational strategies to go beyond the technicalities of business
and management training, into the manner in which education prepares
young people to seek opportunities, and – somewhat esoterically – to pursue
independence and initiative.
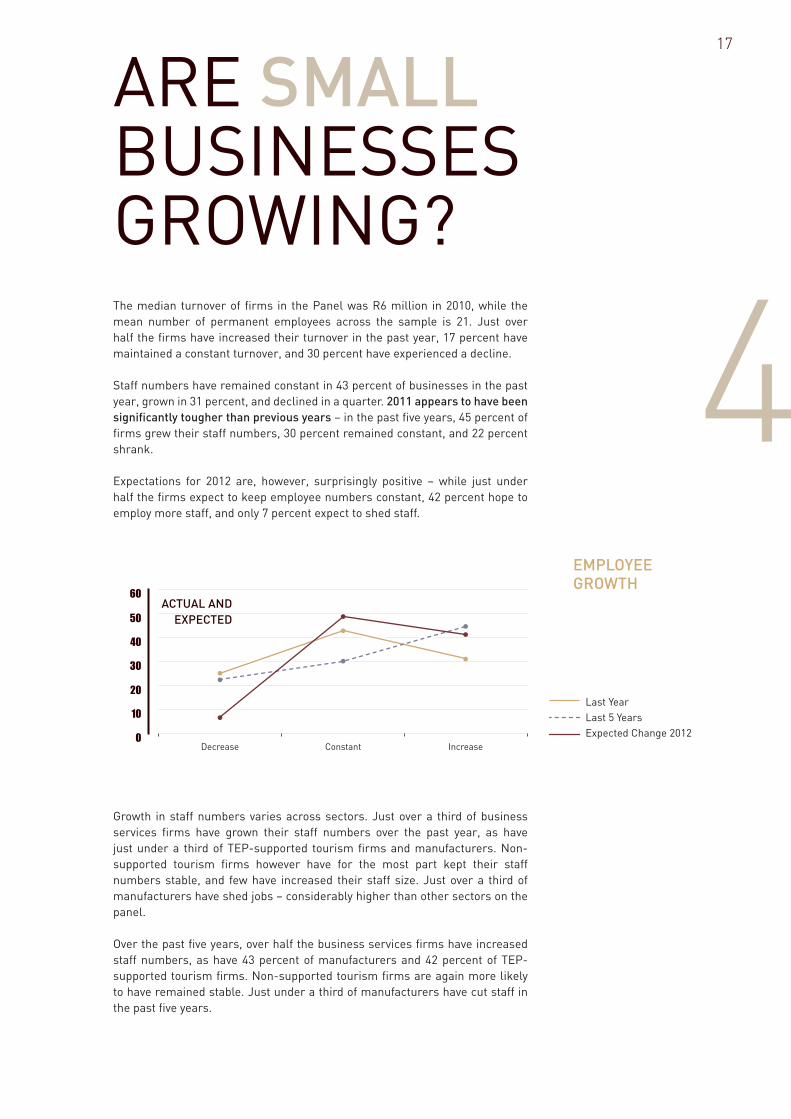
The median turnover of fi rms in the Panel was R6 million in 2010, while the
mean number of permanent employees across the sample is 21. Just over
half the fi rms have increased their turnover in the past year, 17 percent have
maintained a constant turnover, and 30 percent have experienced a decline.
Staff numbers have remained constant in 43 percent of businesses in the past
year, grown in 31 percent, and declined in a quarter. 2011 appears to have been
signifi cantly tougher than previous years – in the past fi ve years, 45 percent of
fi rms grew their staff numbers, 30 percent remained constant, and 22 percent
shrank.
Expectations for 2012 are, however, surprisingly positive – while just under
half the fi rms expect to keep employee numbers constant, 42 percent hope to
employ more staff, and only 7 percent expect to shed staff.
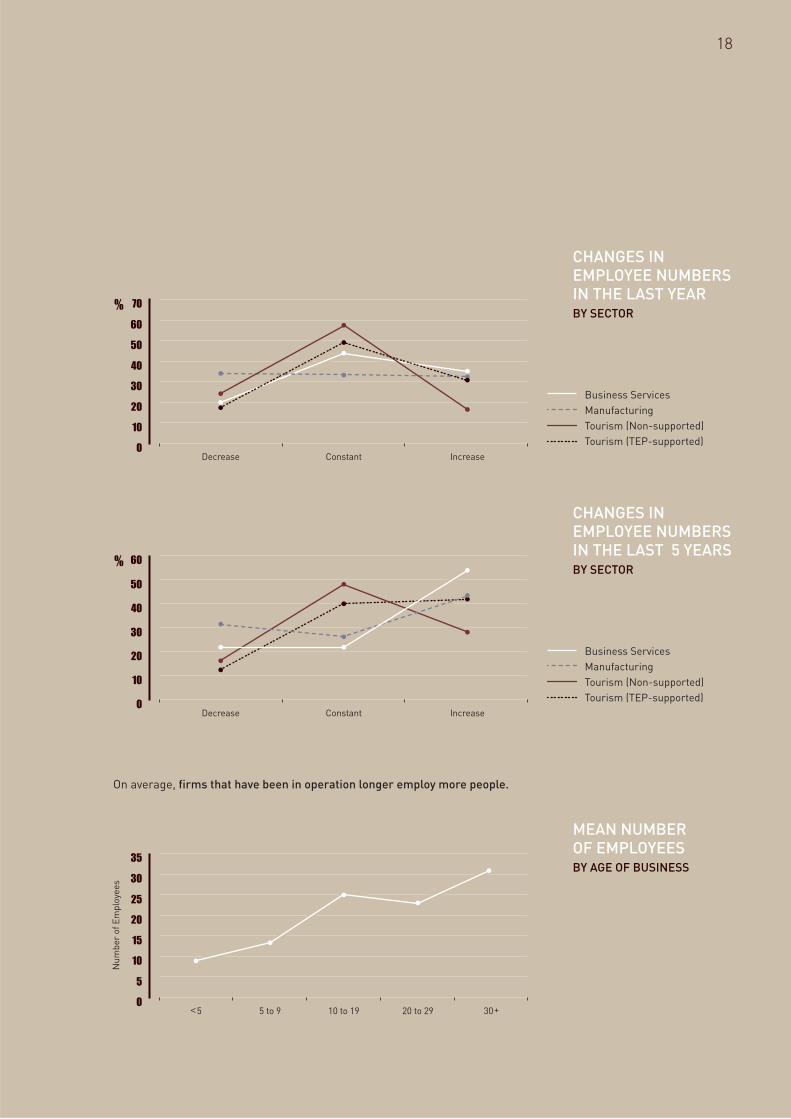
Growth in staff numbers varies across sectors. Just over a third of business
services fi rms have grown their staff numbers over the past year, as have
just under a third of TEP-supported tourism fi rms and manufacturers. Non-
supported tourism fi rms however have for the most part kept their staff
numbers stable, and few have increased their staff size. Just over a third of
manufacturers have shed jobs – considerably higher than other sectors on the
panel.
Over the past fi ve years, over half the business services fi rms have increased
staff numbers, as have 43 percent of manufacturers and 42 percent of TEP-
supported tourism fi rms. Non-supported tourism fi rms are again more likely
to have remained stable. Just under a third of manufacturers have cut staff in
the past fi ve years.
4
ARE SMALL BUSINESSES GROWING?
60
50
Decrease Constant Increase
%
30
40
20
10
0
Last Year
Last 5 Years
Expected Change 2012
EMPLOYEEGROWTH
ACTUAL AND
EXPECTED
17
70
50
60
Decrease Constant Increase
%
30
40
20
10
0
Business Services
Manufacturing
Tourism (Non-supported)
Tourism (TEP-supported)
60
50
Decrease Constant Increase
%
30
40
20
10
0
Business Services
Manufacturing
Tourism (Non-supported)
Tourism (TEP-supported)
On average, fi rms that have been in operation longer employ more people.
35
30
<5 5 to 9 10 to 19 20 to 29 30+
Nu
mb
er
of
Em
plo
yee
s
15
20
25
10
5
0
CHANGES IN EMPLOYEE NUMBERS IN THE LAST YEAR
CHANGES IN EMPLOYEE NUMBERS IN THE LAST 5 YEARS
MEAN NUMBER OF EMPLOYEES
BY SECTOR
BY SECTOR
BY AGE OF BUSINESS
18
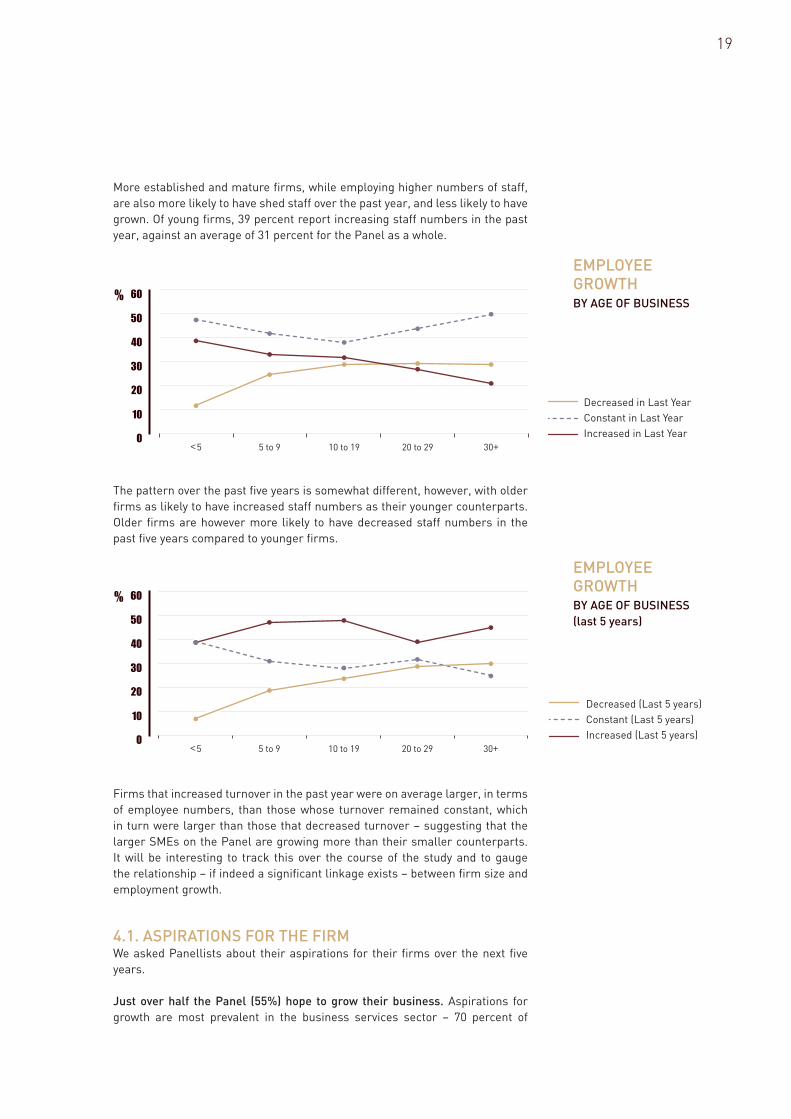
More established and mature fi rms, while employing higher numbers of staff,
are also more likely to have shed staff over the past year, and less likely to have
grown. Of young fi rms, 39 percent report increasing staff numbers in the past
year, against an average of 31 percent for the Panel as a whole.
The pattern over the past fi ve years is somewhat different, however, with older
fi rms as likely to have increased staff numbers as their younger counterparts.
Older fi rms are however more likely to have decreased staff numbers in the
past fi ve years compared to younger fi rms.
Firms that increased turnover in the past year were on average larger, in terms
of employee numbers, than those whose turnover remained constant, which
in turn were larger than those that decreased turnover – suggesting that the
larger SMEs on the Panel are growing more than their smaller counterparts.
It will be interesting to track this over the course of the study and to gauge
the relationship – if indeed a signifi cant linkage exists – between fi rm size and
employment growth.
4.1. ASPIRATIONS FOR THE FIRMWe asked Panellists about their aspirations for their fi rms over the next fi ve
years.
Just over half the Panel (55%) hope to grow their business. Aspirations for
growth are most prevalent in the business services sector – 70 percent of
60
40
50
<5 5 to 9 10 to 19 20 to 29 30+
%
30
20
10
0
Decreased in Last Year
Constant in Last Year
Increased in Last Year
60
40
50
<5 5 to 9 10 to 19 20 to 29 30+
%
30
20
10
0
Decreased (Last 5 years)
Constant (Last 5 years)
Increased (Last 5 years)
EMPLOYEEGROWTH
EMPLOYEEGROWTH
BY AGE OF BUSINESS
BY AGE OF BUSINESS
(last 5 years)
19
business services Panellists have plans for fi rm growth. Some 57 percent of
the TEP-supported tourism fi rms are hoping to grow their businesses. The
numbers are lower among the manufacturing fi rms – only 49 percent plan
to grow, and very low among non-supported tourism fi rms, of whom only 29
percent hope to grow over the next fi ve years.
Panellists were also asked to comment on their longer term plans for the fi rm,
thinking about the next ten to twenty years. Some 45 percent hope to continue
to grow the business. Again, business services fi rms are more confi dent of
long-term growth than fi rms in other sectors – 44 percent expect to grow over
the next ten to twenty years, compared to 31 percent of manufacturing fi rms,
and 33 percent of non-supported tourism fi rms. TEP supported tourism fi rms
are much more confi dent than their non-supported counterparts – 66 percent
of TEP-supported fi rms expect to grow.
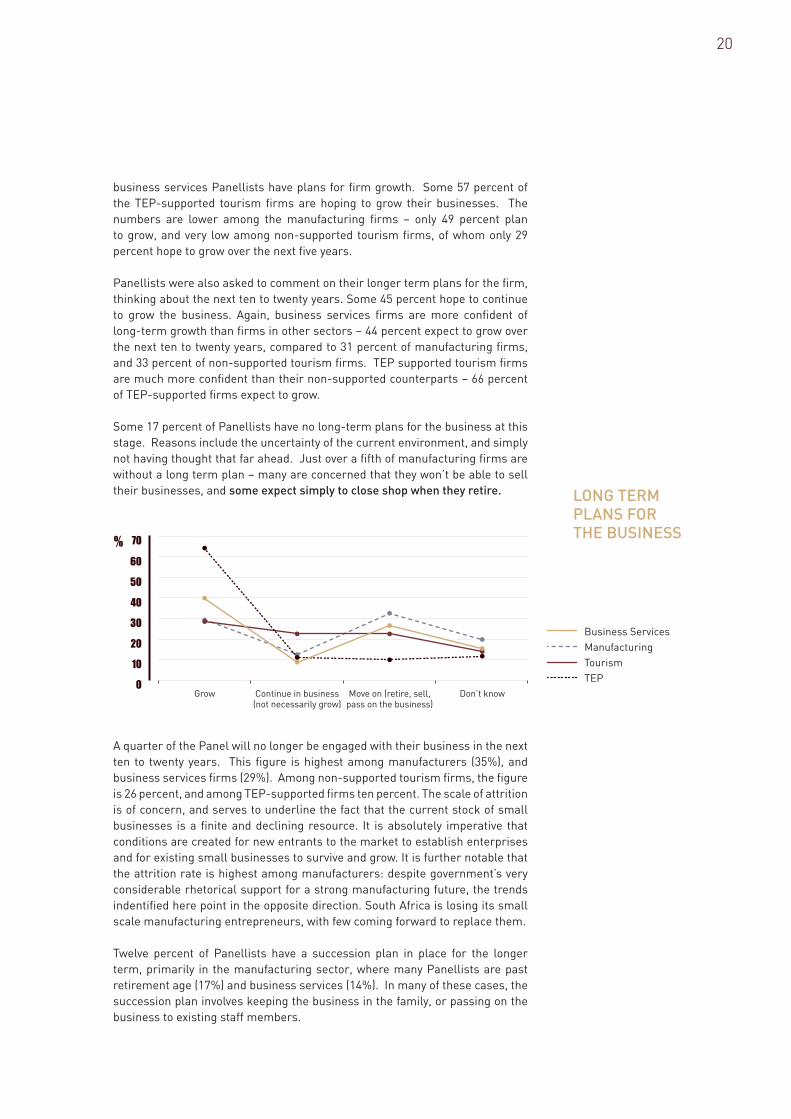
Some 17 percent of Panellists have no long-term plans for the business at this
stage. Reasons include the uncertainty of the current environment, and simply
not having thought that far ahead. Just over a fi fth of manufacturing fi rms are
without a long term plan – many are concerned that they won’t be able to sell
their businesses, and some expect simply to close shop when they retire.
A quarter of the Panel will no longer be engaged with their business in the next
ten to twenty years. This fi gure is highest among manufacturers (35%), and
business services fi rms (29%). Among non-supported tourism fi rms, the fi gure
is 26 percent, and among TEP-supported fi rms ten percent. The scale of attrition
is of concern, and serves to underline the fact that the current stock of small
businesses is a fi nite and declining resource. It is absolutely imperative that
conditions are created for new entrants to the market to establish enterprises
and for existing small businesses to survive and grow. It is further notable that
the attrition rate is highest among manufacturers: despite government’s very
considerable rhetorical support for a strong manufacturing future, the trends
indentifi ed here point in the opposite direction. South Africa is losing its small
scale manufacturing entrepreneurs, with few coming forward to replace them.
Twelve percent of Panellists have a succession plan in place for the longer
term, primarily in the manufacturing sector, where many Panellists are past
retirement age (17%) and business services (14%). In many of these cases, the
succession plan involves keeping the business in the family, or passing on the
business to existing staff members.
70
50
60
Grow Continue in business(not necessarily grow)
Move on (retire, sell, pass on the business)
Don’t know
%
30
40
20
10
0
Business Services
Manufacturing
Tourism
TEP
LONG TERM PLANS FOR THE BUSINESS
20

21
CHALLENGES TO BUSINESS GROWTH
5No
pla
ns to
exp
an
d, fu
lly sta
ffed
Sk
ills c
ha
llen
ge
s
La
bo
ur re
gu
latio
ns
Fin
an
cia
l co
nstra
ints
/ca
sh
flow
0%
5%
10%
15%
20%
25%
30%
35%
40%
Ba
d e
co
no
mic
co
nd
ition
s,
de
clin
e in
bu
sin
ess/w
ork
loa
d
5. CHALLENGES TO BUSINESS GROWTHWe asked Panellists to identify the main factors that prevent them from growing
their employee numbers.
ECONOMIC CLIMATE
Panellists identify the current economic climate as the primary barrier to
employment growth and job creation. Almost 40 percent of Panellists describe
the economic slowdown, and the resulting decline in volumes of business, as a
critical barrier to growth.
The economic decline has hit the tourism industry hardest in terms of prospects
for job creation – 40 percent of tourism panellists say that lack of demand and
slowing down of business prevents them from hiring additional staff. This is
not surprising, as spending on leisure activities is discretionary, non-essential,
and therefore highly elastic. The tourism industry across the world has been
similarly affected.
TOP 5 FACTORS DISCOURAGING EXPANSION OF STAFF NUMBERS

45
40
Economic decline
Cash flow Inflexible labour laws
High minimum wage
Lack of skills Fully staffed
%
35
30
25
15
20
10
5
0
Business Services
Manufacturing
Tourism
FACTORS DISCOURAGING INCREASE IN STAFFBY SECTOR
The manufacturing sector is not far behind, at 37 percent. Some manufacturers
note that they may have to retrench staff in the near future if business does
not pick up. As one said: “We don’t have enough business coming in to hire.
Running costs have increased, particularly as a result of electricity hikes, and
we can’t recover those costs from clients. I’ve met with the union and have
agreed that if someone leaves, we will not be replacing.” Another commented:
“We could actually cut back on permanent staff, but we don’t want to, because
they have helped us build up the business. Confi dence is better in the business
services sector, where 30 percent of respondents report economic decline and/
or a slowing of business as a barrier to employing more staff.
Related to the constraints imposed by the economic climate are concerns
about cash fl ow. Some 12 percent of Panellists say that their biggest obstacle
to increasing employment is uncertainty around cash fl ow, which makes
increasing employee numbers too risky. One Panellist phrased these concerns
thus: “I worry about overheads getting too high as workfl ow is not constant.
A business of this size can not afford to be overstaffed.” Panellists report a
preference for outsourcing, contracting or bringing in casual staff as and when
the need arises. Concerns about cash fl ow and fi nancial constraints are most
prevalent among tourism panellists (18%), compared to business services
(12%) and manufacturing (6%).
22
Almost 40% of Panellists describe
the economic slowdown, and the
resulting decline in volumes of business,
as a critical barrier to growth
LABOUR ENVIRONMENT
If there is a single issue that ignites ideological and political passions in
discussing SMEs, it is the impact of labour legislation. In our panel, just short of
one in fi ve (19%) say that labour regulations are the biggest barrier to growing
their staff numbers. Critical issues include the infl exibility of labour laws,
infl ated staff costs, diffi culties with the unions and strikes.
Challenges in respect of labour laws were identifi ed repeatedly by Panellists
as a restraint on business growth. In a separate question about regulatory
challenges to growing their businesses, a third identifi ed infl exible labour laws
(and the diffi culty of getting rid of staff in particular), as a critical regulatory
challenge. Panellists also identifi ed the need for more fl exible labour laws as
one of the top ten priorities for government action to support SME growth.
Challenges associated with the infl exibility of labour laws are most pronounced
in the manufacturing sector. A quarter of manufacturing Panellists identify
infl exible labour regulations as a critical barrier to employment. Over half
(56%) of manufacturing Panellists report that labour regulation is a major
regulatory barrier to business growth.
Among business services Panellists, 13 percent identify labour legislation as a
key barrier to employment growth, and 25 percent identify labour regulations
as the major regulatory constraint to business growth.
Tourism companies are much less likely to be concerned with the infl exibility
of labour laws as a barrier to employment (a fi fth describe themselves as fully
staffed with no plans to grow). Sixteen percent do however identify labour
legislation as the major regulatory barrier to business growth.
These differentials probably relate to the different natures of industrial relations
in the various sectors. Manufacturing is a sector with far greater potential for
organisation and union penetration, not to mention the collective bargaining
regime (touched on below) than the service industries. Manufacturing has a
totemic signifi cance to government in terms of the New Growth Path, as well as
to the ruling party’s trade union allies as a driver of “real” growth and “decent
jobs.” Government’s long-standing refusal to contemplate a more fl exible
labour legislation framework looks unlikely to waver, however.
Business owners stress that to survive as small businesses they need to
stay fl exible in terms of their staffi ng arrangements, but that South Africa’s
labour legislation makes this extremely diffi cult. The diffi culty and expense
involved in making staff redundant in response to decreasing volumes of work
makes Panellists very reluctant to take the risk of hiring people. Panellists
also report that it is overly diffi cult and costly to get rid of under-performing or
unsatisfactory staff. This frustration is evident here: “You have to get the right
23
person fi rst time, because you can’t get rid of someone if they turn out to be
a mistake. We would defi nitely hire more people, particularly at lower skills
levels, if the laws weren’t so rigid.”
The extent to which legislation allows for a probation period is perceived to
be insuffi cient. Employers suggest that a three month probation period is too
short. According to one Panellist, “you spend a great deal of that time training
people to acquire the necessary skills, only to conclude after 4 to 6 months that
the person is not right for the position – and then it’s too late.”
Business owners indicate a preference for paying existing staff overtime, and/
or fi nding ways to make existing staff more productive, rather than taking on
new people, which is seen as a high risk choice.
Small business owners work closely with their staff, and would like more
fl exibility in terms of how the employer and employee structure their working
arrangements. Some suggest for example that they would like to be able to
pay their staff more and have them work longer hours during busy periods, but
that concerns about labour law infringements, or a backlash from the unions,
prevent this.
Industry-negotiated wage increases and the extension of collective bargaining
agreements to small businesses are a signifi cant barrier to increasing
employment in the manufacturing sector. Ten percent of manufacturing
panellists report that high wage levels are the major barrier to hiring more
employees. The problem is particularly severe for businesses governed by
bargaining council agreements. Said one Panellist: “Labour demands for
increased wages, and strikes, have a huge impact. There is no recognition
that small business and big business can’t pay the same. Businesses have
to be able to pay their workers according to that worker’s productivity. If the
machine you’re operating is smaller and producing less than the machine your
counterpart in a big business is earning, you have to be paid in proportion to the
work you’re producing.”
Another commented: “I would happily hire someone to sweep the fl oors in the
tool room, but the minimum wage makes it impossible. So the toolmakers have
to sweep their own fl oors. That means the sweeper doesn’t get a foot in the
door, so he doesn’t get the potential opportunity to skill up and get a better
paying position in time.”
Some manufacturers report that as a result of anticipated industry wage hikes,
and the rising cost of inputs such as electricity and raw materials, they have
to look at mechanisation as an alternative to growing staff numbers. This
stands to impact most dramatically on the lower-skilled end of the employment
24
25% of manufacturing Panellists
identify infl exible labour regulations
as a critical barrier to employment

market. In the words of one Panellist: “The kind of work is unskilled, repetitive
and routine. But the unions are insisting on 10 percent increases every year
for the next three years. We’ll have to bring in more automation, even though it
means we’ll have to let some people go.”
Other concerns include:
• Restrictions on the use of limited-term contracts, which limits fl exibility.
One of the Panellists put it in these terms: “There is no recognition that
staff needs go up and down with business fortunes - you are just stuck with
them. Small businesses can’t work that way.”
• The CCMA, which is seen as overly favourable to employees and very costly.
Employers report that they are very careful to do everything by the book
in order to minimize the threat of CCMA action. This is however very time-
consuming in terms of paperwork and keeping a clear audit trail. Several
Panellists say that they employ labour dispute management companies, or
have labour lawyers on retainer, because of the risk created by the labour
legislation and the threat of CCMA cases. Said one: “The diffi culty of fi ring
people and threat of CCMA is a huge disincentive to hiring. If someone is
under-performing on the job, it takes months to build up the fi le, and the
employees know all the rules so they know how to play you. You can’t say
someone can’t do the job, because the CCMA will tell you to train them.”
• The administrative burden associated with collection of the various taxes
and insurances payable for employees
• The disincentive to grow the staff body to a size which would see it
becoming unionised, owing to the cost implications associated with
regular negotiated wage increases.
Presently, a raft of new legislative amendments are under consideration,
including proposals to limit opportunities for ‘atypical employment’ such as
contracting and fl exible working. The net effect is likely to further to tighten
labour legislation, and to exacerbate the challenges identifi ed by SMEs
on the Panel. The response among SMEs may well be further limitation
of their exposure to the labour market, thus limiting fi rm growth and hiring
opportunities.
SKILLS CHALLENGES
That South Africa faces a debilitating skills shortage is generally accepted.
Some years ago, the then Deputy President, Phumzile Mlambo-Ngcuka phrased
it succinctly: “the most fatal constraint to shared growth is skills”. Although
falling behind market conditions and labour legislation, concerns about skills
feature prominently among the Panellists: 11 percent identify skills shortages
as a major barrier to employment creation. The key problems include: a
scarcity of required skills; diffi culties fi nding ‘the right fi t’; and the high salaries
demanded by skilled staff.
25
40 % of business services
fi rms report that fi nding staff with
the required skills and practical
experience is a major challenge

The types of skills most commonly identifi ed by Panellists as being in short
supply include:
• Basic literacy and numeracy
• Basic science and maths
• Financial services – Insurance, Book-keeping, CA Trainees
• IT services/ technical support/ consulting, software development,
programming, multi-media web design
• Engineering (systems integration and design)
• Talented sales/marketing staff (manufacturing and business services
sectors)
• Printing
• Machine operators
• Technical skills in the manufacturing sector
• Tool-making and
• Administrative staff.
This list should be of great concern. Certainly, much of the scarcity relates
to high-end artisanal and professional skills, while others are dispositional
in nature. Problems with the availability of basic literacy, numeracy and
mathematical skills point to an altogether more serious systemic problem: the
failure of the education system to perform some of its most basic functions.
Our study reinforces what has been indentifi ed elsewhere. The quality of South
Africa’s basic maths and science education is consistently rated extremely
poorly in the World Competitiveness Report. This prompts concerns about
the country’s ability to maintain its current level of development, let alone to
signifi cantly expand its economy.
A large majority of Panellists (85%) report that they have initiatives in place
to develop employee skills. There is considerable dissatisfaction with the
SETA system, in respect of the types of training offered to businesses, and
the paperwork and delays involved in claiming back skills development levy
contributions.
Skills shortages are particularly problematic for the business services fi rms,
where employers are looking for high-level, specialised skills. Some 40 percent
of business services fi rms report that fi nding staff with the required skills and
practical experience is a major challenge, and takes a great deal of time. Just
under a fi fth of business services Panellists describe the cost of training as a
major challenge.
Ten percent of business services Panellists report that infl ated expectations
among younger people is a signifi cant challenge – people with limited skills
and experience, often fresh from studying, have exaggerated expectations of
what they can do, and what they should be paid. Concerns around attitudes
26

more broadly, and fi nding the appropriate fi t with the company, is another key
concern, as is the underdevelopment of ‘soft skills’ which enable employees to
engage appropriately with clients.
The scarcity of skills, particularly in the IT sector and business services more
broadly, translates directly into the high cost of skills. Broad-based black
economic empowerment (BBBEE) is also a key concern. Panellists note that
they are reluctant to employ white or Indian people because of the need to
comply with BEE requirements, but that they fi nd it diffi cult to identify suitable
black candidates, and that skilled black candidates command much higher
salaries than other staff. Black candidates are also perceived to be highly
mobile – once they have gained skills and experience in a small fi rm, they
are quickly recruited to larger companies, which can offer higher salaries and
more benefi ts.
Manufacturing Panellists report shortages in technical skills as a key concern.
The cost of training, particularly artisan staff, is also a key challenge. There is
also signifi cant concern about the defi ciencies of basic education among the
workforce – fi fteen percent of manufacturing respondents noted that basic
literacy and numeracy skills are very low, which creates challenges for on the
job training.
The lack of industry standards undermines confi dence in qualifi cations
versus actual skill levels, and there appears to be a shortage of appropriate
training options available to skill up semi-skilled manufacturing staff. Other
concerns include a perceived lack of interest/ unwillingness among low-skilled
workers to take advantage of training opportunities – there is a perception that
employees want wages and benefi ts to rise, without being willing to take on
responsibilities associated with more skilled tasks. The extent to which staff
in the manufacturing sector – both skilled and unskilled – are ageing, and not
necessarily being replaced by a younger generation of workers, is also cause
for concern. The output of qualifi ed artisans has fallen quite catastrophically
over the past few decades.
27
32% of Panellists identifi ed labour
regulations, and in particular the
diffi culties associated with getting rid of
staff, as the major regulatory hurdle to
business growth
5.1. THE REGULATORY ENVIRONMENTThe regulatory burden on small fi rms is a familiar theme among business
analysts, who generally agree that small fi rms are more vulnerable to
regulatory costs (in money or effi ciency) than their larger counterparts. SBP
has previously argued that South Africa’s regulatory environment is signifi cantly
more expensive than that of its peer countries, and that this consumes valuable
economic nutrients that might otherwise nourish the economy. The government
acknowledges the importance of moderating the regulatory burden, but its
efforts have been halting and indecisive – leading some commentators to
question whether it is serious about doing so.
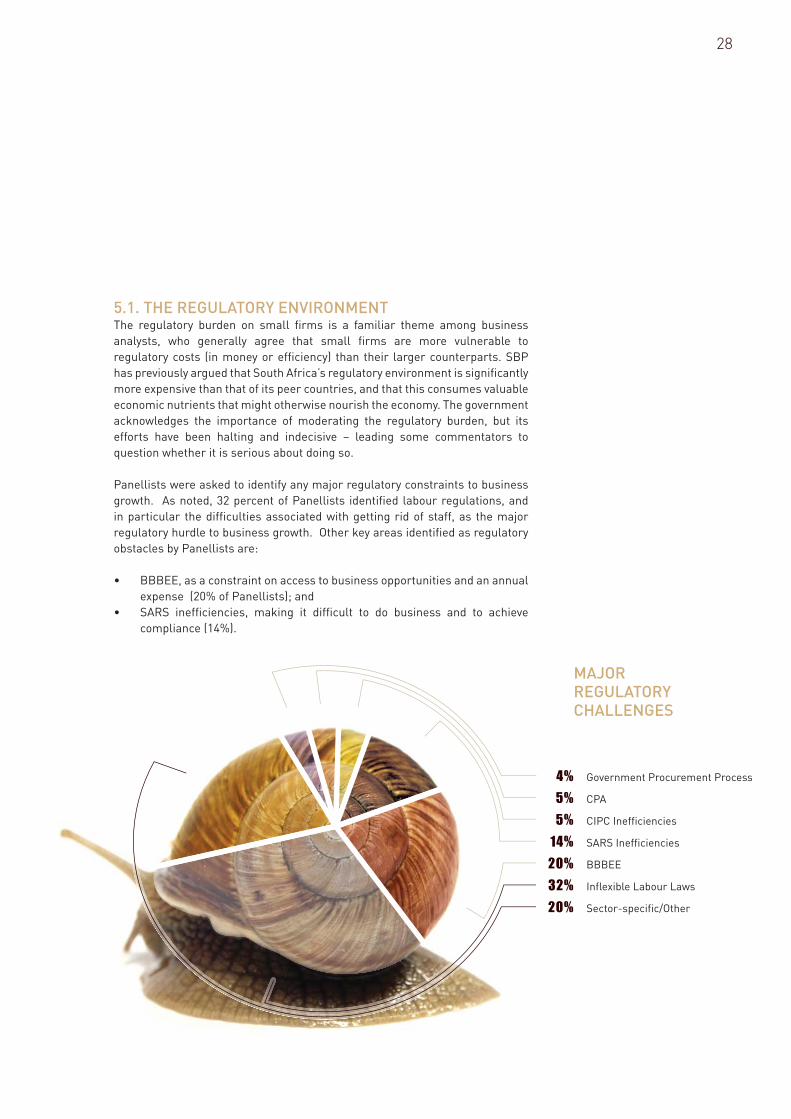
Panellists were asked to identify any major regulatory constraints to business
growth. As noted, 32 percent of Panellists identifi ed labour regulations, and
in particular the diffi culties associated with getting rid of staff, as the major
regulatory hurdle to business growth. Other key areas identifi ed as regulatory
obstacles by Panellists are:
• BBBEE, as a constraint on access to business opportunities and an annual
expense (20% of Panellists); and
• SARS ineffi ciencies, making it diffi cult to do business and to achieve
compliance (14%).
28
4% Government Procurement Process
5% CPA
5% CIPC Inefficiencies
14% SARS Inefficiencies
20% BBBEE
32% Inflexible Labour Laws
20% Sector-specific/Other
MAJOR REGULATORY CHALLENGES
BBBEE ACCREDITATION
A fi fth of Panellists identify BEE as a major constraint on business growth.
The extent to which BEE is perceived as a constraint varies signifi cantly across
sectors. Thirty percent of business services fi rms identifi ed BEE as a critical
challenge, compared to a quarter of manufacturing fi rms, and only six percent
of tourism fi rms.
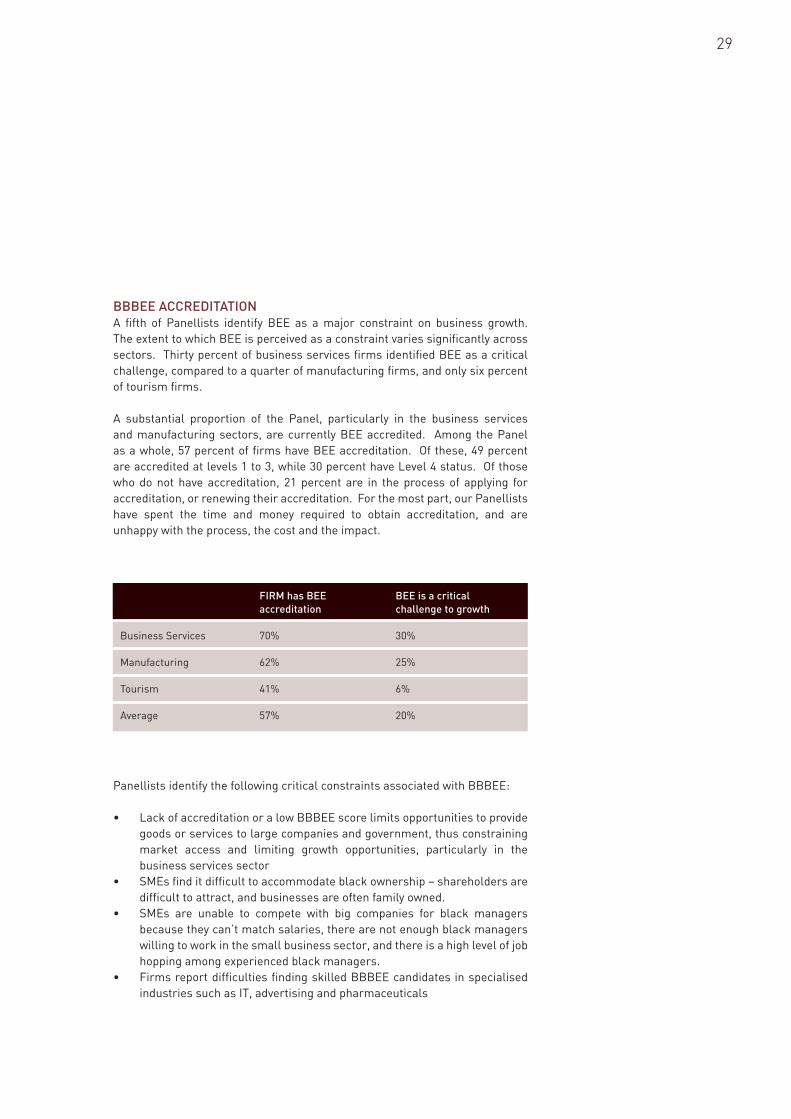
A substantial proportion of the Panel, particularly in the business services
and manufacturing sectors, are currently BEE accredited. Among the Panel
as a whole, 57 percent of fi rms have BEE accreditation. Of these, 49 percent
are accredited at levels 1 to 3, while 30 percent have Level 4 status. Of those
who do not have accreditation, 21 percent are in the process of applying for
accreditation, or renewing their accreditation. For the most part, our Panellists
have spent the time and money required to obtain accreditation, and are
unhappy with the process, the cost and the impact.
Panellists identify the following critical constraints associated with BBBEE:
• Lack of accreditation or a low BBBEE score limits opportunities to provide
goods or services to large companies and government, thus constraining
market access and limiting growth opportunities, particularly in the
business services sector
• SMEs fi nd it diffi cult to accommodate black ownership – shareholders are
diffi cult to attract, and businesses are often family owned.
• SMEs are unable to compete with big companies for black managers
because they can’t match salaries, there are not enough black managers
willing to work in the small business sector, and there is a high level of job
hopping among experienced black managers.
• Firms report diffi culties fi nding skilled BBBEE candidates in specialised
industries such as IT, advertising and pharmaceuticals
29
FIRM has BEE BEE is a critical
accreditation challenge to growth
Business Services 70% 30%
Manufacturing 62% 25%
Tourism 41% 6%
Average 57% 20%
Panellists report that the turnover thresholds for exemption are set too low,
and that annual infl ation and increases in the costs of inputs can quickly place
a business above the threshold, without the business actually having ‘grown’
at all. Some Panellists indicate that they have ensured that turnover remains
below R5 million, in order to stay on the right side of the compliance threshold.
In this way, BBBEE has actually acted as a direct disincentive to growth.
There is considerable dissatisfaction with the high cost of annual accreditation.
Panellists note that there are very often limited benefi ts to accreditation,
in relation to the cost of compliance. The administrative burden and time
associated with the process is also perceived as being very onerous.
Panellists also raise concerns about the narrowness of BBBEE, which is
perceived to benefi t the individuals brought in as partners, while failing to
achieve ‘broad-based’ benefi ts. There is also a perception among some
Panellists that BBBEE is used as a justifi cation to award contracts to well
connected people - whether or not they can actually deliver.
Panel members whose fi rms are not currently accredited were asked to
comment on why they were not accredited. Some 22 percent report they were
under the threshold required for accreditation and are therefore exempt.
Another 28 percent say that accreditation offers no benefi t to their business. A
further six percent report that they are trying to be compliant, but that meeting
the criteria - fi nding the right partners and employees - is too diffi cult for small
fi rms. Interestingly, 10 percent are against the principle of BEE - this includes
both black and white respondents.
Capturing the concerns about BEE, one black Panellist said: “I don’t see why
I should pay people to say that I’m black. We need to be clear that we’re doing
things for right reasons - creating skills and improving the country. We should
move on from the past and treat people equally.”
These fi ndings should provide some fuel to the ongoing debate around the
trajectory of BBBEE. It seems quite clear that there are both perceptual issues
associated with BBBEE as well as very real economic costs. This cannot be
ignored, and there is every reason for pause in considering new legislation,
such as the possibility of introducing crippling fi nes for failure to comply with
empowerment demands.
30
Among the Panel as a whole,
57% of fi rms have BEE
accreditation

SARS INEFFICIENCIES
About a fi fth of business services fi rms say that SARS is a major problem, as do
15 percent of manufacturing fi rms, and eight percent of tourism fi rms. Primary
concerns are as follows:
• Refunds take a very long time. One Panellist reported that “We have
been waiting two years for a R380 000 from SARS, for a VAT rebate on
the purchase of our new property. Lack of access to that money stops us
taking opportunities, and there doesn’t seem to be any progress”
• SARS is very slow to respond to queries and problems – but allows no
leeway to businesses when they have been wrongly charged. Capturing
these concerns, one Panellist said: “Three months ago, SARS triple
debited us by mistake. It was a huge blow to our cash fl ow, and still hasn’t
been rectifi ed. But SARS insists that we still have to pay our full monthly
fees – they don’t seem to care that their errors wipe out cash fl ow”
• Documents are frequently lost, requiring the business owner to go to the
SARS offi ce in person to get things done
• The call centre is perceived as being very ineffi cient
• Online returns often don’t work
• VAT registration is a big challenge
• Tax clearance certifi cates take a long time to issue – which impacts on
fi rms’ ability to submit tenders
• Procedures and formats change frequently, making it diffi cult to keep up
with what is required
• PAYE reconciliation is problematic – as this is one of the primary fi elds
of interaction between business people and SARS, its consequences are
profound. One Panellist complained that: “Almost every day SARS issues
a new version of PAYE reconciliation that is supposed to fi x the problems.
We spent 20 percent of admin time in April trying to get it to work”
• SARS is perceived as being overly punitive and of failing to support small
business. Thus, one aggrieved Panellist said: “Our fi rm recently made
a small admin error on our submission - we were told we had to pay
R100,000 fi ne, and were threatened with the company being shut down.
Isn’t SARS interested in what happens to people’s jobs when you shut
companies down? It was an honest mistake and we fi xed it immediately-
but SARS always wants to beat you up”
• Provisional tax drains companies of their cash fl ow, because it is charged
on gross income – as one Panellist said: “A business makes a loss in year
1, probably also in year 2, and then in year 3 they have to pre-pay next
year’s tax based on the previous year in cash. That comes straight out of
the funds they need to grow the business and stops them in their tracks”
• Charging VAT on invoices, rather than on receipts, drains cash fl ow and is
particularly damaging when clients pay late
• The requirement that every employee, no matter how temporary, has to
have a tax number is problematic, particularly for advertising agencies
working with hundreds of models and ‘extras.’
31

5.2. FINANCEAccess to fi nance did not emerge as a critical barrier to expansion of staff
numbers, but the prevailing perception across the Panel is that banks are not
willing to lend to small businesses, and that fi nancial assistance programmes
provided by government departments and agencies such as the IDC are
administratively over-complex and thus largely inaccessible. For the most part,
Panellists set up their businesses with their own savings, and continue to rely
on their savings and cash fl ow for capital investments.
Almost 60 percent of Panellists drew on their own fi nancial resources to start
their businesses. Some drew on personal savings, others cashed in redundancy
payouts or pensions, and some re-mortgaged their homes or relied on their
access bonds. A further eight percent relied on their own savings in conjunction
with a bank loan.
Only eight percent accessed bank funding as the primary source of funding
for business establishment. Some six percent relied on loans from family or
friends, and a further six percent on private investors or shareholders. Small
numbers had made arrangements with the previous business owner to pay
them off over a period of time on favourable interest rates, while two percent
had accessed government funding, such as an IDC loan.
32
6% Family Loan
6% Private Investors
3% Holding Company
1% Loan From Previous Owner
2% Govt Funds (IDC/Others)
9% None Needed
57% Own Savings
8% Bank Loan
8% Bank Loan + Own Funds
STARTING THE BUSINESS:SOURCES OF FUNDING
Almost 60% of Panellists drew on
their own fi nancial resources to start
their businesses
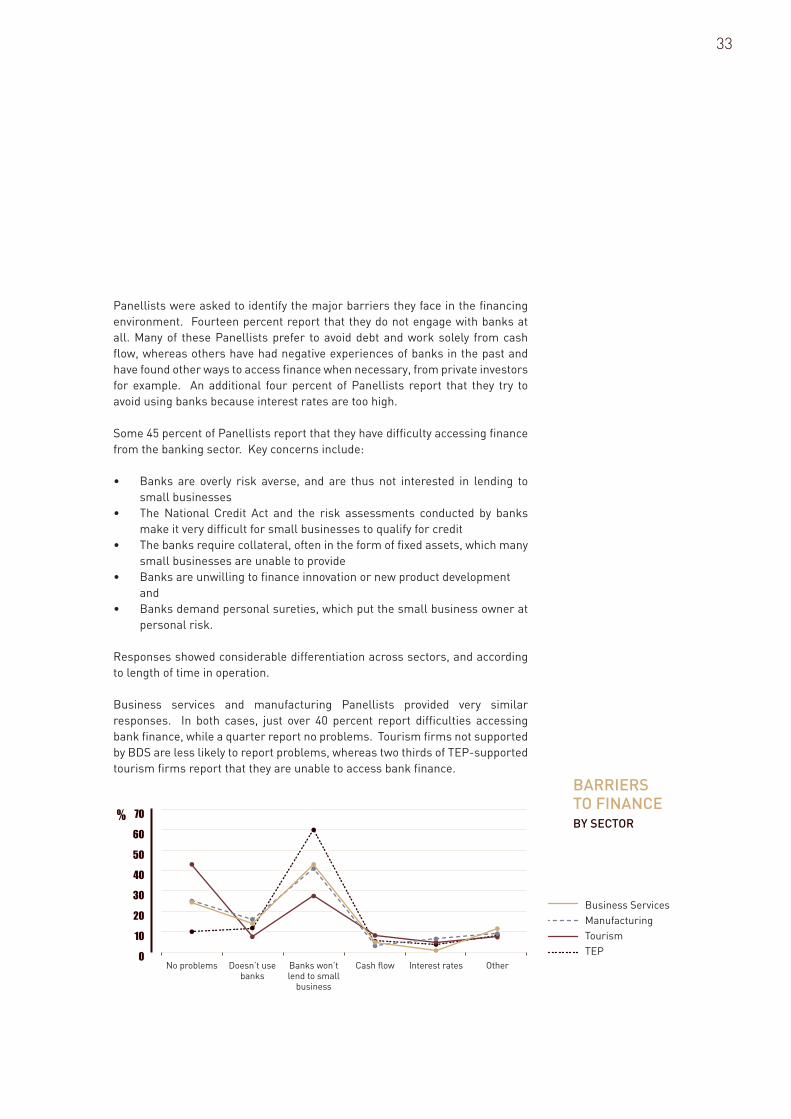
Panellists were asked to identify the major barriers they face in the fi nancing
environment. Fourteen percent report that they do not engage with banks at
all. Many of these Panellists prefer to avoid debt and work solely from cash
fl ow, whereas others have had negative experiences of banks in the past and
have found other ways to access fi nance when necessary, from private investors
for example. An additional four percent of Panellists report that they try to
avoid using banks because interest rates are too high.
Some 45 percent of Panellists report that they have diffi culty accessing fi nance
from the banking sector. Key concerns include:
• Banks are overly risk averse, and are thus not interested in lending to
small businesses
• The National Credit Act and the risk assessments conducted by banks
make it very diffi cult for small businesses to qualify for credit
• The banks require collateral, often in the form of fi xed assets, which many
small businesses are unable to provide
• Banks are unwilling to fi nance innovation or new product development
and
• Banks demand personal sureties, which put the small business owner at
personal risk.
Responses showed considerable differentiation across sectors, and according
to length of time in operation.
Business services and manufacturing Panellists provided very similar
responses. In both cases, just over 40 percent report diffi culties accessing
bank fi nance, while a quarter report no problems. Tourism fi rms not supported
by BDS are less likely to report problems, whereas two thirds of TEP-supported
tourism fi rms report that they are unable to access bank fi nance.
33
70
60
50
No problems Doesn’t use banks
Banks won’t lend to small
business
Cash flow Interest rates Other
%
40
30
20
10
0
Business Services
Manufacturing
Tourism
TEP
BARRIERS TO FINANCEBY SECTOR

Young fi rms experience far greater problems accessing fi nance. Across the
sectors, 60 percent of fi rms less than fi ve years old report diffi culties accessing
bank fi nance (54% of manufacturing and business services fi rms, 62% of
tourism fi rms). The number of fi rms reporting that they have no problems
accessing bank fi nance increases signifi cantly as fi rms get older – 30 percent
of fi rms over ten years old report no problems, compared to 19 percent of fi rms
operating between six and ten years, and just 10 percent of fi rms less than fi ve
years old.
The fi ndings here are important, as they challenge two apparently contradictory
claims simultaneously. The fi rst relates to the World Bank’s Ease of Doing
Business report, which suggests that access to credit in South Africa is among
the easiest in the world. Our fi ndings demonstrate that there are clearly
signifi cant hurdles facing small businesses in this regard.
Secondly, the notion that access to fi nance has been the most signifi cant brake
on small business has been infl uential in offi cial policy thinking. The SME Growth
Index suggests that while this certainly exerts an important infl uence, it is
neither the primary problem for growth, nor entirely decisive, nor evenly spread
throughout the businesses – especially when considering the age of fi rms. This
is in line with international experience: ready fi nance is an advantage, but not
one that an enterprising entrepreneur cannot overcome.
34
70
50
60
No problems Doesn’t use banks
Banks won’t lend to small business
Cash flow Interest rates
%
30
40
20
10
0
2 to 5
6 to 10
11 to 20
Over 20
BARRIERSTO FINANCEBY AGE OF FIRM
45 % of Panellists report that they
have diffi culty accessing fi nance from the
banking sector

5.3. SOURCING NEW STAFFGiven the perceived risk associated with taking on new employees, it is not
surprising to learn that Panel members rely heavily on personal referrals when
recruiting new staff. This is particularly the case for unskilled staff, whose
chances of securing a job are slim if they don’t have a referral from someone
within the business. Over half the Panellists rely on word of mouth and referrals
to recruit unskilled or semi-skilled staff. Referrals mostly come from current
staff members, family and friends. Around 16 percent advertise in the newspaper,
14 percent are approached by applicants, nine percent use recruitment agencies
or labour brokers, and nine percent use their professional networks.
35
14%
9%
9%
52%
16%
Approached By Applicant
Recruitment Agent/Broker
Professional Networks
Referrals/Word of Mouth
Newspaper Ads
SOURCING UNSKILLED STAFF
Over 50% the Panellists rely on
word of mouth and referrals to recruit
unskilled or semi-skilled staff
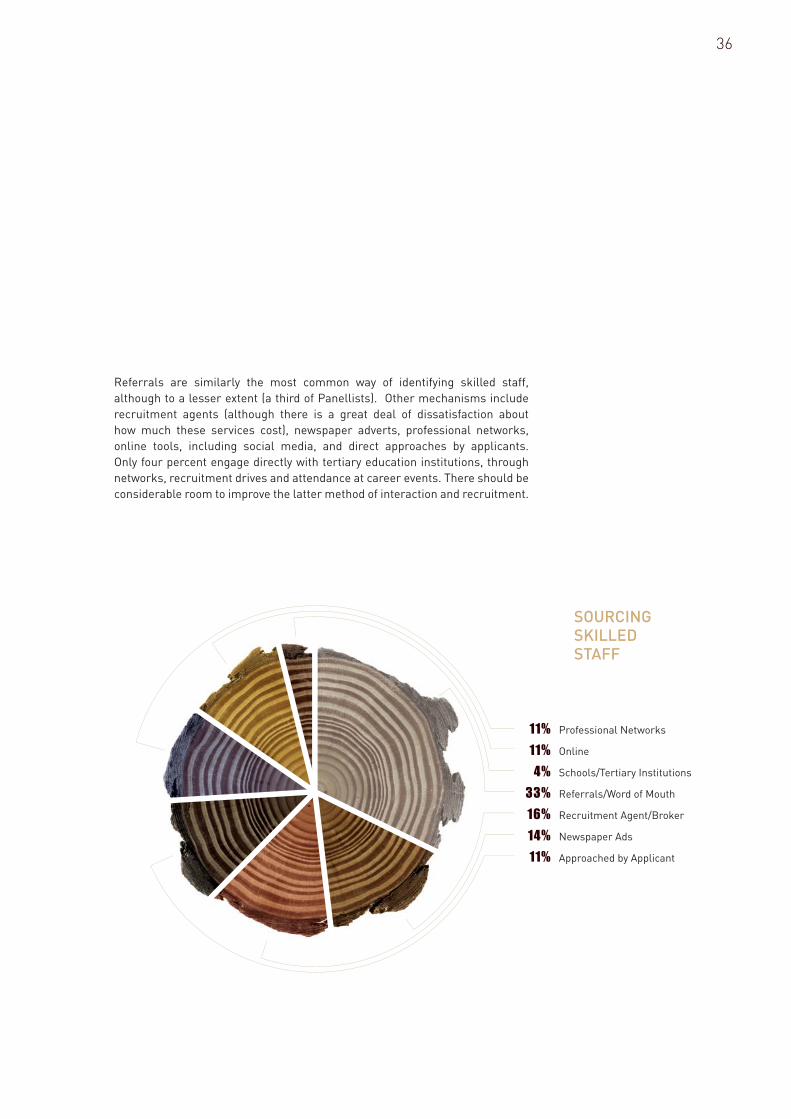
Referrals are similarly the most common way of identifying skilled staff,
although to a lesser extent (a third of Panellists). Other mechanisms include
recruitment agents (although there is a great deal of dissatisfaction about
how much these services cost), newspaper adverts, professional networks,
online tools, including social media, and direct approaches by applicants.
Only four percent engage directly with tertiary education institutions, through
networks, recruitment drives and attendance at career events. There should be
considerable room to improve the latter method of interaction and recruitment.
36
11% Professional Networks
11% Online
4% Schools/Tertiary Institutions
33% Referrals/Word of Mouth
16% Recruitment Agent/Broker
14% Newspaper Ads
11% Approached by Applicant
SOURCING SKILLED STAFF

IN THEIR OWN WORDS…
The SME Growth Index asked Panellists to identify the critical actions that
government needs to take in order to support small business growth and
employment generation. Panellists’ responses will be analysed in detail
in forthcoming SBP Alerts. For the moment, we shall discuss a few actions
that each of a number of interested parties can take to enrich the country’s
entrepreneurial soil. Our Panellists identifi ed the following factors (in order of
frequency of responses) as actions that they would like to see taken:
1. Reduce the cost and complexity of regulatory compliance
2. Improve administrative effi ciency within government in order to reduce
red tape
3. Create a level playing fi eld, ensuring that regulations are fairly and
consistently enforced
4. Develop more effi cient and accessible fi nancial instruments for the SME
sector
5. Create tax incentives for small businesses to grow employee numbers
6. Work with industry to facilitate the development of practical skills across
the labour force
7. Introduce more fl exibility in respect of labour laws
8. Rethink BEE
9. Make government procurement opportunities more accessible to small
businesses, streamline tender processes, improve transparency, and pay
on time
10. Create political stability, reduce the crime rate and address corruption in
government, as preconditions for attracting investment
37
WHAT IS TO BE DONE
6
The SME Growth Index is intended to contribute to the national conversation on
small business development. Beyond any sectoral message, or specifi c policy
change, three broad points suggest themselves.
Firstly, the national conversion needs to be informed by evidence. The data
available to date on small business has been too vague to make properly
informed decisions about policy and support. The SME Index is an attempt to
contribute to remedying this. Contributing to the stock of understanding is a
task for all interested parties.
Second, success tends to harvest success. Small businesses are part of the
broader social and economic system of the country. They are sensitive to the
environment in which they operate. There are few clear borders between the
factors that infl uence the sector and those that do not, even if some are clearly
more important than others. But defi ciencies in the education system, for
example, will likely manifest themselves in limitations on the performance of
small business, and the economy as a whole. This is both a point of general
social principle, and is supported by our fi ndings. South Africa’s prospects of
growing a robust small business economy will in all likelihood fl uctuate with
the success of the country as a whole.
Thirdly, small businesses are not charities, welfare measures or systems
to generate employment for its own sake. This needs to be kept fi rmly in
mind, and appears easily lost as policy makers have their eyes fi rmly on the
attendant social benefi ts. Such benefi ts are a happy by-product of healthy small
businesses’ seeking opportunities in a market, not their inherent objective.
Small businesses’ potential to grow – indeed to function at all – is no different
from that of their larger counterparts insofar as economic decisions must be
based on economic incentives. Imbuing small businesses with excessive moral
or ideological signifi cance is counterproductive. Small business is business,
fi rst and foremost.
38

MESSAGES TO GOVERNMENT
• Government needs to prioritise its micro-economic goals. At present,
promotion of employment, empowerment, and labour protection – to
name a few – are jockeying in an unviable mix. If the government’s goals
are centred on employment, and if it accepts – as it claims to, and as the
evidence suggests – that small business is a key to achieving this, then it
needs to be willing to ask whether this goal is more or less important than
others, and to alter the environment accordingly. At present, attempting to
address all goals at the same time seems to mean failing to achieve much
of any of them.
• Aspirations, policy and interventions need to be based on evidence. It
is decidedly unclear to what extent government is basing its outlook on
small business on the realities of small businesses and small business
people. For example, the stress on manufacturing sits uncomfortably with
an overall decline in the sector. Although state intervention can be a useful
stimulant to the sector, this is contingent upon it responding to real needs,
enabling real opportunities to be seized.
• The regulatory environment needs to be reformed. There is plenty of
evidence that the regulatory environment in particular, labour legislation
is proving an unwieldy burden. The recently announced procurement
regime, which aims to direct 75 percent of state procurement to local
fi rms, might be viewed as a signifi cant opportunity for SMEs: but this
will not materialise if they are stymied by regulatory constraints. South
Africa has a limited pool of productive SMEs capable of producing quality
products and services, in suffi cient quantity, and within time frames, and
this is unlikely to expand if they are to be hemmed in by demands of scant
relevance to themselves. At a bare minimum, a concerted effort must
be made by state agencies and bureaucracies to switch from an ethos of
authority and punishment, to one of assistance and facilitation. However,
a fuller set of reforms is needed, including a comprehensive review of
existing labour and empowerment regulations. The turnover ceilings for
BBBEE compliance need to be raised. Small business people need to
be able to devote their energies to operating their enterprises, and not
to managing cumbersome administrative details or government policy of
little direct relevance or benefi t to their activities. Furthermore, burden
reduction must be recognised as an ongoing process: government at all
levels needs to consistently engage with business, of all sizes, to fi nd
simpler or more effi cient means of accomplishing what needs to be done.
39
40
The regulatory environment
in particular, labour legislation is proving an
unwieldy burden

MESSAGE TO THE PRIVATE SECTOR
• The implicit mentorship experienced by a number of entrepreneurs in
larger and established companies that appears to have been a factor in
their success provides the rudiments of a strategy for developing and
nurturing entrepreneurship among smaller business people.
• Linkages in the form of subcontracting to and sourcing from small
business could be useful lever for growth, provided service and product
quality are satisfactory, and payments are made timeously.
• The private sector need to understand that it is an aggregate entity and that
good policy will entail treating different parts of it differently. In particular,
large companies and business organisations, with greater access and
voice on policy, need to be more vocal about recognising the challenges
and circumstances of small business, and pushing for their exclusion from
unaffordable and constricting bargaining arrangements. Until now, they
have largely failed to do so.
• The private sector could make a great contribution to understanding the
dynamics of small business. Regular research, perhaps shared throughout
the sector, would assist in developing overall plans to assist the SME
sector.
41

That small business can play an enormously positive role in resolving South
Africa’s socio-economic problems is an article of faith in South Africa, and is
backed by virtually all comparative evidence – but one whose promise has not
been realised. Rather than sprouting and fl ourishing, the country’s SME sector
is surviving. And it is not delivering on its key promise: the creation of jobs to
soak up the country’s unemployed. This is not a situation that South Africa can
or should accept.
The perspectives captured in the SME Growth Index clearly point the way.
The picture that emerges is of a solid and robust business sector, intent on
surviving, and hopeful, but not optimistic about the future. There are major
concerns, many of them long-standing and voiced before, but generally not
responded to in policy.
If small business is to be taken seriously as a part of the solution, its concerns
need to be recognised and accommodated. This will mean accepting realities
as they are revealed in the evidence, even when they may challenge fondly
held positions. The SME Growth Index aims to move that process forward by
assembling a strong body of fi rst-hand evidence and contributing it to national
conversation.
South Africa cannot afford to allow such a potentially rich fi eld to lie fallow.
42
CONCLUDING COMMENT

SBP ACKNOWLEDGES THE FINANCIAL CONTRIBUTION OF THE:
Friedrich Naumann Foundation for Liberty
Investment Climate & Business Environment Research Fund
(a joint initiative of TrustAfrica and Canada’s IDRC)
Employment Promotion Programme (EPP) South Africa
Tourism Enterprise Partnership (TEP) South Africa
DESIGN & LAYOUT done by
Justin Robinson in association
with Push Pull
www.pushpull.co.za

79 Oxford Road
Saxonwold
Johannesburg
South Africa
P O Box 1051
Houghton 2041
Johannesburg
South Africa
T +27 11 486 0797
F +27 11 486 0810
www.sbp.org.za