principal component directed partial least squares …...principal component directed partial least...
TRANSCRIPT
Principal component directed partial least squares analysis for differentiation of benign and malignant canine breast
cancer: HR-MAS NMR spectroscopy-based metabolomic study
Sang-Young Kim1, Taehyeong Lee2, Hyunju Kim3, Eunjung Bang3, Hwi-Yool Kim2, and Bo-Young Choe1
1Department of Biomedical Engineering, The Catholic University of Korea, Seoul, Seoul, Korea, 2Department of Veterinary Surgery, Konkuk University,
Seoul, Korea, 3Korea Basic Science Institute, Seoul, Korea
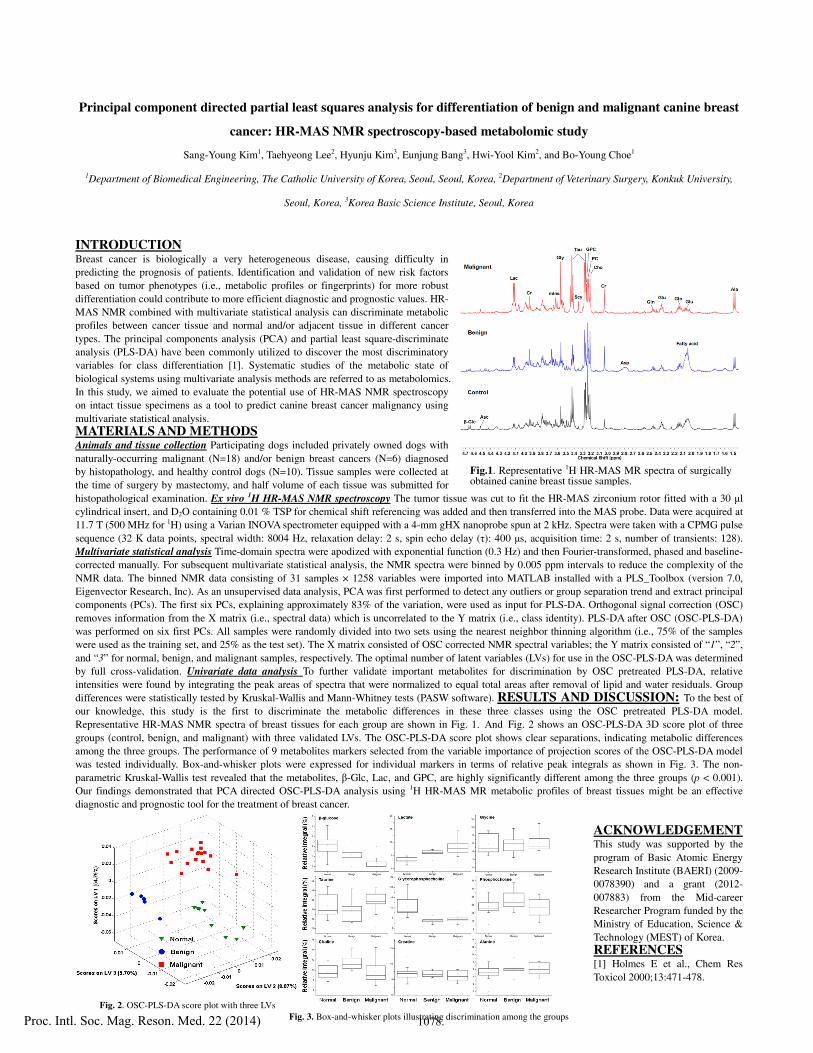
INTRODUCTION Breast cancer is biologically a very heterogeneous disease, causing difficulty in predicting the prognosis of patients. Identification and validation of new risk factors based on tumor phenotypes (i.e., metabolic profiles or fingerprints) for more robust differentiation could contribute to more efficient diagnostic and prognostic values. HR-MAS NMR combined with multivariate statistical analysis can discriminate metabolic profiles between cancer tissue and normal and/or adjacent tissue in different cancer types. The principal components analysis (PCA) and partial least square-discriminate analysis (PLS-DA) have been commonly utilized to discover the most discriminatory variables for class differentiation [1]. Systematic studies of the metabolic state of biological systems using multivariate analysis methods are referred to as metabolomics. In this study, we aimed to evaluate the potential use of HR-MAS NMR spectroscopy on intact tissue specimens as a tool to predict canine breast cancer malignancy using multivariate statistical analysis. MATERIALS AND METHODS Animals and tissue collection Participating dogs included privately owned dogs with naturally-occurring malignant (N=18) and/or benign breast cancers (N=6) diagnosed by histopathology, and healthy control dogs (N=10). Tissue samples were collected at the time of surgery by mastectomy, and half volume of each tissue was submitted for histopathological examination. Ex vivo 1H HR-MAS NMR spectroscopy The tumor tissue was cut to fit the HR-MAS zirconium rotor fitted with a 30 μl cylindrical insert, and D2O containing 0.01 % TSP for chemical shift referencing was added and then transferred into the MAS probe. Data were acquired at 11.7 T (500 MHz for 1H) using a Varian INOVA spectrometer equipped with a 4-mm gHX nanoprobe spun at 2 kHz. Spectra were taken with a CPMG pulse sequence (32 K data points, spectral width: 8004 Hz, relaxation delay: 2 s, spin echo delay (τ): 400 μs, acquisition time: 2 s, number of transients: 128). Multivariate statistical analysis Time-domain spectra were apodized with exponential function (0.3 Hz) and then Fourier-transformed, phased and baseline-corrected manually. For subsequent multivariate statistical analysis, the NMR spectra were binned by 0.005 ppm intervals to reduce the complexity of the NMR data. The binned NMR data consisting of 31 samples × 1258 variables were imported into MATLAB installed with a PLS_Toolbox (version 7.0, Eigenvector Research, Inc). As an unsupervised data analysis, PCA was first performed to detect any outliers or group separation trend and extract principal components (PCs). The first six PCs, explaining approximately 83% of the variation, were used as input for PLS-DA. Orthogonal signal correction (OSC) removes information from the X matrix (i.e., spectral data) which is uncorrelated to the Y matrix (i.e., class identity). PLS-DA after OSC (OSC-PLS-DA) was performed on six first PCs. All samples were randomly divided into two sets using the nearest neighbor thinning algorithm (i.e., 75% of the samples were used as the training set, and 25% as the test set). The X matrix consisted of OSC corrected NMR spectral variables; the Y matrix consisted of “1”, “2”, and “3” for normal, benign, and malignant samples, respectively. The optimal number of latent variables (LVs) for use in the OSC-PLS-DA was determined by full cross-validation. Univariate data analysis To further validate important metabolites for discrimination by OSC pretreated PLS-DA, relative intensities were found by integrating the peak areas of spectra that were normalized to equal total areas after removal of lipid and water residuals. Group differences were statistically tested by Kruskal-Wallis and Mann-Whitney tests (PASW software). RESULTS AND DISCUSSION: To the best of our knowledge, this study is the first to discriminate the metabolic differences in these three classes using the OSC pretreated PLS-DA model. Representative HR-MAS NMR spectra of breast tissues for each group are shown in Fig. 1. And Fig. 2 shows an OSC-PLS-DA 3D score plot of three groups (control, benign, and malignant) with three validated LVs. The OSC-PLS-DA score plot shows clear separations, indicating metabolic differences among the three groups. The performance of 9 metabolites markers selected from the variable importance of projection scores of the OSC-PLS-DA model was tested individually. Box-and-whisker plots were expressed for individual markers in terms of relative peak integrals as shown in Fig. 3. The non-parametric Kruskal-Wallis test revealed that the metabolites, β-Glc, Lac, and GPC, are highly significantly different among the three groups (p < 0.001). Our findings demonstrated that PCA directed OSC-PLS-DA analysis using 1H HR-MAS MR metabolic profiles of breast tissues might be an effective diagnostic and prognostic tool for the treatment of breast cancer.
ACKNOWLEDGEMENT This study was supported by the program of Basic Atomic Energy Research Institute (BAERI) (2009-0078390) and a grant (2012-007883) from the Mid-career Researcher Program funded by the Ministry of Education, Science & Technology (MEST) of Korea. REFERENCES [1] Holmes E et al., Chem Res Toxicol 2000;13:471-478.
Fig.1. Representative 1H HR-MAS MR spectra of surgically obtained canine breast tissue samples.
Fig. 2. OSC-PLS-DA score plot with three LVs Fig. 3. Box-and-whisker plots illustrating discrimination among the groups Proc. Intl. Soc. Mag. Reson. Med. 22 (2014) 1078.