principal global indicators (pgi) - imf · 3 recommendation 20: communication of official...
TRANSCRIPT

Reproductions of this material, or any parts of it, should refer to the IMF Statistics Department as the source.
IMF Statistics Department
June 25-26, 2014 Basel, Switzerland
He Qi, Advisor, IMF Statistics Department
Principal Global Indicators (PGI)
IMF/FSB Global Conference on the G-20 Data Gaps Initiative

IMF Statistics Department
Outline
2
Overview of the PGI Main features of the PGI Access to the PGI What is in the PGI Usage of the PGI Enhancements of the PGI

IMF Statistics Department
G-20 Recommendation
3
Recommendation 20: Communication of Official Statistics
The G-20 economies to support enhancement of the Principal Global Indicators (PGI) website and close the gaps in the availability of their national data. The Inter-Agency Group on Economic and Financial Statistics (IAG) should consider making longer runs of historical data available.
Lead agency: IMF

IMF Statistics Department
Overview of the PGI (1 of 3)
4
The PGI website was launched in 2009 in response to the global financial crisis, and is hosted by the IMF. It is a joint undertaking of the IAG, which was established in 2008 to coordinate statistical issues and data gaps highlighted by the global crisis and to strengthen data collection.
IMF Statistics Department
Overview of the PGI (2 of 3)
5
The PGI provides information on major economic indicators that is available at participating international agencies covering financial, governmental, external, and real sector data, with links to data available at websites of international and national agencies. The PGI provides internationally comparable data for the
G-20 economies and economies with systemically important financial sectors that are not members of the G-20 to facilitate the monitoring of economic and financial developments for these jurisdictions.

IMF Statistics Department
Overview of the PGI (3 of 3)
6
G-20 economies:
Argentina Euro Area Italy South Africa
Australia France Japan South Korea
Brazil Germany Mexico Turkey
Canada India Russia United Kingdom
China, P.R. : Mainland Indonesia Saudi Arabia United States
Economies with systemically important financial sectors:
Austria Luxembourg Sweden
Belgium Netherlands Switzerland
China, P.R.: Hong Kong Singapore
Ireland Spain

IMF Statistics Department
Main Features of the PGI (1 of 2)
7
The PGI disseminates data on the main international statistical concepts sourced from the IAG members. The PGI publishes cross-country reports which facilitate
international comparison for over 40 principal economic concepts. The PGI publishes additional detailed country data (about 200
concepts) useful in country-level analysis. The PGI also has derived data indicators, such as annual
growth and ratios to GDP, designed for data analysis. The PGI now includes aggregate GDP growth rate and CPI for
G-20 economies.
IMF Statistics Department
Main Features of the PGI (2 of 2)
8
The Data Mapper tool is available to enhance data analysis through visualization (using geographical maps and graphs). The PGI presents data in comparable units of
measure. The PGI data may be retrieved in Excel, Word,
or PDF formats.
IMF Statistics Department
Access to PGI Data
9
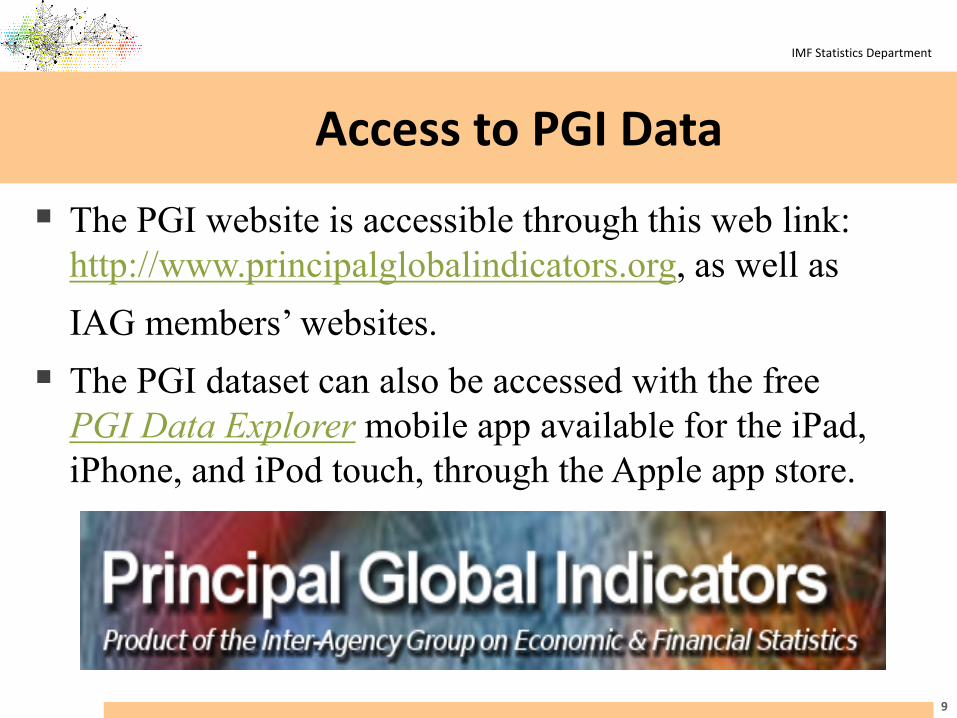
The PGI website is accessible through this web link: http://www.principalglobalindicators.org, as well as
IAG members’ websites. The PGI dataset can also be accessed with the free
PGI Data Explorer mobile app available for the iPad, iPhone, and iPod touch, through the Apple app store.

IMF Statistics Department
What’s in the PGI (1 0f 7)
10
Cross-country data for the G-20 and economies with systemically important financial sectors that are not members of the G-20.

IMF Statistics Department
What’s in the PGI (2 of 7)
11
Additional detailed data for country-level analysis.

IMF Statistics Department
What’s in the PGI (3 of 7)
The Data Mapper tool is available to enhance data analysis through visualization (using geographical maps and graphs— country-specific analysis).
12
IMF Statistics Department
What’s in the PGI (4 0f 7)
13
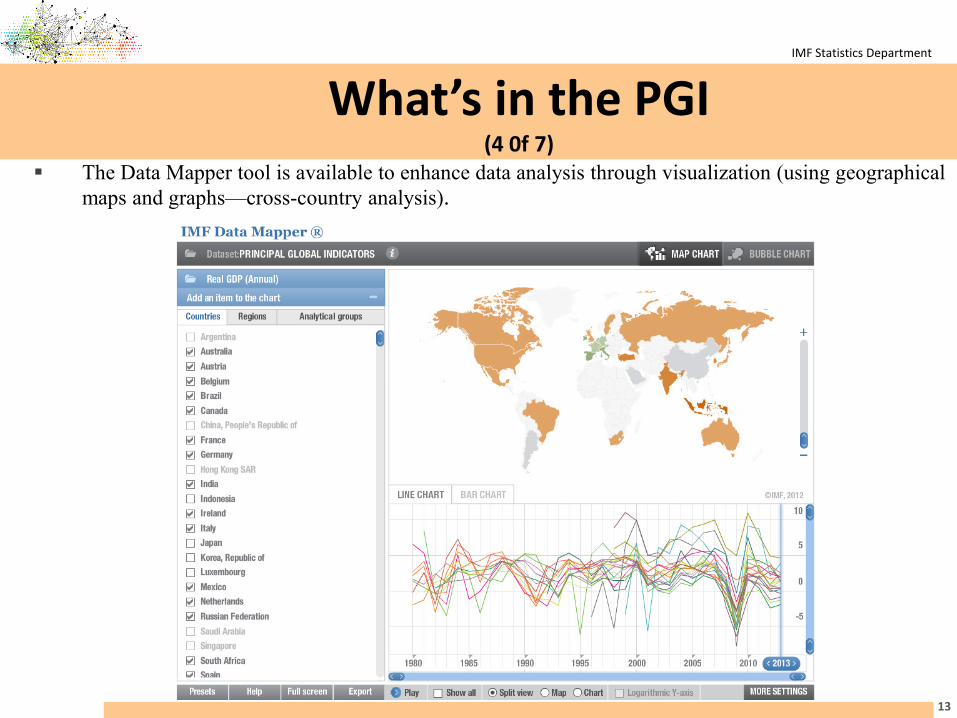
The Data Mapper tool is available to enhance data analysis through visualization (using geographical maps and graphs—cross-country analysis).
IMF Statistics Department
What’s in the PGI (5 0f 7)
14
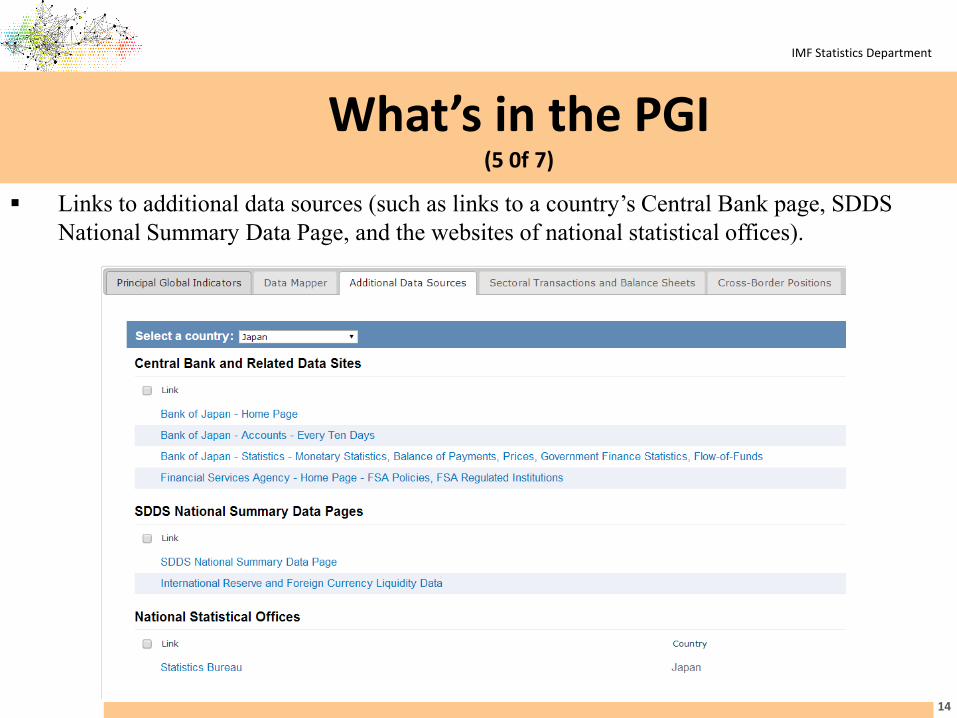
Links to additional data sources (such as links to a country’s Central Bank page, SDDS National Summary Data Page, and the websites of national statistical offices).

IMF Statistics Department
What’s in the PGI? (6 of 7)
15
SNA sectoral account reports provide sectoral breakdown of data on financial and nonfinancial transactions and balance sheets.

IMF Statistics Department
What’s in the PGI? (7 of 7)
16
The Cross-Border Positions section provides access to two standardized navigation templates on the cross-border positions of specific economic sectors of reporting economies.

IMF Statistics Department
Usage of the PGI (1 of 4)
17
0
1,000
2,000
3,000
4,000
5,000
6,000
Num
ber o
f vis
its
Number of visits to PGI website in G20 from January 1 to May 31 (in 2013 and 2014)
2013 2014 Source: Google Analytics Excludes visits from IMF internal network.

IMF Statistics Department
Usage of the PGI (2 of 4)
18
Source: Google Analytics Excludes visits from IMF internal network.
0
10000
20000
30000
40000
50000
60000
G20 Total World
Num
ber o
f vis
its
Total number of visits to PGI website from G20 and the World from January 1 to May 31 (in 2013 and 2014)
2013 2014

IMF Statistics Department
Usage of the PGI (3 of 4)
19
From January 1 – May 31, 2014
The PGI website had about 50,000 visits from over 180 countries; an increase of more than 13 percent compared with the same period in previous year.
The number of G-20 visits increased by about 10 percent.
Countries with the largest number of visitors are the United States (4,946), Japan (3,398), Brazil (2,821 ), the UK (2,373), and Italy (2,349).
IMF Statistics Department
Enhancements of the PGI (1 of 2)
20
High priorities: Continuous improvement of data coverage and timeliness of the
PGI website.
Enhanced collaboration among IAG agencies that offer an SDMX web service to further improve the efficiency of data exchange, increase timeliness of PGI, and reduce overlaps in data collection from economies.
Promotion of the usage of PGI data through outreach activities, such as giving a presentation on the PGI, producing posters and brochures, and placing links to the PGI website at more prominent locations.
IMF Statistics Department
Enhancements of the PGI (2 of 2)
21
Work ahead:
Short-term improvements focus on country and data coverage, increased communication of the IAG work program as well as tracking progress on DGI recommendations.
The medium-term strategy covers the introduction of the new data dissemination platform, improved timeliness by leveraging the SDDS-Plus, and PGI promotion via social media.
