principal longevity, leadership behaviors, and student
TRANSCRIPT
University of South CarolinaScholar Commons
Theses and Dissertations
12-15-2014
Principal Longevity, Leadership Behaviors, andStudent Academic AchievementJennifer McLeod SwearingenUniversity of South Carolina - Columbia
Follow this and additional works at: https://scholarcommons.sc.edu/etd
Part of the Educational Administration and Supervision Commons
This Open Access Dissertation is brought to you by Scholar Commons. It has been accepted for inclusion in Theses and Dissertations by an authorizedadministrator of Scholar Commons. For more information, please contact [email protected].
Recommended CitationSwearingen, J. M.(2014). Principal Longevity, Leadership Behaviors, and Student Academic Achievement. (Doctoral dissertation).Retrieved from https://scholarcommons.sc.edu/etd/3021
PRINCIPAL LONGEVITY, LEADERSHIP BEHAVIORS, AND STUDENT
ACADEMIC ACHIEVEMENT
by
Jennifer McLeod Swearingen
Bachelor of Science
The College of Charleston, 1997
Master of Education
The Citadel, 2000
Educational Specialist
The Citadel, 2009
Submitted in Partial Fulfillment of the Requirements
For the Degree of Doctor of Philosophy in
Educational Administration
College of Education
University of South Carolina
2014
Accepted by:
Zachary Kelehear, Major Professor
Peter Moyi, Committee Member
Lynn Harrill, Committee Member
Rhonda Jeffries, Committee Member
Lacy Ford, Vice Provost and Dean of Graduate Studies

ii
© Copyright by Jennifer McLeod Swearingen, 2014
All Rights Reserved.

iii
ABSTRACT
Utilizing Pearson’s correlation and other forms of data analysis, the researcher
explored relationships between principal longevity, leadership behaviors, and student
academic achievement in this study. Additionally, the study considered the degree to
which leadership behavior ratings seem to be associated with student academic
achievement.
The researcher found positive correlations among all three variables, with the
strongest correlation being between principal longevity and student academic
achievement. The only correlation that was found to be statistically significant was
between principal longevity and student academic achievement. The researcher was also
able to identify the highest and lowest rated leadership behaviors for principals with the
most years of experience.
The study indicated a need for school districts, and larger scale public school
institutions, to study trends of principal longevity, and principal turnover, particularly in
high poverty schools and schools with a history of underachievement. Strategies should
be implemented to attract and retain high performing principals. All students would
greatly benefit by the existence of systems that prevent turnover of effective principals.

iv
TABLE OF CONTENTS
ABSTRACT ....................................................................................................................... iii
LIST OF TABLES ............................................................................................................. vi
CHAPTER 1: INTRODUCTION
1.1 INTRODUCTION..............................................................................................1
1.2 THE PURPOSE OF THE STUDY .....................................................................5
1.3 RESEARCH QUESTIONS ................................................................................7
1.4 RESEARCHER HYPOTHESIS ........................................................................7
1.5 SIGNIFICANCE OF THE STUDY...................................................................8
1.6 METHODOLOGY ............................................................................................9
1.7 DELIMITATIONS ..........................................................................................10
1.8 LIMITATIONS ................................................................................................11
1.9 DEFINITION OF TERMS ..............................................................................12
1.10 ORGANIZATION OF DISSERTATION .....................................................14
CHAPTER 2: LITERATURE REVIEW
2.1 THE ROLE AND IMPACT OF THE BUILDING LEVEL PRINCIPAL ......15
2.2 LEADERSHIP STANDARDS AND BEHAVIORS ......................................20
2.3 RELATIONSHIPS BETWEEN PRINCPAL LONGEVITY, LEADERSHIP
BEHAVIORS, AND STUDENT ACADEMIC ACHIEVEMENT.......................22
2.4 SUMMARY OF LITERATURE REVIEW.....................................................25
CHAPTER 3: METHODOLOGY
3.1 RESEARCH DESIGN .....................................................................................26
3.2 PARTICIPANTS .............................................................................................27
3.3 INSTRUMENTS..............................................................................................28
3.4 PROCEDURES ...............................................................................................31

v
3.5 SUMMARY OF METHODOLOGY ...............................................................32
CHAPTER 4: DATA ANALYSIS
4.1 DATA OVERVIEW ........................................................................................33
4.2 RESEARCH QUESTION ONE ......................................................................48
4.3 RESEARCH QUESTION TWO......................................................................50
4.4 RESEARCH QUESTION THREE ..................................................................54
4.5 RESEARCH QUESTION FOUR ....................................................................55
CHAPTER 5: SUMMARY, CONCLUSIONS, AND RECOMMENDATIONS
5.1 SUMMARY OF DATA ANALYSIS ..............................................................71
5.2 CONCLUSIONS..............................................................................................77
5.3 RECOMMENDATIONS .................................................................................78
REFERENCES ..................................................................................................................82
APPENDIX A-IRB APPROVAL ......................................................................................85

vi
LIST OF TABLES
Table 4.1 Elementary School and Principal’s Years of Experience ..................................34
Table 4.2 Leadership Behavior One – My principal provides good processes and
resources for me to do my job............................................................................................35
Table 4.3 Leadership Behavior Two – My principal has provided feedback on my
strengths as an employee ...................................................................................................36
Table 4.4 Leadership Behavior Three – Principal led staff meetings make efficient use of
my time and are productive ................................................................................................37
Table 4.5 Leadership Behavior Four – My principal recognizes good performance ........38
Table 4.6 Leadership Behavior Five – My principal demonstrates a genuine concern for
my welfare .........................................................................................................................39
Table 4.7 Leadership Behavior Six – My principal makes the best use of available
funds ...................................................................................................................................40
Table 4.8 Leadership Behavior Seven – My principal consults me on the decisions that
affect my job ......................................................................................................................41
Table 4.9 Leadership Behavior Eight – The expectations for judging my performance are
clear ....................................................................................................................................42
Table 4.10 Leadership Behavior Nine – My principal provides the support needed to
accomplish my work objectives .........................................................................................43
Table 4.11 Leadership Behavior Ten – My principal has provided feedback concerning
areas for improving my performance .................................................................................44
Table 4.12 Leadership Behavior Averages for All Schools ..............................................45
Table 4.13 Leadership Behavior Differentials ...................................................................47
Table 4.14 PASS Percent Met and Exemplary in English Language Arts ........................48
Table 4.15 Principal Longevity and Overall Leadership Behavior Rating ........................49
Table 4.16 Principal Longevity and Student Academic Achievement ..............................51
vii
Table 4.17 Average PASS Scores with Years of Experience ............................................53
Table 4.18 Overall Leadership Behavior Rating and Student Academic Achievement ....55
Table 4.19 Highest Rated Leadership Behaviors per Group .............................................56
Table 4.20 Lowest Rated Leadership Behaviors per Group ..............................................57
Table 4.21 Leadership Behavior One – My principal provides good processes and
resources for me to do my job............................................................................................59
Table 4.22 Leadership Behavior Two – My principal has provided feedback on my
strengths as an employee ...................................................................................................60
Table 4.23 Leadership Behavior Three – Principal led staff meetings make efficient use
of time and are productive .................................................................................................61
Table 4.24 Leadership Behavior Four – My principal recognizes good performance ......62
Table 4.25 Leadership Behavior Five – My principal demonstrates a genuine concern for
my welfare .........................................................................................................................63
Table 4.26 Leadership Behavior Six – My principal makes the best use of available
funds ...................................................................................................................................64
Table 4.27 Leadership Behavior Seven – My principal consults me on the decisions that
affect my job ......................................................................................................................65
Table 4.28 Leadership Behavior Eight – The expectations for judging my performance
are clear ..............................................................................................................................66
Table 4.29 Leadership Behavior Nine – My principal provides the support needed to
accomplish my work objectives .........................................................................................67
Table 4.30 Leadership Behavior Ten – My principal has provided feedback concerning
areas for improving my performance .................................................................................68
Table 4.31 Highest Rated Group per Leadership Behavior ...............................................69
Table 4.32 Differences Among Groups per Leadership Behavior ....................................70

1
CHAPTER 1: INTRODUCTION
INTRODUCTION
Public schools play an important role in our society; possibly one of the most
important roles in societal advancement. So what makes a successful school – the facility,
the students, the parents, the principal, or a combination of variables? Is it practicable to
measure the impact of individual school variables, such as principal contribution, to
overall school success? Branch, Hanushek, and Rivkin (2013) stated:
The fundamental challenge to measuring the impact of school leaders is
separating their contributions from the many other factors that drive student
achievement. For example, a school that serves largely affluent families may
create the illusion that it has a great principal, when family backgrounds are the
key cause of high achievement. Alternatively, a school that serves disadvantaged
students may appear to be doing poorly but in fact have a great principal who is
producing better outcomes than any other principal would (p. 64).
There is some debate on how much, if any, school based principals affect student
achievement and overall school success. If principal influence and effectiveness are
heavily weighted variables in the successful school equation, what impact could a ‘good’
or ‘bad’ principal really have on an individual school? Branch, Hanusheck, and Rivkin
(2013) conducted a study to measure the impact of effective principals and stated, “Our

2
results indicate that highly effective principals raise the achievement of a typical student
in their schools by between two and seven months of learning in a single school year;
ineffective principals lower achievement by the same amount” (p. 63).
If principal effectiveness impacts student achievement to the degree, or extent,
that Branch et al. suggest, then exploring ideas and potential correlated factors
surrounding principal effectiveness might prove beneficial to the current educational
system. Marzano (2005) echoes the idea of school level leadership being important by
stating that:
Principal effectiveness is central to raising student achievement. Nearly 60 % of a
school’s total impact on student achievement is attributable to principal and
teacher effectiveness. Moreover, a comprehensive review of the research on
school leadership found that the quality of the principal alone accounts for 25% of
a school’s impact on student achievement (Fenton, Kelemen, Norskog, Robinson,
Schnur, Simmons, Taliaferro, and Walker, 2010).
If, as Marzano suggested, one fourth of school success can be contributed to the
“quality of the principal”, then what leadership qualities are important? The MetLife
survey (2012) results indicated that:
Principals and teachers give each other high marks but disagree somewhat on the
skills and experiences school leaders need. Teachers provide a positive report on
the job their principal is doing, and nearly all principals give high ratings to the
classroom teachers in their schools as do teachers to the other teachers in their
schools. Principals and teachers do not fully agree, however, on what experiences

3
and skills they think are necessary for a principal to be effective. While principals
place greatest importance on being able to use data about student performance to
improve instruction as well as to lead the development of strong teaching capacity
across a school, teachers say that it is most important for a principal to have had
experience as a classroom teacher (p. 4).
This study explored the relationship between leadership behaviors, as determined
by employee survey results, and academic achievement, as determined by student
standardized test scores. Further, the study determined the correlations between principal
longevity, employee survey ratings, and student academic achievement. The Colorado
Department of Education (CDE) piloted an educator evaluation system in 2011-2012 and
2012-2013 and according to the pilot study findings:
When considering ratings based on principals’ years of experience, principals
with more experience (overall and in their current school) received higher ratings.
Principals with over five years of experience as a principal overall or in their
current school receive the highest ratings. Considering only experience in their
current school, principals who are new or only have one year of experience in
their current school receive the lowest ratings (p. 14).
If previous studies suggest that principals who have been at schools for longer
periods of time have higher employee survey ratings, does the same apply to the
academic achievement level of students? Specifically, do principals who have been at
schools for longer periods of time tend to have greater increases in their student
4
achievement data each year or have the capacity to maintain high student achievement
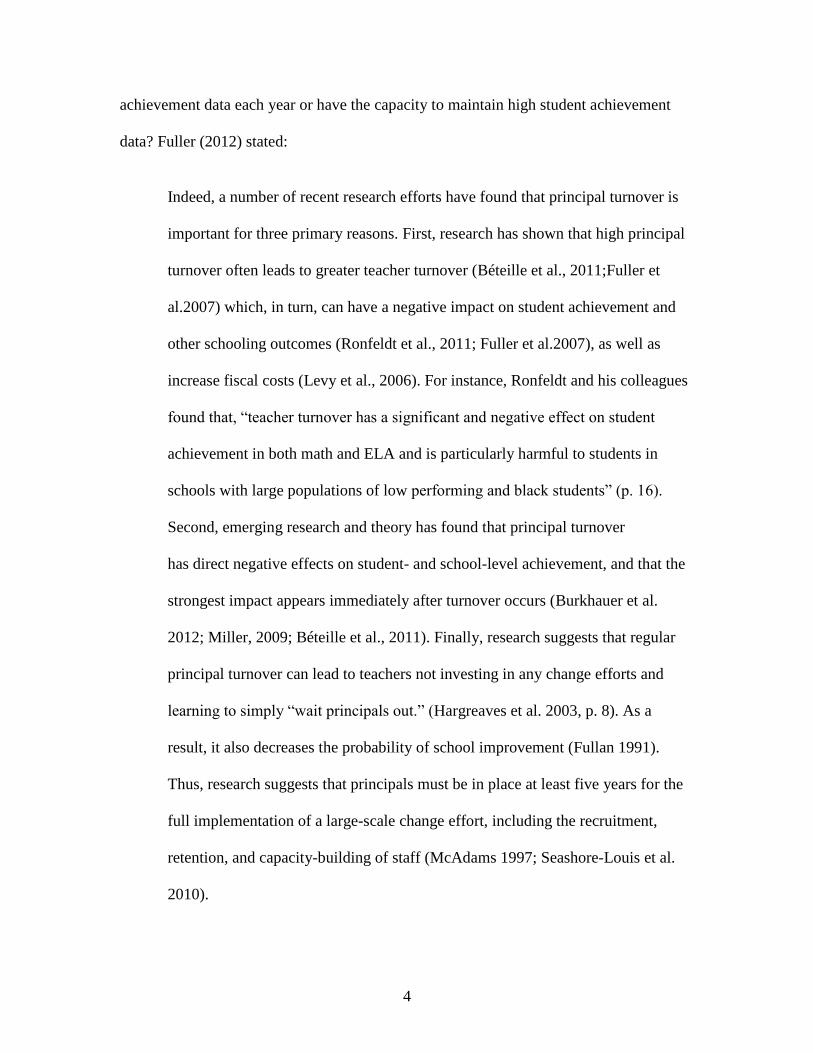
data? Fuller (2012) stated:
Indeed, a number of recent research efforts have found that principal turnover is
important for three primary reasons. First, research has shown that high principal
turnover often leads to greater teacher turnover (Béteille et al., 2011;Fuller et
al.2007) which, in turn, can have a negative impact on student achievement and
other schooling outcomes (Ronfeldt et al., 2011; Fuller et al.2007), as well as
increase fiscal costs (Levy et al., 2006). For instance, Ronfeldt and his colleagues
found that, “teacher turnover has a significant and negative effect on student
achievement in both math and ELA and is particularly harmful to students in
schools with large populations of low performing and black students” (p. 16).
Second, emerging research and theory has found that principal turnover
has direct negative effects on student- and school-level achievement, and that the
strongest impact appears immediately after turnover occurs (Burkhauer et al.
2012; Miller, 2009; Béteille et al., 2011). Finally, research suggests that regular
principal turnover can lead to teachers not investing in any change efforts and
learning to simply “wait principals out.” (Hargreaves et al. 2003, p. 8). As a
result, it also decreases the probability of school improvement (Fullan 1991).
Thus, research suggests that principals must be in place at least five years for the
full implementation of a large-scale change effort, including the recruitment,
retention, and capacity-building of staff (McAdams 1997; Seashore-Louis et al.
2010).

5
THE PURPOSE OF THE STUDY
As data become more frequently used in schools and readily available to the
public, transparency of school performance and leadership accountability has become
increasingly present in the field of education. With a heightened sense of urgency, school
districts are searching for strategies to enhance school leadership performance that
increase student academic achievement. Chapman (2005) stated:
The recruitment, retention, and development of school principals are matters of
great importance for all school systems because effective educational leadership is
absolutely vital to bringing about improvements and advances in all those
activities, institutions, and processes that foster the provision of education and
student learning. Governments, school system authorities, school-based
personnel, universities, leadership institutes, and professional associations are
therefore increasingly turning their attention to the development of policies and
strategies to address concerns in this area (p. 2).
Understanding leadership development could possibly enhance school
performance and potentially help with educational leadership preparation at the college
level, as well as contribute to the design of professional development of aspiring and
current school level administrators. In addition, the study may encourage district level
administrators to consider the importance of principal retention at individual schools,
especially schools with high levels of poverty and/or a history of underachievement.
Burkhauser, Gates, Hamilton, and Ikemoto (2012) stated:

6
Schools that lose a first-year principal do not do well in the subsequent year,
indicating that a poor match between a principal and a school can have lingering
consequences. This suggests that improving the principal placement process to
ensure that individuals are truly ready for and supported in their new roles could
have important implications for student achievement, particularly in low-
performing schools (p. 15).
This study explored relationships between principal longevity (years of
experience in the same school), leadership behaviors (as measured by employee survey
results), and student academic achievement (as measured by PASS – Palmetto
Assessment of State Standards), providing insight on which leadership behaviors are
most affected by principal longevity and which leadership behaviors appear to be
untouched by principal longevity. Additionally, this study considered the degree in which
leadership behavior ratings seem to be associated with student academic achievement.
Nineteen elementary school principals in the Charleston County School District
(CCSD) were selected for this study. Pearson’s correlation analysis was completed on the
following using 2013 data: 1) principal longevity and leadership behaviors; 2) principal
longevity and student academic achievement; 3) leadership behaviors and student
academic achievement.
Correlations were completed in an effort to understand the relationships between
principal longevity, leadership behaviors, and student academic achievement. The
correlations were determined and the statistical significance for each correlation was
interpreted. The researcher also analyzed the relationship between principal longevity and

7
certain leadership behaviors, focusing on which leadership behaviors are most affected by
principal longevity and which leadership behaviors appear to be untouched by principal
longevity.
RESEARCH QUESTIONS
1. What is the correlation and statistical significance between principal longevity
and leadership behavior ratings?
2. What is the correlation and statistical significance between principal longevity
and student academic achievement?
3. What is the correlation and statistical significance between leadership
behavior ratings and student academic achievement?
4. Which leadership behavior ratings are highest and lowest for principals with
the most years of experience?
RESEARCHER HYPOTHESIS
Research question one – What is the correlation and statistical significance
between principal longevity and leadership behavior ratings? The null hypothesis is that
there is no correlation between principal longevity and leadership behavior ratings. The
researcher’s hypothesis is that there will be a positive correlation between longevity and
leadership behavior ratings.
Research question two – What is the correlation and statistical significance
between principal longevity and student academic achievement? The null hypothesis is
that there is no correlation between principal longevity and academic achievement. The
8
researcher’s hypothesis is that there will be a positive correlation between principal
longevity and student academic achievement.
Research question three – What is the correlation and statistical significance
between leadership behavior ratings and student academic achievement? The null
hypothesis is that there is no correlation between leadership behavior ratings and
academic achievement. The researcher’s hypothesis is that there will be a positive
correlation between leadership behavior ratings and student academic achievement.
Research question four – Which leadership behavior ratings are highest and
lowest for principals with the most years of experience?
SIGNIFICANCE OF THE STUDY
All students need access to schools that prepare them for their future pursuits.
Educating, training, and preparing school based leaders are imperative to the process of
providing high quality education for all children. Understanding leadership behaviors of
the building level principal and the effect that these behaviors have on student
achievement could possibly help with educational leadership preparation at the college
level, as well as contribute to the design of professional development of aspiring and
current school level administrators. In addition, the study may encourage district level
administrators to consider the importance of principal retention at individual schools
where they have made positive, measurable gains in student academic achievement,
especially in schools with high levels of poverty and/or a history of underachievement.
9
METHODOLOGY
Nineteen neighborhood elementary school principals in the Charleston County
School District (CCSD) were selected for the study. All 19 principals led a neighborhood
school, as defined by the CCSD. A neighborhood school is defined as a school that uses a
geographical attendance zone for student enrollment.
Neighborhood schools were used for this study in an effort to maintain a constant
variable, in that all of these schools follow the same residency requirement policies for
student enrollment. No non- neighborhood schools, or choice schools, in the CCSD were
used in this study – including, but not limited to, charter, magnet, and partial magnet
schools.
The leadership behaviors used in this study were found on the employee
engagement survey that the CCSD gives employees to rate their direct supervisor on their
leadership abilities. Teachers complete two surveys per year on their building level
principal and principals complete two surveys a year on district level employees. These
surveys are referred to as employee engagement surveys. The mean for the first ten
leadership behaviors from the last survey window from 2013 are used in this study.
Academic achievement was measured utilizing 2013 PASS scores for all students in
grades 3-5 in English Language Arts (ELA). PASS scores listed reflect the percentage of
students in grades 3-5 who scored met or exemplary in ELA.
This study used Pearson’s correlation to analyze the following data for all 19
schools: principal longevity 2013 and leadership behaviors 2013, principal longevity
10
2013 and academic achievement 2013, and leadership behaviors 2013 and academic
achievement 2013.
In an effort to determine which leadership behaviors, of the ten on the survey, are
rated the highest with experience and which are the lowest with experience the researcher
grouped the principals’ level of experience into three groups: group A = 1 – 4 years of
experience, group B = 5 – 8 years of experience, and group C – 9 or more years of
experience. The researcher then averaged the individual leadership indicators, items 1
through 10, for each group to determine which group had the highest average and which
group had the lowest average for each of the ten leadership behaviors.
This allowed the researcher to discover which three leadership behaviors were
rated highest for principals with the most experience and which three leadership
behaviors were rated lowest for principal with the most experience.
DELIMITATIONS
The number of schools used in this study was limited to 19 neighborhood schools.
This was done in an effort to maintain a constant variable, in that all of these schools
follow the same residency requirement policies for student enrollment. Choice school
factors, such as academic requirements for admission, parental involvement level needed
for initially choosing school choice alternatives and completing the application process,
and transportation factors that can limit student access may contribute to academic
achievement levels at these schools; therefore these schools were not used in this study.
Choice schools can be defined as any school in the CCSD that is not considered a

11
neighborhood school. Choice schools include charter schools, magnet schools, partial
magnet schools, constituent magnet schools, specialized or program schools.
The study will only include typical grade assignment elementary schools because
the academic achievement data used in the study, PASS scores for students in grades 3-5,
is only available at the elementary school level. No primary (K-2) schools were included
because they do not have PASS data.
The study utilized the first ten leadership behaviors on the Studer employee
engagement survey and eliminated the last four items on the survey, only using the first
ten when averaging each principal’s mean. The last four behaviors were eliminated
because they are ratings for the CCSD superintendent, not the individual school based
principal. The last four leadership behavior ratings varied from school to school
depending on how the employees in the individual schools rated the superintendent in
these four leadership behaviors. Each school was affected differently by the initial
inclusion and the elimination of these four items; therefore these four items were
eliminated from each principal’s mean.
LIMITATIONS
The Studer employee engagement surveys are voluntary and anonymous. The
CCSD does not require employees to take part in the surveys, nor do they have any type
of tracking system that allows them to know who has completed the survey or the number
of times the same employee completed the survey. Therefore, it is possible for an
employee to complete the same survey multiple times. The number of participants, as
well as the percentage of staff participation at each school, completing the survey varies

12
from school to school. The number of participants from each school is listed for each
survey window but not the percentage of participants for each school. Also, the number
of participants within individual schools fluctuated for each survey window. For
example, one school had thirty-two participants in one survey window and seventy-five
in a different survey window.
DEFINITION OF TERMS
Choice School – any school in the CCSD that is not considered a neighborhood school;
choice schools include charter schools, magnet schools, partial magnet schools,
constituent magnet schools, specialized or program schools.
Neighborhood School – each school-aged child is assigned to a neighborhood school
based on grade level and home address.
The Studer Group – a business that provides coaches that partner with organizations to
create an aligned culture accountable to achieving outcomes together. They advertise that
they establish, accelerate, and hardwire the necessary changes to create a culture of
excellence. This leads to better transparency, higher accountability, and the ability to
target and execute specific, objective results that organizations want to achieve.
Interstate School Leaders Licensure Consortium (ISLLC) Standards – standards that
represent the broad, high-priority themes that educational leaders must address in order to
promote the success of every student. These six standards call for:

13
Standard 1: Setting a widely shared vision for learning – an education leader promotes
the success of every student by facilitating the development, articulation, implementation,
and stewardship of a vision of learning that is shared and supported by all stakeholders;
Standard 2: Developing a school culture and instructional program conducive to student
learning and staff professional growth – an education leader promotes the success of
every student by advocating, nurturing, and sustaining a school culture and instructional
program conducive to student learning and staff professional growth;
Standard 3: Ensuring effective management of the organization, operation, and resources
for a safe, efficient, and effective learning environment – an education leader promotes
the success of every student by ensuring management of the organization, operation, and
resources for a safe, efficient, and effective learning environment;
Standard 4: Collaborating with faculty and community members, responding to diverse
community interests and needs, and mobilizing community resources – an education
leader promotes the success of every student by collaborating with faculty and
community members, responding to diverse community interests and needs, and
mobilizing community resources;
Standard 5: Acting with integrity, fairness, and in an ethical manner – an education leader
promotes the success of every student by acting with integrity, fairness, and in an ethical
manner;
Standard 6: Understanding, responding to, and influencing the political, social, legal,
and cultural contexts – an education leader promotes the success of every student by

14
understanding, responding to, and influencing the political, social, economic, legal, and
cultural context.
Palmetto Assessment of State Standards (PASS) – the Palmetto Assessment of State
Standards (PASS) was first administered in the spring of 2009. It is administered to South
Carolina public school students, including charter school students, in grades three
through eight.
Pearson correlation analysis – a technique for investigating the relationship between two
quantitative, continuous variables. Pearson’s correlation coefficient is a measure of the
strength of the association between two variables.
ORGANIZATION OF DISSERTATION
After the introductory chapter, the dissertation is organized into four additional
chapters. The second chapter is the literature review. The third chapter provides detailed
information on the methodology used in this study. The fourth chapter presents the results
of the research and provides information on the findings in regards to the established
research questions. The final chapter discusses the findings of the study and makes
recommendations for application in general educational settings and also provides
suggestions for future research on principal longevity, leadership behaviors, and student
academic achievement.
15
CHAPTER 2: LITERATURE REVIEW
THE ROLE AND IMPACT OF THE BUILDING LEVEL PRINCIPAL
The role of the building level principal can be difficult to define, as the
responsibilities and duties can vary from school to school. One can find a variety of
defined responsibilities when reviewing literature on the role of the principal. Research is
suggesting that principals contribute to school success by creating an environment of
collegial and productive collaboration among staff where optimal learning environments
are created versus directly affecting student academic outcomes through identified
leadership behaviors or roles (MetLife Project, 2012).
Habegger (2008) stated “the job description of a school principal cannot be
adequately described in a 1,000-word essay, let alone in a short paragraph; today’s
principal is constantly multitasking and shifting roles at a moment’s notice”. The
principal’s role and responsibilities can be dependent upon the school level, whether
elementary, middle, or high school. Hull (2012) stated that “principals also have more of
an impact at the lower grades. As a matter of fact, principals have the greatest impact in
elementary schools, less over middle schools, and the least over high schools”
(Leithwood, et al. 2004, Seashore-Louis, et al. 2010). Roles can also differ based on the
type of program the school offers, such as an arts infusion or Montessori focus.
Research suggests that an important part of a principal’s role is providing a
positive and collaborative school culture where collegial, productive relationships are

16
established. Creating a positive school culture allows many important educational and
operational components to occur, such as teacher collaboration, parental involvement,
etc. The role of the principal can also be influenced by the particular needs of the students
served.
Principals that serve in high performing schools with students of low
socioeconomic status report the importance of developing relationships with both
teachers and students, as students from backgrounds of poverty report that positive adult
and student relationships are key motivators for success. These principals also report that
the greatest learning occurs when positive relationships are developed and nurtured in
school settings that allow for these connections to be made; and that it is also important
for connections to be made between students’ personal knowledge and experiences and
the content standards (Habegger, 2008).
The CCSD is the school district used in this study. It is assumed that the principal
position description for individual school districts provides the expected role and
responsibilities of the principal within that district. A general principal position
description is available on the CCSD website.
The description states:
Eighty-five percent of the time for this position should be used for these primary
functions: Plans, organizes and directs the activities of a school; Cultivates a
vision for the school with measurable goals and strategies for implementation;
Carries out supervisory responsibilities in accordance with the school district’s
policies, procedures and applicable laws; Utilizes data to develop and monitor
educational goals and initiatives that promote improved academic achievement
17
for all students; Utilizes data to develop and monitor student behavioral/health
initiatives; Confers with teachers and students concerning educational and
behavioral initiatives in the school; Supervises the instructional program and
assists teachers in personal growth improvement; Manages subordinate
supervisors, teaching staff and support staff within assigned school; Plans, assigns
and directs employees’ work responsibilities; Assumes responsibility for
interviewing, hiring, training and appraising the work performance of all
employees; Assumes responsibility for the overall direction, coordination and
evaluation of all activities within assigned school; Plans and monitors the school
budgets, including the requisition and allocation of supplies, equipment and
instructional materials as needed; Directs preparation of class schedules,
cumulative records and attendance reports; Addresses concerns and resolves
problems; Provides for the safety and security of all students and staff by walking
about the school campus and facility and planning and directing building
maintenance; Develops and implements a professional growth plan; Establishes
and maintains relationships with colleges, community organizations and other
schools to coordinate educational services.
The position description states that the other fifteen percent of the time should be used to
“perform all duties as assigned by supervisor”.
The principal position description provided by the CCSD is reflected, generally,
in the leadership behaviors used on the employee engagement survey. For example,
leadership behavior one on the employee engagement survey is my principal provides
good processes and resources for me to do my job. This leadership behavior can be

18
aligned to the statement in the CCSD principal position description “plans and monitors
the school budgets, including the requisition and allocation of supplies, equipment and
instructional materials as needed”. If the principal is the instructional leader of the school,
as many school districts assume and expect, then what impact does a school based leader
have on the overall success of the school, more specifically the school climate as
indicated by employee survey results and student academic achievement as indicated by
standardized test scores?
Many would agree that principal leadership is a factor in overall school success;
the debate lies in how much of a factor it is in the overall successful school equation.
Louis, Leithwood, Wahlstrom, and Anderson (as cited in Gill, 2012) stated that “in a six-
year study analyzing data from 180 schools in nine states, researchers from the University
of Minnesota and Toronto found that leadership is second only to teaching among school-
related factors as an influence on student learning” (pp. 24-25).
Current educational research confirms that both teacher quality and principal
leadership are key priorities for school reform. Cultivating and improving principal
leadership is critical as research continues to suggest that effective principals create
school climates that allow for individual school related factors to combine and provide an
environment where increased student achievement can occur (The Wallace Foundation,
2012).
Additionally, the Wallace Foundation (2012) suggests that school districts that
pair schools with students that have academically at-risk characteristics and
inexperienced principals can be systemically contributing to the achievement gap among
groups of students. Branch et. al. (2013) stated:

19
Texas schools serving a high proportion of low-income students are more likely to
have first-year principals and less likely to have leaders who have been at the
school at least six years. The least effective principals are also least likely to
remain in their current position and more likely to leave the public school system
entirely (p. 67).
Research is suggesting that some school districts place first year principals, or
relatively inexperienced principals, in schools that have the most challenges related to
student achievement and that there may be a need for school districts to systemically
motivate and encourage principals to go to or remain at historically underachieving
schools. Miller (2009) stated:
Principal turnover is a common phenomenon nationwide. Using administrative
data from Texas, Cullen and Mazzeo (2008) report that about 22% of principals
switch jobs from one year to the next. Papa Jr. (2007) follows several cohorts of
new principals hired in New York finds that after four years only 46% are still
principals at the same school. Gates et al. (2006) followed a cohort of new
principals and found that after six years, only 37% of the Illinois cohort and 21%
of the North Carolina cohort remained principals at the same school. In addition,
it is known that more turnover takes place at low performing schools (Besley and
Machin (2008) and Cullen and Mazzeo (2008)), schools located in high poverty
communities, (Partlow and Ridenour (2008)), and schools with more minority and
limited English proficiency students (Gates et al. (2006) and Papa Jr. (2007)) (pp.
1-2).
20
Literature is suggesting that experienced principals may contribute to better
academic outcomes for students; therefore, more research is needed on the importance of
connecting the most experienced principals, with positive, measurable academic data,
with schools that have a history of academic underachievement.
LEADERSHIP STANDARDS AND BEHAVIORS
It may be difficult to identify, in measurable terms, the weight of principal
influence; however, discovering patterns in leadership behaviors associated with
environments of high academic achievement could prove beneficial to training and
educating future school building level leaders as well as contribute to principal
professional development plans for school districts.
One factor to consider in relation to leadership behaviors is that school districts
play an important role in the level of freedom, sometimes referred to as autonomy, that
school based leaders have within their position. That can have great impact on their
behaviors and, in turn, their level of effectiveness and success. Branch, et. al. (2013)
stated that “there are many channels through which principals influence school quality,
although the precise mechanisms likely vary across districts with the regulatory and
institutional structures that define principal authority” (p. 69).
Principals must function within the parameters that a school district provides for
them. There may be times when a principal might not agree with the policies that are in
place but must abide by these policies as required. Principals must also possess certain
academic requirements and leadership behaviors in order to apply for these positions,
depending on the needs of school districts.

21
Key leadership standards and behaviors exist in most states and are often based on
the Interstate School Leaders Licensure Consortium (ISLLC) standards. The
professionalization of the standards only holds true when individual school districts
utilize them to recruit, develop, and evaluate school based leaders and leadership systems
(Mendels and Mitgang, 2013).
The CCSD conducts the employee engagement surveys in an effort to create a
way to connect measurable data points with identified leadership behavior standards.
Clifford, Menon, Gangi, Condon, and Hornung (2012) support the idea of the need for
school districts to partner leadership standards with principal performance measurement
by stating that “although professional standards are in place to clearly articulate what
principals should know and do, states and school districts are often challenged to
determine how to measure principal performance in ways that are fair, systematic, and
useful” (p. 1).
The CCSD has selected the following ten leadership behaviors for the employee
engagement survey: my principal/supervisor provides good processes and resources for
me to do my job, my principal/supervisor has provided feedback on my strengths as an
employee, principal/supervisor led staff meetings make efficient use of time and are
productive, my principal/supervisor recognizes good performance, my
principal/supervisor demonstrates a genuine care for my welfare, my principal/supervisor
makes the best use of available funds, my principal/supervisor consults me on the
decisions that affect my job, the expectations for judging my performance are clear, my
principal/supervisor provides the support needed to accomplish my work objectives, and
22
my principal/supervisor has provided feedback concerning areas for improving my
performance.
RELATIONSHIPS BETWEEN PRINCIPAL LONGEVITY, LEADERSHIP
BEHAVIORS, AND STUDENT ACADEMIC ACHIEVEMENT
An important consideration when analyzing leadership behaviors, through
employee engagement surveys, might be the number of years a principal has been at the
school in which they are being rated. Some data trends indicate that principals that have
been at schools for longer periods of time have higher employee ratings. The Colorado
Department of Education (CDE) piloted an educator evaluation system in 2011-2012 and
2012-2013. The pilot study revealed:
Principals with over five years of experience as a principal, overall or in their
current school, receive the highest ratings. Considering only experience in their
current school, principals who are new or only have one year of experience in
their current school receive the lowest ratings (p. 14).
District level employees should consider evidence presented in recent educational
research that suggests that school improvement occurs most often when building level
leadership is consistent. Some research is suggesting that school improvement takes time
and that it takes five to seven years for a principal to provide beneficial impact to a
school. High principal turnover is associated with a lack of a shared vision by employees,
a decreased commitment to school initiatives and school improvement goals, and can
result in a poor school climate (The Wallace Foundation, 2012).

23
It often takes time and experiences for a building level principal to build a level of
trust, or lack thereof, with their staff. That level of trust would typically be reflected in
employee engagement survey results. It is also suggested that high turnover in the
principal position at a school can possibly decrease moral which may, in turn, decrease
employee engagement survey ratings.
Some would agree that typically the longer a person spends in a profession, the
better they become at their craft. This theory could apply to many professions. Some
research indicates that principals are more effective, as indicated by student achievement
data, with experience. Hull (2012) stated:
Principals become more effective as they gain more experience. Just as teachers
become more effective with experience, so do principals, especially in their first
three years (Clark, Martorell and Rockoff 2009). Furthermore, no matter how
effective a principal was at his or her previous school, when he or she transfers to
a new school it takes approximately five years to fully stabilize and improve the
teaching staff as well as fully implement policies and practices to positively
impact the school’s performance (Seashore-Louis, et al. 2010). Effective
principals still make significant improvements in their first few years; however,
their effectiveness definitely increases over time.
Today’s building level principal is required to continually conduct needs
assessments regarding student achievement and each year these data points and needs
change. Research is supporting the idea that gaining traction in efforts to increase
academic achievement is more likely to occur when the same principal stays in the same
school over time; yet data on principal movement is suggesting that this is not occurring.

24
Toner (2013) stated that across the country, schools are increasingly churning through
principals – and the problem is worse in urban districts with dwindling resources; nearly
one-fifth of Milwaukee’s public schools have new principals this year.
Principals have personalized ideas and perspectives on what they deem important;
and the strategies they incorporate to address these identified areas of importance vary
from person to person. If a school is experiencing high principal turnover it can be
difficult for the school to experience consistent academic success or continual gains.
Clark, Martorell, & Rockoff (2009) summarize research conducted in New York City
(NYC) by stating:
An important finding to emerge from our analysis is the positive impact of
principal experience, particularly over the first few years of principals’ careers.
Since this implies that new, inexperienced principals will, on average, hurt school
performance, it has at least two implications. First, it implies that policies that
lengthen principals’ careers will, on average, improve school performance, since
there will be fewer first-year principals. Second, it implies that a positive
correlation between principal experience and student background may exacerbate
inequality within the NYC education system (p. 34).
Today’s most challenging schools, serving the most challenging students, are
often being lead by principals and leadership teams with the least amount of experience.
Literature reviewed connects inexperienced leadership to adverse impacts on teacher
retention, student achievement, and overall school climate. Knowing that principal and
teacher effectiveness are two indicators closely aligned with student achievement, school
25
districts should be aware that principal turnover can deter the mission of high quality
school systems.
SUMMARY OF LITERATURE REVIEW
The roles and responsibilities of the building level principal can vary, depending
on the school level (elementary, middle, or high school) and the type of school (i.e. arts
infused, Montessori, or traditional). Research indicates that principal leadership is a
factor in overall school success. However, it can be difficult to isolate the contribution of
individual variables, such as principal longevity or leadership behaviors, in the overall
success of the school. More research is needed on initiatives that current public school
districts are implementing to retain effective principals in their current schools and more
study is needed on the patterns in leadership behaviors that contribute to positive student
academic achievement.
26
CHAPTER 3: METHODOLOGY
RESEARCH DESIGN
The researcher used Pearson’s correlation analyses in the study to investigate the
relationships among principal longevity, leadership behaviors, and academic
achievement. Principal longevity is the number of years a principal has been at their
current school. The leadership behaviors are selected by the CCSD and are a part of the
Studer employee engagement survey. The employee engagement survey is given to all
employees in the CCSD twice per school year and was given in December and March
during the 2012-2013 school year. Each principal is scored on a scale of 0-5 on the ten
leadership behaviors selected by the CCSD. The data from the last survey window in
2013 was used for the correlations. 2013 PASS scores for all students in grades 3-5 in
ELA were used in this study. PASS score figures listed reflect the percentages of students
in grades 3-5 who scored met or exemplary in ELA.
Pearson’s correlation analysis was completed for each of the first three research
questions. Additionally, in an effort to determine which leadership behaviors, of the ten
on the survey, were the highest with experience and which were the lowest with
experience the researcher grouped the principals into three groups based on years of
experience: group A = 1 – 4 years of experience; group B = 5 – 8 years of experience;
and group C = 9 or more years of experience. The researcher averaged the individual
leadership indicators, items 1 through 10, for each group to determine which group had

27
the highest and which group had the lowest for each of the ten leadership behaviors. This
allowed the researcher to discover which three leadership behaviors were highest with
experience and which three leadership behaviors were the lowest with experience. More
specifically, the researcher identified which three behaviors were the highest and which
behaviors were the lowest for all three groups of principals.
PARTICIPANTS
Nineteen neighborhood elementary school principals in the Charleston County
School District (CCSD) were selected for the study. A neighborhood school is defined as
a school that uses a geographical attendance zone for student enrollment. All nineteen
principals led a neighborhood school, as defined by the CCSD, during the 2012-2013
school year.
Neighborhood schools were used for this study in an effort to maintain a constant
variable in that all of these schools follow the same policies for student enrollment.
Choice school factors, such as academic requirements for admission, parental
involvement level needed for initially choosing school choice alternatives and completing
the application process, and transportation factors that can limit student access may
contribute to academic achievement levels at these schools; therefore these schools were
not used in this study. No choice schools in the Charleston County School District were
used in this study – including, but not limited to, charter, magnet, and partial magnet
schools.
Schools selected for the study: Angel Oak Elementary School, Belle Hall
Elementary School, Drayton Hall Elementary School, Goodwin Elementary School,

28
Harbor View Elementary School, James Island Elementary School, Ladson Elementary
School, Mary Ford Elementary School, Mt. Pleasant Academy Elementary School, Mt.
Zion Elementary School, Oakland Elementary School, Pepperhill Elementary School,
Charles Pinckney Elementary School, Pinehurst Elementary School, Springfield
Elementary School, Stiles Point Elementary School, Stono Park Elementary School,
Sullivans Island Elementary School, and Whitesides Elementary School.
INSTRUMENTS
The number of years each principal has been at their current school, known as
principal longevity, can be found on the South Carolina Department of Education’s
website. Every public school in South Carolina is given a school report card each year
and one of the data points listed on the school’s report card is the number of years the
principal has been at that school at the end of that school year.
The CCSD contracts with The Studer Group to assess school district leadership
positions, including building level principals. Principals are assessed on ten leadership
behaviors, selected by the CCSD. The behaviors are as follows:
1 – My principal/supervisor provides good processes and resources for me to do my job.
2 – My principal/supervisor has provided feedback on my strengths as an employee.
3 – Principal/supervisor led staff meetings make efficient use of time and are productive.
4 – My principal/supervisor recognizes good performance.
5 – My principal/supervisor demonstrates a genuine care for my welfare.
6 – My principal/supervisor makes the best use of available funds.
29
7 – My principal/supervisor consults me on the decisions that affect my job.
8 – The expectations for judging my performance are clear.
9 – My principal/supervisor provides the support needed to accomplish my work
objectives.
10 – My principal/supervisor has provided feedback concerning areas for improving my
performance.
The survey is given to all employees twice per school year and was given in
December and March during the 2012-2013 school year. Each principal is rated on a
scale of 0-5 by their employees on the ten leadership behaviors selected by the CCSD.
Using the Likert scale, Studer is able to quantify the ratings as follows:
1 – strongly disagree
2 – disagree
3 – mixed feelings
4 – agree
5 – strongly agree
Four additional survey questions, questions 11-14, are included on the building
level principal’s overall average. However, these survey questions are on the CCSD
superintendent’s leadership behaviors. Therefore, the last four questions were eliminated
when calculating each principal’s mean score for each leadership behavior. The last four
questions are: the superintendent manages district finances effectively, the superintendent
30
uses a variety of methods to promote effective communication throughout the district, the
superintendent makes informed decisions based on the best interest of the district, and if
given a choice, I would recommend that a parent select this district for his or her child.
The CCSD contracts the Studer Group to assist in evaluating school based
principals and district office staff. The Studer Group provides the employee engagement
surveys for the CCSD as part of their K12 Accountability System and Continuous
Improvement Process department. Initially The Studer Group worked in the health care
field; however, they have expanded into the educational field. The Studer Group terms
their expansion into the educational field initiative Evidence Based Leadership (EBL)
K12. The Studer Group website provided the following statement as to the history of
their involvement in the educational field:
For the past 15 years, Studer Group coaches have worked side by side with
leaders in healthcare organizations to help them achieve measurable results that
produce positive clinical outcomes, patient satisfaction, and employee
engagement. In 2010, Dr. Janet Pilcher initiated the education division to apply
the Evidence-Based Leadership Framework in school districts. Dr. Pilcher started
the first effort in the School District of Janesville to pilot the model and make
adaptations to align to K12 education. Since the inception of Studer Education,
Dr. Robin Largue and Dr. Pilcher have coached several early adopters – these
early adopters have seen improvements in student achievement, employee
engagement, parent satisfaction, district support services, and financial
efficiencies and productivity. As part of the EBL K12, employee engagement is
defined as the extent to which leaders provide a work environment that supports

31
and coaches employees to reach their highest potential. The Studer Education
Employee Engagement Survey measures this construct.
In this study, academic achievement was measured using 2013 Palmetto
Assessment of State Standards (PASS) ELA scores for students in grades 3-5 in all
nineteen schools. The PASS data represented is the percent of all students scoring met
and exemplary in ELA. This data is reported on the school’s annual report card.
PROCEDURES
The researcher utilized Pearson’s correlations in the study to analyze the
relationships between principal longevity, leadership behaviors, and academic
achievement. Principal longevity is the number of years a principal has been at their
current school. The leadership behaviors are selected by the CCSD and are a part of the
Studer employee engagement survey. The employee engagement survey data from the
last survey window for the 2012-2013 was used in the correlations. PASS scores for all
students in grades 3-5 in ELA were used in this study. PASS score figures listed reflect
percentage of students in grades 3-5 who scored met or exemplary in ELA.
The researcher completed three correlations on the following: principal longevity
and employee survey results, principal longevity and student academic achievement, and
employee survey results and student academic achievement.
32
Additionally, in an effort to determine which leadership behaviors, of the ten on
the survey, were rated highest with principal experience and which were rated lowest
with principal experience the researcher grouped the principals into three groups based on
their years of experience. These groups are as follows: group A = 1-4 years of
experience, group B = 5-8 years of experience and group C = 9 or more years of
experience. The researcher averaged the individual leadership indicators, items 1 through
10, for each group to determine which group had the highest and which group had the
lowest for each of the ten leadership behaviors. This allowed the researcher to discover
which three leadership behaviors were rated highest with experience and which three
leadership behaviors were rated lowest with experience.
SUMMARY OF METHODOLOGY
The researcher utilized Pearson’s correlation to analyze the relationships among
principal longevity, leadership behaviors, and academic achievement. The analysis of
these correlations in the CCSD between principal longevity and high ratings on employee
engagement surveys on certain leadership behaviors were analyzed in an effort to identify
which leadership behaviors might need to be further developed through principal
induction programs or programs for development of school based leaders in their first
few years of leadership. High ratings on the employee engagement survey on certain
leadership behaviors in correlation to high student achievement were analyzed as well.
Studying the relationships among these three variables could provide an outline of best
practice for training and preparing school based principals at the college level, as well as
at the school district level, through professional development for school based leaders.

33
CHAPTER 4: DATA ANALYSIS
DATA OVERVIEW
Nineteen neighborhood elementary school principals in the CCSD were selected
for the study. All nineteen principals led a neighborhood school, as defined by the CCSD,
during the 2012-2013 school year. A neighborhood school is defined as a school that uses
a geographical attendance zone for student enrollment.
Only neighborhood schools were used for this study in an effort to maintain a
constant variable, in that all of these schools follow the same residency requirement
policies for student enrollment. Choice school factors, such as academic requirements for
admission, parental involvement level needed for initially choosing school choice
alternatives and completing the application process, and transportation factors that can
limit student access may contribute to academic achievement levels at these schools;
therefore these schools were not used in this study. No choice schools in the CCSD were
used in this study – including, but not limited to, charter, magnet, and partial magnet
schools.
The name of each school and the number of years the principal had been at that
school at the end of the 2012-2013 school year are listed in the table below.

34
Table 4.1
Elementary School and Principal’s Years of Experience
Elementary School Years of Experience
Angel Oak 5
Belle Hall 5
Drayton Hall 9
Goodwin 5
Harbor View 3
James Island 3
Ladson 3
Mary Ford 3
Mt. Pleasant Academy 25
Mt. Zion 9
Oakland 5
Pepperhill 6
Pinckney 9
Pinehurst 4
Springfield 3
Stiles Point 17
Stono Park 3
Sullivan’s Island 9
Whitesides 10
South Carolina Department of Education
Leadership behaviors used in this study are found on the employee engagement
survey. The CCSD gives employees these surveys to rate their direct supervisor on their
leadership behaviors. Teachers complete two surveys per year on their building level
principal and principals complete two surveys a year on district level employees. The
mean for the first ten leadership behaviors from the last survey window from 2013 were
used in this study. The following tables, Table 4.2 through Table 4.11, display the school
name and the employee engagement survey rating score for each leadership behavior for
each school.

35
Table 4.2
Leadership Behavior One – My principal provides good processes and
resources for me to do my job.
Elementary School Rating
Angel Oak 4.62
Belle Hall 4.95
Drayton Hall 4.72
Goodwin 4.71
Harbor View 4.43
James Island 3.92
Ladson 4.10
Mary Ford 4.61
Mt. Pleasant Academy 4.52
Mt. Zion 4.20
Oakland 4.48
Pepperhill 4.45
Pinckney 4.83
Pinehurst 4.40
Springfield 3.30
Stiles Point 4.79
Stono Park 4.47
Sullivan’s Island 4.46
Whitesides 4.44
Charleston County School District
36
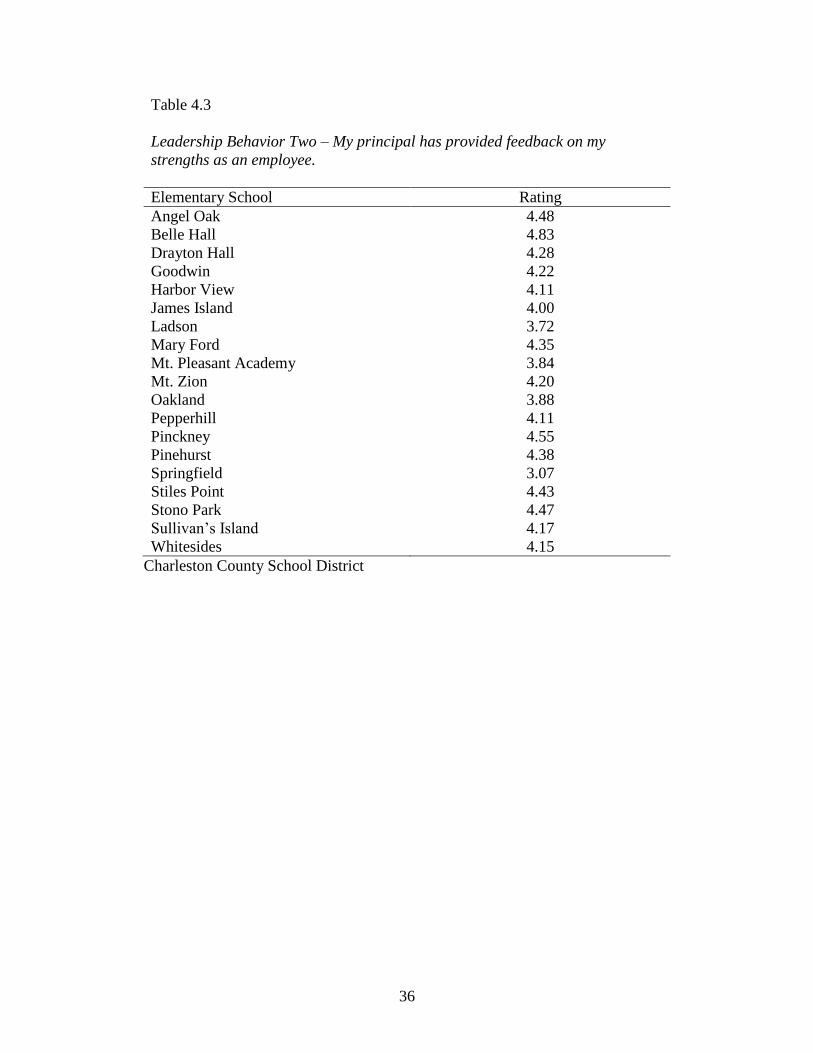
Table 4.3
Leadership Behavior Two – My principal has provided feedback on my
strengths as an employee.
Elementary School Rating
Angel Oak 4.48
Belle Hall 4.83
Drayton Hall 4.28
Goodwin 4.22
Harbor View 4.11
James Island 4.00
Ladson 3.72
Mary Ford 4.35
Mt. Pleasant Academy 3.84
Mt. Zion 4.20
Oakland 3.88
Pepperhill 4.11
Pinckney 4.55
Pinehurst 4.38
Springfield 3.07
Stiles Point 4.43
Stono Park 4.47
Sullivan’s Island 4.17
Whitesides 4.15
Charleston County School District

37
Table 4.4
Leadership Behavior Three – Principal led staff meetings make efficient use of
my time and are productive.
Elementary School Rating
Angel Oak 4.05
Belle Hall 4.95
Drayton Hall 4.64
Goodwin 4.68
Harbor View 4.49
James Island 3.54
Ladson 3.91
Mary Ford 4.36
Mt. Pleasant Academy 4.52
Mt. Zion 4.20
Oakland 4.40
Pepperhill 4.10
Pinckney 4.90
Pinehurst 4.52
Springfield 3.19
Stiles Point 4.68
Stono Park 4.59
Sullivan’s Island 4.17
Whitesides 4.34
Charleston County School District

38
Table 4.5
Leadership Behavior Four – My principal recognizes good performance.
Elementary School Rating
Angel Oak 4.62
Belle Hall 4.85
Drayton Hall 4.32
Goodwin 4.41
Harbor View 4.40
James Island 3.96
Ladson 3.78
Mary Ford 4.26
Mt. Pleasant Academy 3.92
Mt. Zion 3.60
Oakland 3.65
Pepperhill 4.41
Pinckney 4.67
Pinehurst 4.34
Springfield 2.89
Stiles Point 4.36
Stono Park 4.59
Sullivan’s Island 4.08
Whitesides 4.17
Charleston County School District

39
Table 4.6
Leadership Behavior Five – My principal demonstrates a genuine concern for
my welfare.
Elementary School Rating
Angel Oak 4.52
Belle Hall 4.95
Drayton Hall 4.48
Goodwin 4.41
Harbor View 4.56
James Island 3.92
Ladson 3.87
Mary Ford 4.48
Mt. Pleasant Academy 3.76
Mt. Zion 4.20
Oakland 4.23
Pepperhill 4.52
Pinckney 4.74
Pinehurst 4.16
Springfield 2.96
Stiles Point 4.50
Stono Park 4.47
Sullivan’s Island 4.54
Whitesides 4.61
Charleston County School District
40
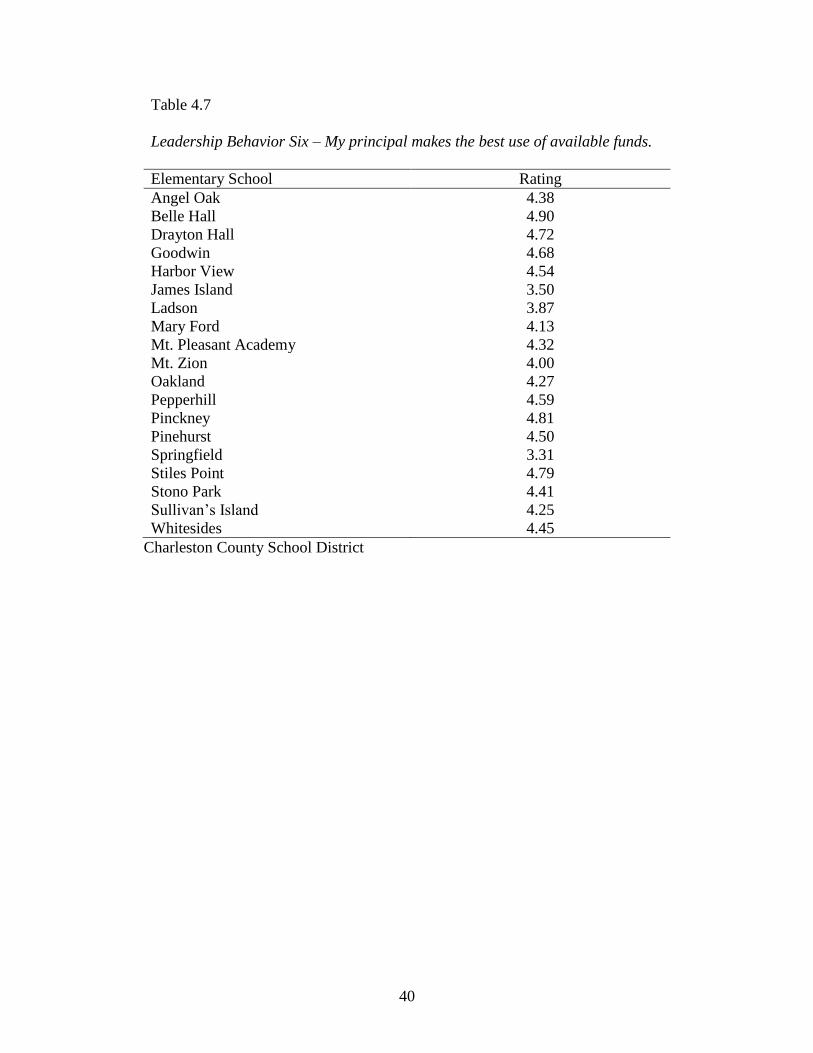
Table 4.7
Leadership Behavior Six – My principal makes the best use of available funds.
Elementary School Rating
Angel Oak 4.38
Belle Hall 4.90
Drayton Hall 4.72
Goodwin 4.68
Harbor View 4.54
James Island 3.50
Ladson 3.87
Mary Ford 4.13
Mt. Pleasant Academy 4.32
Mt. Zion 4.00
Oakland 4.27
Pepperhill 4.59
Pinckney 4.81
Pinehurst 4.50
Springfield 3.31
Stiles Point 4.79
Stono Park 4.41
Sullivan’s Island 4.25
Whitesides 4.45
Charleston County School District
41
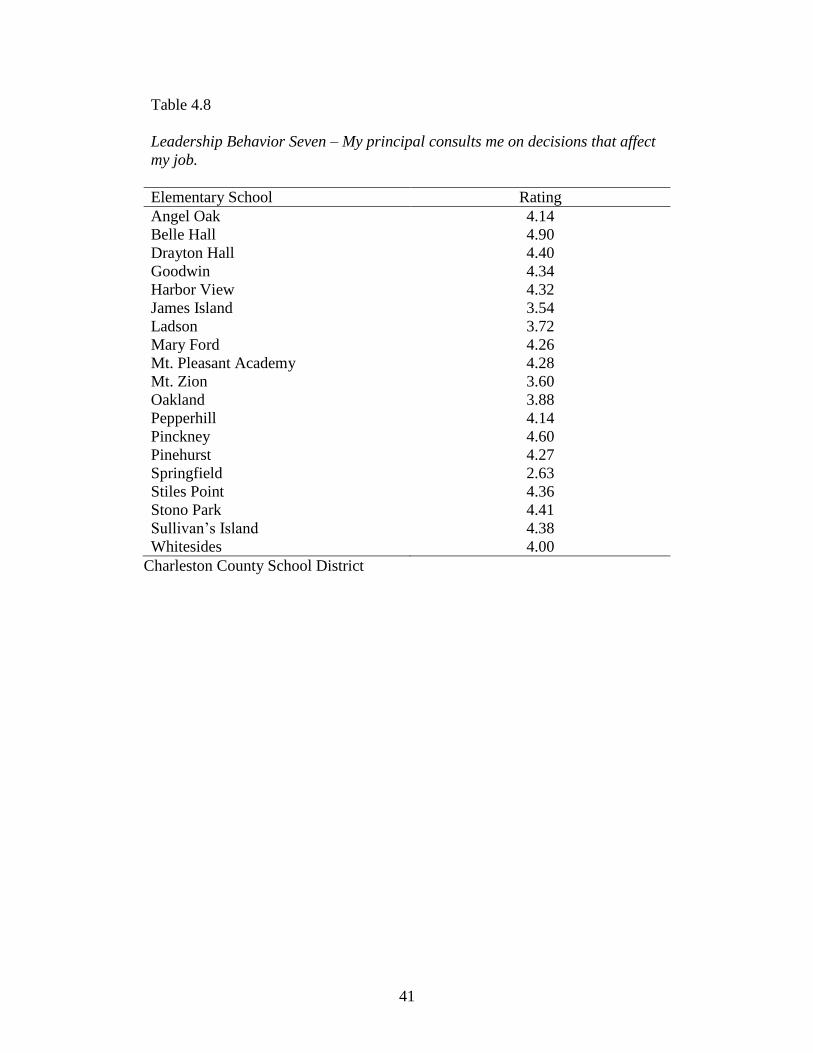
Table 4.8
Leadership Behavior Seven – My principal consults me on decisions that affect
my job.
Elementary School Rating
Angel Oak 4.14
Belle Hall 4.90
Drayton Hall 4.40
Goodwin 4.34
Harbor View 4.32
James Island 3.54
Ladson 3.72
Mary Ford 4.26
Mt. Pleasant Academy 4.28
Mt. Zion 3.60
Oakland 3.88
Pepperhill 4.14
Pinckney 4.60
Pinehurst 4.27
Springfield 2.63
Stiles Point 4.36
Stono Park 4.41
Sullivan’s Island 4.38
Whitesides 4.00
Charleston County School District

42
Table 4.9
Leadership Behavior Eight – The expectations for judging my performance are
clear.
Elementary School Rating
Angel Oak 4.48
Belle Hall 4.93
Drayton Hall 4.40
Goodwin 4.71
Harbor View 4.37
James Island 4.42
Ladson 4.16
Mary Ford 4.52
Mt. Pleasant Academy 4.32
Mt. Zion 4.20
Oakland 4.04
Pepperhill 4.24
Pinckney 4.74
Pinehurst 4.40
Springfield 3.19
Stiles Point 4.59
Stono Park 4.59
Sullivan’s Island 4.38
Whitesides 4.44
Charleston County School District

43
Table 4.10
Leadership Behavior Nine – My principal provides the support needed to
accomplish my work objectives.
Elementary School Rating
Angel Oak 4.43
Belle Hall 4.95
Drayton Hall 4.60
Goodwin 4.56
Harbor View 4.43
James Island 3.83
Ladson 3.94
Mary Ford 4.35
Mt. Pleasant Academy 4.20
Mt. Zion 4.00
Oakland 4.23
Pepperhill 4.38
Pinckney 4.71
Pinehurst 4.42
Springfield 2.96
Stiles Point 4.71
Stono Park 4.47
Sullivan’s Island 4.50
Whitesides 4.44
Charleston County School District
44
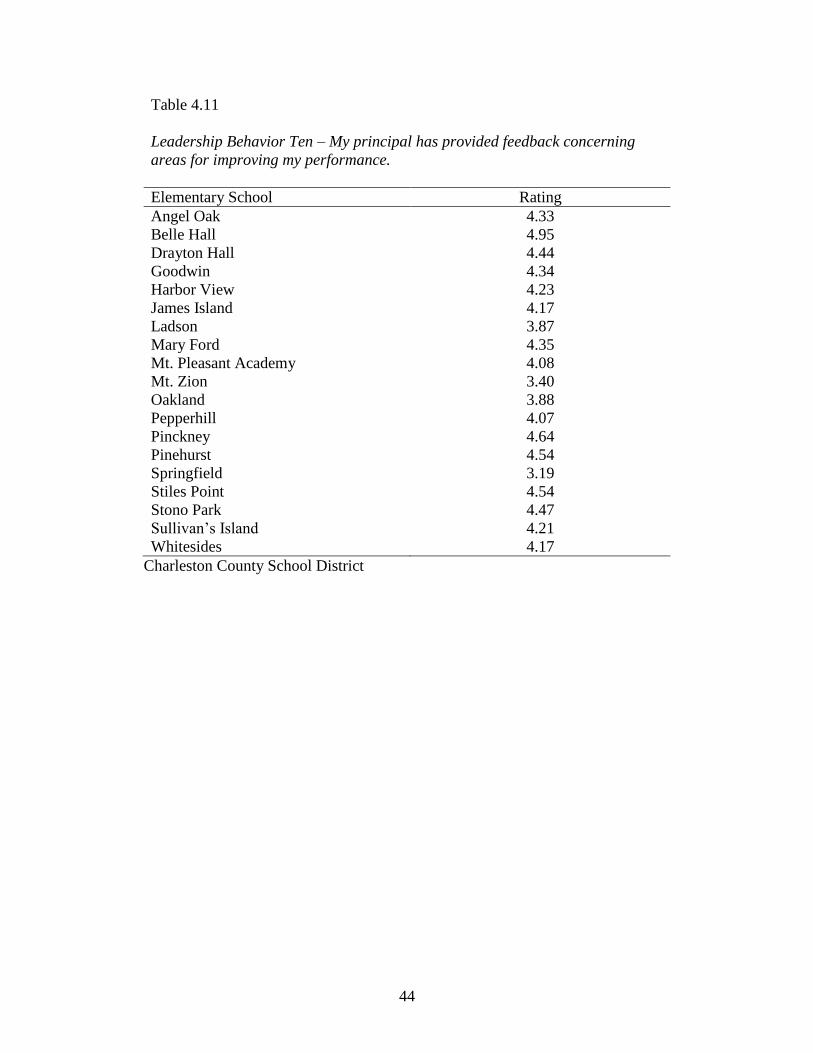
Table 4.11
Leadership Behavior Ten – My principal has provided feedback concerning
areas for improving my performance.
Elementary School Rating
Angel Oak 4.33
Belle Hall 4.95
Drayton Hall 4.44
Goodwin 4.34
Harbor View 4.23
James Island 4.17
Ladson 3.87
Mary Ford 4.35
Mt. Pleasant Academy 4.08
Mt. Zion 3.40
Oakland 3.88
Pepperhill 4.07
Pinckney 4.64
Pinehurst 4.54
Springfield 3.19
Stiles Point 4.54
Stono Park 4.47
Sullivan’s Island 4.21
Whitesides 4.17
Charleston County School District

45
The researcher averaged each leadership behavior to identify which behaviors had
the highest and lowest ratings for the 19 schools in the study. The following table
displays this information.
Table 4.12
Leadership Behavior Averages for All Schools
Leadership Behavior Average
Rank (Highest to
Lowest)
One 4.44 1
Two 4.17 Tie 8
Three 4.33 4
Four 4.17 Tie 9
Five 4.31 6
Six 4.34 3
Seven 4.11 10
Eight 4.37 2
Nine 4.32 5
Ten 4.20 7
The highest rated leadership behavior was behavior one – My principal provides
good processes and resources for me to do my job. The second highest rated leadership
behavior was behavior eight – The expectations for judging my performance are clear.
The third highest rated leadership behavior is behavior six – My principal makes the best
use of available funds.
The lowest rated leadership behavior was behavior seven – My principal consults
me on decisions that affect my job. There was a tie for the second lowest rated leadership
behavior between behaviors two – My principal has provided feedback on my strengths
as an employee and behavior four – My principal recognizes good performance. The third

46
lowest rated leadership behavior was behavior ten – My principal has provided feedback
concerning areas for improving my performance.
The researcher observed that the highest rated behaviors for the 19 schools are
more measurable and the lowest rated behaviors are somewhat less measurable. Although
all ten of the leadership behaviors allow for subjective, versus objective, thought by
employees completing the survey, it is the belief of the researcher that the 19 principals in
the study were rated higher when the behavior was able to be more clearly measured.
The study utilized the first ten leadership behaviors on the Studer employee
engagement survey and eliminated the last four items on the survey, only using the first
ten when averaging each principal’s mean. The last four behaviors were eliminated
because they are ratings for the CCSD superintendent, not the individual school based
principal. The last four leadership behavior ratings varied from school to school
depending on how the employees in the individual schools rated the superintendent on
these four leadership behaviors.
Each school was affected differently by the initial inclusion and the elimination of
these four items; therefore these four items were eliminated from each principal’s mean.
The following table displays the differentials:

47
Table 4.13
Leadership Behavior Differentials
Elementary School All 14 Leadership
Behaviors
Without
Behaviors 11-14
Differential
Angel Oak 4.33 4.405 +0.075
Belle Hall 4.79 4.916 +0.126
Drayton Hall 4.30 4.500 +0.200
Goodwin 4.34 4.506 +0.166
Harbor View 4.27 4.388 +0.118
James Island 3.80 3.880 +0.080
Ladson 3.95 3.894 -0.056
Mary Ford 4.25 4.367 +0.117
Mt. Pleasant 4.21 4.176 -0.034
Mt. Zion 3.74 3.960 +0.220
Oakland 4.12 4.094 -0.026
Pepperhill 4.22 4.301 +0.081
Pinckney 4.62 4.719 +0.099
Pinehurst 4.31 4.393 +0.083
Springfield 3.26 3.069 -0.191
Stiles Point 4.39 4.575 +0.185
Stono Park 4.43 4.494 +0.064
Sullivan’s Island 4.35 4.339 -0.011
Whitesides 4.25 4.323 +0.073
Charleston County School District
Academic achievement was measured utilizing 2013 PASS scores for all students
in grades 3-5 in English Language Arts (ELA). PASS scores listed reflect percentage of
students in grades 3-5 who scored met or exemplary in ELA. The following table
displays the PASS scores for each school:

48
Table 4.14
PASS Percent Met and Exemplary in English Language Arts
Elementary School % Met & Exemplary
Angel Oak 66.3
Belle Hall 94.8
Drayton Hall 87.4
Goodwin 73.0
Harbor View 92.3
James Island 80.6
Ladson 72.5
Mary Ford 77.5
Mt. Pleasant Academy 96.7
Mt. Zion 75.3
Oakland 84.7
Pepperhill 75.0
Pinckney 95.6
Pinehurst 63.0
Springfield 87.3
Stiles Point 94.0
Stono Park 87.2
Sullivan’s Island 97.9
Whitesides 89.5
South Carolina Department of Education
RESEARCH QUESTION ONE
Research question one – What is the correlation and statistical significance
between principal longevity and leadership behavior ratings? The null hypothesis is that
there is no correlation between principal longevity and leadership behavior ratings. The
researcher’s hypothesis is that there will be a positive correlation between longevity and
leadership behavior ratings.
The researcher found that there was a positive correlation between principal
longevity and the overall mean of the ten leadership behaviors for each school. Using a
one tailed test, an alpha level of 0.05, a degree of freedom of 17, and the Table of Critical

49
Values for Pearson’s r, the researcher determined that in order for this correlation to be
considered statistically significant, the correlation would need to be higher than 0.389.
The value of r for this correlation is 0.1599. Although this is a positive correlation, the
relationship between principal longevity and leadership behaviors does not have
statistical significance.
The following table displays the name of each school, the number of years the
principal had been at the school as of 2013, and the mean of the ten leadership behaviors
for each principal. The correlation between principal longevity and overall leadership
behavior ratings is listed at the bottom of the table:
Table 4.15
Principal Longevity and Overall Leadership Behavior Rating
School Name Longevity Overall Rating
Angel Oak 5 4.405
Belle Hall 5 4.916
Drayton Hall 9 4.500
Goodwin 5 4.506
Harbor View 3 4.388
James Island 3 3.880
Ladson 3 3.894
Mary Ford 3 4.367
Mt. Pleasant Academy 25 4.176
Mt. Zion 9 3.960
Oakland 5 4.094
Pepperhill 6 4.301
Pinckney 9 4.719
Pinehurst 4 4.393
Springfield 3 3.069
Stiles Point 17 4.575
Stono Park 3 4.494
Sullivans Island 9 4.339
Whitesides 10 4.323
Longevity and Overall Rating Correlation
0.159856894
50
The null hypothesis was found to be incorrect because there was a correlation
between principal longevity and the overall mean of the ten leadership behaviors for each
school. The researcher’s hypothesis was correct; however the strength of the correlation
was weaker than the researcher expected and statistically insignificant.
RESEARCH QUESTION TWO
Research question two – What is the correlation and statistical significance
between principal longevity and student academic achievement? The null hypothesis is
that there is no correlation between principal longevity and student academic
achievement. The researcher’s hypothesis is that there will be a positive correlation
between principal longevity and student academic achievement.
The researcher found that there was a positive correlation between principal
longevity and student academic achievement. Using a one tailed test, an alpha level of
0.05, a degree of freedom of 17, and the Table of Critical Values for Pearson’s r, the
researcher determined that in order for this correlation to be considered statistically
significant, the correlation would need to be higher than 0.389. The value of r for this
correlation is 0.4795. This is a positive correlation and determined to be statistically
significant.
The following table displays the name of the school, the number of years the
principal had been at the school as of 2013, and the percent of students in grades 3-5 that
scored met or exemplary on the ELA section of the 2013 PASS test. The correlation
between principal longevity and student academic achievement is listed at the bottom of
this table:

51
Table 4.16
Principal Longevity and Student Academic Achievement
School Name Longevity PASS
Angel Oak 5 66.3
Belle Hall 5 94.8
Drayton Hall 9 87.43
Goodwin 5 73
Harbor View 3 92.3
James Island 3 80.6
Ladson 3 72.5
Mary Ford 3 77.5
Mt. Pleasant Academy 25 96.7
Mt. Zion 9 75.3
Oakland 5 84.7
Pepperhill 6 75
Pinckney 9 95.6
Pinehurst 4 63
Springfield 3 87.3
Stiles Point 17 94
Stono Park 3 87.2
Sullivans Island 9 97.9
Whitesides 10 89.5
Longevity and PASS Correlation 0.4795
The null hypothesis was found to be incorrect because there was a correlation
between principal longevity and student academic achievement. The researcher’s
hypothesis was correct. The researcher recognizes that this correlation is the strongest
among the correlations performed and also the only correlation that was considered
statistically significant.
In an effort to analyze additional data related to principal longevity and student
academic achievement, the researcher divided the principals into three categories. These
categories are as follows: group A are principals with 1 – 4 years of experience, group B
are principals with 5 – 8 years of experience, and group C are principals with 9 or more

52
years of experience. The principal longevity groups are as follows: Group A (n=7):
Harbor View (3), James Island (3), Ladson (3), Mary Ford (3), Pinehurst (4), Springfield
(3), Stono Park (3); Group B (n=5): Angel Oak (5), Belle Hall (5), Goodwin (5), Oakland
(5), Pepperhill (6); and Group C (n=7): Drayton Hall (9), Mt Pleasant Academy (25), Mt.
Zion (9), Pinckney (9), Stiles Point (17), Sullivans Island (9), Whitesides (10).
The researcher calculated the average PASS scores for each of the groups to
further analyze the relationship between principal longevity and student academic
achievement. The table below provides this information:

53
Table 4.17
Average PASS Scores with Years of Experience
School Number of Years PASS
Group A
Harbor View 3 92.3
James Island 3 80.6
Ladson 3 72.5
Mary Ford 3 77.5
Pinehurst 4 63.0
Springfield 3 87.3
Stono Park 3 87.2
Group A Averages 3.14 80.1
Group B
Angel Oak 5 66.3
Belle Hall 5 94.8
Goodwin 5 73.0
Oakland 5 84.7
Pepperhill 6 75.0
Group B Averages 5.20 78.8
Group C
Drayton Hall 9 87.4
Mt Pleasant Academy 25 96.7
Mt. Zion 9 75.3
Pinckney 9 95.6
Stiles Point 17 94.0
Sullivans Island 9 97.9
Whitesides 10 89.5
Group C Averages 12.57 90.9
Group C, the group with the most experience, had the highest level of student academic
achievement, with 90.9 % of students scoring met or exemplary on the 2013 ELA section
of the PASS test. However, group A, the group with the least amount of experience,
outscored group B by 1.3 percentile points. It is the belief of the researcher that the
outcome of group A outscoring group B by 1.3 percentile points may be attributed to a
54
small sample size and that a study using a larger sample size could produce different and,
potentially, more reliable data.
RESEARCH QUESTION THREE
Research question three – What is the correlation and statistical significance
between leadership behavior ratings and student academic achievement? The null
hypothesis is that there is no correlation between leadership behavior ratings and student
academic achievement. The researcher’s hypothesis is that there will be a positive
correlation between leadership behavior ratings and student academic achievement.
The researcher found that there was a positive correlation between the overall
mean of the ten leadership behaviors for each school and student academic achievement
for each school. Using a one tailed test, an alpha level of 0.05, a degree of freedom of 17,
and the Table of Critical Values for Pearson’s r, the researcher determined that in order
for this correlation to be considered statistically significant, the correlation would need to
be higher than 0.389. The value of r for this correlation is 0.1791. Although this is a
positive correlation, the relationship between principal longevity and leadership
behaviors does not have statistical significance.
The following table displays the school name, the overall employee engagement
survey rating per school, and the percent of students in grades 3-5 that scored met or
exemplary on the ELA section of the 2013 PASS test. The correlation between leadership
behavior ratings and student academic achievement is listed at the bottom of this table:
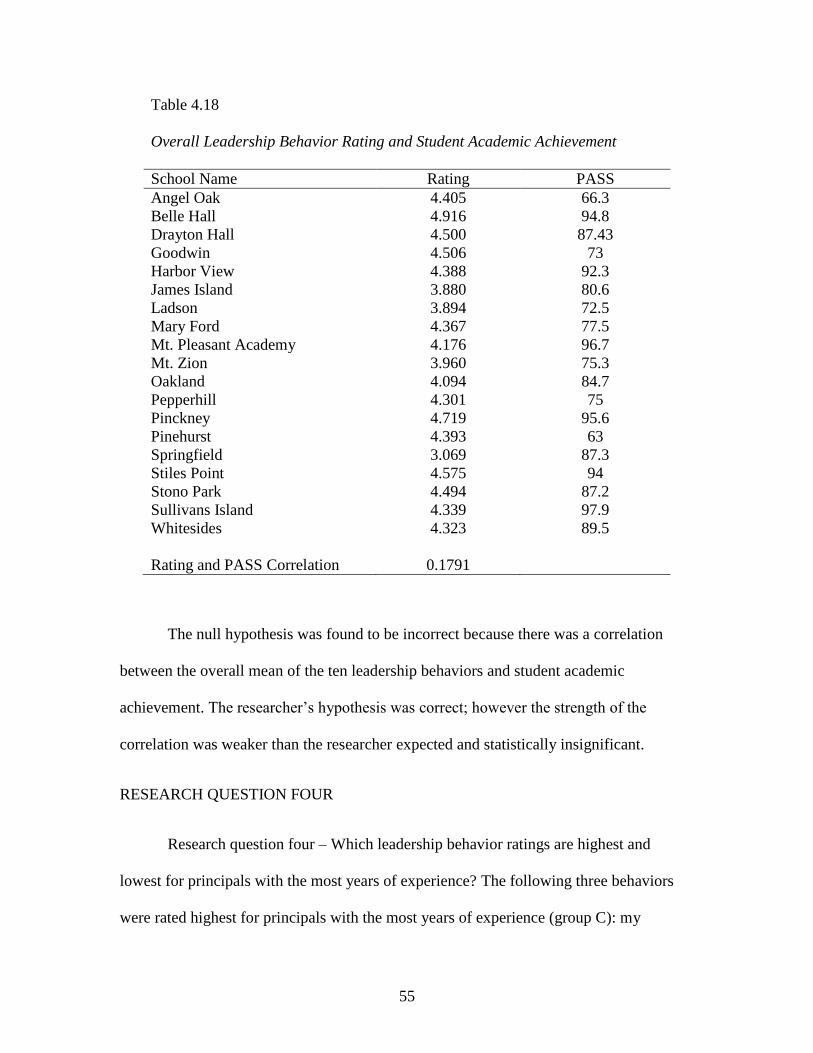
55
Table 4.18
Overall Leadership Behavior Rating and Student Academic Achievement
School Name Rating PASS
Angel Oak 4.405 66.3
Belle Hall 4.916 94.8
Drayton Hall 4.500 87.43
Goodwin 4.506 73
Harbor View 4.388 92.3
James Island 3.880 80.6
Ladson 3.894 72.5
Mary Ford 4.367 77.5
Mt. Pleasant Academy 4.176 96.7
Mt. Zion 3.960 75.3
Oakland 4.094 84.7
Pepperhill 4.301 75
Pinckney 4.719 95.6
Pinehurst 4.393 63
Springfield 3.069 87.3
Stiles Point 4.575 94
Stono Park 4.494 87.2
Sullivans Island 4.339 97.9
Whitesides 4.323 89.5
Rating and PASS Correlation 0.1791
The null hypothesis was found to be incorrect because there was a correlation
between the overall mean of the ten leadership behaviors and student academic
achievement. The researcher’s hypothesis was correct; however the strength of the
correlation was weaker than the researcher expected and statistically insignificant.
RESEARCH QUESTION FOUR
Research question four – Which leadership behavior ratings are highest and
lowest for principals with the most years of experience? The following three behaviors
were rated highest for principals with the most years of experience (group C): my

56
principal/supervisor provides good processes and resources for me to do my job,
principal/supervisor led staff meetings make efficient use of time and are productive, and
my principal/supervisor makes the best use of available funds.
Due to a tie for third lowest rated leadership behavior for group C the following
four behaviors were rated lowest for principals with the most years of experience (group
C): my principal/supervisor recognizes good performance, my principal/supervisor has
provided feedback concerning areas for improving my performance, and the third lowest
was a tie between two behaviors, my principal/supervisor has provided feedback on my
strengths as an employee and my principal/supervisor consults me on the decisions that
affect my job. The following tables display this information:
Table 4.19
Highest Rated Leadership Behaviors per Group
Group Highest Second Highest Third Highest
A 8 – The expectations
for judging my
performance are
clear. (4.41)
1 – My
principal/supervisor
provides good
processes and
resources for me to
do my job. (4.32)
10 – My
principal/supervisor
has provided feedback
concerning areas for
improving my
performance. (4.27)
B 1 – My
principal/supervisor
provides good
processes and
resources for me to
do my job. (4.57)
6 – My
principal/supervisor
makes the best use of
available funds.
(4.48)
5 – My
principal/supervisor
demonstrates a
genuine care for my
welfare. (4.42)
C 1 – My
principal/supervisor
provides good
processes and
resources for me to
do my job. (4.57)
3 –
Principal/supervisor
led staff meetings
make efficient use of
time and are
productive. (4.53)
6 – My
principal/supervisor
makes the best use of
available funds. (4.48)

57
Table 4.20
Lowest Rated Leadership Behaviors per Group
Group Lowest Second Lowest Third Lowest
A 7 – My
principal/supervisor
consults me on the
decisions that affect
my job. (4.09)
6 – My
principal/supervisor
makes the best use of
available funds.
(4.16)
2 – My
principal/supervisor
has provided feedback
on my strengths as an
employee. (4.17)
B 7 – My
principal/supervisor
consults me on the
decisions that affect
my job. (4.13)
10 – My
principal/supervisor
has provided
feedback concerning
areas for improving
my performance.
(4.16)
2 – My
principal/supervisor
has provided feedback
on my strengths as an
employee. (4.17)
C 4 – My
principal/supervisor
recognizes good
performance. (4.16)
10 – My
principal/supervisor
has provided
feedback concerning
areas for improving
my performance.
(4.21)
2 – My
principal/supervisor
has provided feedback
on my strengths as an
employee. (4.23) and 7
– My
principal/supervisor
consults me on the
decisions that affect
my job. (4.23)
Although question four was answered by identifying the highest and lowest rated
behaviors for principals with the most years of experience, group C, the researcher felt
that additional data analysis was needed to gain a better understanding of the answer to
the question.
As done previously, the researcher divided the principals into the same three
categories – group A are principals with 1-4 years of experience, group B are principals
with 5-8 years of experience, and group C are principals with 9 or more years of
experience. The principal longevity groups were: Group A (n=7): Harbor View (3),

58
James Island (3), Ladson (3), Mary Ford (3), Pinehurst (4), Springfield (3), Stono Park
(3); Group B (n=5): Angel Oak (5), Belle Hall (5), Goodwin (5), Oakland (5), Pepperhill
(6); and Group C (n=7): Drayton Hall (9), Mt Pleasant Academy (25), Mt. Zion (9),
Pinckney (9), Stiles Point (17), Sullivans Island (9), Whitesides (10).
The researcher averaged the ratings for the principals in each group for each of
the ten leadership behaviors in an effort to see which group had the most number of
leadership behaviors rated the highest. After completing this, the researcher observed that
group B had the most number of leadership behaviors rated the highest. Upon further data
analysis, the researcher realized that two schools, Springfield and Belle Hall, were
outlying data points and were possibly skewing the results due to the small sample size
overall (19) and the small size of each group (A=7, B=5, C=7). Therefore, the researcher
removed Springfield’s data from group A due to outlying low scores and Belle Hall data
from group B due to outlying high scores. The following tables show the results of these
steps per leadership behavior:

59
Table 4.21
Leadership Behavior One – My principal provides good processes and
resources for me to do my job.
School Number of Years Rating
Group A
Harbor View 3 4.43
James Island 3 3.92
Ladson 3 4.10
Mary Ford 3 4.61
Pinehurst 4 4.40
Springfield 3 3.30*
Stono Park 3 4.47
Group A Average 3.14 4.18
Note. *= Average overall mean of leadership behavior one for group A without
Springfield 4.32
Group B
Angel Oak 5 4.62
Belle Hall 5 4.95*
Goodwin 5 4.71
Oakland 5 4.48
Pepperhill 6 4.45
Group B Average 5.20 4.64
Note.*= Average overall mean of leadership behavior one for group B without
Belle Hall 4.57
Group C
Drayton Hall 9 4.72
Mt Pleasant Academy 25 4.52
Mt. Zion 9 4.20
Pinckney 9 4.83
Stiles Point 17 4.79
Sullivans Island 9 4.46
Whitesides 10 4.44
Group C Average 12.57 4.57

60
Table 4.22
Leadership Behavior Two – My principal has provided feedback on my
strengths as an employee.
School Number of Years Rating
Group A
Harbor View 3 4.11
James Island 3 4.00
Ladson 3 3.72
Mary Ford 3 4.35
Pinehurst 4 4.38
Springfield 3 3.07*
Stono Park 3 4.47
Group A Average 3.14 4.01
Note. *= Average overall mean of leadership behavior one for group A without
Springfield 4.17
Group B
Angel Oak 5 4.48
Belle Hall 5 4.83*
Goodwin 5 4.22
Oakland 5 3.88
Pepperhill 6 4.11
Group B Average 5.20 4.30
Note.*= Average overall mean of leadership behavior one for group B without
Belle Hall 4.17
Group C
Drayton Hall 9 4.28
Mt Pleasant Academy 25 3.84
Mt. Zion 9 4.20
Pinckney 9 4.55
Stiles Point 17 4.43
Sullivans Island 9 4.17
Whitesides 10 4.15
Group C Average 12.57 4.23

61
Table 4.23
Leadership Behavior Three – Principal led staff meetings make efficient use of
time and are productive.
School Number of Years Rating
Group A
Harbor View 3 4.49
James Island 3 3.54
Ladson 3 3.91
Mary Ford 3 4.36
Pinehurst 4 4.52
Springfield 3 3.19*
Stono Park 3 4.59
Group A Average 3.14 4.09
Note. *= Average overall mean of leadership behavior one for group A without
Springfield 4.24
Group B
Angel Oak 5 4.05
Belle Hall 5 4.95*
Goodwin 5 4.68
Oakland 5 4.40
Pepperhill 6 4.10
Group B Average 5.20 4.44
Note.*= Average overall mean of leadership behavior one for group B without
Belle Hall 4.31
Group C
Drayton Hall 9 4.64
Mt Pleasant Academy 25 4.52
Mt. Zion 9 4.20
Pinckney 9 4.90
Stiles Point 17 4.68
Sullivans Island 9 4.42
Whitesides 10 4.34
Group C Average 12.57 4.53
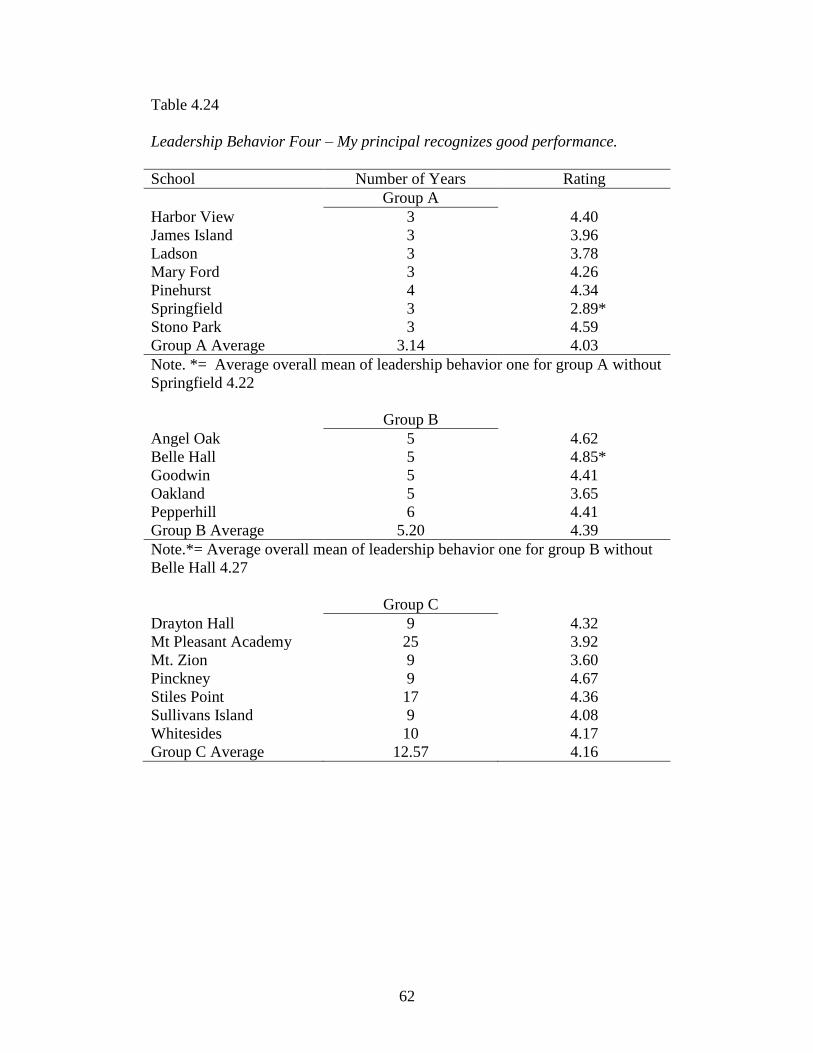
62
Table 4.24
Leadership Behavior Four – My principal recognizes good performance.
School Number of Years Rating
Group A
Harbor View 3 4.40
James Island 3 3.96
Ladson 3 3.78
Mary Ford 3 4.26
Pinehurst 4 4.34
Springfield 3 2.89*
Stono Park 3 4.59
Group A Average 3.14 4.03
Note. *= Average overall mean of leadership behavior one for group A without
Springfield 4.22
Group B
Angel Oak 5 4.62
Belle Hall 5 4.85*
Goodwin 5 4.41
Oakland 5 3.65
Pepperhill 6 4.41
Group B Average 5.20 4.39
Note.*= Average overall mean of leadership behavior one for group B without
Belle Hall 4.27
Group C
Drayton Hall 9 4.32
Mt Pleasant Academy 25 3.92
Mt. Zion 9 3.60
Pinckney 9 4.67
Stiles Point 17 4.36
Sullivans Island 9 4.08
Whitesides 10 4.17
Group C Average 12.57 4.16

63
Table 4.25
Leadership Behavior Five – My principal demonstrates a genuine concern for
my welfare.
School Number of Years Rating
Group A
Harbor View 3 4.56
James Island 3 3.92
Ladson 3 3.87
Mary Ford 3 4.48
Pinehurst 4 4.16
Springfield 3 2.96*
Stono Park 3 4.47
Group A Average 3.14 4.06
Note. *= Average overall mean of leadership behavior one for group A without
Springfield 4.24
Group B
Angel Oak 5 4.52
Belle Hall 5 4.95*
Goodwin 5 4.41
Oakland 5 4.23
Pepperhill 6 4.52
Group B Average 5.20 4.53
Note.*= Average overall mean of leadership behavior one for group B without
Belle Hall 4.42
Group C
Drayton Hall 9 4.48
Mt Pleasant Academy 25 3.76
Mt. Zion 9 4.20
Pinckney 9 4.74
Stiles Point 17 4.50
Sullivans Island 9 4.54
Whitesides 10 4.61
Group C Average 12.57 4.40

64
Table 4.26
Leadership Behavior Six – My principal makes the best use of available funds.
School Number of Years Rating
Group A
Harbor View 3 4.54
James Island 3 3.50
Ladson 3 3.87
Mary Ford 3 4.13
Pinehurst 4 4.50
Springfield 3 3.31*
Stono Park 3 4.41
Group A Average 3.14 4.04
Note. *= Average overall mean of leadership behavior one for group A without
Springfield 4.16
Group B
Angel Oak 5 4.38
Belle Hall 5 4.90*
Goodwin 5 4.68
Oakland 5 4.27
Pepperhill 6 4.59
Group B Average 5.20 4.56
Note.*= Average overall mean of leadership behavior one for group B without
Belle Hall 4.48
Group C
Drayton Hall 9 4.72
Mt Pleasant Academy 25 4.32
Mt. Zion 9 4.00
Pinckney 9 4.81
Stiles Point 17 4.79
Sullivans Island 9 4.25
Whitesides 10 4.45
Group C Average 12.57 4.48

65
Table 4.27
Leadership Behavior Seven – My principal consults me on the decisions that
affect my job.
School Number of Years Rating
Group A
Harbor View 3 4.32
James Island 3 3.54
Ladson 3 3.72
Mary Ford 3 4.26
Pinehurst 4 4.27
Springfield 3 2.63*
Stono Park 3 4.41
Group A Average 3.14 3.88
Note. *= Average overall mean of leadership behavior one for group A without
Springfield 4.09
Group B
Angel Oak 5 4.14
Belle Hall 5 4.90*
Goodwin 5 4.34
Oakland 5 3.88
Pepperhill 6 4.14
Group B Average 5.20 4.28
Note.*= Average overall mean of leadership behavior one for group B without
Belle Hall 4.13
Group C
Drayton Hall 9 4.40
Mt Pleasant Academy 25 4.28
Mt. Zion 9 3.60
Pinckney 9 4.60
Stiles Point 17 4.36
Sullivans Island 9 4.38
Whitesides 10 4.00
Group C Average 12.57 4.23

66
Table 4.28
Leadership Behavior Eight – The expectations for judging my performance are
clear.
School Number of Years Rating
Group A
Harbor View 3 4.37
James Island 3 4.42
Ladson 3 4.16
Mary Ford 3 4.52
Pinehurst 4 4.40
Springfield 3 3.19*
Stono Park 3 4.59
Group A Average 3.14 4.24
Note. *= Average overall mean of leadership behavior one for group A without
Springfield 4.41
Group B
Angel Oak 5 4.48
Belle Hall 5 4.93*
Goodwin 5 4.71
Oakland 5 4.04
Pepperhill 6 4.24
Group B Average 5.20 4.48
Note.*= Average overall mean of leadership behavior one for group B without
Belle Hall 4.37
Group C
Drayton Hall 9 4.40
Mt Pleasant Academy 25 4.32
Mt. Zion 9 4.20
Pinckney 9 4.74
Stiles Point 17 4.59
Sullivans Island 9 4.38
Whitesides 10 4.46
Group C Average 12.57 4.44
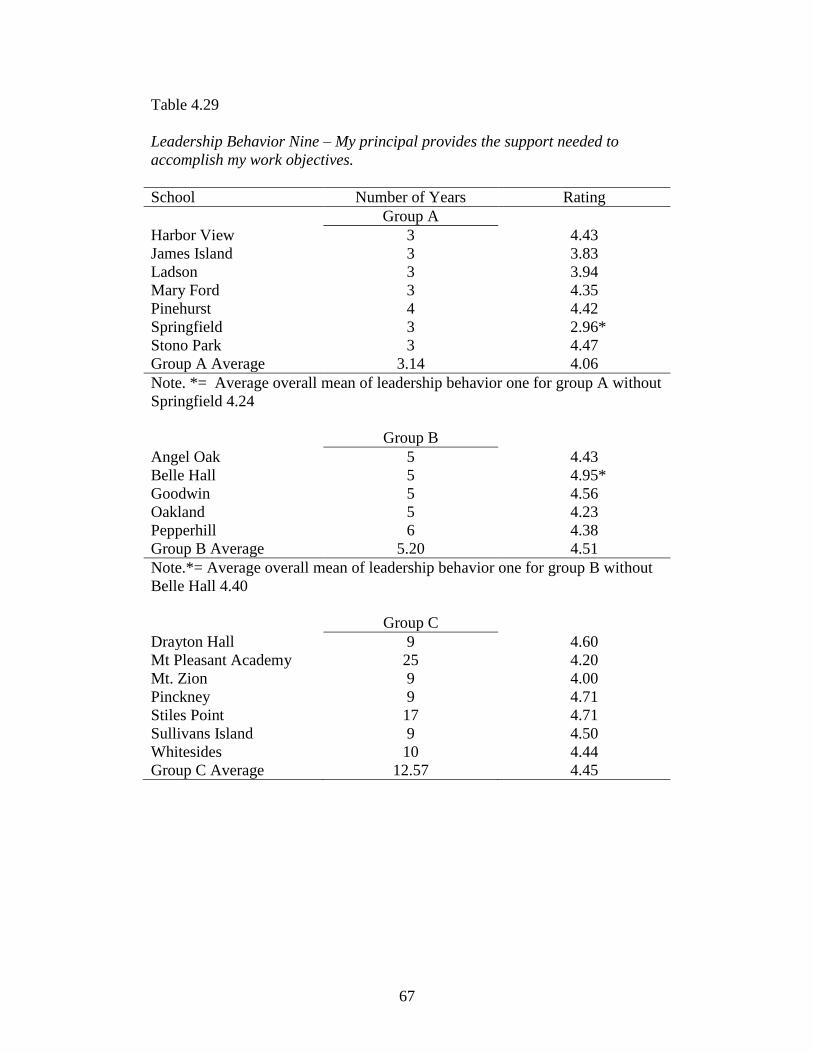
67
Table 4.29
Leadership Behavior Nine – My principal provides the support needed to
accomplish my work objectives.
School Number of Years Rating
Group A
Harbor View 3 4.43
James Island 3 3.83
Ladson 3 3.94
Mary Ford 3 4.35
Pinehurst 4 4.42
Springfield 3 2.96*
Stono Park 3 4.47
Group A Average 3.14 4.06
Note. *= Average overall mean of leadership behavior one for group A without
Springfield 4.24
Group B
Angel Oak 5 4.43
Belle Hall 5 4.95*
Goodwin 5 4.56
Oakland 5 4.23
Pepperhill 6 4.38
Group B Average 5.20 4.51
Note.*= Average overall mean of leadership behavior one for group B without
Belle Hall 4.40
Group C
Drayton Hall 9 4.60
Mt Pleasant Academy 25 4.20
Mt. Zion 9 4.00
Pinckney 9 4.71
Stiles Point 17 4.71
Sullivans Island 9 4.50
Whitesides 10 4.44
Group C Average 12.57 4.45

68
Table 4.30
Leadership Behavior Ten – My principal has provided feedback concerning
areas for improving my performance.
School Number of Years Rating
Group A
Harbor View 3 4.23
James Island 3 4.17
Ladson 3 3.87
Mary Ford 3 4.35
Pinehurst 4 4.54
Springfield 3 3.19*
Stono Park 3 4.47
Group A Average 3.14 4.12
Note. *= Average overall mean of leadership behavior one for group A without
Springfield 4.27
Group B
Angel Oak 5 4.33
Belle Hall 5 4.95*
Goodwin 5 4.34
Oakland 5 3.88
Pepperhill 6 4.07
Group B Average 5.20 4.31
Note.*= Average overall mean of leadership behavior one for group B without
Belle Hall 4.16
Group C
Drayton Hall 9 4.44
Mt Pleasant Academy 25 4.08
Mt. Zion 9 3.40
Pinckney 9 4.64
Stiles Point 17 4.54
Sullivans Island 9 4.21
Whitesides 10 4.17
Group C Average 12.57 4.21

69
The researcher was able to determine which group had the highest score per
leadership behavior in three ways: with all schools included, with all schools minus
Springfield, and with all school minus Springfield and Belle Hall. The following table
displays this information:
Table 4.31
Highest Rated Group per Leadership Behavior
Leadership
Behavior
With all
schools
Without
Springfield
Without Springfield and
Belle Hall
One B – 4.64 B – 4.64 B and C – 4.64
Two B – 4.30 B – 4.30 C – 4.23
Three C – 4.53 C – 4.53 C – 4.53
Four B – 4.39 B – 4.39 B – 4.27
Five B – 4.53 B – 4.53 B – 4.42
Six B – 4.56 B – 4.56 B and C – 4.48
Seven B – 4.28 B – 4.28 C – 4.23
Eight B – 4.48 B – 4.48 C – 4.44
Nine B – 4.51 B – 4.51 C – 4.45
Ten B – 4.31 B – 4.31 A – 4.27
Group C had the most behaviors rated highest among all three groups once the
researcher removed the outlying data points for Springfield and Belle Hall. The
researcher removed Springfield’s data from group A due to outlying low scores and Belle
Hall data from group B due to outlying high scores. This was done because the
researcher, during data analysis, realized that two schools, Springfield and Belle Hall,
were outlying data points and were possibly skewing the results due to the small sample
size overall (19) and the small size of each group (A=7, B=5, C=7).
In an effort to gain a deeper understanding of research question four, the
researcher decided to calculate the differences between the group C and group A for each

70
leadership behavior to determine which leadership behaviors had the largest differentials.
The researcher observed that leadership behavior six, my principal makes the best use of
available funds, had the largest positive differential from group C to group A (+.32). The
researcher observed that leadership behavior three, principal led staff meetings make
efficient use of my time and are productive, had the second largest positive differential
from group C to group A (+.29). The researcher observed that leadership behavior one,
my principal provides good processes and resources for me to do my job, had the third
largest positive differential from group C to group A (+.25). The following table displays
this information:
Table 4.32
Differences Among Groups per Leadership Behavior
Leadership
Behavior
Group A Group B Group C Group C –
Group A
One 4.32 4.57 (+.25) 4.57 +.25
Two 4.17 4.17 4.23 (+.06) +.06
Three 4.24 4.31 (+.07) 4.53 (+.22) +.29
Four 4.22 4.27 (+.05) 4.16 (-.11) -.06
Five 4.24 4.42 (+.18) 4.40 (-.02) +.16
Six 4.16 4.48 (+.32) 4.48 +.32
Seven 4.09 4.13 (+.04) 4.23 (+.10) +.14
Eight 4.41 4.37 (-.04) 4.44 (+.07) +.03
Nine 4.24 4.40 (+.16) 4.45 (+.05) +.21
Ten 4.27 4.16 (-.11) 4.21 (+.05) -.06

71
CHAPTER 5: SUMMARY, CONCLUSIONS, AND RECOMMENDATIONS
In chapter five, the researcher provides a summary of the data analysis, the
conclusions of the study, and makes recommendations of potential applications for school
districts and provides a recommendation to future researchers interested in completing
studies on principal longevity, leadership behaviors, and student academic achievement.
SUMMARY OF DATA ANALYSIS
Research question one – What is the correlation and statistical significance
between principal longevity and leadership behavior ratings? The null hypothesis is that
there is no correlation between principal longevity and leadership behavior ratings. The
researcher’s hypothesis is that there will be a positive correlation between longevity and
leadership behavior ratings. The researcher presumed that experience, in any field, would
lead one to better skills within a particular field and that experience would provide
opportunities for one to evolve and hone his or her skill set.
The researcher found that there was a positive correlation between principal
longevity and the overall mean of the ten leadership behaviors for each school. The value
of r for this correlation is 0.1599. Although this is a positive correlation, the relationship
between principal longevity and leadership behaviors is not considered statistically
significant. In order for this correlation to be considered statistically significant, the
correlation would need to be higher than 0.389.

72
The correlation was not as strong as the researcher presumed it would be. This
could be due to a number of factors in this particular relationship between principal
longevity and employee engagement survey results. Examples of these factors include
staff turnover from year to year within the school during the principal’s time at the
school, differing local, state, and federal mandates that principals must follow that affect
school personnel’s perceptions and ratings of their principal, and individual school based
issues that vary from year to year that result in disproportionate time consumption of the
building level principal, such as school construction or a community tragedy.
These are just a few possible factors, or reasons, that employee survey ratings on
a principal’s leadership behavior could deviate from year to year with little connection to
the principal’s years of experience at that particular school and/or their leadership
behavior qualities. Limited research and literature is available on principal longevity and
employee survey results.
Research question two – What is the correlation and statistical significance
between principal longevity and student academic achievement? The null hypothesis is
that there is no correlation between principal longevity and student academic
achievement. The researcher’s hypothesis is that there will be a positive correlation
between principal longevity and student academic achievement.
The researcher found that there was a positive correlation between principal
longevity and student academic achievement. The value of r for this correlation is 0.4795.
This is a positive correlation and determined to be statistically significant according to
the Table of Critical Values for Pearson’s r, because it is higher than 0.389.

73
The null hypothesis was found to be incorrect because there was a correlation
between principal longevity and student academic achievement. The researcher
recognizes that this correlation was the strongest among the correlations performed and
was the only correlation that was statistically significant.
To look at additional data regarding the relationship between principal longevity
and student academic achievement, the researcher divided the principals into three
categories. These categories are as follows: group A are principals with 1 – 4 years of
experience, group B are principals with 5 – 8 years of experience, and group C are
principals with 9 or more years of experience. The principal longevity groups are as
follows: Group A (n=7): Harbor View (3), James Island (3), Ladson (3), Mary Ford (3),
Pinehurst (4), Springfield (3), Stono Park (3); Group B (n=5): Angel Oak (5), Belle Hall
(5), Goodwin (5), Oakland (5), Pepperhill (6); and Group C (n=7): Drayton Hall (9), Mt
Pleasant Academy (25), Mt. Zion (9), Pinckney (9), Stiles Point (17), Sullivans Island
(9), Whitesides (10).
The researcher looked at the average PASS scores for each of the groups to
further analyze the relationship between principal longevity and student academic
achievement. Group C, the group with the most experience, had the highest level of
student academic achievement, with 90.9 % of students scoring met or exemplary on the
2013 ELA part of the PASS test. However, group A, the group with the least amount of
experience, outscored group B by 1.3 percentile points. It is the belief of the researcher
that the outcome of group A outscoring group B by 1.3 percentile points may be
attributed to a small sample size and that a study using a larger sample size could produce
different and, potentially, more reliable data.
74
Principal longevity and student academic achievement had the strongest
correlation among the first three research questions and was the only correlation to have
statistical significance. The outcome of this correlation contributes to the confirmation of
the importance of school districts encouraging principals who are making positive student
academic achievement gains to remain in their current schools versus being successful in
one school and then moving to a different school. Some research suggests that often
principals, when successful as measured by student achievement academic data, move to
different, sometimes perceived as easier, schools. Hull (2012) stated:
Many principals gain their initial experience at challenging schools, then transfer
to easier-to-manage schools as those positions open up. A study of one large
urban district found that principals’ second or third schools typically enrolled 89
percent fewer poor and minority students than their first position.
Supporting this line of thought, Beteille, Kalogrides, and Loeb (2012) stated:
More than one out of every five principals leaves their school each year. In some
cases, these career changes are driven by the choices of district leadership. In
other cases, principals initiate the move, often demonstrating preferences to work
in schools with higher achieving students from more advantaged socioeconomic
backgrounds. Principals often use schools with many poor or low achieving
students as stepping stones to what they view as more desirable assignments (p.
904).
If data trends are showing that principals are using historically underachieving
schools as ‘stepping stones’, or pathways to higher achieving schools, then the researcher

75
feels there is value to school districts, states, and federal entities analyzing and
strategically attempting to discourage this occurrence.
Research question three – What is the correlation and statistical significance
between leadership behavior ratings and student academic achievement? The null
hypothesis is that there is no correlation between leadership behavior ratings and student
academic achievement. The researcher’s hypothesis is that there will be a positive
correlation between leadership behavior ratings and student academic achievement.
The researcher found that there was a positive correlation between the overall
mean of the ten leadership behaviors and student academic achievement. The value of r
for this correlation is 0.1791. Although this is a positive correlation, the relationship
between principal longevity and leadership behaviors is not considered statistically
significant. In order for this correlation to be considered statistically significant, the
correlation would need to be higher than 0.389.
The null hypothesis was found to be incorrect because there was a correlation
between the overall mean of the ten leadership behaviors and student academic
achievement. The researcher’s hypothesis was correct; however the strength of the
correlation was weaker than expected. The researcher presumed that the correlation
between leadership behaviors and student academic achievement would have been
stronger, especially considering the information gathered while completing chapter two,
the literature review.
As discussed in chapter two, research suggest that principals do have an impact on
the success of the overall school organization; therefore, the researcher expected a

76
stronger correlation between principal leadership behaviors and student academic
achievement. Upon further research of the relationship between leadership behaviors and
student academic achievement, the concept of direct versus indirect impact of the
principal appears throughout the literature.
Research question four – Which leadership behavior ratings are highest and
lowest for principals with the most years of experience? Research question four was the
easiest to answer for the researcher; however the most challenging to explore and
analyze. It involved multiple types of data analysis that evolved throughout the process.
The researcher went on a data journey, in a sense, because one type of data analysis led to
more questions and a need for validation of sorts, which in turn, caused the researcher to
do further data analysis, as described throughout the study.
The researcher was able to answer research question four by simply identifying
the three highest and the three lowest rated leadership behaviors for group C.
Furthermore, the researcher averaged the ratings for the principals in each group for each
of the ten leadership behaviors in an effort to see which group had the most leadership
behaviors rated the highest. After completing this, the researcher observed that group B
had the most number of leadership behaviors rated the highest. Upon further data
analysis, the researcher realized that two schools, Springfield with low outlying data and
Belle Hall with high outlying data, were possibly skewing the outcome due to the small
sample size overall (19) and each group (A=7, B=5, C=7). Therefore, the researcher
removed Springfield’s data from group A due to outlying low scores and Belle Hall data
from group B due to outlying high scores.

77
After completing that process, the researcher then decided to analyze the
differences between the three groups, specifically analyzing the differentials between
group C and group A for each leadership behavior. The researcher observed that
leadership behavior six, my principal makes the best use of available funds, had the
largest positive differential from group C to group A (+.32). The researcher observed that
leadership behavior three, principal led staff meetings make efficient use of my time and
are productive, had the second largest positive differential from group C to group A
(+.29). The researcher observed that leadership behavior one, my principal provides good
processes and resources for me to do my job, had the third largest positive differential
from group C to group A (+.25).
In summary, all three correlations in the study were positive with the correlation
between principal longevity and student academic achievement being the strongest and
the only correlation to have statistical significance. Research question four was answered
easily by simply noting the three highest and three lowest behaviors for group C, the
group of principals with the most experience. However, question four led the researcher
to further data analysis. The researcher concluded that a larger sample size might prove
beneficial to future studies on principal longevity, leadership behaviors, and student
academic achievement.
CONCLUSIONS
The researcher was able to answer all four research questions used in this study.
There were positive correlations between principal longevity and leadership behaviors,
principal longevity and student academic achievement, and leadership behaviors and

78
student academic achievement. The strongest correlation, and the only correlation with
statistical significance, was between principal longevity and student academic
achievement. The weakest correlation was between principal longevity and leadership
behavior ratings.
Question four was answered, in simple terms, in that the researcher was able to
identify the three leadership behaviors rated highest and the three leadership behaviors
rated lowest for principals with the most years of experience (group C). However, the
researcher realized when analyzing research question four that this particular question
needed to be explored further. Partially due to having a sample size of 19, the researcher
realized that a more in depth process of data analysis would be beneficial in gaining a
deeper understanding of question four. This process was discussed in great detail in
chapter four and the researcher believes there was value to this process in understanding
the relationship between principal longevity and leadership behaviors.
RECOMMENDATIONS
The researcher has a few recommendations after completing the study. One
recommendation is for school districts, and larger scale public school institutions, to
study trends of principal longevity, and principal turnover, particularly in high poverty
schools and schools with a history of underachievement. McKibben (2013) stated:
An emerging body of research suggests the high-quality principals systemically
use lower-quality schools as stepping stones to build experience and move into
better schools, while low-quality principals simply transfer to low-quality schools,
each doing so at the expense of equity. It is a matter of national urgency,
79
therefore, for schools and districts to devise programs and policies that not only
increase principal quality, but also keep effective principals in the highest-need
schools (p. 70).
Are school districts unintentionally allowing principals to use underachieving
schools as ‘stepping stones’, or pathways, to positions where they can lead more
academically successful schools? The necessary data is available for government entities
to monitor the prevalence of this occurrence. Strategies should be explored and
implemented to alter this trend, if it is present, when possible. Advocates for Children
and Youth (2007) stated:
Principals with a track record of success are vital to combat the challenges of
poverty and poor educational achievement. To change the trajectory of low-
income students there should be incentives and conditions that attract talented
professionals who can turn around a school. Chosen principals must be supported
in a system that provides mentoring, resources, flexibility, accountability, and
evaluation (p. 2).
Research is indicating a trend in higher principal turnover rates for historically
underachieving schools. Strategies to decrease this trend are not easily conjured. School
districts could possibly utilize systems that discourage these trends that are aligned to the
characteristics of their districts.
Samuels (2012) stated:
The solution to the problem of churn [principal turnover] is not a one-size-fits-all
formula. In some cases, it makes sense to give principals more time to make
80
progress. However, policymakers and districts leaders must also put better
principal selection processes in place to find the best candidates to fill positions in
struggling schools (p. 2).
The researcher also recommends further studies on direct impact versus indirect
impact of the building level principal on overall school success. For example, do
principals affect student academic achievement directly or do principals affect the
teachers’ work environment, which in turn affects student academic achievement, thus
creating a situation in which the principal indirectly affects student academic
achievement? MacNeil, Prater, and Busch (2009) stated that “organizational theorists
have long reported that paying attention to culture is the most important action that a
leader can perform and educational theorists have likewise reported that the principals’
impact on learning is mediated through the climate and culture of the school and is not a
direct effect” (p. 73).
Lastly, if another researcher were to replicate this study it is the recommendation
of the researcher that a larger sample size be used in an effort to obtain more reliable
data. As mentioned earlier in the study, using a sample size of 19 was problematic in that
two outlying pieces of data, one low and one high, possibly created an issue with
reliability within some parts of the data. Even after removing the two outlying data points
for some parts of the analysis, the researcher continued to feel that the data outcomes of
the study would have been more reliable if a larger sample size was used in the study.
The researcher was limited to 19 schools for this study because there are only 19
neighborhood schools with grades 3-5 within the CCSD. The researcher was limited to
81
only using the CCSD because it is the only school district that uses the Studer employee
engagement survey. The survey used in the CCSD is not currently being used by any
other school district in South Carolina. If the researcher were to have used schools in
other states that are using the Studer employee engagement survey, then those states do
not administer the PASS test, which is only administered in the state of South Carolina.
In conclusion, if another study is conducted on the correlations and relationships
among principal longevity, leadership behaviors, and student academic achievement it is
the suggestion of the researcher that when selecting the sample size for the study that the
tool used to measure leadership behaviors and the standardized test data used to measure
student academic achievement be considered in an effort to obtain a larger sample size.
This may allow for more reliable data outcomes in the study.

82
REFERENCES
Beteille, T., Kalogrides, D., & Loeb, S. (2012). Stepping Stones: Principal Career
Paths and School Outcomes. Social Science Research, 41, 904-919.
Branch, G., Hanushek, E., & Rivkin, S. (2013). School Leaders Matter. Education Next,
13(1), 62-69.
Burkhauser, S., Gates, S., Hamilton, L., & Ikemoto, G. (2012). First-Year Principals in
Urban School Districts: How Actions and Working Conditions Relate to
Outcomes. New Leaders (Technical Report).
Chapman, J. (2005, January 1). Recruitment, Retention, and Development of School
Principals. Retrieved October 22, 2014, from
http://www.iaoed.org/files/Edpol2.pdf
Clark, C., Martorell, P., & Rockoff, J. (2009). School Principals and School Performance.
Calder Urban Institute, December. Retrieved from
http://files.eric.ed.gov/fulltext/ED509693.pdf.
Clifford, M., Menon, R., Gangi, T., Condon, C., & Hornung, K. (2012). Measuring
School Climate for Gauging Principal Performance: A Review of the Validity and
Reliability of Publicly Accessible Measures. Quality School Leadership.
Colorado Department of Education (2013) Colorado State Model Evaluation System for
Principals. Retrieved from

83
http://co.chalkbeat.org/sites/default/files/sites/2/2014/01/PrincipalPilotReport1213.pdf.
Fenton, B., Kelemen, M., Norskog, A., Robinson, D., Schnur, J., Simmons, M., &
Taliaferro, L. (2010). Evaluating Principals: Balancing Accountability with
Professional Growth. Retrieved from
http://www.isbe.net/peac/pdf/eval_principals.pdf
Fuller, E. (2012, July 17). Examining Principal Turnover. Retrieved from
http://nepc.colorado.edu/blog/examining-principal-turnover.
Habegger, S. (2008, Sept/Oct). The Principal’s Role in Successful Schools: Creating a
Positive School Culture. Retrieved June 17, 2014.
McKibben, S. (2013). Do Local-Level Principal Preparation Programs Prevent Principal
Turnover? The Public Purpose, 11, 69-87.
Hull, J. (2012, April 1). The Principal Perspective: Full Report. Retrieved July 10, 2014.
MacNeil, A., Prater, D., & Busch, S. (2009). The effects of school culture and climate on
student achievement. Leadership in Education, 12(1), 73-84.
Mendels, P. & Mitgang, L.D. (2013). Creating Strong Principals. Educational
Leadership, April. Retrieved from http://www.wallacefoundation.org/knowledge-
center/school-leadership/district-policy-and-practice/Documents/Educational-
Leadership-Creating-Strong-Principals.pdf.
Miller, A. (2009). Principal Turnover, Student Achievement and Teacher Retention.
Retrieved from http://harris.princeton.edu/seminars/pdfs/miller.pdf.
84
Neighborhood School Definition. (n.d.). Retrieved April 29, 2014, from
ccsdschools.com/choice/index.php.
Principal Position Description. (n.d.). Retrieved May 26, 2014, from
applitrack.com/ccsdschools.com/choice/index.php.
Principal Turnover in the Baltimore City School Public School System. (2007).
Advocates for Children & Youth, 5(6), 1-2.
Samuels, C. (2012). Principal Turnover Bodes Poorly for Schools. Education Week.
The MetLife Survey of the American Teacher: Challenges for School Leadership (2012)
Retrieved from https://www.metlife.com/assets/cao/foundation/MetLife-Teacher-
Survey-2012.pdf.
The Studer Group Description. (n.d.). Retrieved April 14, 2014, from
(https://www.studergroup.com/what-we-do/coaching/).
The Wallace Foundation (2012) The School Principal as Leader: Guiding Schools to
Better Teaching and Learning. Retrieved from
http://www.wallacefoundation.org/knowledge-center/school-leadership/effective-
principal-leadership/Documents/The-School-Principal-as-Leader-Guiding-
Schools-to-Better-Teaching-and-Learning-2nd
-Ed.pdf.
Toner, E. (2013, September 9). School Districts Struggle to Get Principals to Stay Put.
Retrieved October 23, 2014, from
http://www.npr.org/2013/09/09/220735277/school-districts-struggle-to-get-
principals-to-stay-put.

85
APPENDIX A - IRB APPROVAL
OFFICE OF RESEARCH COMPLIANCE
INSTITUTIONAL REVIEW BOARD FOR HUMAN RESEARCH
DECLARATION of NOT HUMAN SUBJECTS
This is to certify that research proposal: Pro00038752
Entitled: The Effect of Principal Longevity on Leadership Behaviors and Student Achievement
Submitted by:
Principal Investigator: Jennifer Swearingen
College: College of Education
Department: Education Administration
Address: Wardlaw
Columbia, SC 29208
was reviewed by the Office of Research Compliance, an administrative office that supports the
University of South Carolina Institutional Review Board (USC IRB). The Office of Research
Compliance, on behalf of the Institutional Review Board, has determined that the referenced

86
study meets the Not Human Research criteria set forth by the Code of Federal Regulations (45
CFR 46) of:
a. the specimens and/or private information/data were not collected specifically for the currently proposed research project through an interaction/intervention with living individuals AND
b. the investigator(s) including collaborators on the proposed research cannot readily ascertain the identity of the individual(s) to whom the coded private information or specimens pertain
No further oversight by the USC IRB is required; however, the investigator should inform the
Office of Research Compliance prior to making any substantive changes in the research
methods, as this may alter the status of the project.
If you have questions, contact Arlene McWhorter at [email protected] or (803) 777-7095.
Sincerely,
Lisa M. Johnson
IRB Manager
__________________________________________________________________________
University of South Carolina ● 1600 Hampton Street, Suite 414 ● Columbia, South Carolina 29208 ● 803-777-7095 An Equal Opportunity Institution