principles and guidelines for evaluating federal water
TRANSCRIPT

Principles and Guidelines for Evaluating Federal Water Projects:
U.S. Army Corps of Engineers Planning and the Use of Benefit Cost Analysis
A Report for the Congressional Research Service
Final Report, August 2009
A course capstone project from the
Evans School of Public Affairs
University of Washington
Prepared by the members of PbAf 599D:Jonathan Armah
Hande AyanChristina BernardAaron Blumenthal
Lea FortmannLori Reimann Garretson
Christopher GodwinWilliam Dean Runolfson1
Coordinated by:Tyler Blake Davis
Julie Vano2
Supervised by:Dr. Richard O. Zerbe, Jr.
Dr. Joseph Cook
1 Bethanne Barnes, Ross Gilliland, and Peter Teigen also contributed to the report.2 Corresponding authors’ E-mail: [email protected] and [email protected]

2
Table of Contents
SUMMARY............................................................................................................................... 5PART I. BACKGROUND: A P&G PRIMER............................................................................. 6
Scope and Organization of Report .......................................................................................... 6Benefit-Cost Analysis and the Principles and Guidelines ........................................................ 9The (Current) Principles and Guidelines ............................................................................... 12P&G Process ........................................................................................................................ 14P&G Criticisms and Revisions ............................................................................................. 17Recently-Authorized Corps Planning Studies ....................................................................... 20
The Upper Mississippi River Comprehensive Plan (UMRCP) .................................................. 21Rationale and Scope for the UMRCP.................................................................................... 21UMRCP Alternatives............................................................................................................ 22Plan Recommendation.......................................................................................................... 23Stakeholder Response........................................................................................................... 23
PART II. REVIEW OF CRITICISMS OF CURRENT CORPS BENEFIT-COST ANALYSISGUIDANCE............................................................................................................................. 24REGIONAL VS. NATIONAL ACCOUNTS............................................................................ 25
Regional vs. National Account in the Current P&G .............................................................. 25Existing Criticisms & Options for Addressing NED vs. RED Account in the Updated P&G. 26RED vs. NED Application to the UMRCP............................................................................ 30
PLANNING AREA.................................................................................................................. 33Planning Area in the Current P&G ....................................................................................... 33Existing Criticisms of Planning Area in the P&G ................................................................. 34Options for Addressing Planning Area in the Updated P&G ................................................. 35Planning Area Application to the UMRCP ........................................................................... 37
ECOSYSTEM SERVICES....................................................................................................... 38Ecosystem Services in the Current P&G............................................................................... 38Existing Criticisms of Ecosystem Services in the P&G......................................................... 39Options for Addressing Ecosystem Services in the Updated P&G......................................... 40Ecosystem Services and the EQ Account in the UMRCP...................................................... 42
PUBLIC SAFETY ................................................................................................................... 44Public Safety in the Current P&G......................................................................................... 44Existing Criticisms & Options for Addressing Public Safety in the Updated P&G ................ 44Public Safety in the UMRCP ................................................................................................ 45
UNCERTAINTY ..................................................................................................................... 46Uncertainty in the Current P&G ........................................................................................... 46Existing Criticisms and Options for Addressing Uncertainty for Updated P&G .................... 47Application of Uncertainty in the UMRCP ........................................................................... 49
OUTPUT PRICE EFFECTS..................................................................................................... 50Output Price Effects in the Current P&G .............................................................................. 50Existing Criticisms and Options for Addressing Output Price Effects in the Updated P&G... 50Application of Output Price Effects in the UMRCP .............................................................. 51

3
PART III: FLOODPLAIN RISK: RESIDUAL RISK, NONSTRUCTURAL MEASURES, ANDDEVELOPMENT BEHIND LEVEES ..................................................................................... 52
Introduction.......................................................................................................................... 52RESIDUAL RISK.................................................................................................................... 53
Residual Risk in the Current P&G ........................................................................................ 53Existing Criticisms and Options for Addressing Residual Risk in the Updated P&G............. 57Application of Residual Risk in the UMRCP........................................................................ 60
NONSTRUCTURAL ALTERNATIVES ................................................................................. 61Nonstructural Alternatives in the Current P&G..................................................................... 61Existing Criticisms and Options for Addressing Nonstructural Alternatives in the UpdatedP&G..................................................................................................................................... 63Nonstructural Alternatives in the UMRCP............................................................................ 64
LEVEE DEVELOPMENT EFFECTS ...................................................................................... 65Academic Studies of Levee Development and Non-structural Approaches ........................... 66Levee Development in the UMRCP...................................................................................... 68
APPENDIX.............................................................................................................................. 71Appendix A: Annotated Bibliography................................................................................... 71Appendix B. Recommendations offered by the National Research Council (NRC) .............. 81Appendix C: Summary of Criticisms from Scodari (2005)................................................... 83Appendix E: EPA Residual Risk Assessment Steps .............................................................. 95Appendix F: Effects of Accounting for Equity on NED ........................................................ 96Appendix G: Technical Details for the UMRCP ................................................................... 97

4
GLOSSARY OF ABBREVIATIONS
BCR Benefit-cost ratioCorps U.S. Army Corps of EngineersCRS Congressional Research ServiceCVM Contingent Valuation MethodEC Engineering CircularsEPA Environmental Protection AgencyEQ Environmental QualityFEMA Federal Emergency Management AgencyGRP Gross Regional ProductHAPs Hazardous Air PollutantsHSDRRS Hurricane and Storm Damage Risk Reduction SystemIWR Institute for Water ResourcesLCA Least Cost AlternativeMACT Maximum Achievable Control TechnologyMCDA Multi-Criteria Decision AnalysisMRC Mississippi River CommissionNED National Economic DevelopmentNFIP National Flood Insurance ProgramNRC National Research CounselNRCS Department of Agriculture’s Natural Resources Conservation ServiceOIRA Office of Information and Regulatory AffairsOMB Office of Management and BudgetOSE Other Social EffectsP&G Principles and Guidelines (Economic and Environmental Principles and
Guidelines for Water and Related Land Resources Implementation Studies)P&S Principles and Standards for Planning Water and Related Land ResourcesPDA Property Damage AlternativePGN Planning Guidance NotebookReclamation Department of the Interior’s Bureau of ReclamationRED Regional Economic DevelopmentREMI Regional Economic Models Inc.RIDF Risk-Informed Decision FrameworkRPI Real Personal IncomeTCM Travel Cost MethodTVA Tennessee Valley AuthorityUDA Upstream and Downstream AnalysisUMRCP Upper Mississippi River Comprehensive PlanVSL Value of a Statistical LifeWRDA Water Resources Development ActWTA Willingness-To-AcceptWTP Willingness-To-Pay

5
SUMMARY
Federal water resource agencies, such as the Army Corps of Engineers (Corps), follow planningguidance when evaluating plans for federally funded water resource projects. Currently, for theCorps, the 1983 Economic and Environmental Principles and Guidelines for Water and Related Land
Resources Implementation Studies (P&G) is the foundation for guidance, with additional directionprovided in executive orders, and other executive branch and agency directives. Congress mandatedin the Water Resources Development Act of 2007 (WRDA 2007, P.L. 110-114) that the P&G berevised for the Corps.
The P&G outlines how to use a benefit-cost analysis (BCA) for evaluating and comparing alternativeplans. However, in the decades since the P&G were adopted, there have been evolutions inmethodological, environmental, social, and regional approaches and concerns that are not reflected inthe original document. Federal agencies, academics, and stakeholder groups have provided somecriticisms of the P&G and suggestions for revision. Given current science, economic theory, andinformation technology, there are numerous options for updating the P&G.
This report discusses use of BCA in the P&G and provides a Corps case study to illustrate currentimplementation. The discussion is organized into three parts: (1) A review of current practices ofBCA in Corps’ projects; (2) A review of literature identifying criticisms and recommendations forchanges to the P&G; and (3) An assessment of a case study on the Upper Mississippi RiverComprehensive Plan to illustrate the importance of, and challenges to, using BCA in project planningand analysis.
Issues with the existing P&G that critics suggest should be revised or included in an update include:
(1) Regional vs. National Accounts: Whether to consider regional benefits separately fromnational benefits.
(2) Planning Area: How to select a planning area that captures the potential area affected.(3) Ecosystem Services: How to consider ecosystem services and other non-monetary
environmental values.(4) Public Safety: How to more explicitly include public safety in the analysis.(5) Uncertainty: How to manage the uncertainty in estimates of costs and benefits.(6) Output Pricing: How to better capture project costs.(7) Floodplain Risk: How to evaluate and compare structural and nonstructural alternatives and
options.
A more detailed summary of these issues and options for addressing them in the P&G update can befound throughout the report in text boxes at the beginning of each specified section. Whether andhow to address these issues represents a significant challenge to the current P&G update.

6
PART I. BACKGROUND: A P&G PRIMER
Scope and Organization of Report
This report is intended to inform policy-makers when considering how federal agencies involvedin water resource management evaluate project proposals and alternatives. The principle federalwater resource agencies are the U.S. Army Corps of Engineers (Corps), the Department of theInterior’s Bureau of Reclamation (Reclamation), the Department of Agriculture’s NaturalResources Conservation Service (NRCS), and the Tennessee Valley Authority (TVA). Thisreport focuses on activities within the Corps (Figure 1), with an emphasis on flood damagereduction projects, although many of these same concepts apply to project evaluation in the otherthree agencies and for projects with other purposes. The Corps civil works program includeswater resource development activities in three primary mission areas: flood control, navigation,and aquatic ecosystem restoration.
Figure 1. U.S. Army Corps of Engineers Planning Guidance. Conceptual representation of
how the Corps’ mission has expanded and evolved, including significant legislation and
federal water resources planning guidance. Items that relate specifically to benefit-costanalysis are indicated in red. Figure adapted from National Research Council’s report on
New Directions in Water Resources: Planning for the U.S. Army Corps of Engineers.3
3 NRC. (1999). New Directions in Water Resources: Planning for the U.S. Army Corps of Engineers. National
Academy Press. Washington, D.C.
7
Water resource projects affect both national and local economies through the construction andoperations of facilities, the management of flood risk, the availability of hydropower andirrigation, the navigability of waterways for shipping, and the impact on the natural environment.Decisions regarding how public funds are allocated and which plans are implemented requiretradeoffs that impact public safety and affect how costs and benefits of federal water resourcespending are distributed. The Principles and Guidelines for Water and Related Land Resources
Implementation Studies (P&G)4 was published by the Water Resources Council in 1983 toprovide the main basis for evaluating potential federal water resource projects and theiralternatives. Since 1983, the P&G has been used by the Corps, Reclamation, NRCS, and TVA.This report provides a brief history of the P&G and earlier planning guidance, identifies existingcriticisms, and provides an example of how the current P&G is being applied to a recent Corpsproject.
The report pays particular attention to issues in evaluating flood damage reduction (often calledflood control) projects. Roughly 7% of all U.S. land area is located along rivers or streams inareas known as floodplains. Floodplains adjacent to rivers have historically provided flat,nutrient-rich land for agriculture. The combination of relatively low land prices in floodplainareas and existing flood protection structures, have led to urban and suburban encroachment,putting people, structures, infrastructure, and economic activities at risk of catastrophic flood.
Planning goals and analytical procedures for evaluation of new Corps projects are developedusing guidance from Congress through statutes including Water Resource Development Acts,historic River and Harbor and Flood Control Acts, and the Water Resources Planning Act of1965, the latter of which mandated development of principles, standards, and procedures for theevaluation of federal water and related land resources. Specifically, Congress mandated that theWater Resources Council:
Establish, after such consultation with other interested entities … principles, standards,and procedures for Federal participants in the preparation of comprehensive regional orriver basin plans and for the formulation and evaluation of Federal water and related landresources projects.5
The Act also specified that the principals and standards were to include economic evaluation:
The Council shall develop standards and criteria for economic evaluation of waterresource projects. For the purpose of those standards and criteria, the primary directnavigation benefits of a water resource project are defined as the product of the savings toshippers using the waterway and the estimated traffic that would use the waterway.6
In response to this direction, the Water Resources Council produced the Principles and Standard
(P&S) in 1973 which outlined how to evaluate benefits and costs of projects. In 1983 thePrinciples and Guidelines (P&G) replaced the P&S for federal water and related land resource
4 Water Resources Council. (1983). Economic and Environmental Principles and Guidelines for Water and Related
Land Resources Implementation Studies. Washington, D.C.: U.S. Government Printing Office.5 WRPA 1962. U.S.C Title 42 Chapter 19B Subchapter 1 (a).6 WRPA 1962. U.S.C Title 42 Chapter 19B Subchapter 1 (b).

8
projects undertaken by the four water resource agencies. Since then, the Corps has issued furtherimplementation guidance, such as the Corps’ Planning Guidance Notebook (PGN). U.S. Courtsalso have played a role in shaping federal water resource projects. Notwithstanding this otherdirection, the P&G have remained the primary basis for water resource project evaluations.Whether this guidance reflects current national concerns and methods has led to somecontroversy.
WRDA 2007 Revisions. In response to the scrutiny of ongoing criticisms and length of timesince they were last updated, the U.S. Congress mandated in WRDA 2007 (Section 2031) thatthe Secretary of the Army issue revisions to the Principles and Guidelines within two years,which include the following:7
(A) “Use of best available economic principles and analytical techniques, includingtechniques in risk and uncertainty analysis.
(B) Assessment and incorporation of public safety in the formulation of alternatives andrecommended plans.
(C) Assessment methods that reflect the value of projects for low-income communitiesand projects that use nonstructural approaches to water resources development andmanagement.
(D) Assessment and evaluation of the interaction of a project with other water resourcesprojects and programs within a region or watershed.
(E) Use of contemporary water resources paradigms, including integrated water resourcesmanagement and adaptive management.
(F) Evaluation methods that ensure that water resources projects are justified by publicbenefits.”
Section 2033 of the act states that Corps feasibility studies of projects that would address flooddamage reduction must include8:
(1) “a calculation of the residual risk of flooding following completion of the proposedproject (residual risk is the risk of flooding that remains after implementing a projectto reduce the risk of flooding such as a levee);
(2) a calculation of the residual risk of loss of human life and residual risk to humansafety following completion of the proposed project;
(3) a calculation of any upstream or downstream impacts of the proposed project; and(4) a calculation of benefits and costs associated with structural and nonstructural
alternatives that ensures projects are evaluated in an equitable manner.”
In the context of on-going revisions to the Principles and Guidelines, this report considersexisting practices and criticisms. Specifically, this report:
(1) Analyzes current practices of benefit-cost analysis and steps required under the P&G
7 The following is from Section 2031 and Section 2033 of WRDA 2007.8 Section 2032 of WRDA mandates that the President submit a report to Congress describing the vulnerability of the
United States to damage from flooding.

9
(2) Identifies, through a literature review, criticisms of the current P&G andrecommendations for changes, made by experts and stakeholders
(3) Presents a case study (the Upper Mississippi River Comprehensive Plan (UMRCP))of how the current P&G are applied
The report is divided into three parts. Part I provides history and background on the P&G andthe PGN, describes the mandate from Congress to revise the P&G, and briefly outlines the Upper
Mississippi Comprehensive Plan (UMRCP). Part II highlights guidance elements and issues,summarizing the criticisms and recommendations for each and describing how the currentguidance was applied to the UMRCP. Part III focuses on three issues specifically related toflood control projects: residual risk management, treatment of nonstructural approaches, andimpacts of levees on economic development.
This document is intended to aid and inform policy-makers by considering:
1) the current benefit-cost analysis practice within the Corps;2) criticisms of and options to modify current benefit-cost analysis practices; and3) how current guidelines for benefit-cost analysis are implemented through a case study.
Benefit-Cost Analysis and the Principles and Guidelines
This section summarizes the guiding documents for using benefit-cost analysis (BCA) toevaluate the Corps’ projects and reveals how and when changes have been made in BCA practice(Figure 1). First, the report reviews the policy rationale for conducting BCA and describeswhere it may be applied. Second, it reviews the history of BCA by tracing the legal foundationsof BCA in national policy. Third, it summarizes BCA process as currently practiced. Finally, itprovides an overview of the ways BCA processes have been modified since the publication ofthe P&G in 1983.

10
Benefit-Cost Analysis and Its Applications. In principle, BCA is intended to do two things: 1)“establish which public projects are likely to yield economic benefits” and 2) “furnish a basis forthe apportionment of the cost” of such projects.9 Simply stated, BCA is “an accountingframework in which benefits and costs associated with a decision are set out for purposes ofinformation and discussion.”10 Ideally, BCA provides objective information to a decision-makerabout quantifiable costs and benefits in common (money-metric) terms. The decision-makermay then compare the costs and benefits of the decision and make a more informed decision.For example, when planning for flood protection, there will be costs from project constructionand implementation and benefits from reduced flood risk (Figure 2). If decision-makers hadinformation on benefits and costs of a range of different levels of flood protection, they couldchoose the level of protection that minimized total cost (labeled as “optimal minimum cost” inFigure 2).
Figure 2. Benefit-Cost Analysis in Water Resources Planning. At its simplest, the level of flood
protection increases for more severe floods, construction costs (plan implementation costs)
increase. The higher the protection level, the less risk incurred. The decrease in risk costs, or
damage curve, reflect how projects benefit from reductions in risk. Arrows indicate that allcosts in BCA have some uncertainty. Regardless of the level of flood protection, risk costs
never entirely disappear. Curves are conceptual simplifications; if included other components
such as residual risk, curves would be altered. Figure concept derived from Figure 14-1 inG.W. Kite book on Frequency and Risk Analyses.11
9 Hammond, R. J. (1966). Convention and Limitation in BCA, 6 Natural Resources Journal. 195-222.10 Lesser & Zerbe (1998). In F. Thompson& M. Green (Eds.), Handbook of Public Finance CRC Press, 221..11 Kite, G.W. (1977). Frequency and Risk Analyses in Hydrology. Water Resources Publications, Fort Collins, CO,
203.

11
In practice, the application of BCA is more complicated. Benefits and costs are often difficult toidentify, difficult to measure or monetize, and highly uncertain. Additionally, although the BCAprocess aims for objectivity, analysts must make many subjective decisions and assumptions.These might include the choice of discount rate, whether and how to value environmentalamenities (which are not traded in a marketplace), and what categories of benefits and costs touse. For federal water resource projects, guidance like the P&G are used to ensure that types ofsubjective decisions are made as consistently as possible across projects and agencies.
In the United States, the idea of quantifying benefits for water resource projects was consideredas early as the Rivers and Harbor Act of 1902.12,13 Language specifying the use of BCA in waterrelated projects was provided in the River and Harbor Act of 1920.14 Later, the FederalNavigation Act of 1936 required the practical application of benefit-cost analysis whenevaluating waterway infrastructure projects.15 The modern era of BCA within the Corps beganwith the 1965 Water Resource Planning Act (WRPA). The WRPA attempted to centralize waterresource planning by creating the Water Resources Council (WRC) to draft water resourceproject evaluation standards, including BCA. The result of their efforts was the Principles and
Standards for Planning Water and Related Land Resources (P&S) 16 released in 1973,commonly called the Principles and Standards.
Principles and Standards (P&S). The P&S were approved by President Nixon in September of1973 and became effective on October 25, 1973. They applied to all four federal water resourceagencies within the Water Resource Council mandate (the Corps, Reclamation, NRCS, andTVA). The P&S had two main and co-equal objectives:17
(1) To enhance the national economic development by increasing the value of theNation’s output of goods and services and improving national economic efficiency.
(2) To enhance the quality of the environment by the management, conservation,preservation, creation, restoration, or improvement of the quality of certain naturaland cultural resources and ecological systems.
The relevant costs and benefits of alternative plans for these two objectives were to beenumerated in two “accounts.” These two required accounts were for improving “nationaleconomic development” (the NED account), and the second was for enhancing “environmentalquality” (the EQ account). Two other accounts were created for “regional development” and“social wellbeing,” but were not required of analysts.
After a period of revisions, the P&S were established in 1980 as a set of formal rules with theaim of providing federal agencies with uniform requirements for evaluating projectimplementation studies.18 After a new Administration took office, the WRC repealed the
12 Hammond, R. J. (1966). Convention and Limitation in BCA, 6 Natural Resources Journal. 195-222.13 32 Stat. 372-73 (1903)(The date you reference in the text is 1902 – is the discrepancy ok?)14 River and Harbor Act, 41 Stat. 1009-10 (1920)15 Watkins, Thayer. An Introduction to Cost-Benefit Analysis, San Jose State University. Retrieved April 22, 2009
from: http://www.usace.army.mil/cw/hot_topics/ht_2008/pandg_rev.htm16 Federal Register number: 38 Fed. Reg. 24,778-24869, September 10, 1973.17 P&S, p.6.18 Federal Register 64366.

12
existing principles, standards, and procedures in September 1982 and replaced them with a newguidance document, Economic and Environmental Principles and Guidelines for Water and
Related Land Resources Implementation Studies, commonly called the Principles and Guidelines
or P&G.19 This document is still in effect today.
The (Current) Principles and Guidelines
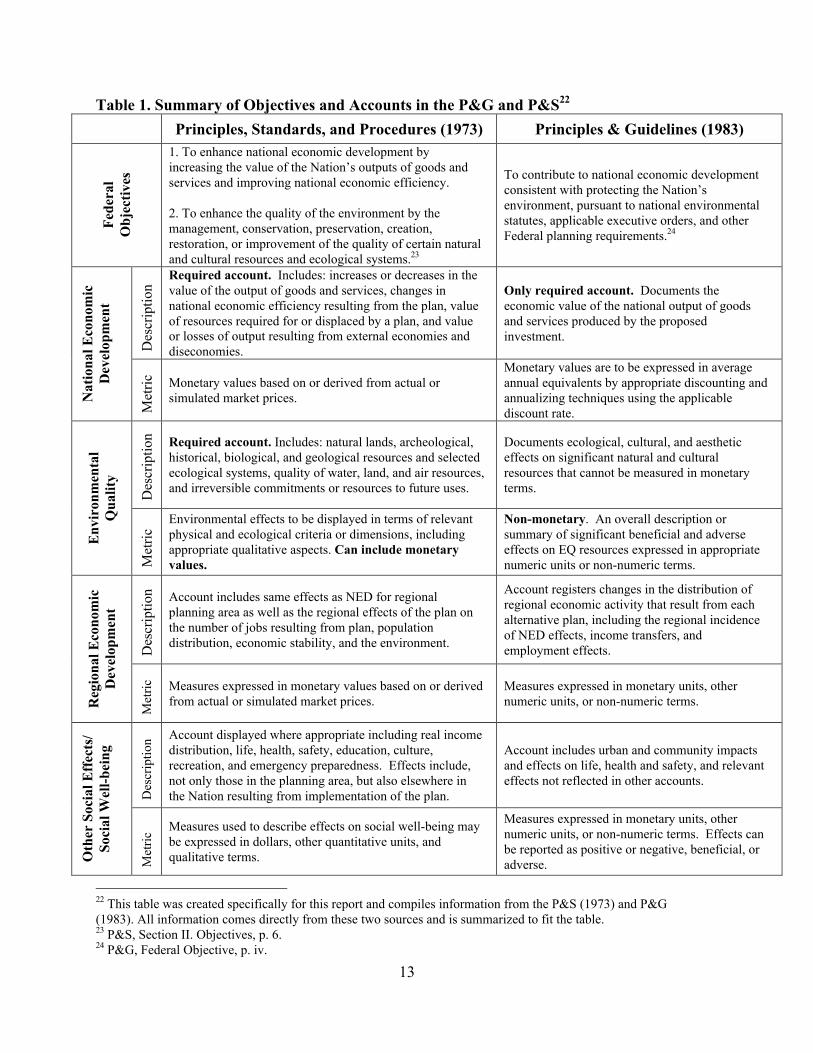
The objective of the current P&G was to “contribute to national economic developmentconsistent with protecting the Nation’s environment.”20 In other words, the P&G treatedeconomic development as the primary objective and environmental protection as a secondaryconstraint, rather than their co-equal status under the P&S objective (see Table 1 for a summaryof the similarities and differences between the P&S and P&G).
As suggested by its title, the P&G outlines several guiding principles for the purpose of ensuringconsistent planning by federal agencies as well as detailed guidelines providing standards andprocedures for federal agencies when conducting analyses of potential water resource projectsand alternative plans.21 Principles include federal, state, and local concerns, as well as generalguidelines for conducting analyses of project implementation studies.
Like the P&S, the P&G established four accounts for measuring the diverse potential impacts ofwater resource projects, although the P&G placed different relative weight between the accounts(see Figure 1). Only the National Economic Development (NED) account is required by theP&G, although the analysis that informs the Environmental Quality (EQ) account is typicallyrequired by other laws and regulations, such as the National Environmental Policy Act of 1969(NEPA). Approximately 80 pages of the P&G outline the procedures for conducting NEDbenefit calculations, while the EQ account is treated in 22 pages. The Other Social Effects(OSE) and Regional Economic Development (RED) accounts are not treated in the guidelinesportion of the P&G.
19 See 18 C.F.R. 725.6 concerning Principals, Standards and Procedures for Conservation of Power and Water
Resources. All of Chapter IV of C.F.R. 18 concerns the Water Resources Council.20 P&G, Federal Objective, p. iv.21 P&G, Section 1.1.1.
13
Table 1. Summary of Objectives and Accounts in the P&G and P&S22
Principles, Standards, and Procedures (1973) Principles & Guidelines (1983)
Fed
era
l
Ob
ject
ives
1. To enhance national economic development by
increasing the value of the Nation’s outputs of goods and
services and improving national economic efficiency.
2. To enhance the quality of the environment by the
management, conservation, preservation, creation,
restoration, or improvement of the quality of certain natural
and cultural resources and ecological systems.23
To contribute to national economic development
consistent with protecting the Nation’s
environment, pursuant to national environmental
statutes, applicable executive orders, and other
Federal planning requirements.24
Des
crip
tio
n
Required account. Includes: increases or decreases in the
value of the output of goods and services, changes in
national economic efficiency resulting from the plan, value
of resources required for or displaced by a plan, and valueor losses of output resulting from external economies and
diseconomies.
Only required account. Documents the
economic value of the national output of goods
and services produced by the proposed
investment.
Na
tion
al
Eco
no
mic
Dev
elop
men
t
Met
ric Monetary values based on or derived from actual or
simulated market prices.
Monetary values are to be expressed in average
annual equivalents by appropriate discounting and
annualizing techniques using the applicable
discount rate.
Des
crip
tio
n Required account. Includes: natural lands, archeological,
historical, biological, and geological resources and selected
ecological systems, quality of water, land, and air resources,
and irreversible commitments or resources to future uses.
Documents ecological, cultural, and aesthetic
effects on significant natural and cultural
resources that cannot be measured in monetary
terms.
En
vir
on
men
tal
Qu
ali
ty
Met
ric
Environmental effects to be displayed in terms of relevant
physical and ecological criteria or dimensions, including
appropriate qualitative aspects. Can include monetary
values.
Non-monetary. An overall description or
summary of significant beneficial and adverse
effects on EQ resources expressed in appropriate
numeric units or non-numeric terms.
Des
crip
tio
n Account includes same effects as NED for regional
planning area as well as the regional effects of the plan on
the number of jobs resulting from plan, population
distribution, economic stability, and the environment.
Account registers changes in the distribution of
regional economic activity that result from each
alternative plan, including the regional incidence
of NED effects, income transfers, and
employment effects.
Reg
ion
al
Eco
no
mic
Dev
elop
men
t
Met
ric Measures expressed in monetary values based on or derived
from actual or simulated market prices.
Measures expressed in monetary units, other
numeric units, or non-numeric terms.
Des
crip
tion
Account displayed where appropriate including real income
distribution, life, health, safety, education, culture,
recreation, and emergency preparedness. Effects include,
not only those in the planning area, but also elsewhere in
the Nation resulting from implementation of the plan.
Account includes urban and community impacts
and effects on life, health and safety, and relevant
effects not reflected in other accounts.
Oth
er S
oci
al
Eff
ects
/
So
cial
Wel
l-b
ein
g
Met
ric
Measures used to describe effects on social well-being may
be expressed in dollars, other quantitative units, and
qualitative terms.
Measures expressed in monetary units, other
numeric units, or non-numeric terms. Effects can
be reported as positive or negative, beneficial, or
adverse.
22 This table was created specifically for this report and compiles information from the P&S (1973) and P&G
(1983). All information comes directly from these two sources and is summarized to fit the table.23 P&S, Section II. Objectives, p. 6.24 P&G, Federal Objective, p. iv.

14
P&G Process
Although all four federal water resource agencies must use the P&G for project evaluation, theimplementation process varies among them. This report focuses on the process at the Corps.
The Planning Guidance Notebook (PGN) states that Corps’ evaluation process for formulatingplans and alternatives consists of two phases: a reconnaissance stage and a feasibility stage.25
During the reconnaissance stage, the Corps is authorized to use $100,000 and up to one year toconduct a primary analysis. At this stage the Corps is particularly interested in identifying ifthere is a substantial federal interest in the project — whether there is an appropriate role for thefederal government or whether the proposed project is primarily local in nature and effect. If theproposed course of action passes the reconnaissance phase, the agency proceeds with a moredetailed feasibility study.
The P&G outlines six major steps in the evaluation process:26
• Specification of the water and related land resource problems and opportunities (relevantto the planning setting) associated with the federal objective and specific state and localconcerns.
• Inventory, forecast, and analysis of water and related land resource conditions within theplanning area relevant to the identified problems and opportunities.
• Formulation of alternative plans.• Evaluation of the effects of the alternative plans.• Comparison of alternative plans.• Selection of a recommended plan based upon comparison of alternative plans.
While the P&G provides these specific steps to follow, it acknowledges that plan formulation is adynamic process and iterations of steps will most likely take place. The final plan selected is tobe “the alternative plan with the greatest net economic benefit consistent with protecting theNation’s environment.”27
Planning Guidance Notebook (PGN). Since the P&G was written, the Corps has proposed andadopted incremental modifications to its regulations on how to implement the P&G. Intermittentmodifications of the regulations were circulated from 1982 until 1985, before they werecompiled into a single publication. The Engineering Regulations (ER) were unified in ER-1105-2-100, also known as the Planning Guidance Notebook (PGN). The PGN was first published in1990, and has been continually revised with the goal to present “the overall direction by whichCorps of Engineers Civil Works projects are formulated, evaluated, and selected forimplementation”.28 To achieve the goal of “describing the planning process in straightforward,plain-language,” the PGN reviews specific policies applicable to each mission and program, andassociated analytical requirements. The PGN updates the six steps to water resource projectevaluation first described in the P&G to conform to new law and regulations, including how to
25 Planning Guidance Notebook Section 4 paragraph 1-2.26 P&G, Section 1.3.227 P&G, Plan Selection, p. v.28 Planning Guidance Notebook Section 1 paragraph 1-2.

15
accommodate mandates from the Water Resource Development Act of 1986 and 1996, and otherstatutory and regulatory requirements that postdate the original P&G. The latest version of theER-1105-2-100 was published in 2000.
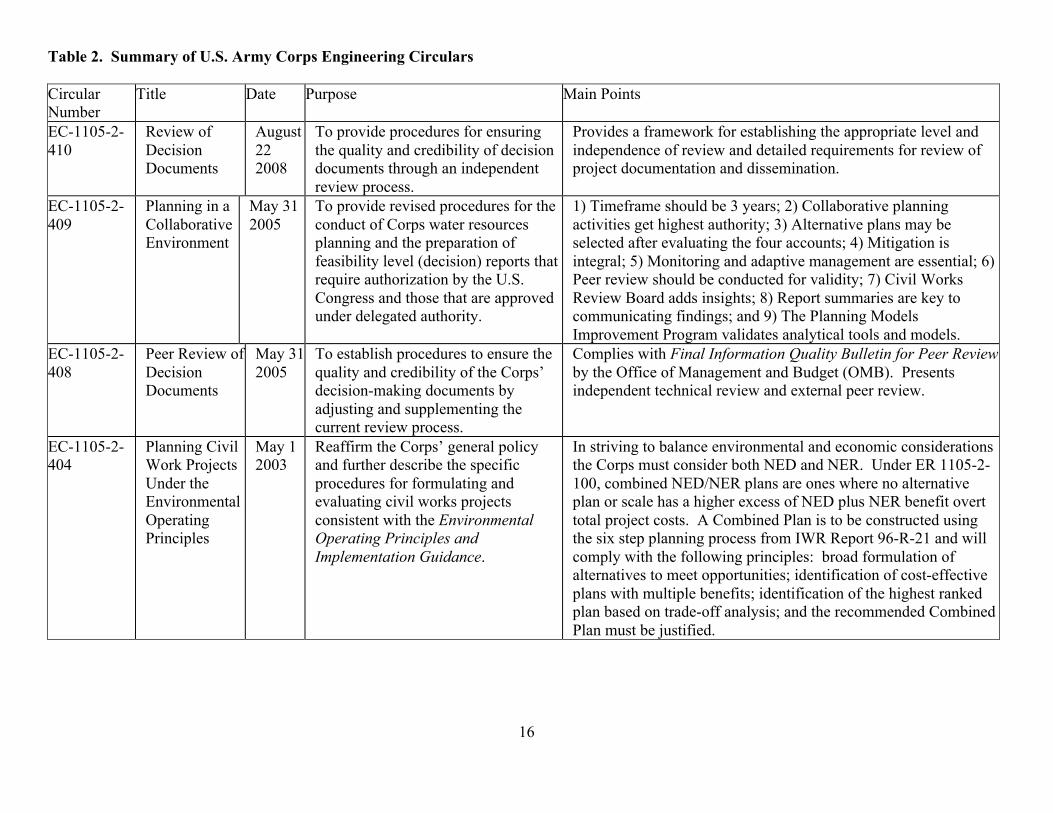
Engineering Circulars (EC). In between updates to the PGN, the Corps amends the guidancefor project analysts through Engineering Circulars (EC). The Corps’ EC are binding for one ortwo years after their publication date. During this provisional time period the EC is open forpublic comment. At the conclusion of the provisional time period, the circular may be acceptedas a new regulation. Table 2 provides a summary of currently and recently binding ECdocuments.
16
Table 2. Summary of U.S. Army Corps Engineering Circulars
Circular
Number
Title Date Purpose Main Points
EC-1105-2-
410
Review of
Decision
Documents
August
22
2008
To provide procedures for ensuring
the quality and credibility of decision
documents through an independent
review process.
Provides a framework for establishing the appropriate level and
independence of review and detailed requirements for review of
project documentation and dissemination.
EC-1105-2-
409
Planning in a
Collaborative
Environment
May 31
2005
To provide revised procedures for the
conduct of Corps water resources
planning and the preparation of
feasibility level (decision) reports that
require authorization by the U.S.
Congress and those that are approved
under delegated authority.
1) Timeframe should be 3 years; 2) Collaborative planning
activities get highest authority; 3) Alternative plans may be
selected after evaluating the four accounts; 4) Mitigation is
integral; 5) Monitoring and adaptive management are essential; 6)
Peer review should be conducted for validity; 7) Civil Works
Review Board adds insights; 8) Report summaries are key to
communicating findings; and 9) The Planning Models
Improvement Program validates analytical tools and models.
EC-1105-2-
408
Peer Review of
Decision
Documents
May 31
2005
To establish procedures to ensure the
quality and credibility of the Corps’
decision-making documents by
adjusting and supplementing the
current review process.
Complies with Final Information Quality Bulletin for Peer Review
by the Office of Management and Budget (OMB). Presents
independent technical review and external peer review.
EC-1105-2-
404
Planning Civil
Work Projects
Under the
Environmental
Operating
Principles
May 1
2003
Reaffirm the Corps’ general policy
and further describe the specific
procedures for formulating and
evaluating civil works projects
consistent with the Environmental
Operating Principles and
Implementation Guidance.
In striving to balance environmental and economic considerations
the Corps must consider both NED and NER. Under ER 1105-2-
100, combined NED/NER plans are ones where no alternative
plan or scale has a higher excess of NED plus NER benefit overt
total project costs. A Combined Plan is to be constructed using
the six step planning process from IWR Report 96-R-21 and will
comply with the following principles: broad formulation of
alternatives to meet opportunities; identification of cost-effective
plans with multiple benefits; identification of the highest ranked
plan based on trade-off analysis; and the recommended Combined
Plan must be justified.

17
P&G Criticisms and Revisions
Since 1983 there have been numerous studies and reviews that have suggested modifications tothe P&G.29 In 1994, a White House commissioned study of the Mississippi flooding of 1993reported:
The principal federal water resources planning document, Principles andGuidelines, is outdated and does not reflect a balance among the economic, social,and environmental goals of the nation. This lack of balance is exacerbated by apresent inability to quantify, in monetary terms, some environmental and socialimpacts. As a result, these impacts are frequently understated or omitted. Manycritics of the Principles and Guidelines see it as biased against nonstructuralalternatives.30
In 1994 a group of eight professors led by Professor Zilberman at the University of California inBerkeley reviewed the P&G at the request of the Environmental Protection Agency (EPA). TheEPA sought a review of the P&G in an effort to develop a framework for BCA within the EPA.31
Their work culminated in The Zilberman Review, which contains very careful and detailedanalysis of several key economic questions. 32 Professor Anthony Fisher provides an extensivediscussion of the issues associated with using contingent valuation, and he suggests differentways to assess environmental quality costs within the Environment Quality (EQ) account and onthe National Economic Development (NED) balance sheet. Professor William Hyde addressesfive distinct sources of error in the P&G and suggests methods for limiting these errors.33
Professor Douglas Larson argues that the P&G focuses too heavily on the monetary impacts of aproject, which tend to over-emphasize the quantity of benefits and costs and neglects to measurehow the project changes the quality or value of the environment. He argues that the three otheraccounts, Environmental Quality, Regional Economic Development, and Other Social Effects,should be considered more when assessing a project. (For more information about The
Zilberman Review see the annotated bibliography in Appendix A in this report.)
In 2000, Congress requested that the National Academy of Sciences, through the NationalResearch Council (NRC), review the planning procedures and methods of analysis used in Corpswater resources planning.34 The NRC responded with a series of reports published in 2004.Noting that the Corps is governed by over 219 public laws (as of December 2000), many ofwhich may at times conflict, the NRC first recommended that the Administration, Congress, andstates, reconcile inconsistencies within the existing, de facto, body of national water policy to
29 Gerald Galloway, comments to the Corps regarding revisions to the P&G, June 8, 2008.30 Quoted in Gerald Galloway, comments to the Corps regarding revisions to the P&G, June 8, 2008.31 Personal communication with Professor Zilberman, May 10, 2009.32 Published by the EPA as “Review of Economic and Environmental Principles and Guidelines for Water and
Related Land Resources Implementation Studies”33 The five sources of error are (1) Assessment of non-market values; (2) Output price affects; (3) Interactions
between multiple project outputs; (4) Disregard of regional impacts; and (5) Tacit acceptance of non-standardizeddata from other natural resource organizations.34 NRC report, Analytical Methods and Approaches for Water Resources Project Planning, 2004, p. viii. The entire
report is available from the NRC at http://www.nap.edu/catalog.php?record_id=10973
18
provide better direction to the Corps. The NRC offered ten other key recommendations forchange, which are included in Appendix B. The recommendations most applicable to the P&Grevision include:35
• The Principles and Guidelines should be revised to better reflect contemporarymanagement paradigms; analytical methods; legislative directives; and social,economic, and political realities. A revised version of the P&G documentshould be periodically and formally reviewed and updated.
• Benefit-cost analysis should not be used as the lone decision criterion injudging whether a proposed planning or management alternative in a Corpsplanning study should be approved.
• Periodic reviews of completed projects should be a routine part of Corps waterresource project planning and management.
• Resources and time allocated for Corps reconnaissance studies should becommensurate with the scale and complexity of the water resources issue athand.
• A summary document that identifies key environmental and social issues,primary assumptions, alternatives considered and evaluated, objectivessought, benefits and costs (monetized and non-monetized), trade-offs andstakeholder perspectives and differences, presented with a consistent formatacross studies, should be a standard in Corps planning studies.
• The Corps should strengthen its programs in the areas of systems engineeringaspects of water resources, risk and uncertainty analysis, and the integration ofengineering and ecosystem analyses. Part of this strengthening should includethe development of updated design manuals that better reflect contemporarymethods and theories. These manuals should be used as general guidancerather than as “cookbooks” that specify a series of steps that must be strictlyadhered to.
• Independent experts from outside the Corps of Engineers should be routinelyenlisted to provide advice in Corps programs and planning studies.”
In 2005, after the Corps came under increased scrutiny in the wake of Hurricane Katrina, PaulScodari of the Army Corps of Engineers Institute for Water Resources (IWR) gathered asummary of existing criticisms of the P&G. After carefully comparing these criticisms with theactual language contained in the P&G, Scodari found that although some of the perceived flawsare closely linked to specific provisions, many cannot be directly traced to the P&G and must beattributed to other sources.36 In his final report, Scodari detailed when and how the perceived
35 NRC report, Analytical Methods and Approaches for Water Resources Project Planning, 2004.36 Paul Scodari, Survey and Analysis of Criticisms of Corps Planning and Links to Planning Guidance, 2005, p. 4.

19
flaws arise from the guidance within which Corps planning occurs, and when and how perceivedflaws arise from other sources. (See Appendix C in this report for a table that summarizes keyinformation from this report).
Ongoing Update of the P&G. On September 12, 2008, in response to the WRDA 2007directives, the Corps released a draft of revised principles for public comment. An invitationwas issued through Reuters, and the public was invited to mail in their comments or post themonline.37 Although the draft does not include the complete standards or guidelines, it includesnew requirements for planners to assess a total of five accounts, review at least three alternatives(one focused on economic development, one on environmental considerations, and one based onnonstructural options), and use current risk and uncertainty techniques.38 Several commentators,including the NRC, noted the inclusion of updated ideas into the principles as a step in the rightdirection and praised the Corps for some parts of the updated Principles. Many of these samecommentators and others also pointed to gaps in several areas such as guidance on the evaluationof accounts and specificity and clear definitions of terms and ideas.39
Asking for and receiving public comment is an important step in the revision process. However,it will be challenging for both policy-makers and the Corps to know how to evaluate and weighthe authority, expertise, and biases that may be represented within the comments that have beenreceived. An extremely wide range of stakeholders commented, including: The NatureConservancy, the Audubon Society, and numerous conservation groups; the American Society ofCivil Engineers, the Associated General Contractors of America, and the Southwestern PowerResources Association; and a number of concerned citizens as well as numerous professorsrepresenting a variety of disciplines.
37 http://www.usace.army.mil/CECW/Pages/pgr.aspx38 Army Corps of Engineers. Draft Principles. September 2008.
http://www.usace.army.mil/CECW/Documents/pgr/pg_draft.pdf39 Public comments from Scott Farrow, Paul Kirshen, and others. http://www.usace.army.mil/CECW/Pages/pgr.aspx

20
Recently-Authorized Corps Planning Studies
One important question is whether the P&G is being updated with thought towards the type ofprojects the Corps is currently considering and evaluating, rather than the mix of projects it hasdone in the past. To set this context, this section provides an overview of 154 recently-authorized Corps planning studies proposed in the Water Resources Development Act of 2007(100 projects) as well as Committee Resolutions in the House (51 projects) and Senate (3projects) in 2007 and 2008.
Water resource projects are proposed throughout the country (Figure 3), with California (19projects), New York (19 projects), and Pennsylvania (14 projects) having the most. Elevenstates have no recently-authorized projects. Projects can cover multiple states; however, they areprimarily local in scope, over 60% of projects have a planning area of two counties or less. Forthe purposes of this report, project location and extent was designated based on the areadescribed within the legislation listed above. Municipal or sub-county levels were defined as"Subcounty," projects defined as countywide or two counties were categorized as “1-2Counties,” and any project area greater than two counties was designated in the “3+ Counties”level.
Figure 3. Location and Extent of Proposed Projects. The map indicates the location of projects.
Projects located in more than one state are counted in each state. Five regional projects, not
included in the state project count on the map, were specified to be in the John Glen Great
Lakes Basin, Southwest, Lake Erie Region, Northeast, and New England States. One projectwas also located in Puerto Rico.
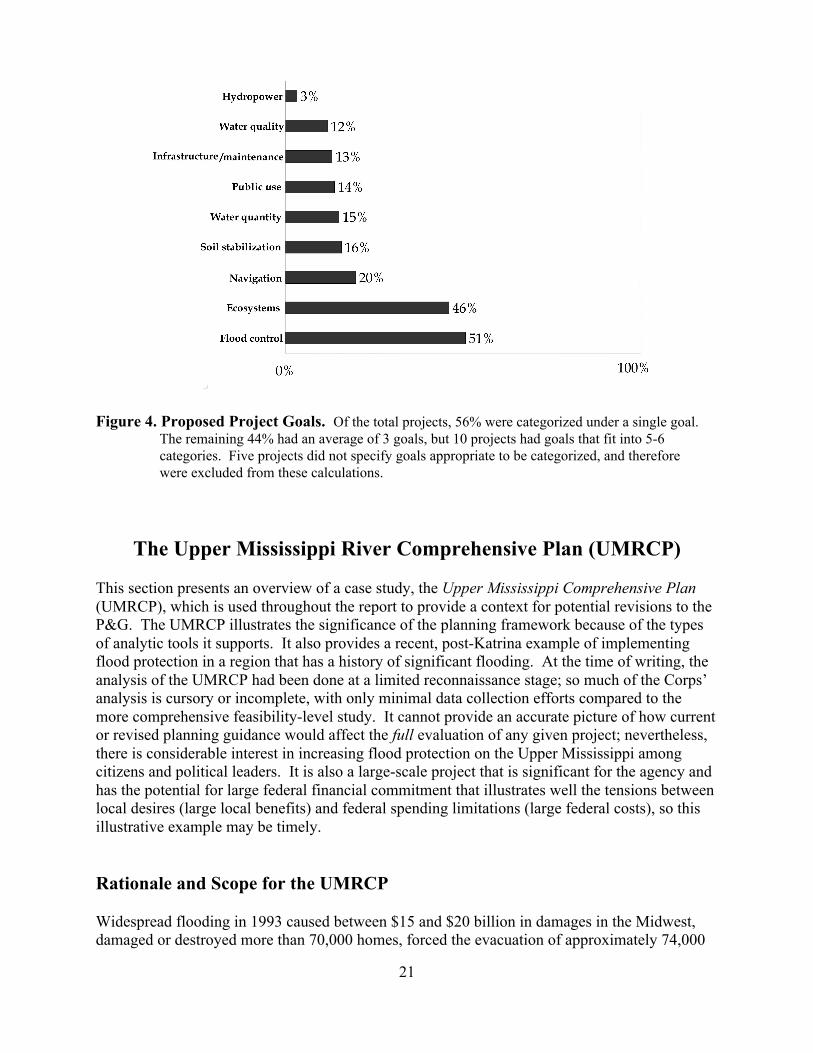
Proposed projects had a range of goals specified in the authorizing legislation (Figure 4). Bycombining related terms in legislation, categories of goals were designated. Hydropower wasonly specified in 3% of projects, whereas projects that specified ecosystem-related goals (i.e.,ecosystem protection, rehabilitation, and restoration) were in 46% of proposed projects. Termsrelated to flood control were contained in the authorizing language of 51% of projects.
21
Figure 4. Proposed Project Goals. Of the total projects, 56% were categorized under a single goal.
The remaining 44% had an average of 3 goals, but 10 projects had goals that fit into 5-6
categories. Five projects did not specify goals appropriate to be categorized, and therefore
were excluded from these calculations.
The Upper Mississippi River Comprehensive Plan (UMRCP)
This section presents an overview of a case study, the Upper Mississippi Comprehensive Plan
(UMRCP), which is used throughout the report to provide a context for potential revisions to theP&G. The UMRCP illustrates the significance of the planning framework because of the typesof analytic tools it supports. It also provides a recent, post-Katrina example of implementingflood protection in a region that has a history of significant flooding. At the time of writing, theanalysis of the UMRCP had been done at a limited reconnaissance stage; so much of the Corps’analysis is cursory or incomplete, with only minimal data collection efforts compared to themore comprehensive feasibility-level study. It cannot provide an accurate picture of how currentor revised planning guidance would affect the full evaluation of any given project; nevertheless,there is considerable interest in increasing flood protection on the Upper Mississippi amongcitizens and political leaders. It is also a large-scale project that is significant for the agency andhas the potential for large federal financial commitment that illustrates well the tensions betweenlocal desires (large local benefits) and federal spending limitations (large federal costs), so thisillustrative example may be timely.
Rationale and Scope for the UMRCP
Widespread flooding in 1993 caused between $15 and $20 billion in damages in the Midwest,damaged or destroyed more than 70,000 homes, forced the evacuation of approximately 74,000

22
people, and caused forty-seven deaths. Furthermore, the Corps has written that “[w]hile the sizeand impact of the flood of 1993 was unprecedented in recent history, floods of equal or greatermagnitude will likely occur in the future, and the region will likely again be exposed to thedestructive potential of the Mississippi and Illinois Rivers.”40
The threat of future devastation from flooding in the Upper Mississippi River System awakenedrenewed interest in developing a comprehensive, systemic approach to reducing flood damagewithin it. The Upper Mississippi floodplain comprises approximately 185,000 square miles ofwatershed area and about 1,100 river miles. Since the late 1800s, both federal and non-federaldamage reduction facilities have been constructed throughout the Upper Mississippi without asystemic, coordinated plan. The majority of the system’s components were planned and builtincrementally under various authorities, beginning around 1880. The age, structural integrity,and level of flood risk reduction provided for similar land uses vary greatly among the levees,floodwalls, and large tributary reservoirs within the Upper Mississippi.
In response to this, the Water Resources Development Act of 1999 authorized the Secretary ofthe Army to develop the UMRCP to “address water resource and related land resource problemsand opportunities in the Upper Mississippi and Illinois River basins, from Cairo, Illinois, to theheadwaters of the Mississippi River.”41 The objectives of the UMRCP are included in Appendix
F, Part 1 of this report.
In authorizing the development of the UMRCP, Congress recognized the need for acomprehensive planning effort that integrates the various existing structures and develops afloodplain management plan that might justify federal involvement and investment. However,due to the size of the study area and the inherent complexity of the system, as well as fiscal andtime constraints, the Corps chose not to study the entire Upper Mississippi River System, butlimited the scope of the UMRCP to a reconnaissance-level analysis of the Upper Mississippi andIllinois Rivers floodplain.42
UMRCP Alternatives
The UMRCP final report presented fourteen alternative plans. In addition to a “no action”alternative, the thirteen alternatives (labeled A through M) provided varying levels of urban andagricultural flood protection. The alternatives varied primarily on the level of protection andtype of flood damage reduction actions taken in agricultural areas; they ranged from a slightincrease in existing protection to 500-year protection for agricultural areas.43 Of the 13alternatives, the Corps analyzed eight plans in greater detail, which included nonstructural plans,floodplain buyouts, and structural alternative plans, all with various improvements in the level offlood protection. The report evaluated the alternatives based on benefits and costs from each ofthe four accounts described above. A summary of the comparison between the alternative plansis found in Appendix F, Part 2 of this report.
40 Ibid., p. ES-141 UMRCP, p. ES-242 Ibid., p. 443 For more information, see CRS Report, R240201, Carter 2009, p. 36.

23
Plan Recommendation
The Corps found that none of the proposed alternatives would come close to passing a benefit-cost test. Among the alternatives, the ratio of benefits to costs in the NED account ranged from alow of 0.03 to a high of 0.07, and the Corps did not recommend or request additional authority toimplement any of the alternatives for the UMRCP. Despite this, the Corps compared thealternatives using a Risk Informed Decision Framework (RIDF), which incorporatedconsiderations from the other three accounts. The final report identified Plan H as the preferredalternative. Plan H would provide a 500-year level of flood protection for urban areas and townsalong the length of the main stem of the Mississippi and Illinois Rivers (but not other tributaries)and provide ecosystem restoration benefits. Additional details on UMRCP Plan H are containedin Appendix F, Part 3 of this report.
The states could, of course, choose to develop further and possibly implement one of thealternatives studied without significant federal leadership or funding.44
Stakeholder Response
In a letter dated January 15, 2009, John Paul Woodley, Jr., Assistant Secretary of the Army(Civil Works), wrote to the Honorable James M. Inhofe, a ranking member of the SenateCommittee on Environmental and Public Works, that Plan H:
… was strongly supported by the Governors of Illinois, Iowa, and Missouri andoverwhelming[ly] by a number of stakeholders. While the [Mississippi RiverCommission (MRC)] acknowledged that the reconnaissance level analysis of theUMRCP indicated that there is no Federal interest based on NED evaluationcriteria, the MRC believed that the full benefits of implementing Plan H could notbe adequately measured within current guidelines.45
Despite the fact that the Corps did not recommend additional funding for the UMRCP, IllinoisRepresentative Phil Hare called for full funding of the UMRCP on August 15, 2008, seekingcongressional authorization to implement the plan with “federal funding so that work can beginas soon as possible”.46 Representative Hare, recently appointed to the Committee onTransportation and Infrastructure, Subcommittee on Water Resources and Environment, stated,“I will use my seat on this subcommittee to help fund the Upper Mississippi RiverComprehensive Plan.”47 On April 2, 2009, Illinois Representative Aaron Schock requested$550,000 to be allocated toward the UMRCP, noting that the funding would be used “to conducta feasibility study of the entire Upper Mississippi River and Illinois Waterway flood protectionsystems”48.
44 For more information, see CRS Report, R240201, Carter 2009, p. 39.45 John Paul Woodley, Jr., Assistant Secretary of the Army (Civil Works), letter to the Honorable James M. Inhofe,
ranking member of the Senate Committee on Environmental and Public Works. January 15, 2009, p. 246 State News Service, August 15, 2008, Press release from the office of Illinois Representative Phil Hare.47 State News Service, January 16, 2009, Press release from the office of Illinois Representative Phil Hare.48 State News Service, April 2, 2009, Press release from the office of Illinois Representative Schock.

24
PART II. REVIEW OF CRITICISMS OF CURRENT CORPS
BENEFIT-COST ANALYSIS GUIDANCE
The following sections address specific areas where the Corps’ existing planning guidance hasbeen criticized. We have grouped these criticisms into seven general categories: Regional vs.National Accounts; Planning Area; Ecosystem Services; Public Safety; Uncertainty; and OutputPrice Effects. Each section begins with an introduction to the issue, including how the topic istreated in current guidance. We then discuss existing criticisms and options for improvement.49
We finish each section by describing how the issue was treated in the Upper Mississippi RiverComprehensive Plan (UMRCP) case study. Each section also includes a “summary” box at thebeginning for readers interested in section highlights.
49 Drawing heavily on Scodari 2005 and NRC 2004.

25
REGIONAL VS. NATIONAL ACCOUNTS
Regional vs. National Account in the Current P&G
Benefit-cost analysis for water resource projects considers a wide range of benefits and costs thatcan have effects on local, regional, and national scales. As discussed above, the NED accountshows effects on the national economy, while the RED account shows how much of thosenational economic benefits and costs occur within the local region. This includes incometransfers from one part of the country to another, as well as employment changes in the region.50
The regional analysis is, by definition, a subset of the broader national analysis. The P&Gloosely define “region” as areas “in which the plan will have particularly significant income andemployment effects.”51 The definition of “significance” is not developed further in the P&G(nor in this report); it is presumably left up to the agencies to define when conducting theiranalyses.
50 P&G 1983, (1.7.1a)51 P&G 1983, (1.7.4)
Summary
The relationship and weighting between the RED and NED accounts in the currentP&G is controversial. New methods in BCA may provide additional ways to measurebenefits and costs, and aid decision-making in furthering national objectives for flood-control projects.
Criticisms of the P&G methods for RED vs. NED accounting:• RED and NED accounts are not given equal weight in considering net benefits.• Equity effects are not required in decision criteria accounts.• RED is not required nor used to inform cost-sharing possibilities between
national and local agencies.
Options for addressing these criticisms in P&G revisions include:• Require RED and use RED analysis as part of decision criteria for proposed
projects, possibly including RED net benefits in an NED-style account.• Monetize equity effects to account for the rest of the nation’s willingness to pay
for benefits in region-specific projects.• Rely less heavily on a strict cost-benefit criterion in order to accommodate
equity concerns.• Consider portfolio analysis of a collection of projects to better judge the
benefits that accrue to the nation.• Include information collected about the reduction of risk and remaining risk in a
project alongside RED.• Require and specifically tailor RED to inform potential cost-sharing options for
projects that can benefit from them.

26
Relationship between NED and RED. The P&G define the NED account as the accumulatednet benefits of all regions in the nation, including the project region. For this reason, the REDaccount is not required, and is to be included for agencies reference only. When computing theRED, the remaining benefits that accrue to the rest of the nation are shown for reference in the“rest of nation” account.52 It is important to note that because of the way the NED is currentlyconstructed, requiring RED as a separate decision-criteria account alongside the NED wouldresult in double-counting the benefits, since they are already factored into the NED total netbenefits.
Conversely, the most recent revisions of the Draft Principles released in September 2008 suggestthe Corps will be required to conduct a RED analysis, but RED benefits are not to be included inNED analysis. This suggests that no RED effects will be considered under Federal purview, andthat only NED-type effects are important in project decision-making.
Existing Criticisms & Options for Addressing NED vs. RED Account in the
Updated P&G
There are three broad criticisms surrounding the role of RED and NED. The first is NED isheavily weighted, and RED should be given more weight when projects are being decided. Thesecond is the current P&G do not include equity effects that can affect the importance of regionaland national benefits. The third criticism is that the lack of RED analysis prevents thedevelopment of cost-sharing formulas between local and federal agencies based on themagnitude of regional and national benefits.
1. Criticism that NED is heavily weighted
The P&G have been criticized for not considering local interests and the effects of alternativeplans on regions, because decisions are determined primarily on the NED account. When theCorps invited comments on the revision of P&G in a public meeting in 2008, a frequentcomment by participants was that final planning decisions did not adequately take regionaleffects into account because of the weight the current P&G place on the NED. As oneparticipant said, “[t]he other three accounts are just as important. Even though identifying theNED plan [the plan selected only on the basis of the NED account] is important, there needs tobe equal emphasis on the other three accounts when evaluating alternatives and selecting a planto implement.”53 Another participant added, “ … other accounts that include non-monetaryproject benefits should receive the same weight as the NED and project planning andprioritization.”54 Also, “[i]n spite of the fact that there have been exceptions, when you go tothe field and talk to the planners, there’s this hesitation to do anything that moves away fromNED.”55 Both the UMRCP main report and participants in the first public meeting for P&Gupdates emphasize that for the last 24 years, the Corps’ focus in project implementation and
52 P&G 1983, (1.7.1, 1.7.4)53
Principles & Standards for Water Resources Study, Meeting Transcripts (2008). Public Meeting. Lockheed MartinCorporation. p. 54.54 Ibid.P.13055Ibid. P.26-27

27
evaluation has been the NED account, which may not be the best solution for water resourcesplanning. The alternative perspective is discussed further in the following criticism.
In general, national economic development (NED) analysis assumes that all resources are fullyemployed. As a consequence, regional economic development (RED) effects can occur onlywhen resources are transferred from one or more regions of the country to the project region.”56
This assumption suggests only one of many possible scenarios that could exist within the nation,some of which are outlined in Table 3 below. The table pertains to employment and income-based benefits only, showing the possible net benefits of implementing a project under fourdifferent combinations of economic conditions. In reality, “employed resources” could also referto all monetized benefits, and may include the existence of equity preferences discussed above,as well as environmental benefits, and others.
56 UMRCP 2008, p. 82

28
Table 3: Economic Capacity in the Region and Nation
An option to address this criticism is weighting RED more heavily as a decision criterion.
2. Equity is not a major decision criterion in NED analysis
In contrast to the public comments referenced above, others suggest that weighting local benefitsraises equity concerns when federal dollars primarily benefit local projects. Two relevantquestions are 1) is it fair to use federal resources on local projects that benefit few; and2) might residents nationwide place some weight on using federal dollars for projects inparticularly poor, undeveloped or stricken areas, even though such projects may not producesufficient national-level benefits to exceed costs? Conversely, citizens may wish to not displaceor negatively affect an already-marginalized group or area with a new project that would pass anational-level benefit-cost test. The current P&G provide no guidance for answering thesequestions.
Regional economy operating
Below capacity Near capacity
Below capacity In the region:
1) Jobs created from unemployed (netgain).
2) Jobs taken from employed resources incompeting industry (ambiguousdepending on income changes).
In the rest of the nation:
1) Jobs created from unemployed (netgain).
2) Jobs taken from employed resources incompeting industry (ambiguousdepending on income changes).
Effect on national and regional netbenefits is likely both positive.
Region:
Jobs taken from employed resources in competingindustry (ambiguous depending on income changes).
In the rest of the nation:
1) Jobs created from unemployed (net gain).
2) Jobs taken from employed resources (ambiguousdepending on income changes).
Effect on national net benefit is more likely positive,and likely zero for the region, but possibly
ambiguous.
Nat
ion
al e
con
om
y o
per
atin
g
Near capacity In the region:
1) Jobs created from unemployed (netgain).
2) Jobs taken from employed resources(ambiguous depending on income
changes).
In the rest of the nation:
Jobs taken from employed resources(ambiguous depending on incomechanges).
Effect on national net benefit is likely
zero, and likely positive for the region,but possibly ambiguous.
Region:
Jobs taken from employed resources in competingindustry (ambiguous depending on income changes).
In the rest of the nation:
Jobs taken from employed resources in competingindustry (net gain zero or loss depending on incomechanges).
Effect on national and regional net benefits is likelyzero, but possibly ambiguous.

29
There are analytical techniques (stated preference methods) that allow practitioners to measurethe value of equity considerations by surveying the public’s willingness to pay for certainindirect effects. For example, survey respondents may report that they are willing to pay aspecific amount to see another region avoid catastrophic loss, even if this loss is not directly feltby the survey respondents. In this way, the benefits of equity perceptions by the general publicmight be monetized and included in the NED account, although these techniques are not yetwell-accepted among economists.
In addition, it may be valuable to place equity effects in a context that extends beyond individualprojects. One of the challenges faced by the Corps and other federal water agencies is that flood-control projects generally have benefits that accrue to very local (flood-prone) regions. Takenone by one, no single project may be justified by its effect on national net benefits in an NEDanalysis, even in major economic centers, as implied by the public comments noted above.However, taken together, a portfolio of projects in many regions across the nation may show awide distribution of benefits, justifying the use of federal dollars.
Ultimately, the importance of including equity effects in NED analysis is that these effects couldsignificantly change the number and type of projects implemented compared to those selectedunder the current P&G methods. In some cases, projects that initially do not provide enoughnational-level benefits to pass a benefit-cost test may pass if the general public holds some large(and currently unmeasured) value on reducing inequity. Conversely, projects that pass a benefit-cost test may not pass if they harm marginalized groups citizens place value on protecting.Further discussion of where reversal of a BCR is possible is shown in Appendix E of this report.
The options presented by this critique are as follows:• Include monetized equity effects to account for the rest of the nation’s willingness to pay
for benefits in region-specific projects.• Rely less heavily on a strict benefit-cost criterion in order to account for equity effects in
the decision-making process.• Consider portfolio analysis of a collection of projects to better judge the benefits that
accrue to the nation, taking into account the advantages and disadvantages of this type ofanalysis.
3. Combining regional and national interest with risk informed decisions could inform cost-sharing alternatives.
The risk information gathered from local data and stakeholders may provide a basis for adeviation from the NED plan to meet a reliability goal or constraint. The elimination of riskfactors for important economic sectors in the region can increase benefits accrued to RED whileNED benefits may not change substantially. For example, the NED plan may find a 90-yearlevee appropriate for unprotected agricultural areas, but the local sponsors, whose livelihooddepends on agricultural outputs, may find the risk remaining after a 90-year levee is constructedis still unacceptable. Local interest can be willing to pay the difference between the NED planand maximum protection from flood hazard desired by local interests.

30
Negotiating the protection level against flooding raises important trade-offs for both the Corpsand the local sponsors of the project. However, it may require additional protection beyond theFEMA base flood (100-year flood). By permitting urban development in floodplains,communities may become more vulnerable to remaining risk, and suffer increased flooddamages when floods above stated protection levels occur.
Finally, every reduction in risk typically brings additional cost to the table. Often, a move fromhigh to very high levels of protection incur extreme increases in costs, where moving from lowto moderate reductions in risk are much more affordable. Local sponsors should understandtrade-offs fully, so they can make decisions that benefit their communities the most. Riskanalysis can be used to show trade-offs between different alternative plans, and educatestakeholders on how each plan features differences in the likelihood of reduced flood damage, aswell as local and federal project costs.
The options presented by this criticism are as follows:• Include information collected about the reduction of risk and remaining risk in a project
alongside RED.• Require and specifically tailor RED to inform potential cost-sharing options for projects
that can benefit from them.
RED vs. NED Application to the UMRCP
RED in the UMRCP. Despite the fact that the RED is not required, local stakeholders in theregion asked the Corps to use the Tennessee Valley Authority (TVA) to conduct a RED-likeanalysis with existing regional data.
The TVA report analyzed the effects of construction employment, land value enhancement, farmincome gains, and flood damages averted. These were included in a multisectoral computablegeneral equilibrium (CGE) model formulated by Regional Economic Models Inc. (REMI) ofAmherst, Massachusetts. The REMI model assumes multiplier relationships between directeconomic impacts in the region (i.e., jobs created) and the additional economic activitystimulated by the direct effect (i.e., spending by the workers in local markets). The TVAestimated that every dollar spent on comprehensive flood risk management reduction wouldgenerate as much as $5 in increased gross regional product.57 Gross regional product is definedas “an estimate of each state or region’s share of the nation’s gross domestic product, which isthe total value of the goods and services produced by labor and property in the United States.”58.
NED in the UMRCP. The NED analysis in the UMRCP study is outlined in Appendix C of theUMRCP. The primary focus of this analysis is to project potential flood damage (by river reach)under current climate conditions and with current levees. Because analysts can assign aprobability to any given level of flood damages and plot these damages as a function of
57 Ibid., p. ES-558 Ibid, p. 79

31
probability (see Figure 5), this approach is referred to as the “damage curve” approach, whichrelates to the “risk costs” in Figure 2. Total expected flood damages for the status quo can becalculated by summing the area under the probability curve (the area in purple in Figure 5). Agiven plan alternative increases the level of flood protection (i.e., raises levees) and thereforereduces the expected flood damages, shifting the curve in Figure 5 downward. NED benefits arethen defined as the difference in expected damages between the status quo condition and the newalternative plan. This process is repeated for several alternative plans. Data for the damagecurves in the UMRCP varied in completeness, with some sections of the river providing morerecent data, and others with less information available.59 In addition, the precise process forconstructing these damage curves is not discussed within Appendix C of the UMRCP, suggestingthe analysis may be largely incomplete. One reason for this may be that since the estimatedbenefit-cost ratios of all alternative plans were significantly below one (most are less than 0.1), amore detailed and time-consuming accounting of costs and benefits was not justified at thereconnaissance level.
Figure 5. Sample damage curve from UMRCP Final Report, Appendix C, p. C-17
There are three reasons why the Corps’ analysis in the UMRCP may not be representative forthe purposes of illustrating existing criticisms and suggestions. First, the UMRCP was analyzedat the reconnaissance level, not the feasibility level. Second, the TVA’s analysis of regional
59 UMRCP 2008. Appendix C, p. C-16.

32
economic impacts was adapted and included as a form of RED. A typical RED analysis,however, is a subset of the NED analysis. In the UMRCP, the NED analysis used a fairlysimple damage curve approach while the RED analysis used a very sophisticated simulatedeconomic model. The RED analysis in the UMRCP is certainly not a subset of the NED.Furthermore, it is worth noting that the TVA’s RED analysis used proprietary commercialsoftware (REMI) to model these effects. Although REMI makes a large amount of modeldocumentation available through its website, the lack of a completely transparent and freely-available model that interested groups can test may be at odds with the Corps’ goal of openpublic deliberation. Third, although the UMRCP included a fairly extensive environmentalimpact analysis in the EQ section (discussed more below), the Corps made no attempt tomonetize any of these effects. Without monetizing the effects, they could not be included in theNED account.

33
PLANNING AREA
Planning Area in the Current P&G
The P&G define planning area as “the geographic space with an identified boundary.”60 Theauthorizing document of the study generally determines boundaries of the area. Additionally,two other components identify boundaries of the planning area:
1. Project areas, where alternative plans are located.2. Affected area, where the resources affected by alternative plans directly, indirectly, oraggregately are located.
According to the P&G, the planning area should include planning problems and opportunitiesand geographic areas that alternative plans may impact. However, existing criticisms raiseconcerns about how that planning area is determined under the P&G, which will be discussed inthe following section. The P&G provides minimum guidance to planners, and according to somecritics, planners tend to limit the geographical scope of the planning area. Beyond planningguidance problems, limited budgets and local sponsors’ cost-sharing concerns can constrict thescope of the planning area. As a result of a limited scope, planners often ignore watershed-wideeffects by not looking at the impacts of alternative plans in affected areas outside the planningarea. Some critics suggest including upstream and downstream analysis in the P&G in order tointegrate a more comprehensive, watershed-wide perspective.
60 (P&G, 1.4.7)
Summary
The completeness of a project’s benefit-cost analysis is influenced by how its planningarea, including areas both upstream and downstream of the project, is defined andmanaged.
Criticisms of the P&G methods for defining planning area include:• Minimal guidance in defining geographical boundaries of project areas.• Lack of focused guidance on how to integrate river basins when determining
affected areas.• Financial limitations and differences between local and national interests limit
geographical boundaries of the planning area.
Options for addressing these criticisms in P&G revisions include:• Coordinated upstream and downstream analysis can cover an entire river basin
and help to minimize unintended impacts of upstream water resources projects ondownstream communities.

34
Existing Criticisms of Planning Area in the P&G
Criticisms relate to limited geographic scope for the planning area and a lack of guidance inwatershed-wide planning. The following section will discuss these criticisms and associatedfactors more in-depth.
The overall criticisms on the planning area focus on the requirement for planners to account forindirect and regional effects of optional plans. P&G mandates planners to consider all possibleeffects wherever they emerge.61 Limited geographic scope prevents planners from taking intoaccount all potential locations that may be included in alternative plans for planning problemsand opportunities. Also, project planning can exclude indirect and comprehensive watershedeffects of plans. For example, downstream economic and environmental effects are among theignored indirect and watershed effects. There are a variety of factors that limit the geographicscope of the planning area:
1. Minimum P&G guidance for geographical boundaries of project areas
The P&G do not specifically define geographical boundaries of project areas; nor do they limitthe geographical scope. However, in some instances the study area is defined in the projectstudy authorization. Where this is the case, the planning area should comprise the study area asdefined in the authorizing document. The P&G also guides planners to define the planning areaaccording to problems and opportunities and the geographic areas that alternative plans canaffect.62 Planners may or may not conclude that alternatives outside the geographical boundariesof the planning area can bring opportunities to solve planning problems. There is nothing in theP&G to prevent planners from excluding project areas outside the geographic boundaries of theplanning area.
2. Lack of focused guidance on how to integrate river basins when determining affected areas
The P&G requires planners to consider all benefits and costs. Even costs and benefits accruedoutside the geographical planning area are supposed to be included in the benefit-cost analysis.Because the affected area comprises resources affected by alternative plans directly, indirectly,or cumulatively, the P&G allow planners to include affected areas beyond the geographicboundaries of project areas. However, the P&G do not focus on any watershed-based planning,which can incorporate effects of alternative plans in other resources outside project areas. TheCorps’ general tendency to prefer local, single-purpose projects does not support a watershed-wide perspective in the planning process.63 As a result of the lack of focused and integratedbasin-wide planning, water resources planning projects guided by P&G ignore the indirect andcomprehensive watershed-wide effects of alternative plans. A watershed-wide perspective inP&G could help ensure that these effects are considered in the planning process. In contrast tothe P&G, the Planning Guidance Notebook (PGN) emphasizes the inclusion of a watershed-wideperspective in project planning.
61 Scodari, 2005, p.10-12.62 P&G, 1.4.8, p. 863 Scodari, 2005.

35
3. Financial limitations and differences between local and national interests can limitgeographical boundaries of the planning area.
Not all factors limiting the scope of the planning area may come from planning guidance. Studybudgets and local sponsors can limit the planning area’s geographical scope. Limited budgetscan contribute to limited scope, which make watershed planning less likely.64 Local sponsors, onthe other hand, may be concerned about cost-sharing of the project. If the alternative that localsponsors prefer is not viable from the federal funding perspective, local sponsors may choose toignore affected areas and project areas beyond the geographical boundaries defined by theauthorizing document. For example, an alternative, which causes a possible economic andecological problem in downstream communities, may be preferred by local sponsors. Since thisalternative cannot be accepted from the federal funding perspective, local sponsors may want tolimit geographical boundaries of the planning area by rejecting opportunities that use awatershed-wide perspective.65
Options for Addressing Planning Area in the Updated P&G
Upstream/ Downstream Analysis: An Integrated River Basin. Integrated, watershed-wideplanning ensures the coordination of water resources plans along a watershed.66 Upstream anddownstream analysis (UDA) can help engineers identify the performance of flood control incommunities upstream and downstream by examining risk factors in both reaches of a riverbasin.67 Flood control strategies, which target optimum flood damage reduction, are unique toeach watershed, because different watersheds within a basin may have different flooding patternsand landscape characteristics. For example, upstream projects, which are often uncoordinatedwith downstream projects, may result in unintended impacts downstream. Consequently,upstream flood control projects need careful assessment of when and how much floodwater isaccumulated in the downstream reaches of a basin.68 Coordinated upstream and downstreamanalysis can cover an entire river basin and help minimize unintended impacts of upstream waterresources projects on downstream communities.
Upstream and Downstream Analysis in Current P&G. While upstream and downstreamanalysis can fit a variety of water resources related projects such as sediment control, watershedmanagement, water quality monitoring and evaluation, streambank fencing, and floodplainmanagement, the P&G provide limited guidance on this type of analysis. Although downstreamand upstream concerns are mentioned in the P&G, the P&G neither requires nor suggestsanalyzing upstream watershed management methods or downstream flood reduction. The P&Gguide the Corps to “increase upstream watershed management and conjunctive use of ground andsurface waters” as a part of nonstructural measures and conservation methods.69 Upstream
64 Ibid.65 Scodari, 2005.66 Ibid.67 Red River Basin Flood Damage Reduction Work Group, 199868 Ibid.69 P&G, p.117

36
flooding issues are also mentioned in NED benefit evaluation procedures for urban flooddamage. If an urban flood damage plan or project causes downstream flooding, P&G regardsdownstream flood damages as an increase in damage.70 Since downstream damages arecategorized as NED other direct costs, the Corps counts the downstream flood damages as a partof national economic development direct costs.
Other direct costs: Costs of resources directly required for a project or plan, but for which nofinancial costs are compensated by Federal or non-Federal agency or entity. These costs areuncompensated, unmitigated NED losses caused by the installation, operation, maintenance, orreplacement of project or plan measures.71
Contrastingly, the PGN emphasizes the importance of watershed studies because of their multi-purpose and multi-objective scope.72 Since watershed management brings flexibility andcollaboration in the formation and evaluation of alternative plans, it is recommended forsuccessful planning initiatives. Therefore, there are two primary reasons for including UDA intothe P&G.
First, all parts of the basin are inter-linked.73 Any decision ignoring a complete analysis of thebasin can result in problems in different locations of a basin. A flood control strategy that fitsupstream may cause different results downstream, causing tension between different parts of theriver basin. Downstream communities may fear that they are incurring costs associated withupstream structures while benefits are being accrued by upstream communities. Local sponsorsin the upstream, on the other hand, may think that unexpected flooding problems in thedownstream result from their flood mitigation strategies.74 Upstream and downstream analysiscould be used to better account for costs and benefits of a project at a system level as opposed toa project level.
Second, dam safety issues and associated risk analysis highlight the importance of upstream-downstream connections.75 Decisions on upstream and downstream reaches of the dam can beexamined in a risk context to balance demands of local interests. When dams break, the safety ofdownstream communities is in jeopardy. Flood damage will be more serious than it will beupstream, because flood magnitudes increase as contributing areas of water increasedownstream. Such residual risks prevalent at different levels of river basins require a holisticunderstanding of watersheds along a river. UDA can integrate a watershed-wide perspective intodecision-making.76
70 P&G, 2.4.1771 P&G, 1.7.2, p. 1072 PGN, 3-3773 SLMcLeod Consulting et al. (1999) Review of Red River Basin Floodplain Management Policies and Programs.
Retrieved from http://www.rrbdin.org/communication/filebank/files/Floodpln.pdf74 SLMcLeod Consulting et al., 1999.75 Moser, D.A. (2001); CRS Report, RL33129, Carter & Cody, 2008.76 U.S. Bureau of Reclamation, 2000; Cooter, 2006; SLMcLeod Consulting, 1999.
37
Case Study: Jackson Mississippi
The Jackson Mississippi case exemplifies what can happen if consensus along a watershed is notreached regarding flood management strategies. Jackson has faced severe flooding for the past25 years. Throughout that time, upstream localities such as Pearl River and downstream regionssuch as Columbia, MS have implemented different flood control plans. Although the plans havereduced the short-term flood risk for communities along the watershed by mitigating floods withdifferent strategies, the absence of consensus in flood management strategies caused strongerfloods in the region.77 Uncoordinated strategies made downstream communities more vulnerableto the higher flood elevations each year, increasing their residual risks.78 In the Jackson case,upstream and downstream analysis may have provided the necessary level of informed decisionsamong local sponsors by recognizing interests of both upstream and downstream communitiescollectively, leading to coordinated floodplain management along the entire watershed.79
Planning Area Application to the UMRCP
The UMRCP demonstrates typical tensions that can arise between upstream and downstreamcommunities during and after public meetings north and south of St. Louis, MO.80 In theUMRCP, Plans A, D, G, and M (see Appendix F of this report) mention upstream anddownstream effects of proposed alternatives. The plans mainly have impacts on the LowerMississippi area by creating flood-water storage areas or eliminating certain agricultural lands.Among the alternatives, Plan G was favored strongly by residents living north of St. Louis, MOat public meetings, because Plan G involved a high level of protection and a 10,000 acre storagearea located downstream of north of St. Louis, MO, the floodplain of Monroe County, IL.Unlike north of St. Louis, Chester, IL, — located south of St. Louis, MO — strongly refusedPlan G because of the storage area and potential buy out of 10,000 acres of agricultural land.The tension between upstream and downstream communities in the St. Louis district resulted inthe formulation of Plan M, created nine months after the public meetings. Plan M is a variationof Plan B. Plan M ensures that impacts on the downstream water surface is minimized, and itprovides additional strategies for the area south of St. Louis to raise their protection level.Compared to Plan G, Plan M eliminates the purchase of 10,000 acres of storage area in MonroeCounty, MO.
77 Kilgore & Davis, 2000.78 Ibid.79 Ibid.80 UMRCP, p. ES-5

38
ECOSYSTEM SERVICES
Ecosystem Services in the Current P&G
The procedures in the Principles and Guidelines (P&G) handle environmental effects of projectsprimarily as a separate issue from economic and other effects. Chapter three of the P&Gincludes guidelines for assessing factors in the Environmental Quality (EQ) account. Items to beincluded in the EQ account include “ecological, cultural, and aesthetic properties of natural andcultural resources that sustain and enrich human life.”81 The specific environmental effects andthe methods for quantifying or assessing them are not described and can vary widely betweenprojects. The account is separate from the NED account, but according to the P&G, any EQ costor benefit that can be monetized should be included in the NED costs and benefits.82
While not explicitly discussed in the P&G, effects on ecosystem services are one of the waysenvironmental impacts can be studied in assessing projects. Ecosystem services broadlyencompass any benefit to humans provided by natural ecosystems. They can include anythingfrom providing naturally occurring foods to purifying water or regulating the climate. Whenanalyzing projects that can affect or change the natural environment, increases in ecosystemservices are included as a benefit, while decreases can be added to the cost of the project.
81 Principles and Guidelines, p. 103.82 Ibid.
Summary
Environmental effects and ecosystem services are difficult to quantify or value inbenefit-cost analysis. The P&G account for these effects mainly in a separate, non-required EQ account.
Criticisms of the P&G methods for environmental analysis include:• The P&G do not provide strong guidance on how to quantify and monetize
environmental effects.• Since effects can be quantified in a number of ways, it is difficult to make
comparisons between accounts and within the EQ account.
Options for addressing these criticisms in P&G revisions include:• The new P&G could require EQ analysis and provide additional guidance on
making comparisons between accounts.• They can also provide further guidance on methods for quantifying and
valuing environmental effects, possibly including newer methods developedsince 1983.

39
Existing Criticisms of Ecosystem Services in the P&G
In critiques of the P&G, authors remark that the valuation and inclusion of ecosystem services isnot adequately covered and the guidelines for including ecosystem services in the accounts is notconsistent. The main concerns can be combined into three general points.
1. The P&G are not clear in stating how monetized environmental effects should be included inthe NED account, and those that cannot be monetized should be recorded in the EQ account.83
When separate accounts are included in analysis, this can blur the line between accounts and thecosts and benefits relevant to each. Also, according to some critiques, the P&G do not providesufficient guidance on how environmental quality effects and ecosystem services should beevaluated and monetized to be included in the NED account.84 While procedures and techniquesfrom the early 1980s, such as travel cost method and contingent valuation, are described brieflyin the P&G, there is little direction for including monetary valuation of nonmarket environmentalbenefits and costs. Additionally, there has been significant progress in this field in the last 25years, with advances particularly in stated and revealed preference methods for valuing non-market costs and benefits, which are not described or required by the P&G. The Corpsincorporated some updated methods and requirements on valuing ecosystem services into thePlanning Guidance Notebook (see below).
2. The P&G do not include guidance on environmental services such as soil fertilization ordegradation that can be relevant to benefit-cost analysis for alternative projects. Critics point outthat BCA only takes into account present environmental quality or quantity, and it does notconsider environmental changes resulting from the implementation of the different alternatives,85
resulting in the failure to include increases or decreases in the level of ecosystem services fromthe different alternative projects. Other critiques claim that the P&G ignore the value ofenvironmental protection and ecosystem services in general and suggest that revisions to theP&G should fully account for the costs of environmental damages and benefits of environmentalservices.86
3. Benefit-cost analysis should not be the single deciding factor on whether or not to go forwardwith a project. The NRC Report (2004) emphasizes the importance of including a wide range offactors in decision-making stating that:
Implicit in the current planning process is that sound water management decisions arebased primarily on monetized values derived by analytical methods, but this is clearly not
83 From critical review (is critical review the title? If so, indicate with punctuation) of the P&G by Anthony Fisher,
Department of Agricultural and Resource Economics, University of California at Berkeley, commissioned by the
U.S. Environmental Protection Agency. (July 16, 1993).84 Scodari, 2005.85 Larson, Douglas. (1994). Procedures Used to Assess Environmental Benefits in Principles and Guidelines.
Review of Economic and Environmental Principles and Guidelines for Water and Related Land Resources
Implementation Studies.86 From Scodari (2004). National Wildlife Foundation and Taxpayers for Common Sense. Crossroads: Congress,
the Corps of Engineer and the future of America’s water resources (March).

40
the case. Other important social, environmental, and even political considerations shouldbe recognized explicitly in the decision-making process.87
Options for Addressing Ecosystem Services in the Updated P&G
Several scholars have offered methods for how ecosystem services can be quantified and thenvalued to be incorporated in a more comprehensive benefit-cost analysis. Select major methodsof valuing ecosystem services are discussed below, along with approaches for including non-quantifiable ecosystem services.
Methods for Valuing Ecosystem Services. Since conducting nonmarket valuation studies isoften timely and expensive, benefit transfer is a potential way for providing monetized values forecosystem services by using values from previous studies and applying them to similar studiesbeing conducted by the Corps. This method is useful if it is not feasible to conduct a fullanalysis of the benefit in question. Douglas Larson, an academic who was part of The Zilberman
Review, suggested creating a database of valuation studies that the Corps could use whenanalyzing alternative plans, which could also include meta-analyses of multiple environmentalvaluation studies.88
Alternative Analyses. Complete data is not always available when making decisions. In thesecases, policy-makers may be aided in making more informed decisions by using alternativeanalytical strategies:
• Qualitative discussions of the benefits could be included in cases where quantitativeanalysis is not possible addressing why such quantitative analysis is not feasible and thereasons why the qualitative data is relevant. The P&G description of methods for the EQaccount allows for some use of qualitative analysis, but provides little detail on how tocomplete the analysis and combine or compare it with other analyses.
• Breakeven analysis could be used in cases where risk or valuation data is lacking toestimate the number of units affected or willingness-to-pay value required to "breakeven"on a given project. Decision-makers can then determine whether the breakeven estimateis reasonable or not.
• Bounded analysis could be used when values are available for high-end and low-endscenarios for ecosystem services and environmental quality to create upper and lowerbounds for the value. The estimated benefits can then be evaluated based on the range ofvalues, which may provide insight or guidance when analyzing benefits and costs ofenvironmental quality and ecosystem services.
The Planning Guidance Notebook and Army Corps Circulars. Circulars issued by the Corpsguide the evaluation of future projects when considering ecosystem restoration and services, andone option for updating the P&G could be to incorporate the methods used in the environmentalcirculars into the revised version.
87 NRC Report, p 51. (2004).88 Ibid. Larson, Douglas. (1994).
41
The Corps’ Planning Guidance Notebook (PGN) includes ecosystem restoration as one of theproject purposes, along with other purposes such as flood damage reduction and navigation. Theobjective of ecosystem restoration according to the PGN is “to restore degraded ecosystemstructure, function, and dynamic processes to a less degraded, more natural condition.”89
Ecosystem restoration can be the sole purpose of the project or part of a multi-purpose project.The PGN states that “similar to other project purposes, the value of ecosystem restorationoutputs shall equal or exceed their cost.”90 Outputs of ecosystem restoration must be clearlyidentified and quantified in appropriate units”91 such as habitat units restored or increases innumber of breeding birds. The PGN recognizes that “the significance of the outputs is a criticalfactor in determining if the monetary and/or non-monetary benefits of the proposed projectjustify the costs,”92 including considerations of scarcity of the outputs. Contingent valuationsurveys for estimating non-market values of ecosystems are not approved PGN standards forquantifying benefits or outputs due to the speculative nature of estimating values and difficulty incontrolling for bias.93 Cost effectiveness analysis is to be used for identifying “the least costsolution for each level of environmental output being considered,”94 where the additional cost ofachieving each additional unit/level of output can be assessed to assist decision-makers whenforming and evaluating plans.
Under the PGN, project outputs can fall under the NED Plan or the National EnvironmentalRestoration (NER) Plan, which for ecosystem restoration projects is the plan that “reasonablymaximizes ecosystem restoration benefits compared to costs, consistent with the Federalobjective.”95 When projects have both NED and NER benefits, a Combined NED/NER Plan iscreated with the goals of maximizing the “sum of the net NED and NER benefits, and offeringthe best balance between two Federal objectives,”96 considering both monetary and non-monetary benefits and costs.
The Corps further issued Circular 1150-1-404, “Planning Civil Work Projects Under theEnvironmental Operating Principles.” The objective of this circular is to promote environmentalsustainability, which is defined as a “synergistic process whereby environmental and economicconsiderations are effectively balanced through the life cycle of project planning, design,construction, operation and maintenance to improve the quality of life for present and futuregenerations."97 The circular calls for formulating a Combined NED/NER Plan that incorporatesboth NED and NER plans into one plan and addresses the discord these two plans oftenencounter when weighing economic benefits against environmental quality. The documentstates, “the formulation and evaluation process for the Combined NED/ NER Plan shallexplicitly account for those conflicts and identify a balanced plan that addresses both types ofbenefits,” and outlines steps to follow for formulating the Combined NED/NER Plan. This planplaces more emphasis on considering environmental quality when comparing alternative plans
89 Planning Guidance Notebook, 3-5b.90 Ibid, 3-5.91 Ibid, 3-5c.92 Ibid, 3-5c.93 Ibid, 3-5c94 Ibid, 3-5c.95 Ibid, 2-3f.96 Ibid, 2-3f.97 Army Corps Circular 1150-1-404, “Planning Civil Work Projects Under the Environmental Operating Principles.”

42
and provides a framework for incorporating environmental considerations into the final plan,addressing the issue of comparing monetized benefits with more qualitative benefits throughtrade-off analysis. Trade-off analysis is a tool used by the Corps to “identify the potential gainsand losses associated with producing a larger or lesser amount of a given output or outputs.”98
Ecosystem Services and the EQ Account in the UMRCP
The UMRCP contains a preliminary assessment of ecosystem services effects and the EQaccount, based mainly on existing reports and data.99 Environmental effects were quantified forsix of the 12 plans. The potential magnitude of the effects of the six other plans is discussedbriefly in comparison to the six assessed plans.100
In addition to a description of current environmental conditions focused on habitat loss,endangered species and water quality, five areas of environmental assessment were quantifiedand compared for Plans B, D, E, H, I, and J:
• Mitigation, reported as the number of acres of habitat mitigation required. The Corpsestimated the area and habitat types likely to be impacted by each plan. This estimatewas then multiplied by a generic cost per acre estimate for required mitigation to arrive ata total mitigation cost.
• Secondary development, reported as the potential acres of new development. The Corpsestimated the number of acres that would be above the 100-year protection level for eachplan. These acres would then be available for development and the related potentialnegative environmental and economic impacts, such as increased water pollution fromrunoff and increased damages when floods overtop levees.
• Ecosystem restoration opportunities, reported as the number of ecosystem restorationacres, percent of sustainability achieved and related costs. The Corps quantified thenumber of potential restoration projects and the area they would cover.
• Nutrients reduction, reported as the potential acres of wetland restored. The Corps usedan estimate that showed that 38% of the 100-year flood area was either wetland ordamaged wetland. This percentage was applied to the number of acres of potentialecosystem restoration to estimate the potential acres of wetland restoration.
• Sediment reduction, reported as the number of tributary feeders restored. The Corps usedthe number of tributaries identified in the ecosystem restoration category above.101
While some of these categories included monetized values for costs of environmental restorationand mitigation of negative effects, the monetized values were not added to the NED account, asrequired by the P&G.102 Instead, they are presented and assessed as part of the separate EQaccount.103 Since only a few of the EQ categories were monetized and there is no standardmethod to compare NED with non-monetized EQ effects, it is difficult to determine whether the
98 Ibid, 2-3f.99 UMRCP, Appendix A, p. A-2.100 UMRCP, p. 96.101 UMRCP, p. 92-93.102 Principles and Guidelines, p. 103.103 UMRCP, p. 99-100.
43
EQ costs could be large enough to have an impact on the Corps’ NED-based decision. However,based on the assessment, Plan J was determined to be the best plan from an environmentalperspective, ranking highest in all five environmental categories covered.104
The Corps also looked at a number of other environmental effects and impacts, but did notinclude any quantification or analysis within the EQ account. It is unknown whether fullassessment of these particular environmental effects and opportunities might be included infurther study. For example, the study includes a list of federal and state endangered speciesfound within the study area.105 However, there is no specific analysis of which species may bepositively or negatively impacted by the different plans and the potential magnitude of theseeffects.
Additionally, expert opinion was used to grade each plan on its potential impact in 12 othercategories of general environmental effects. Likely impacts were rated between +3 (majorbeneficial effects) and -3 (major adverse effects).106 However, this assessment is consideredvery preliminary and is not part of the EQ account. The Corps suggests a much broader andmore intensive environmental assessment in the case that one or more of the alternative plans arerecommended for further consideration.107
104 UMRCP, p. 95.105 UMRCP, Appendix A, p. A11-A14.106 Ibid. p. A-31.107 Ibid.

44
PUBLIC SAFETY
Public Safety in the Current P&G
In assessing damages and benefits of programs, one method of quantifying impacts on publicsafety is to measure the expected number of lives saved as a result of increased protection, or theexpected number of lives lost if an existing or new structure would fail. These types of effectsare included in the optional Other Social Effect (OSE) account under the current P&G. Since theCorps has not attempted to monetize these effects, they have not been included in the required,binding NED account.
Existing Criticisms & Options for Addressing Public Safety in the Updated
P&G
One approach for monetizing expected reductions in mortality risk is the Value of a StatisticalLife (VSL) method. VSL attempts to monetize reductions in mortality risk by observing ordirectly asking how people trade-off money for changes in mortality risk. Estimates come fromlabor market studies examining wage premiums that workers demand for risky jobs, studies ofdemand for risk-reducing products (helmets, car safety improvements, etc.), or stated preferencestudies.
VSL has been incorporated into many benefit-cost analyses undertaken by federal agencies suchas the EPA,108 though their use remains controversial. Guidance provided by the Office ofManagement and Budget (OMB) includes a detailed discussion of accepted usage as well asimportant considerations when including VSL calculations in agency analyses.109 OMBdocumentation indicates, “a substantial majority of the resulting estimates of VSL vary from
108 Kenkel, Donald (2003). “Using Estimates of the Value of a Statistical Life in Evaluating
Consumer Policy Regulations” Journal of Consumer Policy 26 (1): 1-21.109 Office of Management and Budget Circular [0]A-4, September 17, 2003.
Summary
How and whether public safety is accounted for in benefit-cost analysis can have abig impact. The Corps does not currently take public safety into account in itsproject analyses. This may become especially important given the commitment toinclude “human safety” as an important consideration in the P&G update.
Criticisms of the P&G methods for accounting for public safety include:• The P&G do not provide strong guidance on how to quantify and monetize
public safety effects.
Options for addressing these criticisms in P&G revisions include:• The new P&G could require a public safety account that includes recent
tools to monetize public safety effects, like Value of Statistical Life.

45
roughly $1 million to $10 million per statistical life”110 Because of the high value per statisticallife, including or excluding VSL calculations in BCA can be the determining factor in whether aproject passes a benefit-cost test.
Although the updated Draft Principles as of September 2008 recognize the importance ofanalyzing public safety issues, they do not suggest that including or monetizing these effects as arequirement.111
The option presented by this criticism is to use recent VSL methodologies in calculations ofreduced mortality risk, as well as the residual risk remaining after the project.
Public Safety in the UMRCP
Because the Corps is not required to use public safety calculations, the UMRCP reconnaissancestudy did not attempt to place an economic value on the reduction in lives lost as a result of floodprotection from each of the alternatives. Similarly, neither the UMRCP’s Appendix I (on Risk-Informed Decision Framework) nor discussions of residual or other types of risk and uncertaintyin the planning process specifically mention any type of monetization of potential loss of humanlife in the analysis.
110 Office of Management and Budget Circular [0]A-4, September 17, 2003. p.30111 P&G Draft Principles, September 2008. http://www.usace.army.mil/CECW/Pages/pgr.aspx

46
UNCERTAINTY
Uncertainty in the Current P&G
The P&G state that “uncertainty and variability are inherent in water resources planning. . . . Insituations of uncertainty, potential outcomes cannot be described in objectively knownprobability distributions … Because there are no known probability distributions to describeuncertain outcomes, uncertainty is substantially more difficult to analyze than risk.”112
The P&G offer the following steps for addressing risk and uncertainty in water resource projects:
1. Planners should collect more detailed data during the feasibility and reconnaissancestages of a project to reduce measurement error.
2. More refined analytical techniques, such as sensitivity analysis, should be used.3. Safety factors within the design models should be increased.4. Planners should select measurements or indicators with better-known performance
indicators. `5. Irreversible or irretrievable commitments of resources should be reduced.6. Planners should perform sensitivity analysis to make better estimates of the benefits and
costs of the alternatives.113
Some uncertain phenomenon, such as demographic, economic, hydrological, and metrologicalevents, can be described using historical data to fit a probabilistic distribution, while others canbe described subjectively by expert opinion. The measures above may increase the costs and
112 P&G, 1983 Supplement I.113 P&G, 1983 Supplement I.S2.2.b
Summary
Most components within benefit-cost analysis do not have one value, but are bestcaptured as being within a range of values. Analytical tools can be used to providebenefit-cost information as probabilities and better account for uncertainty. Impactssuch as the amount of precipitation a region receives in a given year, the effect ofclimate change on a river system, and the development of communities in a river basinare perhaps best presented as ranges rather than fixed values.
Criticisms of the P&G methods for accounting for uncertainty include:• The current P&G focus on point estimates of risk and uncertainty
Options for addressing these criticisms in P&G revisions include:• Incorporate uncertainty in input prices.• Use Monte Carlo analysis to simulate probability distributions.• Use confidence intervals as opposed to point estimates to describe uncertainty
whenever possible.

47
benefits of a proposed project; however, integrating uncertainty into decision-making is animportant component of water resource planning.
The National Economic Development (NED) account treats uncertainty in two ways. First,general guidelines are outlined in the supplemental to Chapter 1, where NED project benefits arerequired to be “calculated on the basis of ‘the most probable’ with-project and without-projectconditions".114 The chapter prescribes sensitivity analyses, including comparing current benefitunits (e.g., shipping tonnage) to projected units (e.g., projected tonnage) of a new waterway,incorporating growth rates for the time period, and incorporating changes in user charges.
The second treatment of uncertainty in the current P&G fall within specific guidance for each ofthe various components of the NED account: Municipal and Industrial Water Supply,Agriculture, Urban Flood Damage, Power, Transportation, Recreation, Commercial Fishing,Other Direct Benefits, Labor Resources, and Cost Evaluation Procedures. Of these sections,three give specific guidance on evaluating uncertainty. Measuring savings to shippers isconfounded by uncertainty in impact on the long-run marginal costs to shippers.115 The solutionsare to 1) establish consistent sources of data, 2) expand data gathering, and 3) estimate the rangeof benefits. It is also suggested that planners produce high and low projections as well as withand without estimates of impacts for project costs and benefits.116 Finally, it is stated that “riskand uncertainty attached to the hypothesized outcomes can be reduced by clearly revealing areasof uncertainty.”117
Notably, the P&G do not include an analysis of uncertainty in the evaluation of EQ effects. TheP&G decision-making process states that "the agency decision-maker is responsible for judgingwhich of these types of net EQ effects best reflects the desirability of an alternative plan's overalleffect on environmental quality." This decision is to be made based on, at minimum, "the tablesused to document the previous activity" where the "the net EQ effect of each alternative planshould be expressed in a clear and complete narrative statement that identifies the type of net EQeffect expected."118
There is no information specifically dealing with uncertainty in the P&G in either the OSE orRED accounts.
Existing Criticisms and Options for Addressing Uncertainty for Updated
P&G
Experts highlight fundamental ways in which the Corps can improve its use of risk anduncertainty analysis for water resource projects.119 In general, critiques suggest that uncertaintyanalysis should:
114 P&G, 1983, Ch. 2.6.15.d115 P&G, 1983, Ch. 2.6.15.d116 P&G, 1983, Ch. 2.7.4.2117 P&G, 1983, Ch. 2.10.7118 P&G, 1983, Ch. 3.4.15.b-d119 Scodari, P. (2005). Survey and Analysis of Criticism of Corps Planning and Links to Planning Guidance.

48
1. Consider uncertainties in input prices.
Physical costs of levee construction are particularly sensitive to the height of the levy, as evenincremental increases in levee height can result in costs drastically higher than projected.120 Thesame could apply to other aspects of physical construction, such as varying costs of materialsover the lifetime of a long-term project. While PNG does advise sensitivity analysis regardinginput price levels in relation to population and income, it does not address uncertainty related topolicy change. Even policies in unrelated fields could drastically alter the demand elasticity andother factors relevant to input prices. Projections made far into the future should thereforeaddress the sensitivity of BCA conclusions to such policy changes.121
2. Incorporate uncertainties concurrently using Monte Carlo analysis.
The relative weighting of individual parameters is one of the major problems in conventional riskanalyses. Elicitation of weights from decision-makers can be difficult, especially when theconcepts of uncertainty are not well-understood, and are often inconsistent from one individualto the next. Monte Carlo methods122 can account for the sensitivity of a project to the relativeweighting of these parameters. The explicit incorporation of uncertainties, both in the individualparameters and within the analysis itself, will strengthen the analysis and make decisions mucheasier for the decision-makers (because the elicitation of weights is not as crucial).123,124
3. Use confidence intervals rather than point estimates.
Point estimates are often misinterpreted by decision-makers and the general public, and do notgive a complete picture of the range of outcomes resulting from uncertain systems. Monte Carloanalysis explicitly incorporates uncertainty throughout the planning process, ultimately resultingin a probabilistic distribution of costs and benefits. This type of analysis will allow decision-makers to consider the likelihood that a project will pass a cost-benefit test, rather than having torely simply on a point estimate.125
120 Davis, D.W., Faber, B.A..& Stedinger, J.R. (2008). USACE Experience in Implementing Risk Analysis for Flood
Damage Reduction Projects. Journal of Contemporary Water Research & Education, 140, 3-14.121 Hyde, W. F. (1994) Principles and Guidelines: A Ten-Year Critique. The Zilberman Review, 3.122 Monte Carlo techniques allow the analyst to allow several uncertain parameters to vary simultaneously and
construct a range of possible outputs (in this case, net benefit measures). Specifically, the analyst defines a
distribution of plausible values for each uncertain parameter. The Monte Carlo model then randomly draws from
this distribution for each uncertain parameter and calculates the net benefits that would result from the “draw.” It
repeats this process many times (e.g., 10,000), each time generating a net benefit estimate. The result is a
distribution of 10,000 net benefits estimates, which can then be described probabilistically.123 Suedel, B. C., Kim, J., Clarke, D. G., & Linkov, I. (2008). A risk-informed decision framework for setting
environmental windows for dredging projects. Science of The Total Environment, (403)1-3, 1-11.124 Ibid, Davis 2008125 Clemen, R. T. (1997). Making Hard Decisions: An Introduction to Decision Analysis. South-Western College
Pub.

49
Application of Uncertainty in the UMRCP
Because the UMRCP analysis was done only at the reconnaissance level, the Corps did notconduct an uncertainty analysis.

50
OUTPUT PRICE EFFECTS
Output Price Effects in the Current P&G
An integral part of conducting a complete BCA for any project is to consider the broad effectsthat will change accrued benefits and costs when a project is implemented. With large projectsthat result in large variation in the output of products (i.e., agricultural outputs affected by floodcontrol measures, or hydroelectric power outputs from a dam project), it is possible that pricesfor these outputs can rise or fall depending on the project, and potentially have significant effectsin calculating both regional and national net benefits. This change in price is referred to as anoutput price effect.
Methods of accounting for prices, and specifically for crop prices, are discussed explicitly in theP&G. Net benefits are calculated by anticipating the change in output volume of a good underproposed project alternatives, and then multiplying this quantity by a set price of the good. Inthe case of agricultural goods, the price is determined by the Department of Agriculture.126
However, there is no method in the P&G to account for changes in price due to project effects.
Existing Criticisms and Options for Addressing Output Price Effects in the
Updated P&G
Critics argue that analysis according to the P&G ignores output price effects on calculatedbenefits of a project. The omission ignores the potential that increases or decreases in outputs
126 P&G, 1983, 2.3.3b
Summary
Under the current P&G, prices of goods or services that are affected by a project areto be valued at current market prices. However, it is possible that goods and servicesprices can be affected by the project itself (called Output Price Effects), changing theactual benefits and costs.
Criticisms of the P&G methods for incorporating Output Price Effects:• P&G do not require analysis that accounts for potential changes in output
pricing due to the implementation of a project.
Options for addressing these criticisms in P&G revisions include:• Include output pricing effects in NED calculations of net benefits.• Include demand analysis of affected goods to predict price changes for a
projected change in quantity of the good in question.

51
from the project can have significant effects on the market value of these outputs (i.e., downwardpressure or upward on prices, respectively)127.
Proponents of this view argue that in the case where a project creates a large increase of a goodinto a market (i.e., a flood control program that allows a formerly scarce agricultural good to beproduced in great quantity), original benefit calculations that rely on current prices mayovervalue the benefits of the project. Similarly, rising prices are suggested as a possibility whena previously productive good is reduced by a project (i.e., if a quantity of goods from a croplandthat depends on floodwaters for irrigation and fertilization is severely reduced).
In both cases, a localized change in goods may have broader national effects, like in the case ofsubsidized goods, or goods and services that are transported out of the project region. For thisreason, it can be challenging to determine exactly where benefits accrue.
The suggestions presented by proponents of taking into account output price effects are asfollows:128
• Include output pricing effects in NED calculations of net benefits.• Include demand analysis of affected goods to predict price changes for a projected
change in quantity of the good in question.
Beyond maintaining the current guidance, no alternative perspectives to account for output priceeffects have been suggested from the review of existing criticisms.
Application of Output Price Effects in the UMRCP
Within the UMRCP, the Corps did not consider output price effects in calculating benefits andcosts. At the least, output price effect could have impacted the final results of a BCA:agricultural output changes as a result of reduced incidence of flood. Since the proposed projectarea within the Mississippi system largely supports agricultural output in the nation, projectalternatives may have a significant effect on output prices.
127 Hyde, 1994, p. 50128 Hyde, 1994, p. 50

52
PART III: FLOODPLAIN RISK: RESIDUAL RISK,
NONSTRUCTURAL MEASURES, AND LEVEE
DEVELOPMENT EFFECTS
“Let no one believe that because you are behind a levee, you are safe”
-- Brig. Gen. Gerald Galloway, February 2005
Introduction
This section focuses on three related issues central to the analysis of floodplain managementprojects: 1) risk and residual risk, 2) nonstructural alternatives, and 3) levee developmenteffects.
The first section begins by defining and describing risk and residual risk in the P&G. Thennonstructural alternatives are explained. And finally, the third section discusses leveedevelopment effects along with existing literature on levee development and nonstructuralapproaches. Within each section, as in Part II, existing criticisms are highlighted and options areidentified. The final sub section in each section reviews how the issue is addressed in theUMRCP case study.

53
RISK AND RESIDUAL RISK
Defining Risk and Residual Risk in Floodplain Management
The P&G define risk as “the potential outcomes [that] can be described in reasonably well-known probability distribution.”129 Once measures have been adopted to reduce risk of flooddamage, the risk that flood damage will still occur is termed “residual risk.”130
In the context of BCA, benefits and costs may be considered functions of the probability offlooding and the value of the area damaged by a flood. No Corps project removes all possibilityof floods and associated flood damage. Given historical meteorological data and existing floodprotection structures on a river, hydrologists have made estimates of probabilities of floods of agiven magnitude. However, predictions of future events are subject to assumptions made whenestimating flooding event probability distributions.
Additionally, even after hydrologists forecast floods with underlying probability distributions,presenting probabilities to the public and policy-makers in a clear and understandable format is acontinuing challenge. To translate the concept of flood likelihoods to the general public, floodrisks are typically portrayed as an “X-year flood”. For example, if flood levees were 15 feet andfloods were expected to exceed 15 feet with a probability of 0.01 for each year, it would be
129 P&G, 1983 Supplement I.S1130 http://www.asce.org/files/pdf/erp.pdf (accessed 8-02-09)
Summary
Risk is assessed as a potential outcome that is described by reasonably well-knownprobability. Residual risk is the risk that remains after preventative measures have beentaken.
Criticisms of the P&G methods for incorporating risk include:• Residual risk management is not discussed extensively. This may be
especially important in light of the expected hydrological impacts of climatechange, where historical meteorological data may no longer be an accuratepredictor of future conditions.
Options for addressing these criticisms in P&G revisions include:• Improve methods of identifying, estimating, and combining risk and
uncertainty information.• Conduct ex post studies of projects to evaluate accuracy and reliability of
risk models.• Consider uncertainties in flood damage and overall project performance as
residual risk.• Accessibly communicate risk analysis findings to make them part of the
deliberative process. • Adopt Residual Risk Practices from other agencies or programs.
54
termed a “100-year flood.” The number of years is simply one divided by the probability of thatlevel of flood.
X-Year Flood Models: The term is simply one divided by the probability.
If a given level of flooding is modeled to have a probability of 0.01:1/0.01 = 100 or a“100-year flood”
If the probability were .002 then the flood would be:1/0.002= 500 or a “500-year flood”
Although this approach seems intuitive, it is often misinterpreted. For example, more than one100-year flood may occur in 100 years. This is because the probability of seeing a “100-year”flood in one year is independent of whether one occurred in another. Additionally, the 100-yearflood refers to one location; it is possible that a 100-year flood could occur each year in differentlocations.
In anticipation of flooding events, the Corps has employed structural measures to manage floodsthat include dams, reservoirs, levees, walls, diversion channels, pumping, and land treatment. Byeither storing or diverting the flow of flood waters, the Corps regulates the magnitude anddirection of floodwaters.131 Corps structures are built with a specific design level in mind; forexample, a “100-year” levee is designed to withstand a 100-year flood without failing. A leveebuilt to withstand a flood anticipated to occur with a probability of 0.01 is termed a “100-year”levee. Many landowners incorrectly interpret this to mean that a flood will occur once every 100years. In fact a 100-year levee means that there is a 1% chance each year that a flood of themagnitude identified will occur.
Despite building levees to 100- or even 500-year standards there are numerous ways in whichlevees may fail, including overtopping, becoming saturated and collapsing, eroding, andundergoing structural failures.132 After a levee or structure is built, the risk of the structurefailing for any of the above reasons is termed residual risk. Given an inability to fully predict thefuture, residual risk can never be completely eliminated; it can only be managed (Figure 6).133
131 National Research Council, Committee on Risk-Based Analysis for Flood Damage Reduction, Water Science and
Technology Board, Commission on Geosciences, Environment and Resources. (2000). Risk Analysis and
Uncertainty in Flood Damage Reduction Studies. Washington D.C.: National Academy Press. 132Steinman, F. & Banovec, P. (2008). Flood Hazard, Flood Damage Potential. Residual Risk. A presentation for
Drava River Vision, Maribor. University of Ljublana, Faculty of Civil and Geodetic Engineering, and Chair of FluidMechanics.133 More details of levee limitations are discussed in the CRS Report R40201, Federal Flood Policy Challenges:
Lessons from the 2008 Midwest Flood, by Nicole Carter.

55
Figure 6. The existence of flooding risk even after protection by flood mitigation structures134
Global climate change can also compromise the ability to predict future events based onhistorical data.135 Therefore, an additional challenge in incorporating risk is accounting for theimpact of global climate change into forecasts of future hydrological events. Patterns ofincreased flooding, as well as continued land-use changes, are now changing the probablemaximum flood levels. For example, severe Mississippi floods have become more frequent sincethe 20th century. As of 1884, there have been 17, 100-year floods in St. Louis, and 16 of themhave taken place in the 20th Century. St. Louis has experienced 14, 100-year floods in the past66 years, 10 of which have occurred in the past 50 years.136Therefore, residual risk combinedwith nonstructural alternatives and development behind levees are key considerations whenevaluating water management plans in the midst of changing conditions and future uncertainty.
Risk and Residual Risk in the Current P&G
Calculating risk presents both a theoretical and empirical challenge. Planners need to ask: 1)what risks to include in planning, and 2) how to include those risks. The P&G addresses thesetwo questions in both theoretical (Principles) and empirical (Guidelines) settings.
Section 10 of the current Principles states:
Planners shall identify areas of risk and uncertainty in their analysis and describe themclearly, so that decisions can be made with knowledge of the degree of reliability of theestimated benefits and costs and of the effectiveness of alternative plans.137
134 Figure from Corps at http://www.asce.org/files/pdf/erp.pdf135 Milly, P. C. D., Betancourt, J., Falkenmark, M., Hirsch, R.M., Kundzewicz, Z.W., Lettenmaier, D.P., & Stouffer,
R.J. (2008). Climate Change. Stationarity Is Dead: Whither Water Management? Science 319, 573. [DOI:
10.1126/science.1151915]136 McMaster, S. W. (April 1996). The Influence of Flood Protection Structures on the Level of Development in
Midwestern Floodplains. Masters Thesis. Southern Illinois University.137 P&G, 1983, p. v.

56
The Principles direct analysts to identify changes in the risks of damages both before and after aproject. The change in risk is weighted against either the cost of the project or the benefits of theproject, so policy-makers may have the most realistic estimate of the change in damages shouldan adverse event occur.
Risk is treated both generally and in specific cases in the Guidelines. Chapter 1 Section IV givesan outline of how to include risk considerations in planning, Supplemental I treats risk morespecifically. Finally, specific guidelines are given for how to evaluate risk when calculatingNED benefits.
Within Chapter 1, Section IV the Guidelines state that the planner’s primary role is to identifyareas of risk and describe them. Situations of risk are defined as occurring within a reasonable,well-defined probability distribution. The role of the planner is to identify ways to reduce riskand describe the costs and benefits of reducing risk.138
Supplement I of the Guidelines acknowledges that risk will always play some role in waterresource-related projects, and states that the planner should identify sources and ranges of risks.Types of risk identified include natural, social, and economic unpredictability. The Guidelines
state that the assessment of risk in project evaluation should be reported and displayed in amanner that makes clear to the decision-maker the types and degrees of risk and uncertaintybelieved to characterize the benefits and costs of the alternative plans considered.139
Finally, the P&G offer specific guidance when calculating the NED account in Chapter 2,Section III. The P&G recognize that there are inherent problems in evaluating damagereduction benefits.140 The challenge is to measure the change in the probability of damagehappening before and after a project has been completed. For this reason, the impact of residualrisk is housed within an evaluation of two levels of risk: with and without the proposed project.
Not every section of NED treats risk explicitly, but it does give some examples of how risk maybe incorporated into estimating costs and benefits. The P&G state that when calculating theNED benefits of agriculture, the NED benefit evaluation procedures should take into account“residual damages” for agricultural benefits from the water resources plan. For these purposesresidual damages are defined as “ … damages that would still occur with implementation of theplan.”141 For evaluating risk in the “without” plan, calculating risk will depend on what projectshave been completed by the local authority that has jurisdiction over urban flood damageprojects. If residual hazard exists after implementing local risk reducing regulations, those localregulations may still be certified by the Flood Insurance Agency, under the Federal EmergencyManagement Agency (FEMA).142
138 P&G, 1983, Ch. 1.4.13139 P&G 1.Supplement I.S2140 P&G Section 2.3.8141 P&G Section 2.3.8 (d)142 P&G Section 2.4.3 (2) ( ii)
57
The P&G identify several methods for including residual risk in the “with” and “without”options:143
1) Damage Reduction Benefits2) Change in Land Constraint3) Benefit Attribution of Drainage and Flood Damage Reduction4) Changes in Land Value
To evaluate the changes in the preceding four categories of benefits, the P&G suggest foursources of data: a) interviews with farmers and area residents, b) physical specialists such asagronomists and soil scientists, c) universities and federal agencies, and d) land appraisers.
Existing Criticisms and Options for Addressing Residual Risk in the Updated
P&G
In critiques of the P&G, five categories emerged that relate to how risks are addressed and howthey could be more fully addressed in the future.
1. Improve methods of identifying, estimating, and combining risk and uncertainty information
The NRC recommended that the Corps should adopt probabilistic performance measures ofengineering risk, which more accurately estimates uncertainties associated with each componentof the project.144 While improving risk-based analysis will increase project costs, in terms ofretraining and reeducating existing personnel, these up-front training costs may be mitigated bybetter performing projects in the long-term. In addition, more accurate projections of projectperformance may help secure financial support from potential beneficiaries or other cost-sharingpartners.145
2. Conduct ex post studies of projects to evaluate accuracy and reliability of risk models
The NRC recommended that the Corps perform empirical, ex post studies of a number ofprojects to evaluate accuracy and reliability of risk models. Probabilities of failure for floodmitigation projects could be compared against actual frequencies of structural and nonstructuralfailures. These studies will be appropriate for determining shortfalls in the risk analysis andreliability in the engineering models.146
3. Consider uncertainties in flood damage and overall project performance as residual risk.
Darryl Davis from the USACE Institute for Water Resources notes that the Corps should analyzethe “consequence of the exceedence of project capacity to public safety, lifeline security, and
143 P&G Section 2.4.3 (a)144 National Research Council (NRC). (2000). Risk Analysis and Uncertainty in Flood Damage Reduction Studies.
National Academy Press. p.162145 Moser, D.A. (2001). The Use of Risk Analysis by the U.S. Army Corps of Engineers. U.S. Army Corps ofEngineers Institute for Water Resources146 National Research Council (NRC). (2000) Risk Analysis and Uncertainty in Flood Damage Reduction Studies.
National Academy Press. p.163

58
local and regional economic impacts.”147 If possible, these consequences need to be quantifiedand included in the NED account during the planning stage of the project.148 This would addressnaturally-occurring uncertainty, as well as knowledge uncertainty, which arise from a limitedunderstanding of those systems. In the language of levee certification, the focus should beplaced on "annual exceedence probability," the likelihood that an area will be affected by anyflood, rather than whether or not it passes the 100-year flood certification.
4. Accessibly communicate risk analysis findings to make them part of the deliberative process.
The goal of the Corps’ risk analysis is to inform the public and decision-makers. Whileprobabilistic distributions are inherently more complicated and are more difficult to convey to anon-technical audience, the Corps should try to present this information to its constituents andpolicy-makers in an accessible way, through the use of intelligible terminology and visualaids.149 The Corps should present analysis in a transparent manner and use standardized prose toavoid confusion. In general, more practical guidance as to how risk analysis should be used toinform policy would help decision-makers use this information more effectively 150
Furthermore, uncertainties in flood frequency estimations need to be conveyed, including moreconsistent terminology when discussing natural variability, uncertainty, risk, and systemreliability.151
5. Adopt Residual Risk Practices from other agencies or programs.
Although the current P&G do not incorporate residual risk, the examples below may be feasibleoptions to enhance the risk assessment in P&G.
Residual Risk at the Environmental Protection Agency (EPA)
The Clean Air Act mandated the EPA to prepare reports on their residual risk assessmentmethods. In their “Residual Risk: Report to Congress,” the EPA explains how it evaluates theremaining risk after the implementation of Maximum Achievable Control Technology (MACT)on emission sources of hazardous air pollutants. The EPA defines the standards beyond MACTas “an ample margin of safety to protect public health” and to “prevent, considering costs,energy, safety, and other relevant factors, an adverse environmental effect” as required by theact.152 Given directives by the act, the EPA’s residual risk assessment provides information toformulate standards for the identified emission sources. In this way, their decision-making
147 Davis, D.W., Faber, B.A. and Stedinger, J.R. USACE Experience in Implementing Risk Analysis for Flood
Damage Reduction Projects. (2008). Journal of Contemporary Water Research & Education, 140, 6.148 National Research Council (NRC). (2000). Risk Analysis and Uncertainty in Flood Damage Reduction Studies.
National Academy Press.149 David A. Moser (2001). The Use of Risk Analysis by the U.S. Army Corps of Engineers. U.S. Army Corps of
Engineers Institute for Water Resources.150 Davis, D.W., Faber, B.A. & Stedinger, J.R. (2008). USACE Experience in Implementing Risk Analysis for Flood
Damage Reduction Projects. Journal of Contemporary Water Research & Education, 140, 3-14.; National Research
Council (NRC). (2000). Risk Analysis and Uncertainty in Flood Damage Reduction Studies. National AcademyPress.151 Ibid, Davis et al. 2008152 EPA, 1999, p.ES-8

59
process ensures that appropriate standards for the public and environmental health are consideredin the decision-making.
The EPA residual risk assessment is a detailed, multi-step process, which consists of six steps(See Appendix D of this report for the description of each step). The EPA’s analysis measuresthe human health risk for each case of exposure and emission of hazardous air pollutants, whichdiffers from the P&G’s approach. If the level of risk involved is acceptable, the EPA stopsassessing the residual risk in the fourth step; otherwise, the process continues with the evaluationof management options to reduce the associated residual risk. Factors such as residual risks,costs, economic impacts, feasibility, energy, and safety are all considered in weighting ofmanagement alternatives, and the residual risk assessment is completed after analyzing theoptions’ impacts. With the analysis provided by the residual risk assessment, the EPA proceedswith decision-making. The residual risk assessments inform the final decision that identifies thebest management option to reduce hazardous air pollutants (HAPs) emissions.153
Residual Risk in Hurricane/Storm Protection
The Hurricane and Storm Damage Risk Reduction System (HSDRRS),which will be upgradedwith a 100-year system by the Corps,154 decreases but does not eliminate risk entirely. OnceHSDRRS structures are built, their impact on storm damage reduction stays static. Factors suchas sea level rise, erosion, changing weather patterns, land use changes, and/or performance ofstorm or flood protection contribute to the (changing) residual risk. To reduce the remaining riskafter taking all protection measures, the New Orleans team suggests the following strategies:155
• Heeding evacuation orders• Restoring wetlands and barrier islands• Raising buildings and making them flood-proof• Relocating buildings to higher ground• Purchasing insurance
As a response to Hurricane Katrina, Congress mandated the Corps to prepare a comprehensiveplan for South Louisiana. The Corps were required to consider hurricane protection, floodcontrol, and coastal restoration. The end product, Louisiana Coastal Protection and Restoration(LACPR), creates a decision framework to produce risk-informed decisions. The Corpsrecognize that storm and flood risk fluctuates over time because of changes in project planningconditions such as weather, land-use patterns or performance of the flood or storm protectionprojects. In order to inform decision-makers of possible future conditions, the Corps uses RiskInformed Decision Frameworks to guide the decision-making process.
153 United States Environmental Protection Agency, Office of Air Quality. (March 1999). Residual Risk: Report to
Congress. Retrieved from http://www.epa.gov/ttn/oarpg/t3/reports/risk_rep.pdf154 US Army Corps of Engineers Headquarters (September 23, 2008). U.S. Army, State of Louisiana Sign Project
Partnership Agreement. Retrieved from http://www.usace.army.mil/CEPA/News/Pages/LaAgree.aspx155 US Army Corps of Engineers, Team New Orleans. (Last updated 02/26/2009). Understanding Risk. Retrieved
from http://www.mvn.usace.army.mil/hps2/hps_riskgen.asp

60
Application of Residual Risk in the UMRCP
In the UMRCP, risk analysis was discussed in the context of the Risk Informed DecisionFramework (RIDF), a system developed by the Corps in which traditional risk analysis iscombined with tools from the field of multi-criteria decision analysis (MCDA), and used toevaluate structural and nonstructural alternative plans for the Upper Mississippi River basin. Thefoundation of RIDF is outlined in Appendix I of the UMRCP, and is composed of the followingsteps:
1) Define the boundaries of the analysis2) Develop performance metrics and associated uncertainty3) Formulate alternative plans4) Evaluate alternative plans5) Eliminate objective-dominated plans6) Select recommended plan
Step 2 is primarily where risk analysis is conducted as it applies to flood protection. Inconstructing metrics to begin to evaluate the benefits and costs associated with any alternativeplan, the Corps suggests, “along with indicating the basic source of metric estimates, it isnecessary to explicitly state the important underlying assumptions and indicate which are highlyuncertain, moderately uncertain, or highly certain.”156 Within the UMRCP RIDF analysis, thefollowing metrics were defined according to their associated P&G accounts. The NED usesempirical data and models to assign dollar values to metrics for the NED, which are constructioncosts, annual net benefits, and the benefit-cost ratio. RED uses the Regional Economic ModelInc. (REMI) to assign dollar values to measure the construction costs. The environmental qualityaccount uses empirical data and expert opinion to estimate the acreage for mitigation, secondarydevelopment, and ecological restoration opportunities.157
However, beyond reporting point-estimate values for these metrics within the RIDF Appendix I,no assumptions or models used to estimate these metrics were reported in the RIDF analysis.Likewise, no analysis of uncertainty about metric accuracy, including estimate ranges, variance,sensitivity analysis, or other methods of quantifying uncertainty and associated risk for floodprotection were reported in the plan.
Once metrics have been determined by model estimation and risk analysis, the UMRCP usestools from MCDA in steps 4) through 6) to determine weights for the importance of each metric,convert weights to a comparable scoring system, rank alternatives using these scores, and finallychoose the highest scoring plan158. Historically the Corps has focused on selecting the plan thatmaximizes the national economic development (NED) benefits. Counter to this tradition,MCDA seeks to use “a comprehensive decision analytic framework that considers a broad arrayof objectives and criteria/metrics, including those associated with ecosystem restoration.”159
156 Appendix I: Risk-Informed Decision Framework for the Upper Mississippi River Comprehensive Plan, p. 4157 Appendix I: Risk-Informed Decision Framework for the Upper Mississippi River Comprehensive Plan, p. 4158 In addition, RIDF performs a sensitivity analysis on these weights to determine how changes in weightingpreference between metrics and their associated accounts by the public and decision-makers might affect each plan’s
overall score.159 Ibid. p. 7

61
NONSTRUCTURAL ALTERNATIVES
Nonstructural Alternatives in the Current P&G
In addition to structural measures, the P&G discuss the possibility of using nonstructuralmeasures to manage residual risk. Nonstructural measures are defined in the P&G as amodification in public policy, an alteration in management practice, a regulatory change, or amodification in pricing policy that provides a complete or partial alternative for addressing waterresources problems and opportunities. Nonstructural measures can include thefollowing:160,161,162
1. Watershed Management. The idea of “catching the water where it falls” calls formodifying the formation of floodwater by managing land-use and soil conservationpolicies to minimize surface runoff, erosion, and sediment transport.
160 Andjelkovic, I. (2001). Guidelines on Non-Structural Measures in Urban Flood Management. UNESCO,
Technical Documents in Hydrology. Paris: International Hydrological Programme.161 Army Corps Circular 1150-1-404, Planning Civil Work Projects Under the Environmental Operating Principles.
May 2003.162 Green, C., Parker, D., & Tunstall, S. (2000). Assessment of Flood Control and Management Options.
Vlaeberg, Cape Town, South Africa: Secretariat of the World Commission on Dams.
Summary
Nonstructural alternatives are changes that do not require physical alteration offloodwater flow or direction. These could include modifications in public policy,alterations in management practices, regulatory changes, or modifications in pricingpolicy.
Criticisms of the P&G methods for incorporating risk include:• Nonstructural alternatives are encouraged, but they are not weighted equally
with structural alternatives in the assessment process. This may be becausenonstructural alternatives do not meet all four criteria required by the P&Gfor assessment: completeness, effectiveness, efficiency, and acceptability.
• Nonstructural alternatives are also frequently outside the jurisdiction of theCorps, as they primarily involve local and municipal regulations.
Options for addressing these criticisms in P&G revisions include:• A plan that employs nonstructural alternatives should be included in future
planning. This is included in the September 2008 Draft Principles.
62
2. Zoning and Relocation. Local land use policy and zoning guidelines can be used toensure safer development and settlement on the floodplain. Residents that are currentlyin danger can be relocated to safe areas.
3. Flood Forecasting and Warning. By monitoring factors likely to cause a flood andwarning residents of a likely flood, local governments can prepare residents forevacuation measures or reinforcement techniques.
4. Awareness Raising. Communicating with the public about flood risk and what likelydamages will be increases the motivation for individuals to prepare themselves for floodsand reduces the economic impact of a flood.
5. Insurance. Insurance against flood damages can reimburse affected individuals for theeconomic losses they have suffered in the case of a flood. The National Flood InsuranceProgram (NFIP), created by Congress in 1968, requires homeowners with federallybacked mortgages to purchase flood insurance. While this does nothing to reduce the riskof a flood, insurance protection reduces the financial risk of people in floodplains.
6. Natural Flood Reduction Strategies. Preserving wetland areas or restoring wetland areasto their natural state helps to divert water into a catchment area and reduces the volumeand velocity of floodwater going into the original floodplain. This diversion reduces thefrequency, intensity, and severity of floods.
7. Flood Preparedness and Recovery Plans. Developing preparedness and recovery planswith public participation increases the ability of the community to react to a floodproactively. Increased preparedness and knowledge of who needs to do what when, andwhere they need to go, reduces the loss of life and economic damages that result from aflood, and decreases the time required for the community to recover.
These alternatives are termed “nonstructural” because they do not rely upon physical alterationof floodwater flow or direction. In many instances these alternatives are policy driven and maybe less costly. However, an additional challenge to consider when implementing nonstructuralalternatives is policy jurisdiction.
Important jurisdictional differences play a key role in how the federal water agencies approachnonstructural approaches to flood control. Comprehensive flood management plans are locallydriven, usually at the city or county level of government. The Corps generally does not have thepower to impose nonstructural and comprehensive flood management plans on localjurisdictions. Because the authority for different aspects of comprehensive flood managementcan lie in many different jurisdictions, coordination may be a difficult challenge. Where localgovernments have implemented comprehensive flood management plans that includenonstructural alternatives, there is some evidence that they have been effective.
One challenge is that state and local governments may lack incentives to invest in morecomprehensive flood management plans, because federal insurance programs partially covercosts of a flood. Since the Federal Emergency Management Agency (FEMA) mitigatesconsequences of floods that exceed the 100-year level of protection, this decreases themotivation of local governments to incur costs in expensive flood prevention projects.163
163 (33 USC 701n) Galloway Jr., 2005.

63
However, Corps planning guidance — the P&S, the P&G, and the PGN — have encouraged useof nonstructural alternatives. The important difference between the P&S and the P&G is thatcurrent guidance does not specifically require planners to consider a nonstructural alternative.164
Currently the P&G recommends that “non-structural alternatives should be considered as meansfor addressing problems and opportunities” and “shall receive equal consideration in theplanning process to structural measures” regardless of whether the Corps itself could legallyimplement this plan. Nonstructural measures are included in Section VI — Alternative Plans,and nonstructural alternatives can make up the complete alternative plan or can be combinedwith more traditional structural methods.165
The PGN also encourages nonstructural alternatives. According to the PGN, “[t]he first phase inthe plan formulation process is the identification of management measures that could beimplemented, giving equal consideration to structural and non-structural measures.”166 And thefeasibility report should document that “all reasonable alternatives for addressing the identifiedproblems, including non-structural measures and measures beyond the authority of the Corps toimplement, have been systematically formulated and evaluated in accordance with the P&G.”167
The September 2008 Draft Principles state, “[i]n order to facilitate the development of thewidest range of practical alternative plans, the following required alternatives constitute theminimum series of plans necessary.”168 The minimum series will include a NED plan, an EQplan, and a Primarily Nonstructural Plan. The Primarily Nonstructural Plan would be a plan thatprimarily employs nonstructural elements, and as a secondary consideration adds structuralfeatures to address the planning issues. This would return Corps guidance to the requirements ofthe P&S.
Existing Criticisms and Options for Addressing Nonstructural Alternatives in
the Updated P&G
Federal water projects are not a good panacea for bad public policy.
-Griffin169
While the P&G recommend that planners consider nonstructural alternatives, they are notweighted equally with structural alternatives in the assessment process. This is due to a numberof factors. One of the most important is that nonstructural alternatives frequently do not meet allfour criteria required by the P&G for assessment: completeness, effectiveness, efficiency, andacceptability. 170 Depending on how planning objectives are defined in a study, potential
164 Scodari, P. (2005). Survey and Analysis of Criticism of Corps Planning and Links to Planning Guidance, 9.165 P&G Section 1.6.1166 PGN page 2-4167 PGN Appendix G-6168 Draft Principles and Guidelines http://www.usace.army.mil/CECW/Documents/pgr/pg_draft.pdf (accessed 8-02-
09)169 as quoted in Scodari, P. (2005). Survey and Analysis of Criticism of Corps Planning and Links to Planning
Guidance.170 Scodari, page 10.

64
nonstructural measures might be rejected early in the planning process because they fail to meetone or more of the formulation criteria. And while the P&G encourages the consideration ofnonstructural alternatives, unlike the P&S guidance, it does not specifically require a primarilynonstructural plan.
However, others argue that the Corps should make their assessments as if policies advocatingnonstructural alternatives were already in place at local and regional levels. This would maintainthe responsibility for local and regional policy at local and regional levels.171
Nonstructural Alternatives in the UMRCP
In the UMRCP main report, one of the 13 plans presented has a nonstructural component andtwo of the plans could be described as primarily nonstructural. Plan H combined structural andnonstructural components with “cost-effective buyouts” to purchase certain floodplain propertieswhere the benefits of structural protection (100-year levees) are less than the value of theproperty. Plan I and Plan J were both primarily nonstructural — Plan I would combine buyoutsin the agricultural districts with urban floodplain development restrictions (with the 500-yearfloodplain), and Plan J would purchase land in the 100-year floodplain and (presumably) relocateany existing residents or structures. These nonstructural approaches would also have the benefitof increasing floodplain connectivity.172
In the public comments the Corps gathered while preparing the UMRCP, it is interesting to notethere was strong, repeated support for the idea of nonstructural alternatives. However, when theCorps proposed Plan G, which would have involved raising levees north of St. Louis to the 500-year level together with buy-outs and the use of 10,000 acres south of St. Louis as an overflowarea, there was strong opposition among residents in the county designated for buy-outs, and theCorps abandoned this controversial plan. While Plan G was not a nonstructural plan, as itinvolved a significant structural component, the strong opposition to the creation of a storagearea demonstrates how challenging buy-outs can be. Nonstructural alternatives are a popularconcept, but possibly most attractive when they involve another family’s backyard.
171 Griffin, (1993). The Zilberman Review.
172 UMRCP, p. 72 -74.

65
LEVEE DEVELOPMENT EFFECTS
Existing Criticisms and Options in Accounting for Levee Development Effects
When weighing structural and nonstructural approaches to floodplain management, in addition toresidual risk and nonstructural alternatives, a third consideration is accounting for the type ofdevelopment that occurs in the floodplain once levees are built and the subsequent expectationsby the people moving into the floodplain.173 This “levee development effect” is the increasedincentive to build on a floodplain after a levee is constructed. Perversely, by both increasingdevelopment in the floodplain and reducing the risk of flooding the net result may be the samevalue of property will be damaged as before the levee was built.
The land that is developed can be used for residential, commercial, industrial, and agriculturalpurposes. Development may be limited by nonstructural efforts such as constraints on land-use
173 White, G.F. (1945). Human Adjustment to Floods: A Geographical Approach to the Flood Problems in the
United States. University of Chicago Press.
Summary
Construction of levees alters development patterns and therefore influences benefitsand costs of a levee-constructing alternative in multiple ways. Construction may resultin more development behind levees, but still on the floodplain. With lowered risk offlooding but higher property value on the floodplain the net effect may result in higherproperty damage than expected.
Criticisms of accounting for levee development effects include:• The National Floodplain Insurance Program (NFIP) may discourage
efficiently pricing land in flood prone areas to minimize risk and maximizeflood damage reduction efforts
• Extensive construction of levees may result in all levees offering a lowerlevel of protection, as floodwaters are not diffused into the floodplain butinstead channeled downstream.
• Limited academic studies have been done to determine whether leveesserve as catalysts for economic development.
Options for addressing these criticisms in P&G revisions include:• Include anticipated development behind levees in BCA.• Include impact of proposed new levees on existing levees in BCA.• Include the impact of NFIP incentives to develop on the floodplain when
evaluating proposed Corps levee projects.• Invested more resources in tracking regional effects post-levee
construction.

66
planning, zoning, and including regional growth boundaries. Once a levee has been built, thefloodplain is often perceived as being less flood-prone than it actually is, and residents may relyon the National Flood Insurance Program (NFIP) protection to reimburse them for any floodlosses. Furthermore, if cheaper floodplain land values attract disproportionately poor residents,they may be unable to move themselves and their property away from the flood risk withoutincurring considerable costs.174
Finally, as more development occurs on the floodplain, people moving to the floodplain start todemand greater flood protection to reduce the risk of flood damage. This can lead to the so-called “escalator effect”. In the escalator effect urban development sites behind a floodwalldepend on the water storage in the floodplain. With increasing urban development infloodplains, the demand for protection by flood mitigation structures such as levees increases.This heavy protection narrows the floodway to the point where every flood can result inovertopping. Even the best possible protection may experience flooding beyond its baseflood.175
Academic Studies of Levee Development and Nonstructural Approaches
Limited research has been done to determine whether levees serve as catalysts for economicdevelopment, which is a key factor when calculating benefits for the RED account. In the last 50years, some have assumed that building a levee spurs development in the form of job creation:jobs created by building the levee, construction in the floodplain after the levee has been built,and jobs associated with any industry moving into the floodplain.
While it is possible that levee development may spur economic development, it is also possiblethat levees simply displace jobs that would have been created outside the floodplain.Furthermore, changes of land values in floodplains may not accurately reflect the change inresidual flood risk from structural protection.
With limited studies on this topic, federal agencies have had to rely on single documents such asthe master’s thesis described below, which was used to determine estimates of economicdevelopment behind levees in the UMRCP. The results of one study have had a significantimpact on how the RED account is weighted. In the thesis, McMaster tried to empiricallyestimate the “levee effect” by comparing the amount of money invested in either commercial orresidential construction or renovation before and after a levee was built. To create a controlgroup, McMaster compared the pre- and post-levee values of activity in three cities that built alevee to values in two cities that did not build a levee. The findings were inconclusive.
The McMaster thesis considered the level of activity (in terms of money invested in newconstruction in the floodplains that had little to no pre-existing structures and money invested inrenovation in floodplains that already had pre-existing structures) of five cities. Two cities sawstatistically significant levels of increased activity within the floodplain post-levee construction,while three cities did not.
174 McMaster, S. W. (April 1996). The Influence of Flood Protection Structures on the Level of Development in
Midwestern Floodplains. Masters Thesis. Southern Illinois University175 Parker, D J. (1995). Floodplain development policy in England and Wales. Applied Geography . 15(4), 341-363.
67
Two concerns may hamper the application of McMaster results to the UMRCP:
(1) Displacement of Development
The thesis considered the possibility that constructing a levee might simply displace activitythat would have happened outside of the floodplain, pulling this activity into the floodplain.In terms of tracking the development, the thesis considered the displaced activity a benefit inthe floodplain, but did not consider it a cost outside of the floodplain. The net benefit(activity in the floodplain less activity outside the floodplain) would ultimately be a betterindicator of the levee effect. Consider the case of Davenport, Iowa, which saw higher levelsof activity outside the floodplain. According to McMaster, had a levee been built inDavenport, the level of activity in the floodplain might have increased at the cost of theactivity outside the floodplain, in addition, or some variant of the two.
(2) Causation Correlation Confusion
The McMaster thesis compared two groups: The experimental group that built a levee andthe control group that did not. The report found the two cities that built levees hadsignificant increases in the level of activity within the floodplain. It is possible, but notcertain, the values observed in the McMaster thesis can be attributable to regionaldevelopment, a variable independent of levees. Cities with levees were clustered together, sothat rising general economic development (not attributable to the levees) in the cluster mayhave been a bigger factor.
Chivers and Flores documented the effect a levee can have on property values in their critique ofthe National Flood Insurance Program (NFIP).176 Their article claims that the NFIP failed toefficiently price land in flood prone areas to minimize risk and maximize flood damage reductionefforts.177 They attribute this mainly to the failure of federal regulators and mortgage lenders touniformly enforce flood insurance requirements. They found the complex calculation ofpremiums, the variability of rates, and the consistent lack of premium disclosure to homebuyersuntil purchase prevented the reflection in property prices of the inherent flood risk. Furthermore,they found that cheap land, combined with poor consumer information, created an incentive fordevelopers to develop high-risk floodplain areas and sell property to less informed homebuyers.Chivers and Flores proposed the removal of mandatory NFIP and, instead, suggested homesellers should be required to obtain a flood-rating certificate as a necessary condition for listing aproperty in a flood-prone area.
Holway and Burby found the effect a levee has on the NFIP, and by extension land values, canbe either enhanced or negated by nonstructural alternatives.178 They found the value of the landincreased by $689 per acre after construction of a levee, although the direct experience of
176 Chivers, J and Nicholas Flores. (2002) Market Failure in Information: The National Flood Insurance Program.
Land Economics. 78(4), 515-512.177 Under NFIP, flood insurance premiums were priced based on location and flood risk, where high-risk areas had
higher premiums to discourage development, and lower risk areas had lower premiums to maximize use of the land.178 Holway and Burby use hedonic modeling to determine the difference. Hedonic models use existing variation in
prices and amenities to predict values for a property with a given set of similar amenities, or the value of one
specific amenity (in this case the presence of a levee).

68
individuals affects the valuation: An individual who experienced a recent flood decreased thevalue of the land more than older floods (a decrease of $288 for recent, $182 for older).However, nonstructural measures the local jurisdiction put in place were found to have a muchgreater effect on the value of the land. Holway and Burby further found that when localgovernment ensured that floodplains were zoned for low-density development, the value of theparcel was $268 lower per acre than when they zoned for medium-density development. Thelimited development combined with the lower land value reduces the potential damages that canbe caused by a flood.
Holway and Burby also found that if local governments required buildings to be elevated aboveminimum NFIP elevation, it reduced the value of the land by $74 per acre for each additionalfoot. Finally, they found the enforcement and coordination of floodplain management by localgovernments made a significant difference. In areas where the local government designated asingle individual or department to oversee floodplain development, parcels that resided in thefloodplain were valued at $188 per acre lower than those areas where the responsibility waseither nonexistent or distributed among many agencies.179
Academic studies have not conclusively proven that levees spur economic development.Scholars have documented some post-levee construction effects, but evaluations have not yettied all of the subsequent actions to the levee as a catalyst. Furthermore, the literature has shownthat it is difficult to differentiate which effects are attributable to the levee and which areattributable to the policies of the local governments. Future efforts could benefit considerably ifthe Corps invested more resources in tracking regional effects post-levee construction. Thiscollection of data for analysis is consistent with project management theory that holds evaluationand assessment as the concluding step to any project.
Levee Development in the UMRCP
As discussed above, the Corps contracted with the Tennessee Valley Authority (TVA) tocalculate regional-level benefits, which used a computable general equilibrium model from theREMI firm. Because the model results depended heavily on assumptions about leveedevelopment effects (and multipliers), it is discussed in more detail here.
For the UMRCP, the REMI model used information gathered about different factors to predicthow levee construction would affect five indicators of economic development. The purpose ofthe model is to project the marginal benefits in economic activity that a levee would bring to theregion.
The five indicators used in the REMI model were:180
179 NRC. (1999). New Directions in Water Resources: Planning for the U.S. Army Corps of Engineers. National
Academy Press. Washington, D.C.
180TVA (2004). An Economic Evaluation of Porposed Flood Protection Plans on the Upper Mississippie River and
Illinois Waterway. Prepared for The Rock Island District U.S. Army Corps of Engineers. Available online at
http://www2.mvr.usace.army.mil/UMRCP/Documents/CompPlanRegionalEconomicDevelopmentRpt.pdf.

69
• Construction,
The model projected that levee construction would bring both direct and indirectmonetary benefits to the region. Direct benefits would include the jobs created and themoney invested to purchase the materials and supplies for construction. Indirectly,construction would bring benefits to the region because of the goods and services that theworkers and their families could buy with the money earned through construction jobs.The model does acknowledge that some of the indirect benefits would be enjoyed byfamilies of construction workers living outside the regional boundary of the study.
• Economic development,
The model projected that building a levee reduced the risk of flooding in the flood plainbehind levees. The subsequent impact of levee construction would be 1) reducedoperating costs for businesses with lower flood damage insurance premiums, 2) a greateramount of usable land, and 3) more feasibly upgraded infrastructure.
• Land value enhancement,
The model projected that building a levee and providing greater protection from flooding,increased the value of the land. The model also assumes reduced flood insurancepremiums are positive income flows for landowners.
• Farm income gains, and
The model projected that building a levee and providing greater protection from floodingwould lead to a decrease in crops destroyed by flooding. This was considered a gain tothe farmers who would reap more of the crops they sowed.
• Damages averted.
The model also considered the damages that could be averted as a result of constructing alevee.
Each of five indicators is measured in terms of increased gross regional product (GRP),increased real personal income (RPI), jobs created, and increased efficiency measured in termsof output.181
• The REMI model uses information garnered from large data sets maintained andmanaged by agencies such as the Bureau of Labor Statistics, Bureau of EconomicAnalysis, the Department of Energy, the Census Bureau, and others. REMI uses valuesgenerated from data collected by the different agencies to develop a multi-sectorequilibrium analysis and calculate how the presence of a levee would increase each of thefive indicators.
• The REMI model concluded that the 500-year protection plan would generate the greatestamount of regional benefits based primarily on two of the five input variables:construction and economic development. The model calculated that regional grossproduct would increase by $30.381 billion, total personal income would increase by
181 Ibid. TVA (2004).
70
$25.295 billion, and output would rise by $51.518 billion. The model also concluded that25,690 jobs would be created, but it is unclear whether those jobs were included in themodel as net benefits or net costs. The REMI model concluded that the region wouldbenefit significantly from constructing a levee. The model calculated that the regionwould see 19,023 in average employment each year, $20.427 billion increase in grossregional product, $16.927 billion increase in regional personal income, and $33.952increase in output. The economic development portion of the TVA report dependedprimarily on the work done in the McMaster thesis. The REMI model includedMcMaster conclusions in a linear regression model that considered employment as thedependent variable. The conclusion is that economic development is measured in termsof employment. The equation considered population growth, the presence of a levee, andtime.
As stated above, the REMI model is proprietary. This reality limited the amount of informationavailable about the model and prevents further analysis.

71
APPENDIX
Appendix A: Annotated Bibliography
This annotated bibliography covers existing literature on the use of Benefit-Cost Analysis (BCA)by federal agencies that manage water and water related natural resources. Specifically, theseagencies include the Army Corps of Engineers (Corps), Bureau of Reclamation (Reclamation),Tennessee Valley Authority (TVA), and the Natural Resources Conservation Service (NRCS).The bibliography is organized by topic with four sections.
Section I. Planning DocumentsSection II. Evaluation of Existing Principles and Guidelines for Benefit-Cost AnalysisSection III. Methodology (discussion of BCA or other measurement techniques)Section IV. Scientific and Policy Background
SECTION I. Planning Documents
Water Resources Council. (1983). Economic and Environmental Principles and Guidelines
for Water and Related Land Resources Implementation Studies. Washington, D.C.: U.S.
Government Printing Office.
The Principles and Guidelines (P&G) document outlines a set of rules and steps to be followedin assessing costs and benefits of implementation alternatives for water resource projects. Thedocument aims to provide consistent planning and decision-making for water resource projectsimplemented by the Corps of Engineers, the Bureau of Reclamation, the Tennessee ValleyAuthority, and the Natural Resources Conservation Service (formerly the Soil ConservationService). The objective of the assessed projects is to contribute to national economicdevelopment (NED) by increasing the value of national output, while being consistent withrelevant environmental regulations. Four agencies are required to use the P&G: the Army Corpsof Engineers, Bureau of Reclamation, Tennessee Valley Authority, and the Natural ResourcesConservation Service. The largest part of the document details how to calculate the NEDbenefits for each plan. Benefits are based on: 1) municipal and industry water supply services, 2)agricultural production, 3) urban flood damage reduction, 4) hydropower production, 5) ease oftransportation, 6) recreation, 7) commercial fishing, and 8) use of unemployed or underemployedlabor. Most benefits are measured using either market values or public willingness to pay. Costsinclude installation, operation, management, and replacement. Costs and benefits are discountedto present value, and the project with the greatest net economic benefits is chosen unless there isan overriding reason to select a different plan. The document also briefly outlines methods foranalyzing uncertainty and risk, as well as evaluation of projects in three other areas:environmental quality, regional economic development, and other social effects. However, theseanalyses are not required.
72
U.S. Army Corps of Engineers. (2000). Planning Guidance Notebook. ER 1105-2-100,
April 22, 2000. Available online at http://140.194.76.129/publications/eng-regs/er1105-2-
100/entire.pdf
The PGN shows Corps practitioners how to apply the BCA in the Corps setting. This Corpsdocument provides the overall direction by which Corps projects are formulated, evaluated, andselected for implementation. It contains a description of the Corps planning process, missionsand programs, specific policies applicable to each mission and program, and analyticalrequirements. Its fundamental purpose is to describe the planning process in “straightforward,plain language”182. The added benefit of the PGN is condensing the P&G into key ideas andoutlining how BCA in the Corps should be conducted.
The PGN is divided into four chapters that correspond with four components of the P&G:
Chapter 1 gives an overview of the background of the P&G from beginning to current revisions;the entire 1983 Executive Order from President Regan is included as a founding document. Nextthe PGN outlines the purpose, scope and application of the P&G.
Chapter 2 begins by describing the federal objective of the P&G as “contributing to nationaleconomic development consistent with protecting the Nation’s environment”183. Next each ofthe six steps of BCA mandated by the P&G are reviewed and summarized:
Step 1 — Identifying problems and opportunitiesStep 2 — Inventorying and forecasting conditionsStep 3 — Formulating alternative plansStep 4 — Evaluating alternative plansStep 5 — Comparing alternative plansStep 6 — Selecting a plan
Thirdly, Chapter 2 discusses individual elements of BCA including: System Analysis, With andWithout Project Analysis, BCA and Cost Effectiveness Analysis, Ecosystem Restoration, Riskand Uncertainty, Time Horizons, and Discount Rates, among other topics.
Chapter 3 identifies and details each of the seven mission areas of the Corps: Navigation, FloodDamage Reduction, Ecosystem Restoration, Hurricane and Strom Damage Reduction, WaterSupply, Hydroelectric Power Generation and Recreation. Each mission is reviewed, and types ofmeasures (both structural and nonstructural) are itemized and summarized.
Finally, Chapter 4 details the bureaucratic process by which projects are described in decisiondocuments, technical and policy reviews, and how these documents are promulgated through theCorps. This final chapter identifies types of studies and reports, approval authorities, procedures,review, and authorization.
182 PGN section 1-1183 PGN section 2-2

73
SECTION II: Evaluation of Existing Principles and Guidelines for Cost Benefit Analysis
Cicchetti C.J., Davis, R.K., Hanke, S.H., and R.H. Haveman, et al. (1973). Evaluating
federal water projects: a critique of proposed standards. Science, 181, 723-728
Authors provide a concise set of criticisms of Principles and Standards proposed by the WaterResources Council in 1973. They argue that the standards use faulty estimation procedures thatmisuse economic methods that “encourage inefficient projects and neglect harmfulenvironmental impacts” and are bias toward development. They outline concerns of havingbenefits and costs distributed between four accounts while not providing clear direction on howmeasurements should be made and how accounts should be integrated. Within the discussion,they describe problems in how regional economic development effects are included, and how theenvironmental quality account encourages double counting for benefits but single counting forcosts and thus downplays adverse environmental effects. They also provide cautions on how thethree measures of economic benefits (willingness to pay, change in net income, and least-costalternative) are attributed. The article also briefly addresses issues surrounding discount ratepolicy, pricing and cost-sharing policies, and the role of the public. Throughout, the authors urgereaders of the need to carefully assess these issues, otherwise evaluations using the Principles
and Standards will result in unnecessary large land and water resource development programs.
Fisher, A. C. (1994). Principles and Guidelines: Some Methodological Issues. In The
Zilberman Review, D. Zilberman (Ed.), Review of Principles and Guidelines, 82-93
(Chapter 7).
Anthony Fisher presents a point-by-point critique of the first two chapters of Principles and
Guidelines, suggesting improvements such as better ways to assess environmental quality costswithin the Environment Quality (EQ) account and on the National Economic Development(NED) balance sheet; ideas regarding accounting for benefits and opportunity costs withunemployed labor statistics, and accounting for costs that are changing over time due totechnological advances; and appropriate ways to avoid expensive benefit estimation bymeasuring benefits as the savings in cost over an existing alternative. Fisher suggests that amore straightforward approach to compare the costs of structural measures would be to look atchanges in consumer surplus; however, to evaluate the cost of energy-saving measures, heencourages looking at the real resource costs of the measures and comparing them to the cost ofproducing the energy instead of evaluating change in consumer surplus, which provides theupper bound. Fisher also provides an extensive discussion of issues using contingent valuation,including the hypothetical nature of the process as well as concerns about embedding and thewarm glow effect. Fisher advocates further discussion of these points and pooling insights ofmembers of the panel who have had varying degrees of involvement in contingent valuationresearch.

74
Hyde, W. F. (1994). Principles and Guidelines: A Ten-Year Critique. In The Zilberman
Review, D. Zilberman (Ed.), Review of Principles and Guidelines, 46-65 (Chapter 5).
In this article Hyde addresses five distinct sources of error in Principles and Guidelines (P&G)and suggests methods for limiting these errors. These errors arise from 1) assessment of non-market values, 2) output price affects, 3) interactions between multiple project outputs, 4)disregard of regional impacts, and 5) tacit acceptance of non-standardized data from other naturalresource organizations. His proposed remedies range in nature from specific to entirely general,in some cases relying simply on warning the P&G reader of the existence of the tendencies forsuch error. Hyde’s analysis is broad but could nevertheless prove a valuable first step inaddressing identified weaknesses of the P&G.
Jacobs, J. W. (2002). Broadening U.S. Water Resources Project Planning and Evaluation.
Natural Resources Journal 42(1), 21-31.
This paper discusses the importance of conducting “ex-post” project evaluations in waterresource projects and programs. Jacobs argues that project planning is a dynamic iterativeprocess that should be evaluated to achieve the best results. While Principles and Guidelines
outlines steps the Corps, the Bureau of Reclamation, NRCS and the TVA must follow whendesigning and planning projects, it does not require evaluations upon completion or anytimethereafter. The author argues that ex post evaluations are important to make improvements tonew or current projects. The article also discusses the difficulties surrounding evaluatingenvironmental and ecological projects and makes three recommendations for such evaluations:1) evaluations should be “comprehensive, integrated, long-term, cumulative, and adaptive” whenreported, 2) adaptive management should be used in doing these evaluations (adaptivemanagement emphasizes iteration and evaluation is key to this process) and 3) outside evaluatorsshould conduct these evaluations when appropriate (to overcome any bias that employees mayhave in evaluating their own projects and to alleviate the fear that poor evaluations will beattributed to and used against management). Additionally, conducting ex-post evaluationsallows for project benefits, goals, preferences, or costs to be measured into the future.
Larson, D. M. (1994). Procedures Used to Assess Environmental Benefits in Principles and
Guidelines. In The Zilberman Review, D. Zilberman (Ed.), Review of Principles and
Guidelines, 66-81 (Chapter 6).
This article critiques procedures used for environmental assessment in the Principles and
Guidelines (P&G) used by the Corps. The main critique is that the P&G focuses too heavily onthe monetary impacts of a project, which tends to over-emphasize the quantity of benefits andcosts and neglects to measure how the project changes the quality or value of the environment.Of the four accounts used to assess the proposed project, only the Nation EconomicDevelopment (NED) account is required. The article argues the three other accounts,Environmental Quality, Regional Economic Development, and Other Social Effects, should beconsidered more when assessing a project. The other accounts often show effects that cannot bemonetized but are still important, including environmental impacts on the local ecology, culture,

75
and community. Larson recognizes that it is not easy to compare different “units” ofmeasurement from the various accounts, but nevertheless argues that more effort should be madefor comparisons to get a truer sense of environmental impacts of a project. A second issueaddressed in the article regards defining the role of the P&G when considering new strategiesthat may correct current inefficiencies. If the P&G is to place more emphasis on these“nonstructural measures,” such as changes in policies, management, or pricing, then they shouldbe covered more extensively in the P&G.
Mazzotta, M. J. & Opaluch, J. J. (1994). Methodological Problems with Principles and
Guidelines. In The Zilberman Review, D. Zilberman (Ed.), Review of Principles and
Guidelines, 23-45 (Chapter 4).
This article addresses general and specific shortcomings of P&G. General comments focus onthe absence of economic concepts such as nonuse values and random utility models, theimportance of using these guidelines for contexts other than water quality improving projects,and the need to make P&G more reader-friendly. More specifically, the authors directly addressthe use of particular concepts and shortcomings on a page-by-page basis. They explain methodsin contingent valuation surveys for asking respondents their willingness to pay for access to anenvironmental site, and methods for monetizing specific environmental services. Furthermore,they discuss that expected benefits and costs should be included in the benefit-cost analysis ofenvironmental quality assessments rather than in uncertain total benefits, because even a smalllikelihood of occurrence may result in loss of lives or property.
National Research Council (NRC). (2004). Analytical Methods and Approaches for Water
Resources Project Planning. Washington, D.C.: National Academy Press.
The Flood Control Act of 1936 mandated the use of formal benefit-cost analysis in its planningstudies, followed by two Presidential Executive Orders (12,191 [1981] & 12,866 [1993]), whichrequire benefit-cost analysis (BCA) be used for proposals that affect human health and theenvironment. The aim of BCA is to “(1) separate acceptable from unacceptable projects and (2)prioritize project alternatives”184. The NRC report evaluates BCA within the Corps as specifiedby the planning guidance document Principles and Guidelines (1983), discusses willingness topay as a measure of human preference, and outlines other difficulties the Corps is faced withwhen trying to value non-economic measures. Two other techniques that economists often useare stated preferences and revealed preferences when trying to value non-market goods. Statedpreferences are those that people explicitly express, usually through a survey, while revealedpreferences are those that economists derive from market behavior (such as paying more for ahouse near a school versus a similar house not near a school). Other economic issues that thereport raises are efficiency, valuation techniques, and discounting, which are all relevant whenconducting a comprehensive benefit-cost analysis. Finally, the report recommends that BCA,like any analytic tool, not be the lone factor for determining whether or not to execute a project.
184 NRC 2004 p. 39

76
Scodari, P. (CEIWR-GI). (2005). Survey and Analysis of Criticisms of Corps Planning and
Links to Planning Guidance. Available online at
http://www.usace.army.mil/CECW/Documents/pgr/feb2005_iwr_sac.pdf
Paul Scodari surveyed criticisms that relate directly to issues addressed in the Principles andGuidelines (P&G) and the Planning Guidance Notebook (PGN). The survey addressed eightdifferent issue areas and developed the following criticisms: (1) despite P&G stating that the goalof any project should be to further national economic development (NED) in a way that isconsistent with protecting the nation’s environment, NED is still prioritized over environmentalquality; (2) agencies do not adequately consider nonstructural solutions to planning problems; (3)the area affected by any given project is defined too narrowly and does not allow planners toconsider indirect or region-wide effects of alternative plans; (4) the P&G allow for planners toignore effects that are not considered primary to national economic development; (5) nationalecosystem restoration (NER) has recently been elevated to be as important as NED, however,P&G do not define the mission of NER as clearly as they do NED, which makes comparing thetwo values and considering trade-offs between them difficult; (6) the process for evaluating NEDis inconsistent and does not adequately consider the effects of one project on others; (7) planningguidance does not specifically instruct planners to use probabilistic methods in assessing risk anduncertainty; and (8) planners are instructed to use a discount rate that may be incommensuratewith the project they are planning.
Stakhiv, E., Cole, R., Scodari, P. & Martin, L. (2003). Improving environmental benefits
analysis in ecosystem restoration planning. IWR Report 03-PS-3. IWR: Alexandria VA:
Institute for Water Resources.
The Corps now considers national ecosystem restoration (NER) a priority when planning civilworks projects. Traditionally, the Corps pursued national economic development (NED) as theprimary goal for any project. However, while the development outputs are required to beexpressed in monetary units, the restoration outputs are required to be expressed in non-monetaryunits. Furthermore, the methods for measuring the restoration outputs are not well developed,and there is no universal unit for measuring ecosystem restoration. This scenario makescomparing and contrasting the outputs particularly difficult. The authors argue that the metricsthat should be used to best determine the success of an NER project need to relate to geneticdiversity in the ecosystem and the survival of genetically unique species. Furthermore, theauthors argue that benefit-cost analysis for NER projects should be forecasted using multipletime horizons to best account for the incremental effects of a project, and new technology needsto be used to better approximate the values of benefits of such projects.

77
SECTION III. Methodology (discussion of BCA or other measurement techniques)
Apogee Research, Inc. (1996). Monetary Measurement of Environmental Goods and
Services: Framework and Summary of Techniques for Corps Planners. IWR Report 96-R-
24. Alexandria, VA: Institute for Water Resources.
This article provides planners with tools for establishing the monetary benefits of environmentalprograms and indicates when such analysis is appropriate. The article presents three approachesto evaluating the economic benefit of goods and services that directly impact individuals. Thereare three broad approaches to assess society’s willingness to pay of society: 1) The MarketApproach (Factor Income/Productivity Technique Measures), which uses data for ecosystemgoods that are traded in markets or data for marketed goods that rely on non-market ecosystemsfor inputs; 2) The Revealed Preference Approach (Hedonic Pricing and Travel Cost Method),which uses data on market goods that are used in conjunction with or somehow related to non-market goods; 3) The Expressed Preference Approach (Contingent Valuation and BenefitsTransfer Measures), derives value by getting people to state their preferences for select goods.This article also explains how Least Cost Alternative (LCA) and Property Damage Alternative(PDA) methods can be used to determine the value of projects that indirectly benefit individuals,such as flood control or sediment retention projects. Information on the required level of data,technical expertise, expected costs, timelines, and major assumptions required are included foreach method.
Arrow, K.J., Cropper, M.L., Eads, G.C., Hahn, R.W., Lave, L.B., Noll, R.G., Portney, P.R.,
Russel, M. Schmalensee, R. Smith, V.K., and R.N. Stavins. (1996). Is there a role for benefit
cost analysis in environmental, health, and safety regulation?, Science, 272, 221-222.
In this short policy forum article, the authors advocate for using benefit-cost analysis (BCA) foragency and legislative policy decisions based on protecting and improving the naturalenvironment, health, and safety. The authors recognize that BCA is not a panacea for all publicpolicy problems; however, they write that it provides a very useful framework for consideringcomplex problems that can lead to making more informed decisions. While admitting that BCAshould not be considered as either necessary or sufficient for crafting good public policy, theauthors provide eight principles for BCA’s appropriate use.
Loomis, J. B. (1997). Use of non-market valuation methods in water resources
management assessments. Water Resources Update, 109, 5-9.
This article is primarily intended for water resource researchers and educators. Loomis explainsnon-market valuation attempts to estimate the economic value in dollar terms of benefits societyreceives from use of water resources that are not allocated through markets. He discusses twocommonly-used methods for estimating recreation and existence values, briefly addressing thetravel cost method (TCM), and focusing on the contingent valuation method (CVM).Economists typically assess the value of recreation based on TCM, which relies on actual visitor

78
travel behavior to determine a demand curve and estimate participants’ willingness to pay (WTP)for water-based recreation at a particular site. To assess the value of the existence of a waterresource (i.e., for individuals who may never fish or boat on a river, but still receive somebenefits from just knowing that free flowing rivers exist), economists often use CVM byconducting a survey wherein respondents are asked about their WTP for the resource underdifferent circumstances. For estimating non-market benefits of recreation, CVM results inestimates of WTP that are slightly less than estimates based on TCM. The validity of CVM-derived estimates of WTP for existence values tend to be higher (sometimes many times higher)than actual contributions or payments, according to economic experiments to date. Afterillustrating these principles by discussing several cases (e.g., the process of estimating thevaluation of improved salmon habitat on the Elwha River), Loomis concludes qualitatively that,while CVM-derived WTP estimates from surveys of the general public may indicate the intensityof their preferences, the exact dollar values may not be as heavily relied upon as they are inrecreation analyses. However, in many instances, the public good nature of the existence valuesoften dwarf the recreation use values and the opportunity costs of protecting water resources.For example, individuals who may never fish or boat on the Elwha River may still derivesubstantial benefit from knowing of the existence of a free flowing river, on which naturalsalmon migrations may continue.
National Research Council (NRC). (2005). Valuing Ecosystem Services: Toward Better
Environmental Decision-Making. Washington, D.C.: National Academy Press.
This report provides an overview and comparison of different valuation methods for assessingboth use and existence values from aquatic ecosystems. Additionally the report identifies thefactors, controllable and otherwise, which are likely to influence the outcome of a benefit-costanalysis. These factors include the valuation of relevant ecosystem goods, geographical scopeand the spectrum of involved stakeholders, chosen temporal scale, whether willingness to acceptor willingness to pay is used, discretion in methods of discounting future costs and benefits, andthe degree to which uncertainty is prevalent in individual parameters and overall analysis. Themost significant factor, and perhaps most subtle, is the framing and context of the analysis itself,as there is no obvious and universal framework with which to analyze every situation. Thereport suggests that high levels of uncertainty present in living ecosystems requires a certainlevel of flexibility in policies such as avoiding the intensive investment of fixed capital.
Freeman, A. M. (1994). The Measurement of Environmental and Resource Values: Theory
and Methods. Washington, D.C.: Resources for the Future.
This text primarily addresses theoretical economics of resource valuation, focusing onwillingness to pay (WTP) and willingness to accept (WTA) methods of valuation. It coverstopics from the classic perspective of Compensating Variation (CV) and Equivalent Variation(EV). It provides (with justification) theoretical methods that can quantify difficult-to-valueresources such as health of populations, mortality, recreational use of environmental resources,and property values, as well as methods for quantifying wages, values changes over time, andvalue estimates limited by conditions of uncertainty. Specific valuation methods include, but are

79
not limited to, revealed and stated preference methods, intertemporal value methods, marketmethods, property value models, hedonic wage models, and recreational use models, all of whichprovide either new methods for hard-to-value resources, or alternatives that take into accountmoral and philosophical issues surrounding valuation.
Venkatachalam, L., (2004). The Contingent Valuation Method: a Review. Environmental
Impact Assessment Review 24, 89 – 124
The Contingent Valuation method (CVM) is commonly used in benefit-cost analysis to assessthe value people derive from a good regardless of any use that they might make of the good,commonly called a non-use value. This article reviews major criticisms of the CV method andrecent work that addresses those criticisms. The author discusses factors that can affect thereliability and validity of the assessment of an individual’s willingness to pay (WTP) orwillingness to accept (WTA), and examines reasons for the disparity between the WTP andWTA figures. The author also addresses other sources of possible error or bias in CV methodstudies: the embedding effect, sequencing effect, information effect, elicitation effects,hypothetical bias, strategic bias, and the benefit transfer issue. The article concludes bysummarizing two methods used to check for bias in CV method results: the test-retest methodand testing for convergent validity.
SECTION IV: Scientific and Policy Background
Chivers, J., & Flores, N.E. (2002). Market Failure in Information: The National Flood
Insurance Program. Land Economics, 78(4), 515–521.
This paper reviews the failure of National Flood Insurance Program (NFIP) pricing efficiency.In 1968, Congress created the NFIP. The Task Force on Federal Flood Control Policy, chairedby Gilbert F. White, defined the efficiency potential of insurance premiums proportional to riskand equal to the private and social costs of flood plain occupancy. Such pricing efficiencydepended on the deterrence of unsupportable use of floodplains and, conversely, thedevelopment of floodplain land that was economically supportable. The NFIP program hasfailed efficiency standards in two ways: Federal regulators and mortgage lenders failed touniformly enforce insurance participation requirements, and as a result of asymmetricalinformation about flood risk and premium costs, property pricing has been inflated. This studyfinds that the complex calculation of premiums, the variability of rates, and the consistent lack ofpremium disclosure to homebuyers until purchase all inhibit economic efficiency. Also,developers who build homes in high-risk areas often absorb the benefits of discounted,undeveloped land and sell the property, minus the risk-related discount, to less-informedhomebuyers.
This study proposes that mandatory NFIP be replaced by allowing communities the choice toparticipate in the National Flood Insurance Program. Home sellers in participating NFIPcommunities would be required to obtain a flood-elevation certificate, indicating the flood riskand cost of insurance premiums up front, as a necessary condition for listing a property. Theauthors do not present a proposal for non-participation communities. Their conclusion that
80
“communities wanting the benefit of the NFIP would need to comply suggests that non-participation communities would not qualify for NFIP federally backed mortgages.”185
Therefore, communities that choose not to participate, a policy that could potentially createanother type of information asymmetry, would not benefit from valid elevation, flood insurancerate, and flood risk details at the time that sellers list available properties.
Holway, J. M., & Burby, R. (1990). The Effects of Floodplain Development Controls on
Residential Land Values. Land Economics, 66 (3), 259-270.
This study examines the effects of 1) the risk of flooding and 2) local policies regardingfloodplain development on the value of that development, as shown by the value of land parcelsthat lie within the floodplain. The value of floodplain development is assumed to be a validindicator of the possible damages that could occur due to flooding. Using a hedonic pricingmodel to control for comparable parcel features, the authors examine nine communities at risk offlooding from a river. Communities at risk from oceanic flooding are excluded. The authorsfind that the following factors significantly reduced the value of land parcels within thefloodplain: low density zoning of the floodplain; requirements to elevate structures built on thefloodplain to above the 100 year flood level; and local government having a specific departmentor individual overseeing the development.
Porter, T. M. (1995). Trust in Numbers: The Pursuit of Objectivity in Science and Public Life.
U.S. Army Engineers and the Rise of Cost-Benefit Analysis (pp. 148–189). Princeton, NJ:
Princeton University Press.
The author presents a historical context for understanding the current use of divergent benefit-cost techniques. Although benefit-cost analysis began as “a strategy for limiting the play ofpolitics in public investment decisions,”186 the author contends that its’ current methodologies,used by the Corps and other government organizations, were transformed by several years ofbureaucratic conflict. The demands of industrialization and the need to cap congressionalexpenditures helped to routinize the Corps’ use of payback and benefits-to-exceed-cost methodsthat, while applied since the 1920s, were not written into law until the Flood Control Act of1936. This act required Corps approval for Congress to authorize flood control projects.Railroad and utility stakeholders and local constituents that were turned down by Corps benefit-cost analyses stirred opposition between private, local, and national policy interests. Thisopposition created a demand for standardized benefit-cost analytical methods. Inter-governmentagency differences also created a push for standardized methods. However, the negotiation foruniform benefit-cost standards between these government agencies failed. This chapter reviewsseveral examples of divergent economic analysis and benefit-cost rationale used by thesegovernment agencies to win projects, achieve department missions, and to define the mostdesirable private, social, and political outcomes. Currently, benefit-cost analysis influences allgovernment expenditures, yet diverse methodologies remain.
185 Chivers, J., & Flores, N.E. (2002) p. 521186 P. 189

81
Appendix B. Recommendations offered by the National Research Council
(NRC)
From the NRC report Analytical Methods and Approaches for Water Resources Project
Planning, 2004187.
Recommendation One:
To provide clearer direction to the Corps, the administration, and the Congress, in
cooperation with the states, should reconcile inconsistencies within the existing, de
facto, body of national water policy.
Recommendation Two:
A body should be specifically charged to coordinate water resources policies and
activities among the administration, the Congress, the states, and federal water
resources management agencies with water resources management responsibilities.
Recommendation Three:
The Principles and Guidelines document should be revised to better reflect
contemporary management paradigms; analytical methods; legislative directives; and
social, economic, and political realities. The new planning guidance should apply to
water resources implementation studies and similar evaluations carried out by all
federal agencies. A revised version of the P&G document should be periodically and
formally reviewed and updated.
Recommendation Four:
Therefore, even if the Administration should choose not to revise the P&G, the Corps
should draft a revision to its Planning Guidance Notebook that is consistent with this
report’s recommendations and propose this revision to the Administration.
Recommendation Five:
Benefit-cost analysis should not be used as the lone decision criterion in judging
whether a proposed planning or management alternative in a Corps planning study
should be approved.
Recommendation Six:
Periodic reviews of completed projects should be a routine part of Corps water project
planning and management. Congress should provide resources to conduct these “ex
post” evaluations.
187 The entire report is available from the NRC at http://www.nap.edu/catalog.php?record_id=10973
82
Recommendation Seven:
Resources and time allocated for Corps reconnaissance studies should be
commensurate with the scale and complexity of the water resources issue at hand.
Recommendation Eight:
The Corps should conduct a comprehensive review of district-level experiences with
stakeholder participation procedures and activities. The Corps should also develop
training and reference materials on stakeholder participation standards.
Recommendation Nine:
A summary document that identifies key environmental and social issues, primary
assumptions, alternatives considered and evaluated, objectives sought, benefits and
costs (monetized and non-monetized), trade-offs and stakeholder perspectives and
differences, presented with a consistent format across studies, should be a standard in
Corps planning studies.
Recommendation Ten:
The Corps should strengthen its programs in the areas of systems engineering aspects
of water resources, risk and uncertainty analysis, and the integration of engineering
and ecosystem analyses. Part of this strengthening should include the development of
updated design manuals that better reflect contemporary methods and theories. These
manuals should be used as general guidance rather than as “cookbooks” that specify
a series of steps that must be strictly adhered to.
Recommendation Eleven:
Independent experts from outside the Corps of Engineers should be routinely enlisted
to provide advice in Corps programs and planning studies.

83
Appendix C: Summary of Criticisms from Scodari (2005)
Table 2.1 Criticisms of Planning PrinciplesPlanning Principle Summary Criticisms (in bold)/Specific Comments, by Source (in bullets)
NED Objective and
Plan Selection
The NED federal objective and plan selection rule elevate economic development over environmental and social
considerations, and do not recognize the potential for civil works activities to advance environmental and social goals
The WRC was zero funded in 1981, and the federal objective has been redefined to be to maximize NED benefits (net benefits)
subject to compliance with all relevant environmental laws, but the ideas that it adopted form the bases of contemporary Corps
planning. The economic evaluation principles articulated by the Harvard Water Program and other economists remain the
foundation for the NED analysis. Environmental considerations are defined as legal constraints, however, not as objectives to
be achieved. Furthermore, the operational meaning of EQ in the context of the Corps program and planning model remains
ill-defined (NRC, 2004: New Opportunity).
Benefit-cost analysis should not be the sole decision criterion because such analyses may contain uncertainties and may
not adequately reflect difficult to measure and qualitative considerations such as stakeholder opinions, nonmarket values
and equity. Benefit-cost analysis should not be used as the lone decision criterion for justification (NRC, 2004:
Analytical Methods).
The P&G severely limits the Corps’ ability to select an alternative with fewer environmental consequences, or one that could
contribute to the national interest in ways other than economic development. The P&G exclusive emphasis on NED should be
balanced with increased focus on protecting and restoring the environment. The P&G must be updated to require the Corps to
consider sustainable environmental management and NED as co-equal goals in formulating projects (NWF and TCS, 2004:
Crossroads).
Flood damage reduction projects are complex and you cannot disqualify non-economic factors. Today, public preferences and
true environmental concerns are not incorporated into identifying the NED plan. The Corps should consider accepting a plan to
be in the federal interest if the net benefits and B/C ratio falls within a range around the NED plan (Fitzgerald, 2002: Local
Sponsor Comments).
In the context of the UMR-IWW inland navigation feasibility study, the Corps approach to considering environmental
resources only after the locks have been extended is inadequate because the environment is treated as a planning constraint
rather than as a resource on par with waterway infrastructure investment. Environmental improvements, not just the mitigation
of environmental damages, should be examined as part of the feasibility study (NRC, 2001: Inland Navigation).
Make economic development and environmental protection and restoration co-equal goals of water resources planning (S. 1987
reported in 2002 and S. 646 reported in 2001: Corps Reform Bills).
The Corps should revise the P&G to make sure project benefits accrue to the general public (S. 1987 reported in 2002: Corps
Reform Bill).
Some projects, such as inland navigation and beach replenishment, benefit just a few private interests. Congress should deny
public funding for projects that provide only private benefits (TCS and NWF, 2000: Troubled Waters).
Ecological and social considerations are often of great importance in project planning and should not necessarily be considered

84
Table 2.1 Criticisms of Planning PrinciplesPlanning Principle Summary Criticisms (in bold)/Specific Comments, by Source (in bullets)
secondary to the maximization of economic benefits. P&G revisions should consider movement away from consideration of the
NED account as the most important concern (NRC, 1999: New Directions).
The P&G is outdated and does not reflect a balance among economic, social, and environmental goals of the nation. The
president should immediately establish EQ and NED as co-equal objectives of planning, and the P&G revised to accommodate
the new objectives and to ensure full consideration of nonstructural approaches to floodplain management (IFMRC, 1994:
Sharing the Challenge).
The P&G lift the NED account above the EQ account. The rules go too far in elevating monetized benefits and costs, and they
do not envision any incommensurable or intangible increases in EQ as worthwhile (Griffin, 1993: EPA Review).
The P&G may give undue emphasis to monetary dimensions of projects at the expense of EQ deterioration, since there is little
or no emphasis on including the change in monetary values of EQ effects (Larson, 1993: EPA Review).
The directive to choose the plan that maximizes NED consistent with environmental protection is puzzling. What does
consistent with protecting the environment mean when comparing alternative plans? Plan A may have greater NED benefits
than Plan B, but also greater EQ impacts. How does one choose? (Fisher, 1993: EPA Review)
The selection rules appear to place too much emphasis on the NED account. Why wouldn’t the decision maker balance the
NED account with the remaining accounts? (Mazzotta and Opaluch, 1993: EPA Review).
It is unclear what is meant by “consistent with protection of the Nation’s environment.” Does this mean that no environmental
degradation is allowed, or that no significant degradation is allowed? The former is unrealistic while the latter would appear to
be purely a matter of judgment of the administrator (Mazzotta and Opaluch, 1993: EPA Review).
Mitigation requirements do not ensure environmental protection
Mitigation for fish and wildlife losses must at a minimum acquire and restore the same number of habitat acres that fully
replace hydrological and ecological functions and characteristics of each acre of habitat adversely affected by the project (S.
2773 reported in 2004: WRDA Bill, Boxer amendment).
Prohibits the Secretary of the Army from submitting to congress any project proposal unless it contains a certification that the
project minimizes to the extent practicable adverse impacts on natural hydrological patterns and the aquatic value or native
diversity or aquatic ecosystems, and a determination has been made that the alternative has the greatest probability of cost-
effectively and successfully mitigating adverse impacts on aquatic resources, fish and wildlife (H.R. 2566 reported in 2003;
Corps Reform Bill).
The federal objective can be viewed as a constrained optimization problem -- determine plan that maximizes NED while
keeping EQ at same level. The fact that NED is in dollars and EQ is not would be no problem if the full costs of mitigation to
achieve the EQ constraint were included in the plans considered. However, the P&G guidance on mitigation is less than this.
It indicates that environmental protection is to be achieved by mitigation of adverse effects, but the level of mitigation is that
“determined to be appropriate by the agency head” (Larson, 1993: EPA Review).

85
Table 2.1 Criticisms of Planning PrinciplesPlanning Principle Summary Criticisms (in bold)/Specific Comments, by Source (in bullets)
The project justification threshold (NED benefits greater than costs) does not ensure an adequate rate of economic return
on public investments.
Project recommendations should be required to achieve a minimum 1.5 BCR (S.B. 1987 proposed in 2002: Corps Reform Bill).
Benefits from Corps projects should always significantly exceed costs before committing taxpayer dollars. Congress should
require the Corps to ensure taxpayers get a solid return on investment by raising the BCR threshold to at least 1.5 to 1 (NWF
and TCS, 2004: Crossroads).
The President’s Budget for FY2004 says that for prioritizing across the portfolio of recommended NED projects, the Corps
should rank projects by the ratio of estimated net benefits to costs. By extension, this implies that the existing project
justification criteria might be usefully changed (e.g. to the one with the highest B-C ratio). It also says the Corps has agreed to
exclude project features and increments that do not significantly increase total net benefits relative to costs; this also points
away from the current justification test based on maximization of net benefit (OMB, 2003: President’s Budget).
Formulation of
Alternative Plans
Project planning places insufficient emphasis on formulating and considering nonstructural management measures that
could address planning problems and opportunities while minimizing adverse effects on the environment.
The Corps should revise the P&G to eliminate bias and disincentives working against nonstructural flood protection, and
encourage the restoration of aquatic ecosystems (S. 1987 reported in 2002: Corps Reform Bill).
Under a new portfolio planning authority, planning studies should identify at least one nonstructural alternative to current
operations that seeks more efficient operation of existing investments to help achieve goals w/o altering hydrologic regimes,
such as purchase of flood easements (NRC, 2004: New Opportunity).
Demand management is an essential management tool to obtain improved use of existing project capacity. Efficient
management of existing projects requires use of appropriate pricing or other demand management strategies whenever public
use begins to exceed their capacity (Dickey, 2002: Congressional Testimony).
Congress should instruct the Corps to fully explore nonstructural options for improving traffic management as the baseline
condition for the NED and environmental evaluation of proposed lock extensions on the UMR-IWW (NRC, 2001: Inland
Navigation).
The President should revise the P&G flood to accommodate a new EQ objective and to ensure full consideration of
nonstructural alternatives for reducing vulnerability of flood damages (IFMRC, 1994: Sharing the Challenge).
Encourage nonstructural flood damage reduction projects (TCS and NWF, 2000: Troubled waters).
To what extent should plans evaluated under P&G attempt to introduce better mechanisms or institutions for managing
resources? Should such activities be permitted or encouraged under the P&G? Section 1.6.1(f) indicates that
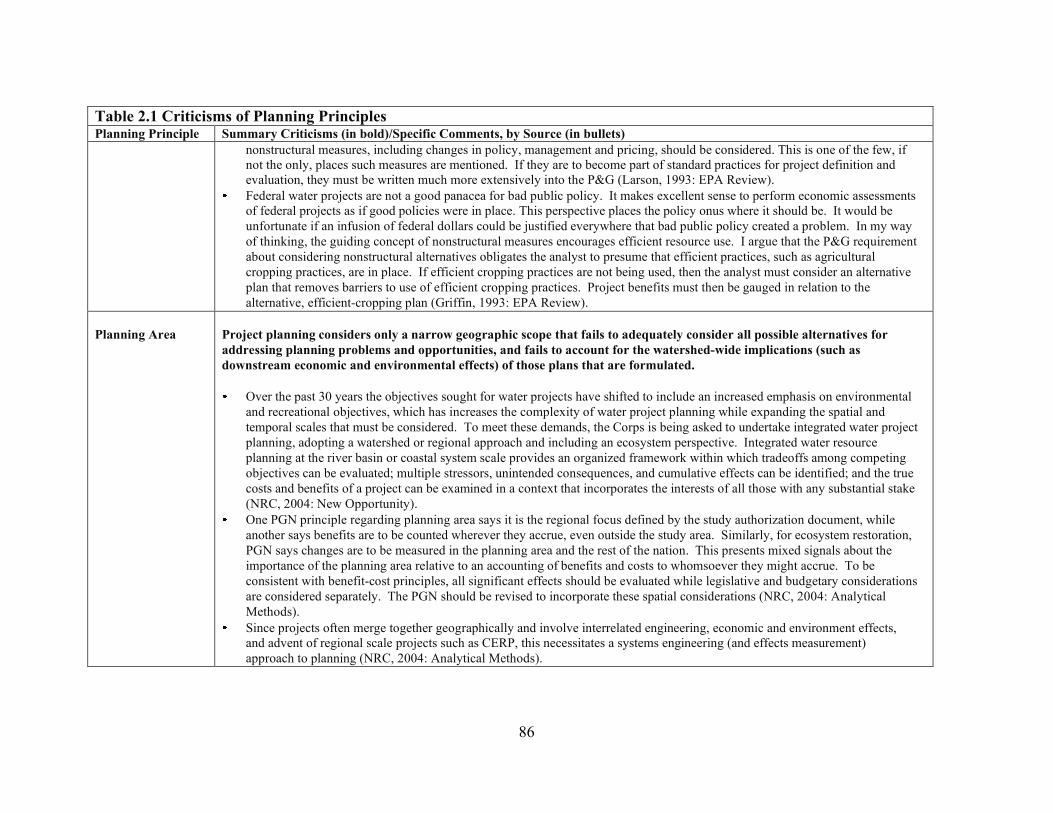
86
Table 2.1 Criticisms of Planning PrinciplesPlanning Principle Summary Criticisms (in bold)/Specific Comments, by Source (in bullets)
nonstructural measures, including changes in policy, management and pricing, should be considered. This is one of the few, if
not the only, places such measures are mentioned. If they are to become part of standard practices for project definition and
evaluation, they must be written much more extensively into the P&G (Larson, 1993: EPA Review).
Federal water projects are not a good panacea for bad public policy. It makes excellent sense to perform economic assessments
of federal projects as if good policies were in place. This perspective places the policy onus where it should be. It would be
unfortunate if an infusion of federal dollars could be justified everywhere that bad public policy created a problem. In my way
of thinking, the guiding concept of nonstructural measures encourages efficient resource use. I argue that the P&G requirement
about considering nonstructural alternatives obligates the analyst to presume that efficient practices, such as agricultural
cropping practices, are in place. If efficient cropping practices are not being used, then the analyst must consider an alternative
plan that removes barriers to use of efficient cropping practices. Project benefits must then be gauged in relation to the
alternative, efficient-cropping plan (Griffin, 1993: EPA Review).
Planning Area Project planning considers only a narrow geographic scope that fails to adequately consider all possible alternatives for
addressing planning problems and opportunities, and fails to account for the watershed-wide implications (such as
downstream economic and environmental effects) of those plans that are formulated.
Over the past 30 years the objectives sought for water projects have shifted to include an increased emphasis on environmental
and recreational objectives, which has increases the complexity of water project planning while expanding the spatial and
temporal scales that must be considered. To meet these demands, the Corps is being asked to undertake integrated water project
planning, adopting a watershed or regional approach and including an ecosystem perspective. Integrated water resource
planning at the river basin or coastal system scale provides an organized framework within which tradeoffs among competing
objectives can be evaluated; multiple stressors, unintended consequences, and cumulative effects can be identified; and the true
costs and benefits of a project can be examined in a context that incorporates the interests of all those with any substantial stake
(NRC, 2004: New Opportunity).
One PGN principle regarding planning area says it is the regional focus defined by the study authorization document, while
another says benefits are to be counted wherever they accrue, even outside the study area. Similarly, for ecosystem restoration,
PGN says changes are to be measured in the planning area and the rest of the nation. This presents mixed signals about the
importance of the planning area relative to an accounting of benefits and costs to whomsoever they might accrue. To be
consistent with benefit-cost principles, all significant effects should be evaluated while legislative and budgetary considerations
are considered separately. The PGN should be revised to incorporate these spatial considerations (NRC, 2004: Analytical
Methods).
Since projects often merge together geographically and involve interrelated engineering, economic and environment effects,
and advent of regional scale projects such as CERP, this necessitates a systems engineering (and effects measurement)
approach to planning (NRC, 2004: Analytical Methods).

87
Table 2.1 Criticisms of Planning PrinciplesPlanning Principle Summary Criticisms (in bold)/Specific Comments, by Source (in bullets)
Despite clear authority and strong evidence for internal support for integrated river basin, coastal system and ecosystem
planning, the amount of focused guidance for such planning is relatively limited compared to that for economic evaluation.
Corps guidance should be revisited to bring it into closer conformity with generally stated principles and methods that support
integrated water resources planning (NRC, 2004: River Basins).
The Corps tendency is to favor single purpose projects that focus primarily on local issues, rather than treating water resources
as interdependent parts of ecological systems. Congress and the Corps should direct planners to utilize comprehensive
watershed-based planning as the basis for development and management planning (NWF and TCS, 2004: Crossroads).
The Corps tends to ignore indirect and cumulative environmental impacts of a new project and maintains a narrow view of the
projects scope (TCS and NWF, 2000: Troubled Waters).
The watershed or river basin, estuarial region, and coastal units should be used as the basic spatial units in water planning,
when and where it is appropriate and circumstances allow (NRC, 1999: New Directions).
For too long agencies have viewed their policies and programs in isolation. The Corps and other agencies should examine the
watershed-wide implications of their programs to take into account the regional and downstream ecological, social and
economic consequences, rather than using a limited project-by-project approach (NRC, 1999: New Strategies).
Evaluation of
EffectsProject evaluations fail to account for the full range of project effects that people care about, including environmental and
social effects (of which some may be measurable in NED terms) as well as non-NED economic effects.
Along with NED and non-monetary NER analysis, Corps economic analyses for portfolio planning should evaluate and report
on a) effects of new projects on national and regional economies, and international competitiveness, b) magnitude and
incidence of foregone benefits from modifying current projects and their operation, c) traditional categories of NED benefits
that accrue from restoration measures (NRC, 2004: New Opportunity).
Feasibility studies shall include an analysis of the benefits and costs, both quantified and unquantified, which shall identify
environmental costs and benefits, including the costs and benefits of protecting or degrading natural systems, social costs and
benefits, including risk analysis regarding potential loss of life, and cultural and historical costs and benefits (S. 2773
Manager’s Amendment reported in 2004: WRDA Bill).
The lowered cost of transport is assumed to be the dominant source of national benefits for improved navigation services.
Although this may capture many of the benefits, it omits others. For example, the PGN does not allow the inclusion of reduced
highway fatalities in calculating navigation benefits (NRC, 2004: Analytical Methods).
Current benefit calculation procedures for Corps flood damage reduction projects include only a subset of potential benefits.
BCA should count all benefits and costs, not just a subset of preferential categories of benefits that may be consistent with
conventional methods for their calculation. If a flood damage reduction project affects human lives and the environment, these
costs and benefits should be included in the analysis (NRC, 2004: Analytical Methods).
The Corps should ensure that all project plans include an assessment of how the project fulfills the Corps’ commitment to

88
Table 2.1 Criticisms of Planning PrinciplesPlanning Principle Summary Criticisms (in bold)/Specific Comments, by Source (in bullets)
environmental stewardship. The cumulative environmental effects of each project, together with other past and future human
activities in the same system, should be consistently evaluated for each project (NRC, 2004: River Basins).
The American Association of Port Authorities and others supporting improvement at ports, need to provide better
documentation of project benefits that fall outside of traditional NED analysis, including the extent to which water project
investment and operations may affect jobs, income, competitiveness of industries among regional economies, and trade, since
these non-NED benefits are the primary reason for the political support that the ports receive at the state and local level and
may more realistically portray the real benefits that the ports provide. Justification of projects based on the basis of
transportation costs savings is an unrealistically narrow measure of a project’s overall worth (Steinberg, 2004: AAPA).
Feasibility studies should exclude any project benefits derived from any intensification of land use from reducing or
eliminating wetlands (S. 2773 Manager’s Amendment reported in 2004: WRDA Bill; S. 1987 reported in 2002: Corps Reform
Bill).
P&G revisions should eliminate calculation of any economic benefits derived from wetlands draining (NWF and TCS, 2004:
Crossroads).
For the UMR-IWW feasibility study, the Corps should aim toward more comprehensive and integrated assessment of the
navigation system’s effects on the environment as well as NED. Further, environmental improvements—not just
mitigation—should be examined as part of the navigation study (NRC, 2001: Inland Navigation).
Federal procedures for calculating costs and benefits of beach nourishment and protection are overly restrictive. The rules
governing C-B analysis, and the choices among alternative project designs and implementation strategies, should account for
the true social costs and benefits in decision-making, including recreational benefits and beneficial effects on beaches outside
the project area (NRC, 1995: Beach Nourishment).
To reduce the vulnerability of flood damages, the Administration should adopt flood damage reduction guidelines based on a
revised P&G which would give full weight to social, economic and environmental values and assure that nonstructural
alternatives are given equal consideration (IFMRC, 1994: Sharing the Challenge).
Feasibility studies should identify local, regional and national economic cost and benefits (S. 2773 Manager’s Amendment
reported in 2004: WRDA Bill).
The ecological, health and other social effects of flood damage reduction studies, and the tradeoffs between them, should be
quantified to the extent possible and included in the NED Plan (NRC, 2000: Risk and Uncertainty).
Criteria to assess water quality effects of Corps projects should be developed and applied to project planning (Zilberman, 1993:
EPA Review).
NER & NED/NER
PlanningThe objective and scope of the NER mission has not been clearly defined
Details regarding the scope and purposes of the Corps’ roles within ecosystem restoration are not clearly defined. Formulating
and evaluating alternatives focused on restoring hydrologic and geomorphic components of aquatic ecosystems is an

89
Table 2.1 Criticisms of Planning PrinciplesPlanning Principle Summary Criticisms (in bold)/Specific Comments, by Source (in bullets)
appropriate role for the Corps. The Corps’ primary environmental missions should be to restore hydrologic and geomorphic
processes in large river and coastal systems. The Corps could also help operationalize its NER evaluation account with
hydrologic and geomorphic outcome measures. Appropriate measures will be site-specific and a function of project goals
(NRC, 2004: New Opportunity).
Tradeoff procedures and plan selection rules for single purpose NER and combined NED/NER planning need to be clarified
in order to support integrated planning for economic and environmental outputs.
The Corps has chosen to not rely solely on benefit-cost analysis for making the final selection of an ecosystem restoration
alternative and also employs non-monetary measures. In its desire to ensure that restoration is not viewed entirely in economic
terms, however, the agency has not adequately emphasized that restoration measures can yield traditional NED benefits. For
example, restoration measures such as wetlands rehabilitation or removing obstacles from a stream can reduce flood peaks and
thus may yield NED flood damage reduction benefits. However, such benefits are not reported or considered in justifying
restoration measures. Planning guidelines should recognize that restoration and nonstructural measures yield benefits
traditionally understood as NED benefits, and these should be calculated and used in the incremental analysis (NRC, 2004:
New Opportunity).
The Corps should continue its efforts to facilitate the systematic integration of information provided in the NED and NER
accounts through the application of tradeoff analysis (NRC, 2004: River Basins).
Contrary to existing guidance for NED/NER planning, plan costs that jointly serve NED and NER (such joint cost should be
the norm for integrated NED/NER planning) should not be “allocated” for efficiency analysis. All monetary and non-monetary
effects of plans should be evaluated together. Specifically, CEA/ICA should be implemented using net dollar NED effects and
non-dollar NER effects. And consistent with the way the Corps at one time did multipurpose planning for multiple NED
purposes, plan justification for NED/NER projects should involve a two-part test. First, each purpose in a plan must be shown
to be justifiable as a separable element based on purpose-specific benefits that exceed separable purpose costs. Second, a
subjective determination must be made that the combination of NED and NER benefits yielded by the plan is worth total plan
costs (Stakhiv et. al., 2003: Environmental Benefits).
The tradeoff explicitly described in the Corps restoration guidance is between net NED and NER outputs. If increased NER
output comes at the expense of NED, guidance calls for an incremental analysis to display and justify NED costs incurred to
satisfy increased NER outputs represented in non-monetary terms. In the case of permanent evacuation and associated
measures that produce both economic and environmental outputs, NED benefits yielded should be included as financial cost
offsets for the tradeoff analysis (Shabman, et al, 1997: Permanent Evacuation).

90
Table 2.2 Criticisms of Planning GuidelinesPlanning Guidance Summary Criticism (in bold)/Specific Comments, by source (in bullets)
NED Evaluation:
Navigation
For deep draft navigation planning, NED evaluations fail to consider the effects that deepening one port might have on other
ports.
Justifiably, the Corps is not supposed to consider traffic simply shifted from one port to another as a benefit when calculating NED
benefits potential of project alternatives. But neither should the Corps ignore the impacts that deepening one port has on neighboring
ports. For example, three ports are within 300 miles of one another on the south Atlantic coast. The Corps assumes that each of these
ports will maintain a constant share of the predicted increase in traffic if all three ports are deepened. Yet if all three are deepened,
the three ports will not be fully utilized, wasting hundred of millions of dollars. Congress should direct the Corps to consider its
navigation projects within a comprehensive and inter-modal framework, such as viewing overall transportation needs in a regional or
national context (NWF and TCS, 2004: Crossroads).
The Corps should work with the NAS to revise the P&G to do regional, multi-port analysis that thoroughly considers regional
economic and environmental benefits, including the effect of overcapacity in the region (S. 1987 reported in 2002: Corps Reform
Bill).
There is a race to the bottom among US ports to deepen harbors in the hopes of attracting an emerging class of mega-ships. Though
some deep draft harbors are necessary, not every port need be deep to be economically competitive. Widespread, uncoordinated
harbor deepening projects will likely result in a huge overcapacity. To halt this race to the bottom, taxpayer and environmental
advocates are pushing for regional port planning measures to guide future port development (TCS and NWF, 2000: Troubled
Waters).
For both deep draft and inland navigation planning NED evaluations fail to consider the extent to which project benefits may be
distributed outside the country.
The PGN should be revised to incorporate more explicit provisions about the spatial and distributional dimensions of costs and
benefits (NRC, 2004: Analytical Methods).
The Corps’ NED analyses of navigation projects assume that if transportation cost savings result from a deeper channel or harbor, all
of those savings will trickle down to the US economy. Yet if there is less than full competition in the use of the navigation
infrastructure, some benefits may be retained by the shipping firms, which may include foreign entities. But the Corps does not
study the level of competition that exists to determine if predicted savings will indeed be passed on to US entities and thus contribute
to national economic development. P&G revisions should improve economic analyses of port projects by requiring an estimate of
how economic benefits derived from transportation costs savings will be distributed to the US economy (NWF and TCS, 2004:
Crossroads).
While maritime projects must produce a NED benefit to the general public, the Corps now broadly defines general public as anyone,
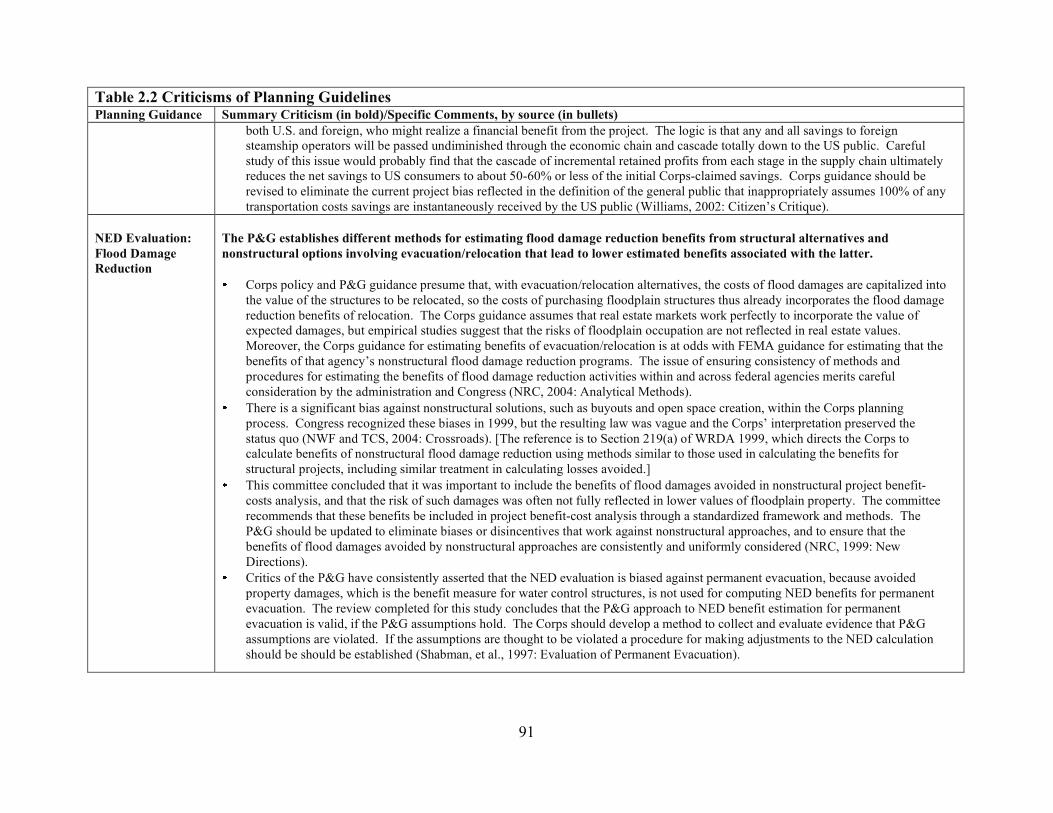
91
Table 2.2 Criticisms of Planning GuidelinesPlanning Guidance Summary Criticism (in bold)/Specific Comments, by source (in bullets)
both U.S. and foreign, who might realize a financial benefit from the project. The logic is that any and all savings to foreign
steamship operators will be passed undiminished through the economic chain and cascade totally down to the US public. Careful
study of this issue would probably find that the cascade of incremental retained profits from each stage in the supply chain ultimately
reduces the net savings to US consumers to about 50-60% or less of the initial Corps-claimed savings. Corps guidance should be
revised to eliminate the current project bias reflected in the definition of the general public that inappropriately assumes 100% of any
transportation costs savings are instantaneously received by the US public (Williams, 2002: Citizen’s Critique).
NED Evaluation:
Flood Damage
Reduction
The P&G establishes different methods for estimating flood damage reduction benefits from structural alternatives and
nonstructural options involving evacuation/relocation that lead to lower estimated benefits associated with the latter.
Corps policy and P&G guidance presume that, with evacuation/relocation alternatives, the costs of flood damages are capitalized into
the value of the structures to be relocated, so the costs of purchasing floodplain structures thus already incorporates the flood damage
reduction benefits of relocation. The Corps guidance assumes that real estate markets work perfectly to incorporate the value of
expected damages, but empirical studies suggest that the risks of floodplain occupation are not reflected in real estate values.
Moreover, the Corps guidance for estimating benefits of evacuation/relocation is at odds with FEMA guidance for estimating that the
benefits of that agency’s nonstructural flood damage reduction programs. The issue of ensuring consistency of methods and
procedures for estimating the benefits of flood damage reduction activities within and across federal agencies merits careful
consideration by the administration and Congress (NRC, 2004: Analytical Methods).
There is a significant bias against nonstructural solutions, such as buyouts and open space creation, within the Corps planning
process. Congress recognized these biases in 1999, but the resulting law was vague and the Corps’ interpretation preserved the
status quo (NWF and TCS, 2004: Crossroads). [The reference is to Section 219(a) of WRDA 1999, which directs the Corps to
calculate benefits of nonstructural flood damage reduction using methods similar to those used in calculating the benefits for
structural projects, including similar treatment in calculating losses avoided.]
This committee concluded that it was important to include the benefits of flood damages avoided in nonstructural project benefit-
costs analysis, and that the risk of such damages was often not fully reflected in lower values of floodplain property. The committee
recommends that these benefits be included in project benefit-cost analysis through a standardized framework and methods. The
P&G should be updated to eliminate biases or disincentives that work against nonstructural approaches, and to ensure that the
benefits of flood damages avoided by nonstructural approaches are consistently and uniformly considered (NRC, 1999: New
Directions).
Critics of the P&G have consistently asserted that the NED evaluation is biased against permanent evacuation, because avoided
property damages, which is the benefit measure for water control structures, is not used for computing NED benefits for permanent
evacuation. The review completed for this study concludes that the P&G approach to NED benefit estimation for permanent
evacuation is valid, if the P&G assumptions hold. The Corps should develop a method to collect and evaluate evidence that P&G
assumptions are violated. If the assumptions are thought to be violated a procedure for making adjustments to the NED calculation
should be should be established (Shabman, et al., 1997: Evaluation of Permanent Evacuation).
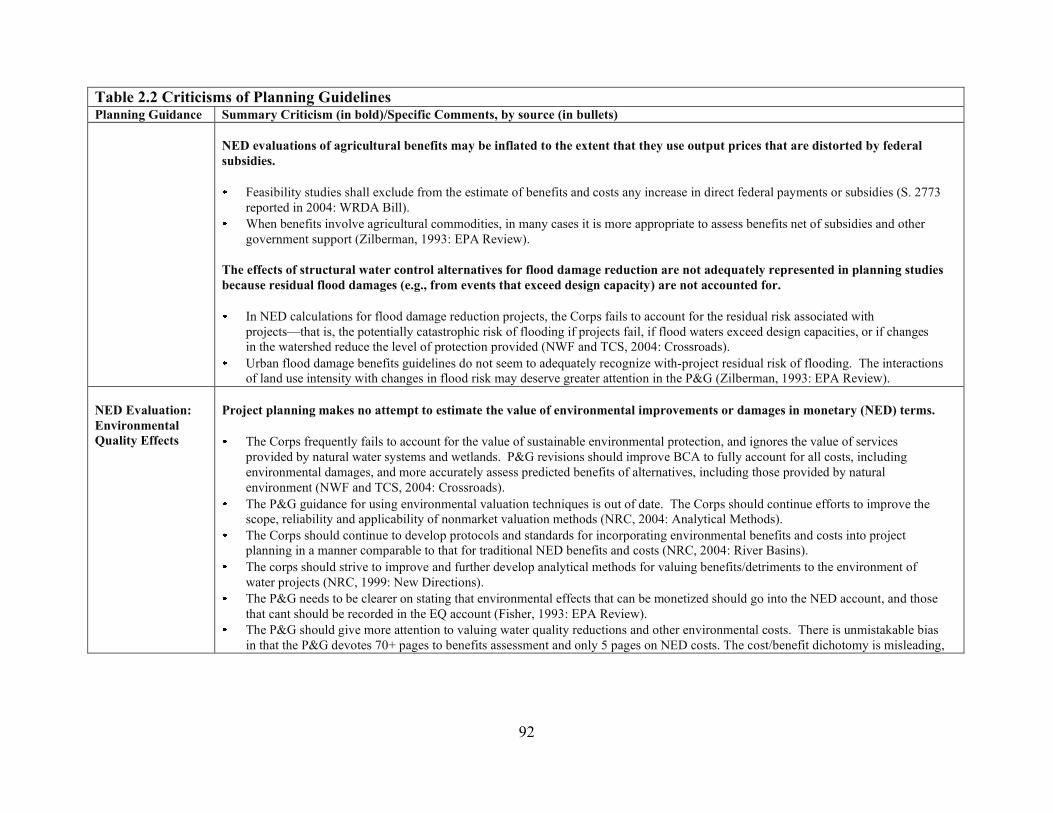
92
Table 2.2 Criticisms of Planning GuidelinesPlanning Guidance Summary Criticism (in bold)/Specific Comments, by source (in bullets)
NED evaluations of agricultural benefits may be inflated to the extent that they use output prices that are distorted by federal
subsidies.
Feasibility studies shall exclude from the estimate of benefits and costs any increase in direct federal payments or subsidies (S. 2773
reported in 2004: WRDA Bill).
When benefits involve agricultural commodities, in many cases it is more appropriate to assess benefits net of subsidies and other
government support (Zilberman, 1993: EPA Review).
The effects of structural water control alternatives for flood damage reduction are not adequately represented in planning studies
because residual flood damages (e.g., from events that exceed design capacity) are not accounted for.
In NED calculations for flood damage reduction projects, the Corps fails to account for the residual risk associated with
projects—that is, the potentially catastrophic risk of flooding if projects fail, if flood waters exceed design capacities, or if changes
in the watershed reduce the level of protection provided (NWF and TCS, 2004: Crossroads).
Urban flood damage benefits guidelines do not seem to adequately recognize with-project residual risk of flooding. The interactions
of land use intensity with changes in flood risk may deserve greater attention in the P&G (Zilberman, 1993: EPA Review).
NED Evaluation:
Environmental
Quality Effects
Project planning makes no attempt to estimate the value of environmental improvements or damages in monetary (NED) terms.
The Corps frequently fails to account for the value of sustainable environmental protection, and ignores the value of services
provided by natural water systems and wetlands. P&G revisions should improve BCA to fully account for all costs, including
environmental damages, and more accurately assess predicted benefits of alternatives, including those provided by natural
environment (NWF and TCS, 2004: Crossroads).
The P&G guidance for using environmental valuation techniques is out of date. The Corps should continue efforts to improve the
scope, reliability and applicability of nonmarket valuation methods (NRC, 2004: Analytical Methods).
The Corps should continue to develop protocols and standards for incorporating environmental benefits and costs into project
planning in a manner comparable to that for traditional NED benefits and costs (NRC, 2004: River Basins).
The corps should strive to improve and further develop analytical methods for valuing benefits/detriments to the environment of
water projects (NRC, 1999: New Directions).
The P&G needs to be clearer on stating that environmental effects that can be monetized should go into the NED account, and those
that cant should be recorded in the EQ account (Fisher, 1993: EPA Review).
The P&G should give more attention to valuing water quality reductions and other environmental costs. There is unmistakable bias
in that the P&G devotes 70+ pages to benefits assessment and only 5 pages on NED costs. The cost/benefit dichotomy is misleading,

93
Table 2.2 Criticisms of Planning GuidelinesPlanning Guidance Summary Criticism (in bold)/Specific Comments, by source (in bullets)
since with greater attention to environmental consequences, a project may increase or decrease economic outputs, and in either case
the evaluation procedures should be the same (Griffin, 1993: EPA Review).
One reason P&G does not adequately address nonmarket valuation (particularly for EQ effects) is that the P&G are devoted almost
exclusively to measuring consumer surplus for price changes, with virtually noting said about measuring surplus from quality
changes. Greater effort should be made toward describing how EQ effects can be included in the NED account, by including the
determination of the value of quality or attribute change through either TCM or more broadly, CVM (Larson, 1993: EPA Review).
Accounting for
Risk and
Uncertainty
Project evaluations produce point estimates of costs and benefits that wrongly suggest that predicted effects are highly certain.
Corps should adopt a long-term focus toward enhancing and expanding use of R&U analysis (NRC, 2004: Analytical Methods).
Feasibility studies should include an analysis of benefits and costs that identifies areas of risk and uncertainty (S. 2773 reported in
2004: WRDA Bill).
The Corps should revise the P&G to incorporate new techniques for R&U analysis (S. 1987 reported in 2002: Corps Reform Bill).
For navigation dredging projects, Corps guidance on economic assessments should be revised to oblige key assumptions (about
commerce growth rates, vessel loading factors, etc.) to be “most probable” outcomes rather than “most optimistic.” Suggest
performing sensitivity (or uncertainty) analyses to illustrate the extent to which the computed project benefits and BCR are impacts
by the variations (uncertainty) in the assumptions (Williams, 2002: Citizen’s Critique).
The P&G should be updated to reflect new techniques in R&U analysis developed since 1983 (NRC, 1999: New Directions).
One important need for advancing watershed management is to develop practical approaches for considering R&U in real world
decision-making (NRC, 1999: New Strategies).
The new corps R&U procedures for flood control projects are innovative and timely; however, there is concern about the specific
ways in which uncertainty is currently represented and included in the calculation of average flood damages and residual risks (NRC,
1995: Flood Risk Management).
Since impacts cannot be predicted with certainty, planners should develop alternative scenarios, assign them some subjective
probabilities, and obtain expected outcomes as well as outcomes that may occur at certain statistically significant levels (Zilberman,
1993: EPA Review).
The stated definitions of risk (known probability distributions) and uncertainty (no objectively known distributions) may be
misleading. Indeed, the discussion of uncertainty indicates that probability can be described subjectively. This is correct and
this Bayesian approach is what makes the stated distinction between risk and uncertainty meaningless (Fisher, 1993: EPA
Review).
The R&U supplement is useful, but the distinction made between R&U made early is not carried through. The methods described
apply to situations involving risk, yet the reference throughout is to R&U (Larson, 1993: EPA Review).
R&U should be included in the evaluation process. At a minimum, B and C should be weighted according to likelihood of
occurrence, i.e., in expected values (Mazzotta and Opaluch, 1993: EPA Review).
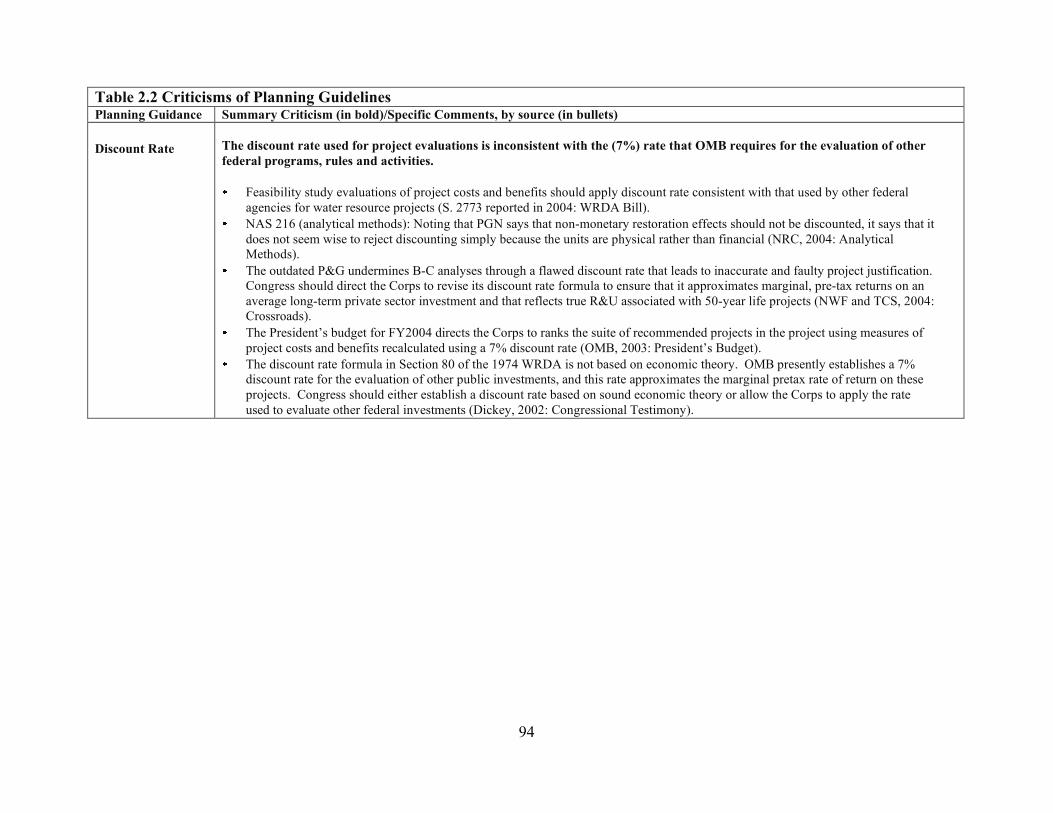
94
Table 2.2 Criticisms of Planning GuidelinesPlanning Guidance Summary Criticism (in bold)/Specific Comments, by source (in bullets)
Discount Rate The discount rate used for project evaluations is inconsistent with the (7%) rate that OMB requires for the evaluation of other
federal programs, rules and activities.
Feasibility study evaluations of project costs and benefits should apply discount rate consistent with that used by other federal
agencies for water resource projects (S. 2773 reported in 2004: WRDA Bill).
NAS 216 (analytical methods): Noting that PGN says that non-monetary restoration effects should not be discounted, it says that it
does not seem wise to reject discounting simply because the units are physical rather than financial (NRC, 2004: Analytical
Methods).
The outdated P&G undermines B-C analyses through a flawed discount rate that leads to inaccurate and faulty project justification.
Congress should direct the Corps to revise its discount rate formula to ensure that it approximates marginal, pre-tax returns on an
average long-term private sector investment and that reflects true R&U associated with 50-year life projects (NWF and TCS, 2004:
Crossroads).
The President’s budget for FY2004 directs the Corps to ranks the suite of recommended projects in the project using measures of
project costs and benefits recalculated using a 7% discount rate (OMB, 2003: President’s Budget).
The discount rate formula in Section 80 of the 1974 WRDA is not based on economic theory. OMB presently establishes a 7%
discount rate for the evaluation of other public investments, and this rate approximates the marginal pretax rate of return on these
projects. Congress should either establish a discount rate based on sound economic theory or allow the Corps to apply the rate
used to evaluate other federal investments (Dickey, 2002: Congressional Testimony).

95
Appendix D: EPA Residual Risk Assessment Steps188
EPA residual risk assessment is a detailed-multi step process. The phases of residual risk
analysis consist of six steps. Likewise P&G EPA starts with a formulation of the problem. For a
given emission source category, firstly they describe the context and scope of the problem.
However, EPA also defines its management goals with the legal requirements and limitations for
the process. In addition to the careful analysis of management objectives and legal constraints,
EPA uses readily available data extensively to document the problem while inviting
stakeholders’ participation in the process.
The second and third steps require the analysis of health effects of the concerned emission source
of hazardous air pollutants (HAPs), and they analyze the exposure to those pollutants. Exposure
analysis looks at the factors that are crucial to the risk assessment outcome. Those outcomes are
routes of exposure and the HAPs emitted along with the nature of populations or environments
being affected by the exposure. After analyzing factors contributing to risk assessment
outcomes, EPA determines the characters of the residual risk, which considers the nature,
magnitude and uncertainty of any risks.
The fourth stage answers the question of whether the human health risk is acceptable for the
specific case of exposure & emission of HAPs. If the EPA’s analysis answers the question that
humane health is present at an acceptable level, then the residual risk assessment process stops at
the fourth stage. If the answer is negative, the fifth step works through the information available
to evaluate the management options sufficiently189
. The evaluation of management options takes
into account the residual risks, costs, economic impacts, feasibility, energy, safety, and other
related factors. If the information available is not sufficient enough to completely evaluate the
options, the process continues with a more thorough analysis to understand the associated
impacts with those management options. When available information helps analysts to evaluate
impacts of risk management options to prevent unacceptable human or environmental risks, the
residual risk assessment is complete.
188
United States Environmental Protection Agency, Office of Air Quality. (March 1999). Residual Risk: Report to
Congress. Retrieved from http://www.epa.gov/ttn/oarpg/t3/reports/risk_rep.pdf189
Ibid. p.110, Exhibit 20.

96
Appendix E: Effects of Accounting for Equity on NED
All the possible effects of including equity on an analysis are summarized in the table below,
with the type of account in the left column, and the sign of the benefits. A question mark
indicates ambiguous sign.
OSE + - - + - + + -
REDIN
+ - + - - - + +
REDOUT
+ - + - + + - -
NEDexist
+ - + - ? ? ? ?
NEDrev
+ - ? ? ? ? ? ?
Key:
OSE Net equity benefits of the project to the nation
REDIN
Net benefits that accrue to the project region
REDOUT
Net benefits that accrue to all regions except the project region
NEDexist
Sum of REDIN
and REDOUT
net benefits of all regions in the nation (not
including equity effects, per P&G 1983, and used in UMRCP)
NEDrev
Sum of REDIN
, REDOUT
, and OSE net benefits of all regions in the nation
(including equity effects)
When comparing the resulting signs for NEDexist
and NEDrev
, two additional possibilities of
ambiguous signs are possible under the NEDrev
when compared to NEDexist
. This suggests that
when equity is monetized and accounted for in BCA, there is potential for positive or negative
net benefits when current P&G methods would suggest otherwise.
It is important to note that the magnitude of the benefits determine the ultimate NED sign. The
interesting case shown in the table is when including equity in an analysis reverses the NED
sign. This is possible in any of the combinations where the sign of NEDrev
is ambiguous. In
trying to determine these cases, the magnitude of an equity effect would need to overcome the
combined effect of both regional and national economic effects to shift the result. This is
unlikely when the combined regional and national net effect is highly positive or negative;
conversely, equity plays a much more important role when the total net benefits of the region and
nation are near zero.
Finally, while this example discusses the effects of equity in particular, additional monetized
benefits from the environment or health and loss of life effects will interact similarly, increasing
uncertainty in expected net outcomes.

97
Appendix F: Technical Details for the UMRCP
This appendix contains three parts. The first outlines overall objectives of the UMRCP, the
second provides a table that highlights each of the 14 alternative plans, and the third provides
more details on the preferred plan and why it was selected as a result of the reconnaissance
study.
Part 1. Objectives of the UMRCP
The objectives of the UMRCP were developed, by considering the problems, opportunities, and
the language of authorizing legislation to:
• “minimize the threat to health and safety resulting from flooding by using structural and
nonstructural flood damage reduction measures;
• reduce damages and costs associated with flooding;
• identify opportunities to support environmental sustainability/restoration goals of the
Upper Mississippi and Illinois River floodplains as part of any systemic flood damage
reduction plan;
• seek opportunities to address, in concert with flood damage reduction measures, other
floodplain specific problems, needs and opportunities to include:
o continued maintenance of the navigation project and related commercial
infrastructure;
o reduction of nutrient input and sedimentation into the rivers;
o improved habitat management;
o bank caving and erosion reduction;
o improved recreation opportunities; and
o identify and recommend appropriate follow-on studies.”190
190
UMRCP, p. ES-3-4
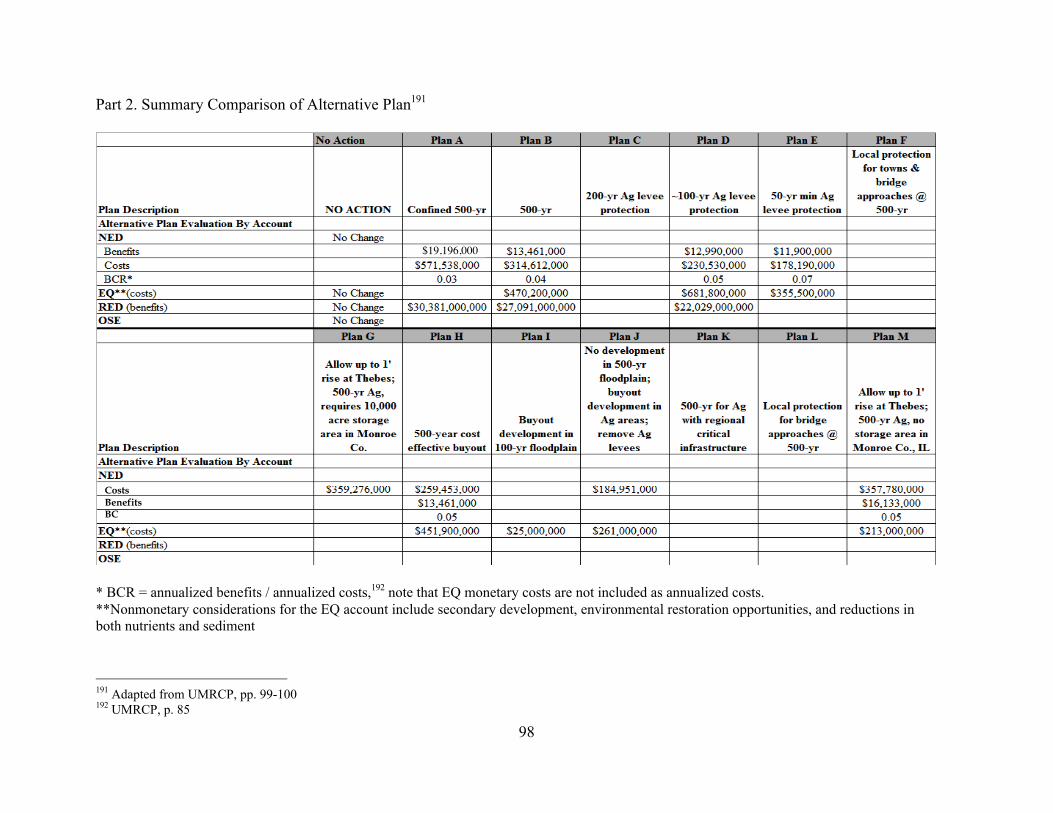
98
Part 2. Summary Comparison of Alternative Plan191
x
$19,196,000
Costs
Benefits
BC
R*
* BCR = annualized benefits / annualized costs,192
note that EQ monetary costs are not included as annualized costs.
**Nonmonetary considerations for the EQ account include secondary development, environmental restoration opportunities, and reductions in
both nutrients and sediment
191
Adapted from UMRCP, pp. 99-100192
UMRCP, p. 85
99
Part 3. Technical Details of Preferred Plan, UMRCP Plan H
According to the UMRCP, Plan H performs the best among the alternatives evaluated, because itincludes a cost effectiveness consideration, despite falling well below (a BCR of 0.05) thethreshold of a BCR of 1.0 or higher. The preferred Plan H would protect urban areas and townswith 500-year levees; for agricultural areas it would provide 500-year levees except wherebuyouts would be more cost effective. “For Plan H, the construction cost of increasing thesystem height, typically raising a levee, is compared to the cost of acquisition of the district, andthe cost effective option then becomes a part of Plan H for that site. Any district could choosenot to be a part of the plan and then the district would stay ‘as is’ or find other resources toimprove the existing level of protection.”193 However, the Corps cautions that Plan H has yet tobe thoroughly vetted with the stakeholders and general public.
Plan D — which includes providing approximately 100-year level protection for agriculturalareas and 500-year level protection for urban areas — was a close second, for which a $22billion benefit was calculated in the RED account:194 “The direct impacts from improved floodprotection of the project proposals occur in five areas: construction, economic development, landvalue enhancement, farm income gains, and damages averted.”195 Plan M — which involvesproviding 500-year level protection to urban, agricultural, and currently unprotectedcommunities — also appeals to regional stakeholders who are seeking further economicdevelopment. However, the UMRCP final report concludes:
There is likely to be limited Federal interest, based upon current guidance, in planimplementation by Federal agencies.… Regional or national oversight (e.g., theMississippi River Commission) would be required to ensure the plan functions asa system over the implementation and operation phases of the project and projectpriorities are established to reflect the changing systemic needs.… The States ofIllinois, Iowa, and Missouri need to agree on the plan and plan implementation toinsure the plan is acceptable. The Corps could provide facilitation and technicalsupport to this effort.”196
193 Ibid, p. 119194 The economic analysis described in the UMRCP is not clear whether this regional benefit is included in thenational benefit, or whether the regional benefit is offset by a cost in other regions within the nation.195 Ibid. Appendix C, p. C-28196 Ibid., p. ES-11