principles of ecology
TRANSCRIPT

1
University of Edinburgh School of GeoSciences
PRINCIPLES OF ECOLOGY The Distribution and Abundance of Organisms
Course Information 2011/2012
Course Organiser Dr Gail Jackson Institute of Atmospheric & Environmental Sciences Room 217a Crew Building
Email: [email protected]
Course Secretary Helen McKeating Room 211, Crew Building Tel.: 0131 650 5430
Email: [email protected]
PR
INC
IPL
ES
OF
E
CO
LO
GY

2
TABLE OF CONTENTS
INTRODUCTION TO THE COURSE 3 WELCOME 3 COURSE SYNOPSIS 3 ENTRY REQUIREMENTS 3 AIMS AND OBJECTIVES 3 COURSE STRUCTURE 3 PRACTICAL PROJECTS 4 STAFF 4 SYLVA 4 TIMING 5 LOCATIONS 5 ASSESSMENT 6 BOOK LIST 9
TIMETABLE 10/11
PRACTICAL PROJECTS 12 TITLES 12 PREPARING PRACTICAL PROJECT REPORTS 12 PROJECT MARK SHEET 14
SYNOPSES OF PRACTICAL PROJECTS 15 PROJECT 1. THE EFFECT OF GORSE BURNING ON THE CARBON STOCK OF BLACKFORD HILL 15 PROJECT 2. GERMINATION AND ESTABLISHMENT OF GORSE ULEX EUROPAEA ON BLACKFORD HILL 17 PROJECT 3. NATURAL REGENERATION IN HERMITAGE WOOD 20 PROJECT 4. THE IMPORTANCE OF EPILITHIC ALGAE FOR STREAM INVERTEBRATES 22 PROJECT 5. VARIATION IN THE ABUNDANCE OF TAR SPOT INFECTION ON SYCAMORE LEAVES 24 PROJECT 6. DISTRIBUTION OF SNAILS IN THE HERMITAGE OF BRAID 26 PROJECT 7. RELATIONSHIPS BETWEEN BRYOPHYTE GROWTH FORM AND HABITAT 28 PROJECT 8. DISTRIBUTION AND DIVERSITY OF SPECIES IN RELATION TO RABBIT GRAZING
ON BLACKFORD HILL 30 PROJECT 9. LEAF BREAKDOWN AND INVERTEBRATE COLONISATION IN STREAMS 32 PROJECT 10. DISTRIBUTION OF SEEDS UNDER DISTURBANCE IN THE HERMITAGE OF BRAID 34
CODE OF PRACTICE FOR FIELD STUDIES 36 GENERAL BEHAVIOUR 36 YOUR RESPONSIBILITIES FOR SAFETY 36 SAFETY PRECAUTIONS APPLYING TO ALL FIELD TRIPS 37 CLOTHING, FOOTWEAR & SAFETY GEAR 37 OCCUPATIONAL DISEASES 38 EMERGENCY PROCEDURES: FIRST AID 38 EMERGENCY PROCEDURES: WHEN LOST 39 EXPOSURE (HYPOTHERMIA) 40 GOING INTO THE FIELD ALONE 40
A FEW GUIDELINES ON EXPERIMENTAL DESIGN AND STATISTICAL ANALYSIS 41
GENERAL POINTS 41 SAMPLING 41 CONFOUNDING FACTORS AND EXPERIMENTAL BIAS 41 INTERPRETATION 41 DESCRIPTIVE STATISTICS 42
STATISTICS FOR HYPOTHESIS TESTING 43
APPENDIX 1. EXAMPLES OF FORMER EXAM PAPERS 46-58 APPENDIX II. MAPS 59 OWN WORK DECLARATION FORM 54
3
INTRODUCTION TO THE COURSE
Welcome Welcome to Principles of Ecology. For some of you, this will be your first introduction to the subject; others will have attended previous courses at school or University. We appreciate that students take this course for many different reasons; while some will be intending to specialise in ecology or a related discipline in their Honours year, others will be pursuing other interests. Our aim is to provide a varied and interesting course that will provide a solid grounding for those wishing to continue studying the subject in future years, while also providing a useful educational experience for those for whom this will be the only ecology course that they ever attend. The course is revised each year and we welcome feedback and ideas on how it might be improved. If you have any queries or suggestions, or face any difficulty with any aspect of the course, please feel free to contact the course organiser (preferably by email: [email protected]) or one of the teaching staff.
Course Synopsis Ecology is the scientific study of the relations of organisms to one another and to their surroundings. In this introductory course, we will focus specifically on examining the interactions that determine the distribution and abundance of organisms. We will explore current and historical patterns of plant and animal distribution and relate these patterns to characteristics of both the organisms and their environment. The course is grouped around five main themes:
• The ecophysiology animals
• The ecophysiology of plants
• The ecological niche
• Vegetation history and succession
• Changing abundance and distribution
Entry requirements
Either Origin and Diversity of Life or Environmental & Community Biology is recommended.
Aims and objectives
• To provide an introduction to the science of ecology, highlighting key concepts and theories.
• To provide practical experience, through a collaborative field project, of formulating and testing simple ecological hypotheses, developing skills in observation, experimental design, sampling, recording, statistical analysis and the writing of scientific reports.
Course Structure
The course consists of 27 lectures (50 minutes each), nine 3 hour practical sessions, and 3 hours of project presentation. The practical work involves a group field project undertaken in the Hermitage of Braid. Each team presents the results of their research to the class in a presentation session once projects are completed. Assessment is via an exam (2/3) and the practical write-up (1/3). For more details, see the Assessment section.
4
Practical Projects
Practicals will be based in Ashworth teaching laboratory number 1 and the KB Centre Level 3 PC lab. Most of the practical work will take place in the Hermitage of Braid, a local Nature Reserve near to the King's Buildings. Practicals are held on Mondays from 2pm – 5pm and are devoted to nine-week projects carried out in small groups. Statistics sessions will be run on some Mondays to support the project work – see the timetable for details of dates. The practical work will be organised and run by demonstrators who will also mark your final report.
In week 10 (Monday 21st November) parallel project presentations will be held from 2-5pm in: (i) the Crew Annexe room 4 and (ii) room 302 of the Crew Building. Each project group will give a short (15 minute) verbal presentation of the results and conclusions of the projects to colleagues and staff. Please check the WebCT Announcements or the Principles of Ecology notice board in the Crew Building during week 9 to find out where each project team will be making their presentation.
A hard copy of the project must be submitted to Helen McKeating, Undergraduate Office, room 211, Crew Building by 12 noon on Friday 25th November. Projects should also be submitted via WebCT by the same deadline.
NB. The "Practical Projects" section includes detailed instructions on how the final report should be written. Be sure to read them carefully.
Staff
Dr Gail Jackson, GeoSciences (Course Organiser). Room 217, Crew Building, 505436; [email protected]
Dr Patrick Walsh, Biological Sciences. Room 407, Ashworth Building, 505474; [email protected]
Dr Richard Ennos, Biological Sciences. Room 1.57, Ashworth Building, 505411; [email protected]
Dr Caroline Nichol, GeoSciences, The Crew Building, 507729; [email protected]
Prof Maurizio Mencuccini, GeoSciences, Room 216, The Crew Building: 505432; [email protected]
Dr Chris Ellis, The Royal Botanic Gardens Edinburgh 0131 248 2993; [email protected]
SYLVA Sylva was established in 1919, as part of the University’s Forestry and Natural Resources Department. It was published by the student society of the department and ran for 61 issues until 1998. This year, the student science journal Sylva was resurrected with the 2010 edition (No.63). As students of ecology and other natural sciences, you will find yourselves completing numerous pieces of work throughout the year on
various topics within this field of study. Why not submit your work for the next edition of Sylva? This provides you with a great opportunity to get your work published in a peer-reviewed journal – great for your own experience as well as your CV. For more information, please contact us via e-mail: [email protected]. We look forward to your submissions,
The Sylva Editorial Committee

5
Timing
Lectures
Monday 0900-0950 Lecture Theatre 100, Joseph Black Building Thursday 1000-1050 Lecture Theatre 201, Grant Institute Friday 1305-1355 Lecture Theatre 201, Grant Institute
Locations Lecture theatres are in the Joseph Black Building (Building 6, below) and Grant Institute (Building 9, below), labs are in the Ashworth laboratories (Building 13, below), and the Course Organiser and Secretary are located in the Crew Building (Building 5 below). Practical projects are in the Hermitage of Braid.
Important dates
Friday 25th Nov 2011 Deadline for practical report. Hand in by 12 noon to Helen McKeating,
Undergraduate Office, room 211, Crew Building. The exam date is not yet set. Check WebCT and/or Principles of Ecology notice board.
JCMB
Crew
N

6
Assessment In order to pass it will be necessary to obtain:
1. Not less than 40% in the degree examination 2. Not less than 40% in the practical report 3. An overall aggregate mark of 40% (in which the degree exam contributes 67% and the practical project
contributes 33%) Note that if you obtain less than 40% for the in-course component then you will automatically have failed the degree exam. The University Extended Common Marking Scheme will be used in all assessments. Marks for assessed coursework will be provided to students but are provisional and may be modified when considered at the Board of Examiners meeting in that year. To pass the course, you must obtain a mark of 40% (calculated according to the weightings given for in-course work and examination performance defined elsewhere) and you must obtain at least 40% in both the in-course component of assessment and the examination. In other words, a mark of less than 40% in the exam paper will lead to a fail in the degree examination, no matter how good your in-course assessment was, and vice-versa.
Exam You will sit the formal Examination in December. It comprises ten compulsory short answer questions, two taken from the material of each of the five course lecturers. Two essay style questions from a choice of five, one for each of the course lecturers, must then be answered. See examples of the past papers at the end of this Handbook or on WebCT. The exam is two hours long and it is recommended that one hour is spent answering the short answer questions and one hour answering the essay style questions.
Penalties for late hand-in of the practical report The practical report hand-in deadline is given in the course timetable. Late coursework will not be accepted without good reason, will be recorded as late and a penalty will be exacted. The penalty will be a reduction of the mark by 5% of the maximum obtainable mark per working day (e.g. a mark of 65% would be reduced to 60% if the hand-in is up to one day late). This applies for up to five working days (or to the time when feedback is given, if this is sooner), after which a mark of zero will be given.
Re-sit exams Students who fail the course due to low marks in the examination in December, but pass the coursework component, need only re-sit the examination component in August; the final mark will then be the aggregate of the course work and re-sit examination marks using the usual weighting. Students who pass the exam, but fail due to low marks in the coursework component, will be asked to submit new coursework for August, but need not re-sit the examination. In this case, however, the maximum coursework mark allowed is 40%. The final mark will then be the aggregate of the earlier exam mark and the new coursework mark. If you fail both the examination and the coursework components then you will need to both re-sit the exam and resubmit coursework.

7
Plagiarism The University has formal procedures for investigating and taking action on plagiarism, collusion (submitting a
piece of work produced jointly with another student as though it were entirely your own work) and other forms of cheating, at whatever stage of a candidate’s course, whether discovered before or after graduation (www.aaps.ed.ac.uk/regulations/Plagiarism/Intro.htm). If after investigation it is established that work submitted for assessment has been plagiarised to a significant extent, that will be permanently noted on the candidate’s record and zero marks will be awarded. The full text of the University’s policy, and a statement of the steps which the University may take in cases where a candidate uses, or is thought to have used, the work of another person or persons in his/her work, is given in the Examination Regulations and Guidelines 2007-2008. Experience has shown that there are many more cases of poor scholarship (with consequent reduced marks) than intentions to deceive. Hence, the project report should be accompanied by a completed plagiarism form as at the back of this Handbook as a reminder and will ask you to confirm that you have:
� Clearly referenced/listed all sources as appropriate � Referenced and put in “inverted commas” all quoted text (from books, web, etc.) � Given the sources of all pictures, figures, tables, data, etc. that are not your own � Not made any use of the report(s) or essay(s) of any other student(s) either past or present � Not sought or used the help of any external professional agencies for the work
� Acknowledged in appropriate places any help that you have received from others (e.g. fellow students, technicians, statisticians, external sources)
� Complied with any other plagiarism criteria specified in the course booklet
Copies of the form will be available from Helen McKeating so you don’t have to tear pages out of this booklet. All project reports should be submitted electronically to Helen McKeating ([email protected]) and as a hard copy by the deadline set. The electronic copy will be passed through the plagiarism detection software used by the University: Turnitin.com
Appeals 1) Course work If you wish to appeal against a mark that you have been given for course work, you should contact the Course Organiser as soon as possible. 2) Exam The procedure for appealing against a decision made by a Board of Examiners is set out in the University DRPS and in the Programme of the College of Science and Engineering. You are strongly advised to consult your Director of Studies before making an appeal, because he or she can approach the examiners on your behalf to investigate the circumstances, but this is not essential. You may appeal against a decision of the Board of Examiners (a) on the grounds of substantial information which for good reason was not available to the examiners when their decision was taken, or (b) on the grounds of alleged improper conduct of the examination
Staff-Student Liaison A number of students will be elected to a Staff-Student Liaison Committee in the first few weeks of the first term. This committee will meet on two occasions to discuss all aspects of the course. The first meeting will be during week 6 of semester 1. The second meeting will be after the course has been completed, in week 6 or semester 2. You should take your comments, criticisms, complaints and compliments to the student representatives. All constructive feedback is welcome. The staff are keen to take whatever action is reasonable and appropriate to ensure student satisfaction with the course. In addition, a formal Course Questionnaire will be placed on WebCT at the end of the course. This is an integral part of the University's teaching quality assessment and it is important that all students respond.

8
Students with Special Needs Any student with special needs, e.g. dyslexia, may identify him/herself privately to the Course Organiser, so that appropriate arrangements can be made. You may choose not to identify yourself, and this we respect.
Disabled Students We welcome disabled students (including those with specific learning difficulties such as dyslexia) and are working to make all our courses accessible. If you wish to talk to a member of academic staff about the course requirements and your particular needs please contact Sarah McAllister (Manager of the GeoSciences Teaching Organisation), GeoSciences, The Crew Building, Tel. 0131 650 4917, or email: [email protected].
You can also contact the Student Disability Service, 6 - 8 South College Street, Telephone 0131 650 6828 or email [email protected] and an Advisor will be happy to meet with you. The Advisor can discuss possible adjustments and specific examination arrangements with you, assist you with an application for Disabled Students' Allowance, give you information about available technology and personal assistance such as note takers, proof readers or dyslexia tutors, and prepare a Learning Profile for your School which outlines recommended adjustments. You will be expected to provide the Student Disability Service with evidence of disability - either a letter from your GP or specialist, or evidence of specific learning difficulty. For dyslexia or dyspraxia this evidence must be a recent Chartered Educational Psychologist's assessment. If you do not have this, the Disability Office can put you in touch with an independent Educational Psychologist.
Further information Further class information, including provisional marks for the practical project reports, will be posted on WebCT and on the Principles of Ecology notice board (opposite the Undergraduate Office in the Crew Building, room 211). Announcements may also be made from time to time by email. Please check your email and WebCT frequently.
Feedback Feedback on the various component of the course will be provided in the following ways: Project presentations: Immediately after the presentation has finished the member of staff supervising the presentations will give an initial response to the work and the quality of the presentation. In addition the presentations will be assessed by your peers. Each student audience member will be asked to fill in a tick box sheet assessing the various strengths and weaknesses of the presentation. Written constructive comments will also be requested. These sheets will be collated by the project demonstrator, who will pass them to the Course Organiser to mount on WebCT. This will be done as quickly as possible, so they can be used to inform the project write-up. Project reports: Your project demonstrators will mark your practical report. The demonstrator will each provide detailed written feedback on each report. If you feel this is unclear or insufficient, in the first instance please approach your demonstrator for clarification – and if you are still unclear, please contact the course organiser. Exam feedback: The examination will occur sometime in December. In January a feedback session will be organised when students are able to look at their exam paper and ask the lecturers any questions they may have. The exam scripts cannot be taken from the room.
Course Changes Last year the project hand-in date was set for two days after the project presentation session. In response to comments made on Course Evaluation forms the hand-in date this year has been set for four days after the project presentation date.

9
Book List
Textbooks provide essential background reading and backup for your lecture notes and course handouts. There is no single book list for this course, nor is there any single book which is adequate as a 'course text'. However, we recommend Begon, M., Townsend, C. R. & Harper, J. L. (2006) Ecology (4th edn.) as the best and most up-to-date Ecology text book available.
Each member of staff contributing to the course will provide an additional reading list including books and journal material. Problems can quickly arise with a large class and limited library resources - please do not hoard books. Essential texts will be put onto the Temporary Reserve shelf in the Darwin Library.
The following are generally useful as sources of first reference on many topics. They cost £20-35 each.
Begon, M., Townsend, C. R. & Harper, J. L. (2006). Ecology (4th edn). Blackwell Science, Oxford. (The recommended text for this course) Townsend, C.R., Begon, M. and Harper, J.L. (2006). Essentials of Ecology (2
nd Edition). Blackwell Publishing.
(Highly recommended). Colinvaux, P. (1993). Ecology 2. Wiley, New York. (Readable and very good on some aspects) Krebs, C. J. (1994 & 2001). Ecology. (4th & 5th edns). Harper Collins, New York. (Good on animal populations) Ricklefs, R. E. & Miller, G. L. (1999). Ecology. (4th edn). Freeman, New York.
The following will be useful for particular parts of the course:
Patrick Walsh’s lectures: Animal ecophysiology
Willmer, P, Stone, G. & Johnston, I. (2004). Environmental Physiology of Animals. WileyBlackwell
Schmidt-Nielsen, K. (1984). Scaling: why is animal size so important? Cambridge University Press, Cambridge. Eckert. Animal Physiology.
Caroline Nichol’s lectures: Plant ecophysiology
Taiz, L. & Zeiger, E. (2002). Plant Physiology (3rd edn). Sunderland, Mass.
Larcher, W. (2003). Physiological Plant Physiology (4th edn). Springer, Berlin
Schulze, E. D., Beck, E., & Müller-Hohenstein, K. (2005). Plant Ecology. Berlin/Heidelberg: Springer. Chris Ellis’ lectures: The ecological niche Tokeshi, M. (1999) Species Coexistence. Blackwell Science, Oxford. Chase & Liebold (2003) Ecological Niches. University of Chicago Press, Chicago. Krebs (2001) Ecology. Benjamin Cummings, San Francisco. Gail Jackson’s lectures: Vegetation history and succession
Ingrouille, M. (1995). Historical Ecology of the British Flora. Chapman & Hall, London.
10
Maurizio Mencuccini’s lectures: Changing abundance and distribution E. I. Newman (2000). Applied Ecology and Environmental Management. Blackwell Science. The European Nitrogen Assessment. Sources, Effects and Policy Perspectives. Edited by M Sutton et al., 2011. Cambridge University Press. Richard Ennos’ statistics sessions and the practical project: Fowler, J. Cohen, L. & Jarvis, P. (1998) Practical Statistics for Field Biology. 2nd Edition. John Wiley, Chichester. Ennos, R. (2007) Statistical and Data Handling Skills in Biology. Pearson, Harlow.
Grafen, A & Hails, R (2002) Modern statistics for the life sciences. Oxford University Press, Oxford. £22.99
Sokal, R. R. & Rohlf, F. J. (1969) Biometry. Freeman, San Fransisco.
Ruxton, G. D. & Colegrave, N. (2006) Experimental Design for the Life Sciences. 2nd Edition. Oxford University Press, Oxford.
Some more general books worth reading:
The Ages of Gaia by James Lovelock Guns, Germs and Steel by Jared Diamond The voyage of the Beagle by Charles Darwin
11
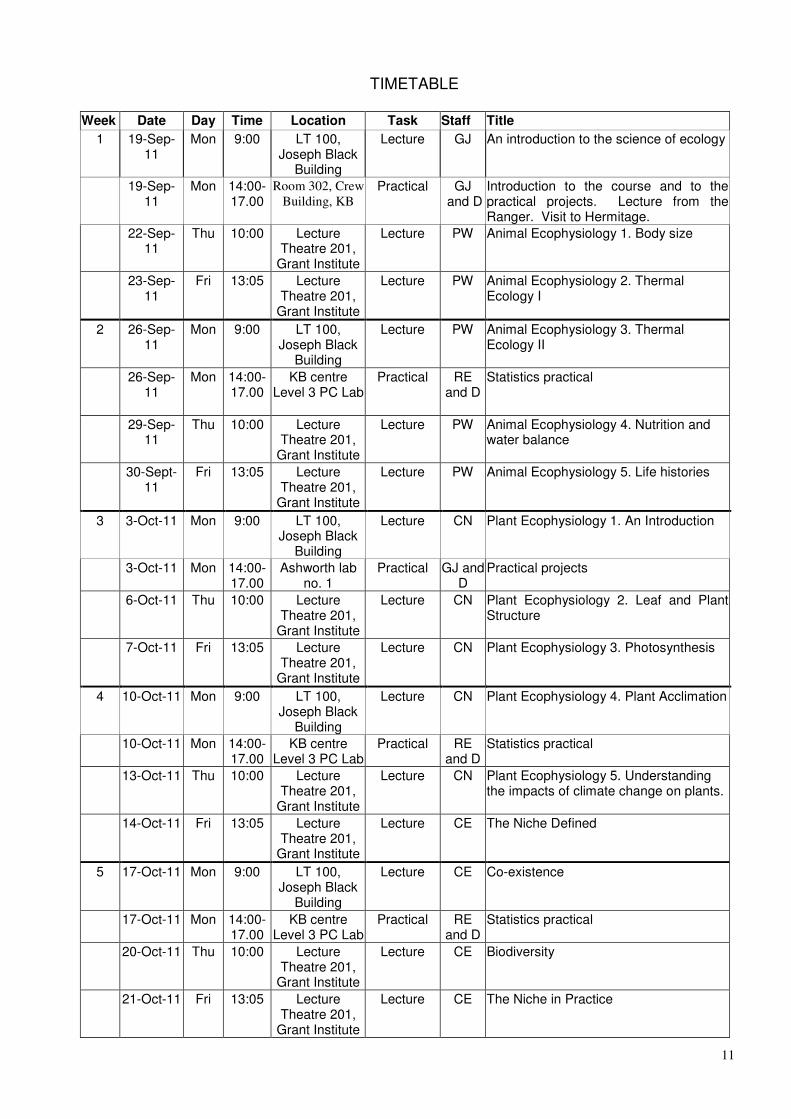
TIMETABLE
Week Date Day Time Location Task Staff Title
1 19-Sep-11
Mon 9:00 LT 100, Joseph Black
Building
Lecture GJ An introduction to the science of ecology
19-Sep-11
Mon 14:00-17.00
Room 302, Crew
Building, KB Practical GJ
and D Introduction to the course and to the practical projects. Lecture from the Ranger. Visit to Hermitage.
22-Sep-11
Thu 10:00 Lecture Theatre 201,
Grant Institute
Lecture PW Animal Ecophysiology 1. Body size
23-Sep-11
Fri 13:05 Lecture Theatre 201,
Grant Institute
Lecture PW Animal Ecophysiology 2. Thermal Ecology I
2 26-Sep-11
Mon 9:00 LT 100, Joseph Black
Building
Lecture PW Animal Ecophysiology 3. Thermal Ecology II
26-Sep-11
Mon 14:00-17.00
KB centre Level 3 PC Lab
Practical RE and D
Statistics practical
29-Sep-11
Thu 10:00 Lecture Theatre 201,
Grant Institute
Lecture PW Animal Ecophysiology 4. Nutrition and water balance
30-Sept-11
Fri 13:05 Lecture Theatre 201,
Grant Institute
Lecture PW Animal Ecophysiology 5. Life histories
3 3-Oct-11 Mon 9:00 LT 100, Joseph Black
Building
Lecture CN Plant Ecophysiology 1. An Introduction
3-Oct-11 Mon 14:00-17.00
Ashworth lab no. 1
Practical GJ and D
Practical projects
6-Oct-11 Thu 10:00 Lecture Theatre 201,
Grant Institute
Lecture CN Plant Ecophysiology 2. Leaf and Plant Structure
7-Oct-11 Fri 13:05 Lecture Theatre 201,
Grant Institute
Lecture CN Plant Ecophysiology 3. Photosynthesis
4 10-Oct-11 Mon 9:00 LT 100, Joseph Black
Building
Lecture CN Plant Ecophysiology 4. Plant Acclimation
10-Oct-11 Mon 14:00-17.00
KB centre Level 3 PC Lab
Practical RE and D
Statistics practical
13-Oct-11 Thu 10:00 Lecture Theatre 201,
Grant Institute
Lecture CN Plant Ecophysiology 5. Understanding the impacts of climate change on plants.
14-Oct-11 Fri 13:05 Lecture Theatre 201,
Grant Institute
Lecture CE The Niche Defined
5 17-Oct-11 Mon 9:00 LT 100, Joseph Black
Building
Lecture CE Co-existence
17-Oct-11 Mon 14:00-17.00
KB centre Level 3 PC Lab
Practical RE and D
Statistics practical
20-Oct-11 Thu 10:00 Lecture Theatre 201,
Grant Institute
Lecture CE Biodiversity
21-Oct-11 Fri 13:05 Lecture Theatre 201,
Grant Institute
Lecture CE The Niche in Practice

12
6 24-Oct-11 Mon 9:00 LT 100, Joseph Black
Building
Lecture GJ Vegetation history: The post glacial period. Plant response to a changing climate.
24-Oct-11 Mon 14:00-17.00
Ashworth lab no. 1
Practical D Practical projects
27-Oct-11 Thu 10:00 Lecture Theatre 201,
Grant Institute
Lecture GJ Vegetation change throughout the Flandrian
28-Oct-11 Fri 13:05 Lecture Theatre 201,
Grant Institute
Lecture GJ The present status of British vegetation
7 31-Oct-11 Mon 9:00 LT 100, Joseph Black
Building
Lecture GJ Primary Succession
31-Oct-11 Mon 14:00-17.00
Ashworth lab no. 1
Practical D Practical projects
3-Nov-11 Thu 10:00 Lecture Theatre 201,
Grant Institute
Lecture GJ Secondary Succession
4-Nov-11 Fri 13:05 Lecture Theatre 201,
Grant Institute
Lecture GJ Small scale vegetation dynamics
8 7-Nov-11 Mon 9:00 LT 100, Joseph Black
Building
Lecture GJ How to write up your project
7-Nov-11 Mon 14:00-17.00
Ashworth lab no. 1
Practical D Practical projects
10-Nov-11
Thu 10:00 LT 201, Grant Institute
Lecture SB Careers session
11-Nov-11
Fri 13:05 LT 201, Grant Institute
Lecture PW and CN
Revision session
9 14-Nov-11
Mon 9:00 LT 100, Joseph Black
Building
Lecture MM The (multiple) influences of human societies on plant and animal distribution.
14-Nov-11
Mon 14:00-17.00
KB centre Level 3 PC Lab
Practical RE and D
Project data analysis
17-Nov-11
Thu 10:00 Lecture Theatre 201,
Grant Institute
Lecture MM Modern human influences: tropical deforestation and sustainable forest management.
18-Nov-11
Fri 13:05 LT 201, Grant Institute
Lecture MM Modern human influences: the alteration of landscape processes.
10 21-Nov-11
Mon 9:00 LT 100, Joseph Black
Building
Lecture None None
21-Nov- 11
Mon 14:00-17.00
Room 4 Crew Annexe and
302 Crew Blg
Presentations GJ and CN
Project presentations. Class will be split into two groups, one in each lecture theatre.
24-Nov-11
Thu 10:00 LT 201, Grant Institute
Lecture GJ, CE MM
Revision session
25-Nov-11
Fri 12:00 Crew 211 Deadline HMcK Project hand-ins
12 tba EXAM Date not set. Check Ecology notice board and WebCT
PW= Patrick Walsh; GJ=Gail Jackson; CN=Caroline Nichol; RE = Richard Ennos; CE= Chris Ellis; MM Maurizio Mencuccini; HMcK=Helen McKeating; D=demonstrators

13
PRACTICAL PROJECTS The practical projects will be selected from the following list. No more than 12 people will be allowed to do any one project and projects with fewer than 3 people will be cancelled. Groups containing 7 or more people will be split into 2 groups. Please select your choice of project in WebCT. 1. The effect of gorse burning on the carbon stock of Blackford Hill 2. Germination and establishment of gorse on Blackford Hill 3. Natural regeneration of trees in Hermitage Wood 4. Importance of epilithic algae as food for stream invertebrates 5. Variation in the abundance of tar spot infection on sycamore leaves 6. Distribution of snails in woodland leaf litter 7. Relationship between growth form and habitat in bryophytes 8. Distribution and diversity of species in relation to rabbit grazing on Blackford Hill 9. Leaf breakdown and invertebrate colonisation in streams 10. Distribution of seeds under disturbance in the Hermitage of Braid
Preparing Practical Project Reports
Reports on practical work serve several functions:
1. Practice in scientific writing of the style found in research journals, i.e. concise and exact 2. Practice in describing and illustrating methods, results and analyses clearly and unambiguously 3. Providing notes for later revision to remind you about the exercise 4. Enabling the Course Organiser to ensure that you have understood the exercise, and to contribute a
mark for your continuous assessment Any report on practical scientific work should be divided into the following main sections which must be strictly adhered to, though further division into sub-sections may be appropriate. This system (with only minor variations) is used by nearly all scientific journals. Marks will be given separately for each section of the report.
1. Introduction This should clearly state the aims of the exercise, and provide the background information necessary to introduce the topic and explain the purpose of the exercise. You will need to refer to published work of a similar nature in order to set the context for your research. Cite references. By the end of the Introduction your reader should know what the project is about, what questions you are going to answer, what approach you are going to take and why those questions are important and interesting.
2. Methods Concise descriptions (with diagrams if necessary) of the Study Area, the Materials and the Methods used. These should be adequate to enable a reader to know precisely what you did and to enable him/her to repeat the exercise exactly if he/she so wishes. Describe the conditions under which experiments were carried out, noting any circumstances which could conceivably alter your results or their interpretation. Do not include trivial information that has no direct importance to the exercise.
3. Results A brief written description of the results which draws particular attention to the most important and interesting features of the data. The Results must be descriptive but must NOT include any "discussion", "opinions" or "interpretation" of the observations; give only a factual account of what you actually observed. The description must refer to data in numbered tables, graphs, and figures presented separately.
You will not yet have done much statistics, but you are expected to be able to demonstrate that your results are meaningful and do not just represent chance events or random sampling error. Discuss the analysis of results with the demonstrators and staff. You should, at least by the end of this year, understand the statistical testing of hypotheses, and know how to use chi-squared, correlation, regression and t-tests where appropriate. If you know how to use Minitab for analysing your data, then do so. If you do not feel confident of data analysis you should discuss methods with the demonstrators.
14
All of the quantitative results of the exercise should be summarised in the form of Tables and Figures (graphs or diagrams). Each must have a completely self-explanatory legend. These should be numbered (Table 1, Figure 1, etc.) and be referred to by the written section of the Results. It is not necessary to include masses of raw data as part of the report where these are also presented in graphs or as summary statistics, but they can be included as an Appendix. The Appendix can also include intermediate steps in the calculations of any statistical analyses.
4. Discussion This is the most important part of the report and includes the interpretation of the results. You should explain the ecological meaning, significance and implications of the observations and put them into a wider context. Cite references. Do your conclusions agree with your expectations, or with other people's results/theories in the published literature? If not, then why not? Are the theories wrong, or are your observations inadequate? What errors may have influenced the results, either through systematic bias or by random sampling error? How could the experimental design be improved? What new experiments could be done to take the subject further? What are the possible implications of your conclusions? How might the information be used in the real world?
5. References All sources of information should be acknowledged by including the author's name and date of publication in the text at the point where you use the information. The full reference - author(s), date, title, and either journal, volume and page numbers, or publisher and place of publication for books - should be given in a list at the end of the report. For chapters in multi-author books give the chapter author(s), date, chapter title, book title, editor, chapter page numbers, publisher and place of publication. The Journal of Ecology or Journal of Animal Ecology give a good standard to follow, for example: 'Legg (2008) claimed that the Earth is flat and others have suggested that it is actually a cube (Ennos & Jones 2009). Since then, however, recent evidence has shown that life is actually supported on the inner surface of a hollow sphere with the Sun at the centre (Jones et al. 2009).'
References • Ennos, R. A. & Jones, P. J. (2009). A third dimension to the Legg theory of Flat Earth. A Square World
(ed. by R. A. Ennos), chapter 5, pp. 234 - 301. Earthscan, London. • Jones, P. J., Ennos, R. A. & Legg, C. J. (2009). Curvature of light supports the Inverse Ping-Pong Ball
theory. Annals of Astrophysics 23, 12 - 68. • Legg, C. J. (2008). Four Corners of the World. Flat Earth Society, Land's End. 152 pp. If you must cite information on the Web (e.g. as a source of unpublished data) then give as much information as possible using the following format:
Author/editor, Year. Title [online]. (Edition). Place of publication: Publisher (if ascertainable). Available from: URL [Accessed Date].
For example:
Bournemouth University Library (undated) Appendix E - Summary of Citation Formats for Internet Sources. University of Bournemouth. Available from: http://www.bournemouth.ac.uk/using_the_library/html/harvardsystinte.html [Accessed 29/10/09].

15
Style of writing Use the style of writing that you see in the scientific journals. Avoid unnecessary jargon. Make sentences clear and concise. Avoid a journalistic style or flowery language which tends to overstate the case and exaggerate with metaphors. Your reader wants to get the maximum precise information for minimal effort; she/he is not reading just for idle entertainment. There is no word limit but, above all, be brief and concise. Exclude all irrelevant or trivial material. Include all essential material that may influence the interpretation of your results. Use the minimum words compatible with including all the essential information. You should clearly separate indisputable fact (Results) from your subjective interpretation of those facts (Discussion). Give sufficient discussion to demonstrate that you understand the purpose of the exercise and the full significance of the results
Marking See the timetable for hand-in deadlines. Late submission of the report will result in penalties. Extenuating circumstances will only be considered if supported by a letter from your Director of Studies. With group projects it is inevitable that the methods and data tables will have a lot in common. Please note that, for assessment purposes, the Introduction, descriptions of Results and Discussion sections must be entirely your own work. Plagiarism is a serious offence. Please do not lend your report to other team members, as this encourages plagiarism and can risk your implication in any plagiarism case that arises.
See the section on Plagiarism
The markers will be guided by a form when marking your work. You should use this form as a guide to writing the report if you want to score high marks.
Project mark sheet
0 1 2 3 4 5
Title Informative but concise
Introduction Statement of objectives
Background information necessary to set the scene
Methods Site description
Materials used (where this is critical to the method)
Methods described adequately
Results Statement summarising the main features of the data
Use of tables, graphs and figures
Self-explanatory legend to tables, graphs and figures
Assessment of errors
Statistical validation of results
Discussion Interpretation of the results
Clear statement of conclusions
Comparison of results with expectations/published theories
Discussion of practical consequences of conclusions
Criticism of experimental design
Suggestions for further study
References Adequate use of literature
Correct citation in text
Correct listing at end of report
Overall presentation
Concise style of writing
Neatness
Avoidance of trivial detail
Final mark (NB. This is not a simple mean of the above marks)

16
Verbal Presentation of Practicals
At the end of the project each group will be asked to make a short verbal presentation of its findings to the lecturers and to the rest of the class. You will need to prepare a 15 minute talk and consider how you will display the results. Every member of the group should give a short section of the talk but all members of the group should be prepared to answer questions concerning any aspect of the project. These presentations will be assessed by your peers.
SYNOPSES OF PRACTICAL PROJECTS
Project 1. The effect of gorse burning on the carbon stock of Blackford Hill
Introduction Gorse (Ulex europaeus) is a spiny bush, and is a member of the pea family (subfamily Fabaceae). It is very well adapted to stand-replacing fires, and is highly flammable. The plant grows rapidly with 1 year old stands capable of producing around 1.2 tonnes of dry biomass per hectare per year. Stem diameters may increase by as much as 5 mm per year, with a height increase of 20 cm per year.
With such rapid growth, gorse is often managed by burning, usually on a 10-15 year cycle. This maintains habitat for nesting birds, by diversifying the age structure. When stands are burnt, some proportion of the total aboveground biomass is lost to the atmosphere as CO2. Stand rapidly recover from fires, as they have a number of adaptations to exploit such disturbances: Seed pods are opened by fires, and there is strong evidence that germination is triggered by the heat.
This project aims to quantify the potential carbon losses from burnt gorse stands on Blackford Hill, and to examine if managed stands represent a source or sink of carbon in the long term.
Questions Consider some of the following questions
1. How much carbon is stored in the existing gorse stands on Blackford Hill? 2. What proportion of this carbon is lost on burning? 3. Given the rapid regeneration of gorse stands after fires, does management by burning constitute a long
term source or sink of carbon? Research Objectives Decide on a specific question or questions that you would like to answer. Although part of your answer will be descriptive, try and express each question and answer in terms of a Null Hypothesis (H0).
For example, your H0 might be that the long term emissions due to a gorse burning are zero, as the release is balanced by new growth.
What sort of data do you need to collect in order to answer your question and test the null hypothesis? Will it be possible to collect the required data?
Think about your question and the potential outcomes in terms of underlying ecological explanations.
Methods Familiarise yourself with the available habitat and decide on the null hypothesis you wish to examine. Then identify suitable sites for the study and devise an appropriate sampling scheme.
An estimate of the carbon content ot the gorse bushes can be made by calculating the biomass of the bushes. This is achieved by calculating the volume of the bush and multiplying by the dry density of the gorse. An accurate measurement of the carbon lost on burning can be made by combustion in a furnace.

17
You should consider how to obtain a representative sample of gorse bushes on Blackford Hill, the size of the sample, and how samples should be selected and distributed. How many bushes will be measured? How will bushes be selected? Ideally they should form an unbiased representation of the population (i.e. all the bushes on Blackford Hill, about which we wish to draw conclusions from the data). You must also devise a way to standardise your sampling procedure.
Points to Consider 1. If you estimate a parameter, such as dry density, how will you indicate the precision of your estimate? 2. How do I proceed with sampling, and what do I need to measure? 3. How do I choose which bushes to sample? 4. How can I scale up from the bushes sampled to the whole of Blackford Hill? 5. What is the appropriate plot size and what sort of sampling scheme should I follow? What you will learn about Methods of estimating biomass and carbon storage of a habitat The role of fire in the carbon cycle Regeneration of gorse patches The design of sampling surveys and experiments The statistical analysis of results
Suggested Equipment Notebooks and pencils 30 m measuring tapes Callipers Secateurs Foil trays Precision balance Drying oven Heat proof mats Methylated spirits Matches
Bibliography Egunjobi, J. K. (1971). Ecosystem Processes in a Stand of Ulex Europaeus L.: I. Dry Matter Production, Litter
Fall and Efficiency of Solar Energy Utilization. Journal of Ecology, 59: 31 - 38 Jacobson, M. Z. (2004). The short-term cooling but long-term global warming due to biomass burning. Journal
of Climate, 17: 2909 - 2926 MAFF (1992). The heather and grass burning code. Available online. Zouhar, K. (2005). Ulex europaeus. In: Fire Effects Information System, [Online]. U.S. Department of
Agriculture, Forest Service, Rocky Mountain Research Station, Fire Sciences Laboratory (Producer). Available: www.fs.fed.us/database/feis/ (2006, April 21).
18
Project 2. Germination and establishment of gorse Ulex europaea on Blackford Hill
Introduction Gorse Ulex europaea is a vigorous plant of waste land, but may also become a pernicious weed of agricultural land. It occurs in patches over most of the Edinburgh hills. These patches are frequently burned, either accidentally, deliberately, or maliciously. Following moderate fires gorse normally re-grows rapidly both from seeds and from buds at the bases of the charred stems where litter has protected the stem bases from the heat of the fire. Does fire control gorse, or cause the gorse to spread and become even more of a pest?
Gorse, like several other plant species in fire-prone habitats may produce a very large bank of seeds lying dormant in the soil. The establishment of large seed banks allows a plant not only to distribute itself spatially but also temporally. Large quantities of seeds are held in the soil and may germinate in the future following disturbance. A dense carpet of seedlings can often be seen soon after a fire, but what is it that breaks the dormancy and causes them to germinate so quickly? Fire severity describes the impact of a fire and the consumption and heating of litter and soil can interact with seed bank size and viability to determine how well gorse regenerates following burning.
Questions There are several questions one might ask about the way gorse responds to fire.
1. Why do gorse seedlings appear to be so abundant just after a fire? Is the germination of seeds stimulated by fire? If so, then what feature of the fire is important to break the seed dormancy? How do seeds respond to raised temperatures and how does this vary with exposure time? Do seeds respond to the increase in light levels at the soil surface? Do the seeds actually germinate in large numbers everywhere, but are only conspicuous on the bare ground exposed by fire?
2. Can the history of gorse areas be determined by examining the depth and size of seed banks at different levels within the soil? Is there evidence that areas currently covered in grass were once dominated by gorse? How well are gorse seeds distributed in the soil, how does the viability of the soil seed bank change over time and what is likely to be the significance of this in relation to a fire event?
3. Do the young sprouts from burnt stem bases originate from a particular type of stem? What is the diameter (age) of stems which sprout most vigorously? Do the sprouts only come from stems protected from the fire by a particular depth of litter? Could the regeneration of gorse be manipulated by controlled burning or gorse at a particular age, or in young stands with relatively little protective litter?
4. Are the patches of gorse expanding on the hills of Edinburgh? Can aerial photographs be used to determine changes in the number and size of gorse patches over the last 40 years?
Research Objectives Decide on a specific question or questions that you would like to answer. Although part of your answer will be descriptive, try and express each question and answer in terms of a Null Hypothesis (H0).
For example, your H0 might be that germination success of gorse seeds from the litter layer is the same as the success of older seeds buried deeper in the soil.
What sort of data do you need to collect in order to answer your question and test the null hypothesis? Will it be possible to collect the required data?
Think about your question and the potential outcomes in terms of underlying ecological explanations. Is it possible to devise a survey of the distribution of gorse seedlings on Blackford Hill to test any of the above ideas? Can you devise simple laboratory or glasshouse experiments to test whether fire stimulates germination? Can you recommend particular ways to control gorse by determining the age, or stage of development of stands at which it should be burnt? Methods Having decided on the hypotheses you wish to examine, devise an appropriate sampling scheme or experimental setup. If sampling, you must identify suitable study locations. Will 'controls' will be necessary against which to compare the effects of experimental treatments?

19
Some simple designs could be: a) aim to get two columns of numbers representing some measured variable in two situations. These might, for example, represent seedling density within several quadrats in both burned and unburned habitat. b) aim to get a table showing number of observations in different categories for one or more situation. For example, the numbers of germinated and ungerminated seeds after exposure to different treatments. Many other designs are possible.
You must consider the size and nature of individual sample units, the size of the sample and how samples or experimental treatments should be distributed. Considering the example H0 above: will a sampling unit be an individual seed or a pot of seeds; will number of replicates be number of seeds or number of pots?; how will the seeds be chosen - ideally they should be an unbiased representation of the population (i.e. all the seeds we wish to draw conclusions about from our results). You must also decide on a way to standardise your sampling procedure.
Gorse seeds are fairly large and can be extracted from soil by sieving. Seedlings are easy to identify from the large size of the cotyledon leaves, though note that the early true leaves are quite different in appearance from those on mature plants.
You are unlikely to be able to do experiments on germination out of doors at this time of year. You could, however, bring seeds or soil into the laboratory where some germination should occur in an incubator within about three or four weeks. To simulate the temperature effect of a passing fire, you could bake moist soil in a muffle furnace for a couple of minutes, or heat loose seeds in an oven at, say, 60 - 90 degrees.
Points to consider 1. As germination may take several weeks, any experiments on germination will have to be set up very
early in the project - field observations can be done later. Germination trials should use more than 100 seeds in each treatment.
2. How will you show that your results represent 'significant' effects and not just chance effects due to sampling error? If you have a Null hypothesis, can you test it statistically?
3. If you estimate a parameter such as average stem thickness, how will you indicate the precision of your estimate?
4. Does the number of seedlings present at any site reflect the dispersal of seed, the survival of seed in the soil once dispersed, the conditions stimulating germination, the survival of seedlings, or your ability to find seedlings amongst other vegetation?
5. Young shoots of gorse are very palatable to rabbits and other herbivores. What you will learn about Seed ecology and biology of germination The importance of microsite and seedling establishment in vegetation dynamics Ecology of fire Experimental design Testing of null hypotheses
Suggested Equipment Note book, pencil Quadrat (10 x 10 cm, 25 x 25 cm, 50 x 50 cm or 1 x 1 m) Marker pen for labelling samples Small seed trays with potting compost, or Petri dishes and filter paper for germination tests Metal trays for use in muffle furnace Aluminium foil for enclosing Petri dishes in dark germination experiment Soil thermometer for measuring soil temperatures pH meter, buffers, sample tubes, deionised water Range of soil sieves

20
Bibliography Fenner, M. (1985). Seed Ecology. Chapman & Hall, London. Rolston, M. P. & Talbot J. (1980). Soil temperature and regrowth of gorse burnt after treatment with
herbicides. New Zealand Journal of Experimental Agriculture, 8, 55-61. Ivens, G. W. (1983). The influence of temperature on germination of gorse (Ulex europaeus L.). Weed
Research, 23, 207-216. De Luis M., Baeza M. J., Raventos J. & Gonzalez-Hidalgo J. C. (2004): Fuel characteristics and fire behaviour
in mature Mediterranean gorse shrublands. International Journal of Wildland Fire, 13, 79-87. De Luis M., Garcia-Cano M. P., Cortina J. et al. (2001): Climatic trends, disturbances and short-term vegetation
dynamics in a Mediterranean shrubland. Forest Ecology and Management, 147, 25-37. Neary D. G., Klopatek C. C., DeBano L. F. & Ffolliott P. F. (1999): Fire effects on belowground sustainability: a
review and synthesis. Forest Ecology and Management, 122, 51-71. Legg, C. J. (1995). Heathland dynamics: a matter of scale. (Eds Thompson, D. B. A., Hester A. J. and Usher M.
B.) Heaths and Moorlands: Cultural Landscapes, 117-134. HMSO, Edinburgh. Lee W. G., Allen R. B. & Johnson P. N. (1986): Succession and dynamics of gorse (Ulex europaeus L.)
communities in the Dunedin Ecological District South Island, New Zealand. New Zealand Journal of Botany, 24, 279-292.

21
Project 3. Natural Regeneration in Hermitage Wood
Introduction Trees may produce abundant seeds yet fail to reproduce themselves. Often, seedlings fail to develop in the shade of the parent trees such that when one tree falls over it will be replaced by a seedling of a different species. Possible reasons for failure include (i) infertile seeds, (ii) seed predation, (iii) germination in an unfavourable microsite, (iv) predation of seedlings and browsing of saplings.
You will investigate regeneration of tree species in the wood and try to identify causes for failure of regeneration. Species investigated should include oak, ash, beech, elm and sycamore. Attempt to identify patterns of change in the species composition that would occur if the woodland were left unmanaged.
Questions Consider some of the following questions:
1. What is the age structure of the tree population? Is there any evidence of successful regeneration in the past?
2. What is the density of seeds / nuts / fruits on the ground under different canopy species? What is the density of different seedling species under different canopy species?
3. Is seedling or sapling density related to the openness of the site? Seedling/sapling success may be influenced by available light intensity and competition with ground vegetation.
4. Can you determine which species is likely to replace any particular canopy tree should it fall down? If so, then knowing the numbers of each species of canopy tree at present, can you predict the composition of the woodland in the next generation?
Research Objectives Decide on specific question(s) that you would like to answer. Although part of your answer may be descriptive, try and express each question in the form of a testable Null Hypothesis (H0).
For example, your H0 might be that seedling density under oak canopy does not differ from that under beech canopy.
What sort of data do you need to collect in order to answer your question? Is it possible to devise a survey of seeds, seedlings, saplings or trees to test any of the above ideas?
Think about your question and the potential outcomes in terms of underlying ecological explanations.
Methods Having decided on the hypotheses you wish to examine, find a suitable location for the study and devise an appropriate sampling scheme.
Some simple designs could be: a) aim to get two (or more) columns of numbers representing some measured variable in two (or more) situations. These might, for example, represent seedling density under different canopy types. b) aim to get two columns of numbers representing two variables measured for each sampling unit. For example, the seedling density and % canopy cover at several sampling locations. Many other designs are possible.
You must consider the size and nature of individual sample units, the size of the sample and how samples or experimental treatments should be distributed. Considering the example H0 above: if a sampling unit was to be a quadrat, what size should it be; how many quadrats would you sample under each canopy type; how will the quadrats be distributed under the canopy types - ideally they should be an unbiased representation of the population (i.e. all the canopy area we wish to draw conclusions about from our results). You must also decide on a way to standardise your sampling procedure.
Tree girth, measured with girth tapes, can be used as a surrogate for age. Light intensity can be measured with a light meter.

22
Points to consider 1. How will you show that your results represent 'significant' effects and not just chance effects due to
sampling error? If you have a Null hypothesis, can you test it statistically? 2. If you estimate a parameter such as average seedling density, how will you indicate the precision of
your estimate? 3. How will you define a canopy tree, a sapling, a seedling? How will you identify the seedlings of trees
(note that some may have lost all their leaves before you finish)? How will you identify the seeds of different tree species?
4. How will you obtain meaningful measures of the light environment in a wood when the light intensity outside the wood is changing by the minute with changing cloud cover?
What you will learn about • The identification of tree species • Natural regeneration in forests • Seed ecology • Simple models of succession • The design of sampling surveys and experiments • The statistical analysis of results Suggested Equipment • Notebooks, pencils, hand lens • 30 m measuring tapes • Tree girth tapes • 1 m x 1 m quadrats • Light meter • Soil sieves of a selection of sizes • Books for tree identification
Bibliography Cousens, J. (1974). An Introduction to Woodland Ecology. Oliver & Boyd, Edinburgh. Horn, H. S. (1975). Forest Succession. Scientific American, 232, 90 - 98 Horn, H. S. (1975). Markovian properties of forest succession. Ecology and Evolution of Communities (ed.
Cody, M. L. & Diamond, J. M.) Harvard University Press, Cambridge, Mass.

23
Project 4. The importance of epilithic algae for stream invertebrates
Introduction The surface of stones in many streams are covered with a layer of epilithic algae (epi = upon; lithos = stone). This algal layer is an important food source for many aquatic invertebrates that graze on stone surfaces. Any environmental factors that influence the growth of algae, such as light, will also influence the distribution of grazing invertebrates. The Braid Burn, as it flows through the Hermitage, passes first through a narrow valley that is well shaded by numerous tall trees and then through a much more open area.
This project aims to determine which invertebrate groups are commonly associated with epilithic algae and to investigate the effect of different light levels on algal growth and, consequently, the density and diversity of invertebrates using this resource.
Questions There are many questions one might ask regarding epilithic algae and invertebrates, such as:
1. Is algal abundance and growth rate influenced by light levels? 2. Which invertebrate groups are commonly associated with epilithic algae? 3. Is abundance and composition of stream fauna related to algal abundance? 4. Are there differences in stream fauna between shaded and open areas of the valley? 5. How long does it take for algae and animals to recolonise bare surfaces? Research Objectives Decide on a specific question or questions that you would like to answer. Although part of your answer will be descriptive, try and express each question in the form of a testable Null Hypothesis (H0).
For example, your H0 might be that algal growth rate is not related to light intensity.
What sort of data do you need to collect in order to answer your question? Will it be possible to collect the required data? Is it possible to conduct a survey of epilithic algae and/or aquatic invertebrates to test any of the above ideas? Can you devise simple experimental manipulations to examine the relationships between sunlight, algae and invertebrates?
Think about your question and the potential outcomes in terms of underlying ecological explanations.
Methods Many stream invertebrates that are commonly found on stone surfaces have well developed escape behaviours to avoid predators. Once disturbed, these animals usually move around to the underside of stones making it virtually impossible to observe them feeding. It is possible, however, to sample these animals by placing a net downstream of a target stone and gently rubbing all the animals off the entire stone and into the net. You may want samples of the entire stream fauna, not just that on stone surfaces, and these can be collected by kick sampling. Many of the animals can be identified to a fairly detailed level whilst still alive; only a representative few need to be preserved for identification. Respect the animals and return as many as possible to the stream.
The entire algal covering of a stone can be removed by scrubbing with a wire brush. By scrubbing a large number of stones and sampling them for animals over a long time period, you can observe the rate at which algae recolonise the stone and animals return to feed. Stones can also be 'transplanted' from shaded areas of the stream to more open areas, and vice versa. Measuring algal abundance directly is difficult. One way to estimate algal growth in various parts of the stream and over various time intervals is to put clean microscope slides in the water and examine the intensity of 'colour' after some time.
Having decided on the hypotheses you wish to examine, find a suitable location for the study and devise an appropriate sampling scheme or experimental setup. Will 'controls' will be necessary against which to compare the effects of experimental treatments?
Some simple designs could be: a) aim to get two (or more) columns of numbers representing some measured variable in two (or more) situations. These might, for example, represent epilithic algal abundance in 'open' and 'shaded' locations. b) aim to get two columns of numbers representing two variables measured for each sampling unit. For example, the algal abundance and light intensity at several sampling locations. Many other designs are also possible.

24
You must consider the size and nature of individual sample units, the size of the sample and how samples or experimental treatments should be distributed. Considering the example H0 above: if a sampling unit was to be a stone, should stone size be kept constant and what size should this be?; how many stones would you sample; how would the stones be distributed in the stream - ideally sampling units should be an unbiased representation of the population (i.e. all the stones we wish to draw conclusions about from our results). You must also decide on a way to standardise your sampling procedure?
Points to consider 1. How will you show that your results represent 'significant' effects and not just chance effects due to
sampling error? If you have a Null hypothesis, can you test it statistically? 2. If you estimate a parameter such as average algal abundance, how will you indicate the precision of
your estimate? 3. How big is a stone? Very small stones are unstable and can get turned over even during small rain
showers. Very big stones can cause back problems. Experimental stones should all be of a similar size, but you should also estimate the surface area of each one - particularly the upper surface. How do you measure surface area of an irregular shaped object?
4. How do you measure light intensity in two (or more) different places when it changes almost continually with cloud cover, time of day, etc.?
5. How long does it take for algae and animals to recolonise surfaces? During warm weather and long hours of sunshine this can be very fast (1 day), in which case it may be necessary to sample at less than one-week intervals. In colder, dull weather recolonisation may be slow and you may need to monitor over a few weeks.
6. Are all the animals in the stream likely to occur on stone surfaces or only some? How can you tell which ones?
7. How do you mark or label stones in a stream so that they can be located later?
HEALTH WARNING: The Braid Burn is not a very clean stream, so be careful to wash your hands thoroughly with soap after working in the stream to avoid picking up any diseases. Health risks are minimal if simple hygiene procedures such as this are observed, so do not be put off working there.
Suggested Equipment Wellingtons or waders Wire brush to scrub stones Light meter Pond net Plastic bags to transport samples from the stream to the lab. White trays for sorting Forceps Wide-mouthed pipettes, sample tubes, Petri dishes Alcohol for preservation Microscope Keys for identification
What you will learn about Experimental design and hypothesis testing. The importance of epilithic algae to stream communities. Identification and classification of aquatic invertebrates. The importance of light to stream communities.
Bibliography Allan, J. D. (1995). Stream Ecology. Chapman & Hall, London. Croft, P. S. (1986). A key to the major groups of British freshwater invertebrates. Field Studies 6, 531-579.
25
Project 5. Variation in the abundance of tar spot infection on sycamore leaves
Introduction Sycamore leaves at the end of the summer are commonly covered on their lower side with black 'tarspots'. These are caused by infection by the ascomycete fungus Rhytimsa acerinum. After leaf fall, the black spots develop into sexual fruiting bodies or sclerotia. In April and May sexual ascospores are released from the sclerotia present in the leaf litter and infect expanding leaves of sycamore. The success of infection determines the number of tar spots seen the following autumn. Infection by R. acerinum is thought to hasten the senescence of sycamore leaves so that infected leaves fall earlier than uninfected leaves. Wide variation is found in the extent of infection between different areas, and between different trees within these areas.
Questions 1. How is the extent of leaf spot infection affected by various factors? Some of these factors might be: • Extent of leaf litter retained beneath tree • Height of leaves from the ground (source of spores). • Amount of air pollution. • Density of sycamore trees. 2. Is there a relationship between tar spot infection and time of leaf fall? 3. Are there significant differences in infection between urban and rural sites? 4. Are there significant differences in infection between different trees within the same site? Research Objectives Decide on a specific question or questions that you would like to answer. Although part of your answer may be descriptive, try and express each question in the form of a testable Null Hypothesis (H0). For example, your H0 might be that number of tar spots per leaf in rural sites does not differ from that in urban sites.
What sort of data do you need to collect in order to answer your question? Will it be possible to collect the required data?
Think about your question and the potential outcomes in terms of underlying ecological explanations.
Methods Having decided on the hypotheses you wish to examine, find a suitable location for the study and devise an appropriate sampling scheme.
Some simple sampling designs could be: a) aim to get two (or more) columns of numbers representing some measured variable in two (or more) situations. These might, for example, represent infection prevalence in several trees from both urban and rural sites. b) aim to get two columns of numbers representing two variables measured for each sampling unit. For example, the infection prevalence and litter depth for several sampling locations. Many other designs are possible.
You must consider the size and nature of individual sample units, the size of the sample and how samples or experimental treatments should be distributed. Considering the example H0 above: is a sampling unit a leaf, an area of leaf, a tree?; how many leaves, areas, trees or locations will you sample?; how will samples be distributed, which leaves on a tree or trees in a site will you sample? - ideally sampling units should be an unbiased representation of the population (i.e. all the leaves, trees etc. that we wish to draw conclusions about from our results). You must also decide on a way to standardise your sampling procedure.
You must decide on the most appropriate measure of tar spot infection - spot number, spot area, presence/absence of spots? Perhaps sample a few leaves first to get an idea of what is appropriate.

26
Points to consider 1. How will you show that your results represent 'significant' effects and not just chance effects due to
sampling error? If you have a Null hypothesis, can you test it statistically? 2. If you estimate a parameter such as tar spot abundance or average leaf height, how will you indicate
the precision of your estimate? 3. Will your tar spot index take into account the size of the leaves? 4. Are other factors likely to be associated with tar spot infection? Could the effect of other factors
confound the results of your study? 5. How would premature falling of infected leaves affect your estimate of abundance? What you will learn about Fungal biology Factors affecting the abundance and distribution of parasitic fungi Assessing biological variability and its causes Effects of fungal infection on plants. Experimental design Statistical analysis
Suggested Equipment Plastic bags Indelible pens Metre rule Quadrats Long handled pruners for sampling leaves to 3m.
Bibliography Leith, I. D. & Fowler, D. (1987). Urban distribution of Rhytisma acerinum (Pers.) Fries (tar spot) on sycamore.
New Phytologis, 108, 175-181. Sutherland, W.J. (1996). Ecological census techniques: a handbook. Cambridge University Press,
Cambridge.

27
Project 6. Distribution of snails in woodland leaf litter
Introduction Land snails (Mollusca) are distributed across a diverse array of habitats in woodland sites. They are readily sampled in such habitats by sieving leaf litter that forms the major part of their diet. The abundance and species composition of land mollusc communities is dependent upon a number of environmental factors. The most important of these appear to be the level of calcium available to the snails for building their shells, the moisture level, and the degree of 'shelter' offered by the habitat. Certain species are more tolerant of low calcium levels while others may be more tolerant of low moisture levels, and these differences in preference may alter the species composition in different microhabitats. This project will be concerned with investigating the abundance and species composition of land snail communities within different microhabitats in the Hermitage of Braid.
Questions To what extent is the abundance and species composition of snail communities related to:
1. origin of leaf litter (oak, beech, ash leaves for instance?) 2. pH of soil (related to calcium levels) 3. degree of 'shelter' 4. moisture levels Research Objectives Decide on a specific question or questions that you would like to answer. Although part of your answer may be descriptive, try and express each question in the form of a testable Null Hypothesis (H0).
For example, your H0 might be that the abundance of a particular species of snail in holly litter does not differ from that in oak litter.
What sort of data do you need to collect in order to answer your question and test the Null hypothesis? Will it be possible to collect the required data?
Think about your question and the potential outcomes in terms of underlying ecological explanations.
Methods Having decided on the hypotheses you wish to examine, find a suitable location for the study and devise an appropriate sampling scheme.
Some simple sampling designs could be: a) aim to get two (or more) columns of numbers representing some measured variable in two (or more) situations. These might, for example, represent snail densities in several litter samples from oak litter and holly litter. b) aim to get two columns of numbers representing two variables measured for each sampling unit. For example, the snail density and soil moisture level at several sampling locations. Many other designs are possible.
You must consider the size and nature of individual sample units, the size of the sample and how samples or experimental treatments should be distributed. Perhaps take a few preliminary samples to get an idea of what is appropriate. Considering the example H0 above: would a sampling unit be a quadrat, or a given volume of litter, or something else, and what size would the sampling unit be?; how many sampling units would you sample; how would the samples be distributed within the woodland - ideally sampling units should be an unbiased representation of the population (i.e. all the litter we wish to draw conclusions about from our results). You must also decide on a way to standardise your sampling procedure?
Snails can be extracted from litter samples in the lab using a combination of sieving and separating techniques together with manual searching and removal. Your demonstrator can advise further. Moisture content of soil or litter can be determined by collecting material, weighing, drying and weighing again. Instruments are available for measuring relevant environmental variables such as Ph.

28
Points to consider 1. How will you show that your results represent 'significant' effects and not just chance effects due to
sampling error? If you have a Null hypothesis, can you test it statistically? 2. If you estimate a parameter such as average abundance, how will you indicate the precision of your
estimate? 3. Ensure that you know how to identify species of snails. The common species are much smaller than
you may imagine. The key given in the references is very good. 4. Is there going to be a problem with confounding factors? Will this interfere with the interpretation of the
results? e.g. are all holly trees situated on drier sites than oak trees? 5. How is abundance best measured? What you will learn about Mollusc diversity and classification Mollusc biology and ecology Factors affecting species distribution Sampling methods Experimental design Testing of null hypotheses
Suggested Equipment Note book, pencil Hand lens Nylon mesh bags (for collecting leaf litter) Oven (for drying leaf litter) Sieves of various sizes for sorting snails Binocular microscope Keys for identification Instruments for measuring relevant environmental factors e.g. pH meter
Bibliography Boycott, A. E. (1934). The habitats of land mollusca in Britain. Journal of Ecology 22, 1-38.
Cameron, R. A. D. (1973). Some woodland mollusc faunas from Southern England. Malacologia 14, 355-370.
Kerney, M.P. & Cameron, R.A.D. (1996). Land snails of Britain and north-west Europe. HarperCollins, London.
Tattersfield, P. (1990). Terrestrial mollusc faunas from some South Pennine woodlands. Journal of Conchology 33, 355-374.
Southwood, T.R.E & Henderson, P.A. (2000). Ecological methods (3rd
ed.). Blackwell Science.

29
Project 7. Relationships between bryophyte growth form and habitat
Introduction Bryophytes (mosses and liverworts) exhibit a very diverse array of growth forms. These may be classified into the following broad categories:
• Cushions: erect shoots radiating up to form a compact dome • Turfs: parallel erect shoots forming dense smooth surface • Canopies: systems with a raised leafy canopy • Mats: interwoven stems spreading horizontally over a surface • Wefts: loosely intertwined shoots, often ascending The growth form adopted by a bryophyte is likely to be closely tied to the ecology of that species. Some growth forms will be better adapted for competition, others for protection against desiccation, etc. For this reason we may anticipate that there will be relationships within a community between the abundance of particular growth forms of bryophytes and particular habitats within an area. This project will be concerned with detecting such associations between growth habit and habitat for the community of bryophytes in the Hermitage of Braid.
Questions How is the distribution of different growth habits in bryophytes related to particular characteristics of the habitat? Important characteristics of the habitat might include:
1. humidity 2. light intensity 3. inclination of substrate (vertical/ horizontal) 4. nature of the substrate (rock ,soil, bark, etc.) Research Objectives Decide on a specific question or questions that you would like to answer. Although part of your answer will be descriptive, try and express each question in the form of a testable Null Hypothesis (H0). For example, your H0 might be that cushion-forming bryophytes are equally abundant on open rocks and heavily shaded rocks. What sort of data do you need to collect in order to answer your question and test the Null hypothesis? Will it be possible to collect the required data?
Think about your question and the potential outcomes in terms of underlying ecological explanations.
Methods Familiarise yourself with the available habitat and decide on the hypotheses you wish to examine. Then identify suitable sites for the study and devise an appropriate sampling scheme. Some simple sampling designs could be: a) aim to get two (or more) columns of numbers representing some measured variable in two (or more) situations. These might, for example, be measures of abundance of cushion forming bryophytes on open rocks and in heavy shade. b) aim to get two columns of numbers representing two variables measured for each sampling unit. For example, the abundance of cushion forming bryophytes and light intensity at several sampling locations. Many other designs are also possible.
You must consider the size and nature of individual sample units, the size of the sample and how samples should be distributed. Considering the example H0 above: would a sampling unit be a whole rock or a quadrat placed on the rocks, what size should the rocks or quadrats, respectively, be?; how many rocks or quadrats would you sample?; how would you choose which rocks to sample, how would they be distributed and, if using quadrats, would you sample more than one quadrat from the same rock? - ideally sampling units should be an unbiased representation of the population (i.e. all the rocks we wish to draw conclusions about from our results). You must also decide on a way to standardise your sampling procedure?
Instruments are available for measuring relevant environmental variables such as light intensity.

30
Points to consider 1. How will you show that your results represent 'significant' effects and not just chance effects due to
sampling error? If you have a Null hypothesis, can you test it statistically? 2. If you estimate a parameter such as average abundance, how will you indicate the precision of your
estimate? 3. What classification scheme is going to be used for growth form? To what extent will it be necessary to
identify the species involved? (Consider the extra information that could be gained). Microscopes and keys will be needed for identification.
4. Is there going to be a problem with confounding factors? Will this prevent you drawing reliable conclusions from the results? E.g. are all open habitats liable to heavy trampling while those in heavy shade are undisturbed?
5. How is abundance best measured? What scale of sampling unit is most appropriate?
What you will learn about Bryophyte diversity and classification Bryophyte biology and ecology Factors affecting distribution of species Experimental design Testing of null hypotheses
Suggested Equipment Note book, pencil Hand lens Plastic bags (for collecting specimens) Microscope Slides Keys for identification Instruments for measuring relevant environmental factors-light meter?
Bibliography
Birse, E. M. (1958). IV. Growth form distribution in a deciduous wood. Journal of Ecology 46, 29-42.
Gimingham, C. H. & Birse, E. M. (1957). Ecological studies on the growth form of Bryophytes. I. Correlations between growth form and habitat. Journal of Ecology 45, 533-545.
Jahns, H.M. (1983). Collins guide to the ferns mosses and lichens of Britain and North and Central Europe. Collins, London.
Watson, E. V. (1968). British Mosses and Liverworts. Cambridge University Press, Cambridge.
31
Project 8: Distribution and diversity of species in relation to rabbit grazing on Blackford Hill
Introduction The European rabbit (Oryctolagos cuniculus) has become so successful that is considered a pest in many areas. They were introduced to the UK by the Normans in the 12th century to provide meat and fur. They live on heathland, open meadow, grassland, woodland, the fringes of agricultural land and dry sandy soil, including sand dunes, but they avoid coniferous forests. Rabbits eat the leaves of a wide range of vegetation including agricultural crops, cereals, young tree and cabbages. In winter, they eat grasses, bulbs and bark. They re-ingest their faeces for nutritional benefit. Rabbits have a burrow system known as a warren, and tunnels can be 1-2m long. They use regular trails, which they scent mark with faecal pellets.
Rabbit grazing affects the stature and composition of vegetation throughout the year and the size of population can influence the numbers of plant species in an area. Continuous grazing by large numbers of rabbits leads to an increase in ground cover in some species (e.g. Anthoxanthum odoratum and Rumex acetosella and a decrease in others (e.g. Festuca rubra and Trifolium repens). They can pose serious threats to sensitive habitats, yet conversely, rabbit grazing is essentially for the maintenance of other threatened habitats such as calcareous grasslands and many invertebrate species are dependent on rabbit grazing for the maintenance of their habitats, such as the large blue butterfly (Maculinea arion).
Pollution There are several questions one might ask about the effects of rabbit grazing on the distribution and abundance of species.
1. Do rabbits increase or decrease plant species richness on Blackford Hill? 2. What are the characteristics of plant species that occur only near to or only far from rabbit burrows? 3. Are some species particularly associated with soil distrurbance caused by rabbits? Additional questions can be posed of invertebrate distribution and abundance.
Research Objectives Decide on a specific question or questions that you would like to answer. Although part of your answer may be descriptive, try and express each question or prediction in the form of a testable Null Hypothesis (H0). For example, your H0 might be that grazing by rabbits does not affect the distribution of vascular plant species on Blackford Hill.
What sort of data do you need to collect in order to answer your question? Will it be possible to collect the required data? How will you devise a method of surveying the the numbers of rabbits and/or distribution of rabbit burrows on Blackford Hill? Can you find comparable areas of grassland, where the vegetation is heavily grazed and lightly grazed, for example?
Think about your question and the potential outcomes in terms of underlying ecological explanations.
Methods Having decided on the hypothesis you wish to examine, devise an appropriate sampling scheme or experimental setup. If sampling, you must identify suitable study locations. Will 'controls' be necessary against which to compare the effects of experimental treatments? Some simple designs could be:
a) aim to get two columns of numbers representing some measured variable in two situations. These might, for example, represent species diversity within several quadrats in both grazed and ungrazed habitat.
b) aim to get a table showing a number of observations in different categories for one or more situations. For example, the percentage cover of selected species in areas of heavy grazing, light grazing, and rabbit scrapes. Many other designs are possible.

32
Identifying lichens You must consider the size and nature of individual sample units, the size of the sample and how samples or experimental treatments should be distributed. Considering the example H0 above: will the sampling unit be a species or a quadrat? How will the size of quadrat be chosen? How will they be distributed? Ideally they should collect an unbiased representation of the population (i.e. all the vegetation types you wish to draw conclusions about from our results). You must also decide on a way to standardise your sampling procedure.
Points to consider 1. You will initially spend a great deal of time determining how the rabbits are distributed on the hill and it
may be two or three weeks before you begin to collect vegetation data. Practice your identification skills in these weeks.
2. How will you show that your results represent 'significant' effects and not just chance effects due to a sampling error? If you have a Null hypothesis, can you test it statistically?
3. If you estimate a parameter such as numbers of rabbits, how will you indicate the precision of your estimate?
4. Does the number of species recorded reflect the dispersal of species on the hill, the resistance of species to grazing, the variation in conditions on different parts of the hill (altitude, aspect, angle of slope), or your ability to identify species?
What you will learn about • Grassland species diversity and identification • The effect of grazing on individual species • The grazing behaviour of rabbits • Ecology of grazing • Experimental design • Testing of null hypothesis Suggested equipment Note book, pencil Quadrats (10 x 10 cm, 25 x 25 cm, 50 x 50 cm, or 1 x 1 m) Sample bags Marker pen for labelling samples identification keys
Bibliography
Bullock, J.M., Franklin, J., Stevenson, M.J., Silvertown, J., Coulson, S.J., Gregory, S.J. & Tofts, R. (2001).
A plant trait analysis of responses to grazing in a long term experiment. Journal of Applied Ecology, 38,
253-267.
Kolb, H. H. (1991). Use of burrows and movements of wild rabbits (Oryctolagus cuniculus) in an area of hill
grazing and forestry. Journal of Applied Ecology, 28, 892-905.
Crawley, M. J. (1990). Rabbit grazing, plant competition and seedling recruitment in acid grassland. Journal of
Applied Ecology, 27, 803-820.
Myers, K. & Poole, W.E. (1963). A study of the biology of the wild rabbit, Oryctolagus cuniculus (L.), in
confined populations. Journal of Ecology, 51, 435-451.
Identification keys
Rose, F. (2006) The Wild Flower Key. How to identify wild flowers and shrubs in Britain and Ireland (revised
edition). Penguin Books, London
Chinery, M. (1993). Collins’ Field Guide: Insects of Britain and Northern Europe (3rd
Edition). Harper Collins
Publishers, London
Fitter, R., Fitter, A. & Farrer, A. (1984). Collins’ Pocket Guide: Grasses, Sedges, Rushes and Ferns of Britain
and Northern Europe. Collins, London
Hubbard, C.E. (1984). Grasses. A guide to their structure, identification, uses and distribution in the British Isles
(3rd
Edition). Penguin Books, London

33
Project 9: Leaf Breakdown and invertebrate colonisation in streams
Introduction Riparian vegetation (i.e. plant communities on the fringes and adjacent to water bodies), through its input into streams, provides an important habitat and food source for aquatic invertebrates. Leaves provide little nutritional value when freshly fallen, but as they are being broken down by bacteria and fungi, they are quickly colonized by invertebrates. However, not all kinds of leaves break down at the same rate, some being broken down more rapidly (e.g. Fraxinus excelsior) than others (e.g. Salix spp.) and not all leaves have the same nutritional value and palatability.
This project aims to investigate the relationship between the abundance, richness, diversity and distribution of aquatic invertebrates within the Braid Burn, and the presence/absence and type of leaves in this stream.
You will be sampling aquatic invertebrates in different areas of the Braid Burn (e.g. under forest cover or open areas; in areas where leaves accumulate or areas without leaves), as well as in leaf packs (bags containing leaves from different tree species) submerged in the stream and recovered every week for analysis.
Questions Many questions may be asked regarding leaf breakdown, leaf palatability and invertebrate diversity and distribution in the stream, such as:
1. Are the abundance, richness and diversity of aquatic invertebrates affected by the presence of leaf packs in the stream? Why?
2. Are different species of aquatic invertebrates associated with different kinds of leaves (from different tree species)? Why?
3. How long does it take for invertebrates to colonize leaf packs and does the diversity and composition of invertebrates evolve over time?
4. Which leaf species are broken down more rapidly? How can differences in breakdown rate be explained?
5. Does light, temperature or flow velocity influence invertebrate distribution within the stream? How? Research Objectives Decide on a specific question or questions that you would like to answer. Although part of your answer will be descriptive, try and express each question or prediction in the form of a testable Null Hypothesis (H0). For example, your H0 might be: "there is no difference in invertebrate diversity between leaf packs containing leaves from different tree species". Your alternative hypothesis H1 would then be: "there is a difference in invertebrate diversity between leaf packs containing leaves from different tree species".
What sort of data do you need to collect in order to answer your question? Will it be possible to collect the required data during the period dedicated to the project?
Methods Most leaves in streams gather in small groups called leaf packs. In order to stimulate this process, you will build mesh bags (e.g. 1 cm x 1 cm mesh), fill them with leaves and place them in the stream. You should choose the tree species you want to investigate and pick up fresh leaves collected from several trees to avoid damaging one particular tree. Place the leaves in comparable mesh bags (e.g. 20 cm x 20 cm) and secure them to the stream bed so that they don't wash away easily. You should choose carefully the number of bags you want to put in the stream (e.g. you should be able to recover each week 2 or 3 replicates for each kind of leaf), the size of the bags and the quantity of leaves, and the area of the stream where you want to place them (looking carefully at flow velocity, natural obstacles, light intensity, etc.).
Each week, collect a given number of mesh bags with a net held downstream to catch any invertebrates that may have been disturbed into the water column. Place these bags (and the content of the nets) into large plastic bags for transportation back to the laboratory. To count and identify invertebrates present in each leaf pack, place small amounts of leaves in white trays with 1 or 2 cm of tap water. Use spoons, brushes, and forceps to separate invertebrates from the leaves. Invertebrates should be separated from the rest of the material as soon as possible after retrieval from the stream, as sorting and identifying living animals is easier. Invertebrates collected can be stored in small vials with 70% ethanol, and should be counted and identified to family level. Most of the animals can be easily identified using a microscope and relevant keys (e.g. Croft, 1986).

34
Points to consider Having decided on the hypotheses you wish to examine, find a suitable location for the study and devise an appropriate sampling scheme. How many leak packs will you need? How many times and how often will you collect them? Where in the stream are you going to place them? Where are you going to do your kick sampling? Which method will you choose? Which parameters can you measure to describe your site. (e.g. temperature, water pH, flow velocity). How will you show that your results represent 'significant' effects and not just chance effects due to sampling error? If you have a Null hypothesis, can you test it statistically? What kind of test can you use and why? HEALTH WARNING: The Braid Burn is not a very clean stream, so be careful to wash your hands thoroughly with soap after working in the stream to avoid picking up any diseases. Health risks are minimal if simple hygiene procedures such as this are observed, so do not be put off working there.
Suggested equipment Wellingtons or waders Pond net Plastic bags to transport samples from the stream to the lab. Wire or plastic mesh Wire or string Sieves White trays for sorting Forceps Sample tubes, Petri dishes Labels Alcohol for preservation Microscope and x10 lenses Keys for identification of invertebrates and trees Thermometer pH-meter Light-meter
What you will learn about The importance of terrestrial inputs to stream communities and the implications for stream management. The factors influencing the distribution of invertebrates in the stream. Identification and classification of aquatic invertebrates. Identification of trees. Experimental design, hypothesis testing and report writing.
Bibliography Books:
Allan, J. D. (1995). Stream Ecology: Structure and function of running waters. Chapman & Hall, London. 388 p.
Croft, P. S. (1986). A key to the major groups of British freshwater invertebrates. Field Studies Council, Taunton. 48 p.
Articles:
Parkyn, S. M., Winterbourn, M. J. (1997). Leaf breakdown and colonisation by invertebrates in a headwater stream: comparison of native and introduced tree species. New Zealand Journal of Marine and Freshwater Research 31: 301 - 312.
Richardson, J. S., Shaughnessy, C. R., Harrison, P. G. (2004). Litter breakdown and invertebrate association with three types of leaves in a temperate rainforest stream. Archiv für Hydrobiologie 159 (3): 309-325.
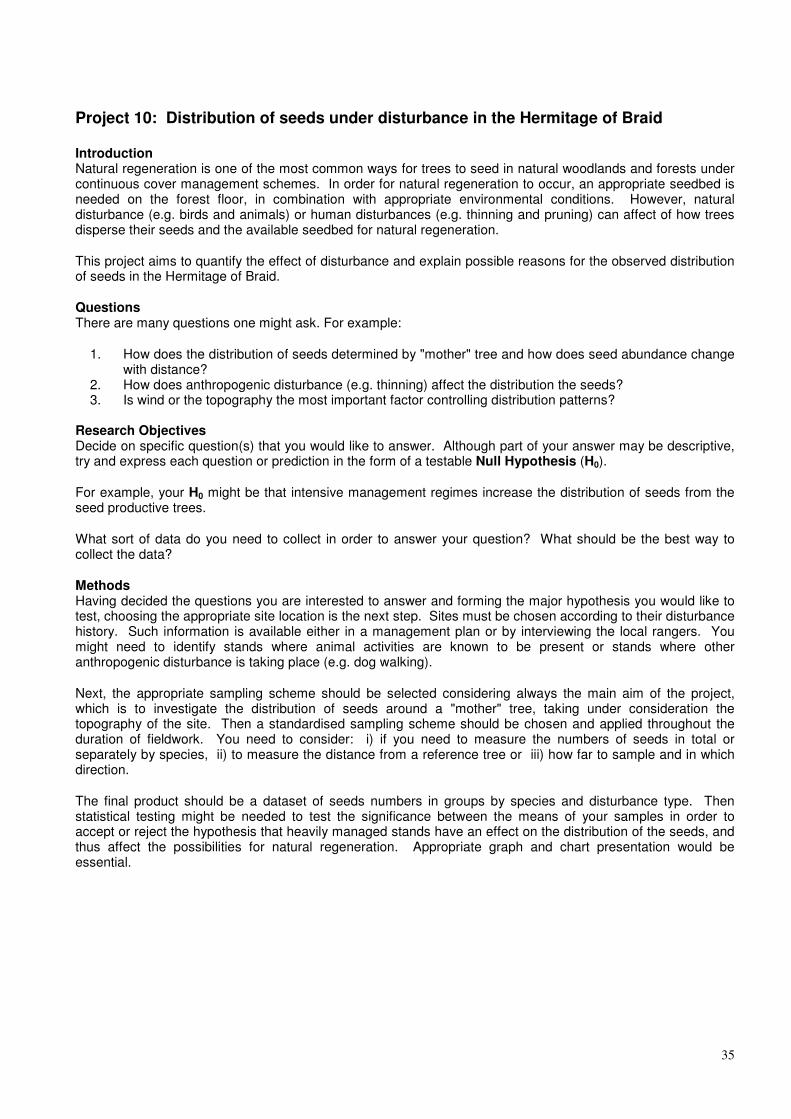
35
Project 10: Distribution of seeds under disturbance in the Hermitage of Braid
Introduction Natural regeneration is one of the most common ways for trees to seed in natural woodlands and forests under continuous cover management schemes. In order for natural regeneration to occur, an appropriate seedbed is needed on the forest floor, in combination with appropriate environmental conditions. However, natural disturbance (e.g. birds and animals) or human disturbances (e.g. thinning and pruning) can affect of how trees disperse their seeds and the available seedbed for natural regeneration.
This project aims to quantify the effect of disturbance and explain possible reasons for the observed distribution of seeds in the Hermitage of Braid.
Questions There are many questions one might ask. For example:
1. How does the distribution of seeds determined by "mother" tree and how does seed abundance change with distance?
2. How does anthropogenic disturbance (e.g. thinning) affect the distribution the seeds? 3. Is wind or the topography the most important factor controlling distribution patterns? Research Objectives Decide on specific question(s) that you would like to answer. Although part of your answer may be descriptive, try and express each question or prediction in the form of a testable Null Hypothesis (H0).
For example, your H0 might be that intensive management regimes increase the distribution of seeds from the seed productive trees.
What sort of data do you need to collect in order to answer your question? What should be the best way to collect the data?
Methods Having decided the questions you are interested to answer and forming the major hypothesis you would like to test, choosing the appropriate site location is the next step. Sites must be chosen according to their disturbance history. Such information is available either in a management plan or by interviewing the local rangers. You might need to identify stands where animal activities are known to be present or stands where other anthropogenic disturbance is taking place (e.g. dog walking).
Next, the appropriate sampling scheme should be selected considering always the main aim of the project, which is to investigate the distribution of seeds around a "mother" tree, taking under consideration the topography of the site. Then a standardised sampling scheme should be chosen and applied throughout the duration of fieldwork. You need to consider: i) if you need to measure the numbers of seeds in total or separately by species, ii) to measure the distance from a reference tree or iii) how far to sample and in which direction.
The final product should be a dataset of seeds numbers in groups by species and disturbance type. Then statistical testing might be needed to test the significance between the means of your samples in order to accept or reject the hypothesis that heavily managed stands have an effect on the distribution of the seeds, and thus affect the possibilities for natural regeneration. Appropriate graph and chart presentation would be essential.

36
Points to consider. 1. What is the main hypothesis? 2. How do I proceed with the design of the sampling and what are the variables I need to measure? 3. Which are the criteria for choosing the appropriate stands to sample? 4. How do I choose the "mother" tree? 5. Which is the appropriate plot size and what sort of sampling scheme should I follow? 6. What statistical analysis should I perform and how to present the results? What you will learn about Identifying trees and seeds Designing of sampling scheme to fulfil certain needs Sampling design Performing basic statistical analysis Presenting results
Suggested equipment Note book and pencil Measuring tape Books for tree and seed identification Sticks and tape for sampling plots Small quadrats
Bibliography Fenner, M. (1985). Seed Ecology. Chapman & Hall, London. Mayer, A. M. & Poljakov-Mayber, A. (1975). The Germination of Seeds (2
nd Ed.). Pergamon Press, London.

37
CODE OF PRACTICE FOR FIELD STUDIES
General Behaviour
• Observe sensible standards of behaviour at all times. • Show good manners and consideration to others, with special regard to those whose facilities we use. • On guided excursions, do not get ahead of the guide. • Show consideration for the property of others: • Do not damage property; • Do not leave gates open; • Do not trample crops; • Do not disturb animals. • Show consideration for our natural environment: • Do not collect specimens unless specifically required for the purpose of the field course; • Do not disturb natural communities; • Do not casually overturn rocks or logs; • Do not leave litter. • Observe conservation regulations.
Your responsibilities for safety
Ecological field work involves some inherent risks and hazards because of the places we go to and the activities we undertake. Severe weather may increase the dangers.
The potential dangers make it imperative that each individual should co-operate by behaving in order to reduce the risks of accidents.
It is the responsibility of the course leader to provide, in so far as is reasonable, a framework for safety on the field course. She/he will:
1. ensure that you have been informed of the special hazards associated with the work; 2. ensure that you know of the precautions, prohibitions and instructions relevant to the exercise; 3. check that you are suitably clothed and equipped for the conditions likely to be prevailing and for the
activities to be carried out; 4. provide safety gear and a first aid kit as appropriate. Within this framework, you are responsible for your own safety and for not endangering the safety of others. In particular, you must:
1. obey safety instructions, whether written or verbal; 2. treat safety equipment with care and respect; 3. act sensibly and responsibly at all times. If you disregard safety requirements, if you behave irresponsibly or if you endanger yourself or others, you will be dismissed from the course and reported to the Head of School for possible disciplinary action.
You should question any apparent disregard of safety by another and refuse to undertake any activity which you consider to involve unreasonable risk.
Think "SAFETY" at all times.

38
Safety precautions applying to all field trips
Wear clothing and footwear suitable for the weather, the activity and terrain. You will not be allowed to participate in a field course if you are ill-equipped for the conditions. Section A4 gives general guidelines, and specific activities may require additional items.
Stay with your group, except by clear arrangement with the course leader.
Meet as arranged at the completion of work. In particular, do not make your own way back home (or to lodgings, etc.) without express permission of the course leader.
Report illness, accident, incident affecting safety, or misbehaviour to the course leader.
Do not endanger yourself or others by fooling around; for example, by running down steep slopes, rolling stones down slopes, throwing objects around, flicking tree branches.
Never smoke or light fires in forests or on moorland. Conditions for the spread of undergrowth fires may be present in any season.
Show extra care on cliffs and steep slopes. Gusty winds can blow you over. Cliff edges may be crumbling. Do not dislodge loose rocks. Grass verges may be very slippery.
Do not incur additional risks by e.g. climbing cliffs, walking on slippery rocks, or wading along rivers, unless these activities have been approved as an essential part of the course.
Do not touch machinery in forests, farms, factories, etc. unless it is a specific requirement of the course. In particular, you will never be allowed to use a chain saw without thorough training and specific permission.
Use potentially dangerous apparatus with care, and with due regard to the operating instructions.
Take care along roads, when you need to work beside the road (e.g. for surveying, sampling vegetation). Walk on the right hand side (i.e. facing oncoming traffic) and remember that a group walking along a road represents a specific hazard. You are not allowed along motorways or railways.
Take care when leaving buses. Remember that this is dangerous when the bus stops at the roadside.
Familiarise yourself with the Forestry Safety Council leaflet 34: First Aid
Make sure you carry the Personal First Aid and Emergency Kit described below
Clothing, footwear & safety gear
Minimum clothing: loose-fitting trousers, shirt, warm sweater, cagoul, warm socks.
Desirable additional clothing: Warm headgear (in addition to the hood of a cagoul), cagoul, waterproof overtrousers, extra sweater. (Remember that several thin layers are better than one heavy layer of clothing). Your cagoul should be brightly coloured.
Footwear: nailed boots or strong boots with rubber mountaineering soles, wear wellingtons only when shallow wading is anticipated.
Do not wear: shoes (as opposed to boots) especially sports shoes or light casual or dress shoes; a dress; jeans (highly undesirable as they absorb moisture and can cause exposure when wet and subjected to a cold wind).
Wear a safety helmet when this is provided for your safety when there is a danger from falling rocks or trees, or a danger of falling.

39
Personal First Aid and emergency kit. You are advised to carry with you, as a matter of course on all field trips, the following items in a plastic bag:
• a loud whistle; • the Forestry Safety Council Leaflet No.34: • First Aid; • 1 adhesive dressing; • 1 plain lint wound dressing; • 2 antiseptic wipes; • Safety matches. The best policy is to keep this kit in a cagoul or rucksack that you routinely take with you on field trips.
Occupational diseases
Although the likelihood of contracting serious diseases through fieldwork are very small in Britain, it is wise to be aware of three diseases which may present potential hazards, and the steps which can be taken to avoid problems.
Tetanus There is a risk of tetanus from anything puncturing the skin in the field, for example from an animal bite, scalpel cut, or a deep scratch. If you are not currently protected against tetanus a course of immunisation can be arranged with the Health Service. If you do receive a cut or a bite in the field and are not covered for tetanus, you must see a doctor within 24 hours and obtain emergency protection through passive immunisation. Weil's Disease Weil's disease is spread by rats and can be contracted from water contaminated with the causative agent, spirochete. The organism can enter through cuts or abrasions in the skin, through skin that has been immersed for long periods in water, or through mucus membrane surfaces such as the lining of the eyes. Infection may result in a range of conditions varying from 'flu like symptoms' through to meningitis and liver and kidney damage. Protection is best provided by wearing the appropriate clothing to cover vulnerable areas. Potentially contaminated skin and cuts should be thoroughly washed with soap and water at the earliest opportunity. Lyme Disease Lyme disease is contracted through tick bites. The risk of infection is high in areas with high populations of deer. Immediate symptoms include a rash around the bite and a brief 'flu like illness'. More serious conditions such as meningitis, heart disease and arthritis may develop if the disease goes untreated. The best preventative measure is to protect the skin from tick bites by wearing long sleeved shirts and trousers in areas where ticks are known to be common. If ticks are discovered on the skin their head and mouthparts should be removed using fine forceps, and the affected area disinfected. Contact your doctor immediately if an illness resembling Lyme disease develops after you have been working in an area with high tick densities.
Emergency procedures: First Aid
Follow the advice given in the Forest Safety Council leaflet 34: First Aid.
Do not attempt treatment beyond this advice unless you are suitably trained. First Aid is not a substitute for expert attention.
Get medical help without delay if there is any uncertainty about the seriousness of the accident.

40
Emergency procedures: When lost
Much depends on individual circumstances, so the following are general guidelines: use your own common sense and initiative in particular circumstances.
Make yourself obvious
1. Expose brightly coloured clothing. 2. Give the international distress signal periodically (six blows on a whistle, shouts, etc. repeated at one
minute intervals). Calmly assess your position
1. Are you close to civilisation? 2. Is it difficult for people to spot you? 3. Are the climatic conditions harsh? 4. Is the terrain reasonably safe? 5. Are your food supplies low? 6. Is your clothing inadequate for a prolonged stay outdoors? If you tend to answer "yes" to most of the above questions, then you should probably try to walk out of trouble.
1. Walk downhill but: • do not follow streams; • do not go down steep slopes; • do not go fast downhill; • watch out for cliffs, etc. 2. Use the sun, moon or land marks for direction. Do not walk in circles. 3. Rest at intervals. 4. When you get to a telephone, dial 999, ask for Police and explain the position: the Police should
already have been contacted by the course leader. If you tend to answer "no" to most of the above questions, then you should probably try to sit it out and wait for help to arrive.
1. Make large visible signs on the ground. 2. Light a fire if possible. 3. Seek shelter. 4. Re-assess your position at intervals.

41
Exposure (Hypothermia)
Causes
1. Accidental hypothermia: sitting still in the cold too long (e.g. in a boat, watching birds, awaiting medical help when injured).
2. Immersion hypothermia: falling into water. 3. Exhaustion-exposure: while hill walking, due to the high heat loss from cold, damp, wind and/or low heat
production resulting from exhaustion, hunger. Symptoms
Any two of the following symptoms suggest hypothermia:
1. Complaints of feeling cold, tired or listless. 2. Unreasonable behaviour or irritability. 3. Sudden uncontrollable shivering. 4. Increase slowness of physical or mental response. 5. Stumbling or falling. 6. Slurring of speech. 7. Difficulty of vision. 8. Physical resistance to help. 9. Collapse, stupor or unconsciousness. Treatment
1. Remove the patient from exposed environment. 2. Provide shelter and rest. 3. Insulate against further heat loss by use of blankets or layers of warm clothing, huddling together in a
sleeping bag, etc. 4. Get medical help. 5. Provide glucose (instant energy) if available and water, preferably warm (to combat dehydration). 6. Handle the casualty with minimum of rough movement.
Going into the field alone
You must have your supervisor's permission for any trip to the field.
Ensure that your supervisor knows precisely where you are going, what you are intending to do, how long you will be in the field and how you are travelling.
Discuss the safety aspects of your work with your supervisor, specifically with regard to clothing, safety gear, hazards and precautions.
Leave a note of your schedule, route and destination with the Departmental secretary or your supervisor. Wherever possible a detailed map of your fieldwork site should be provided so that you can be located rapidly in event of an emergency. If you are away for more than one day leave these details with the hotel manager or warden, etc. as appropriate.
Take your Personal First Aid and Emergency Kit and rations (e.g. chocolate) and extra dry clothing.
Take a map, compass, torch, and survival bag for work in remote areas.

42
A FEW GUIDELINES ON EXPERIMENTAL DESIGN AND STATISTICAL ANALYSIS
General Points
• Have a simple hypothesis and state your objectives clearly
• Express hypotheses to be tested in terms of a Null hypothesis (HO) and an Alternative hypothesis (HA)
• Never report an estimate of an ecological parameter without some measure of its possible error
• Tests of significance and descriptive statistics are both valuable. Tests of significance are often necessary for testing hypotheses. However, we also want to know how groups differ or what a pattern of association is.
Sampling
• Define your sampling unit (experimental unit) o Natural: e.g. 1 leaf, 1 frog, 1 seed o Artificial: e.g. 1 quadrat, 1 litre, 1 hour
• When obtaining a sample think about the population that this sample is intended to represent o A sample is taken to be representative of some ‘population’ or ‘sampling universe’. This
‘population’ embraces all the possible sampling units or objects about which we wish to make inferences – any conclusions regarding hypotheses or estimated parameters, such as means, will be applied to the ‘population’
o Is the sample an unbiased representation of this population? Ideally it should be a random selection from all possible units in the population
Confounding factors and experimental bias � Beware of other factors (natural or artificial) that may vary in parallel with the factor under investigation –
you may not be able to conclude which factor is responsible for any observed effect Examples: � All orchid counts in site A are made by Jim (who is wide awake and good at spotting orchids) whilst all
counts in site B are made by George (who is tired and not very good at spotting orchids). Are resultant differences in orchid counts between the sites actually due to differences in orchid abundance or simply differences in observer ability?
o In a study to examine caterpillar density in different tree species. 10 Oak trees in a park (sample
A) and 10 Sycamore trees along a roadside (sample B) tree sampled for caterpillars. Can we conclude that differences in caterpillar density between samples are definitely due to tree species, or could they be due to differences in pollution, predator numbers, …..?
• Aim to eliminate bias and confounding factors in your study design
Interpretation
• Aim for unambiguous results. Are there any simple and reasonable hypotheses that could explain the observed results, other than the working hypothesis?
• Don’t confuse statistical significance with biological significance
• Statistical evidence of an association or correlation does not necessarily imply cause and effect

43
DESCRIPTIVE STATISTICS
EXPRESSIONS OF ‘AVERAGE’ OR ‘CENTRAL TENDANCY’
Arithmetic Mean
Median
Sum of observations divided by number of observations
The middle value of ordered/ranked observations
• Takes account of the value of all data in sample
• A resistent measure of average
• Can be greatly distored by exteme values and may not apear representative of central region for skewed data sets
• Works well for skewed data and outliers
• Can be used with interval or ranked data
Mode
The most frequently occurring value (or values if multi-modal) in data set
• Can be applied to data on ordinal scales • There may be >1 mode
SPREAD OR VARIABILITY OF DATA
Range
Interquartile range
• Simplest measure of variability • Lower quartile = value below which 25% of ranked observations lie
• Differences between highest and lowest values of obserations in distribution
• Upper quartile = value below which 75% of ranked observations lie
• Strongly influenced by extreme or unusual values
• IQR = differences between upper and lower quartiles
Standard deviation
• Measures ‘average’ deviation of observations from mean
• Takes account of the value of all data in sample
CONFIDENCE IN ESTIMATE OF POPULATION AVERAGE
N.B. Presenting some measure of data variability (above) together with sample size gives a reasonable indication of reliability. More formal measures of confidence include:
• Standard error
• 95% or 99% confidence intervals

44
STATISTICS FOR HYPOTHESIS TESTING
This is only a very brief guide. Discuss any proposed statistical analysis with a demonstrator or staff.
TESTING FOR DIFFERENCE BETWEEN AVERAGES OF TWO GROUPS
t-test Mann-Whitney-U test
• compares means of two groups • compares medians of two groups
• uses interval data • can use interval or ranked data
• Makes a number of assumptions: * data approximately normally distributed * similar variance in both samples
• Makes a few assumptions about data
• You must have >10 observations in total
TESTING FOR AN ASSOCIATION OR RELATIONSHIP BETWEEN TWO INTERVAL OR RANKED VARIABLES
1. Correlation
Measures the ‘strength’ of the relationship between the variables Spearman Rank correlation co-efficient
Product moment correlation co-efficient
• Can use interval or ranked data • Uses interval data
• Makes few assumptions about data
• Require >7 pairs of observations
• Makes a number of assumptions: *both variables should be normally distributed *relationship should be linear
2. Regression
Use when you wish to estimate the value of one variable from a measurement of the other. Fits a line through a scatter of data.
Simple Linear Regression
• Makes a number of assumptions about data: - Linear relationship - Relationship implied to be causal - x-variable is under your control
…………- normal distribution of possible y-values for any x

45
ANALYSIS FREQUENCIES
1. Goodness-Of-Fit Tests
Testing whether frequencies observed of 2 or more categories differ from those expected according to Null Hypothesis Chi-square Goodness-Of-Fit Test (X
2)
• Each ‘object’ can only be assigned to one category
• Ideally all expected frequencies >5
• All observations are independent • Use actual data not percentages 2. Tests for Association Testing whether the relative frequencies observed in two or more categories differ between two or more situations. Chi-square Contingency Table Test (X
2)
• Assumptions and conditions as above
GRAPHICAL PRESENTATION OF DATA
Points to note:
• Scaling of numerical axes should be appropriate to the data
• Use the same scaling on figures that are to be compared
• Ensure axes are properly labelled including units of measurement
• Y-axis need not proceed continuously from zero – can be broken to focus on area of interest. Break indicted by double slash
• Include full explanatory legend. Figure should be fully understandable without reference to main text. Figure Legend should be placed below figure
• Note: Table titles should be placed above the table
FIGURES PRESENTING FREQUENCIES
DOT PLOTS
BAR GRAPHS
• Give a rough but quick visual appreciation of data distribution
• Used for discrete data (categorical, ordinal or interval)
• Each dot represents one observation
• Bar heights reflect frequencies
• Bars do not touch each other (reflects discrete nature of data)
PIE CHARTS
HISTOGRAMS
• Used for categorical data where categories have no logical sequence (if there is a logical sequence, use a bar chart)
• Internal angle of ‘segment’ reflects relative frequency (percentage or proportion) of cases in that category
• Used for continuous data
• Observations groups into artificial classes
• Bar heights (bar areas) reflect frequencies within classes
• Bars touch each other (reflects continuous nature of data)

46
FIGURES PRESENTING SUMMARY STATISTICS
BOX PLOTS
(Box and Whisker plots)
BAR CHARTS WITH ERROR BARS
• Usually used to show medians, interquartile ranges and ranges
• Can be used to show mean and any of standard deviation, standard error, confidence intervals or range
• Top of bar shows mean
• Error bar can show standard deviation, standard error or confidence intervals
FIGURES SHOWING RELATIONSHIPS
SCATTERGRAM (scatter plot)
• Use with bivariate data: pairs of observations on 2 variables are obtained from each unit in a sample
• Aids interpretation of correlation coefficients
• Useful summary or starting point before further data analysis data
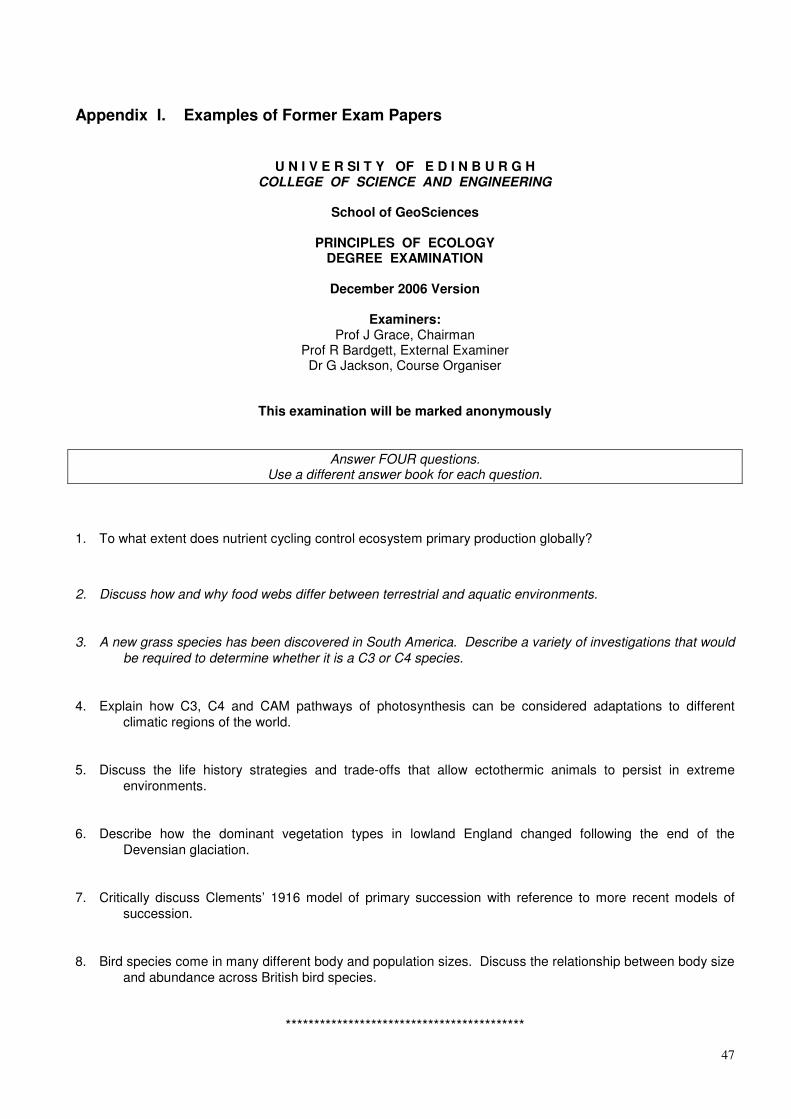
47
Appendix I. Examples of Former Exam Papers
U N I V E R SI T Y OF E D I N B U R G H COLLEGE OF SCIENCE AND ENGINEERING
School of GeoSciences
PRINCIPLES OF ECOLOGY
DEGREE EXAMINATION
December 2006 Version
Examiners: Prof J Grace, Chairman
Prof R Bardgett, External Examiner Dr G Jackson, Course Organiser
This examination will be marked anonymously
Answer FOUR questions. Use a different answer book for each question.
1. To what extent does nutrient cycling control ecosystem primary production globally?
2. Discuss how and why food webs differ between terrestrial and aquatic environments.
3. A new grass species has been discovered in South America. Describe a variety of investigations that would
be required to determine whether it is a C3 or C4 species.
4. Explain how C3, C4 and CAM pathways of photosynthesis can be considered adaptations to different
climatic regions of the world.
5. Discuss the life history strategies and trade-offs that allow ectothermic animals to persist in extreme
environments.
6. Describe how the dominant vegetation types in lowland England changed following the end of the
Devensian glaciation.
7. Critically discuss Clements’ 1916 model of primary succession with reference to more recent models of
succession.
8. Bird species come in many different body and population sizes. Discuss the relationship between body size
and abundance across British bird species.
******************************************

48
U N I V E R SI T Y OF E D I N B U R G H COLLEGE OF SCIENCE AND ENGINEERING
School of GeoSciences
PRINCIPLES OF ECOLOGY DEGREE EXAMINATION
August 2007 Version
Examiners: Prof J Grace, Chairman
Prof R Bardgett, External Examiner Dr G Jackson, Course Organiser
This examination will be marked anonymously
Answer FOUR questions. Use a different answer book for each question.
1. Describe the technique of radio-carbon dating and explain why it needs to be interpreted cautiously in order
to obtain vegetation histories.
2. Describe, with examples, four different approaches to the study of vegetation succession.
3. Critically review the evidence that elevated atmospheric carbon dioxide will increase biological productivity
on a global scale.
4. Explain why some desert plants have evolved many stomata per unit area of green surface whilst others
have only a few.
5. Why is the Earth so rich in life, while its neighbours, Mars and Venus appear to be ‘dead’ planets?
6. Define the ecological efficiency of an organism and discuss the key determinants of ecological efficiency.
7. Define and give examples of “essential resources”, “substitutable resources” and “complementary
resources”. How is population growth influenced by variations in the abundance of these resource
types?
8. Although there are exceptions, most dinosaur species were very large-bodied. Why?
******************************************

49
U N I V E R SI T Y OF E D I N B U R G H
COLLEGE OF SCIENCE AND ENGINEERING
School of GeoSciences
PRINCIPLES OF ECOLOGY DEGREE EXAMINATION
December 2007 Version
Examiners: Prof J Grace, Chairman
Prof R Bardgett, External Examiner Dr G Jackson, Course Organiser
This examination will be marked anonymously
Answer FOUR questions. Use a different answer book for each question.
1. Describe how the vegetation of a terrestrial landscape changes through a complete interglacial period, such
as the Hoxnian.
2. Describe the patterns and processes of vegetation change in a hydrosere. Discuss how such systems can
be studied.
3. What is an ecosystem, and how did the concept arise?
4. What controls the availability of nutrients in any place and time?
5. What are the three sorts of photosynthesis, and why has this variation arisen?
6. The 'life history' of a species is a description of when important events occur, such as the age of sexual maturity. Briefly describe the life history of the dinosaur Tyrannosaurus rex.
7. Describe the life history traits associated with r and K strategists. Using examples, contrast the kinds of
environments in which you would expect to find animals displaying r and K strategies.
8. How can we compare physiological processes across species of animal that differ in body size and what
does this tell us about the nutritional ecology of African ungulates?
******************************************

50
U N I V E R SI T Y OF E D I N B U R G H
COLLEGE OF SCIENCE AND ENGINEERING
School of GeoSciences
PRINCIPLES OF ECOLOGY DEGREE EXAMINATION
August 2008 Version
Examiners: Prof J Grace, Chairman
Prof R Bardgett, External Examiner Dr G Jackson, Course Organiser
This examination will be marked anonymously
Answer FOUR questions. Use a different answer book for each question.
1. Contrast the dominant ecological processes in primary succession as described by Clements (1916) with
typical processes of secondary succession. 2. Describe the patterns of tree colonisation of Britain during the early part of the Holocene (post-glacial)
period following the retreat of the ice. 3. How and why does primary production in oceans differ from terrestrial environments? 4. How many trophic levels can an ecosystem support? 5. What are the major/global environmental factors that are expected to change over the next 50 years and
how do these factors influence the rate of carbon dioxide uptake of C3 and C4 plants? 6. What evidence is there that dinosaurs were warm-blooded? 7. Define these three terms: phenotypic plasticity, polyphenism and reaction norm.
Give one example of a life-history trade-off which involves a polyphenism, and a second example of a life-history trade-off involving a reaction norm.
8. Describe the allometric method of comparing physiological attributes of animals.
******************************************

51
U N I V E R SI T Y OF E D I N B U R G H
COLLEGE OF SCIENCE AND ENGINEERING
School of GeoSciences
PRINCIPLES OF ECOLOGY
DEGREE EXAMINATION
December 2008 Version
Examiners: Prof J Grace, Chairman
Prof R Bardgett, External Examiner Dr G Jackson, Course Organiser
This examination will be marked anonymously
There are THREE sections in this paper. Answer ONE question in Section A Answer ONE question in Section B
Answer ALL SIX questions in Section C
Use a separate answer book for the SECTION A and SECTION B questions
Answers to all six questions in SECTION C must be written on the exam paper in the space allowed
SECTION A
Answer ONE question
Question 1 How is it possible to reconstruct vegetation histories? How have the climatic vegetation zones of Britain changed throughout the current interglacial period?
(25 marks) or Question 2 What do modern ecologists believe to be wrong with Clement’s (1916) model of succession? What aspects of his model are believed to be correct?
(25 marks)
SECTION B
Answer ONE question Question 1 How and why does photosynthesis vary globally? What measurements would you make to quantify this variation?
(25 marks) or Question 2 How and by what mechanisms has life affected the environment of our planet over the past four billion years?
(25 marks)

52
SECTION C
Answer ALL SIX questions in the space allowed
1. (a) What is diapause? (3 marks)
(b) Describe two situations in which organisms might use diapause as a life history strategy?
(4 marks)
(c) Give one example for each. (2 marks)
2. Define the following and give one example for each.
(a) essential resources (2 marks)
(b) substitutable resources (2 marks)
(c) complementary resources (2 marks)
___________________________________________________________________________

53
3. How and why do the following scale with an organism’s body size?
(a) Standard metabolic rate (4 marks)
(b) Specific metabolic rate (4 marks)
4. How are woodland plants adapted to shade? (9 marks)
5. How are tropical grasses different from temperate grasses? (9 marks)

54
6. Reptiles are cold blooded. (9 marks)
(a) Were dinosaurs?
(b) Briefly describe the evidence supporting your answer.

55
U N I V E R SI T Y OF E D I N B U R G H
COLLEGE OF SCIENCE AND ENGINEERING
School of GeoSciences
PRINCIPLES OF ECOLOGY DEGREE EXAMINATION
August 2009 Version
Examiners:
Prof J Moncrieff, Chairman Prof R Bardgett, External Examiner Dr G Jackson, Course Organiser
There are THREE sections in this paper. Answer ONE question in Section A Answer ONE question in Section B
Answer ALL SIX questions in Section C
Use a separate answer book for the SECTION A and SECTION B questions
Answers to all six questions in SECTION C must be written on the exam paper in the space allowed
This examination will be marked anonymously
SECTION A Answer ONE question
Question 1 Choose three native British trees and describe how they spread throughout Britain after the end of the last ice-age. How can we reconstruct these vegetation histories?
(25 marks) or Question 2 Compare and contrast primary and secondary succession giving examples of both.
(25 marks)
SECTION B Answer ONE question
Question 1 How and why does climate vary across the globe? How does climate variation control the distribution of global terrestrial biomes? (25 marks) or Question 2 What is an ecosystem and how did the concept arise?
(25 marks)

56
SECTION C Answer ALL SIX questions in the space allowed
1. (a) What is parity?
(3 marks)
(b) describe how semelparous and iteroparous organisms allocate resources to reproduction?
(5 marks)
2. (a) What is a reaction norm?
(3 marks)
(b) Give an example of a life history trade-off which involves a reaction norm.
(5 marks)
3. (a) Explain the differences between allometric and isometric scaling in terms of body size.
(4 marks)
(b) Why do most physiological and structural processes scale allometrically with body size
(4 marks)
___________________________________________________________________________

57
4. What are the three main types of photosynthesis? How do they provide ‘fitness’ for the plants in which they
are found?
(9 marks)
5. Explain how water is transported in plants?
(8 marks)
6. Many scientists have studied the density of species, such as lynx, at numerous study sites which vary in
size. When we put all these different studies together, what generalisation emerges about the
relationship between the size of the study site and the measured density of the species?
(9 marks)

58
U N I V E R SI T Y OF E D I N B U R G H
COLLEGE OF SCIENCE AND ENGINEERING
School of GeoSciences
PRINCIPLES OF ECOLOGY
DEGREE EXAMINATION
December 2009 Version
Examiners: Prof J Moncrieff, Chairman
Dr R Baxter, External Examiner Dr G Jackson, Course Organiser
This examination will be marked anonymously
Answer FOUR questions
Please use a separate answer book for each QUESTION. 1. Why is Earth so rich in life, while its neighbours, Mars and Venus, are ‘dead’ planets? 2. How do the physical differences between aquatic and terrestrial environments affect the distribution and
abundance of organisms? 3. Define the term “acclimation” and explain the mechanisms whereby plants acclimate to their surroundings. 4. What are the three biochemical pathways of photosynthesis and discuss the advantages of these pathways
in different climatic regions.
5. Over the course of hundreds of thousands of years the climate has changed cyclically. Why is this? Name
the climatic phases through an interglacial period and describe the typical changes in climate, soil and
dominant vegetation types in currently temperate zones between the end of one glaciation and the start
of the next.
6. Compare and contrast primary and secondary vegetation succession.
7. What are the thermal challenges for a terrestrial endotherm of inhabiting a tropical desert? How can
terrestrial endotherms respond to such challenges?
8. Describe how allometric analysis can be used to compare physiological functions across mammal species
varying in body mass.
*****************************************************************

59
U N I V E R SI T Y OF E D I N B U R G H
COLLEGE OF SCIENCE AND ENGINEERING
School of GeoSciences
PRINCIPLES OF ECOLOGY DEGREE EXAMINATION
August 2010 Version
Examiners: Prof J Moncrieff, Chairman
Dr R Baxter, External Examiner Dr G Jackson, Course Organiser
This examination will be marked anonymously
Answer FOUR questions
Please use a separate answer book for each QUESTION.
1. How and why does nutrient cycling differ between aquatic and terrestrial ecosystems? 2. How and why do food webs differ between terrestrial and aquatic environments?
3. Explain how the internal leaf structure can best equip leaves to use the resources of (a) a sunny and (b) a
shaded habitat? 4. Will plants grow faster in a CO2-rich atmosphere? How can plant responses to elevated CO2 concentrations
be explored?
5. What are the effects of a glacial-interglacial cycle on an ecosystem of a currently temperate zone?
6. Which aspects of the Clements (1916) model of primary succession are now largely rejected and which
elements are largely accepted?
7. Describe how terrestrial endotherms respond to environmental temperature as it varies from extreme cold to
extreme heat.
8. How should animals allocate resources between competing life history traits?

60
U N I V E R SI T Y OF E D I N B U R G H
COLLEGE OF SCIENCE AND ENGINEERING
School of GeoSciences
PRINCIPLES OF ECOLOGY DEGREE EXAMINATION
December, 2010 Version
Examiners: Prof J Moncrieff, Chairman
Dr R Baxter, External Examiner Dr G Jackson, Course Organiser
This examination will be marked anonymously
Answer FOUR questions
ONE question to be answered from each section
Please use a separate answer book for each QUESTION
SECTION A
1. Describe how the vegetation, climate and soil changes through a complete British interglacial period such
as the Hoxnian. 2. Explain how primary succession is different from secondary succession.
SECTION B 3. “Islands are more impoverished in species than comparably small areas of mainland”. Discuss.
4. How and why does primary production in oceans differ from that of terrestrial environments?
SECTION C 5. Discuss the structural differences that exist between plants that have adapted to high intensity and low
intensity light environments. 6. Describe the environmental factors that affect terrestrial plant photosynthesis, and how these influence
growth.
SECTION D 7. Describe the response of metabolic rate to ambient temperature in a homeotherm, and the ways in which
such homeothermic animals respond to temperature extremes. 8. How, in theory, should the diets of herbivores be influenced by their body mass?
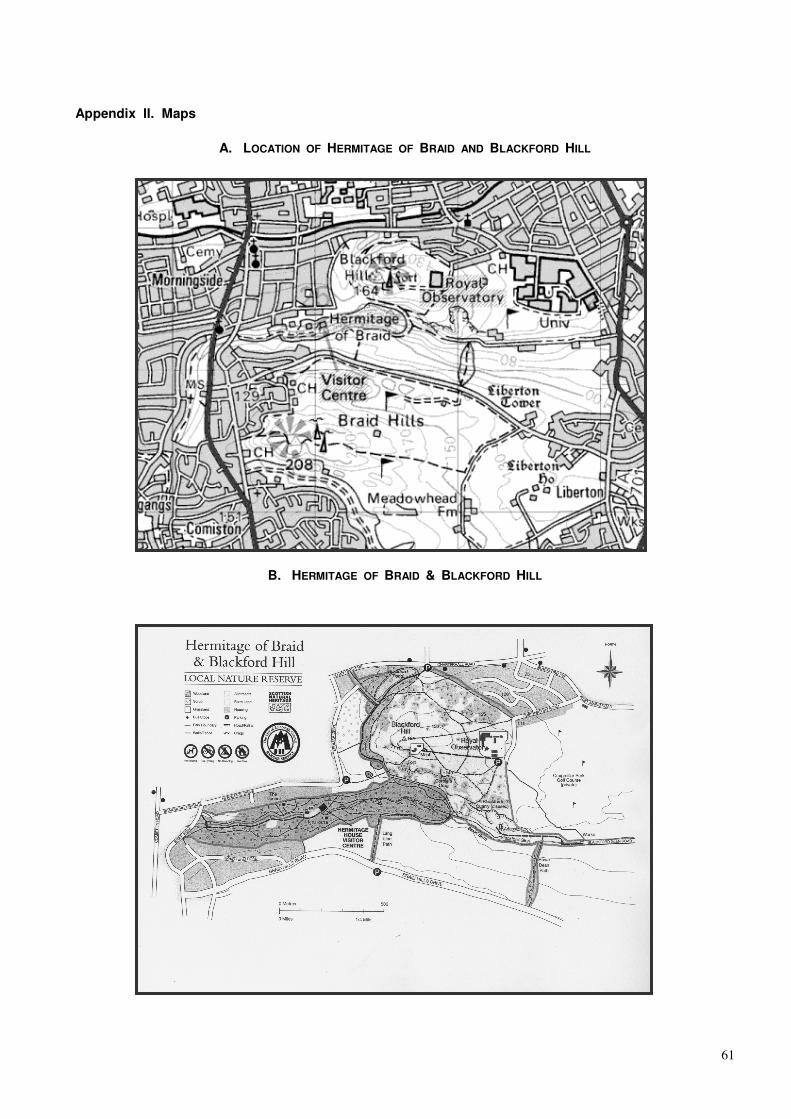
61
Appendix II. Maps
A. LOCATION OF HERMITAGE OF BRAID AND BLACKFORD HILL
B. HERMITAGE OF BRAID & BLACKFORD HILL

62
UNIVERSITY OF EDINBURGH – OWN WORK DECLARATION
This sheet must be filled in (each box ticked to show that the condition has been met), signed and dated, and included with all assessments - work will not be marked unless this is done
This sheet will be removed from the assessment before marking
Name:……………………………………………..… Number:……………………………..….…
Course/Programme:………………………………………………………………………………….…...
Title of work:………………………………………………………………………………………….…….
I confirm that all this work is my own except where indicated, and that I have:
• Clearly referenced/listed all sources as appropriate �
• Referenced and put in inverted commas all quoted text (from books, web, etc) �
• Given the sources of all pictures, data etc. that are not my own �
• Not made any use of the report(s) or essay(s) of any other student(s) either past � or present
• Not sought or used the help of any external professional agencies for the work �
• Acknowledged in appropriate places any help that I have received from others � (e.g. fellow students, technicians, statisticians, external sources)
• Complied with any other plagiarism criteria specified in the Course handbook �
I understand that any false claim for this work will be penalised in accordance with the University regulations �
Signature …………………………………….
Date …………………………………………..
Please note: If you need further guidance on plagiarism, you can
1. Consult your course book
2. Speak to your course organiser or supervisor
3. Check out http://www.aaps.ed.ac.uk/regulations/Plagiarism/Intro.htm
Please read the notes about the use of plagiarism detection software overleaf.

63
Use of plagiarism detection software
Note that computers may be used to detect plagiarism, whether by using something as simple as a search
engine such as Google (it is as easy for a marker to find online sources as it is for you) or something more
complex for specialized comparisons of work. Some courses will use the JISC plagiarism detection service.
The plagiarism detection service is an online service hosted at www.submit.ac.uk that enables institutions and
staff to carry out electronic comparison of students' work against electronic sources including other students'
work. The service is managed by The University of Northumbria on behalf of the Joint Information Systems
Committee (JISC) and is available to all UK tertiary education institutions by subscription.
The plagiarism detection service works by executing searches of the world wide web and extensive databases
of reference material, as well as content previously submitted by other users. Each new submission is
compared with all the existing information. The software makes no decisions as to whether a student has
plagiarised, it simply highlights sections of text that are duplicated in other sources. All work will continue to be
reviewed by the course tutor. As such, the software is simply used as a tool to highlight any instance where
there is a possibly case of plagiarism. Passages copied directly or very closely from existing sources will be
identified by the software, and both the original and the potential copy will be displayed for the tutor to view.
Where any direct quotations are relevant and appropriately referenced, the course tutor will be able to see this
and will continue to consider the next highlighted case.
Once work has been submitted to the system it becomes part of the ever growing database of material against
which subsequent submissions are checked. The copyright in each work submitted remains with the original
author, but a non-exclusive, non-transferable, licence is granted to permit use of the material for plagiarism
detection purposes.
There is an on-line demonstration of the system available at
http://www.submit.ac.uk/