principles of high-dimensional data visualization in...
TRANSCRIPT

Astron. Nachr. / AN xxx, No. xx, 001 – 10 (2012) / DOI please set DOI!
Principles of High-Dimensional Data Visualization in Astronomy
Alyssa A. Goodman1,∗
Harvard-Smithsonian Center for Astrophysics, Cambridge, MA, USA
Received 20 Apr 2012, accepted 20 Apr 2012Published online later
Key words techniques: image processing; methods: data analysis; techniques: radial velocities; cosmology: large-scalestructure; ISM: clouds
Astronomical researchers often think of analysis and visualization as separate tasks. In the case of high-dimensional datasets, though, interactive exploratory data visualization can give far more insight than an approach where data processingand statistical analysis are followed, rather than accompanied, by visualization. This paper attempts to charts a coursetoward “linked view” systems, where multiple views of high-dimensional data sets update live as a researcher selects,highlights, or otherwise manipulates, one of several open views. For example, imagine a researcher looking at a 3D volumevisualization of simulated or observed data, and simultaneously viewing statistical displays of the data set’s properties(such as an x-y plot of temperature vs. velocity, or a histogram of vorticities). Then, imagine that when the researcherselects an interesting group of points in any one of these displays, that the same points become a highlighted subset inall other open displays. Selections can be graphical or algorithmic, and they can be combined, and saved. For tabular(ASCII) data, this kind of analysis has long been possible, even though it has been under-used in Astronomy. The biggerissue for Astronomy and several other “high-dimensional” fields is the need systems that allow full integration of imagesand data cubes within a linked-view environment. The paper concludes its history and analysis of the present situationwith suggestions that look toward cooperatively-developed open-source modular software as a way to create an evolving,flexible, high-dimensional, linked-view visualization environment useful in astrophysical research.
c© 2012 WILEY-VCH Verlag GmbH & Co. KGaA, Weinheim
1 Introduction
Historically, Astronomy has been a visual science. Thou-sands of years ago observations were carried out with thenaked eye; hundreds of years ago telescopes augmented theeye; and during the last century sensitive film and CCDrecording devices enhanced what the eye could see. Morerecently, observing techniques spanning the full electro-magnetic spectrum have been developed, as have techniquesfor statistical comparison with analytic and numerical the-oretical predictions. Oddly though, as Astronomy’s wave-length coverage increased, the value of the “visual” to as-tronomers seems to have declined–not as a wavelength, butas a tool. Too often, wavelength-specific studies of tinypatches of sky, or statistical analyses of tremendous cata-logs of information, are carried out with very little atten-tion paid to context. Viewing what surrounds a tiny narrow-field image, or studying a catalog’s content in context on awide-field sky often gives unexpected and valuable infor-mation. Understanding the context of catalog data in high-dimensional spaces where information can be comparedacross wavelengths and across models, can be similarly il-luminating. Evolution has made humans amazingly good atpattern recognition, and this paper is about how analysistechniques that marry humans’ extraordinary visualization
∗ Corresponding author: e-mail: [email protected]
capabilities to statistical principles are, and should continueto be, on the rise within modern astronomy.1
2 Data-Dimensions-Display
There are three simple words to keep in mind when onesets out to explore and/or explain high-dimensional infor-mation with visualization: data, dimensions, and display.Any data set containing the equivalent of more than twocolumns worth of information can be thought of as “high-dimensional.” In some cases, the dimensions may be spatialor temporal, but in other cases the dimensions might be justcolumns in a data table, so a “high-dimensional” space canbe highly abstract.2
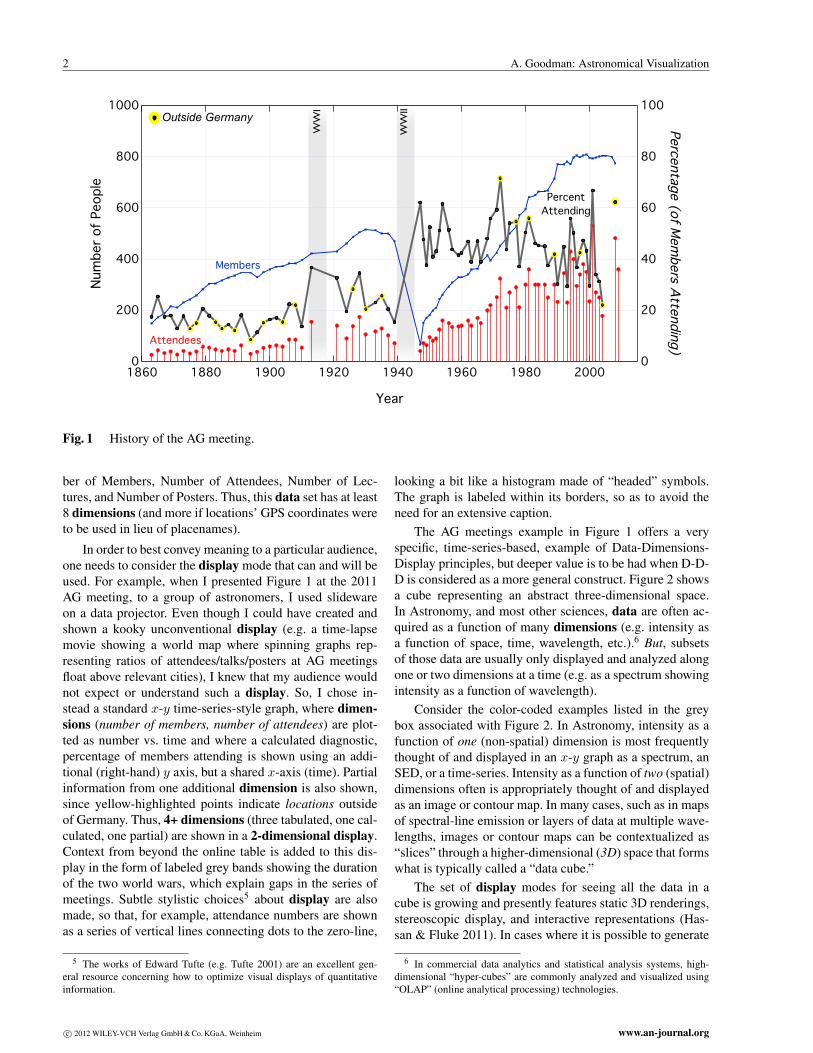
Consider Figure 1, which shows a simple carte-sian graph documenting attendance at AstronomischeGesellschaft (AG) meetings over time. The data used to cre-ate this graph are from the AG website,3 which contains atable with 8 columns, listing: Year, RGA4, City, Date, Num-
1 Hassan & Fluke (2011) recently published a uniquely comprehensivereview of the recent history of visualization in Astronomy, and the inter-ested reader is referred to that work for details and links to software notprovided here.
2 Wong & Bergeron (1997) provide an excellent review of multi-dimensional multi-variate visualization that includes a good discussion ofthe meaning of the word “dimensions” within various disciplines.
3 www.astronomische-gesellschaft.org/en/tagungen4 An index number on “regular” meetings of the General Assembly.
c© 2012 WILEY-VCH Verlag GmbH & Co. KGaA, Weinheim
2 A. Goodman: Astronomical Visualization
1000
800
600
400
200
0
Num
ber o
f Peo
ple
20001980196019401920190018801860
Year
100
80
60
40
20
0
Percentage (of Mem
bers Attending)
oo oo oo
o oo
o
oo
o
o o
o o
o
O
WWI
WWIIOutside Germany
Attendees
Members
PercentAttending
Fig. 1 History of the AG meeting.
ber of Members, Number of Attendees, Number of Lec-tures, and Number of Posters. Thus, this data set has at least8 dimensions (and more if locations’ GPS coordinates wereto be used in lieu of placenames).
In order to best convey meaning to a particular audience,one needs to consider the display mode that can and will beused. For example, when I presented Figure 1 at the 2011AG meeting, to a group of astronomers, I used slidewareon a data projector. Even though I could have created andshown a kooky unconventional display (e.g. a time-lapsemovie showing a world map where spinning graphs rep-resenting ratios of attendees/talks/posters at AG meetingsfloat above relevant cities), I knew that my audience wouldnot expect or understand such a display. So, I chose in-stead a standard x-y time-series-style graph, where dimen-sions (number of members, number of attendees) are plot-ted as number vs. time and where a calculated diagnostic,percentage of members attending is shown using an addi-tional (right-hand) y axis, but a shared x-axis (time). Partialinformation from one additional dimension is also shown,since yellow-highlighted points indicate locations outsideof Germany. Thus, 4+ dimensions (three tabulated, one cal-culated, one partial) are shown in a 2-dimensional display.Context from beyond the online table is added to this dis-play in the form of labeled grey bands showing the durationof the two world wars, which explain gaps in the series ofmeetings. Subtle stylistic choices5 about display are alsomade, so that, for example, attendance numbers are shownas a series of vertical lines connecting dots to the zero-line,
5 The works of Edward Tufte (e.g. Tufte 2001) are an excellent gen-eral resource concerning how to optimize visual displays of quantitativeinformation.
looking a bit like a histogram made of “headed” symbols.The graph is labeled within its borders, so as to avoid theneed for an extensive caption.
The AG meetings example in Figure 1 offers a veryspecific, time-series-based, example of Data-Dimensions-Display principles, but deeper value is to be had when D-D-D is considered as a more general construct. Figure 2 showsa cube representing an abstract three-dimensional space.In Astronomy, and most other sciences, data are often ac-quired as a function of many dimensions (e.g. intensity asa function of space, time, wavelength, etc.).6 But, subsetsof those data are usually only displayed and analyzed alongone or two dimensions at a time (e.g. as a spectrum showingintensity as a function of wavelength).
Consider the color-coded examples listed in the greybox associated with Figure 2. In Astronomy, intensity as afunction of one (non-spatial) dimension is most frequentlythought of and displayed in an x-y graph as a spectrum, anSED, or a time-series. Intensity as a function of two (spatial)dimensions often is appropriately thought of and displayedas an image or contour map. In many cases, such as in mapsof spectral-line emission or layers of data at multiple wave-lengths, images or contour maps can be contextualized as“slices” through a higher-dimensional (3D) space that formswhat is typically called a “data cube.”
The set of display modes for seeing all the data in acube is growing and presently features static 3D renderings,stereoscopic display, and interactive representations (Has-san & Fluke 2011). In cases where it is possible to generate
6 In commercial data analytics and statistical analysis systems, high-dimensional “hyper-cubes” are commonly analyzed and visualized using“OLAP” (online analytical processing) technologies.
c© 2012 WILEY-VCH Verlag GmbH & Co. KGaA, Weinheim www.an-journal.org

Astron. Nachr. / AN (2012) 3
GENERALLY1D: Columns = Spectra, SEDs, Time Series
2D: Faces or Slices = Images
3D: Volumes = 3D Renderings, 2D Movies
4D: Time Series of Volumes = 3D Movies
Fig. 2 Data “Cubes” in Astronomy.
a series of data cubes as a function of some fourth dimension(usually time), 3D animations and/or sets of small multiples(repeated versions of 3D views seen side-by-side) are oftenused for display.7
Software for analyzing observations and simulations isconstantly growing more capable due to increased compu-tational performance. But, even the most modern astronom-ical software packages still do not make enough use of ex-plicit connections between the dimensions inherent in a dataset. Instead, various kinds of displays (x-y graphs, images,volume renderings) are created separately, using tools thatdo not link common dimensions across all active plots. Be-low, I explain a “linked view” approach that is likely to be-come the essential path to insight as astronomical data setscontinue to expand in complexity and size.
3 Linked Views
Live linking of views across display modes holds the keyto effective visualization and analysis of high-dimensionaldata sets (cf. Gresh et al. 2000; Tukey 1977; Wong & Berg-eron 1997). Figure 3 shows a cartoon where four types ofgraphical display of a high-dimensional data set are pic-tured with one data subset highlighted in red. In an effective“linked view” visualization system, the kind of highlight-ing the red coloring represents is done interactively, in realtime, and the selections made can be saved and combinedwith other selections for use in analysis.8
When researchers can easily investigate the behavior oftrends and outliers in all the dimensions of data at hand theywill learn more about the information at hand as a result.(Conversely, if it is not easy to carry out exploratory investi-gations, researchers will often stop analysis at a stage wherekey insights will remain hidden within a high-dimensionaldata set.) For an astronomical example, imagine that a par-ticular group of points in an x-y plot of flux vs. velocityappeared to have aberrant behavior. In a linked-view sys-tem, a user could immediately highlight, select, and option-
7 There are many excellent software packages capable of achievingbeautiful visualizations of high-dimensional real and simulated data, nearlyall of which are explained and listed in the recent review by Hassan & Fluke(2011). Here, I have chosen to focus instead on ideas about how to link theinformation in visualizations amongst otherwise-hidden dimensions andaspects of a data set.
8 see www.kitware.com/InfovisWiki/index.php/Linked_Views and references cited there for more information
ally include/exclude those points from display and analy-sis amongst other dimensions, for example in a plot of ve-locity vs. signal-to-noise ratio, which might show the aber-rant points to have low significance. Extrapolating from thissimple example, one can imagine and appreciate the powerreal-time linked views offer for making more sophisticatedinvestigations, such as data selection based on behavior seenin a combination of several dimensions. In Astronomy, theability to interactively explore the connections between datapoints in statistical graphs and the same measurements’ po-sitions in “real” 3D space, and vice-versa, is particularlypowerful.
3D
2D
Data Abstraction
Statistics
0
25
50
75
100
Fig. 3 Linked Views (figure created by M. Borkin)
In the realm of point-based data (e.g. ASCII tables),the benefits of interactive linked views were first exploredby John Tukey and his colleagues using the PRIM-9 sys-tem they developed in the 1970s.9 No readily-availablecomputers 40 years ago had input devices that could beused to graphically select subsets of data, so Tukey’steam had to design a custom visualization control boxwith many buttons all of which had special selection- andmanipulation-oriented functions.10 Tukey’s ideas on Ex-ploratory Data Analysis (Tukey 1977), including princi-ples he called “picturing,” “rotation,” “isolation,” “brush-ing,” and “masking,” were first implemented commerciallyin 1986 in the Macintosh-only program DataDesk, which isstill in use today on Macs and PCs.11
LIST 1 gives a summary of the mainstream commercialdescendants and offshoots of the Exploratory Data Analysisprinciples espoused by Tukey. These are powerful tools forexploring tabular data on its own, but none of them linksimage-based or image-cube-based information to catalog
9 See Friedman & Stuetzle (2002) for a review.10 An excellent demonstration video showing PRIM-9 is atstat-graphics.org/movies/prim9.html.
11 In 1986 the Macintosh operating system, then two years old, was theonly widely-available computer with a mouse-driven graphical user inter-face needed to make the PRIM-9 ideas practicable.
www.an-journal.org c© 2012 WILEY-VCH Verlag GmbH & Co. KGaA, Weinheim

4 A. Goodman: Astronomical Visualization
(tabular) data, which is the key missing link in astronomicaldata analysis today.
LIST 1: Commercial Linked View Software forAnalyzing Tabular Data12
DataDesk, est. 1986www.datadesk.com, inspired by John Tukey’s and PaulVelleman’s work on “Exploratory Data Analysis”, seeFriedman & Stuetzle (2002) for a review
Spotfire, est. 1996spotfire.tibco.com, inspired by Chris Ahlberg’s and BenShneiderman’s ideas about interactive data display, seewww.cs.umd.edu/hcil/spotfire/ and references therein,including Ahlberg & Shneiderman (1994)
Tableau, est. 2003www.tableausoftware.com, inspired by Chris Stolte, DianeTang, and Pat Hanrahan’s work on “Polaris” and VizQL (Vi-sual Query Language), see Stolte et al. (2002)
Microsoft Business Intelligence (“BI”), est. 2000’swww.microsoft.com/en-us/bi/default.aspx, inspired byextensions to Microsoft’s SQL database services and Excelspreadsheet (in the form of “PowerPivot” add-on)
Fig. 4 Tableau Samples
Figure 4 shows a screenshot of just a few of the kinds ofgraphs that Tableau and its ilk produce. Color is used to sub-set and link points shown in multiple displays, and subsetsof particular colors can be defined graphically or algorith-mically, and they can be saved. Pre-made maps like the one
12 An interesting comparison of the last three services, and the simi-lar “QlikView” software (qlikview.com) is at www.practicaldb.com/blog/data-visualization-comparison.
shown in the top panel can be used as backgrounds and pre-defined bounded regions (e.g. US states) can be used as se-lection facets–but new boundaries within an image (knownas new “segmentations”) cannot be easily added.
Similar linked-view software packages for exploringtabular data are available in the Open Source community(LIST 2). These often have less intuitive or polished graph-ical interfaces, but they may become exceptionally usefulas flexible, statistically-sophisticated, modules that can beintegrated into a set of inter-operable tools as discussed inSection 4.
LIST 2: Sample Open-Source and/or Free Linked ViewSoftware for Analyzing Tabular Data
ggobi: www.ggobi.org, cf. the ”rggobi” package inR/CRAN cran.r-project.org/web/packages/rggobi
Mondrian: stats.math.uni-augsburg.de/MondrianWeave13: www.oicweave.orgViewpoints: astrophysics.arc.nasa.gov/˜pgazis/
viewpoints.htm
XmdvTool: http://davis.wpi.edu/xmdvTOPCAT: www.star.bris.ac.uk/˜mbt/topcatViVA Workbench: http://iplant-viva.sourceforge.
net/
TITAN: www.kitware.com/InfovisWiki/index.php/
Main_Page
In geography and demographics, so-called “GIS” or“Geographic Information System” tools such as ESRI’s Ar-cGIS14 and Pitney Bowes’ MapInfo Professional15 and En-gage3D Pro16 offer powerful linked-view systems wheremaps are used as layers. Importantly, though the maps them-selves are not typically treated as data pixel-by-pixel so thatselection within a map is usually along pre-defined regionboundaries, making the selection and extraction of map-based data for an arbitrary user-selected region less thanfully straightforward.
So, are there any working robust tools that offer image-and cube-savvy linked-view visualization and analysis envi-ronments? Sort of. In the early 2000’s there were two no-table attempts to implement an image and/or cube-enabledlinked view tool: WEAVE at IBM (Gresh et al. 2000) andMIRAGE at Bell Labs/Lucent (Ho 2003).
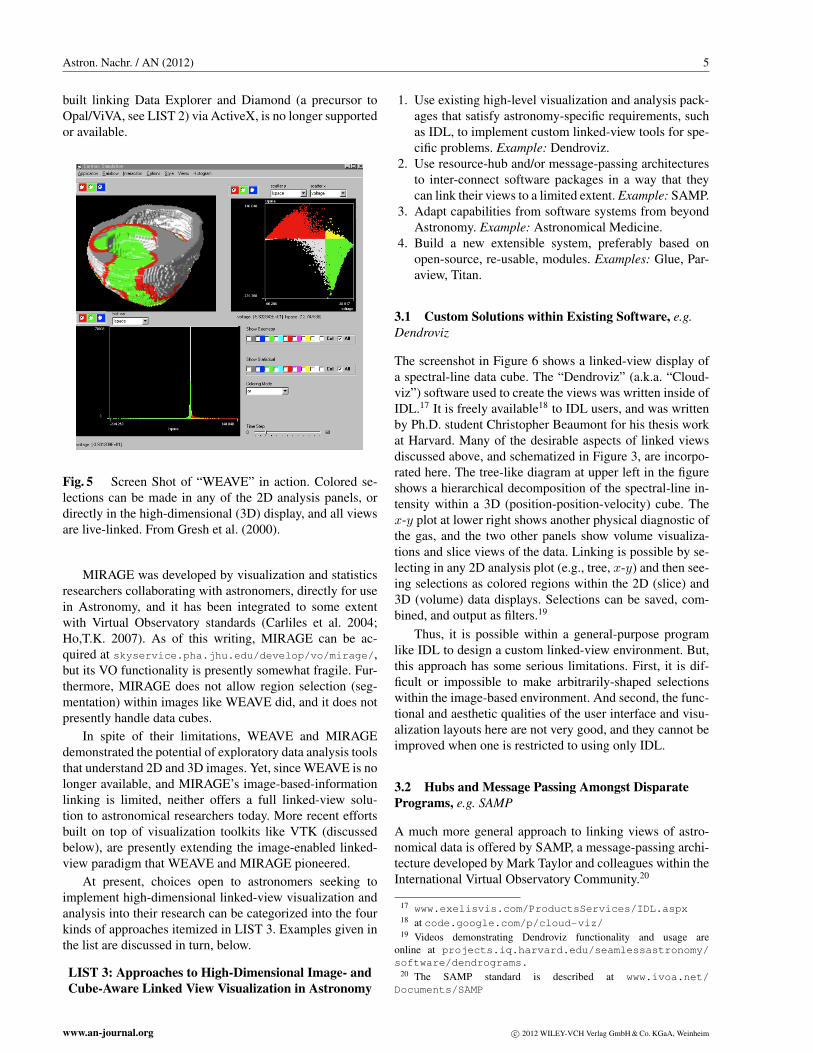
WEAVE was developed in Bernice Rogowitz’ group atIBM Research, to support a collaboration between computerand cognitive scientists with medical researchers. It comesthe closest to a system that would be perfect for the anal-ysis of high-dimensional astronomical data (see Figure 5).Unfortunately, though, the IBM WEAVE project’s software,
13 Note that this “Weave” is not the same as the WEAVE program devel-oped at IBM and described in Gresh et al. (2000)
14 www.esri.com/software/arcgis/15 www.pbinsight.com/products/location-intelligence/
16 www.encom.com.au/template2.asp?pageid=149
c© 2012 WILEY-VCH Verlag GmbH & Co. KGaA, Weinheim www.an-journal.org
Astron. Nachr. / AN (2012) 5
built linking Data Explorer and Diamond (a precursor toOpal/ViVA, see LIST 2) via ActiveX, is no longer supportedor available.
Fig. 5 Screen Shot of “WEAVE” in action. Colored se-lections can be made in any of the 2D analysis panels, ordirectly in the high-dimensional (3D) display, and all viewsare live-linked. From Gresh et al. (2000).
MIRAGE was developed by visualization and statisticsresearchers collaborating with astronomers, directly for usein Astronomy, and it has been integrated to some extentwith Virtual Observatory standards (Carliles et al. 2004;Ho,T.K. 2007). As of this writing, MIRAGE can be ac-quired at skyservice.pha.jhu.edu/develop/vo/mirage/,but its VO functionality is presently somewhat fragile. Fur-thermore, MIRAGE does not allow region selection (seg-mentation) within images like WEAVE did, and it does notpresently handle data cubes.
In spite of their limitations, WEAVE and MIRAGEdemonstrated the potential of exploratory data analysis toolsthat understand 2D and 3D images. Yet, since WEAVE is nolonger available, and MIRAGE’s image-based-informationlinking is limited, neither offers a full linked-view solu-tion to astronomical researchers today. More recent effortsbuilt on top of visualization toolkits like VTK (discussedbelow), are presently extending the image-enabled linked-view paradigm that WEAVE and MIRAGE pioneered.
At present, choices open to astronomers seeking toimplement high-dimensional linked-view visualization andanalysis into their research can be categorized into the fourkinds of approaches itemized in LIST 3. Examples given inthe list are discussed in turn, below.
LIST 3: Approaches to High-Dimensional Image- andCube-Aware Linked View Visualization in Astronomy
1. Use existing high-level visualization and analysis pack-ages that satisfy astronomy-specific requirements, suchas IDL, to implement custom linked-view tools for spe-cific problems. Example: Dendroviz.
2. Use resource-hub and/or message-passing architecturesto inter-connect software packages in a way that theycan link their views to a limited extent. Example: SAMP.
3. Adapt capabilities from software systems from beyondAstronomy. Example: Astronomical Medicine.
4. Build a new extensible system, preferably based onopen-source, re-usable, modules. Examples: Glue, Par-aview, Titan.
3.1 Custom Solutions within Existing Software, e.g.Dendroviz
The screenshot in Figure 6 shows a linked-view display ofa spectral-line data cube. The “Dendroviz” (a.k.a. “Cloud-viz”) software used to create the views was written inside ofIDL.17 It is freely available18 to IDL users, and was writtenby Ph.D. student Christopher Beaumont for his thesis workat Harvard. Many of the desirable aspects of linked viewsdiscussed above, and schematized in Figure 3, are incorpo-rated here. The tree-like diagram at upper left in the figureshows a hierarchical decomposition of the spectral-line in-tensity within a 3D (position-position-velocity) cube. Thex-y plot at lower right shows another physical diagnostic ofthe gas, and the two other panels show volume visualiza-tions and slice views of the data. Linking is possible by se-lecting in any 2D analysis plot (e.g., tree, x-y) and then see-ing selections as colored regions within the 2D (slice) and3D (volume) data displays. Selections can be saved, com-bined, and output as filters.19
Thus, it is possible within a general-purpose programlike IDL to design a custom linked-view environment. But,this approach has some serious limitations. First, it is dif-ficult or impossible to make arbitrarily-shaped selectionswithin the image-based environment. And second, the func-tional and aesthetic qualities of the user interface and visu-alization layouts here are not very good, and they cannot beimproved when one is restricted to using only IDL.
3.2 Hubs and Message Passing Amongst DisparatePrograms, e.g. SAMP
A much more general approach to linking views of astro-nomical data is offered by SAMP, a message-passing archi-tecture developed by Mark Taylor and colleagues within theInternational Virtual Observatory Community.20
17 www.exelisvis.com/ProductsServices/IDL.aspx18 at code.google.com/p/cloud-viz/19 Videos demonstrating Dendroviz functionality and usage are
online at projects.iq.harvard.edu/seamlessastronomy/software/dendrograms.
20 The SAMP standard is described at www.ivoa.net/Documents/SAMP
www.an-journal.org c© 2012 WILEY-VCH Verlag GmbH & Co. KGaA, Weinheim

6 A. Goodman: Astronomical Visualization
Fig. 6 Example: Screen Shot of “DendroViz” project, courtesy C. Beaumont.
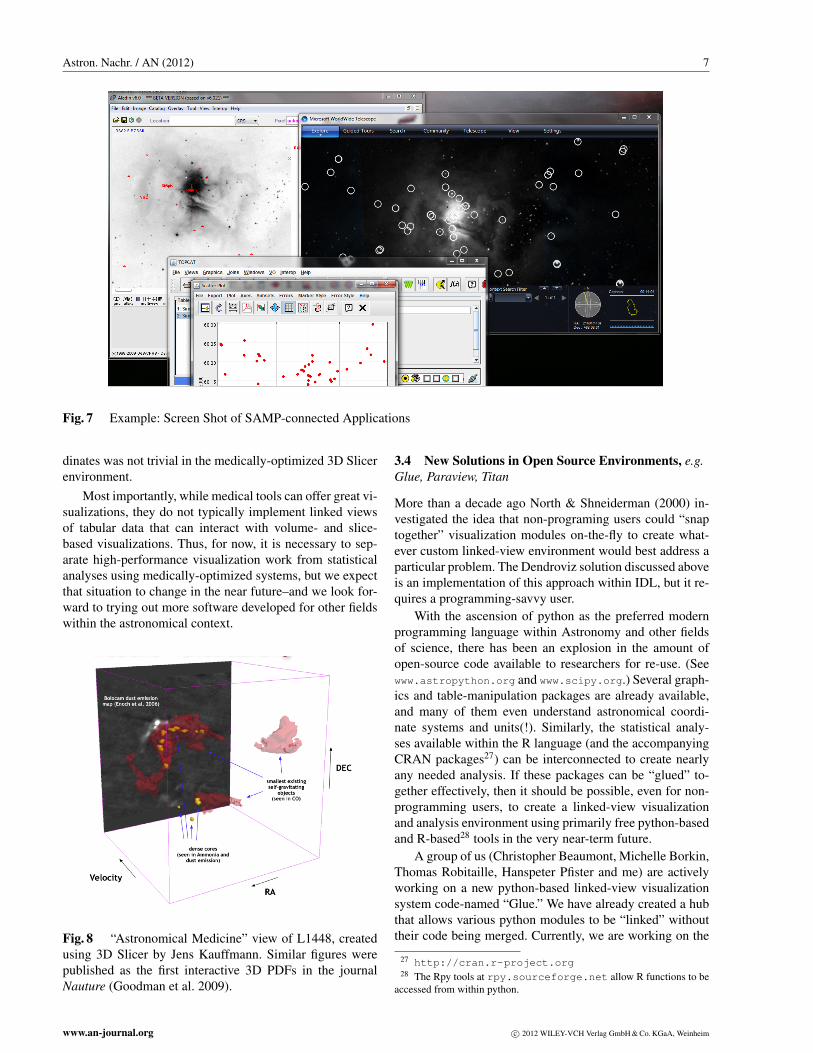
Figure 7 shows a screen shot of SAMP in action. Atthe upper left, an Aladin21 window is open showing thecluster NGC7023, with several catalog sources overlaid.The same region of the sky and catalog data are shown inWorldWide Telescope22 (upper right), and the catalog dataare shown in TOPCAT23, which can manipulate those datain a statistical-graphics environment not unlike DataDesk(lower left). Other popular astronomical analysis environ-ments, like ds924 can also connect to SAMP, but are notshown in this example.
So, what does SAMP do? When applications “connect”to the SAMP hub, as they were during the session capturedin Figure 7, they pass simple messages amongst themselves,telling each other what coordinates and field of view arecurrently being used, and what catalog sources are selectedand sub-setted. Thus, a savvy user can run SAMP to effec-tively link views, bringing the functionality of several pro-grams to bear on the same data set at once, in a concertedway. Other than the screen real-estate challenge posed bythe need to keep track of the (many!) windows open whileSAMP connects disparate applications, the major limitationof the SAMP system at present is the lack of tools to selectarbitrary regions within an image, and link such selections.
The good news is that SAMP has recently been web-enabled, so that java and web-based applications can nowbe connected within a fully online environment.
21 aladin.u-strasbg.fr22 worldwidetelescope.org23 www.star.bris.ac.uk/˜mbt/topcat24 hea-www.harvard.edu/RD/ds9,
3.3 Adaptation from Beyond Astronomy, e.g.Astronomical Medicine
Astronomy is not the only field faced with the challenge ofincorporating high-dimensional information into quantita-tive analyses: geography, medicine, biology, and other fieldsshare similar challenges. The overlap of methods used inthese fields, especially in astronomical and medical imagingand analysis, is far greater than one might imagine at first.Over the past five years, a group of us at Harvard25 havebeen exploring the efficacy of directly adapting tools de-veloped for medical imaging into the astronomical researchenvironment (e.g. Borkin et al. 2007).
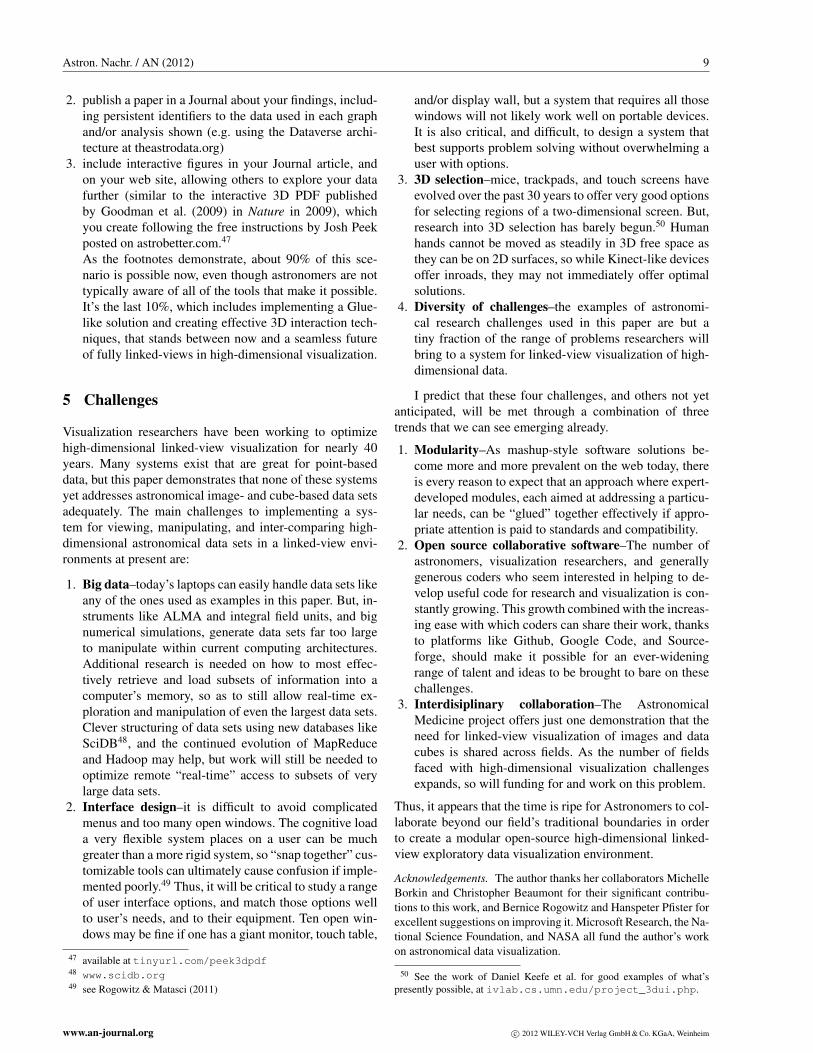
It is clear the the high-dimensional visualization andmanipulation tools available in the medical community,largely based on the VTK and ITK toolkits (discussed fur-ther in §3.4), are far superior to those typically availableto astronomers. Figure 8 shows an example of the useof 3DSlicer, a program developed in part at the SurgicalPlanning laboratory of Brigham and Women’s Hospital inBoston, used to view data about a star-forming region. No-tice that Figure 8 shows multiple 3D spectral-line data setsat once, and a moveable (black and white) 2D plane show-ing a 2D dust image is incorporated as well. Our group atHarvard’s Initiative in Innovative Computing managed towrite a converter (fits2itk) aware of astronomical coordinatesystems to move FITS images into the ITK format26, butpreserving more than astronomical metadata beyond coor-
25 am.iic.harvard.edu26 available at am.iic.harvard.edu/FITS-reader
c© 2012 WILEY-VCH Verlag GmbH & Co. KGaA, Weinheim www.an-journal.org
Astron. Nachr. / AN (2012) 7
Fig. 7 Example: Screen Shot of SAMP-connected Applications
dinates was not trivial in the medically-optimized 3D Slicerenvironment.
Most importantly, while medical tools can offer great vi-sualizations, they do not typically implement linked viewsof tabular data that can interact with volume- and slice-based visualizations. Thus, for now, it is necessary to sep-arate high-performance visualization work from statisticalanalyses using medically-optimized systems, but we expectthat situation to change in the near future–and we look for-ward to trying out more software developed for other fieldswithin the astronomical context.
Fig. 8 “Astronomical Medicine” view of L1448, createdusing 3D Slicer by Jens Kauffmann. Similar figures werepublished as the first interactive 3D PDFs in the journalNauture (Goodman et al. 2009).
3.4 New Solutions in Open Source Environments, e.g.Glue, Paraview, Titan
More than a decade ago North & Shneiderman (2000) in-vestigated the idea that non-programing users could “snaptogether” visualization modules on-the-fly to create what-ever custom linked-view environment would best address aparticular problem. The Dendroviz solution discussed aboveis an implementation of this approach within IDL, but it re-quires a programming-savvy user.
With the ascension of python as the preferred modernprogramming language within Astronomy and other fieldsof science, there has been an explosion in the amount ofopen-source code available to researchers for re-use. (Seewww.astropython.org and www.scipy.org.) Several graph-ics and table-manipulation packages are already available,and many of them even understand astronomical coordi-nate systems and units(!). Similarly, the statistical analy-ses available within the R language (and the accompanyingCRAN packages27) can be interconnected to create nearlyany needed analysis. If these packages can be “glued” to-gether effectively, then it should be possible, even for non-programming users, to create a linked-view visualizationand analysis environment using primarily free python-basedand R-based28 tools in the very near-term future.
A group of us (Christopher Beaumont, Michelle Borkin,Thomas Robitaille, Hanspeter Pfister and me) are activelyworking on a new python-based linked-view visualizationsystem code-named “Glue.” We have already created a hubthat allows various python modules to be “linked” withouttheir code being merged. Currently, we are working on the
27 http://cran.r-project.org28 The Rpy tools at rpy.sourceforge.net allow R functions to be
accessed from within python.
www.an-journal.org c© 2012 WILEY-VCH Verlag GmbH & Co. KGaA, Weinheim

8 A. Goodman: Astronomical Visualization
user interface, and ultimately our plan is to connect Glueto R and to SAMP-enabled applications, which would of-fer a true “snap together” linked-view visualization environ-ment for Astronomers, and for other researchers. Glue willbe fully open-source, available , and we more than welcomecollaboration from the community in this endeavor.29
Glue should be able to build upon and extend impor-tant packages that use the Visualization Tool Kit (VTK)30
as a scientific visualization platform. The 3DSlicer pro-gram used in the Astronomical Medicine project is an ex-ample VTK being used to create a sophisticated medicalvisualization system. More general efforts, such as Par-aview,31 are applicable to many non-medical data formats,including astronomical simulation outputs (but not yet ob-servational formats that use astronomical coordinates). And,most promisingly, the collaborative Titan effort,32 marriesVTK-based scientific visualization to information and sta-tistical visualization modules,33 including those from open-source efforts such as R/CRAN.
4 Seamless Astronomy: A Vision for theFuture
To understand what we34 mean when we say we strive for“seamless” astronomical research, imagine this:35
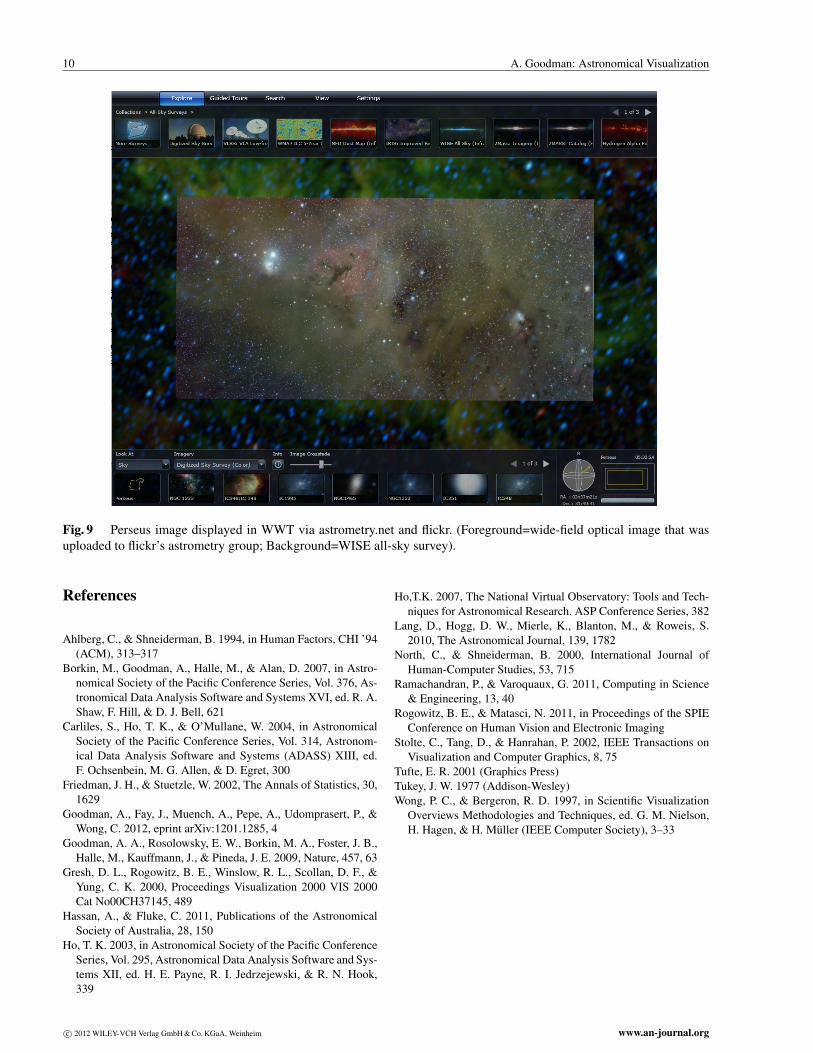
A smartphone application featuring interesting new astron-omy images shows you the inset image in the middle of Fig-ure 9. You have wireless connectivity and some kind of largedisplay handy, and you are curious to know more. First, youflick the image off your phone to your large display.36 Next,you find out where this image belongs on the sky, using arecognition service that either examines embedded meta-data in its header37, or its content38. Now you use VO ser-vices embedded in any number of applications, for examplethe WorldWide Telescope39(Goodman et al. 2012), to putthis image in context, allowing you to view how it looks incomparison to extant images at many wavelengths.40 Fig-
29 See projects.iq.harvard.edu/seamlessastronomy/software for more information.
30 www.kitware.com/products/books.html31 www.paraview.org32 www.kitware.com/InfovisWiki/index.php/Main_Page
33 There is a growing class of such efforts, including the Mayavi project(Ramachandran & Varoquaux 2011), which combines VTK and Python ina modular, extensible, fashion.
34 projects.iq.harvard.edu/seamlessastronomy/35 Footnotes in this section offer live links to what is possible now.36 Already possible using, for example, AirPlay from Apple.37 Possible using AVM tags, see virtualastronomy.org/avm_metadata.php.
38 astrometry.net can find the position of any image just based onthe pattern of visible stars it contains
39 worldwidetelescope.org40 Presently in WWT, one can locate an image based on a FITS header,
AVM header, from metadata passed from astrometry.net (Lang et al. 2010),via flickr www.flickr.com/groups/astrometry/, or by register-ing features by hand. The WWT view shown in Figure 9 can be recreated at
ure 9 shows the result of uploading this image to the “as-trometry” group on flickr, and then selecting the “View inWorldWide Telescope” link that appears in the commentson the resulting page41 a few minutes later, and then chang-ing the background view to show the latest WISE infraredimagery. You’re wondering about the young-star populationin the area, so you first use the VO-searching capabilitiesbuilt in to WWT to add an overlay of 2MASS sources (notshown here, due to high density of such sources!), and thenlater you connect WWT to other astronomical and visual-ization applications using SAMP and Glue. You’re curiousif there are any molecular-line maps of this region, so youuse the features built-in to WWT and ADSLabs42 to findand display a list of all the papers that mention “data cubes”and study this region. One of them has a great map of 13COemission in the Perseus, and you want to see the 2D im-ages in Figure 9 and the catalogs you have retrieved onlinein the context of those 3D maps. You’re lucky and the per-son publishing the CO map included persistent hdl tags inher paper that lead you to a “Dataverse”43 online repositoryat theastrodata.org, where you can retrieve and/or linkto the data cube.44 Now, you call upon the capabilities ofGlue to display and analyze a live-linked combination of:the 3D spectral-line data; moveable planes that hold the im-agery shown in Figure 9; the catalogs you’ve linked to viaSAMP; and a calculated “dendrogram” decomposition ofthe 3D data you calculated using a module within Glue.
Using exploratory data analysis and linked views, youbegin to notice correlations and outliers amongst the variousdimensions of data you’ve displayed. It’s tricky to make andexplore some of the selections you want to make within the3D volumes, so you use your hands in the air, as sensed bya high-dimensional pointing device,45 to make those selec-tions. It seems that there are big shells within the CO dataset that seem associated with young stars. How young arethe stars? You go to the astrobetter.com site and discovera new algorithm, written in R, that offers better estimatesof young stars’ ages. So, you download that algorithm, andyou kindly decide to make this new algorithm part of Glueby using Rpy, the Python interface to R,46 to create a smallPython program that uses R’s statistical power to analyzethe information about the young stars. When you’re donewith your analysis, you:
1. publish your new Python-based young star age mod-ule to the Glue code repositories online (e.g. Github,Sourceforge)
tinyurl.com/seeperseus, by zooming out a bit and then selectingWISE from the Collection “All Sky Surveys” as the background imagery.
41 www.flickr.com/photos/66496709@N00/6791649829/42 adslabs.org43 thedata.org44 at tinyurl.com/complete13COper45 At present, the Microsoft Kinect is a good, albeit low-resolution, ex-
ample of such a device. The Leap www.leapmotion.com may be thenext, higher-resolution step.
46 rpy.sourceforge.net/
c© 2012 WILEY-VCH Verlag GmbH & Co. KGaA, Weinheim www.an-journal.org
Astron. Nachr. / AN (2012) 9
2. publish a paper in a Journal about your findings, includ-ing persistent identifiers to the data used in each graphand/or analysis shown (e.g. using the Dataverse archi-tecture at theastrodata.org)
3. include interactive figures in your Journal article, andon your web site, allowing others to explore your datafurther (similar to the interactive 3D PDF publishedby Goodman et al. (2009) in Nature in 2009), whichyou create following the free instructions by Josh Peekposted on astrobetter.com.47
As the footnotes demonstrate, about 90% of this sce-nario is possible now, even though astronomers are nottypically aware of all of the tools that make it possible.It’s the last 10%, which includes implementing a Glue-like solution and creating effective 3D interaction tech-niques, that stands between now and a seamless futureof fully linked-views in high-dimensional visualization.
5 Challenges
Visualization researchers have been working to optimizehigh-dimensional linked-view visualization for nearly 40years. Many systems exist that are great for point-baseddata, but this paper demonstrates that none of these systemsyet addresses astronomical image- and cube-based data setsadequately. The main challenges to implementing a sys-tem for viewing, manipulating, and inter-comparing high-dimensional astronomical data sets in a linked-view envi-ronments at present are:
1. Big data–today’s laptops can easily handle data sets likeany of the ones used as examples in this paper. But, in-struments like ALMA and integral field units, and bignumerical simulations, generate data sets far too largeto manipulate within current computing architectures.Additional research is needed on how to most effec-tively retrieve and load subsets of information into acomputer’s memory, so as to still allow real-time ex-ploration and manipulation of even the largest data sets.Clever structuring of data sets using new databases likeSciDB48, and the continued evolution of MapReduceand Hadoop may help, but work will still be needed tooptimize remote “real-time” access to subsets of verylarge data sets.
2. Interface design–it is difficult to avoid complicatedmenus and too many open windows. The cognitive loada very flexible system places on a user can be muchgreater than a more rigid system, so “snap together” cus-tomizable tools can ultimately cause confusion if imple-mented poorly.49 Thus, it will be critical to study a rangeof user interface options, and match those options wellto user’s needs, and to their equipment. Ten open win-dows may be fine if one has a giant monitor, touch table,
47 available at tinyurl.com/peek3dpdf48 www.scidb.org49 see Rogowitz & Matasci (2011)
and/or display wall, but a system that requires all thosewindows will not likely work well on portable devices.It is also critical, and difficult, to design a system thatbest supports problem solving without overwhelming auser with options.
3. 3D selection–mice, trackpads, and touch screens haveevolved over the past 30 years to offer very good optionsfor selecting regions of a two-dimensional screen. But,research into 3D selection has barely begun.50 Humanhands cannot be moved as steadily in 3D free space asthey can be on 2D surfaces, so while Kinect-like devicesoffer inroads, they may not immediately offer optimalsolutions.
4. Diversity of challenges–the examples of astronomi-cal research challenges used in this paper are but atiny fraction of the range of problems researchers willbring to a system for linked-view visualization of high-dimensional data.
I predict that these four challenges, and others not yetanticipated, will be met through a combination of threetrends that we can see emerging already.
1. Modularity–As mashup-style software solutions be-come more and more prevalent on the web today, thereis every reason to expect that an approach where expert-developed modules, each aimed at addressing a particu-lar needs, can be “glued” together effectively if appro-priate attention is paid to standards and compatibility.
2. Open source collaborative software–The number ofastronomers, visualization researchers, and generallygenerous coders who seem interested in helping to de-velop useful code for research and visualization is con-stantly growing. This growth combined with the increas-ing ease with which coders can share their work, thanksto platforms like Github, Google Code, and Source-forge, should make it possible for an ever-wideningrange of talent and ideas to be brought to bare on thesechallenges.
3. Interdisiplinary collaboration–The AstronomicalMedicine project offers just one demonstration that theneed for linked-view visualization of images and datacubes is shared across fields. As the number of fieldsfaced with high-dimensional visualization challengesexpands, so will funding for and work on this problem.
Thus, it appears that the time is ripe for Astronomers to col-laborate beyond our field’s traditional boundaries in orderto create a modular open-source high-dimensional linked-view exploratory data visualization environment.
Acknowledgements. The author thanks her collaborators MichelleBorkin and Christopher Beaumont for their significant contribu-tions to this work, and Bernice Rogowitz and Hanspeter Pfister forexcellent suggestions on improving it. Microsoft Research, the Na-tional Science Foundation, and NASA all fund the author’s workon astronomical data visualization.
50 See the work of Daniel Keefe et al. for good examples of what’spresently possible, at ivlab.cs.umn.edu/project_3dui.php.
www.an-journal.org c© 2012 WILEY-VCH Verlag GmbH & Co. KGaA, Weinheim
10 A. Goodman: Astronomical Visualization
Fig. 9 Perseus image displayed in WWT via astrometry.net and flickr. (Foreground=wide-field optical image that wasuploaded to flickr’s astrometry group; Background=WISE all-sky survey).
References
Ahlberg, C., & Shneiderman, B. 1994, in Human Factors, CHI ’94(ACM), 313–317
Borkin, M., Goodman, A., Halle, M., & Alan, D. 2007, in Astro-nomical Society of the Pacific Conference Series, Vol. 376, As-tronomical Data Analysis Software and Systems XVI, ed. R. A.Shaw, F. Hill, & D. J. Bell, 621
Carliles, S., Ho, T. K., & O’Mullane, W. 2004, in AstronomicalSociety of the Pacific Conference Series, Vol. 314, Astronom-ical Data Analysis Software and Systems (ADASS) XIII, ed.F. Ochsenbein, M. G. Allen, & D. Egret, 300
Friedman, J. H., & Stuetzle, W. 2002, The Annals of Statistics, 30,1629
Goodman, A., Fay, J., Muench, A., Pepe, A., Udomprasert, P., &Wong, C. 2012, eprint arXiv:1201.1285, 4
Goodman, A. A., Rosolowsky, E. W., Borkin, M. A., Foster, J. B.,Halle, M., Kauffmann, J., & Pineda, J. E. 2009, Nature, 457, 63
Gresh, D. L., Rogowitz, B. E., Winslow, R. L., Scollan, D. F., &Yung, C. K. 2000, Proceedings Visualization 2000 VIS 2000Cat No00CH37145, 489
Hassan, A., & Fluke, C. 2011, Publications of the AstronomicalSociety of Australia, 28, 150
Ho, T. K. 2003, in Astronomical Society of the Pacific ConferenceSeries, Vol. 295, Astronomical Data Analysis Software and Sys-tems XII, ed. H. E. Payne, R. I. Jedrzejewski, & R. N. Hook,339
Ho,T.K. 2007, The National Virtual Observatory: Tools and Tech-niques for Astronomical Research. ASP Conference Series, 382
Lang, D., Hogg, D. W., Mierle, K., Blanton, M., & Roweis, S.2010, The Astronomical Journal, 139, 1782
North, C., & Shneiderman, B. 2000, International Journal ofHuman-Computer Studies, 53, 715
Ramachandran, P., & Varoquaux, G. 2011, Computing in Science& Engineering, 13, 40
Rogowitz, B. E., & Matasci, N. 2011, in Proceedings of the SPIEConference on Human Vision and Electronic Imaging
Stolte, C., Tang, D., & Hanrahan, P. 2002, IEEE Transactions onVisualization and Computer Graphics, 8, 75
Tufte, E. R. 2001 (Graphics Press)Tukey, J. W. 1977 (Addison-Wesley)Wong, P. C., & Bergeron, R. D. 1997, in Scientific Visualization
Overviews Methodologies and Techniques, ed. G. M. Nielson,H. Hagen, & H. Muller (IEEE Computer Society), 3–33
c© 2012 WILEY-VCH Verlag GmbH & Co. KGaA, Weinheim www.an-journal.org