principles of neutralization titrations -...
TRANSCRIPT

Chapter 14
Principles of Neutralization Titrations

Neutralization titrations are widely used to determine the amounts of acids and bases and to monitor the progress of reactions that produce or consume hydrogen ions.
This chapter explores the principles of acid/base titrations. In addition, we investigate titration curves that are plots of pH vs. volume of titrant, and present several examples of pH calculations.
14 A Solutions and indicators for acid/base titrations
Neutralization titrations depend on a chemical reaction of the analyte with a standard reagent. There are several different types of acid/base titrations.
1. The titration of a strong acid, such as hydrochloric or sulfuric acid, with a strong base, such as sodium hydroxide.
2. The titration of a weak acid, such as acetic or lactic acid, with a strong base.
3. The titration of a weak base, such as sodium cyanide or sodium salicylate, with a strong acid.
• In all titrations, we must have a method of determining the point of chemical equivalence
• Typically, a chemical indicator or an instrumental method is used to locate the end point, which we hope is very close to the equivalence point. Our discussion focuses on the types of standard solutions and the chemical indicators that are used for neutralization titr. ns

Standard Solutions
The standard reagents used in acid/base titrations are always strong acids or strong bases, such as HCl, HClO4, H2SO4, NaOH, and KOH.
Weak acids and bases are never used as standard reagents because they react incompletely with analytes.
Standard solutions of acids are prepared by diluting concentrated hydrochloric, perchloric, or sulfuric acid.
Nitric acid is seldom used because its oxidizing properties offer the potential for undesirable side reactions.
Hot concentrated perchloric and sulfuric acids are potent oxidizing agents and are very hazardous.

Acid/Base Indicators
An acid/base indicator is a weak organic acid or a weak organic base whose undissociated form differs in color from its conjugate base or its conjugate acid form.
For example, the behavior of an acid-type indicator, HIn:
HIn + H2O In- + H3O+
acid color base color
The equilibrium for a base-type indicator, In:
In + H2O InH+ + OH-
base color acid color
The equilibrium-constant expression for the dissociation of an acid-type indicator is
Ka = [H3O+][In-] Rearranging leads to [H3O+] = Ka . [HIn]
[HIn] [In-]
We see then that the hydronium ion is proportional to the ratio of the concentration of the acid form to the concentration of the base form of the indicator, which in turn controls the color of the solution.

The human eye is not very sensitive to color differences in a solution containing a mixture of HIn and In-, particularly when the ratio [HIn]/[In -] is greater than about 10 or smaller than about 0.1.
HIn, exhibits its pure acid color when
[HIn]/[In-] 10/1
and its base color when
[HIn]/[In-] 1/10
Therefore, the range of hydronium ion concentrations needed for the indicator to change color can be estimated.
For full acid color, [H3O+] = 10Ka
and for the full base color, [H3O+] = 0.1Ka
Figure 14-1 Color change and molecular
modes for phenolphthalein.
(a) Acidic form b) Basic form. To obtain the indicator pH range, we take the negative logarithms of the two expressions:
pH (acid color) = -log(10Ka) = pKa + 1 pH (basic color) = -log(0.1Ka) = pKa – 1
Indicator pH range = pKa 1
an indicator with an acid dissociation constant of 10-5 (pKa=5 ) typically shows a complete color change when the pH of the solution in which it is dissolved changes from 4 to 6
Titration Errors with Acid/Base Indicators
There are two types of titration error in acid/base titrations:
Determinate error that occurs when the pH at which the indicator changes color differs from the pH at the equivalence point.
It can usually be minimized by choosing the indicator carefully or by making a blank correction.
Indeterminate error that originates from the limited ability of the human eye to distinguish reproducibly the intermediate color of the indicator.
The magnitude of this error depends on the change in pH per milliliter of reagent at—the equivalence point, on the concentration of the indicator, and on the sensitivity of the eye to the two indicator colors.

Variables That Influence the Behavior of Indicators
The pH interval over which a given indicator exhibits
a color change is influenced by
* temperature,
* the ionic strength of the medium, and
* the presence of organic solvents and colloidal particles.
Some of these effects can cause the transition range to shift by one or more pH units.
Figure 14-2 Indicator color as a function
of pH (pKa 5 5.0).

The Common Acid/Base Indicators
1 2 3 4 5 6 7 8 9 10 11 12
pH
Methyl orange (3.2–4.4) Bromocresol green (3.8–5.4)
1 2 3 4 5 6 7 8 9 10 11 12
pH

The hydronium ions in an aqueous solution of a strong acid have two sources:
(1) the reaction of the acid with water and
(2) the dissociation of water itself.
In all but the most dilute solutions, however, the contribution from the strong acid
far exceeds that from the solvent ( mostly water). For a solution of HCl with a concentration greater than about 10-6 M:
[H3O+] = cHCL + [OH-] cHCL
where [OH-] represents the contribution of hydronium ions from the dissociation of water.
For a solution of a strong base, such as sodium hydroxide:
[OH-] = cNAOH + [H3O+] cNAOH
14 B Titration of strong acids and bases

Three types of calculations must be done to construct the hypothetical curve for titrating a solution of a strong acid with a strong base.
(1) Preequivalence; compute the concentration of the acid from its starting concentration and the amount of base added.
(2) Equivalence: the hydronium ion concentration can be calculated directly from the ion-product constant for water, Kw.
(3) Postequivalence: the analytical concentration of the excess base is computed, and the hydroxide ion concentration is assumed to be equal to or a multiple of the analytical concentration.
Converting hydroxide concentration to pH can be developed by taking the negative logarithm of both sides of the ion-product constant expression for water. Thus,
Kw = [H3O+][OH-]
-log Kw = -log [H3O+][OH-] = -log[H3O+] – log[OH-]
pKw = pH + pOH
14B-1 Titrating a Strong Acid with a Strong Base
At the equivalence point,
the solution is neutral, and
pH = pOH = 7.00, at 25C.
Beyond the equivalence point, we first
calculate pOH and then pH.
Remember that pH = pKw - pOH.
At 25C, pH = 14.00 - pOH.


The effects of reagent and analyte concentration on the neutralization titration
curves for strong acids are shown.
Figure 14-3 Titration curves for HCl with NaOH.
Curve A: 50.00 mL of 0.0500 M HCl with 0.1000 M NaOH.
Curve B: 50.00 mL of 0.000500 M HCl with 0.00100 M NaOH.
Phenolphthalein (8.0–10.0)
Bromothymol (6.0–7.0)
Bromocresol green (3.8–5.4)
The Effect of Concentration
Choosing an Indicator
The selection of an indicator is not
critical when the reagent concentration
is approximately 0.1 M.
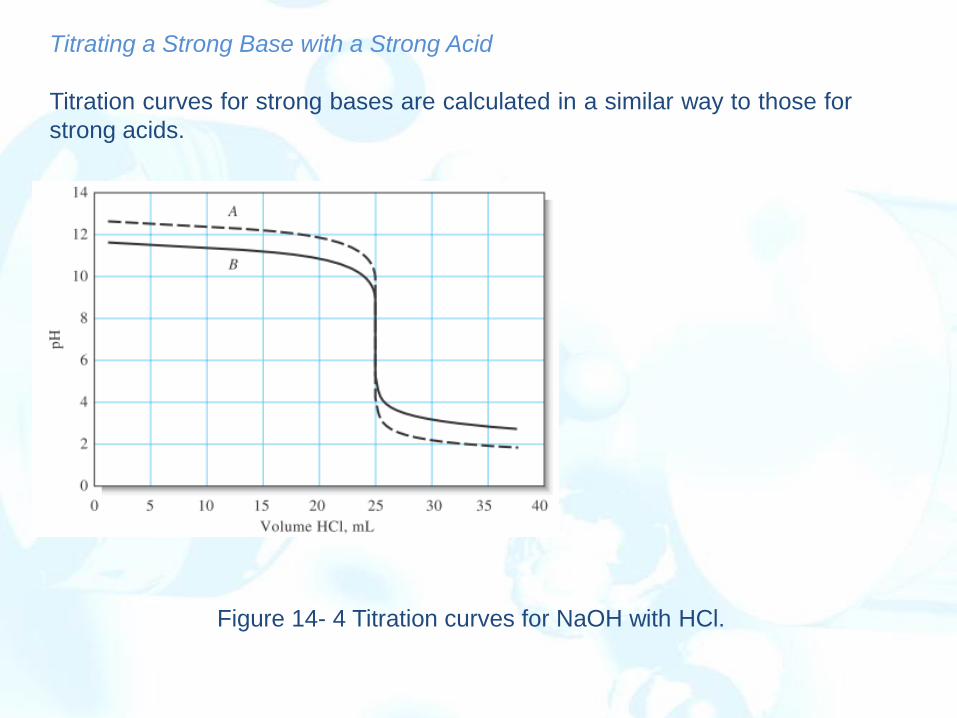
Titrating a Strong Base with a Strong Acid
Titration curves for strong bases are calculated in a similar way to those for
strong acids.
Figure 14- 4 Titration curves for NaOH with HCl.


14 C Titration curves for weak acids
Four distinctly different types of calculations are needed to compute values for a weak acid (or a weak base) titration curve:
1. At the beginning, the solution contains only a weak acid or a weak base, and the pH is calculated from the concentration of that solute and its dissociation constant.
2. After various increments of titrant have been added (up to, but not including, the equivalence point), the solution consists of a series of buffers.
The pH of each buffer can be calculated from the analytical concentrations of the conjugate base or acid and the concentrations of the weak acid or base that remains.
3. At the equivalence point, the solution contains only the conjugate of the weak acid or
base being titrated (that is, a salt), and the pH is calculated from the concentration of this product.
4. Beyond the equivalence point, the excess of strong acid or base titrant suppresses the acidic or basic character of the reaction product to such an extent that the pH is governed largely by the concentration of the excess titrant.


The analytical concentrations of acid and conjugate base are identical when an acid has been half neutralized. The buffer capacities of each of the solutions are at a maximum at this point and these points, often called the half-titration points. At the half-titration point in a weak-acid titration, [H3O+] = Ka and pH = pKa
Determining Dissociation Constants
of Weak Acids and Bases
The dissociation constants of weak
acids or weak bases are often
determined by monitoring the pH of the
solution while the acid or base is being
titrated. A pH meter with a glass pH
electrode is used for the
measurements. The titration is
recorded from the initial pH until after
the end point. The pH at one-half the
end point volume is then obtained and
used to obtain the dissociation
constant.

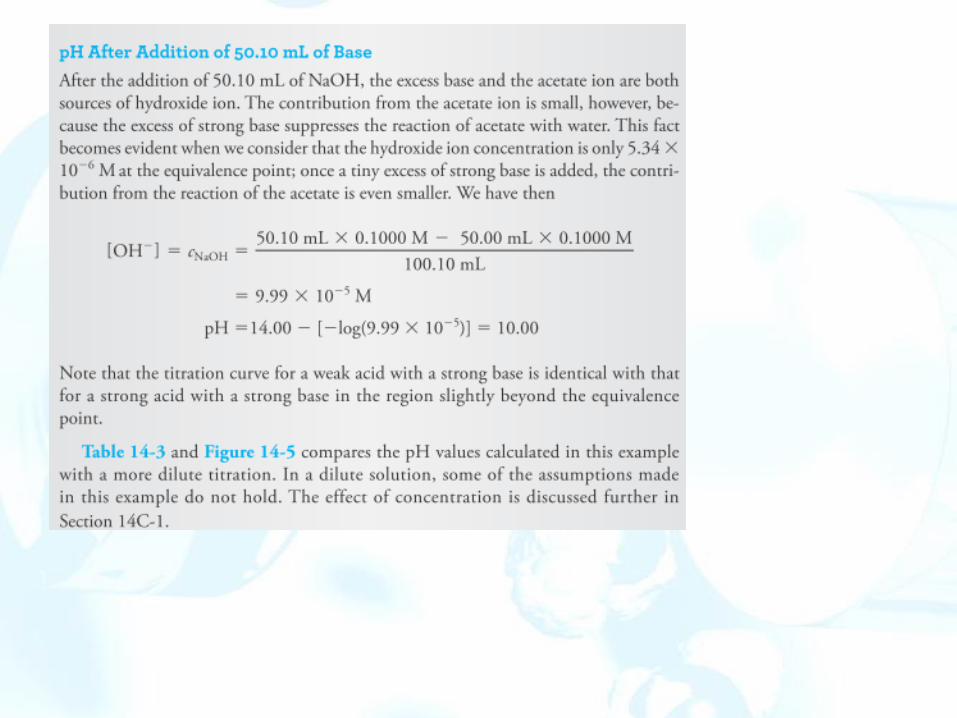

Figure 14-5 Curve for the titration of acetic acid with sodium hydroxide. Curve A: 0.1000 M acid with 0.1000 M base. Curve B: 0.001000 M acid with 0.001000 M base.
Figure 14-5 illustrates that bromocresol green is totally unsuited for titration of 0.1000 M acetic acid. Bromothymol blue does not work either because its full color change occurs over a range of titrant volume from about 47 mL to 50 mL of 0.1000 M base. On the other hand, an indicator exhibiting a color change in the basic region, such as phenolphthalein, provides a sharp end point with a minimal titration error. The end-point pH change associated with the titration of 0.001000 M acetic acid (curve B)is so small that there is likely to be a significant titration error regardless of indicator.
14C-1 The Effect of Concentration
The initial pH values are higher and the equivalence-point pH is lower for the more dilute solution (Curve B).
At intermediate titrant volumes, however, the pH values differ only slightly because of the buffering action of the acetic acid/sodium acetate system that is present in this region.
14C-3 Choosing an Indicator:
However, using an indicator with a transition range between that of phenolphthalein and that of bromothymol blue in conjunction with a suitable color comparison standard makes it possible to establish the end point in this titration with decent precision (a few percent relative standard deviation).

Figure14-6 The effect of acid strength
(dissociation constant) on titration curves.
The Effect of Reaction Completeness Titration curves for 0.1000 M solutions
of acids with different dissociation constants are shown.
The pH change in the equivalence point
region becomes smaller as the acid becomes weaker.
14C-3 Choosing an Indicator:
The Feasibility of Titration Figures 14-5 and 14-6 show that the choice of indicator is more limited for the titration of a weak acid than for the titration of a strong acid.
Figure 14-6 illustrates that similar problems occur as the strength of the acid being titrated decreases. A precision on the order of ± 2 ppt can be achieved by titrating a 0.1000 M solution of an acid with a dissociation constant of 10-8 if a suitable color comparison standard is available. With more concentrated solutions, weaker acids can be titrated with reasonable precision.

14D Titration curves for weak bases


The curves show that indicators with mostly acidic transition ranges must be used for weak bases.
Figure 14-7 Hypothetical titration curves for
a series of weak bases of different
strengths. Each curve represents the
titration of 50.00 mL of 0.1000 M base with
0.1000 M HCl
* When you titrate a weak base, use
an indicator with a mostly acidic
transition range.
* When titrating a weak acid, use an
indicator with a mostly basic
transition range.


The changes in composition that occur while a solution of a weak acid or a weak base is being titrated can be visualized by plotting the relative equilibrium concentration a0 of the weak acid as well as the relative equilibrium concentration of the conjugate base a1 as functions of the pH of the solution.
Figure 14-8 Plots of relative amounts of acetic acid and acetate ion during a titration.
The straight lines show the change in relative amounts of HOAc (0) and OAc- (1) during the titration of 50.00 mL of 0.1000 M acetic acid. The curved line is the titration curve for the system.
* Note that at the beginning of the titration 0 is nearly 1 (0.987) meaning that 98.7% of the acetate containing species is present as HOAc and only 1.3% is present as OAc-. * At the equivalence point, 0 decreases to 1.1x10⁻⁴, and 1 approaches 1. * Thus, only about 0.011% of the acetate containing species is HOAc. Notice that, at the half-titration point (25.00 mL), 0 and 1 are both 0.5.
* For polyprotic acids (see Chapter 15), the alpha values are very useful in illustrating the changes in solution composition during titrations.
14 E The composition of solutions during acid/base titrations

Feature 14-6 Locating Titration End Points from pH Measurements
Figure 14F-4 In (a), the titration curve of 50.00 mL of
0.1000 M weak acid with 0.1000 M NaOH is shown as
collected by a pH meter.
In (b), the second derivative is shown on an expanded
scale. Note that the second derivative crosses zero at
the end point. This can be used to locate the end point
very precisely.
The end point can be taken as the inflection
point of the titration curve.
With a sigmoid-shaped titration curve, the
inflection point is the steepest part of the
titration curve where the pH change with
respect to volume is a maximum.
This point can be estimated visually from the
plot or we can use calculus to find the first and
second derivatives of the titration curve.
The first derivative, which is approximately
pH/ V, is the slope of the titration curve. It
goes from nearly zero far before the end point
to a maximum at the end point back to zero far
beyond the end point.
We can differentiate the curve a second time
to locate the maximum of the first derivative
since the slope of the first derivative changes
dramatically from a large positive value to a
large negative value as we pass through the
maximum in the first derivative curve.
This is the basis for locating the end point by
taking the second derivative.

Figure 14F-5 Gran plot for the titration of 50.00 mL of 0.1000 M weak acid (Ka=1.00x10⁻⁵) with 0.1000 M NaOH. The least-squares equation for the line is given in the figure.
The Gran plot is an alternative method for locating the end point in a titration. In this method, a linear plot is produced that can reveal both the acid dissociation constant and the volume of base required to reach the end point. Unlike the normal titration curve and derivative curves, which find the end point only from data located in the end point region, the Gran plot uses data far away from the end point.
The Gran plot:
A plot of the left-hand side of this equation versus
the volume of titrant, VNaOH, should yield a straight
line with a slope of -Ka and an intercept of KaVeq
This method can decrease the tedium
of making many measurements after
dispensing tiny volumes of titrant in
the end point region.
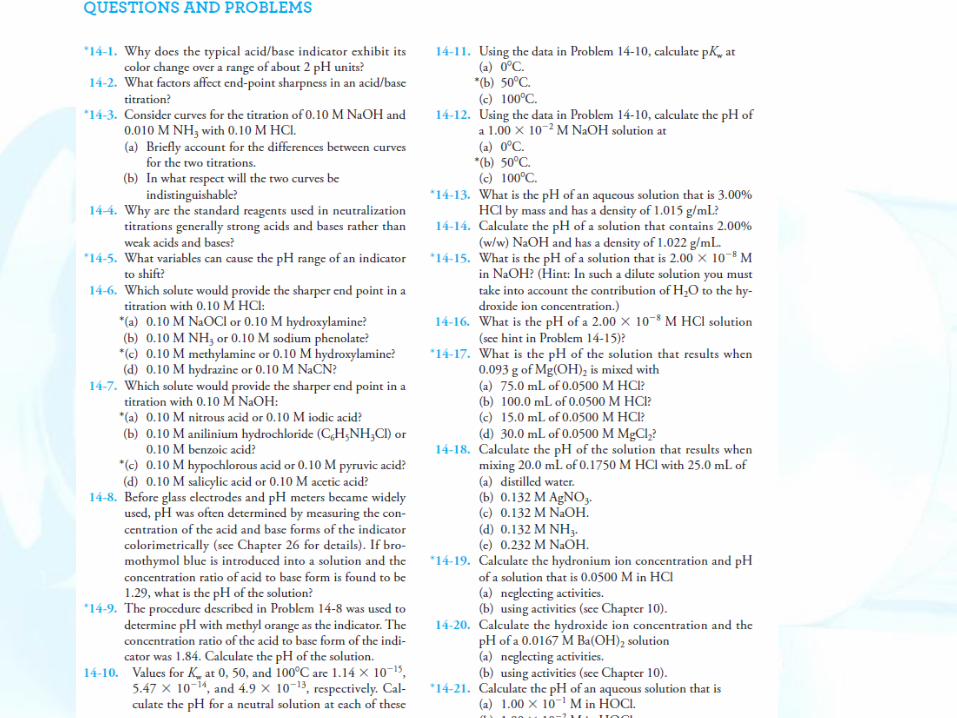


Homework (Due 20/03/2018)
Chapter 14, Questions and Problems
14-1, 14-3, 14-6, 14-8, 14-10, 14-12, 14-15, 14-16, 14-18, 14-21,
14-22, 14-23, 14-24, 14-27, 14-30, 14-32, 14-41(c), 14-42(a),
14-43(d)
End of Chapter 14
32/35