principles, rules, bright lines and transaction ... · 1 principles, rules, bright lines and...
TRANSCRIPT

1
Principles, Rules, Bright Lines and Transaction Structuring: A Cross-Regime Study of Lessees
Darren Henderson University of Western Ontario
Patricia C. O’Brien* University of Waterloo [email protected]
March 2014
Abstract: We study lease accounting in an international panel data set to examine how accounting outcomes vary with the emphasis on using professional judgement to apply principles, and with the presence or absence of “bright line” tests. We study four countries: Australia, Canada, the UK and the US, and companies in two lease-intensive industries, retail and transportation. Our study period spans the time when Australia and the UK switched from domestic to international accounting standards. We find that neither requiring professional judgement over principles nor omitting bright-line tests materially increases the use of capital lease treatment. Overall, we conclude that financial reporting outcomes are relatively insensitive to these standard-setting tools. Keywords: principles-based standards; rules-based standards; lease accounting; bright lines; IFRS. The authors are grateful to Catalina Anghel, Vishal Baloria, Joseph Cheng, Andrea Down and Deanna Qi for excellent research assistance, and to the Ernst & Young Professorship at the University of Waterloo and the Social Sciences and Humanities Research Council of Canada for financial assistance. For helpful comments, we thank seminar participants at the University of Waterloo and conference participants at the 2012 AAA-IAS and 2012 CAAA annual meetings, particularly Bradley Pomeroy, Changling Chen, Duane Kennedy, Roger Silvers, Kim Trottier, Christine Wiedman. All errors and omissions are ours.
*corresponding author

2
Principles, Rules, Bright Lines and Transaction Structuring: A Cross-Regime Study of Lessees
“One of my great ambitions before I die is to fly in an aircraft that is on an airline’s balance sheet.” -- Sir David Tweedie, (former) IASB chairman1
1. INTRODUCTION
Standard-setters have long recognized leasing transactions as a potential threat to fair
presentation of a company’s financial position. In 1976, FAS13 introduced capital lease
treatment to account for leases that are similar to outright purchases, while IAS17 featured
similar treatment in 1982.2 US companies responded to FAS13 by altering their lease contracts
to avoid capital lease accounting, retaining leased assets’ off-balance-sheet status (Imhoff and
Thomas (1988)). Further, entire industries came into existence solely to structure lease contracts
to avoid capital lease treatment (SEC 2008 p. 41). Most observers trace these outcomes to
FAS13’s specific guidance, which gave companies a clear road map for the design of contracts.
Our opening quote from Sir David Tweedie accompanied his call for an overhaul of lease
accounting standards to ensure assets appear on-balance-sheet.3
A precept of accounting standard-setting in recent years holds that standards should be
written as general principles, not specific rules, and should avoid “bright-line” tests (Maines et
al. (2003), Schipper (2003), SEC (2008)). This view emphasizes that clear, enforceable rules
create opportunities to structure contracts to evade the rules. Nelson (2003), on the other hand,
cites a large body of survey and experimental evidence suggesting that imprecise accounting
1 Tweedie (2008). Sir David has said these words more than once. 2 FAS13 refers to the US Statement of Financial Accounting Standards No. 13, “Accounting for Leases.” IAS17 refers to International Accounting Standard 17, “Leases.” 3 At the time of writing, the FASB and IASB are in deliberations, after the 2013 re-exposure of a proposed new standard. The original, 2010 Exposure Draft generated heated debate. http://www.ifrs.org/current-projects/iasb-projects/leases/Pages/leases.aspx, accessed 20 March 2014.

3
standards can encourage aggressive reporting by offering more room for interpretation and
negotiation. We study whether, in practice, general principles override bright-line tests, and
whether eliminating the bright lines affects companies’ lease accounting choices.
We study the lease accounting choices of lessee firms in four countries, namely Australia,
Canada, the UK and the US. As we explain in greater detail below, the accounting regimes
differ in whether the lease standard required the exercise of professional judgement, and in the
existence and particulars of bright line tests. This cross-sectional variation in accounting regimes
provides a first natural experiment to study the impact of these features on companies’ reporting
choices. We further examine pre- versus post-IFRS lease accounting in Australia, Canada and
the UK.
All international research faces challenges due to the impossibility of creating a true
ceteris paribus condition, given enduring and influential country-specific characteristics. Any
country-specific traits other than accounting regime that affect companies’ accounting decisions,
from legal systems to cultural norms, can potentially confound inferences. As we explain in
section 3, we selected our four countries to provide a relatively homogeneous setting in non-
accounting dimensions, which retains cross-sectional and time-series variation in lease
accounting standards. To control for the nature of the leased assets, we limit our analyses to two
lease-intensive industries, Retail and Transportation.
Observers outside the US generally regard the US as unique in its emphasis on rules. This
view persists despite identical guidance, as in the case of leases, or the frequent practice of using
US guidance when local standards provide none. In this view, requiring the preparer or auditor
to exercise professional judgement in applying a general principle makes a standard “principles-

4
based.” In contrast, Nelson (2003) describes US standards as generally principles-based, with
gradations of guidance tending toward rules as the guidance becomes more specific.
In the US, the Financial Accounting Standards Board’s (FASB) Statement of Financial
Accounting Standards No. 13 (FAS13) provides strict rules for determining whether a lessee
company must use capital or operating lease accounting, which do not allow for judgement,
including bright-line tests about useful life and asset value. Imhoff and Thomas (1988)
convincingly demonstrate that US companies changed the way they wrote contracts following
FAS13, substantially increasing companies’ use of operating leases, the opposite of the
standard’s intent. Since then, FAS13 has served as the key example of how rules and bright lines
promote transaction structuring and circumvention, rather than informative accounting.
Other countries, including Australia, Canada, and the UK, had similar lessee accounting
standards with identical bright-line guidance, but the standards emphasize that professionals
must judge whether the risks and rewards of ownership have effectively transferred. Our first
hypothesis tests whether this emphasis on professional judgement affects the accounting
outcomes. In particular, we test whether similar companies leasing similar, economically
important assets, are more likely to use capital leases when standards encourage professional
judgement over the application of rules. In the pre-IFRS period, we compare companies’ lease
accounting choices in Australia, Canada, and the UK with those of industry peers in the US.
In 2005, Australia and the UK changed to IFRS, which deliberately eschew all bright-line
tests in lease accounting.4 We use data from 2003 and 2007 to compare changes in lease
accounting in these two regimes to the unchanged regimes of Canada and the US. This allows
4 Using Mergenthaler’s (2009) measure of the extent to which a given standard is rules-based, Donelson et al. (2012) evaluate IAS17 at a score of 2, while FAS13 merits the highest possible score of 4.

5
us to see whether eliminating bright line tests altered firms’ accounting decisions, as standard-
setters evidently hoped. If, on the other hand, companies continue to adhere to past guidance or
to employ existing US guidance to fill the void, we should expect no change.
While we find that capital lease use varies significantly across our sample countries,
overall the differences are not consistent with professional judgement curbing transaction
structuring. Canada looks very similar to the US, despite requiring professional judgement on
the transfer of risks and rewards. Pre-IFRS, fewer UK companies use capital leases than their
US counterparts, while more Australian companies use them. We also find no consistent
evidence for the idea that eliminating bright lines reduces transaction structuring. The UK and
Australia, the two countries that switched to IFRS in our sample period, move in opposite
directions between 2003 and 2007.
As a further test of the impact of IFRS’ elimination of bright lines, we look for changes in
the accounting in the transition year: 2005 for Australia and the UK, and 2011 for Canada.
Because IFRS required firms to restate their opening balance sheets in the transition year, we can
examine whether they chose different accounting, in view of the uncertainty created by
eliminating guidance. In this analysis, we hold constant the lease contracts themselves, and
examine the accounting choices each firm makes as the regimes change. We find a small
number of companies re-classifying a small number of leases from operating to capital, but the
economic significance of re-classified leases is quite low.5
We go on to explore how specific bright lines influence companies to structure contracts
to avoid capital lease treatment. For the useful life test, we conjecture that companies in bright-
line regimes will structure their operating leases to be shorter. We find no consistent evidence
5 This analysis is not yet tabulated.

6
that operating lease terms are shorter in bright-line regimes, contrary to this expectation. For the
present value test, we hypothesize that companies in bright-line regimes will use more contingent
rentals, to reduce the reported minimum lease payments enough to allow operating lease
treatment. We find no evidence of greater use of contingent rentals in bright-line regimes.
Overall, although we find significant differences across regimes, their pattern does not
conform to what we should expect if professional judgement overrules bright line guidance, or if
eliminating or avoiding bright lines in standards reduces transaction structuring. Rather, our
results are more consistent with Nobes’ (2011) conclusion that “accounting differences are
generally very deep-seated and resistant to harmonization,” or with Ball’s (2006) assertion that
harmonizing standards is unlikely to overcome local incentives of those who prepare and audit
financial statements.
Nelson (2003) and Jamal et al. (2010) call for empirical analysis of the effects of
principles-based standards on companies’ accounting choices. Our study answers those calls by
examining leasing outcomes in practice. We complement recent experimental work (Jamal and
Tan (2010), Agoglia et al. (2011), Cohen et al. (2012)) that uses the lease decision as a context to
examine principles versus rules. Principles-based standards can prevent transaction structuring
only if the professionals applying them perceive the net benefits of adhering to the principal
outweigh those from violating it. Our evidence demonstrates that, in a context where bright-line
guidance exists, requiring professional judgement to apply a broad principal does not materially
affect outcomes in accounting practice.
Our study is subject to several limitations. Because we must hand-collect much of our
data and wish to conduct analyses within-industry, we limit our analysis to two industries in
which leasing is economically important, with leased assets that are fundamental to operations.

7
We find substantial variation in practice between the two industries, confirming that results from
one industry may not generalize to others. By extension, results based on these high-leasing
industries may not generalize to those where leasing is less extensive or the leased assets are less
central to the business. Similarly, limiting our analysis to four OECD-member, primarily
English-speaking countries with similar legal and regulatory profiles helps control for cross-
country differences, but also limits generalizability. Conceivably, in a different cultural or
regulatory setting, standards that emphasize principles and professional judgement could ensure
adherence to the principles. In that case, however, we would argue that it is the cultural or
regulatory setting, and not the accounting standard, that drives the outcome.
Our paper proceeds as follows: in Section 2, we discuss relevant background and form
our hypotheses; in Section 3, we discuss our data and measurement choices; in Section 4, we
discuss our results; and in Section 5, we conclude.
2. BACKGROUND AND HYPOTHESIS DEVELOPMENT
Capital lease accounting makes companies appear more highly levered than the
alternative, operating lease treatment, hence many companies seek operating treatment for their
leases.6 Firms with growing lease activity also report lower income under capital lease treatment
(ceteris paribus), providing another, albeit temporary, advantage to operating lease treatment.
On the other hand, firms can report consistently higher operating cash flow under capital lease
treatment, because they classify a significant portion of the lease payment as repaid borrowing.
6 Some jurisdictions use the terms “finance lease”, “financing lease”, and “hire purchase contract” for contracts that transfer substantially all risks and rewards to the lessee. We treat these terms as interchangeable with “capital lease”, and to avoid confusion use the latter term consistently for accounting that results in leased assets and lease liabilities recognized on the lessee’s balance sheet.

8
Standard-setters have been most concerned with concealed leverage, and have attempted to
curtail the use of operating leases.
In 2010, in the hope of eliminating transaction structuring to avoid capitalization, the
FASB and the International Accounting Standards Board (IASB) issued a joint Exposure Draft
on leasing proposing capitalization of all leases based on the right-of-use model (FASB/IASB
2010). We infer from this, along with public statements like our opening quote from the IASB
chair, the written justifications for existing lease standards and the rationale for re-considering
lease accounting, that standard-setters believe that many operating leases fail to represent the
substance of the underlying economic activity faithfully.7
In the US, FAS13 applies a rule: lessee companies must use capital lease accounting for
non-cancellable leases that meet any of four criteria, and must use operating lease accounting for
leases that fail to meet any of the criteria. Two of these criteria employ quantitative bright lines:
that the lease term be at least 75 percent of the asset’s useful life, and that the present value of
minimum lease payments be at least 90 percent of the asset’s fair market value at lease
inception.8
The pre-IFRS Canadian CICA Handbook section 3065 and Australian standard
AASB1008 contain precisely the same four criteria as the US standard, but as guidance,
emphasizing that the accountant must exercise professional judgement to decide whether a lease
transfers “substantially all the risks and rewards” of ownership.9 Thus, they elevate the principle
above the bright-line guidance. The UK’s Statement of Standard Accounting Practice 21
7 See, e.g. FAS13, para. 63-71, and http://www.fasb.org/cs/ContentServer?c=FASBContent_C&pagename=FASB%2FFASBContent_C%2FProjectUpdatePage&cid=900000011123#objective, accessed 26 April 2012 8 FAS13, para. 7. 9 See CICA HB Sec. 3065.6 and AASB1008 sec. 5.

9
governing lease accounting includes the fair value test, but omits the useful life test. Like the
Australian and Canadian standards, it embeds the test as guidance within a standard requiring
professional judgement. Beginning in 2005, Australia and the UK adopted IFRS, which indicate
that the transfer of “substantially all” risks and rewards should determine the lease accounting,
but decline to state any bright-line criteria for determining whether the transfer has occurred.10
Canada adopted IFRS in 2011.
To study the effect that the professional judgement provision has on accounting
outcomes, we compare the US to Australia, Canada and the UK. If requiring professionals to
apply an overriding principle leads to less transaction structuring by companies, or to stricter
adherence to the intent of the standard, then we expect more capital lease use in the other three
regimes, relative to the US. In alternative form, our first hypothesis is:
H1: Firms in regimes that include a professional judgement clause in the lease standard use more capital leases than US firms.
Alternatively, if professionals in different regimes use bright-line guidance similarly, regardless
of the professional judgement clause, then we expect no difference in capital lease use.11 Cohen
et al. (2011) find, in an experimental setting with bright-line tests, that auditors are more likely to
require capitalization when the standard contains a professional judgement clause. Nelson et al.
(2002) report that auditors believe that firms use transaction structuring less under principles-
based standards, but also note that less precise standards can create room for auditor-client
negotiation to achieve client reporting goals. We view our evidence on outcomes as
complementary to experimental and survey evidence.
10 See SSAP21, para. 15, 16 & 32, and IAS17 para. 7, 8 & 12. 11 Although we state directional hypotheses for clarity, we argue for substantial doubt about the direction of effects, and in fact frequently find contrary evidence. We therefore report two-tailed p-values for all statistical tests.

10
We next examine whether the presence or absence of bright lines, and not the
professional judgement clause, determine lease accounting choices. Imhoff and Thomas (1988)
found that FAS13 provided companies with the parameters to avoid capitalizing leases. We
examine the reverse situation, the removal of such guidance. Agoglia et al. (2011) provide
experimental evidence that US CFOs are more likely to capitalize a lease when bright lines are
absent than when they are present. Jamal and Tan (2010), on the other hand, find no difference
in managers’ propensity to capitalize leases, in experimental settings with versus without bright-
line criteria. We conjecture:
H2: Firms in regimes with fewer or no bright lines use more capital leases than firms in regimes with more bright lines.
An important difference between our setting and the one examined by Imhoff and Thomas
(1988) is that our change occurs after a sustained period in which structuring leases was accepted
accounting practice. We characterize their question as: when given bright lines, do firms use
them to avoid capitalizing leases? Our question is: once bright lines have been introduced, can
removing them affect the capitalization decision?
We use four comparisons to examine H2: (a) the UK versus other countries pre-2005, (b)
post-IFRS versus pre-IFRS, within country (Australia and the UK), (c) IFRS (Australia and the
UK) versus other regimes (Canada and the US) post-2005, and (d) IFRS versus domestic GAAP,
in the year of transition (Australia, Canada and the UK). Table 1 summarizes the comparisons
we use to test each hypothesis.
Finally, we look for more detailed evidence of transaction structuring by considering
specific lease details relating to bright lines, specifically the lease term and the proportion of
contingent rentals, discussed further below. If the bright line at 75 percent of useful life causes
firms to write lease contracts with artificially short lease terms, then we should find shorter

11
operating lease terms in regimes with this bright line test. We state this hypothesis in alternative
form, as follows.
H3: Firms in regimes with a bright-line criterion for the lease term will have shorter operating lease terms than firms in regimes with no such bright-line criterion.
The UK never had this bright line, so the switch to IFRS represents no change on this criterion.
Canada and the US, on the other hand, have this criterion in both of our sample periods, so they
also represent no change, albeit within the opposite regime. Australia went from having this
criterion under domestic GAAP to not having it under IFRS. We conjecture, first, that operating
lease terms in the UK in 2003 were longer than those in Australia, Canada and the US. Second,
we examine whether Australian companies experienced greater increases in lease terms than
their industry counterparts in the other countries between 2003 and 2007. Finally, we examine
whether, post-IFRS, Australian and UK firms have longer operating lease terms than firms in
Canada and the US.
To study the present value criterion, we examine contingent rentals. Companies can use
contingent rentals to reduce the minimum lease payments included in the present value
calculations, to stay below the 90 percent threshold and qualify for operating lease treatment. By
the arguments above, removing the bright line should reduce the use of contingent rentals. The
hypothesis, in alternative form, is as follows.
H4: Firms in regimes with a bright-line criterion for the present value of minimum lease payments will use more contingent rentals in their operating leases than firms in regimes with no such bright-line criterion.
To study H4, we compare Australian and UK companies’ use of contingent rentals before versus
after they adopted IFRS. We also compare Australian and UK companies in the post-IFRS
period to industry peers in the US, who retained this bright line. As we explain in the next
12
section, Canadian firms generally lack the data to estimate contingent rentals, so we cannot
include them in tests of H4.
3. RESEARCH DESIGN AND DESCRIPTIVE STATISTICS
3.1 Design
Our first hypothesis is inherently cross-country: it pits the US, where FAS13 does not
encourage professional judgement to override bright-line criteria, against other countries that
require this professional judgement. Given that context, we identify countries that are as similar
as possible in other respects that might affect accounting choice. By worldwide standards, our
four countries are relatively homogeneous. They share linguistic, cultural and legal
backgrounds, along with the “Anglo-Saxon” accounting model.12 Using DeFond and Hung’s
(2004) data on law enforcement institutions, the average of absolute pair-wise differences among
our four countries is 0.30, as compared with 2.55 for the other 29 countries in their sample.13
Likewise, the average of absolute pair-wise differences among our four countries using Hope’s
(2003) measure of accounting enforcement is 0.76, as compared with 1.75 among the other 18
countries in his sample.14 We believe it would be difficult to find four countries with less
variation in the non-accounting traits likely to affect accounting choices.
Given that we hand-collect much of the data for this study, our design attempts to
maximize statistical power from a necessarily limited sample.15 Statistical power is a function of
several factors, including (a) the size of the effect, (b) the background variation in outcomes that
12 See Mueller et al. (1997) and Nobes (2011). 13 DeFond and Hung (2004) p. 284. Leuz et al. (2003) developed the measure, based on scores in LaPorta et al. (1998) ranging from 1 to 10. 14 Hope (2003) p. 253. These factor analysis scores range from -3.65 to 1.21. 15 We hand-collect data because our preliminary analysis found that Compustat lease data varied widely across countries in availability and accuracy. See Appendix C.

13
may obscure the effect, and (c) the sample size. We seek to maximize (a), the size of the effect,
by choosing industries with substantial leasing of economically significant assets, namely Retail
and Transportation.16 Companies in these industries tend to lease assets (in Retail: premises; in
Transportation: vehicles) that are fundamental to their operations. In preliminary analysis of the
Compustat Global and North America Fundamentals databases, we found that these two
industries had reasonable numbers of companies with relatively large amounts of lease activity in
all four countries. Ensuring adequate numbers of observations addresses (c), the sample size.
Within these countries, industries and years, we employ nearly the full population of firms with
available data, hence we can increase sample size only at peril of introducing new variation (e.g.
a new country, a new industry).
We attempt to minimize (b), background variation, by choosing otherwise similar
countries, as discussed above, by performing our analysis within-industry to keep operating traits
as similar as possible, and by statistically controlling for covariates that might affect individual
companies’ lease accounting decisions. With the industry selection and within-industry analysis,
we attempt to hold constant the nature of the leased assets, in relation to operations. An
alternative view is that contract terms define the economic substance of the lease, so we should
attempt to hold contract terms constant.17 To address this alternative, we use the opening
balance sheet in the year of IFRS transition, for which we have both domestic GAAP and IFRS
representations of the same data. In the transition year, firms had the opportunity and obligation
to re-state their balance sheets to conform to IFRS. We look for companies re-classifying
operating leases to capital lease status, as a result of IFRS omitting guidance for interpreting the
16 We are grateful to Kenneth French for making the Fama-French industry definitions freely available: http://mba.tuck.dartmouth.edu/pages/faculty/ken.french/Data_Library. 17 We are grateful for a reviewer’s suggestion that led to this approach.

14
“transfer of risks and rewards”.18 We omit cases where IFRS imposes a technical requirement to
capitalize, for example that all investment property leases must be reported as capital leases.
3.2 Sample
Table 2 shows the stages of our sample selection for our main analyses, along with the
data lost at each stage, by country and industry. We collected data for Canada’s 2011 transition
to IFRS separately, as we describe further below. We begin with companies listed in Compustat
North America and Compustat Global for our two industries and four countries in 2007.
Because most leases are long-term, information for a given firm changes little from year to year.
We therefore choose to collect only one observation per firm before and one per firm after 2005,
the IFRS transition year for Australia and LSE-listed companies in the UK. For December year-
end firms, the before and after observations are 2003 and 2007 respectively. We choose 2003 for
the pre-IFRS year because firms restated their opening (2004) balance sheets when they switched
to IFRS; 2003 gives us the last year of the old regime. We choose 2007 for symmetry around the
switch. The comparable years for non-December year-end firms are the fiscal years ending in
calendar 2004 and 2008, respectively. For simplicity, we refer to the pre- and post-transition
periods in our main analyses as 2003 and 2007. A drawback of our choice of years is that firms
do not have a long experience with IFRS in the post-IFRS period. The transition to IFRS,
however, obliged companies to re-evaluate how they accounted for existing contracts.
Moreover, widening the window between periods increases the risk that structural changes, such
as legal or tax changes, could confound inferences.
18 Examples of such wording include: “"IFRS is less prescriptive" (STYLO PLC, 2005); "... quantitative guidance to facilitate lease classification was not provided..." (Qantas, 2005); and "Under previous GAAP, the Company classified a lease as operating or finance based on quantitative "bright-line" tests. Under IFRS, the assessment must be made based on a qualitative analysis of the risks and rewards" (Canadian Tire, 2011).

15
As a first step, we eliminate firms with Compustat Total Assets either missing or zero in
2003. This eliminates firms that went public between 2003 and 2007 from our sample, but it
allows us to make more precise comparisons between the periods. We also eliminate firms that,
according to Compustat, did not use the country’s domestic GAAP, for example Canadian firms
reporting under US GAAP.
We obtain annual reports for the remaining companies, either from the company’s own
website, or from the following sources: in Australia, from Annual Reports Online by Aspect
Huntley via the National Library of Australia,19 in Canada from the Canadian Securities
Administrators’ SEDAR site,20 in the UK from Companies House21 and in the US from the
Securities and Exchange Commission’s EDGAR site.22 We lose additional firms at this stage,
because (i) we are unable to locate one of the annual reports, (ii) the annual reports lacked the
information needed, (iii) the company is a subsidiary of a parent already in our sample, or (iv)
the firm did not adopt IFRS. We then read the business descriptions and descriptions of leased
assets in the annual reports to ensure that the companies fit our target profile, with leased assets
integral to operations. On this basis, we eliminated a sub-industry from Retail, SIC 5961:
catalogue and mail order houses, and several Transportation companies that lack vehicles, e.g.
travel agencies. Although this last step further reduces an already small sample, it eliminates
firms where the magnitude of the economic effect, issue (a) in our statistical power list, is likely
to be small or non-existent.
Finally, for the transition-year analysis, we obtain the annual reports for year before and
the year of transition to IFRS, for sample Australian and UK firms. Because Canada adopted
19 We thank Joseph Cheng for obtaining these reports for us. 20 http://www.sedar.com/homepage_en.htm 21 http://www.companieshouse.gov.uk/ 22 http://www.sec.gov/edgar/searchedgar/webusers.htm

16
IFRS in 2011, we apply the sample conditions in the later years, resulting in a sample of 29
Retail and 14 Transportation firms.
3.3 Measures
Appendix A summarizes our variable definitions. For our first hypothesis, we measure
capital lease use in two ways: as the proportion of firms in the industry-country-year using any
capital leases, and as the average ratio of capital leases to total leases, measured firm-by-firm
among firms having lease activity. For the first measure, we code any company disclosing
capital leases in its lease footnote as a capital lease user. To construct the second measure, we
must place operating and capital leases on a comparable basis. We considered three candidates,
two representing total aggregate lease commitments and the third representing current-year
payments: (1) aggregate undiscounted operating lease commitments, plus aggregate
undiscounted capital lease commitments; (2) the capitalized liability value of non-cancellable
operating leases using the method of Imhoff et al. (1991), plus the reported liability value of
capital leases; and (3) the annual operating rent expense, plus current-year cash payments under
capital leases. Both (1) and (2) have the drawback that future lease commitments omit
contingent rentals, a potentially important transaction structuring tool. Measure (2) has the
additional drawback that we must assume a discount rate and a pattern of expiration to
constructively capitalize operating leases. Canada does not require firms to disclose rent expense
for operating leases, and most Canadian firms do not report it separately, eliminating (3) for
comparisons involving Canadian companies. We use measure (1), because we can observe or
estimate it for all regimes, unlike (3), and it requires fewer assumptions than (2).
The pre-IFRS UK did not require firms to report aggregate undiscounted lease
commitments, and its lease disclosures followed a different format from that in the other

17
countries. In Appendix B, we explain how we place the UK data on a basis comparable to other
countries’ data, including how we estimate undiscounted operating lease commitments from
disclosed information. In addition, many pre-IFRS UK companies and a small number of
companies in other jurisdictions report only discounted, and not undiscounted future capital lease
commitments. In these cases, we use the ratio of undiscounted to discounted capital lease
commitments for other companies in the same industry-country-year to gross up the discounted
value.
We face similar data perils in measuring operating lease term and contingent rentals to
test our hypotheses about transaction structuring. Companies variously report the maximum
lease term, a range of terms, a longest expiry date, or nothing at all about term. None provide
details relating monetary amounts to time periods beyond five years. We compute a weighted-
average lease term, using the undiscounted cash flow amounts in each year as the weights, and
assuming that the lump-sum amount beyond five years expires in equal instalments, equal to the
amount in year five. When the firm reports a lump-sum cash flow for years two through five
together, as is common in the UK and Australia, we assign equal monetary amounts to each year
in the interval. We compute an alternative proxy for the lease term, equal to the maximum
number of years (unweighted) with lease commitments, assuming that the lump-sum for years
beyond five expires in equal instalments as described above. The Pearson (Spearman)
correlation between these two operating lease term proxies across firms is 0.949 (0.965).
Because the proxies provide similar inferences, we report and discuss results for the weighted-
average lease term proxy only.

18
Few companies in any country disclose contingent rentals, so we rely on a proxy.23 We
conjecture that the difference between the amount disclosed in year t-1 as one-year-ahead
operating lease commitment and the actual operating lease expense in year t comprises mainly
contingent rentals. Consequently, to estimate the contingent proportion of operating lease
expense, we calculate one minus the ratio of prior year disclosed commitment to current year
operating lease expense. A higher value represents more contingent rentals. As mentioned
above, we cannot measure this amount for Canadian companies because they rarely disclose rent
expense on operating leases.
3.4 Descriptive statistics
Table 3 provides descriptive information about our sample companies, by country within
industry. We state total assets and revenue in US dollars to allow comparison across countries.24
In both industries, US firms are largest in terms of both assets and revenue, while Australian
firms are generally smallest. Means exceed medians in all countries and both industries,
indicating that size is positively skewed. We use ratio measures in our univariate tests to
mitigate problems stemming from differences in firm size across countries, and include size as a
control variable in multivariate tests.
Australian retail companies exhibit higher return on equity (Net income / Equity) at both
the mean (21 percent) and the median (18 percent) than other sample groups. This appears to be
a function of both relatively high profit margins (Net income / Total revenue) and high asset
23 Australia requires that companies separately disclose both minimum payments and contingent rentals under operating leases for the current year (see AASB1008 paragraph 11.1(b)); however, no other sample country requires the same disclosure and fewer than 15 percent of our sample Australian companies list contingent rentals, despite the requirement. As a result, we use our constructed proxy for Australia as well. 24 We convert other currencies to US dollars using the spot rate on the balance sheet date for balance sheet amounts and the average yearly rate for income statements amounts.

19
turnover (Total revenue / Total assets). In all countries, asset turnover is higher in Retail
(median 1.9 to 2.6 times) than in Transportation (median 1.0 to 1.1 times). Some large losses
evidently influence the average return on equity (negative in US Transportation) and profit
margin (negative in Canada and US Retail); the medians of both these profitability measures are
positive in all sector-countries. Median leverage (Total borrowing / Total assets) ranges from 15
to 31 percent across sector-countries. As a rough descriptive indicator of leasing activity, we
approximate leased assets as the total undiscounted future payments on operating and capital
leases, and scale by total assets. By this measure, Retail firms use more leases than
Transportation firms in all countries. In the Retail sector, median undiscounted lease
commitments range from 45 percent of reported total assets in Australia to 111 percent in the
UK, while in Transportation the same figure ranges from 15 percent in Canada to 81 percent in
the UK.
4. RESULTS OF HYPOTHESIS TESTS
4.1 Tests of H1: Regimes requiring professional judgement use more capital leases, and H2: Regimes with fewer bright lines use more capital leases
Our first two hypotheses compare rates of capital lease use across regimes. As we
described in section 3.3, we measure capital lease use in two ways: as the proportion, within
industry, of companies in a regime using any capital leases, and as the average ratio of capital to
total lease commitments, across companies in a regime-industry. Table 4 reports results for both
hypotheses using the first measure, capital lease use, while Table 5 reports on the second, capital
lease intensity. Table 6 shows the results of estimating probit models of capital lease use, and
OLS regressions of capital lease intensity, including firm-specific determinants of lease use.
Table 4 shows capital lease use in Panel A and (for comparison, not related to the
hypothesis) operating lease use in Panel B. Panel C reports the p-values for two-tailed statistical
20
tests of H1, using the normal approximation to the binomial distribution. We discuss two-tailed
p-values of 10 percent or lower as significant. Bolded p-values indicate that the result is
significant in the predicted direction. Panel D reports the same tests for H2 comparisons.
In general, Panel A of Table 4 shows substantial variation in the proportion of firms
reporting capital leases, ranging from 28.2 percent in the UK Retail in 2003 to 100 percent in UK
Transportation in 2003. In contrast, Panel B shows that between 83.3 and 100 percent of the
same companies use operating leases. Although we do not tabulate statistical tests for Panel B,
all of these proportions are statistically indistinguishable from 100 percent. Thus, our sample
industries, broadly speaking, consist of lessee companies, and we see fairly wide variation across
regimes in the use of capital leases.
Turning now to the tests of H1 in Panel C of Table 4, we test whether the US has
proportionately fewer firms using capital leases than the other three countries. If the professional
judgement clause promotes greater adherence to the spirit of the standard, we would expect firms
in Australia, Canada and the UK to use more capital leases than their US industry peers.
Australia in 2003 is exceptional, confirming H1 in both industries in 2003, and in Transportation
in 2007 after the shift to IFRS. Firms in Canada do not differ significantly in either industry,
either year, from their US counterparts. In the UK in 2003, however, significantly fewer Retail
firms used capital leases than in the US (28.2 percent versus 44.5 percent). The UK experiences
a surge in capital lease use after its switch to IFRS, with the Transportation sector at 100%
(versus 52.3% in the US) confirming H1. In the same interval, Australia experiences a decline,
but all of these regimes’ standards contain a professional judgement clause, so their differences
have no bearing on that distinction. Overall, although we find some support for H1, the results
21
are more consistent with Australia in 2003 having a different leasing environment than the other
countries, than professional judgement requirements promoting the use of capital leases.
In Panel D we evaluate H2, whether omitting or removing bright lines promotes capital
lease use. If so, then we expect higher capital lease use in the UK than in other regimes in 2003,
because it lacked a bright line test for useful life that the other regimes had. We also expect
higher capital lease use under IFRS than in other regimes in 2007, and higher under IFRS than
under the pre-IFRS domestic standards in the same country. The comparisons involving the UK
show the opposite: a lower proportion of companies use capital leases in the UK than in regimes
with the useful life bright line, and all three comparisons in Retail are statistically significant.
The IFRS comparisons show no differences with Canada, nor with the US in Retail. We find
both UK and Australian Transportation firms use significantly more capital leases that their US
peers after the switch to IFRS, confirming H2. In a related point, the increase in UK
Transportation from pre-IFRS to post-IFRS confirms H2; we find a similar result in UK Retail,
2003 vs. 2007. Among the eighteen comparisons in Panel D, the four results supporting H2 all
pertain to increases among UK companies, relative to their previously low level.
Counterbalancing these results are three significant differences in the opposite direction, also
involving the UK. Taken together, these results are far more consistent with an anomaly in the
UK Retail sector pre-IFRS, than with the hypothesis that omitting or eliminating bright lines
promotes the use of capital leases.
Although we regard discovering the reasons for country-specific anomalies to be beyond
the scope of this investigation, we found a change in UK tax law that could explain its unique
results in the above tests. The UK Finance Act 2006 brought in “long funding leases” for plant

22
and machinery that meets certain conditions.25 The key condition relevant to our study is that a
lease that a company reports as a finance lease under GAAP will qualify as a long funding lease
for tax purposes. Prior to this Act, UK tax authorities treated nearly all leases as operating. By
front-loading expenses, capital leases provide a clear tax advantage over operating leases.
Because they tied the advantageous tax treatment to financial reporting, the UK tax authorities
may well have changed lease reporting to shareholders.
In Table 5 we report an alternative proxy for the extent of capital lease use, namely firm-
specific capital lease intensity. As explained in Section 3, we compute intensity for each firm-
year as the capital lease proportion of total leasing activity, using undiscounted lease
commitments to measure lease activity. In Table 5 Panel A, we report average capital lease
intensity across all leasing firms within each regime. Because Table 4 shows that the proportion
of firms using any capital leases varies across regimes, we have replicated our Table 5 tests for
the subset of firms using capital leases. This (untabulated) subset analysis yields similar
inferences. Panel B reports the p-values for two-tailed statistical tests of H1, using t-tests. Panel
D reports the same tests for H2 comparisons.26
In Panel A of Table 5, similar to capital lease use reported in Table 4, Australia is notable
for companies reporting a higher proportion of leasing activity as capital, with average intensities
several times larger than the corresponding industry-years in other countries. Turning to the tests
of H1 reported in Panel B, US capital lease intensity is not remarkably low. The average values
around 3 percent in Retail exceed the corresponding figures in Canada and the UK (significantly
25 http://www.legislation.gov.uk/ukpga/2006/25/pdfs/ukpga_20060025_en.pdf) The new guidance is included in the Business Leasing Manual, http://www.hmrc.gov.uk/leasing/blm1.pdf, accessed 23 Jan 2013. 26 We also perform Wilcoxon rank-sum tests on the differences between countries, within industry and year. We find fewer statistically significant differences in the rank tests, and no results that contradict what we report based on t-tests.

23
so for UK Retail in 2003). US capital lease intensity is significantly lower than Australian
capital lease intensity in Retail in 2003 and Transportation in both years, confirming H1. The
fact that H1 is confirmed only in one of the three comparison countries, leads us to conclude that
the differences stem from factors specific to Australia, and not to the professional judgement
clause.
Table 5 Panel C shows tests of H2, which posits that omitting or removing bright lines
promotes capital lease use. If so, then we expect higher average capital lease intensity in the UK
than in other regimes in 2003, higher intensity under IFRS than in other regimes in 2007, and
higher under IFRS than under the pre-IFRS domestic standards. As with Table 4, the
comparisons involving the UK show the opposite: UK firms use a lower proportion of capital
leases than firms in regimes that have the useful life bright line, significantly so in three of the
six comparisons. We do not find significant increases in capital lease intensity after the switch to
IFRS, in either the UK or Australia. Australian Transportation firms under IFRS use more
capital leases than their Canadian or US counterparts, but the same comparisons in Retail are not
significant. Taken together, these results are once again more consistent with regime-specific
traits, than with absent bright lines promoting capital lease accounting.
In addition to examining pair-wise differences between regimes on their capital lease use,
we estimate regression models that control for firm-specific factors that could influence the
operating versus capital lease decision. The general form of the model is:
where i indexes companies, t indexes time, c indexes countries. The dependent variable,
CapLease, is either an indicator variable that takes the value one if the company reports using
any capital leases and zero otherwise, or a variable measuring the proportion of the company’s

24
leasing activity reported as capital. We explain our lease measures in more detail in section 3.
We use probit when the dependent variable is an indicator, and ordinary least squares (OLS) for
the continuous measure.
The test variables in the above model are the intercepts, αcpre and αc
post, which measure
the level of the leasing variable for country c in the pre- and post-2005 periods, respectively,
controlling for the regressors. We include control variables for size, leverage, profitability,
variance of profit, fixed asset intensity and asset growth. We include Size, the natural log of total
assets at the beginning of the year, because larger firms may operate differently from small ones.
To control for the possibility that companies with higher non-lease leverage may avoid capital
lease treatment, we include Lev, the ratio of long-term borrowing to total assets at the beginning
of the year. More profitable firms, and those with less variable profit streams, may be better able
to support the appearance of higher leverage. To control for this, we include Profit, the average
of current and the past four years’ earnings before interest and taxes, scaled by total assets, and
the standard deviation of the same series, Var. We include PPE, the ratio of non-leased fixed
assets to total assets at the beginning of the year, to control for the company’s fixed asset
intensity, and Growth, the percentage change in total assets from last year to the current year,
because the differential effects of capital leases on the income statement relate to growth.
Table 6 displays the results from estimating models of capital lease use and capital lease
intensity, including control variables for firm-specific factors that may affect the choice of
capital versus operating treatment for leases. We implement the models with a constant term
representing the US in 2003, and country-specific indicators for Australia (AUS), Canada (CDA)
and the UK. The first two columns of Table 6, Panel A report estimation results for probit
models of capital lease use by firms in the Retail and Transportation industries, respectively.

25
The second two columns report OLS estimation results for capital lease intensity, by industry.
Pooling across countries in Table 6 increases degrees of freedom, and the addition of control
variables reduces the unexplained variation (and hence standard errors), creating potential for
more significant relations.
Table 6 Panels B and C report statistical tests for H1 and H2 using capital lease use as the
dependent variable, comparable to the univariate tests in Table 4. We report only p-values; the
corresponding coefficient estimates and Z-statistics appear in the first two columns of Panel A of
Table 6. Panel B, which shows tests for H1, confirms the impression from the univariate tests,
that differences pertain to Australia having a high proportion of firms capitalizing leases, and not
to the US having an exceptionally low proportion. Panel B reports tests for H2, that omitting
bright lines promotes capital lease use. The panel confirms the exceptionally high rate of capital
lease use in Australia, and in addition shows a significant increase for UK Retail firms after the
move to IFRS, as we saw in Table 4, along with the counter-hypothetical lower baseline in the
UK in 2003. Overall, although the probit analysis with covariates provides more precision,
controlling for firm-specific determinants does not alter the inferences gained from Table 4.
Panels D and E of Table 6 report tests using capital lease intensity as the dependent
variable, comparable to the tests in Table 5. As for the probit analysis reported above, the results
here confirm the univariate analysis.
Overall, the results from the regression analysis confirm those from our analysis of pair-
wise differences. Neither H1 nor H2 find strong support in the data. We find significant
differences across regimes, but often they are opposite in sign from predictions. Almost all
results that support H1 or H2 involve Australia, where firms used more capital leases than other
regime both before and after the switch to IFRS, and where the pre-IFRS lease standard was

26
essentially the same as Canada’s. Our evidence indicates that requiring professional judgement
in a lease standard that contains bright-line guidance does not generally achieve greater
adherence to the spirit of the standard, and that omitting or eliminating bright lines from lease
standards does not generally result in greater use of capital leases.
4.2 Tests of H3: Lease-term bright lines lead to shorter-term operating leases
We now turn to our tests of specific lease features that may indicate transaction structuring.
In 2003, Australia, Canada and the US each had a bright line criterion for lease terms, while the
UK did not. Between 2003 and 2007, Australia adopted IFRS, and so eliminated its bright line.
These regime differences define the categories for our tests: we compare the UK to all others in
2003, Australia’s change from 2003 to 2007, and post-IFRS Australia and the UK to Canada and
the US in 2007. If companies structure their leases to avoid the bright-line test, then we expect
to find the evidence in shorter operating lease terms in regimes with the bright line than in
regimes without.
Table 7 displays our results on lease terms. The data requirements for estimating lease
terms reduce our available observations slightly, relative to the final sample numbers reported in
Table 2. In Retail, we lose one firm in the US. In Transportation, we lose one firm in Canada
and six in the US. Unfortunately, as discuss in Appendix B, UK companies did not disclose
sufficient information pre-IFRS to allow us to estimate lease terms. We therefore assume that
UK firms’ lease terms do not change from 2003 to 2007 to allow cross-country comparisons in
2003.27
27 We find no significant difference in lease terms between 2003 and 2007 in Australia, Canada or the US, in either industry. This adds credibility to our assumption that UK lease terms do not change in the same period. We tabulate this difference between periods only for Australia, in the test of H3.
27
Table 7 Panel A shows the average term of operating leases across firms, by country,
industry and year, using the weighted-average lease term described in section 3. In Panel B, we
report tests of H3, which states that operating lease terms will be shorter in regimes with a bright
line relating to the useful life, as firms use the bright line to structure their contracts. For ease of
exposition, we test the opposite of the stated hypothesis, that regimes without a lease-term bright
line have longer lease terms. Thus, the UK both pre- and post-IFRS, and post-IFRS Australia
represent the test groups for H3.
In the first set of comparisons in Table 7 Panel B, we observe that the UK has longer
operating lease terms than all three other countries in both industries in 2003, significantly so in
Retail. In the second set of comparisons, we find these differences are maintained in 2007 after
the UK switched to IFRS. Recall that the UK measures do not change, but other countries may
have. Australia post-IFRS, with the shortest operating lease terms, does not support H3, either in
comparison with Canada and the US, or with itself pre-IFRS. In total, these results identify UK
Retail leases as distinctly longer than those of comparison firms, but the result does not extend to
UK Transportation companies, nor to post-IFRS Australia in either industry. It therefore appears
driven by specific features of the Retail industry in the UK, as opposed to the absence of the
lease-term bright line.
4.3 Tests of H4: Lease present-value bright lines lead to more contingent rents
Next, we consider whether a present value bright line leads to more transaction structuring
via contingent rentals. In 2003, all of our sample countries had a 90 percent bright-line criterion,
and all excluded contingent rentals from minimum lease payments. In 2007, Australia and the
UK adopted IFRS, which has no bright line. We therefore look for cross-country differences in
2007, and pre- versus post-IFRS differences in Australia and the UK. As discussed in section 3,

28
Canada has insufficient data to test H4, so our cross-country tests are limited to comparing the
US to Australia or the UK. If this bright line causes companies to use more contingent rentals,
we should find US companies in 2007 using more contingent rentals than companies reporting
under IFRS, and Australian and UK companies reducing their use of contingent rentals between
2003 and 2007.
Table 8 reports our tests of H4. As was true for H3, we lose observations due to
unavailable data. For some sample firms, we lose one of the two years due to missing data,
causing an unequal number of observations between 2003 and 2007. In Retail, we lose both
years for one, one and eight firms in Australia, the UK and the US respectively, representing less
than 10 percent of observations in each case. In Transportation, we lose both years for one firm
in Australia, and six firms in the US, representing roughly 10 percent in each case. Panel A of
Table 8 shows the average contingent proportion of operating lease expense by country, industry,
and time period. In Panel B, we report hypothesis tests.
In Retail, we find no significant difference between the post-IFRS UK and either the US or
pre-IFRS UK, and the signs of the difference are opposite those predicted by H4. In
Transportation, we find that UK firms under IFRS use a smaller proportion of contingent rentals
than their US peers, supporting H4. Contingent rentals increase, though not significantly, from
pre- to post-IFRS in the UK, so the difference relative to the US existed before IFRS eliminated
the bright line.
In Australia, we find a very similar pattern of results to those in the UK, except that the
comparison with the US in Retail is statistically significant in the wrong direction. The one
comparison that supports H4, the comparison with the US in Transportation, has the same
problem of inference as was true for the UK: the insignificant increase from 2003 means that

29
Australian Transportation firms had lower contingent rentals than the US prior to IFRS
eliminating the bright line. In sum, we cannot conclude in favor of H4.
5. DISCUSSION AND CONCLUSION
The SEC, FASB and IASB all promote the idea that principles-based standards reduce
transaction structuring and lead to better financial reporting (see SEC 2008 and FASB/IASB
2010). According to this view, eliminating bright-line tests and focusing on general principles
can reduce transaction structuring, because firms will follow and auditors will enforce the
principles. Our research tests this idea by examining whether encouraging application of
principles or eliminating bright lines affects companies’ use of capital leases.
For two lease-intensive industries, Retail and Transportation, in four countries and two
time periods, we examine the extent of capital lease use across firms and within firms, as well as
two lease traits related to the bright-line tests: the lease term and the use of contingent rentals.
We find differences in leasing structure and activity across countries, industries, and time
periods, but our evidence overall does not support, and often contradicts, the notion that
encouraging professional judgement or eliminating bright lines leads to greater capitalization.
We did not set out to discover why these countries’ leasing practices differ, rather our goal
in this research was to explore how specific differences in accounting standards may affect lease
reporting outcomes. Given our research questions, we chose countries that are as similar as
possible in non-accounting respects, but whose accounting standards differ in key respects, to
minimize the influence of other contextual factors. Finding, despite this, that local contextual
differences often generate significant differences that overwhelm any effect of the accounting
standards, naturally leads to the further questions: which local differences matter, and should

30
they, under a principles perspective, result in different accounting outcomes? Candidate
differences for future investigation include book-tax conformity and differences in tax law, local
differences in property law or contract law that affect tenants’ rights, and internationalization of
the leasing market (e.g. in transportation equipment). As an example, we conjecture that the
2006 UK Finance Act, and not the 2005 switch to IFRS, accounts for the dramatic rise in UK
firms’ use of capital leases.
Imhoff and Thomas (1988) provide compelling evidence that US companies substantially
changed their contracts following FAS13. This fact undoubtedly contributes to standard-setters’
concerns, because structured transactions challenge the notion that accounting depicts economic
events and circumstances in a neutral way. We believe that the lack of the symmetric result to
Imhoff and Thomas’s when IFRS eliminated bright lines is due to preparers and auditors
carrying forward old practices as long as the practices do not directly conflict with IFRS. The
IFRS GAAP hierarchy supports seeking guidance from other jurisdictions and accepted practice
on matters where IFRS is silent.28
We do not view our results as indicating that standard-setters should abandon principles in
setting accounting standards. Rather, our results demonstrate that relying on accountants to
exercise professional judgement in applying a broad principle does not to result in greater
adherence to the principle, even in some of the best enforcement regimes in the world. In their
right-of-use model for leases (FASB/IASB 2010), the Boards essentially resort to a rule requiring
capitalization of nearly all leases, on the grounds that this rule will best enforce the principle of
faithful balance sheet representation. Contemporaneous work by Bratten et al. (2012) on US
28 IAS 8, para. 7-12.

31
lease disclosures, however, suggests that investors can make equivalent decisions regardless of
lease capitalization, as long as they have reliable disclosed information.
Through examining companies’ detailed disclosures, we find that seemingly small
differences in specific disclosure requirements, or in companies’ compliance with disclosure
requirements, can have substantial effects on the usefulness of the information for international
comparison. For example, Canada did not require companies to report operating lease rental
expense as a separate item, and few Canadian companies in our sample reported it voluntarily.
This fact excluded Canada from our investigation of contingent rentals. In another example,
although pre-IFRS Australia required companies to disclose a breakdown of current-year
operating lease rental expense into minimum payments and contingent rentals, fewer than 15
percent of sample Australian companies provided this required disclosure, and no companies
from other jurisdictions provided the information voluntarily. Possibly the greatest impediment
to comparability in our sample was the pre-IFRS UK disclosure of future lease commitments.
The UK reported next year’s undiscounted payments, organized by lease expiry date, while the
other three countries in our sample reported cash payments in each of the next five years and
thereafter. As we show in Appendix B, this difference in format, combined with the fact that the
UK did not require disclosure of aggregate undiscounted cash flows, complicated comparisons of
the UK with other countries. Financial analysts wishing to use the lease disclosure to analyze
leasing transactions would face similar impediments. Though we do not find that the form of the
standards determines whether companies account for leases as capital or operating, we perceive
important benefits from ensuring adequate, standardized disclosure.
Our findings contribute to debate about principles versus rules, and the level of detailed
guidance that should be included in accounting standards. We find that a professional judgement

32
clause fails to ensure greater adherence to the spirit of the standard, in a context where bright line
tests have defined practice. In this context, even removing the bright lines does not ensure
greater adherence, because the weight of past practice and practice in other jurisdictions supports
continuing non-adherence. Our results suggest that the benefits of principles-based standards are
elusive.

33
References
Agoglia, C., T. Doupnik, G. Tsakumis. 2011. Principles-Based versus Rules-Based Accounting Standards: The Influence of Standard Precision and Audit Committee Strength on Financial Reporting Decisions. The Accounting Review 86 (3): 747-767.
Australian Accounting Standards Board (AASB). 1998. Leases. Accounting Standard No. 1008 (AASB1008), Victoria, NSW, Australia: AASB.
Ball, R. 2006. International Financial Reporting Standards (IFRS): Pros and Cons for Investors. Accounting and Business Research 36 (special issue): 5-27.
Bratten, B., P. Choudhary and K. Schipper. 2012. Evidence that Market Participants Assess Recognized and Disclosed Items Similarly when Reliability is not an Issue. Working paper, University of Kentucky, Georgetown University, and Duke University.
Canadian Institute of Chartered Accountants (CICA). 1979. Leases. CICA Handbook—Accounting (CICA HB), Section 3065, Toronto, ON, Canada: CICA.
Cohen, J., G. Krishnamoorthy, M. Peytcheva, A. Wright. 2012. How Does the Strength of the Financial Regulatory Regime Influence Auditors’ Judgments to Constrain Aggressive Reporting in a Principles versus Rules-Based Accounting Environment? Working paper, Boston College, Northeastern University, and Lehigh University.
DeFond, M.L., and M. Hung. 2004. Investor Protection and Corporate Governance: Evidence from Worldwide CEO Turnover. Journal of Accounting Research 42 (2): 269-312.
Donelson, D., J. McInnis, J. Mergenthaler. 2012. Rules-Based Accounting Standards and Litigation. The Accounting Review 87 (4): 1247-1279.
Financial Accounting Standards Board (FASB). 1976. Accounting for Leases. Statement of Financial Accounting Standards No. 13 (FAS13), Norwalk, CT, USA: FASB. Available at: http://www.fasb.org/st/.
Financial Accounting Standards Board (FASB)/International Accounting Standards Board (IASB). 2010. Leases. Exposure Draft, August 17, 2010, Norwalk, CT, USA: FASB/IASB.
Hope, O. 2003. Disclosure Practice, Enforcement of Accounting Standards and Analysts’ Forecast Accuracy: An International Study. Journal of Accounting Research 41 (2): 235-272.
Imhoff, E., R. Lipe, and D. Wright. 1991. Operating leases: Impact of Constructive Capitalization. Accounting Horizons 5 (1): 51-63.
Imhoff, E.A. and J.K. Thomas. 1988. Economic Consequences of Accounting Standards: The Lease Disclosure Rule Change. Journal of Accounting and Economics 10 (4): 277-310.

34
Institute of Chartered Accountants in England and Wales (ICAEW). 1984. Accounting for Leases and Hire Purchase Contracts. Statement of Standard Accounting Practice No. 21 (SSAP21), London, England: ICAEW.
International Accounting Standards Board (IASB). 2003. Accounting Policies, Changes in Accounting Estimates and Errors. International Accounting Standard 8 (IAS8), London, England: IASB.
International Accounting Standards Committee (IASC). 1997. Leases International Accounting Standard 17 (IAS17), London, England: IASC; 2003, revised and re-issued by International Accounting Standards Board (IASB), London, England: IASB.
Jamal, K., H.-T. Tan. 2010. Joint Effects of Principles-Based versus Rules-Based Standards and Auditor Type in Constraining Financial Managers’ Aggressive Reporting. The Accounting Review 85 (4): 1325-1346.
LaPorta, R., F. Lopez-de-Silanes, A. Shleifer and R.W. Vishny. 1998. Law and Finance. Journal of Political Economy 106 (6): 1113-1155.
Leuz, C., D. Nanda and P.D. Wysocki. 2003. Earnings Management and Investor Protection: An International Comparison. Journal of Financial Economics 69 (3): 505-537.
Maines, L.A., E. Bartov, P. Fairfield, D.E. Hirst, T.E. Iannoconi, R. Mallett, C.M. Schrand, D.J. Skinner and L. Vincent. 2003. Evaluating Concepts-Based vs. Rules-Based Approaches to Standard Setting. Accounting Horizons 17 (1): 73-89.
Mergenthaler, R.D. 2009. Principles-Based versus Rules-Based Standards and Earnings Management. Working paper, University of Iowa.
Mueller, G. G., H. Gernon, and G. Meek., eds. 1997. Accounting: An International Perspective. Chicago, IL: Richard D. Irwin.
Nelson, M. 2003. Behavioral Evidence on the Effects of Principles- and Rules-Based Standards. Accounting Horizons 17 (1): 91-104.
Nelson, M., J. Elliott, R. Tarpley. 2002. Evidence from Auditors about Managers’ and Auditors’ Earnings Management Decisions. The Accounting Review 77 (supplement): 175-202.
Nobes, C.W. 2011. IFRS Practices and the Persistence of Accounting System Classification. Abacus 47 (3): 267-283.
Schipper, K. 2003. Principles-based Accounting Standards. Accounting Horizons 17 (1): 61-72.
Securities Exchange Commission (SEC). 2008. Final Report of the Advisory Committee on Improvements to Financial Reporting. Washington, DC: SEC. Available at: http://www.sec.gov/about/offices/oca/acifr.shtml.

35
Tweedie, D. 2008. Prepared Remarks of Sir David Tweedie, Chairman of the International Accounting Standards Board, at The Empire Club of Canada, Toronto. (April 25). http://www.ifrs.org/News/Announcements-and-Speeches/Documents/Sir_David_Tweedie_Empire_Club_Speech.pdf, accessed Jan. 29, 2014.

36
Appendix A. Variable definitions
Leasing outcomes
Capital lease use Indicator variable that takes the value one if the firm-year reports any capital leases, and zero otherwise; constructed from hand-collected data from annual reports.
Capital lease intensity Proportion of a given firm-year’s total undiscounted lease commitments that arise from capital leases; constructed from data hand-collected from annual reports and Compustat.
Weighted-average operating lease term
Weighted average of digits [1,2,...T], which represent years into the future in which a given firm-year reports operating lease cash flows, with the weight equal to the cash flow for that future year; constructed from hand-collected data from annual reports and Compustat.
Operating lease contingent rentals
One minus [the ratio of the one-year-ahead operating lease commitment reported in year t-1, to the rental expense in year t], for a given firm-year; constructed from hand-collected data from annual reports and Compustat.
Test variables AUS, CDA, UK, US Indicator variables for Australia, Canada, the UK and the US,
respectively.
Post Indicator variable for post-2005 time period. Control variables
Size Natural log of total assets at the beginning of the year; from Compustat.
Lev Ratio of long-term borrowing to total assets at the beginning of the year; from Compustat.
Profit Average of current and the past four years’ [earnings before interest and taxes, scaled by beginning total assets]; from Compustat.
Var Standard deviation of current and the past four years’ [earnings before interest and taxes, scaled by beginning total assets]; from Compustat.
PPE Ratio of non-leased fixed assets to total assets at the beginning of the year; from Compustat.
Growth Percentage change in total assets from the prior to the current year; from Compustat.

37
Appendix B. UK pre-IFRS operating lease disclosures
Prior to 2005, most UK companies disclosed their future commitments under operating leases in a format different from that used in North America or Australia. The UK’s SSAP21, para. 56, required lessee companies to disclose “the payments which he is committed to make during the next year, analysed between those in which the commitment expires within that year, in the second to fifth years inclusive and over five years from the balance sheet date”. In contrast, the other jurisdictions provide guidance similar to that in FAS13, para. 16, which requires the company to disclose “[f]uture minimum rental payments required as of the date of the latest balance sheet presented, in the aggregate and for each of the five succeeding fiscal years.” Figure B.1 gives examples of disclosures from UK retailer Marks & Spencer and US retailer Nordstrom Inc. for illustration. Figure B.2 shows how a single hypothetical company with seven identical leases expiring one per year over the next seven years would report its information under (a) US and Canadian guidance, (b) IFRS and Australian guidance, and (c) pre-IFRS UK guidance. We convert UK data to the format used in other jurisdictions, by the following method. Denote the value reported in the UK for future period t as UK[t] and the value reported in the other jurisdictions as World[t]. Denote the time period for the lump-sum beyond five years as T. For the first year, the World value is simply the sum across years of all the UK values:
If we had UK data for each of the years 2 through 5, we would similarly compute the World amount by summing beginning at that year. Because we do not, we estimate the aggregate amount for years 2 through 5, assuming that the ratio of year 1 cash flow to years 2 through 5 is the same in 2003 as in 2007. Denote the aggregate amount for year 1 in 2007 as η1, and for years 2 through 5 in 2007 as η2-5. We apply the following formula:
Prior to switching to IFRS in 2005, UK firms generally provided neither lease terms nor aggregate undiscounted cash flows, which would allow us to estimate the World[T] value. Consistent with World[2-5] above, we use the detailed data disclosed by UK firms in 2007 to estimate World[T]. Denote the amount for the thereafter period in 2007 as ηT. Our formula for the lump-sum value beyond 5 years is:
Finally, our estimate of the aggregate undiscounted cash flows is the sum of the three World values described above. By using the method above to manage limitations of the available data, we effectively make the pre-IFRS lease term equal to the post-IFRS lease term, eliminating the possibility of testing for such a change.

38
Figure B.1: Operating lease minimum commitment disclosures from a UK and a US retailer
Extract from note 30, “Commitments and Contingent Liabilities” of Marks & Spencer’s Annual report and financial statements 2004:
Extract from note 12, “Leases” of Nordstrom Inc.’s Annual report 2004:
_____________________ This figure provides examples of disclosures of future commitments under operating leases from the 2004 annual reports of UK retailer Marks & Spencer and US retailer Nordstrom Inc.

39
Figure B.2: Example of disclosed minimum operating lease payments from simulated data
Lease cash flows future year 1 2 3 4 5 6 7
Lease 1 100 2 100 100 3 100 100 100 4 100 100 100 100 5 100 100 100 100 100 6 100 100 100 100 100 100 7 100 100 100 100 100 100 100
1 2 3 4 5 there-
after (a) US or Cdn format 700 600 500 400 300 300
1 2-5 there-
after (b) Aus. or IFRS format 700 1800 300
1 2 3 4 5 there-
after (c) UK format, pre-IFRS 100 100 100 100 100 200
1 2-5 there-
after aggregating 2-5 100 400 200
_____________________ This figure illustrates how a hypothetical company with seven identical leases expiring one per year over the next seven years would report its information under (a) US and Canadian guidance, (b) IFRS and Australian guidance, and (c) pre-IFRS UK guidance.

40
Appendix C. Compustat lease data
As we describe further below, we found that Compustat lease data often were incomplete or had data errors. We base our analysis and conclusions below on reviews of Compustat data and comparisons with data from companies’ annual reports. We obtained US and Canadian data from the Compustat Fundamentals Annual file for North America, and the UK and Australian data from the Compustat Fundamentals Global Annual file with country codes ‘GBR’ and ‘AUS’. Incomplete data: For operating leases, Compustat has fields for one-year through five-year-out operating lease commitments (MRC1-MRC5), five-year total lease commitment (MRCT), thereafter (beyond five years) commitments (MRCTA), and operating lease expense (titled ‘rental expense’; XRENT). We found operating lease commitment data available for firms in the US and Canada, but not for the UK or Australia. We found rental expense data for all countries when disclosed. Compustat does not collect data on operating lease term, even when the company discloses it. In summary, we found operating lease data generally complete for the US and Canada, except for lease term data. We found operating lease data generally missing for the UK and Australia, except for rent expense. For capital leases, Compustat has fields for two-year- through five-year-out capital lease commitments (CLD2-CLD5), but does not collect one-year-out or thereafter capital lease commitments. As a result, total undiscounted capital lease commitment is unavailable through Compustat. In addition, Compustat collects total discounted capital lease commitment (DCLO). We found this field populated for firms in the US and Canada, but not for those in the UK and Australia. Compustat contains the data field ‘loans/claims/advances - lease’ (LCAL), but this field is never populated for any of our four countries. For capital lease assets, Compustat has fields for: capital lease assets at cost (FATL), net capital lease assets (PPENLS), and accumulated depreciation on capital lease assets (PPACLS). While Compustat populates the first of these, neither of the latter two is populated. Compustat contains fields for the following current-year capital lease data: capital lease principal payments (CAPFL), capital lease interest payments (INTFL), and capital lease increases (FINLE). For UK firms, we found these fields populated only in 2003, prior to adoption of IFRS.29 Compustat does not capture any data on capital lease terms or interest rates. In summary, capital lease data are largely missing for all countries. Data errors: To assess the accuracy of Compustat data, we compared them to data from annual reports for a sample of firms. We compared five data items: one-year-out operating lease commitment (MRC1), operating lease expense (XRENT), two-year-out capital lease commitment (CLD2), total discounted lease commitment (DCLO), and capital lease assets at cost (FATL). For the US, we used 2004 data for 21 firms in SIC code 2836 that had capital lease balances in Compustat and 10-K, 20-F or 40-F forms available from EDGAR. All available data were 29 Among 1,288 Australian firms in 2003, we found the CAPFL and FINLE fields populated for one firm, and the INTFL populated for two firms.

41
correctly reflected in Compustat, with the exception of capital lease assets at cost. This Compustat field had errors for 18 of 21 firms, because Compustat often includes leasehold improvements, normally a separate asset that is not part of the lease contract, in capital lease assets. In a related point, we found many instances where Compustat reported capital lease assets, but no capital lease liabilities for a firm-year. On investigation, all of these proved to be cases where Compustat had coded leasehold improvements as capital lease assets. For Canada, we used 2004 data for 21 firms in SIC code 7372 with lease activity and annual reports available from company websites or SEDAR. Operating lease data (MRC1 and XRENT) were correctly recorded in Compustat when disclosed, but operating lease expense was only disclosed by two of 21 firms since this disclosure is not required in Canada. For capital leases, two-year out commitment was correct in 18 of 21 firms, with Compustat missing the disclosed figure for two firms and reporting an incorrect figure for one firm. Total discounted lease commitment was correct for 19 of 21 firms, with Compustat missing the disclosed figure for one firm and reporting an incorrect figure for one firm. Capital lease assets were correct for 2 of 21 firms, with Compustat reporting leasehold improvements as capital lease assets for 18 firms, and missing the disclosed figure for one firm. For the UK, we compared Compustat to hand-collected data from annual reports for 13 firms with capital leasing activity and available annual reports in 2004. We investigated different data items in the UK than in the US and Canada, because of the differences in Compustat’s coverage, as we discussed above under the heading “Incomplete data”. Specifically, we investigated: current year capital lease principal payment (CAPFL) and interest payment (INTFL), capital lease increases (FINLE), and operating lease expense (XRENT). We found current year capital lease principal payments reported correctly for all firms. Capital lease interest payments were correct for nine of thirteen firms, with Compustat missing the disclosed figure for the remaining four firms. Capital lease increases were correct for ten of thirteen firms, with Compustat missing the disclosed figure for three firms. Operating lease expense was correct for eight of thirteen firms, with Compustat missing the disclosed figure for three firms and reporting incorrect figures for two firms. We added Australia to our study after we had conducted the above accuracy analysis and concluded that we would need to hand-collect footnote disclosures. Hence, we have no similar accuracy comparisons for Australia. In summary, we found Compustat data for leases to be generally accurate for the US and Canada, with the exception of capital lease assets, which was incorrect for 37 of 42 firms. We found several errors in Compustat’s Canadian data (three of 21 for CLD2; two of 21 for DCLO). We also found errors in the UK, including incorrect figures (two of thirteen for XRENT) and missed data (four of thirteen for INTFL; three of thirteen for FINLE; three of thirteen for XRENT). Conclusion: We found Compustat’s operating lease data to be generally complete and accurate for the US and Canada, but incomplete for the UK and Australia, where Compustat evidently has not collected the available footnote data. Compustat’s capital lease data are generally incomplete in the US and Canada, lacking current year payments, one-year-out commitments and thereafter (beyond

42
five years) commitments, all of which firms disclose. Compustat has data fields for net capital lease assets and accumulated depreciation on capital lease assets, but generally does not populate these fields. Compustat’s capital lease assets at cost are mostly incorrect when available. For UK firms, Compustat does not provide the capital lease commitment data that companies disclose, and often records missing values for current year payments that we found available in company disclosures. Overall, we recommend careful checking before relying on Compustat lease data.

43
Table 1 Lease Accounting Regimes and Associated Hypotheses
Hypothesis Contrasts H1: Companies in regimes with a professional judgment clause use more capital leases than the US.
US vs. AUS, CDA, UK, IFRS
H2: Companies in regimes with fewer or no bright lines use more capital leases than those with (more) bright-line criteria.
(a) UK vs. AUS, CDA, US
(b) IFRS (AUS-2007, UK-2007)
vs. AUS-2003, UK-2003
(c) IFRS (AUS-2007, UK-2007)
vs. CDA-2007, US-2007
(d) Transition year IFRS (AUS, CDA, UK)
vs. Transition year Domestic GAAP (AUS, CDA, UK)
H3: Regimes with no lease term BL have longer operating lease terms than regimes with this BL.
(a) UK vs. AUS, CDA, US
(b) IFRS (AUS-2007) vs. AUS-2003, CDA-2007, US-2007
H4: Regimes with no fair value BL have lower contingent rentals than regimes with this BL.
IFRS (AUS-2007, UK-2007) vs. AUS-2003, UK-2003, US-2007

44
Table 2 Sample Selection, by Industrya
Retail Transportation Australia Canada UK US Australia Canada UK US Firms in the sector with Compustat
data in 2007 39 31 94 310 30 26 54 162 Less:
Firms lacking 2003 Compustat data -12 -9 -36 -91 -9 -11 -20 -49 Firms reporting under non-
domestic GAAP 0 -1 0 -3 0 -2 -1 0 Sample for hand data collection
from annual reports 27 21 58 216 21 13 33 113 Less:
Firms for which we lack one or both annual reports -1 0 -6 -30 0 -1 -3 -20
Firms whose annual report disclosures lack essential information 0 0 -3 -2 -2 0 0 -2
Subsidiaries of parent firms also included in our sample 0 -1 0 0 0 0 0 -3
Firms not adopting IFRS 0 N/A -6 N/A 0 N/A 0 N/A Retail firms in SIC 5961 (catalogue and mail-order houses) -3 0 -4 -20 N/A N/A N/A N/A Transportation firms whose
business does not include transportation equipment (e.g. airplanes, trucks, ships) N/A N/A N/A N/A -8 -6 -21 -23
Final sample - firms 23 20 39 164 11 6 9 65 Final sample - firm-years 46 40 78 328 22 12 18 130
_____________________ a We classify firms as Retail or Transportation using the Fama-French mapping of SIC codes to industries, and Compustat SIC codes.

45
Table 3 Descriptive Information about Sample Firms, by Country within Industry
Retail Transportation
Australia Canada UK US Australia Canada UK US Total assets (US$millions)a
Mean 695.3 2,208.4 3,792.1 3,959.3 1,939.9 2,512.0 4,910.0 5,427.4 Median 104.0 574.0 427.3 864.5 63.6 863.5 2,588.3 803.3
Total revenue (US$millions) Mean 1,794.9 4,074.7 5,900.7 8,181.2 1,550.6 1,540.0 4,434.9 3,937.8 Median 268.5 948.9 991.7 1,544.3 118.1 1,142.0 3,736.1 713.1
Net income / Equity Mean 0.21 0.11 0.17 0.05 0.13 0.12 0.32 -0.25 Median 0.18 0.13 0.12 0.11 0.11 0.14 0.16 0.10
Net income / Total revenue Mean 0.050 -0.046 0.031 -0.001 0.049 0.068 0.040 0.031 Median 0.040 0.033 0.024 0.020 0.042 0.061 0.035 0.034
Total revenue / Total assets Mean 2.3 2.0 2.0 2.1 1.4 1.3 1.4 2.6 Median 2.6 1.9 1.9 2.0 1.1 1.1 1.2 1.0
Total assets / Equity Mean 0.77 2.04 3.06 0.15 2.51 2.39 4.91 6.87 Median 2.34 1.98 2.12 2.04 2.32 2.5 3.71 2.21
Total borrowing / Total assets Mean 0.25 0.18 0.20 0.24 0.29 0.26 0.28 0.31 Median 0.25 0.22 0.15 0.18 0.28 0.31 0.28 0.29
Total lease commitment / Total assets Mean 0.69 0.48 1.43 0.65 0.36 0.23 1.17 0.60 Median 0.45 0.51 1.11 0.52 0.31 0.15 0.81 0.17
Number of observations 46 40 78 328 22 12 18 130 _____________________ a We convert other currencies to US dollars using the spot rate on the balance sheet date for balance sheet amounts, and the average annual rate for
income statement amounts.

46
Table 4 Capital and Operating Lease Use, by Country, Industry and Time Period
Panel A: Percent of firms reporting capital leases, by country-industry-year
Industry Retail Transportation Country \ Year 2003 2007 N 2003 2007 N
Australia 65.2% 56.5% 23 81.8% 81.8% 11 Canada 55.0% 60.0% 20 50.0% 50.0% 6
UK 28.2% 61.5% 39 56.0% 100.0% 9 US 44.5% 49.4% 164 49.2% 52.3% 65
Panel B: Percent of firms reporting operating leases, by country-industry-year Industry Retail Transportation
Country \ Year 2003 2007 N 2003 2007 N Australia 100.0% 100.0% 23 100.0% 100.0% 11 Canada 100.0% 100.0% 20 83.3% 83.3% 6
UK 100.0% 100.0% 39 100.0% 100.0% 9 US 100.0% 99.4% 164 92.3% 95.4% 65
Panel C: Tests of H1: US compared with other regimes (p-values in parentheses)a
US vs. Australia Canada UK Retail 2003 44.5% 65.2% 55.0% 28.2% (0.06) (0.37) (0.06) 2007 49.4% 56.5% 60.0% 61.5% (0.52) (0.37) (0.17) Transportation 2003 49.2% 81.8% 50.0% 56.0% (0.04) (0.97) (0.72) 2007 52.3% 81.8% 50.0% 100.0% (0.07) (0.91) (0.01)

47
Table 4 (continued) Panel D: Tests of H2: Regimes with fewer bright lines compared with other regimes (p-values in parentheses)a
UK vs. Australia Canada US Retail 2003 28.2% 65.2% 55.0% 44.5% (0.00) (0.04) (0.06) Transportation 2003 56.0% 81.8% 50.0% 49.2% (0.20) (0.83) (0.72) UK-IFRS vs. Canada US UK-2003 Retail 2007 61.5% 60.0% 49.4% 28.2% (0.91) (0.17) (0.00) Transportation 2007 100.0% 50.0% 52.3% 56.0% (0.85) (0.01) (0.02) Au-IFRS vs. Canada US Au-2003 Retail 2007 56.5% 60.0% 49.4% 65.2% (0.82) (0.52) (0.55) Transportation 2007 81.8% 50.0% 52.3% 81.8% (0.17) (0.07) (1.00)
_____________________ a Table 4 Panels C and D repeat the capital lease proportions from panel A that are relevant for tests of H1 and H2, respectively. The p-values in parentheses are for two-tailed tests of differences in proportions, using the normal approximation to the binomial distribution. Bolded p-values denote cases where the p-value is below 0.10 and the direction of the difference is consistent with the stated alternative hypothesis.

48
Table 5 Capital Lease Intensity, by Country, Industry and Time Perioda
Panel A: Capital lease intensity for firms using leases, by country-industry-year
Industry Retail Transportation Country \ Year 2003 2007 N 2003 2007 N
Australia 12.2% 7.7% 23 40.1% 46.2% 11 Canada 1.0% 1.2% 20 18.0% 12.5% 5
UK 0.7% 1.1% 39 8.2% 12.5% 9 US 2.7% 3.8% 164/163 8.5% 6.6% 61/62
Panel B: Tests of H1: US compared with other regimes (p-values in parentheses)b
US vs. Australia Canada UK Retail 2003 2.7% 12.2% 1.0% 0.7% (<0.0001) (0.25) (0.06) 2007 3.8% 7.7% 1.2% 1.1% (0.15) (0.27) (0.12) Transportation 2003 8.5% 40.1% 18.0% 8.2% (0.0001) (0.33) (0.97) 2007 6.6% 46.2% 12.5% 12.5% (<0.0001) (0.44) (0.32)

49
Table 5 (continued) Panel C: Tests of H2: Regimes with fewer bright lines compared with other regimes (p-values in parentheses)b
UK vs. Australia Canada US Retail 2003 0.7% 12.2% 1.0% 2.7% (0.001) (0.59) (0.06) Transportation 2003 8.2% 40.1% 18.0% 8.5% (0.03) (0.44) (0.97) UK-IFRS vs. Canada US UK-2003 Retail 2007 1.1% 1.2% 3.8% 0.7% (0.97) (0.12) (0.29) Transportation 2007 12.5% 12.5% 6.6% 8.2% (1.00) (0.32) (0.63) Au-IFRS vs. Canada US Au-2003 Retail 2007 7.7% 1.2% 3.8% 12.2% (0.15) (0.15) (0.47) Transportation 2007 46.2% 12.5% 6.6% 40.1% (0.08) (<0.0001) (0.69)
_____________________ a We define capital lease intensity as the capital lease proportion of a firm’s total leasing activity, where leasing activity is undiscounted lease commitments.
b Panels B and C repeat the capital lease intensities from Panel A that are relevant for tests of H1 and H2, respectively. The p-values in parentheses are for two-tailed t-tests of differences. Bolded p-values denote cases where the p-value is below 0.10 and the direction of the difference is consistent with the stated alternative hypothesis.

50
Table 6 Determinants of Capital Lease Use and Capital Lease Intensity, and Tests of H1 and H2
Controlling for Firm-Specific Factorsa
Panel A: Probit analysis of capital lease use and OLS regression analysis of capital lease intensity (Z-statistics for probit and t-statistics for OLS in parentheses)
Dependent variable [estimation method]
Capital lease use [Probit]b
Capital lease intensity [OLS]c
Retail Trans Retail Trans constant -1.27 -2.58 -0.01 -0.04 (-3.81) (-4.33) (-0.42) (-0.46) AUS 0.81 2.15 0.07 0.34 (2.45) (3.67) (2.94) (4.43) CDA 0.36 -0.19 -0.02 0.13 (1.07) (-0.28) (-0.71) (1.03) UK -0.64 -0.22 -0.03 0.04 (-2.28) (-0.43) (-1.44) (0.55) Post 0.07 -0.20 0.01 -0.02 (0.45) (-0.75) (0.79) (-0.42) AUS*Post -0.17 -0.36 -0.02 0.06 (-0.38) (-0.51) (-0.50) (0.61) CDA*Post -0.04 0.06 -0.01 -0.05 (-0.09) (0.06) (-0.27) (-0.30) UK*Post 0.99 n/a 0.00 0.07 (2.65) n/a (-0.06) (0.66) Size ? 0.19 0.45 0.00 0.00 (4.60) (5.62) (0.88) (-0.49) Lev - 0.13 0.06 0.01 0.03 (0.46) (0.11) (0.65) (0.39) Profit + -3.04 0.87 -0.16 -0.03 (-4.07) (0.52) (-2.87) (-0.11) Var + -4.38 0.62 -0.12 -0.02 (-3.15) (0.72) (-1.28) (-0.11) PPE ? 0.80 -0.91 0.11 0.27 (1.90) (-1.60) (3.74) (3.14) Growth - 0.86 0.10 0.03 -0.02 (2.92) (0.24) (1.81) (-0.32) N 461 160 460 159 pseudo/adj. R2 0.127 0.232 0.072 0.271
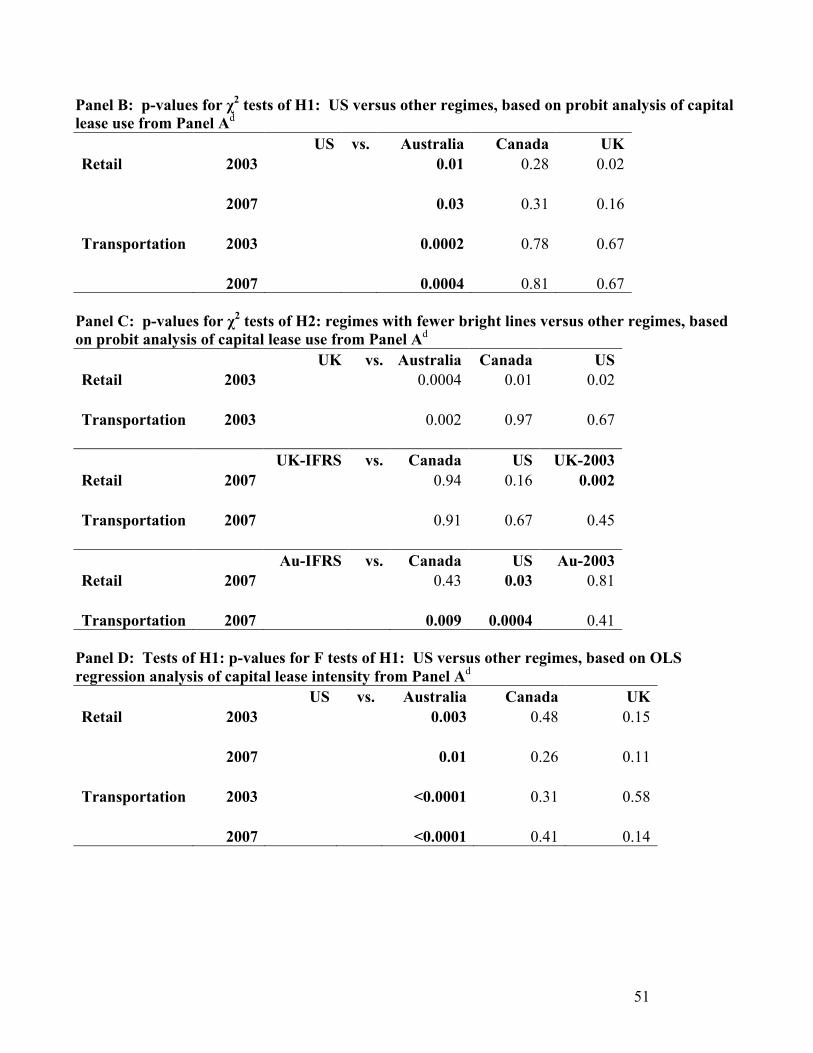
51
Panel B: p-values for χ2 tests of H1: US versus other regimes, based on probit analysis of capital lease use from Panel Ad
US vs. Australia Canada UK Retail 2003 0.01 0.28 0.02 2007 0.03 0.31 0.16 Transportation 2003 0.0002 0.78 0.67 2007 0.0004 0.81 0.67
Panel C: p-values for χ2 tests of H2: regimes with fewer bright lines versus other regimes, based on probit analysis of capital lease use from Panel Ad
UK vs. Australia Canada US Retail 2003 0.0004 0.01 0.02 Transportation 2003 0.002 0.97 0.67 UK-IFRS vs. Canada US UK-2003 Retail 2007 0.94 0.16 0.002 Transportation 2007 0.91 0.67 0.45 Au-IFRS vs. Canada US Au-2003 Retail 2007 0.43 0.03 0.81 Transportation 2007 0.009 0.0004 0.41
Panel D: Tests of H1: p-values for F tests of H1: US versus other regimes, based on OLS regression analysis of capital lease intensity from Panel Ad US vs. Australia Canada UK Retail 2003 0.003 0.48 0.15 2007 0.01 0.26 0.11 Transportation 2003 <0.0001 0.31 0.58 2007 <0.0001 0.41 0.14

52
Panel E: Tests of H1: p-values for F tests of H2: regimes with fewer bright lines versus other regimes, based on OLS regression analysis of capital lease intensity from Panel Ad UK vs. Australia Canada US Retail 2003 0.0006 0.72 0.15 Transportation 2003 0.006 0.56 0.58 UK-IFRS vs. Canada US UK-2003 Retail 2007 0.92 0.11 0.76 Transportation 2007 0.75 0.14 0.59 Au-IFRS vs. Canada US Au-2003 Retail 2007 0.006 0.01 0.80 Transportation 2007 0.006 <0.0001 0.63
_____________________ a See Appendix A for variable definitions. b In the probit columns of Panel A, the dependent variable is capital lease use, an indicator variable that takes the value one if the company reports any leases as capital leases, and zero otherwise. Z-statistics in parentheses test whether the coefficient equals zero.
c In the OLS columns of Panel A, the dependent variable is capital lease intensity, the capital lease proportion of the firm-year’s total leasing activity, where leasing activity is undiscounted lease commitments. t-statistics in parentheses test whether the coefficient equals zero.
d Bolded p-values denote cases where the p-value is below 0.10 and the direction of the difference is consistent with the stated alternative hypothesis.

53
Table 7 Weighted-average Operating Lease Term,
by Country, Industry and Time Perioda
Panel A: Mean across firms of lease term, in years
Industry Retail Transportation Country \ Year 2003 2007 N 2003 2007 N
Australia 3.7 3.8 23 3.2 3.3 11 Canada 4.7 4.7 20 3.8 3.5 5
UK 7.5 7.6 39 4.8 4.8 9 US 4.7 4.9 163 4.5 4.1 59
Panel B: Tests of H3 - Regimes with no bright line for useful life compared with othersb
UK vs. Australia Canada US Retail 2003 7.5 3.7 4.7 4.7 (<0.0001) (0.002) (<0.0001) Transportation 2003 4.8 3.2 3.8 4.5 (0.10) (0.48) (0.68) UK-IFRS vs. Canada US UK-2003 Retail 2007 7.6 3.8 4.9 n/a (0.001) (<0.0001) Transportation 2007 4.8 3.5 4.1 n/a (0.38) (0.37) Au-IFRS vs. Canada US Au-2003 Retail 2007 3.8 4.7 4.9 3.7 (0.07) (0.02) (0.85) Transportation 2007 3.3 3.5 4.1 3.2 (0.73) (0.20) (0.93)
_____________________ a Weighted-average operating lease term is the weighted average of digits [1,2,...T], representing years
in the future in which a given firm-year has operating lease cash flows, with the weight equal to that future year’s cash flow.
b Panel B repeats the average operating lease terms from Panel A relevant for tests of H3, along with p-values for t-tests of differences in parentheses. Bolded p-values denote cases where the p-value is below 0.10 and the direction of the difference is consistent with the stated alternative hypothesis.

54
Table 8 Operating Lease Contingent Rentals, by Country, Industry and Time Perioda
Panel A: Average contingent rentals as a percent of total rentals across firms, by country,
industry and time period Industry Retail Transportation
Country \ Year 2003 2007 N 2003 2007 N Australia 19.8% 25.0% 22/21 11.5% 16.5% 9/10
UK 11.2% 15.8% 38/36 10.8% 11.7% 9/8 US 15.3% 14.4% 154/156 29.1% 30.6% 58/59
Panel B: Tests of H4 - IFRS compared with regimes having a fair value bright lineb
UK-IFRS vs. US UK-2003 Retail 2007 15.8% 14.4% 11.2% (0.60) (0.15) Transportation 2007 11.7% 30.6% 10.8% (0.01) (0.91) Au-IFRS vs. US Au-2003 Retail 2007 25.0% 14.4% 19.8% (0.00) (0.32) Transportation 2007 16.5% 30.6% 11.5% (0.03) (0.54)
_____________________ a We define contingent rentals as one minus the ratio of the one-year-ahead commitment from year t-1
to the rental expense in year t. b Panel B repeats the average contingent rentals from Panel A relevant for tests of H4, along with p-
values for t-tests of differences in parentheses. Bolded p-values denote cases where the p-value is below 0.10 and the direction of the difference is consistent with the stated alternative hypothesis.