printed in u.s.a. method developmentfor measuring
TRANSCRIPT

© Copyright as part of July/August 1998, Vol. 70 No . 5, Water Environment ResearchWashington, D.C . 20037
Printed in U .S .A .
Method development for measuringbiodegradable organic carbon in reclaimed
and treated wastewatersEakalak Khan, Roger W. Babcock, Jr., Irwin (Mel) H . Suffet, Michael K. Stenstrom
ABSTRACT: Analyses that measure oxygen demand, such as bio-chemical oxygen demand (BOD) and chemical oxygen demand (COD)analyses, have long been used as indicators ofcontamination and waste-water treatment plant efficiency. They measure the tendency of pollut-ants to react with oxygen, which is generally a good indicator of thestability or level of treatment. Both parameters include reactions withorganic as well as inorganic substances and suffer from a lack of preci-sion and accuracy at low concentrations, which are becoming increas-ingly more important. Biodegradable dissolved organic carbon (BDOC)analysis is a relatively new procedure that has advantages over bothBODand COD analyses, including insensitivity to inorganic oxidations .A modified BDOC procedure was developed to characterize the perfor-mance of advanced treatment methods, such as those used in municipalwater reclamation and secondary-treated wastewaters, where moderatelylow dissolved organic carbon concentrations (4 to 15 mg/L) are routinelyencountered. The development of the modified BDOC procedure wasbased on a combination of the existing batch BDOC protocol and BODtechniques. Various aspects and incubation conditions were investigatedto finalize the procedure. Nitrification does not interfere with the proce-dure . It is possible to simultaneously determine the soluble BOD(SBOD) under certain conditions . The procedure has reduced variabilityand increased precision as compared to BOD and COD analyses . WaterEnviron. Res., 70, 1025 (1998) .
KEYWORDS: secondary-treated wastewater, organic carbon, re-claimed wastewater, biodegradation, biodegradable dissolved organiccarbon, analyses .
IntroductionRemoval of organic contaminants is a primary goal of both
waterand wastewater treatment . Traditional methods of evaluat-ing treatment efficiency measure the tendency of the contami-nants to react with oxygen. Biochemical oxygen demand(BOD), chemical oxygen demand (COD), and total oxygen de-mand (TOD) have all been used . Organic carbon is frequentlyone of the main components of the contaminants, and for thisreason total organic carbon (TOC) removal is sometimes usedas a primary indicator of treatment plant efficiency .
All four measurements have advantages and disadvantages.TheBOD measurement provides the best estimate ofthe reactiv-ity of the contaminants in the natural environment, but is insen-sitive and imprecise at low concentrations . The COD measure-ment provides no indication of biodegradability and has limitedprecision and accuracy at values less than 5 mg/L (APHA etal., 1989). The COD procedure also uses toxic reagents andproduces hazardous wastes .
The presence of certain contaminants or conditions interferewith BOD, COD, and TOD analyses . The BOD test measures
July/August 1998
the presence of both carbonaceous and nitrogenous oxygen de-mands, which are becoming known as CBOD and NBOD, re-spectively . Sometimes it is desirable to have one analysis mea-sure both demands, but more often, separate measurement ofthe demands is preferred (Albertson, 1995). TheCOD test doesnot completely oxidize some ring organics such as pyridine andrelated compounds, and it is subject to interference at highchloride concentrations (APHA et al ., 1989). The TOD proce-dure is an instrumental method that combusts the sample andprovides rapid response . Unfortunately, if nitrate is present inthe sample, a false reading is produced when some of the nitrateis reduced to nitrite or other nitrous oxides . The indicated TODis sometimes negative for samples with low oxygen demandand high nitrate concentration . Analysis of TOC is a rapid pro-cedure with low detection limits (0 .05 to 0.10 mg/L) and excel-lent precision, and has fewer of the previously cited disadvan-tages. Therefore, it is frequently used as an indicator ofcontami-nants in potable waters as well as reclaimed and treatedwastewaters . Its primary disadvantage is that it provides noindication of the biodegradability of the contaminants .
This paper presents an adaptation of a previous method (Ser-vais et al ., 1989) for quantifying the biodegradable dissolvedorganic carbon (BDOC) in drinking water (dissolved organiccarbon [DOC] < 4 mg/L) for use in evaluating reclaimed andsecondary-treated wastewaters (DOC = 4 to 15 tng/L) . A modi-fied batch protocol was developed using a combination of theexisting batch BDOC protocol and BOD techniques . With theuse of this new protocol, it was expected that simultaneousdeterminations of DOC, BDOC, and soluble BOD (SBOD) oftested waters could be achieved . A companion paper (Khan etal., 1998) shows the applications of the modified BDOC proto-col for the analysis of reclaimed and secondary-treated waste-waters . Although it has not been tested with other wastewaters,the protocol, with appropriate modifications, should be applica-ble to water samples with high DOC, such as primary-treatedwastewater.
BackgroundIn 1987, Servais et al. introduced the BDOC parameter. Huck
(1990) defined BDOC as the portion of organic carbon in waterthat can be metabolized by heterotrophic microorganisms . Be-side causing taste, odor, and color in water, BDOC can reactwith some disinfectants to form undesirable products . In addi-tion, BDOC can be a problem in drinking water by inducingregrowth in the distribution system ; such regrowth inhibits ordefeats disinfection .
1025
Khan et al.
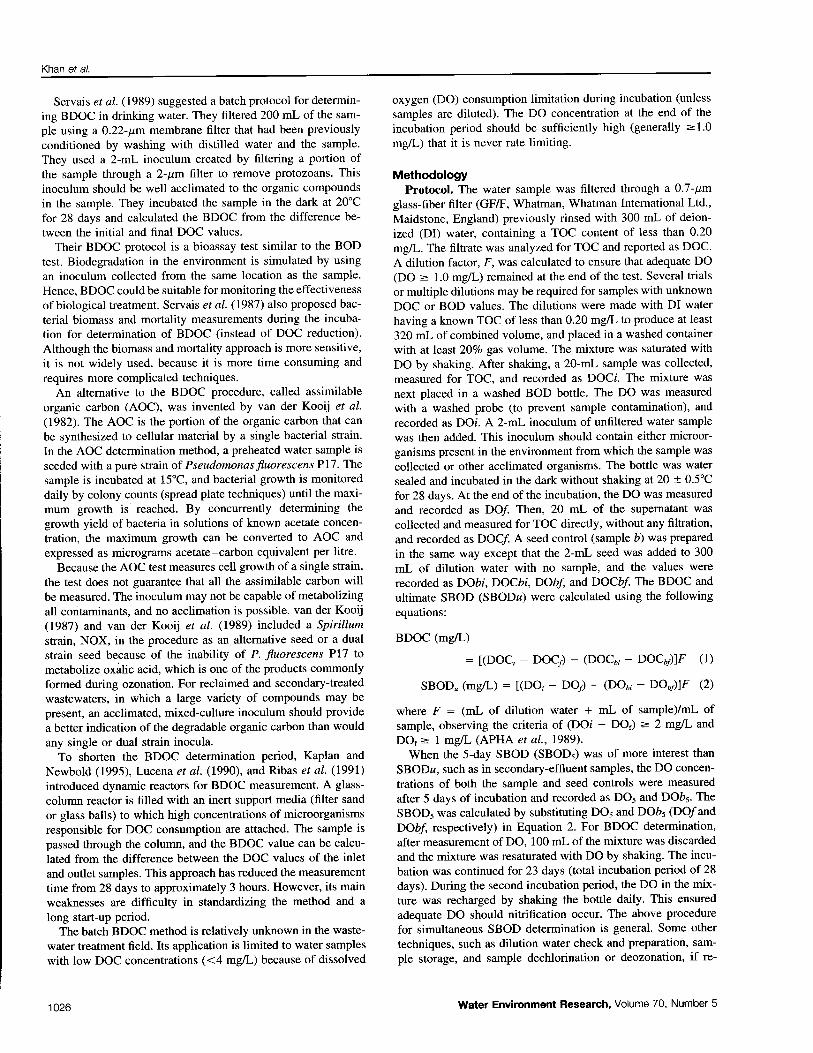
Servais et al . (1989) suggested a batch protocol for determin-ing BDOC in drinking water. They filtered 200 mL of the sam-ple using a 0.22-ym membrane filter that had been previouslyconditioned by washing with distilled water and the sample .They used a 2-mL inoculum created by filtering a portion ofthe sample through a 2-Mm filter to remove protozoans . Thisinoculum should be well acclimated to the organic compoundsin the sample . They incubated the sample in the dark at 20 °Cfor 28 days and calculated the BDOC from the difference be-tween the initial and final DOC values .
Their BDOC protocol is a bioassay test similar to the BODtest . Biodegradation in the environment is simulated by usingan inoculum collected from the same location as the sample .Hence, BDOC could be suitable for monitoring the effectivenessof biological treatment . Servais et al . (1987) also proposed bac-terial biomass and mortality measurements during the incuba-tion for determination of BDOC (instead of DOC reduction) .Although the biomass and mortality approach is more sensitive,it is not widely used, because it is more time consuming andrequires more complicated techniques .An alternative to the BDOC procedure, called assimilable
organic carbon (AOC), was invented by van der Kooij et al.(1982) . The AOC is the portion of the organic carbon that canbe synthesized to cellular material by a single bacterial strain.In the AOC determination method, a preheated water sample isseeded with a pure strain of Pseudomonasfuorescens P17. Thesample is incubated at 15 °C, and bacterial growth is monitoreddaily by colony counts (spread plate techniques) until the maxi-mum growth is reached. By concurrently determining thegrowth yield of bacteria in solutions of known acetate concen-tration, the maximum growth can be converted to AOC andexpressed as micrograms acetate-carbon equivalent per litre .
Because the AOCtest measures cell growth of a single strain,the test does not guarantee that all the assimilable carbon willbe measured . The inoculum maynot be capable of metabolizingall contaminants, and no acclimation is possible . van der Kooij(1987) and van der Kooij et al . (1989) included a Spirillumstrain, NOX, in the procedure as an alternative seed or a dualstrain seed because of the inability of, P. fuorescens P17 tometabolize oxalic acid, which is one of the products commonlyformed during ozonation. For reclaimed and secondary-treatedwastewaters, in which a large variety of compounds may bepresent, an acclimated, mixed-culture inoculum should providea better indication of the degradable organic carbon than wouldany single or dual strain inocula.To shorten the BDOC determination period, Kaplan and
Newbold (1995), Lucena et al. (1990), and Ribas et al . (1991)introduced dynamic reactors for BDOC measurement. A glass-column reactor is filled with an inert support media (filter sandor glass balls) to which high concentrations of microorganismsresponsible for DOC consumption are attached. The sample ispassed through the column, and the BDOC value can be calcu-lated from the difference between the DOC values of the inletand outlet samples. This approach has reduced the measurementtime from 28 days to approximately 3 hours. However, its mainweaknesses are difficulty in standardizing the method and along start-up period .The batch BDOC method is relatively unknown in the waste-
water treatment field. Its application is limited to water sampleswith low DOC concentrations (<4 mg/L) because of dissolved
1026
oxygen (DO) consumption limitation during incubation (unlesssamples are diluted) . The DO concentration at the end of theincubation period should be sufficiently high (generally ? 1 .0mg/L) that it is never rate limiting .
MethodologyProtocol. The water sample was filtered through a 0.7-/cm
glass-fiber filter (GF/F, Whatman, Whatman International Ltd.,Maidstone, England) previously rinsed with 300 mL of deion-ized (DI) water, containing a TOC content of less than 0.20mg/L . The filtrate was analyzed for TOC and reported as DOC.A dilution factor, F, was calculated to ensure that adequate DO(DO ? 1.0 mg/L) remained at the end of the test . Several trialsor multiple dilutions may be required for samples with unknownDOC or BOD values . The dilutions were made with DI waterhaving a known TOCof less than 0.20 mg/L to produce at least320 mL of combined volume, and placed in a washed containerwith at least 20% gas volume . The mixture was saturated withDO by shaking. After shaking, a 20-mL sample was collected,measured for TOC, and recorded as DOCi . The mixture wasnext placed in a washed BOD bottle . The DO was measuredwith a washed probe (to prevent sample contamination), andrecorded as DOi. A 2-mL inoculum of unfiltered water samplewas then added. This inoculum should contain either microor-ganisms present in the environment from which the sample wascollected or other acclimated organisms. The bottle was watersealed and incubated in the dark without shaking at 20 ± 0.5°Cfor 28 days . At the end of the incubation, the DO was measuredand recorded as DOf. Then, 20 mL of the supernatant wascollected and measured for TOCdirectly, without any filtration,and recorded as DOCf. A seed control (sample b) was preparedin the same way except that the 2-mL seed was added to 300mL of dilution water with no sample, and the values wererecorded as DObi, DOCbi, DObf, and DOCbf. The BDOC andultimate SBOD (SBODu) were calculated using the followingequations :
BDOC (mg/L)
= [(DOC; - DOCf) - (DOCb; - DOCbf)]F
(1)
SBODu (mg/L) = [(DO; - DOf) - (DO,; - DObf)]F (2)
where F = (mL of dilution water + mL of sample)/mL ofsample, observing the criteria of (DOi - DOf) ? 2 mg/L andDOf ~ 1 mg/L (APHA et al., 1989).When the 5-day SBOD (SBOD5) was of more interest than
SBODu, such as in secondary-effluent samples, the DO concen-trations of both the sample and seed controls were measuredafter 5 days of incubation and recorded as DOS and DOb5. TheSBOD5 was calculated by substituting DOS and DOb5 (DOfandDObf, respectively) in Equation 2. For BDOC determination,after measurement of DO, 100 ml- of the mixture was discardedand the mixture was resaturated with DO by shaking. The incu-bation was continued for 23 days (total incubation period of 28days). During the second incubation period, the DO in the mix-ture was recharged by shaking the bottle daily . This ensuredadequate DO should nitrification occur. The above procedurefor simultaneous SBOD determination is general. Some othertechniques, such as dilution water check and preparation, sam-ple storage, and sample dechlorination or deozonation, if re-
Water Environment Research, Volume 70, Number 5

quired, should be incorporated and performed as described inStandard Methodsfor the Examination of Water and Wastewa-ter (APHA et al., 1989).The modified BDOC protocol presented above differs from
the original batch protocol in many aspects . It was eventuallydeveloped from the original procedure after several series ofexperiments to identify problems and sources of error. The typeof filter used for DOC determination was changed from 0.22-,um cellulose acetate (CA) membrane filter to 0.7-,um glass-fiberfilter . It was found that the CA membrane releases a substantialamount of organic carbon . The leaching of organic carbon fromthe CA membrane was studied in detail, and the results aredescribed and discussed in the next section . A BOD bottle wasused for incubation . Both BOD bottles and glass-fiber filtersare standard equipment in water quality laboratories . To main-tain the similarities in microbial types and activities betweenthe actual environment and the incubation, the seed employedin the modified protocol was not filtered . As a result, the seedshould contain both heterotrophic bacteria and protozoans . Dis-solved oxygen was measured before and after the incubation todetermine SBOD and to confirm its adequacy throughout theincubation period . The dilution and seed control were incorpo-rated to make the protocol workable with moderately high-DOCwaters and to produce more accurate results .
Dissolved Organic Carbon and Dissolved Oxygen Mea-surements. Dissolved organic carbon was measured with aDohrmann Total Organic Carbon Analyzer, model DC-80 (Xer-tex Corporation, Santa Clara, California), using ultraviolet pro-moted persulfate oxidation and infrared spectrometry . The ana-lyzer was calibrated daily using 10 mg TOC/L potassium hydro-gen phthalate (KHP) standard solution and the multiple-pointcalibration procedure recommended by the manufacturer . Theanalyzer has a usable range of 0.10 to 20.00 mg/L (limit ofquantitation to limit of linearity) and a detection limit of 0.04mg/L for a sarr}ple size of 1 mL . The mean value of three DOCmeasurements was reported . Dissolved oxygen was measuredusing a YSI 58 DO Meter and a YSI 5720 DO Probe (YellowSprings Instrument Co., Inc., Yellow Springs, Ohio).
Results and DiscussionThe original BDOC procedure (Servais et al., 1989) was first
used to measure BDOC of the effluent samples from the sandfilter, the primary ozonation columns (5 columns), and the bio-logical activated carbon (BAC) filter of the Lake Arrowheadwastewater reclamation pilot plant (Madireddi et al ., 1997).Problems and inconsistent BDOC results were encountered us-ing the original procedure. To identify the problems and sourcesof error, various aspects of the original protocol were evaluatedand modified . The main modification was inclusion of the dilu-tion and/or DO recharge (shaking) techniques to avoid oxygendepletion during the incubation. The filter type, inoculum originand size, and inoculum filtration (after incubation) were allinvestigated . Control experiments using prepared samples con-taining known compounds (dextrose and sodium acetate) werealso conducted. After the complete development, the modifiedprotocol was employed to determine BDOC of secondary efflu-ents . Reduction of the incubation period was attempted by agi-tating the sample, increasing the incubation temperature, andstudying the protocol kinetics .
Filter Type. The initial BDOC analysis using 0.22-pm CA
July/August 1998
membrane filters provided inconsistent results . The membranereleased organic carbon even after being rinsed with 300 mLof DI water and 300 mL of sample . A soak test was performedto determine the amount oforganic carbon released from the CAmembrane filters (Khan, 1997). The results show that withoutprerinsing, one 0.22-/.tm CA membrane filter can release ap-proximately 0.40 to 0.50 mg of TOC (1 .40 to 1 .70 mg TOC/Lin a 300-mL BOD bottle) in the first 24 hours of the soak test.Filters still leached organic carbon in a second 24-hour soaktest (0 .03 mg of TOC/filter) .The quantity of DOC leached was sometimes more than the
DOC reacting during the BDOC analysis . The leached organiccarbon was not analyzed, but its biodegradability was evaluated.During the 28-day period, the leached organic carbon degraded,further complicating the use of CA membrane filters . It is possi-ble that the filters were hydrolyzing and releasing TOC. The0.22-pm CA membrane filters were abandoned. No leaching oradsorption problems were detected with glass fiber-filters,which were used for all subsequent analyses .
Detection Limit, Precision, and Accuracy of the ModifiedBiodegradable Dissolved Organic Carbon Protocol . Themodified BDOC protocol was evaluated following the proce-dure for determining method detection limit (MDL) in StandardMethods (APHA et al., 1989) using five blank samples spikedwith sodium acetate (0.40 to 0.50 mg DOC/L) . The resultsindicated an MDL of 0.10 to 0.15 mg/L, which was lower thanthe MDLs of 5 mg/L and 2.0 mg/L for the COD and BOD5tests, respectively . Though the detection limit of the BDOC testwas much lower than those for the COD and BOD5 tests, italone was not sufficient to conclude that the BDOC test is betterthan the other two tests . As a consequence, the modified BDOCprotocol was further investigated for precision.To determine precision, the modified BDOC protocol was
used on 29 reclaimed-wastewater samples and 43 secondary-effluent samples. The DOC concentrations of these 72 samplesranged from 4.50 to 15.50 mg/L . Each sample was run in tripli-cate. The mean BDOC concentration and standard deviation(SD) of each sample were calculated . Assuming a linear rela-tionship between BDOC concentration and the precision of themethod, a linear regression between 72 mean BDOC concentra-tions and their SDs yields the following statistically significantrelationship (Pearson, p < 0.000 5) :
SD (mg/L) = 0.03(BDOC) + 0.03
Or
Coefficient of variation (%) = 100(
SD\BDOC
Khan et al.
correlation coefficient, r = 0.55
(3)
= 3.0 +
3.0(BDOC) (4)
Concentrations of BDOC were measured in 72 samples andranged from 0.50 to 5 .00 mg/L . The SD was 0.05 to 0.18 mg/L, which corresponds to a range in the coefficient of variation(CV) of 3.6 to 9.0%. According to a series of interlaboratorystudies on BOD5 measurements using synthetic water samples(1 :1 mixture of glucose and glutamic acid) as described in Stan-
1027

Khan et al.
Table 1-Accuracy of the modified BDOC protocol .
Standardsolution
Dextrose
Sodium acetate
dard Methods (APHA et al., 1989), the predicted BOD5 CV forsamples with a BOD5 of 2 to 30 mg/L (a typical range of BOD5for reclaimed and secondary-treated wastewaters) is 16 .9 to40.4%. The CV of the COD procedure is not defined for concen-trations in this low range; however, the CV of samples with aCOD concentration of 200 mg/L and chloride concentration of0 to 100 mg/L ranges from 4.8 to 10.8%. At the lower CODconcentrations found in reclaimed and secondary-treated waste-waters (5 mg/L :5 COD :!s; 80 mg/L) and greater chloride con-centrations, the CV should be higher . It can be concluded thatthe BDOC procedure is more precise than the BOD5 and CODprocedures.
The variability of the BDOC procedure described above canarise from factors related to three sources: instrumentation, per-sonnel/operation, and method. The last two sources of variabil-ity are difficult to identify . To estimate the variability resultingfrom the instrument, a review of the long-term performance ofthe TOC analyzer was made . During a span of 2 years precedingthis study, the same TOC analyzer was used for DOC measure-ment of various samples, including reclaimed and secondary-treated wastewaters . A review of approximately 2 500 triplicateanalyses (DOC s 15.00 mg/L) showed a CV of 1.0%. If DOCconcentrations of the dilution water used for seed control arelow (__ 0.20 mg/L), the pooled SD of the initial and final DOCmeasurements of a sample can be used to estimate the variabilitycaused by the instrument . Based on the CV of 1 .0% and theactual DOC data before and after incubation of 72 samples usedin the precision study, the range of pooled SD caused by theDOC measurements is 0.05 to 0.19 mg/L, which agrees withthe range yielded by Equation 3. Accordingly, it seems that thevariability in BDOC analysis caused by personnel and methodare small, and the precision of the modified BDOC protocol isprimarily dependent on the precision of the DOCmeasurements .
It is difficult to determine the accuracy ofthe modified BDOCprotocol because it is a bioassay method and the true value cannever be known. Two biodegradable compounds, dextrose andsodium acetate, were used to prepare standard solutions havingDOC concentrations of 1.40 mg/L and0.80 mg/L, respectively .The BDOC results in Table 1 show that the predictions werevery accurate . Recovery ranged from 94.3 to 101 .4% for dex-trose standard solution and from 96.4 to 101.2% for sodiumacetate standard solution. The protocol should provide evenmore accuracy with standards that have higher DOC concentra-tions. Response of the modified BDOC protocol to samples
1028
containing standard compounds with higher DOC concentra-tions is being studied .Inoculum Origin and Size . Table 2 shows a comparison of
the BDOC values determined using inoculum from two differentsources: BAC filter effluent and sand filter effluent . The resultsfor this case show that the BDOC measurement is not a functionof the inoculum origin . Most of the difference between thetwo inocula are within the method's precision range, and theirsignificance levels (Student's t-test) are ~t 0.05 . For a laterprocedure, it was decided to inoculate the sample with the unfil-tered sample. For samples that might not contain sufficient mi-croorganisms to serve as an inoculum, such as ozonated sam-ples, the BAC filter inoculum was used .Three inoculum sizes were investigated, and the results are
shown in Table 3. The inoculum size does not significantlyaffect the BDOC determination for these conditions . The differ-ences between the BDOC values using different inoculum sizes(2 mL versus 4 mL and 2 mL versus 1 mL) fall within themethod's precision and are insignificant. An inoculum size of2 mL was chosen for the remainder of the study.
Filtration after Incubation. Microbial growth occurs duringthe BDOC procedure. To determine whether the cells interferewith the procedure or there is a significant TOC associated withcell mass, a series of experiments was performed with andwithout glass-fiber filtration before final TOC analysis . Table 4shows the results, which indicate that filtration had no signifi-cant effect . For simplicity and convenience, the modified BDOCprocedure therefore does not require filtration of the sampleafter the incubation .
Agitation of Samples, Temperature of Incubation, andKinetics of the Protocol. It was expected that agitating samplesor incubating at a higher temperature would reduce the incuba-tion period . Fourteen reclaimed-wastewater samples and 39 sec-ondary-effluent samples were used to study the effects of agita-tion and incubation temperature on protocol kinetics. Agitationwas provided by leaving 30% headspace in the incubation bottleand shaking at 100 r/min throughout the incubation . Simultane-ous determination of SBOD could not be performed with thisprocedure. A temperature of 37°C was chosen because it is theupper limit of the mesophilic range. Four different incubationconditions (agitation at 20°C, no agitation at 20 °C, agitation at37°C, and no agitation at 37°C) were studied. Duplicates wererun for all conditions . Kinetics were investigated by collectingsamples for TOC analysis at 5, 10, 15, and 20 days in additionto the final determination at 28 days . The BDOC results (meanvalues of duplicates) for different conditions were compared .
Significance levels (t-test) of the differences in BDOC con-centrations measured for agitated and nonagitated reclaimed-wastewater samples were computed . At each temperature, only1 of 70 observations had a significance level below 0.05 . Thesignificance levels of the differences were all above 0.05 at15, 20, and 28 days of incubation. Thus, at both incubationtemperatures, agitation had no effect on the protocol kinetics(data not shown).
Figure 1 shows the significance levels of the differences inBDOC concentrations of reclaimed-wastewater samples whenincubated at 20°C and 37°C (regardless of agitation conditionbecauseit has no effect on BDOC determination) . Points fallingbelow the horizontal line at 0.05 are significant at a significancelevel of 0.05 using the one-tailed t-test. All 28 observations had
Water Environment Research, Volume 70, Number 5
Actual DOC,mg/L
BDOC,mg/L
Recovery,
1 .41 1 .39 97.91 .33 94.31 .33 94.31 .29 101 .4
0.83 0.81 97.60 .81 97.60.80 96.40.84 101 .2
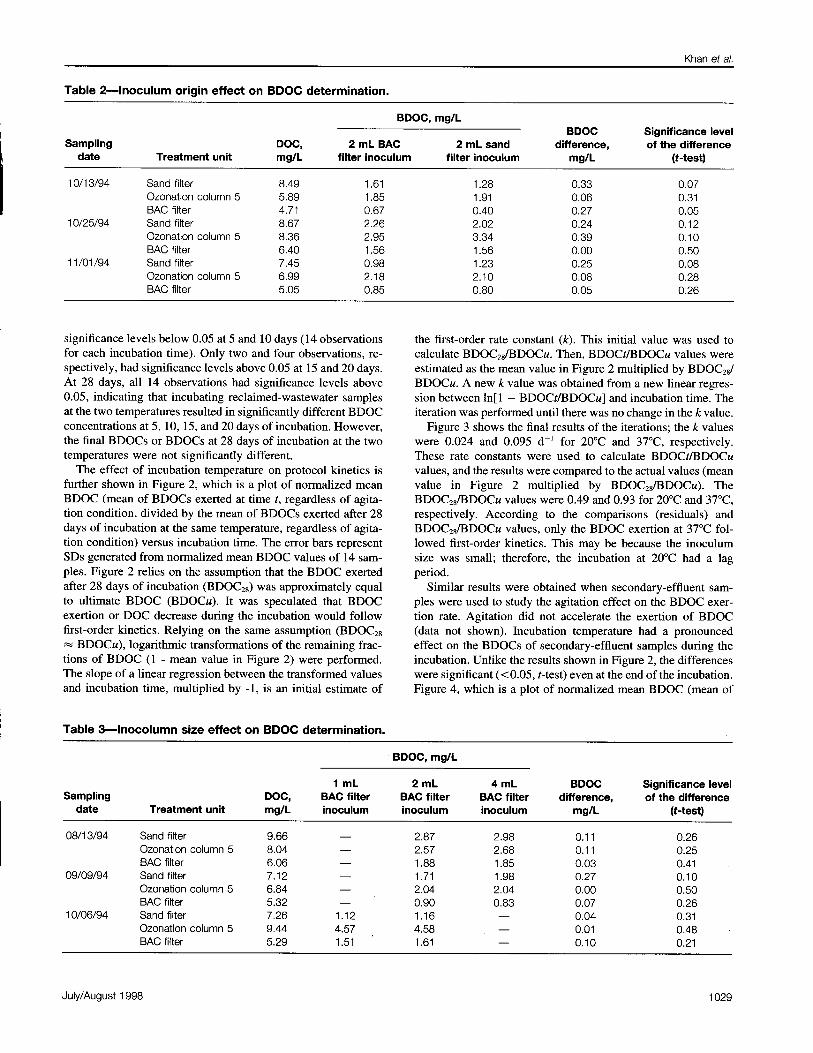
Table 2-Inoculum origin effect on BDOC determination .
significance levels below 0.05 at 5 and 10 days (14 observationsfor each incubation time). Only two and four observations, re-spectively, had significance levels above 0.05 at 15 and 20 days .At 28 days, all 14 observations had significance levels above0.05, indicating that incubating reclaimed-wastewater samplesat the two temperatures resulted in significantly different BDOCconcentrations at 5, 10, 15, and 20 days of incubation . However,the final BDOCs or BDOCs at 28 days of incubation at the twotemperatures were not significantly different.The effect of incubation temperature on protocol kinetics is
further shown in Figure 2, which is a plot of normalized meanBDOC (mean of BDOCs exerted at time t, regardless of agita-tion condition, divided by the mean of BDOCs exerted after 28days of incubation at the same temperature, regardless of agita-tion condition) versus incubation time . The error bars representSDs generated from normalized mean BDOC values of 14 sam-ples . Figure 2 relies on the assumption that the BDOC exertedafter 28 days of incubation (BDOC2g ) was approximately equalto ultimate BDOC (BDOCu). It was speculated that BDOCexertion or DOC decrease during the incubation would followfirst-order kinetics . Relying on the same assumption (BDOC2g
BDOCu), logarithmic transformations of the remaining frac-tions of BDOC (1 - mean value in Figure 2) were performed.The slope of a linear regression between the transformed valuesand incubation time, multiplied by -1, is an initial estimate of
Table 3-Inocolumn size effect on BDOC determination .
July/August 1998
the first-order rate constant (k) . This initial value was used tocalculate BDOC28/BDOCu. Then, BDOCt/BDOCu values wereestimated as the mean value in Figure 2 multiplied by BDOC28 /BDOCu. Anewkvalue was obtained from a new linear regres-sion between In[1 - BDOCt/BDOCu] and incubation time . Theiteration was performed until there was no change in the k value.
Figure 3 shows the final results of the iterations ; the k valueswere 0.024 and 0.095 d-' for 20°C and 37°C, respectively.These rate constants were used to calculate BDOCt/BDOCuvalues, and the results were compared to the actual values (meanvalue in Figure 2 multiplied by BDOC2g/BDOCu). TheBDOC28/BDOCu values were 0.49 and 0.93 for 20°C and 37°C,respectively . According to the comparisons (residuals) andBDOC28/BDOCu values, only the BDOC exertion at 37°C fol-lowed first-order kinetics . This may be because the inoculumsize was small ; therefore, the incubation at 20°C had a lagperiod .
Similar results were obtained when secondary-effluent sam-ples were used to study the agitation effect on the BDOC exer-tion rate . Agitation did not accelerate the exertion of BDOC(data not shown) . Incubation temperature had a pronouncedeffect on the BDOCs of secondary-effluent samples during theincubation . Unlike the results shown in Figure 2, the differenceswere significant (<0.05, t-test) even at the end ofthe incubation .Figure 4, which is a plot of normalized mean BDOC (mean of
Khan et al.
1029
Samplingdate Treatment unit
DOC,mg/L
1 mLBAC filterinoculum
BDOC, mg/L
2 mLBAC filterinoculum
4 mLBAC filterinoculum
BDOCdifference,
mg/L
Significance levelof the difference
(t-test)
08/13/94 Sand filter 9 .66 - 2.87 2.98 0.11 0.26Ozonation column 5 8.04 - 2.57 2.68 0.11 0.25BAC filter 6.06 - 1 .88 1 .85 0.03 0.41
09/09/94 Sand filter 7 .12 - 1 .71 1 .98 0.27 0.10Ozonation column 5 6.84 - 2.04 2.04 0.00 0.50BAC filter 5 .32 - 0.90 0.83 0.07 0.26
10/06/94 Sand filter 7.26 1 .12 1 .16 - 0.04 0.31Ozonation column 5 9.44 4.57 4.58 - 0.01 0.48BAC filter 5 .29 1 .51 1 .61 - 0.10 0.21
Samplingdate Treatment unit
DOC,mg/L
BDOC,
2 mL BACflliter inoculum
mg/L
2 mL sandfilter inoculum
BDOCdifference,
mg/L
Significance levelof the difference
(t-test)
10/13/94 Sand filter 8 .49 1 .61 1 .28 0.33 0.07Ozonation column 5 5.89 1 .85 1 .91 0 .06 0 .31BAC filter 4 .71 0 .67 0.40 0 .27 0.05
10/25/94 Sand filter 8 .67 2.26 2.02 0 .24 0.12Ozonation column 5 8.36 2 .95 3.34 0.39 0.10BAC filter 6 .40 1 .56 1 .56 0.00 0.50
11/01/94 Sand filter 7 .45 0.98 1 .23 0 .25 0.08Ozonation column 5 6.99 2 .18 2.10 0 .08 0.28BAC filter 5 .05 0.85 0.80 0 .05 0.26

Khan et al.
Table 4-Effect of inoculum filtration on BDOC determination .
BDOCs at time t regardless of agitation condition divided bymean of BDOC28 exerted at 37°C regardless of agitation condi-tion), illustrates the differences . At 28 days, the BDOC exertedat 20 °C was only 75% (± 12%) of the BDOC exerted at 37 °C.The assumption that BDOC28 is approximately equal to BDOCuwas not true for this case . This difference may have occurredbecause secondary-effluent samples are more recalcitrant thanozonated reclaimed-wastewater samples. The modified BDOCprotocol is being investigated to detect the biodegradability ofozonated secondary effluents . The results will be reported in afuture publication .
Investigation of theBDOC exertion rate constants for second-ary-effluent samples followed the same process described abovefor reclaimed-wastewater samples, and the results were similar.Only the BDOC exertion at 37°C agrees with the first-ordermodel, and the BDOCZ$/BDOCu value is 0.85 . The k value of0.068 d- ' for 37°C (data not shown) indicates that the BDOCexertion of secondary-effluent samples is much slower than theBDOC exertion of the ozonated, reclaimed-wastewater samples(k value of 0.095 d-') . The incubation temperature of 20 °C wasstill chosen for the modified protocol because it is the standardtemperature that has been used in most of the analytical proce-dures, including the BOD test . In addition, considering BOD5 ,which is only 68% of BODu, it is believed that BDOC exertedafter 28 days of incubation (approximately 64% of BDOCu) is
UN
o °
aU
U00y Q
0 .50
0 .40
0 .30
0.20
0.10
r.--- -
'i
-
. I
. . . . . . . . . . . . . . . . . . . . . . . . . . . . . . . . . . . . . . . . . _
.. .._ . . . . ._ . . ._ . . . . . . . . . . . . . ..- . .. . ._ . . . . . . . . . . . . . . . . . . . . . . . . . ._ . . . .
. . . . . . . . . . . . . . . . . . . . . . . . . . . . . . . . . . . . . . . . . . . . . . . . . . . . . . . . . . . . . . . . . . . . . . . . .A . .
.. . . . . . . . . . . . . . . . . . . . . . . . . . . . . . . . .. . . .
.:. . . ..----- .----- .-----
. . . . . . . . . . . .
. .
0.000 5 10 15 20 25 30
Incubation time (days)
Figure 1-Incubation temperature effect on determina-tion of BDOC in reclaimed wastewater samples.
1030
sufficient to indicate secondary-effluent quality (Khan et al .,1998).Simultaneous Determinations of Biodegradable Dissolved
Organic Carbon and Soluble Biochemical Oxygen Demand.The protocol was used successfully for simultaneous determina-tions of BDOC and SBODu of reclaimed-wastewater samples.Nitrification does not affect BDOC determination, but nitrifica-tion inhibitors such as 2-chloro-6-(trichloromethyl) pyridine andallylthiourea will interfere with the BDOC exerted during theprocedure. The BDOC and SBODS of secondary-effluent sam-ples could not be determined simultaneously because oxygenconsumption in these samples after 5 days of incubation didnot meet the depletion criteria (?2 mg/L). Inoculating the sam-ple with 2 mL of the unfiltered sample might not have providedan adequate seed for SBOD5 measurement. This problem canbe solved by increasing the inoculum size and/or using a moreconcentrated inoculum ; however, for simultaneous determina-tions of BDOC and SBOD5 , separation of microorganisms afterthe incubation will be required. Inclusion of cell-separationtechniques, such as filtration or centrifugation, in the modifiedBDOC procedure is being studied . It is also expected that in-creasing the inoculum size or using a more concentrated inocu-lum will eliminate the lag phase and reduce the incubationperiod.
Aas
1 .00
0.80
0 .60
p 0.40
0.20
0.00
Figure 2-Incubation temperature effect on the protocolkinetics of reclaimed wastewater samples.
Water Environment Research, Volume 70, Number 5
Samplingdate Treatment unit
DOC,mg/L
BDOC,
Withfiltration
mg/L
Withoutfiltration
BDOCdifference,
mg/L
Significance levelof the difference
(t-test)
08/13/94 Sand filter 9 .66 2.87 3.03 0.16 0.20Ozonation column 1 8.63 2.44 2.20 0.24 0.13Ozonation column 2 8.66 2.59 2.79 0.20 0.16Ozonation column 3 8.35 2.84 2.68 0.16 0.20Ozonation column 4 8.24 2.77 2.53 0.24 0.14Ozonation column 5 8.04 2.57 2.73 0.16 0.19BAC filter 6 .06 1 .88 1 .85 0.03 0.39

ConclusionsA modified bioassay protocol for measuring BDOC in water
samples with moderately low DOC, such as reclaimed and sec-ondary-treated wastewaters (4 to 15 mg of DOC/L), has beendeveloped from existing batch BDOC protocol and BOD tech-niques . The development ofthe modified procedure was focusedon the adequacy of DO throughout the incubation period andsimultaneous determinations of DOC, BDOC, and SBOD . Theprimary advantages of the modified BDOC protocol when com-pared to BOD and COD tests are higher precision and highersensitivity .
Glass-fiber filters were used in the modified protocol insteadof 0.22- )um CA membrane filters because the membrane filtersrelease a substantial amount of organic carbon, which interfereswith the procedure. The modified protocol provides good repro-ducibility . The precision of the protocol ranges from 0.05 to0.18 mg/L, while the MDL is approximately 0.15 mg/L . Theprecision of the new BDOC method is much better than that ofBOD andCODmethods. The BDOC measurement is not sensi-tive to inoculum origin and size . Glass-fiber filtration of sampleat the end of the incubation has an insignificant effect on theBDOC determination .Shaking the incubation bottle with 30% gas volume at 100
r/min does not accelerate the kinetics of the exertion . The finalBDOC concentrations (BDOC28 ) of reclaimed-wastewater sam-ples provided by incubation temperatures of 20°C and 37°C arenot different. For secondary-effluent samples, BDOC28 exertedat 20°C is only 75% of BDOC28 exerted at 37°C and 64% ofBDOCu. These values may result from the nature of secondaryeffluents, which are more biorefractory than reclaimed wastewa-ters investigated in this research . It was decided to adopt theincubation temperature of 20°C for the modified BDOC proce-dure because it is the laboratory reference temperature used forthe BOD test and most of the water quality analyses . The first-order model can be used to describe the BDOC exertion kineticsonly for the incubation at 37°C.Using the modified BDOC protocol, simultaneous determina-
tions of DOC, BDOC, and SBOD� of reclaimed wastewaters
-1 .500
-2.000
-2.500
-3 .0000
July/August 1998
5 10 15 20 25Incubation time (days)
30
Figure 3-Determination of BDOC exertion rate con-stants of reclaimed wastewater samples by the first-or-der model.
Khan et al.
Figure 4-Incubation temperature effect on the protocolkinetics of secondary effluent samples.
can be achieved . Unfortunately, SBODS cannot be determinedsimultaneously with DOC and BDOC of secondary effluentsbecause ofinadequate inoculum . The protocol is currently beingrefined by increasing the inoculum size or using a more concen-trated inoculum and adding a cell-separation step . A shorterincubation period is also anticipated .
AcknowledgmentsCredits. This manuscript is based in part on a paper presented
at WEFTEC '96, the 69th Annual Water Environment Federa-tion Technical Exposition and Conference, Dallas, Texas. Thiswork was partially supported by the Ahmanson Foundation,Los Angeles, California .Authors. At the time of this study, Eakalak Khan was a
graduate research assistant in the Department of Civil and Envi-ronmental Engineering, University of California at Los Angeles(UCLA) . MichaelK. Stenstrom is a professor in the Departmentof Civil and Environmental Engineering at UCLA. Roger W.Babcock, Jr., is an assistant professor in the Department of CivilEngineering, University of Hawaii at Manoa. Irwin (Mel) H.Suffet is a professor in the Environmental Science and Engi-neering Program at UCLA. Correspondence should be ad-dressed to Michael K. Stenstrom, 4173 Engineering 1, UCLA,Los Angeles, CA 90095-1600 .
Submitted for publication January 22, 1997; revised manu-script submitted August 12, 1997; acceptedforpublication Sep-tember 10, 1997.
The deadline to submit Discussions of this manuscript isNovember 15, 1998. .
ReferencesAlbertson, O.E. (1995) Is CBODS Test Viable for Raw and Settled
Wastewater? J. Environ. Eng., 121, 515.American Public Health Assosciation, American Water Works Associa-
tion, and Water Environment Federation (1989) Standard Methodsfor the Examination of Water and Wastewater . 17th Ed., Washing-ton, D.C.
Huck, P.M . (1990) Measurement of Biodegradable Organic Matter andBacterial Growth Potential in Drinking Water. J. Am. Water WorksAssoc., 82, 7, 78.
1031
0.500. . .. . . . . . y =-0.024x, r=-0.997, 200C
0.000 y = -0 .095x, r = -0.996, 3700
-0.500 'V . . . . . . . .
-1 .000

Khan et al.
Kaplan, L.A ., and Newbold, J.D. (1995) Measurement of StreamwaterBiodegradable Dissolved Organic Carbon with a Plug-Flow Biore-actor. Water Res. (G.B .), 29, 2696.
Khan, E. (1997) Biodegradable Dissolved Organic Carbon (BDOC)for Characterizing Reclaimed and Treated Wastewaters : MethodDevelopment and Applications . Ph. D . diss ., Univ . Calif., LosAngeles .
Khan, E. ; Babcock, R.W . ; Viriyavejakul, S . ; Suffet, I .H . ; and Stenstrom,M.K . (1998) Biodegradable Dissolved Organic Carbon (BDOC) forIndicating Wastewater Reclamation Plant Performance and TreatedWastewater Quality . Water Environ . Res ., 70, 1033 .
Lucena, F . ; Frias, J . ; and Ribas, F . (1990) A New Dynamic Approachto the Determination of Biodegradable Dissolved Organic Carbonin Water. Environ . Technol., 12, 343 .
Madireddi, K . ; Babcock, R.W. ; Levine, B . ; Huo, T.L. ; Khan, E. ; Ye,Q.F . ; Neethling, J .B . ; Suffer, I .H . ; and Stenstrom, M.K. (1997)Wastewater Reclamation at Lake Arrowhead, California : An Over-view . Water Environ. Res., 69, 350 .
Ribas, F. ; Frias, J . ; and Lucena, F . (1991) A New Dynamic Method for
1032
the Rapid Determination of the Biodegradable Dissolved OrganicCarbon in Drinking Water. J. Appl. Bacteriol., 71, 371 .
Servais, P . ; Billen, G . ; and Hascoet, M.C. (1987) Determination ofthe Biodegradable Fraction of Dissolved Organic Matter in Water .Water Res . (G .B .), 21, 445 .
Servais, P. ; Anzil, A . ; and Ventresque, C . (1989) Simple Method forDetermination of Biodegradable Dissolved Organic Carbon in Wa-ter . Appl. Environ . Microbiol., 55, 2732 .
van der Kooij, D . (1987) The Effect of Treatment on Assimilable Or-ganic Carbon in Drinking Water. In Proceedings of the SecondNational Conference on Drinking Water. P.M. Huck and P . Toft(Eds .), Pergamon Press, N.Y., 317 .
van der Kooij, D . ; Visser, A . ; and Hijnen, W.A.M. (1982) Determiningthe Concentration of Easily Assimilable Organic Carbon in Drink-ing Water. J. Am. Water Works Assoc., 74, 10, 540 .
van der Kooij, D. ; Hijnen, W.A.M . ; and Kruithof, J .C . (1989) TheEffects ofOzonation, Biological Filtration, and Distribution on theConcentration of Easily Assimilable Organic Carbon in DrinkingWater. Ozone Sci . Eng., 11 3, 297 .
Water Environment Research, Volume 70,' Number 5