prioritization of chemical contaminants - arizona
TRANSCRIPT

Prioritization of Chemical ContaminantsPrioritization of Chemical Contaminants
Shane Snyder, Ph.D. Professor & Co-Director
University of ArizonaVisiting Professor
Nat. Uni. Singapore

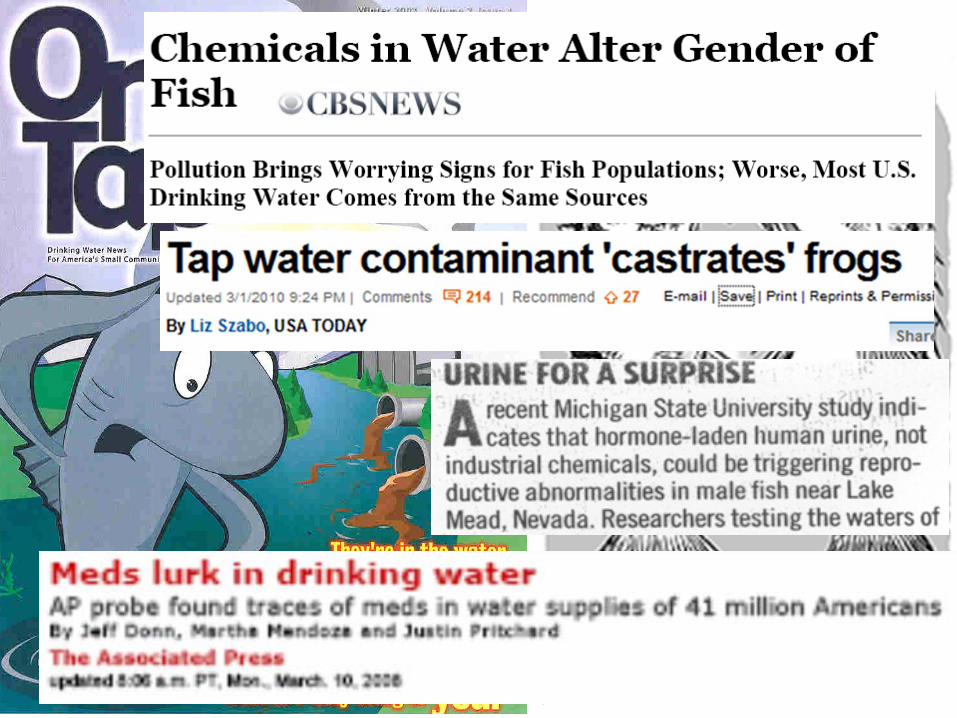
“We are swimming in a sea of chemicals…”
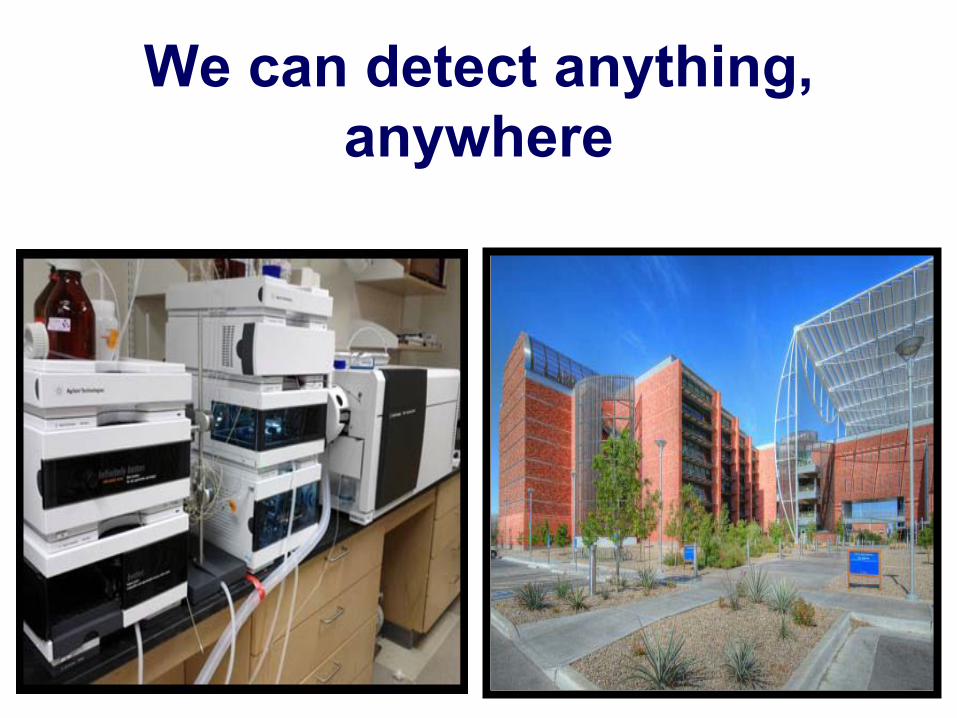
We can detect anything, anywhere

http://news.blogs.cnn.com/2011/06/16/portland-draining-reservoir-after-man-urinates-in-it/

http://www.theage.com.au/world/reservoir-drained-after-a-wee-problem-20110620-1ganj.html
8,000,000 gal = 30,283,000 LBladder holds ≈
0.3 LPee in reservoir ≈
10 ppbMale pee ≈
10 ug/L EstradiolTheoretical E2 in reservoir:
0.1 ng/L E2 in reservoir
Fish LOEL ≈
0.1 ng/LEPA CCL3 risk ≈
0.9 ng/L
Phoenix New TimesAugust 9, 2001
“Nevada's wastewater is causing sex problems in fish. But will Arizona get screwed by the solution?”

“About two years ago, very small traces of an antibiotic, an anti-seizure medication and a possible cancer-causing agent appeared in four groundwater wells in northwest Tucson.
All of the wells are located downstream of the local sewage treatment plant, which releases its treated sewage water into a riverbed.
When tested, some of Flagstaff's drinking water wells downstream
of the Rio de Flag wastewater treatment plant have also shown tiny traces of other pharmaceuticals and hormones, which have an ability to influence
growth in amphibians.”


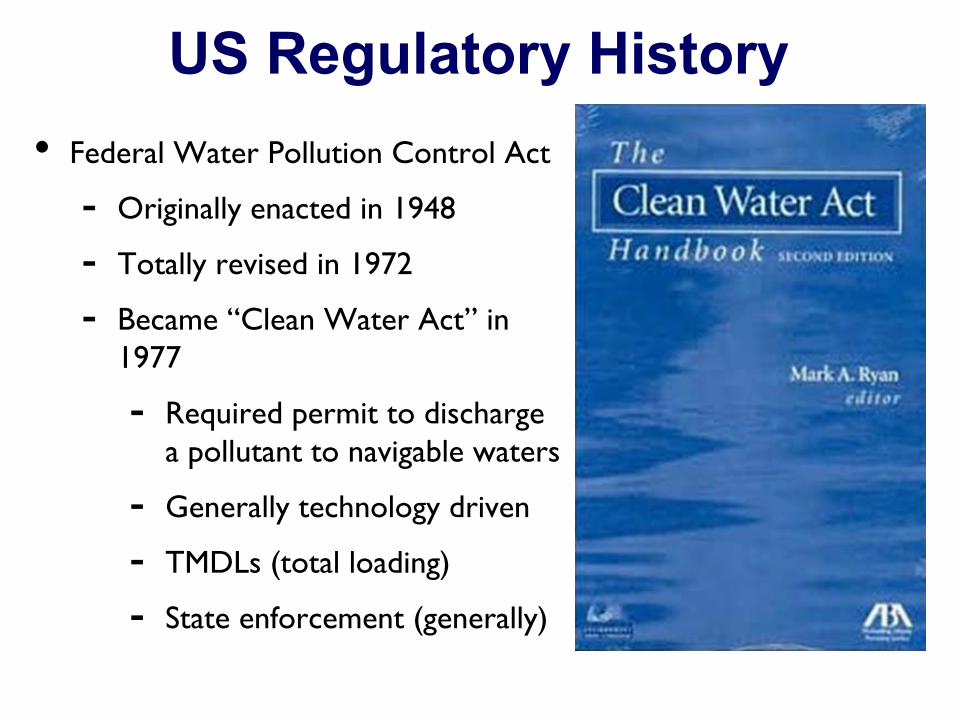
US Regulatory History

US Regulatory History1962: 28 discrete “chemical”
contaminants regulated
US Regulatory History•
Federal Water Pollution Control Act
-
Originally enacted in 1948
-
Totally revised in 1972
-
Became “Clean Water Act”
in 1977
-
Required permit to discharge a pollutant to navigable waters
-
Generally technology driven
-
TMDLs (total loading)
-
State enforcement (generally)
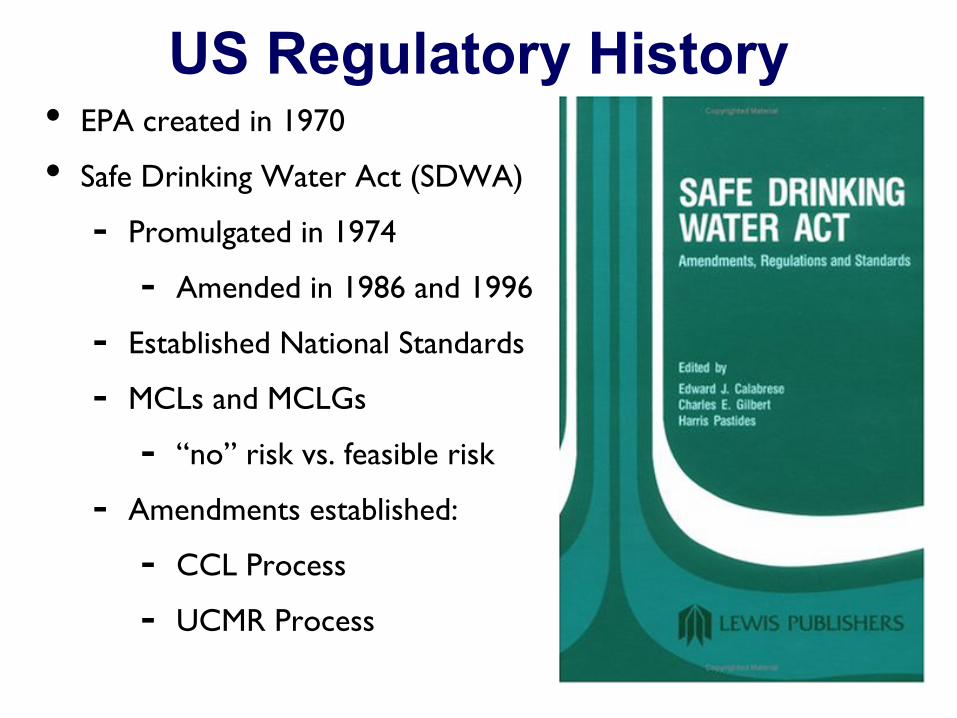
US Regulatory History•
EPA created in 1970
•
Safe Drinking Water Act (SDWA)
-
Promulgated in 1974
-
Amended in 1986 and 1996
-
Established National Standards
-
MCLs and MCLGs
-
“no”
risk vs. feasible risk
-
Amendments established:
-
CCL Process
-
UCMR Process
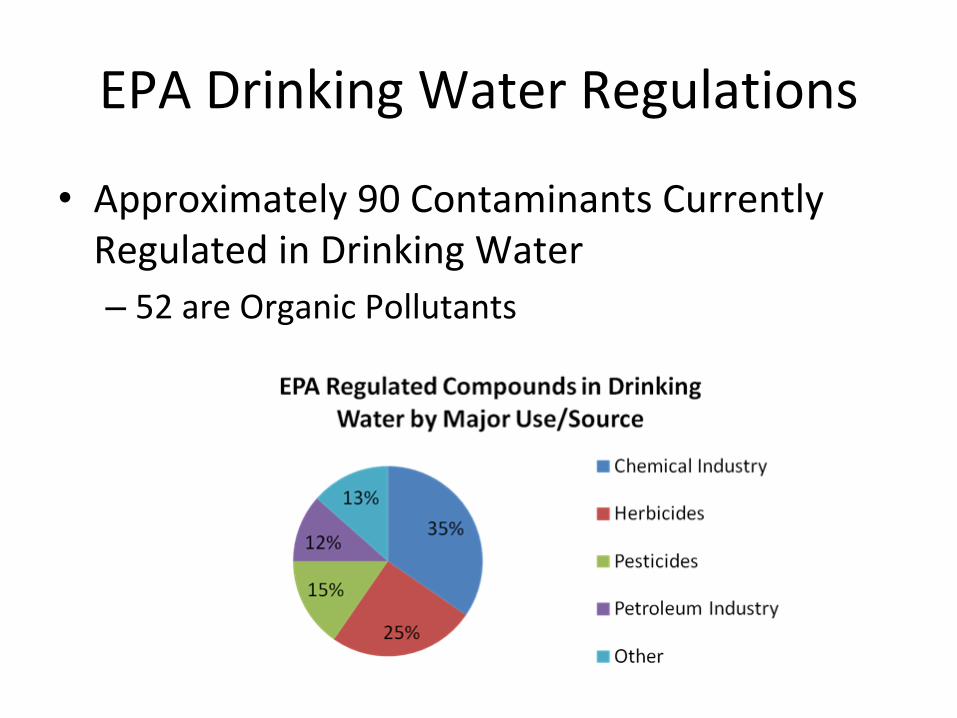
EPA Drinking Water Regulations
•
Approximately 90 Contaminants Currently Regulated in Drinking Water
–
52 are Organic Pollutants
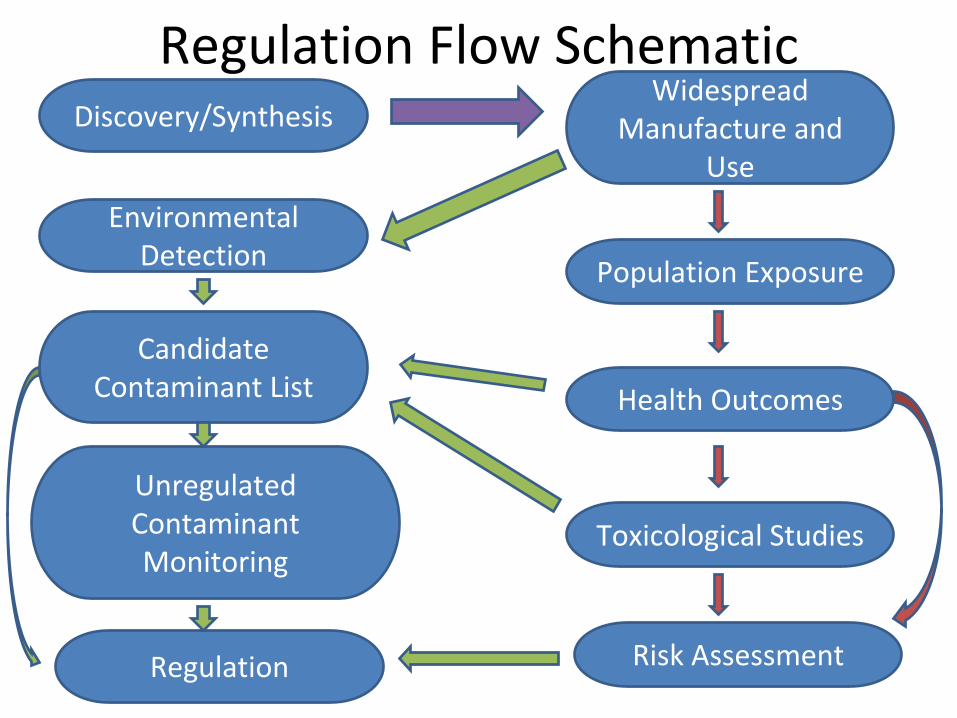
Regulation Flow SchematicDiscovery/Synthesis
Widespread
Manufacture and
Use
Environmental
Detection
Toxicological Studies
Population Exposure
Risk Assessment
Health Outcomes
Candidate
Contaminant List
Unregulated
Contaminant
Monitoring
Regulation
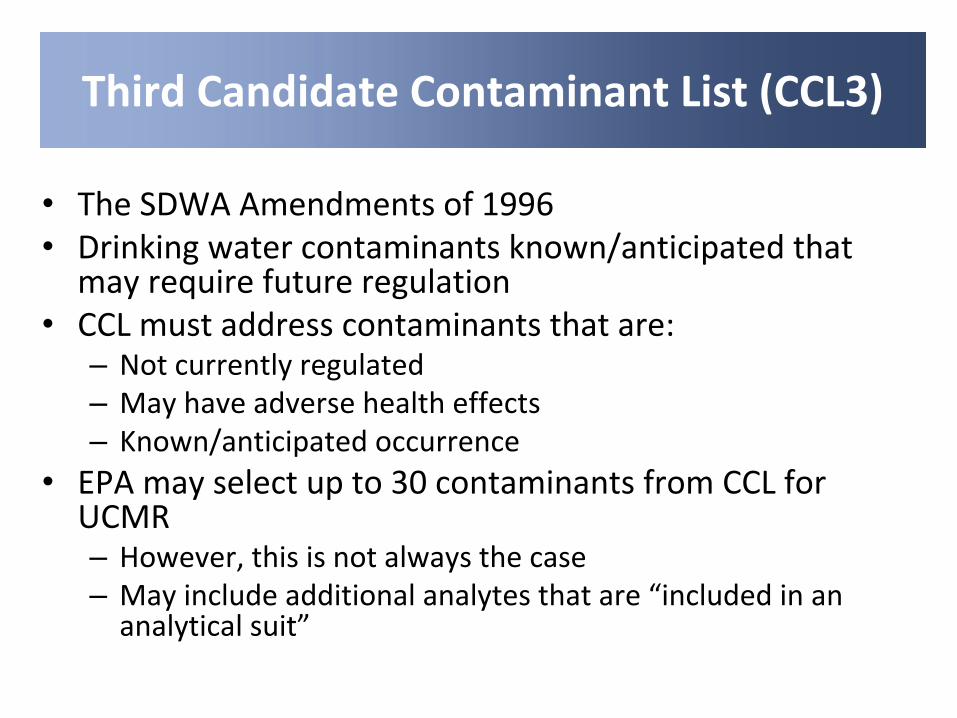
Third Candidate Contaminant List (CCL3)
•
The SDWA Amendments of 1996•
Drinking water contaminants known/anticipated that
may require future regulation•
CCL must address contaminants that are:–
Not currently regulated
–
May have adverse health effects–
Known/anticipated occurrence
•
EPA may select up to 30 contaminants from CCL for UCMR
–
However, this is not always the case–
May include additional analytes that are “included in an
analytical suit”
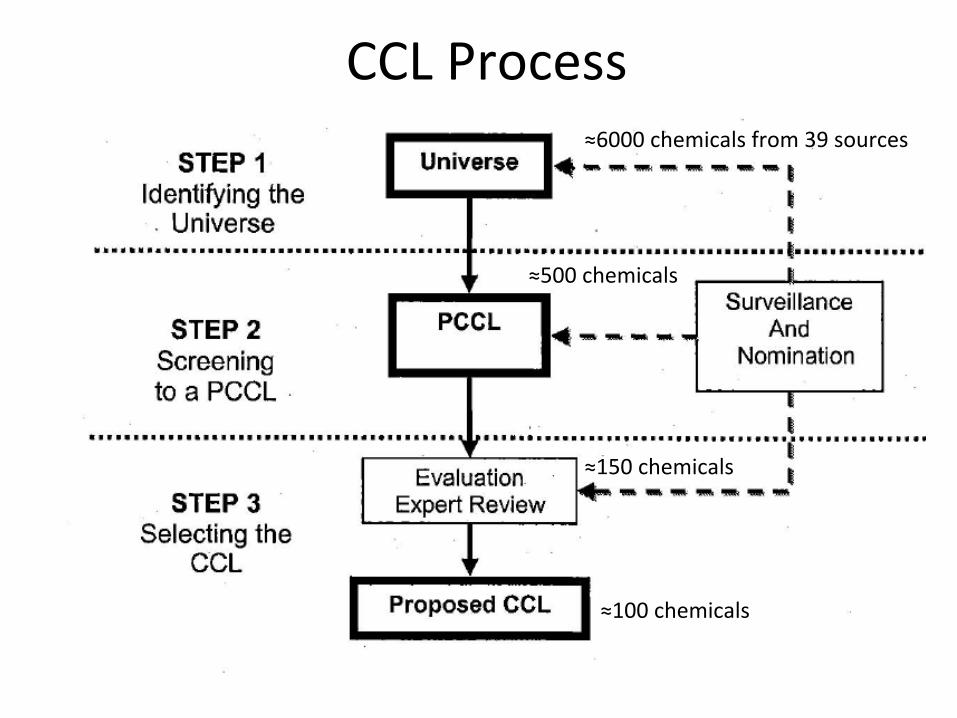
CCL Process≈6000 chemicals from 39 sources
≈500 chemicals
≈150 chemicals
≈100 chemicals
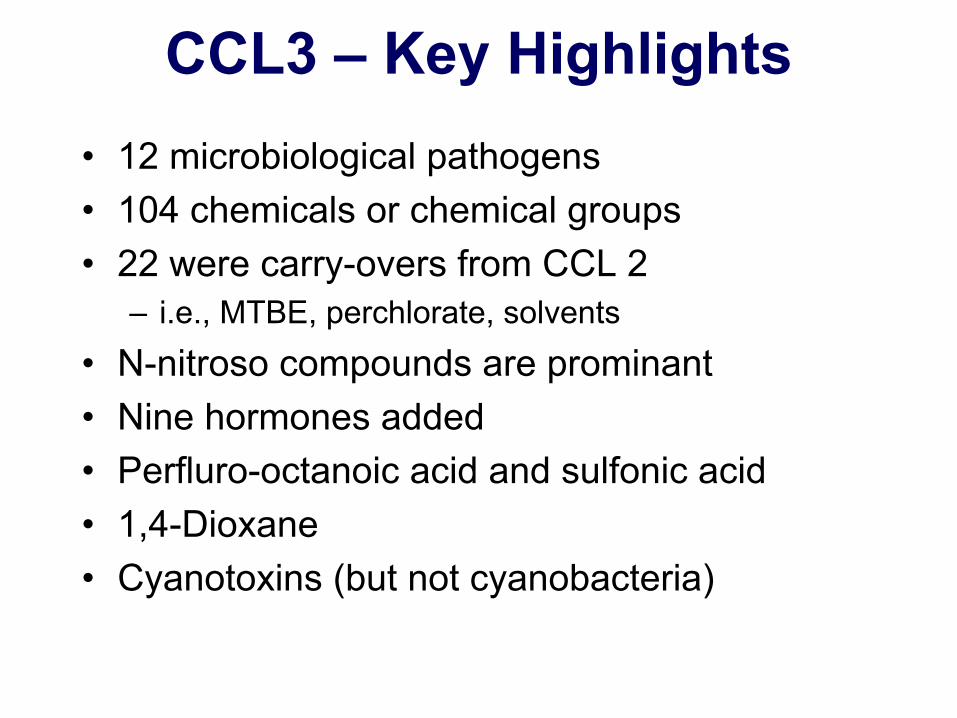
CCL3 –
Key Highlights•
12 microbiological pathogens
•
104 chemicals or chemical groups•
22 were carry-overs from CCL 2–
i.e., MTBE, perchlorate, solvents
•
N-nitroso compounds are prominant•
Nine hormones added
•
Perfluro-octanoic acid and sulfonic acid•
1,4-Dioxane
•
Cyanotoxins (but not cyanobacteria)
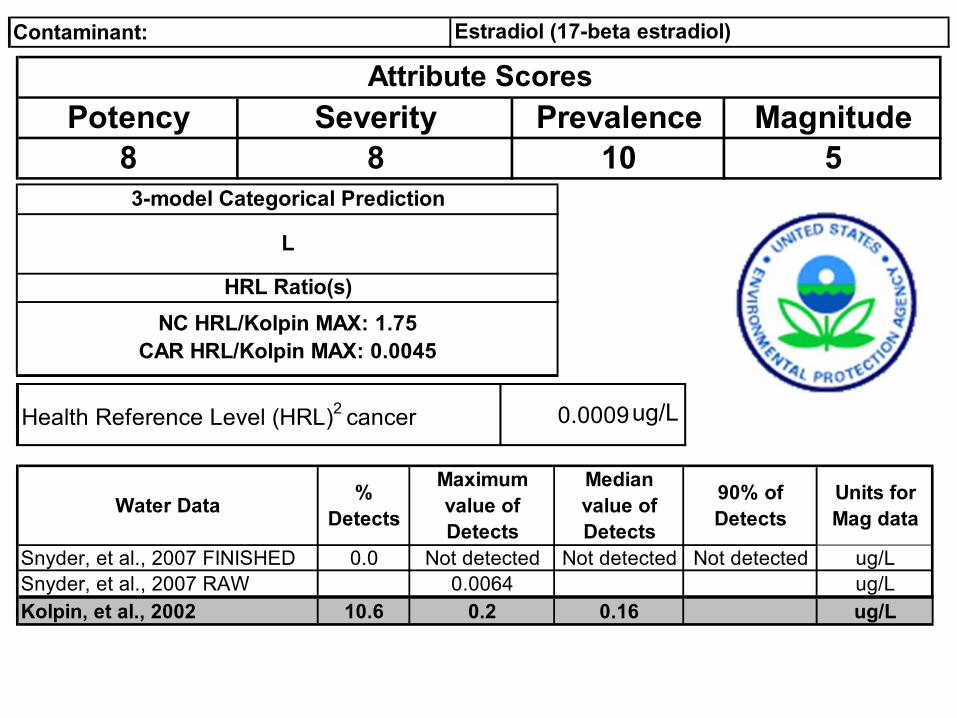
Contaminant: Estradiol (17-beta estradiol)
Potency Severity Prevalence Magnitude8 8 10 5
Attribute Scores
HRL Ratio(s)NC HRL/Kolpin MAX: 1.75
CAR HRL/Kolpin MAX: 0.0045
3-model Categorical Prediction
L
Water Data % Detects
Maximum value of Detects
Median value of Detects
90% of Detects
Units for Mag data
Snyder, et al., 2007 FINISHED 0.0 Not detected Not detected Not detected ug/LSnyder, et al., 2007 RAW 0.0064 ug/LKolpin, et al., 2002 10.6 0.2 0.16 ug/L
Health Reference Level (HRL)2 cancer 0.0009ug/L
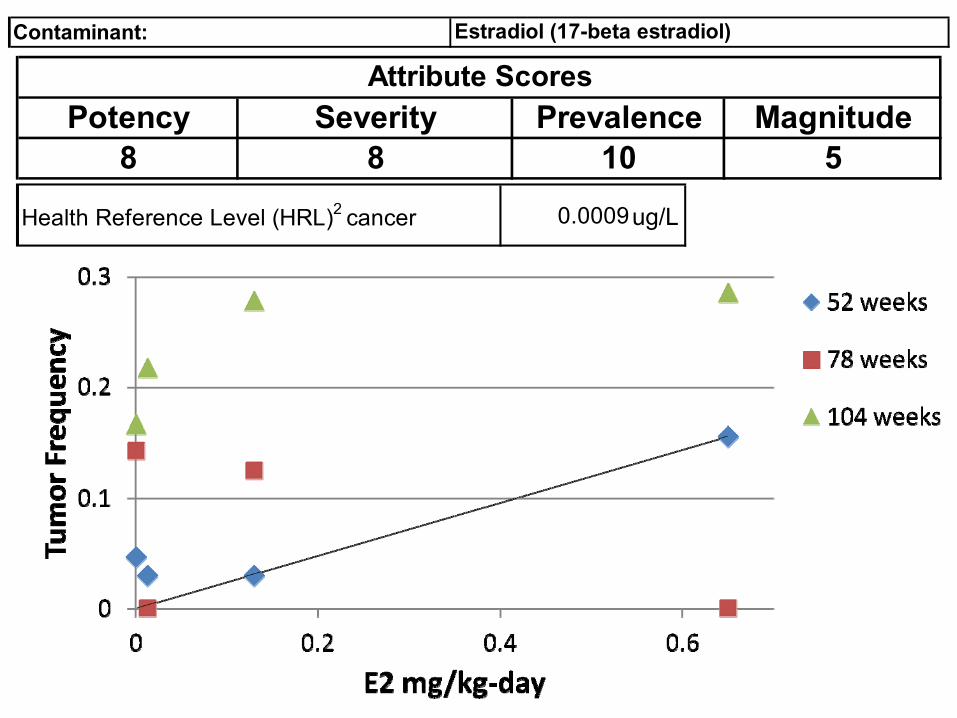
Contaminant: Estradiol (17-beta estradiol)
Potency Severity Prevalence Magnitude8 8 10 5
Attribute Scores
Health Reference Level (HRL)2 cancer 0.0009ug/L
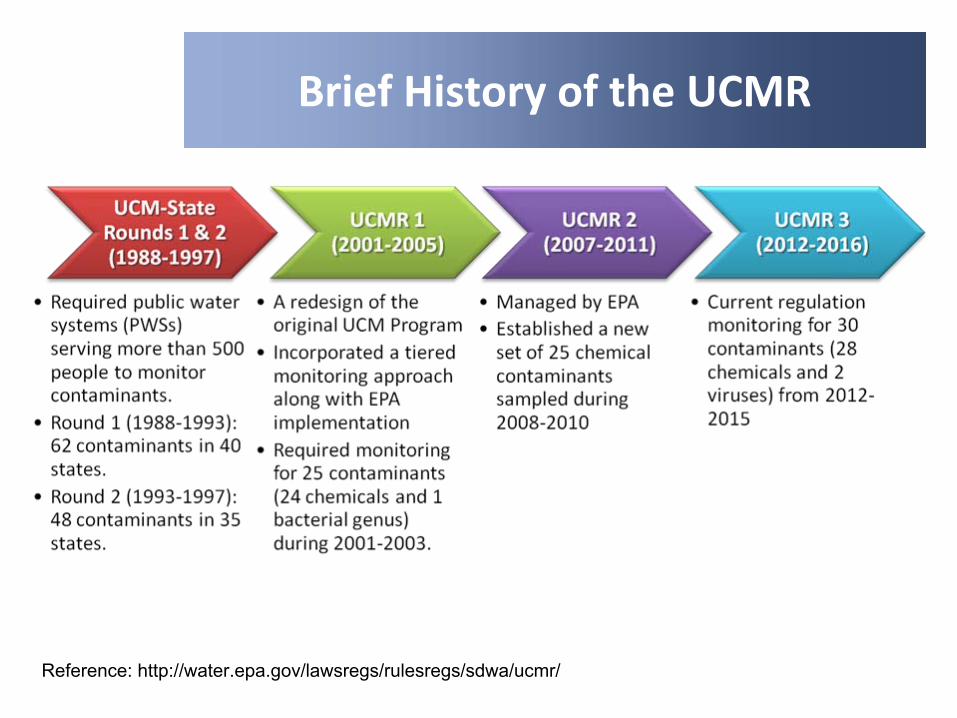
Brief History of the UCMR
Reference: http://water.epa.gov/lawsregs/rulesregs/sdwa/ucmr/
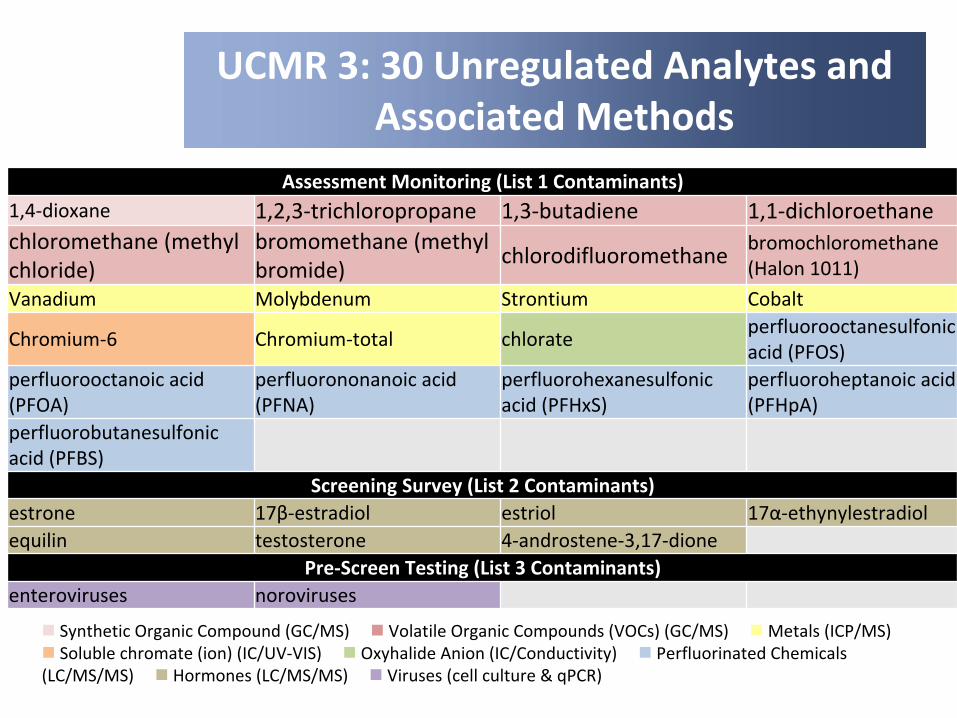
UCMR 3: 30 Unregulated Analytes and Associated Methods
Assessment Monitoring (List 1 Contaminants)1,4‐dioxane 1,2,3‐trichloropropane 1,3‐butadiene 1,1‐dichloroethanechloromethane (methyl
chloride)
bromomethane (methyl
bromide)
chlorodifluoromethanebromochloromethane
(Halon 1011)
Vanadium Molybdenum Strontium Cobalt
Chromium‐6 Chromium‐total chlorateperfluorooctanesulfonic
acid (PFOS)
perfluorooctanoic acid
(PFOA)
perfluorononanoic acid
(PFNA)
perfluorohexanesulfonic
acid (PFHxS)
perfluoroheptanoic acid
(PFHpA)
perfluorobutanesulfonic
acid (PFBS)
Screening Survey (List 2 Contaminants)estrone 17β‐estradiol estriol 17α‐ethynylestradiolequilin testosterone 4‐androstene‐3,17‐dione
Pre‐Screen Testing (List 3 Contaminants)enteroviruses noroviruses
Synthetic Organic Compound (GC/MS)
Volatile Organic Compounds (VOCs)
(GC/MS)
Metals (ICP/MS)
Soluble chromate (ion) (IC/UV‐VIS)
Oxyhalide Anion
(IC/Conductivity)
Perfluorinated Chemicals
(LC/MS/MS)
Hormones (LC/MS/MS)
Viruses (cell culture & qPCR)
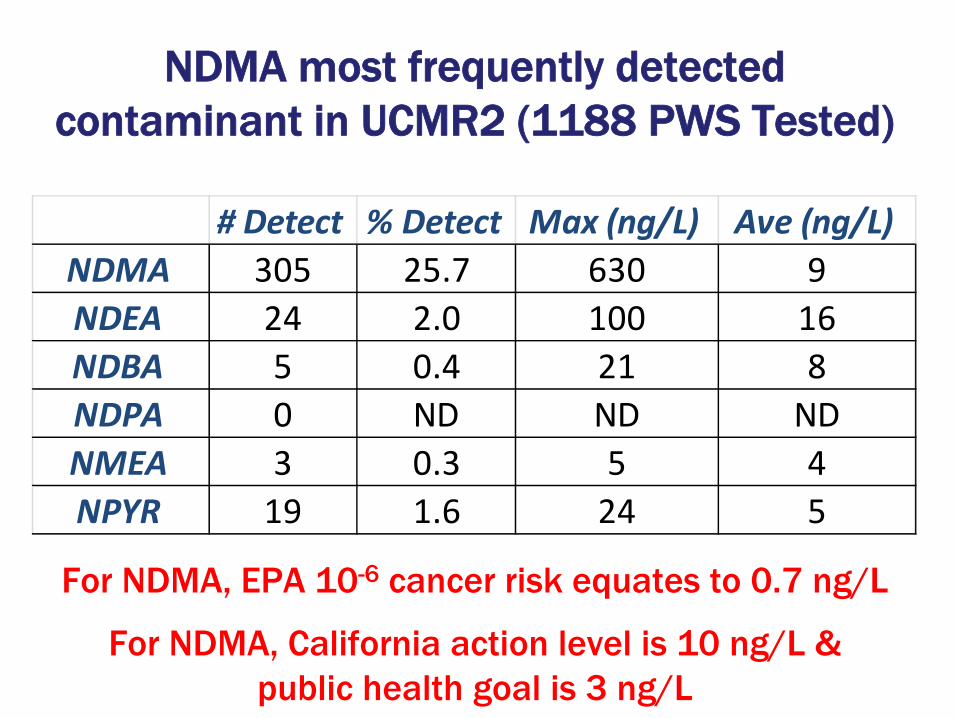
For NDMA, EPA 10-6
cancer risk equates to 0.7 ng/L
NDMA most frequently detectedcontaminant in UCMR2 (1188 PWS Tested)
# Detect % Detect Max (ng/L) Ave (ng/L)NDMA 305 25.7 630 9NDEA 24 2.0 100 16NDBA 5 0.4 21 8NDPA 0 ND ND NDNMEA 3 0.3 5 4NPYR 19 1.6 24 5
For NDMA, California action level is 10 ng/L &public health goal is 3 ng/L
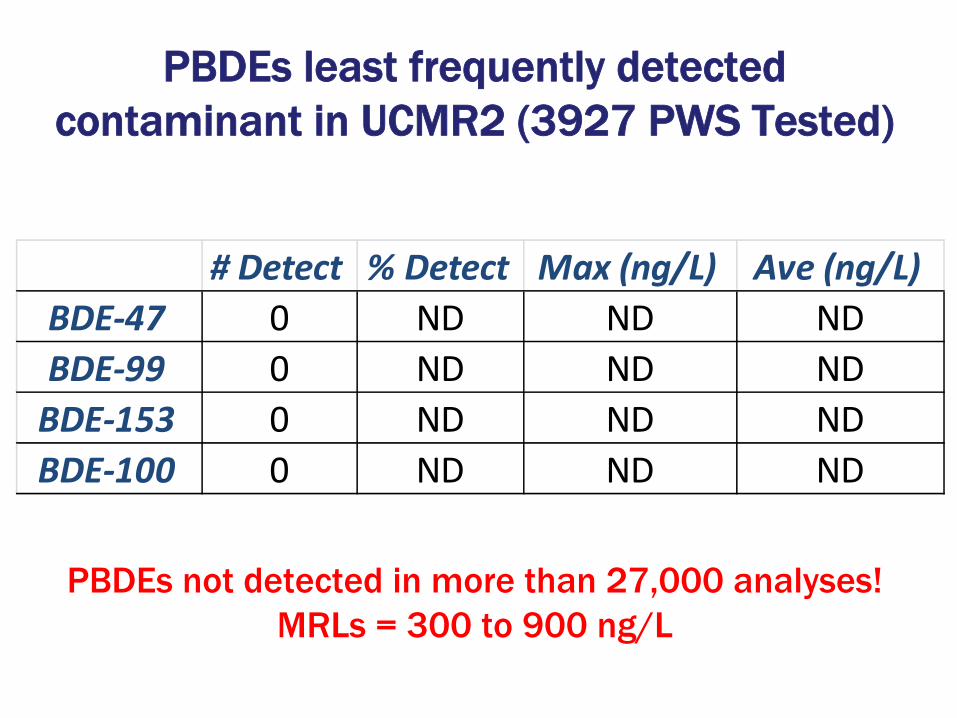
PBDEs not detected in more than 27,000 analyses!MRLs = 300 to 900 ng/L
PBDEs least frequently detectedcontaminant in UCMR2 (3927 PWS Tested)
# Detect % Detect Max (ng/L) Ave (ng/L)BDE‐47 0 ND ND NDBDE‐99 0 ND ND NDBDE‐153 0 ND ND NDBDE‐100 0 ND ND ND
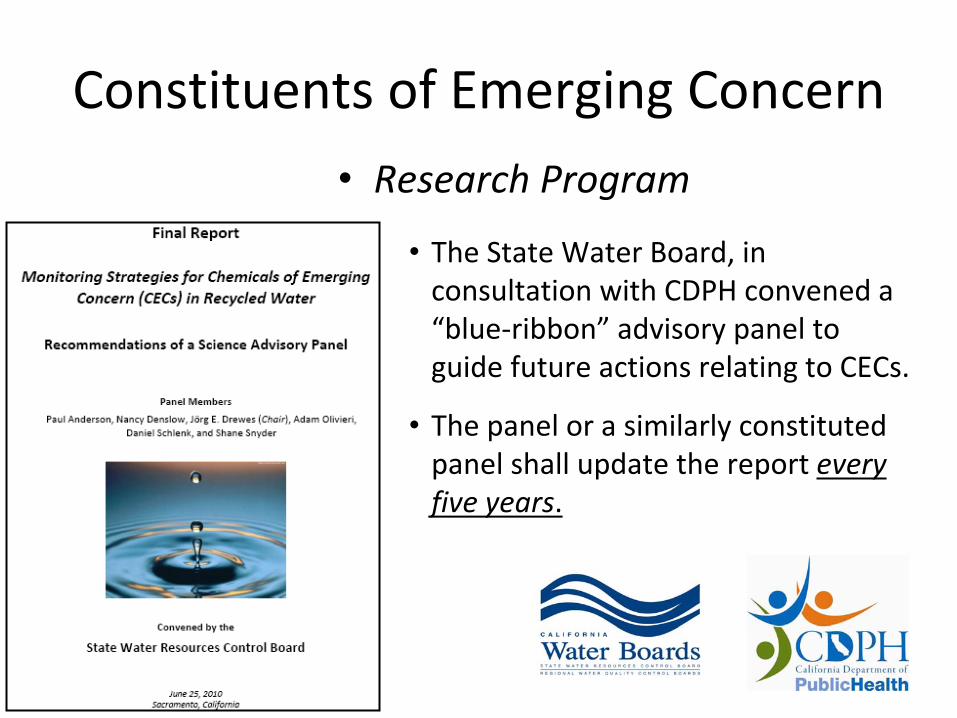
Constituents of Emerging Concern
•
Research Program
•
The panel or a similarly constituted
panel shall update the report every
five years.
•
The State Water Board, in
consultation with CDPH convened a
“blue‐ribbon”
advisory panel to
guide future actions relating to CECs.
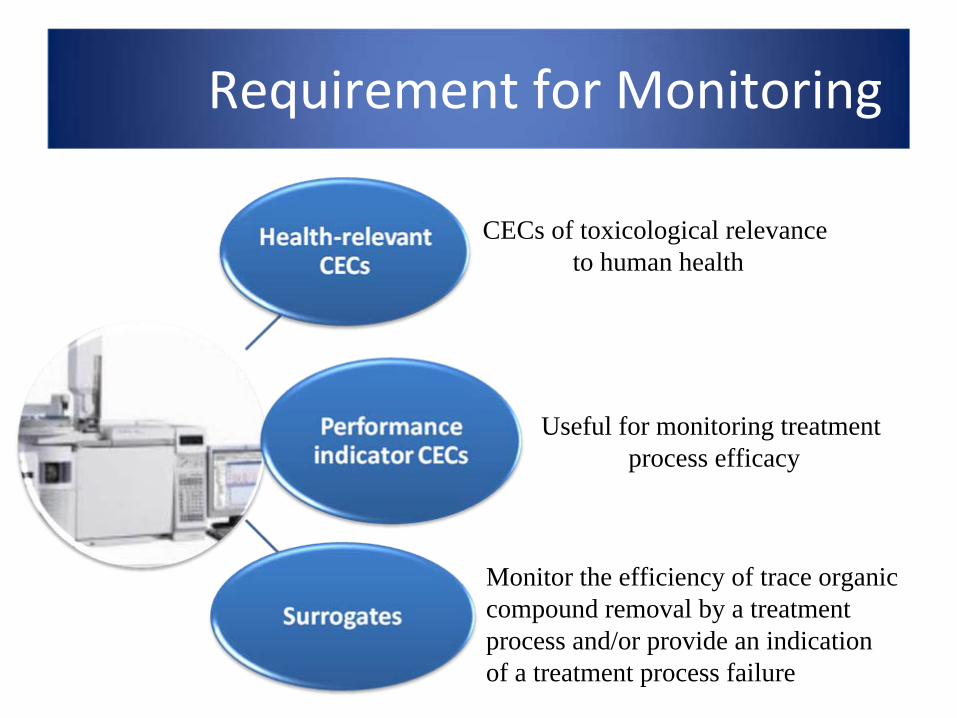
Requirement for Monitoring
CECs of toxicological relevance to human health
Useful for monitoring treatment process efficacy
Monitor the efficiency of trace organic compound removal by a treatment process and/or provide an indication of a treatment process failure

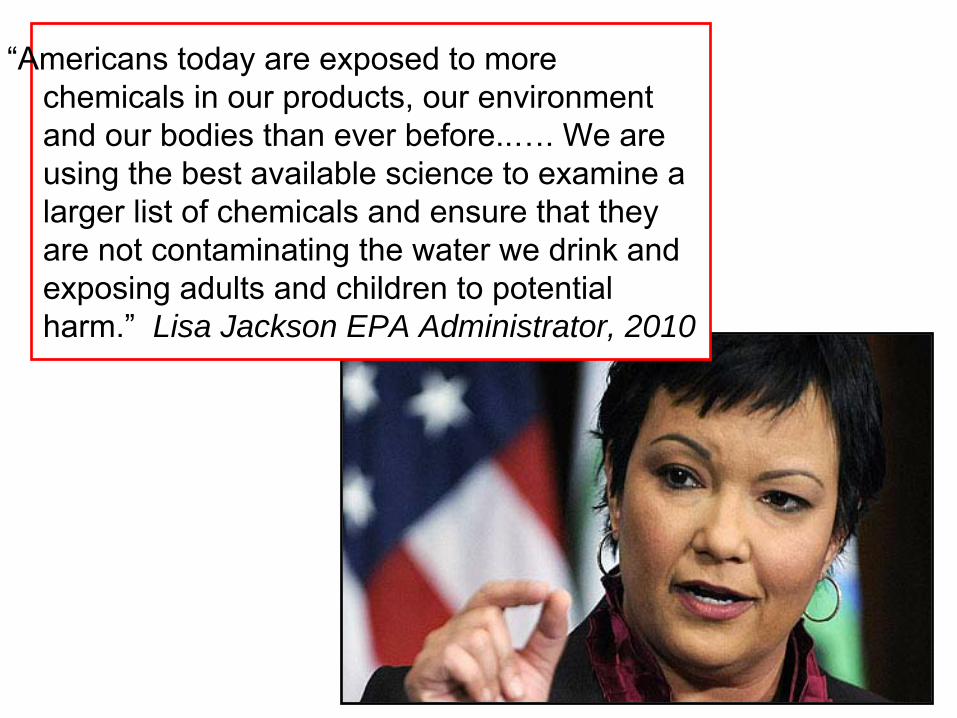
“Americans today are exposed to more chemicals in our products, our environment and our bodies than ever before..…. We are using the best available science to examine a larger list of chemicals and ensure that they are not contaminating the water we drink and exposing adults and children to potential harm.”
Lisa Jackson EPA Administrator, 2010
http://www.webdialogues.net/cs/epa-dwcontaminantgroups-
library/download/dlib/1860/EPA_Discussion_Paper.pdf.pdf?x-r=pcfile_d
1.
Address contaminants as groups
2.
Development of technologies
3.
Multiple statutes for drinking water
4.
Partner with states to share monitoring data
--
Announced by Lisa Jackson March 22Announced by Lisa Jackson March 22ndnd, 2010, 2010
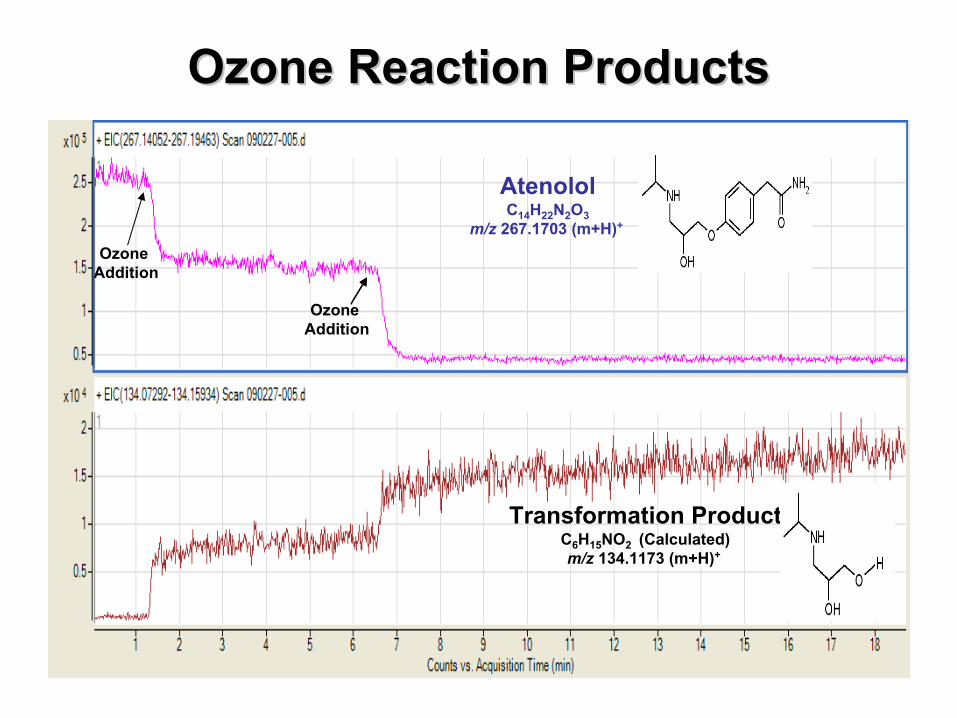
Ozone Reaction ProductsOzone Reaction Products
AtenololC14
H22
N2
O3m/z
267.1703 (m+H)+
Ozone Addition
Ozone Addition
Transformation ProductC6
H15
NO2 (Calculated)m/z
134.1173 (m+H)+
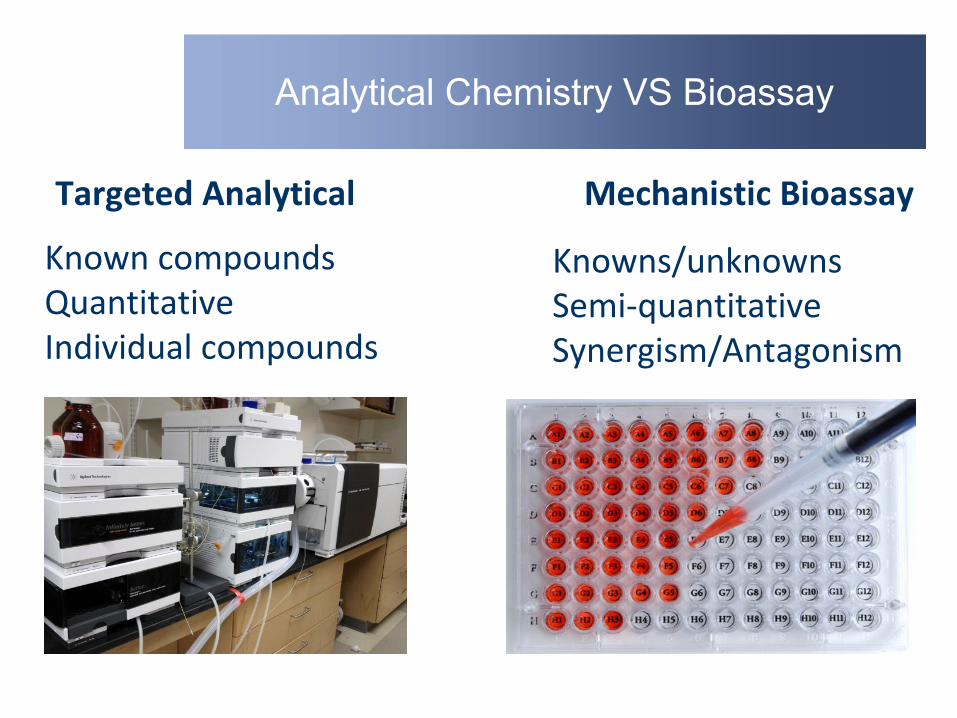
Analytical Chemistry VS Bioassay
Targeted Analytical Mechanistic Bioassay
Known compoundsQuantitativeIndividual compounds
Knowns/unknownsSemi‐quantitativeSynergism/Antagonism
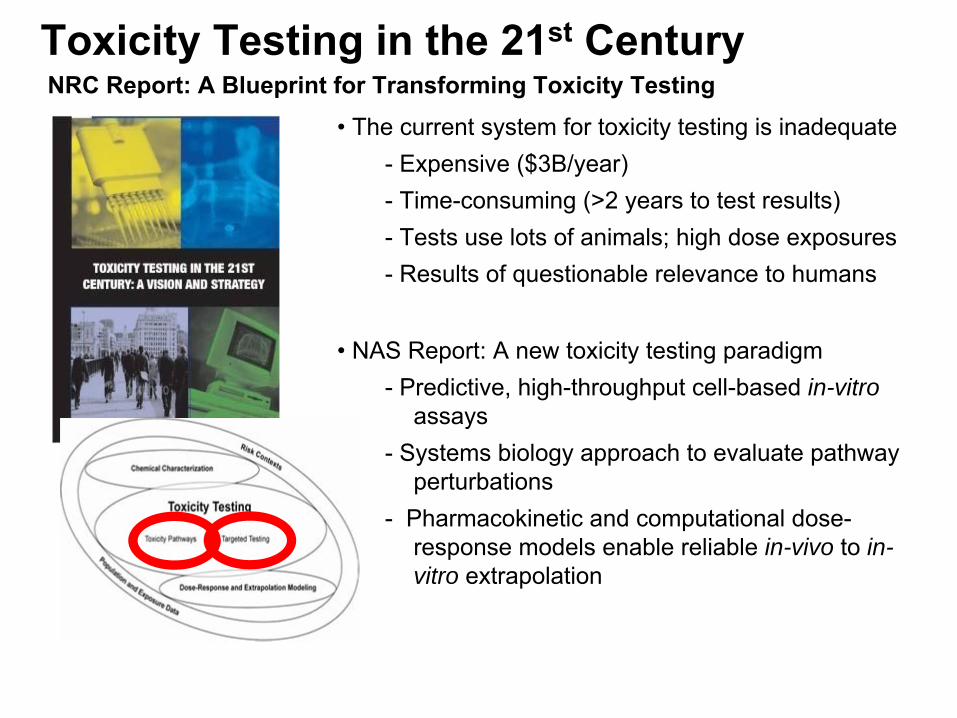
Toxicity Testing in the 21st
Century
December 6, 201233
NRC Report: A Blueprint for Transforming Toxicity Testing
•
The current system for toxicity testing is inadequate-
Expensive ($3B/year)-
Time-consuming (>2 years to test results)-
Tests use lots of animals; high dose exposures-
Results of questionable relevance to humans
•
NAS Report: A new toxicity testing paradigm -
Predictive, high-throughput cell-based in-vitro assays
-
Systems biology approach to evaluate pathway perturbations
-
Pharmacokinetic and computational
dose-
response models enable reliable in-vivo to in- vitro extrapolation
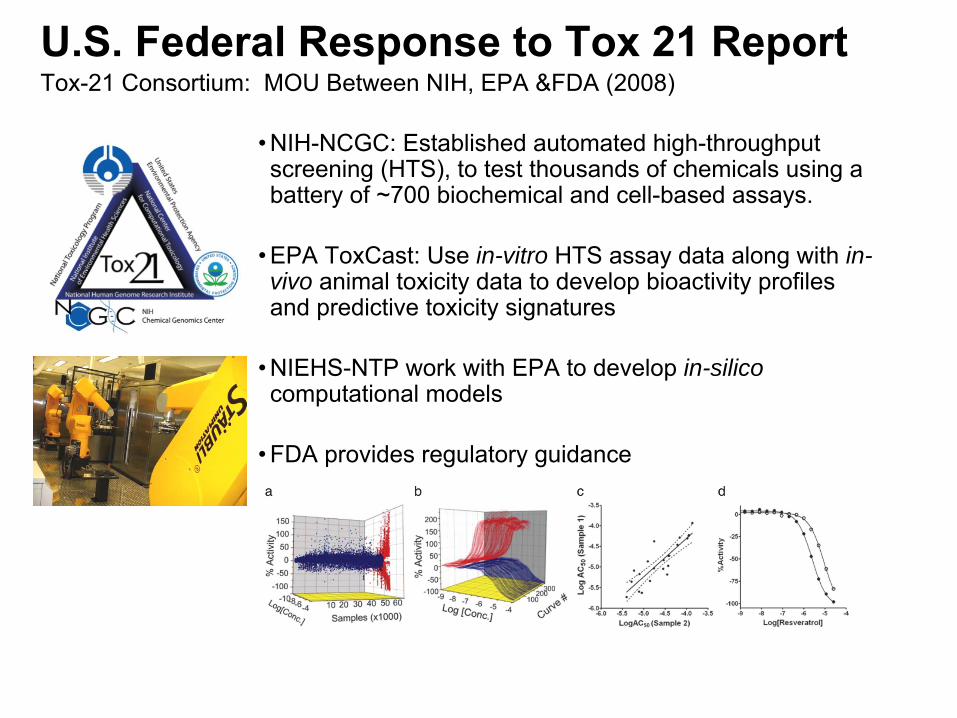
U.S. Federal Response to Tox 21 Report
34
Tox-21 Consortium: MOU Between NIH, EPA &FDA (2008)
•
NIH-NCGC: Established automated high-throughput screening (HTS), to test thousands of chemicals using a battery of ~700 biochemical and cell-based assays.
•
EPA ToxCast: Use in-vitro HTS assay data along with in- vivo animal toxicity data to develop bioactivity profiles and predictive toxicity signatures
•
NIEHS-NTP work with EPA to develop in-silico computational models
•
FDA provides regulatory guidance
December 6, 2012
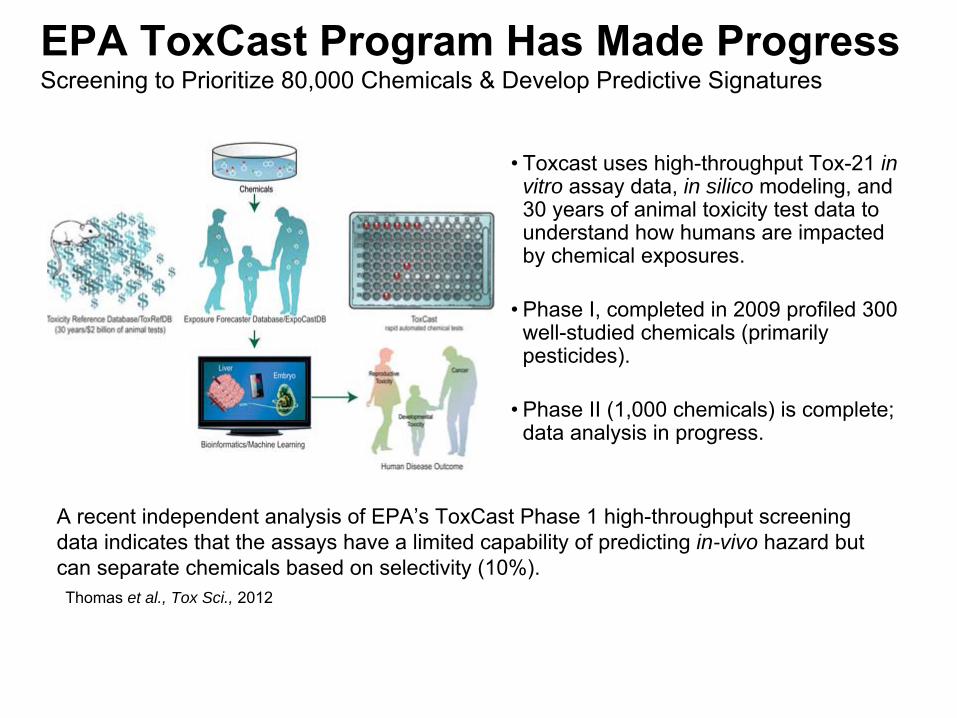
EPA ToxCast Program Has Made Progress
35
Screening to Prioritize 80,000 Chemicals & Develop Predictive Signatures
•
Toxcast uses high-throughput Tox-21 in vitro assay data, in silico modeling, and 30 years of animal toxicity test data to understand how humans are impacted by chemical exposures.
•
Phase I, completed in 2009 profiled 300 well-studied chemicals (primarily pesticides).
•
Phase II (1,000 chemicals) is complete; data analysis in progress.
December 6, 2012
A recent independent analysis of EPA’s ToxCast Phase 1 high-throughput screening data indicates that the assays have a limited capability of predicting in-vivo hazard but can separate chemicals based on selectivity (10%). Thomas et al., Tox Sci., 2012
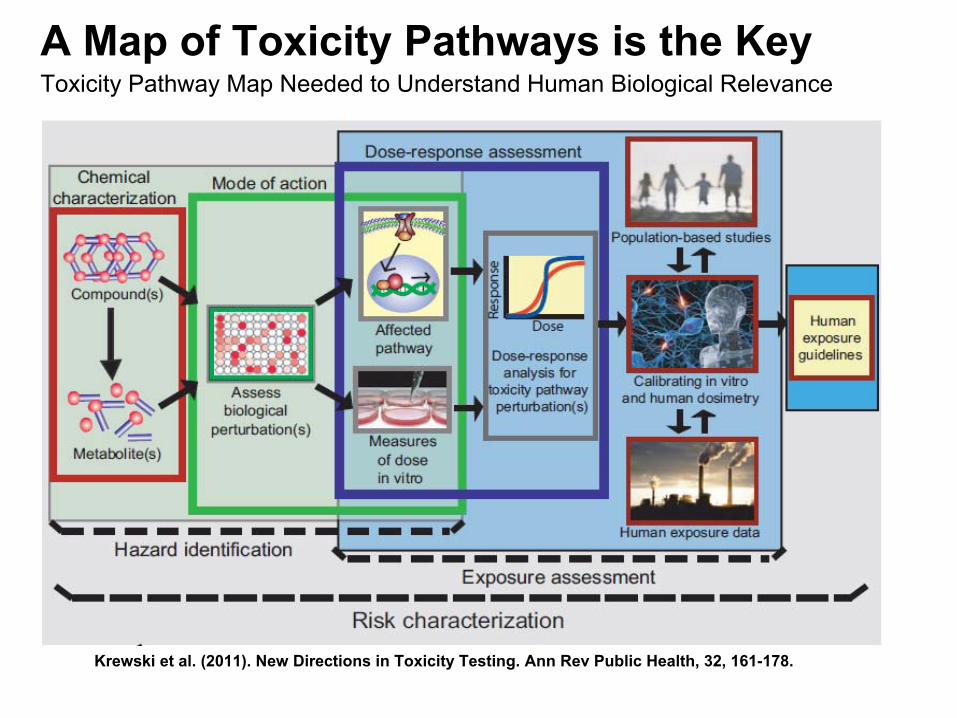
A Map of Toxicity Pathways is the Key
36
Toxicity Pathway Map Needed to Understand Human Biological Relevance
December 6, 2012
Krewski et al. (2011). New Directions in Toxicity Testing. Ann Rev Public Health, 32, 161-178.
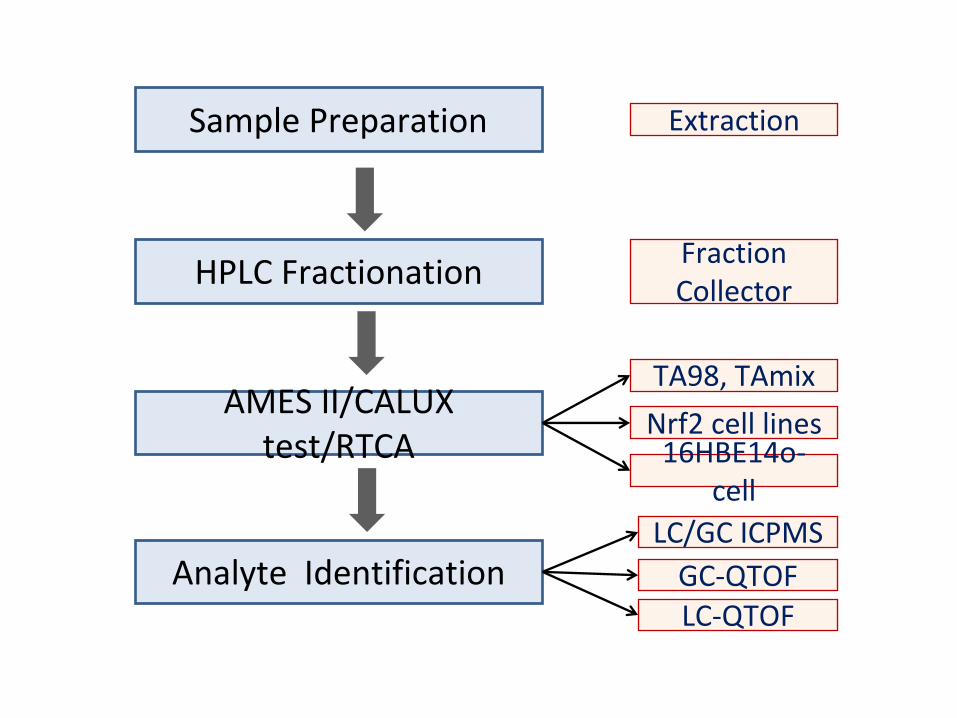
HPLC Fractionation
AMES II/CALUX test/RTCA
Analyte IdentificationLC/GC ICPMSGC‐QTOFLC‐QTOF
Sample Preparation
TA98, TAmix
Nrf2 cell lines
Fraction
Collector
Extraction
16HBE14o‐
cell
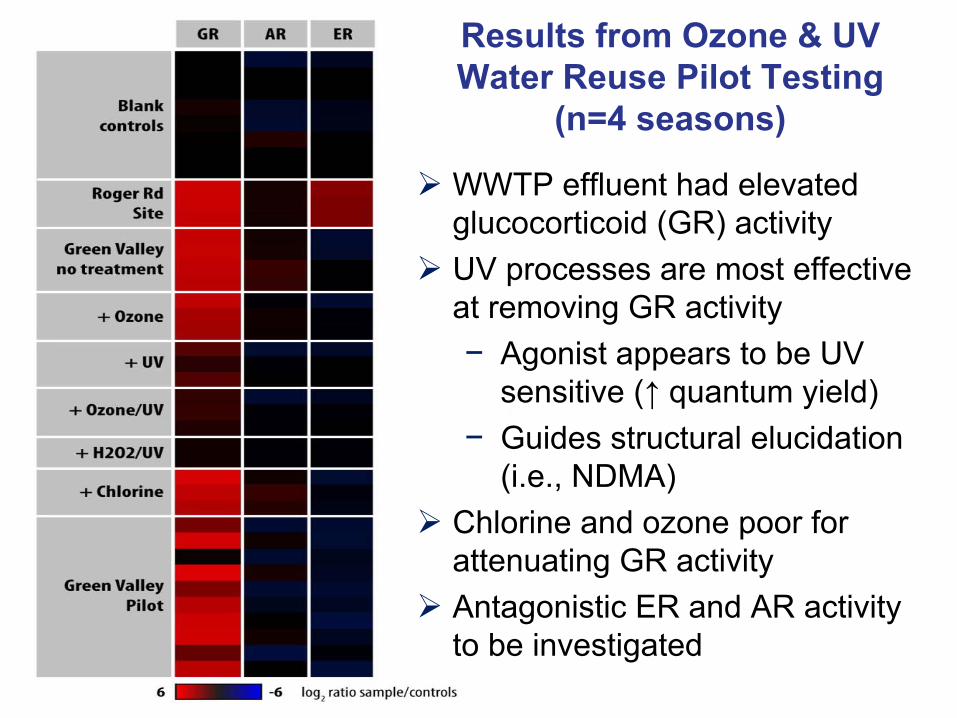
Results from Ozone & UV Water Reuse Pilot Testing
(n=4 seasons)
WWTP effluent had elevated glucocorticoid (GR) activity
UV processes are most effective at removing GR activity−
Agonist appears to be UV sensitive (↑
quantum yield)
−
Guides structural elucidation (i.e., NDMA)
Chlorine and ozone poor for attenuating GR activity
Antagonistic ER and AR activity to be investigated
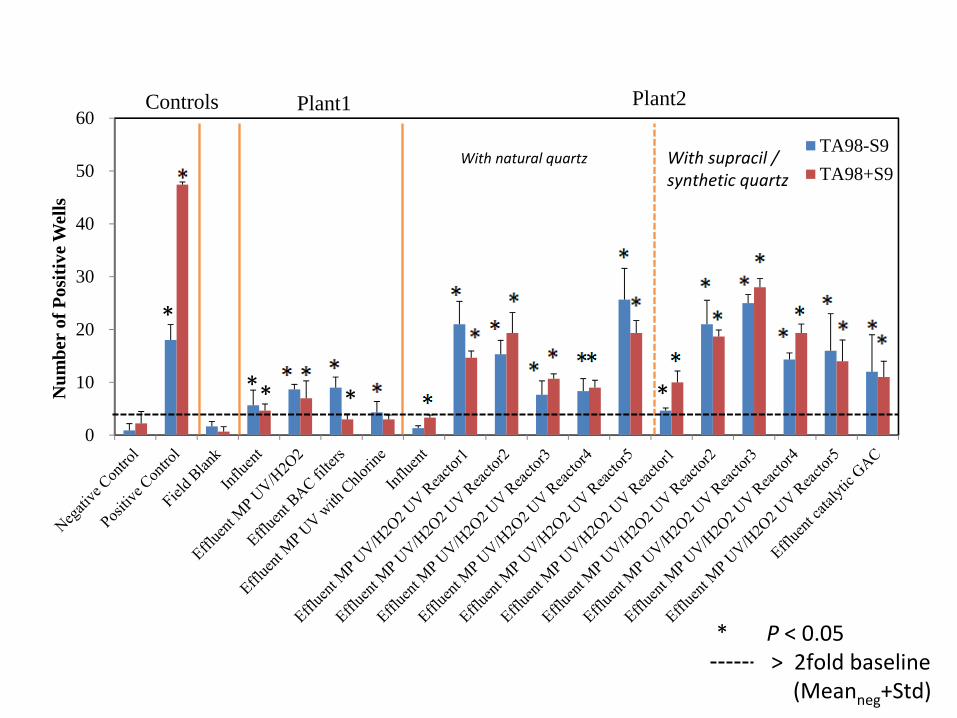
0
10
20
30
40
50
60
Num
ber
of P
ositi
ve W
ells
TA98-S9TA98+S9
Plant1 Plant2Controls
* P < 0.05> 2fold baseline(Meanneg
+Std)
*
** * *
With natural quartz With supracil / synthetic quartz
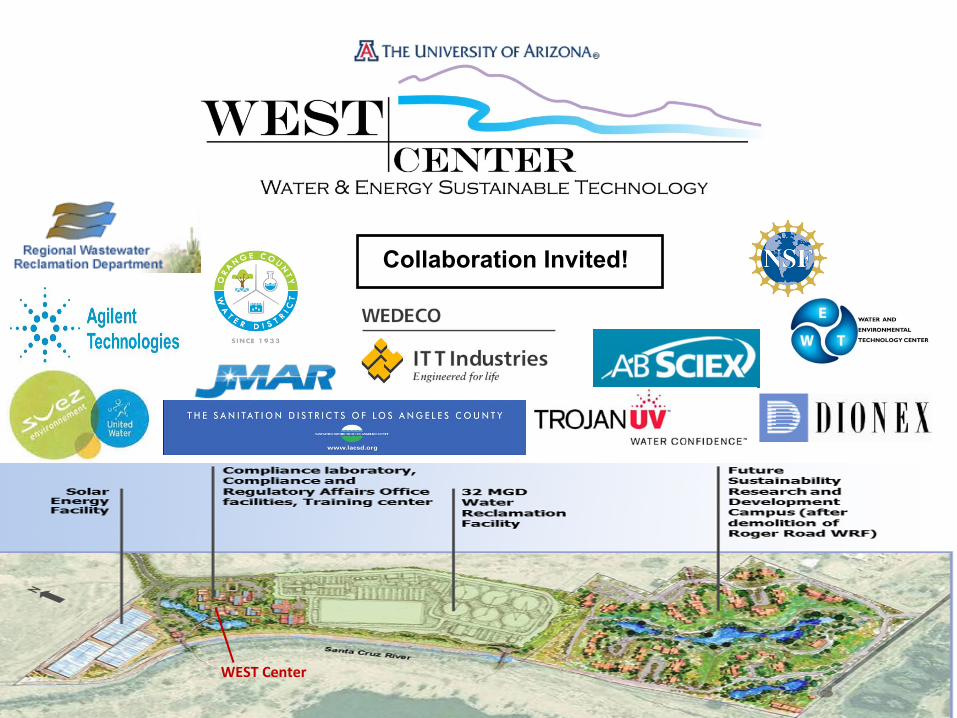
WEST Center
Collaboration Invited!

Shane SnyderShane [email protected]@email.arizona.eduhttp://http://snyderlab.arizona.edusnyderlab.arizona.edu