prioritization of rainfed areas in indianraa.gov.in/pdf/rainfed-final.pdf · v acknowledgement the...
TRANSCRIPT
Prioritization of Rainfed Areas in India
Study Report 4
NATIONAL RAINFED AREA AUTHORITYPLANNING COMMISSIONGOVERNMENT OF INDIA
NEW DELHI
February 2012


Study Report 4
Prioritization of Rainfed Areas in India
NATIONAL RAINFED AREA AUTHORITYPLANNING COMMISSIONGOVERNMENT OF INDIA
NEW DELHI
February 2012
Study by
Central Research Institute for Dryland Agriculture Hyderabad
&
Indian Agricultural Statistics Research Institute New Delhi

Citation:
NRAA.2012, Prioritization of Rainfed Areas in India, Study Report 4, NRAA, New Delhi, India 100p.
Year of Publication : February 2012
Published by:National Rainfed Area AuthorityNASC, Complex, 2nd Floor,Dev Prakash Shastri MargNew Delhi 110012, India
Prited at:Dee Kay PrintersKirti Nagar Indl. AreaNew Delhi-1100015

iii
Foreword
Rainfed areas currently constitute 55 per cent of the net sown area of the country and are home to two-thirds of livestock and 40 per cent of human population. The business as usual approach of taking all the major interventions uniformly across all the regions of the country has not paid much dividend. Therefore, regionally differentiated interventions befitting natural resource endowment and livelihood status are need of the hour. The approach adopted for prioritization of rainfed areas of the country integrates the natural resources and livelihood indices and addresses the above issue.
I appreciate the efforts of Dr. A.K. Sikka, Technical Expert (Watershed Development), National Rainfed Area Authority (NRAA) for initiating the important task of prioritization of rainfed areas of the country. The task was assigned to two most reputed institutions namely Central Research Institute for Dryland Agriculture (CRIDA), Hyderabad and Indian Agricultural Statistics Research Institute (IASRI), New Delhi. I thank the study team comprising of CRIDA and IASRI scientists for their joint efforts and collective wisdom. In consultation with and guidance of NRAA, CRIDA and IASRI together have come up with “Rainfed Areas Prioritization Index” (RAPI) by combining natural resource index (NRI) and integrated livelihood index (ILI). Based on RAPI score, the study has identified 167 districts, the top one-third among 499 as prioritized districts. Among the prioritized 167 districts, 50 of them deserve immediate attention for enhancing productivity and livelihood as resource-wise they are rich but the productivity and livelihood status are poor.
Besides prioritization of rainfed districts of India, the study has highlighted the crop and livestock-based interventions to meet the targeted growth rate of 4 per cent per annum. The study serves as a yardstick for finding the standing of a particular district vis-à-vis others in the country with respect to several bio-physical and socio-economic indicators.
I am sure that this publication will bridge the gap and will be useful for the planners, administrators, scientists and developmental agencies for coming up with location-specific and need-based interventions through convergence of various schemes. Further, it will help in channelizing the limited resources to the targeted region and will pave the way for sustainable development of rainfed areas and second green revolution
(J.S. Samra)


v
Acknowledgement
The study was conducted by Central Research Institute for Dry land Agriculture (CRIDA), Hyderabad and Indian Agricultural Statistics Research Institute (IASRI), New Delhi. The study team received excellent support from the various line Departments from different states and Central Ministries in terms of information, data on ranfall, availale water content, wastelands, ground-water status, irrigation intensity, status of natural resources, rainfed area etc. and suggestions on methodology. Their prompt response in providing the data is appreciated. In collaboration with NRAA, the study team has put its sincere efforts in prioritizing rainfed areas and the team deserves appreciation.
Disclaimer: The results of the study are based on data obtained from various sources for which authors and the Institutes involved are not responsible. The opinions expressed in this publication are suggestive.

Prioritization of Rainfed Areas in Indiavi

Prioritization of Rainfed Areas in India vii
contents
Chapter Title Page No
Executive Summary 1
1. Prioritization of Rainfed Areas : Historical Perspective 3
1.1 Background 31.2 Agro-climatic regions/zonation 4
1.2.1 DPAP and DDP Districts 41.2.2 Planning Commission 41.2.3 Indian Council of Agricultural Research 5
1.2.3.1 NARP Zones 51.2.3.2 Agro-Ecological Regions (AERs) 51.2.3.3 Production Systems Approach 7
2. Methodology for Prioritization of Rainfed Areas 10
2.1 Natural Resources Index (NRI) 102.2 Integrated Livelihood Index (ILI) 122.3 Rainfed Areas Prioritization Index (RAPI) 132.4 Milk Production Potential 13
3. Prioritization of Rainfed Areas: Results 15
3.1 Natural Resources Index (NRI) 153.1.1 Rainfall 153.1.2 Drought 153.1.3 Available Water Content 163.1.4 Degraded and Waste Lands 163.1.5 Rainfed area 163.1.6 Groundwater status 163.1.7 Irrigation intensity 163.1.8 Status of Natural Resources 17
3.2 Integrated Livelihood Index 173.2.1 Socio-economic status 173.2.2 Health and Sanitation 173.2.3 Status of Infrastructure 173.2.4 Status of Livelihood 18
3.3 Rainfed Areas Prioritization Index (RAPI) 18

Prioritization of Rainfed Areas in Indiaviii
4. Productivity Enhancement of Major Rainfed Crops in Prioritized Districts
33
4.1 Introduction 334.2 Rainfed Rice Production System 334.3 Sorghum Production System 354.4 Pearl millet (Bajra) Production System 384.5 Maize Production System 404.6 Ragi Production System 424.7 Groundnut Production System 434.8 Cotton Production System 444.9 Chickpea Production System 46
5. Livestock–Based Interventions for Livelihood Enhancement 49
5.1 Introduction 49
5.2 Livestock Density 50
5.3 Milk Productivity and Production Potential 54
5.3.1 Milk Production Potential 56
5.4 Meeting Fodder Needs during Lean Season 56
5.5 Options for Improving Common Pool Resources (CPRs) 56
5.5.1 Grazing land 56
5.5.2 Forests 57
5.5.3 Tank beds 57
5.5.4 Management systems and strategies of CPRs 58
6. Development Perspective and Policy Issues 59
Conclusions 64
References 66
Annexure – I: Legend Description for the Agro-ecological Sub-regions Map 69
Annexure –II: Principal Component Analysis (PCA) 71
Annexure –III: Rainfed Areas Prioritization Index (RAPI) and Component Indices (NRI & ILI) 74
Annexure –IV: District-wise Milk Production Potential 87
Study Team 100

Prioritization of Rainfed Areas in India 1
executive summAry
Rainfed areas currently constitute 55 per cent of the net sown area of the country and are home to two-thirds of livestock and 40 per cent of human population. Even after realizing the full irrigation potential, about 50 per cent of the cultivated area will remain rainfed. The business as usual approach of taking major interventions uniformly across all the regions of the country has not paid much dividend. Therefore, regionally differentiated interventions befitting natural resource endowment, social capital, infrastructure and economic conditions are need of the hour to meet the local challenges and enhance livelihoods. Earlier efforts of characterization of rainfed areas mainly focused on a few bio-physical indicators without giving importance to socio-economic aspects related to livelihoods issues. In order to meet this challenge, the current study was taken up to prioritize the rainfed areas for resource allocation and targeting of interventions based on resource availability, livelihood parameters and potential for development.
Realizing the importance of characterization of rainfed areas of the country and prioritization of the districts based on natural resource and livelihood indicators, National Rainfed Area Authority (NRAA) identified two premier institutes namely Central Research Institute for Dryland Agriculture (CRIDA), Hyderabad and Indian Agricultural Statistics Research Institute (IASRI), New Delhi to work on two components, viz., natural resources and livelihood status, and integrate the outcome to prioritize the rainfed areas of the country. CRIDA developed a “Natural Resource Index” (NRI) comprising of nine variables, viz., rainfall, frequency of drought, available water content, extent and per cent of degraded and wastelands, irrigation intensity, extent and per cent of rainfed areas and ground water status. Similarly, IASRI constructed an “Integrated Livelihoods Index” (ILI), which is a composite of three sub-indices, viz., socio-economic index, health and sanitation index and infrastructure index. Both NRI and ILI were constructed as a weighted sum of the relevant variables with weights generated from principal component analysis (PCA). The results of NRI derived from PCA generated weights largely agreed with the weights suggested by the subject matter specialists during National Stakeholders Consultation meeting on methodology held at New Delhi.
The study considered ‘district’ as a unit as it is the unit of administration. All the districts covered under Census 2001 have been considered for prioritization. Common minimum data set available across the country led to inclusion of 499 districts in the study. These districts account for more than 90% of country’s population and area. The districts that are not part of this study are: districts of Jammu & Kashmir, districts of north-eastern region except Assam, districts of Goa, and Union Territories. Totally urban districts like

Prioritization of Rainfed Areas in India2
Chennai, Mumbai, Kolkata and Hyderabad were also excluded. Data for newly formed districts were added to ‘original’ district data, wherever a district was bifurcated.
Rainfed Areas Prioritization Index (RAPI) was derived by assigning two-thirds weight to natural resource (NR) priority index and one-third weight to livelihood priority index as suggested by subject matter specialists. Accordingly, the top one-third districts (167) based on RAPI score may be considered as high priority rainfed districts for taking up crop and livestock-based interventions.
In majority of prioritized districts, natural resources status and livelihoods status are inversely related. In eastern India, NRI is medium to high but ILI is low indicating scope for improving the livelihoods through better access and utilization of natural resources. Based on RAPI, most of the districts having high priority fall in western India and southern peninsula. Therefore, further yield and livelihood gap was examined which was not considered in the RAPI. In order to bridge the gap through investment for harnessing natural resources, of the top one-third districts (167), 50 districts have been identified. The districts identified are mostly in eastern India and deserve developmental initiative on priority basis as there is unexploited potential for development. Rice is a major commodity of food security and eastern India provides many opportunities for enhancing production and productivity of rice. In these districts there is an immediate need of effective enabling mechanism and support services. On the other hand, NRI is low in western India and southern peninsula but ILI is medium to high. These districts have been receiving good investments on NRM for quite some time. However, our study indicates that these districts require continued attention in terms of NRM, particularly in-situ and ex-situ water harvesting, controlling soil loss and land degradation. Therefore, there is a need to come up with new policy guidelines and developmental strategies in relation to natural resources and livelihoods status.
There is a considerable scope for land use diversification and crop intensification in areas having high NRI and low or medium ILI. Agricultural development should receive high priority in areas having medium or high NRI irrespective of ILI. This calls for support services in the form of technology, infrastructure, credit, capacity building, forward and backward linkages, etc. Rather than individual components, packaging of the technologies is the need of hour and single window delivery mechanisms need to be explored for sustainable development of prioritized rainfed areas. Lastly, areas having low NRI deserve creation of off-farm employment opportunities with focus on land use diverisification, micro-enterprises and industrialization.
Prioritization of Rainfed Areas in India 3
1. PrioritizAtion of rAinfed AreAs: HistoricAl PersPective
1.1 BackgroundRainfed areas currently constitute 55 per cent of the net sown area of the country. Even after realizing full irrigation potential, about 50 per cent of the cultivated area will continue to remain rainfed. Moreover, two thirds of livestock and 40 per cent of human population of the country live in rainfed regions. In order to achieve overall development of agriculture in the country, it is essential to bridge the yield gaps, enhance the productivity and profitability, minimize risk and improve the livelihoods of millions of people dependent on rainfed agriculture. Although a large number of technologies have been generated by the National Agricultural Research System (NARS), their impact on the livelihoods of those living in rainfed regions has been limited and the recent slow down in agricultural growth has further widened the inequality between irrigated and rainfed areas.
The “green revolution” era had largely by-passed the rainfed agriculture. Subsequently several development programmes were initiated for improving rainfed farming. The “Everything Everywhere” approach of taking up all major interventions uniformly across all regions of the country has not paid much dividend. The specific needs of rainfed farming besides their characterization are of paramount importance. Some efforts have gone in this direction. Earlier most of the efforts of demarcation of dry farming regions in India (Sarkar et al., 1982) and its characterization (Soman and Kumar, 1990) were on the basis of rainfall variability within the range of 400 to 1000 mm of rainfall (Das and Kore, 2003). The rainfed areas per se (beyond the purview of drylands) didn’t get focused attention for increasing production and productivity. Later, the efforts of prioritization have concentrated mainly on few parameters like percentage irrigation, BPL families, aridity index, etc. for delineating rainfed areas/districts, which are the basis for formulating specific area developmental programmes. This approach also did not fully capture all other aspects like livelihood, soil resources, reliability of irrigation, the socio-economic profile, infrastructure, communication means, etc. Therefore, regionally differentiated interventions befitting to the natural resource endowment, social capital, infrastructure and economic condition are need of the hour to meet the current challenges. For this, it is important to prioritize the areas and identify the possible interventions for formulating any new programme. In view of the above, there is an urgent need to prioritize the rainfed areas based on resource availability and livelihood parameters. This chapter deals with the earlier efforts on classifying rainfed areas and the next chapter focuses on the methodology adopted for the current study on prioritization of rainfed areas.

Prioritization of Rainfed Areas in India4
1.2 Agro climatic regions/zonationSeveral approaches have been adopted for delineation of zones based on various parameters. The approaches followed by the Ministry of Rural Development, Planning Commission and ICAR are discussed below:
1.2.1 dPAP and ddP districts
Drought Prone Area Programme (DPAP) is the earliest area development programme launched by the Ministry of Rural Development, Government of India during 1973-74 to address the problem of rainfed areas chronically affected by drought. Similarly, Desert Development Programme (DDP) was launched during 1977-78 to address the problems of hot and cold desert areas. Based on encouraging response and requests from various states, a High Level Technical Committee was constituted in April 1993 under the chairmanship of Prof. C.H. Hanumantha Rao to critically review the programme in terms of methodology and implementation effectiveness. The committee developed the criteria to identify districts to be covered under DPAP and DDP. This was mainly based on climatic zones and percent net irrigated area. Moisture Index (MI) was used to assess the climatic zones. Moisture index is worked out using the formula [(P-PE)/PE]*100, where P=Precipitation and PE=Potential Evapotranspiration.
According to this criterion, the districts having arid ecosystem (MI <–66.7) and net irrigated area not more than 50% were considered under DDP. The districts with semi-arid ecosystem (MI = –66.7 to –33.3) and net irrigated area not more than 40% were covered under DPAP while dry sub-humid ecosystem having net irrigated area not more than 30% were also made eligible for coverage under DPAP (MoRD, 1994). Accordingly, 183 districs in 16 states were covered under DPAP while 40 districts in seven states under DDP.
1.2.2 Planning commission
Planning Commission (Khanna, 1989) has identified 15 agro-climatic regions in the country, 14 in the main land and one covering the islands of Bay of Bengal and the Arabian sea. The Planning Commission aimed at the regionalization of the Indian agricultural economy and attempted to bring integration of plans of the agro-climatic zones (ACZs) with the state and national plans. The agro-climatic classification of the Planning Commission is primarily based on geographical basis for developmental purpose and the list of zones is as follows:
1. Western Himalayan: J&K, HP, UP and Uttarakhand2. Eastern Himalayan: Assam, Sikkim, West Bengal and all North-Eastern States3. Lower Gangetic Plains: West Bengal4. Middle Gangetic Plains: UP and Bihar5. Upper Gangetic Plains: UP

Prioritization of Rainfed Areas in India 5
6. Trans-Gangetic Plains: Punjab, Haryana, Delhi and Rajasthan7. Eastern Plateau and Hills: Maharashtra, UP, Orissa and West Bengal8. Central Plateau and Hills: MP, Rajasthan and UP9. Western Plateau and Hills: Maharashtra, MP and Rajasthan10. Southern Plateau and Hills: AP, Karnataka and Tamil Nadu11. East Coast Plains and Hills: Orissa, AP, Tamil Nadu and Puducherri12. West Coast Plains and Ghat: Tamil Nadu, Kerala, Goa, Karnataka and Maharashtra13. Gujarat Plains and Hills: Gujarat14. Western Dry: Rajasthan15. The Islands: Andaman & Nicobar and Lakshadweep
Of late, the Planning Commission has come up with a list of 150 disadvantaged districts based on the following criteria:
High population of landless and agricultural wage earners��
Low household income and high rate of migration��
Higher per cent of SC and ST population��
Status of infrastructure��
1.2.3 indian council of Agricultural research (icAr)
1.2.3.1 nArP zones
The concept of homogenous agro-ecological zones was initiated by the ICAR in 1979 under the National Agricultural Research Project (NARP), with the support from International Development Agency (IDA) of the World Bank. Under the NARP, the concept of zoning was mainly based on ecological land classification, recognizing various components like soils, climate, topography, crops, vegetation, etc., as major influencing factors. The zones were selected as contiguous areas within the state boundary and to the possible extent zones have homogeneous physical characteristics such as topography, rainfall, soils, cropping patterns and irrigation availability. Generally each NARP zone covers 2-4 districts and is spread over an area as high as 40-50 thousand sq.km. Under NARP, the country was divided into 127 agro-climatic NARP zones falling under 17 major states and 6 states/Union Territories of North Eastern Hills Region. The criteria followed for delineation of NARP zones in different states is different, as depicted in Table 1.1. Of the total 127 NARP zones, 73 are predominantly rainfed (Fig.1.1).
1.2.3.2 Agro-ecological regions (Aers)
National Bureau of Soil Survey and Land Use Planning (NBSS & LUP), Nagpur has come up with 20 agro-ecological regions (Sehgal et al., 1992 and 1995) for the country and 60 agro-ecological sub-regions (AESR) (Fig. 1.2). The major criteria for the delineation of

Prioritization of Rainfed Areas in India6
Table 1.1 Criteria for Agro-climatic zoning under NARPState Broad criteria No. of
zonesAndhra Pradesh Soil and climate, total rainfall and rainfall distribution 7*Assam Rainfall, terrain and soils 6Bihar Rainfall, temperature, terrain, soils 6Gujarat Climate, topography, soils, cropping pattern 8Haryana Climate, topography, soil, cropping pattern, irrigation facility 2Himachal Pradesh Altitude, rainfall, temperature, humidity 4Jammu & Kashmir Soil, climate, altitude 4Karnataka Rainfall, topography, soils and cropping pattern 10Kerala Climate, topography, soils and cropping pattern, sea water incursion, irrigation
facility5
Madhya Pradesh Rainfall, topography, soils, cropping pattern 12Maharashtra Rainfall, topography, soils, cropping pattern 9Orissa Rainfall, climate, soils 10Punjab Rainfall, water resources, soils and cropping pattern 5Rajasthan Rainfall, soils, irrigation, irrigation facility and cropping pattern 9Tamil Nadu Rainfall, altitude, soils, cropping pattern 7Uttar Pradesh Rainfall, terrain and soils 10West Bengal Rainfall, temperature, soils, topography and cropping pattern 6N.E.H. Region Rainfall, topography, temperature and soils 6Andaman & Nicobar Topography and soils 3Pondicherry Soils, climate, topography, cropping pattern 2
Note: * revised to 9 ACZs
Fig. 1.1 Delineation of NARP zones

Prioritization of Rainfed Areas in India 7
regions were: (i) length of growing period as an integrated criterion of effective rainfall (ii) soil groups enjoy precedent over physiography (iii) delineated boundaries adjusted to district boundaries (iv) number of regions as minimal as possible.
1.2.3.3 Production systems Approach
Under the National Agricultural Technology Project (NATP), the concept of production systems was introduced by ICAR. For prioritization of rainfed districts of India, data on crop, livestock and socio-economic parameters for all districts with less than 30 percent irrigated area (considered as rainfed) were analyzed. Districts with highest area under a given crop/cropping system but with stagnant, declining or low productivity were considered as high priority districts. The underlying implication of this approach was that any improvement in the productivity of crops and livestock in such districts will have a greater impact at the state and national level due to the involvement of large area/ number of farmers (NATP, 2004).
Source: (Sehgal et al., 1992 & 1995)
Fig. 1.2 Agro-ecological sub-regions of India (Legend: Annexure – I)

Prioritization of Rainfed Areas in India8
In this approach, the rainfed agro-ecosystem was sub-divided into 5 homogenous production systems, viz.,
i. Rainfed rice based systemii. Nutritious (coarse) cereals based systemiii. Oilseeds based systemiv. Pulses based systemv. Cotton based system
The rainfed rice production system is mostly prevalent in eastern and north eastern parts of India (Fig. 1.3). Coarse cereals are staple food of poor people and principal source of fodder for livestock is mainly confined to western and central parts of the country and the semi-arid hot high lands of Deccan plateau. Oilseed-based production system which is mostly rainfed wherein crops are grown both during kharif and rabi seasons under sole, inter and sequence cropping systems. The groundnut is mostly cultivated in western plains, central high lands, semi-arid Deccan plateau and Eastern Ghats while soybean is mainly confined to Madhya Pradesh and Uttar Pradesh in the central high lands, Malwa-Gujarat plains and Kathiawar peninsula and is now spreading to areas like Vidarbha region in Maharashtra. In case of pulses-based production system, ninety per cent of pulses are grown under rainfed conditions as intercrops or in sequence cropping system all over the country. Pigeon pea and chickpea are the two most important pulse crops and grown during kharif and rabi seasons, respectively. Cotton-based production system has sixty per cent of the cropped area under rainfed condition mostly in the Deccan plateau and hot semi-arid peninsular parts of India.
All the above efforts made earlier for characterization of rainfed areas by-passed many key parameters essential for drawing meaningful conclusions and need- based interventions. The agriculture and allied developmental efforts need to match with the available natural resources and livelihood. The integration of natural resources and livelihood parameters is required to characterize the rainfed areas of the country. The integrated method adopted for prioritization of rainfed areas in the country is discussed in the following chapter.

Prioritization of Rainfed Areas in India 9
Fig. 1.3 Major rainfed production systems of India
(Note: Kerala, Himachal Pradesh and Uttarakhand are mainly horticulture-based production systems)

Prioritization of Rainfed Areas in India10
2. metHodology for PrioritizAtion of rAinfed AreAs
Prioritization of rainfed areas has to be made on a scientific basis; therefore, the study team realized the need for a composite index. Rainfed Areas Prioritization Index (RAPI), evolved by the study team is composed of two sub-indices, viz., Natural Resources Index (NRI) and the Integrated Livelihood Index (ILI) to account for the both natural resource and socio-economic parameters.
This study considered 499 districts that existed as on March 31, 2001, the date of reference for Census-2001. These districts account for about more than 90 % of country’s population and area. The districts that could not form part of the study are all the districts of Jammu & Kashmir, north-eastern region except Assam, Goa, and Union Territories. The basic reason for not including them is the non-availability of data for certain key parameters used in the study. Totally urban districts like Chennai, Mumbai, Kolkata and Hyderabad were also excluded from the purview of the study. Data of newly formed district were added to ‘original district’ data from which such new district was carved out.
2.1 natural resources index (nri) Natural Resources Index was derived by considering nine major variables set out in Table 2.1. The table lists these variables and their measurement units, source of data along with remarks.
Table 2.1: Variables considered for computation of natural resources indexVariables Measurement/unit Data source RemarksRainfall Normal rainfall values expressed
as mm of rainfall. The upper limit of mean annual rainfall of 1500 mm was considered as cutoff which accounts for more than 80% of the total geographical area (Mandal et al., 1999). Moreover, the demand to meet the potential evapo-transpiration for the cropping season is well within 1500 mm for 99.8% of the total geographical area (IMD Science Report No. 36).
Mostly IMD. State Government websites for districts where data were not available from IMD. Global dataset of CRU, UK through India water portal was used for few districts.
The upper limit of 1500 mm was considered to give greater emphasis to low rainfall areas.
Drought Measured in terms of probability of severe drought. Computed by sum of probability of severe drought and half the probability of moderate drought. It means two moderate droughts were considered equivalent to one severe drought.
Gore et al., 2010 A negative deviation of 26 to 50% from normal rainfall was considered as a moderate drought, while any deviation that exceeds 50% is treated as severe drought
Prioritization of Rainfed Areas in India 11
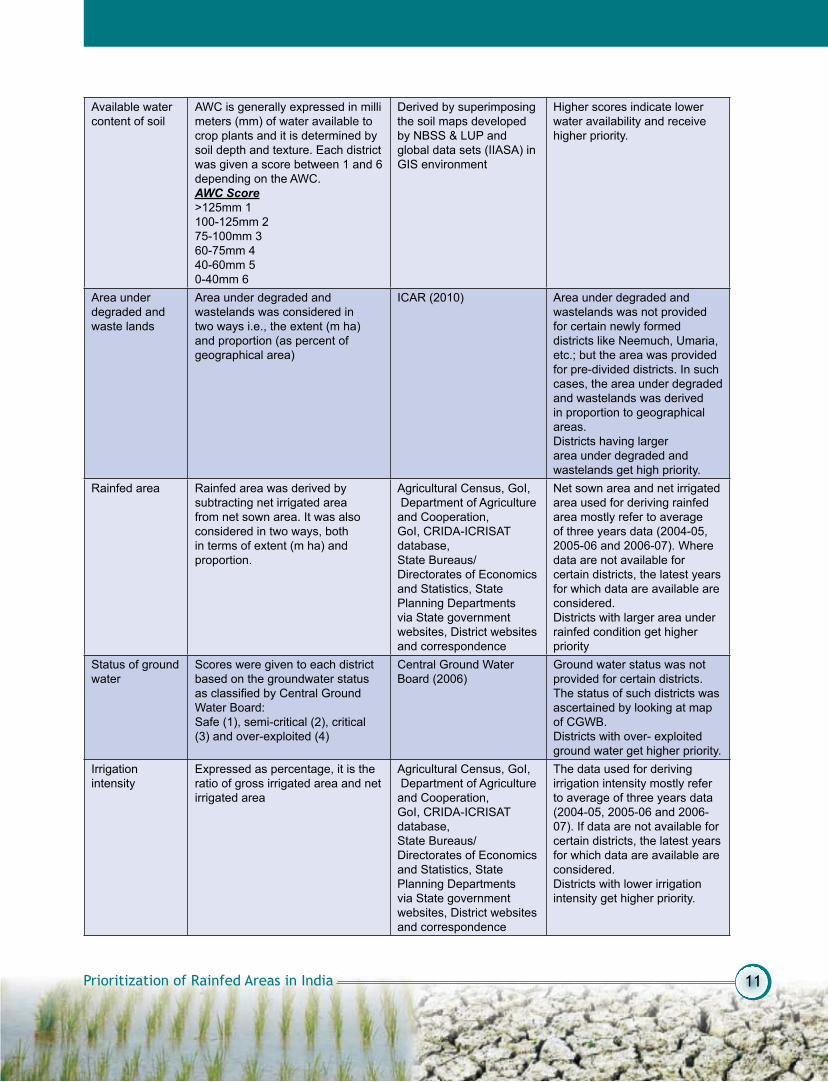
Available water content of soil
AWC is generally expressed in milli meters (mm) of water available to crop plants and it is determined by soil depth and texture. Each district was given a score between 1 and 6 depending on the AWC. AWC Score>125mm 1100-125mm 275-100mm 360-75mm 440-60mm 50-40mm 6
Derived by superimposing the soil maps developed by NBSS & LUP and global data sets (IIASA) in GIS environment
Higher scores indicate lower water availability and receive higher priority.
Area under degraded and waste lands
Area under degraded and wastelands was considered in two ways i.e., the extent (m ha) and proportion (as percent of geographical area)
ICAR (2010) Area under degraded and wastelands was not provided for certain newly formed districts like Neemuch, Umaria, etc.; but the area was provided for pre-divided districts. In such cases, the area under degraded and wastelands was derived in proportion to geographical areas.Districts having larger area under degraded and wastelands get high priority.
Rainfed area Rainfed area was derived by subtracting net irrigated area from net sown area. It was also considered in two ways, both in terms of extent (m ha) and proportion.
Agricultural Census, GoI, Department of Agriculture and Cooperation, GoI, CRIDA-ICRISAT database,State Bureaus/ Directorates of Economics and Statistics, State Planning Departments via State government websites, District websites and correspondence
Net sown area and net irrigated area used for deriving rainfed area mostly refer to average of three years data (2004-05, 2005-06 and 2006-07). Where data are not available for certain districts, the latest years for which data are available are considered.Districts with larger area under rainfed condition get higher priority
Status of ground water
Scores were given to each district based on the groundwater status as classified by Central Ground Water Board:Safe (1), semi-critical (2), critical (3) and over-exploited (4)
Central Ground Water Board (2006)
Ground water status was not provided for certain districts. The status of such districts was ascertained by looking at map of CGWB.Districts with over- exploited ground water get higher priority.
Irrigation intensity
Expressed as percentage, it is the ratio of gross irrigated area and net irrigated area
Agricultural Census, GoI, Department of Agriculture and Cooperation, GoI, CRIDA-ICRISAT database,State Bureaus/ Directorates of Economics and Statistics, State Planning Departments via State government websites, District websites and correspondence
The data used for deriving irrigation intensity mostly refer to average of three years data (2004-05, 2005-06 and 2006-07). If data are not available for certain districts, the latest years for which data are available are considered.Districts with lower irrigation intensity get higher priority.

Prioritization of Rainfed Areas in India12
Thus, nine variables that capture the most important natural resource parameters critical for production and required for formulating interventions in rainfed areas were considered in developing the natural resource index. The data for these variables were subjected to Principal Component Analysis (PCA) as described in Annexure-II. NRI derived by PCA method agreed with that of weights given by the subject matter specialists i.e. budget method (r=0.93 for index score and r=0.88 for ranks). Therefore, PCA method was used for developing NRI to avoid subjectivity.
As the scores given to NRI variables indicate priority (higher score means higher priority), NR priority index was first developed using the weights derived by PCA method. Then NRI is derived as (1-NR priority index). Low values of NRI depict poor status of NR and thus require higher priority.
2.2 integrated livelihood index (ili)
Apart from the status of natural resources, the level of economic development is also an important factor in determining the priority. Accordingly, districts with lower levels of development are to be given higher priority. For this, an integrated livelihood index (ILI) was constructed considering a number of factors that indicate the level of economic development.
The ILI is a composite of three sub-indices, viz., socio-economic index, health and sanitation index and infrastructure index. The variables that went into the computation of these sub-indices are set out in Table 2.2.
The variables in each of these three sub-indices were first normalized to make them unit-free and then combined using the weights obtained from PCA as in case of NRI. The three sub-indices were then subjected to PCA again to derive weights which were then used to construct the livelihood index.
Table 2.2: Variables considered for computation of various component indices of ILI
Socio-Economic IndexS. No.
Variable (parameter)
1 Percentage of SC Population 2 Percentage of ST Population3 Percentage literacy rate4 Per capita expenditure in rupees 5 Poverty gap ratio6 Number of radio and transistors per thousand households7 Number of television sets per thousand households8 Number of telephones per thousand households9 Number of scooters, motor cycles, etc. per thousand households10 Number of cars, jeeps, vans per thousand households

Prioritization of Rainfed Areas in India 13
Health & Sanitation IndexS. No.
Variable (parameter)
1 Number of houses with good and livable housing conditions per thousand houses2 Number of houses with latrine facility in the premises per thousand houses3 Number of villages with drinking water facility per thousand villages 4 Number of villages with medical facility per thousand villages 5 Number of households with drainage facilities per thousand households6 Number of households with bathroom facilities per thousand households7 Number of households with LPG connection per thousand households
Infrastructure IndexS. No.
Variable (parameter)
1 Number of villages with power supply per thousand villages2 Number of villages with Educational Institutes per thousand villages3 Number of villages with P&T facilities per thousand villages4 Number of villages with paved approach roads per thousand villages5 Number of households availing banking facilities per thousand households6 Number of households with electricity as source of lighting per thousand households
(Source of data: 61st round, consumer expenditure, socio-economic survey, July 2004-05, NSSO, GoI; Population Census of India, 2001)
2.3 rainfed Areas Prioritization index (rAPi)
NRI and ILI scores are rescaled using range. Priority indices were derived corresponding to NRI and ILI using the following expressions.
NR priority index = (1-NRI)
Livelihood priority index = (1-ILI)
These two indices have been combined by assigning two-thirds weight to NR priority index and one-third weight to Livelihood priority index to derive RAPI as suggested by Experts (unanimous opinion) during National Stakeholders Consultation meeting held on 18th May 2010 at NASC complex, New Delhi. The resultant RAPI is estimated as under:
RAPI = {2/3 (1-NRI) + 1/3 (1-ILI)}
Accordingly all the 499 districts have been prioritized and their values are set out in Annexure – III and the results are presented in chapter-3.
2.4 milk Production Potential
The milk production potential for 499 districts was estimated using 18th Livestock Census (2007) provisional data for planning interventions in the dairy sector. The milk production potential of the district was determined based on the index developed using the following three steps:

Prioritization of Rainfed Areas in India14
The density was estimated by dividing the population (cows and she-buffaloes) with ��
respective geographical area of the district.
Per cent cross-bred cows was estimated by dividing the population of cross-bred ��
cows with total number of cows of the district. In case of Bihar, the total population data were available but lacked districts wise break up, hence density of cows and buffaloes and % cross-bred cows for the state was considered to represent status of districts of Bihar.
The above three parameters namely cow density, she-buffalo density and per cent ��
cross-bred cows’ data were normalized using the following formula:
Zi = )()(
)(
MinXMaxX
XMaxX
ii
ii
−−
Zi= Normalized value of the parameter for ith district
Xi = Original value of the parameter for ith district
The milk production potential index was derived by combining these three normalized parameters by assigning weights, 0.25, 0.25 and 0.5 for cow density, per cent cross-bred cows and she-buffalo density, respectively. Based on the index value, all the districts were regrouped into three classes having high, medium and low milk production potential (Annexure - IV).

Prioritization of Rainfed Areas in India 15
3. PrioritizAtion of rAinfed AreAs: results
Districts were prioritized based on the Rainfed Areas Prioritization Index (RAPI) score derived by combining Natural Resource Index (NRI) and Integrated Livelihood Index (ILI).
3.1 natural resource index (nri)The natural resource index is based on nine parameters mainly rainfall, the frequency of moderate and severe drought, the extent and percent of rainfed areas, groundwater status, available water content, the extent and percent of degraded & wastelands and irrigation intensity. The NRI accounts for two-thirds of the weight assigned while within the NRI, the rainfall and drought account for the major share as they decide the outcome of rainfed agriculture. The major findings are given variable-wise and also depicted through maps.
3.1.1 rainfall
Per humid region receiving excessive rainfall is confined to Western Ghats extending ��
from Maharashtra to Kerala along the coast, West Bengal, North-Eastern region (Fig. 3.1).
Dry sub-humid and moist sub-humid areas are spread over Orissa, Chattisgarh, Bihar, ��
Jharkand, West Bengal & Parts of UP.
Dry and moist semi-arid extend from the interior of Karnataka, AP, MP, Gujarat, ��
Rajasthan and parts of UP thus form a contiguous region.
Arid region mostly spreads over Western part of Rajasthan and two districts of ��
Gujarat.
3.1.2 drought
Combined probability of moderate and severe drought at district level based on the IMD maps (Gore et al., 2010) was worked out (Fig. 3.2). The probability of severe drought is high in Western parts of Gujarat and Rajasthan followed by Haryana, while it is moderate in the interior parts of Gujarat, Rajasthan, South India, Central India, (Maharashtra & MP), and Indo-Gangetic Plains (IGP) of Punjab and UP. Rest of the country has <10% probability of experiencing drought.

Prioritization of Rainfed Areas in India16
3.1.3 Available water content
Available water content, in absolute terms (i.e. in mm) indicates the storage capacity of soil and its availability to plants. Available water content, derived from grid based global soil data sets, averaged over soil depth and derived for the district indicate more than 125 mm available water content in IGP districts, parts of MP and Maharashtra. The available water content in many coastal districts in AP, TN, Orissa, West Bengal, and Parts of Rajasthan is less than 100mm (Fig. 3.3).
3.1.4 degraded and wastelands
Major part of degraded and wastelands are in the range 0-20% & 20-40% in majority ��
of the districts in the country (Fig. 3.4).
Severely degraded land is found in parts of UP, Rajasthan, MP, Maharashtra and in ��
West Coast.
60-80% district area is degraded in some of the districts of UP & MP. ��
Less than 20% of degraded and wastelands are observed in Central India, West Bengal, ��
Orissa, Gujarat, Coastal Region of Tamil Nadu, and parts of AP.
3.1.5 rainfed Area
Based on the percent rainfed area, districts were categorized into 3 classes i.e. <35% rainfed area, 35-70% and >70% rainfed area (Fig. 3.5). Except for few districts in coastal areas of AP, Tamil Nadu and IGP, rest of the districts are having more than 35% area as rainfed. Most of the districts of Central India, parts of AP and Karnataka, are having more than 70% area under rainfed condition and also come under dry & moist semi-arid climate. Parts of Orissa, Chattisgarh, West Bengal having more than 70% rainfed areas come under moist sub-humid climate.
3.1.6 groundwater status
Based on groundwater utilization, the districts are categorized into safe, semi-critical, critical and over-exploited by Central Ground Water Board (CGWB). Major parts of Eastern India, Central India, Northern Parts of AP are safe in terms of exploitation of groundwater (Fig. 3.6). Most parts of Punjab, Haryana, Rajasthan, Southern AP, Parts of Tamil Nadu are considered as over- exploited. Many districts under IGP where the recharge is mainly through canal supplies are also over-exploited indicating the need for immediate remedial measures in terms of change in cropping pattern.
3.1.7 irrigation intensity
More than 100% of irrigation intensity indicates assured availability of water for more than one cropping season in a year. Typically, these areas are located in canal command
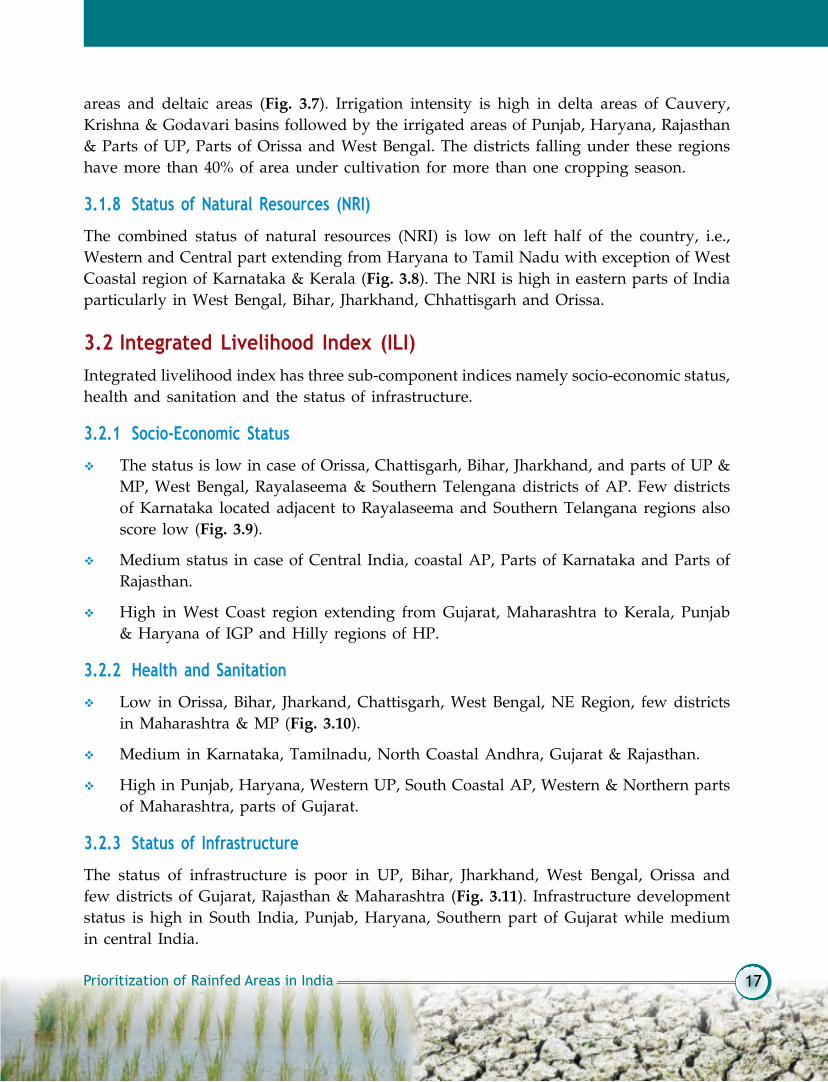
Prioritization of Rainfed Areas in India 17
areas and deltaic areas (Fig. 3.7). Irrigation intensity is high in delta areas of Cauvery, Krishna & Godavari basins followed by the irrigated areas of Punjab, Haryana, Rajasthan & Parts of UP, Parts of Orissa and West Bengal. The districts falling under these regions have more than 40% of area under cultivation for more than one cropping season.
3.1.8 status of natural resources (nri)
The combined status of natural resources (NRI) is low on left half of the country, i.e., Western and Central part extending from Haryana to Tamil Nadu with exception of West Coastal region of Karnataka & Kerala (Fig. 3.8). The NRI is high in eastern parts of India particularly in West Bengal, Bihar, Jharkhand, Chhattisgarh and Orissa.
3.2 integrated livelihood index (ili)Integrated livelihood index has three sub-component indices namely socio-economic status, health and sanitation and the status of infrastructure.
3.2.1 socio-economic status
The status is low in case of Orissa, Chattisgarh, Bihar, Jharkhand, and parts of UP & ��
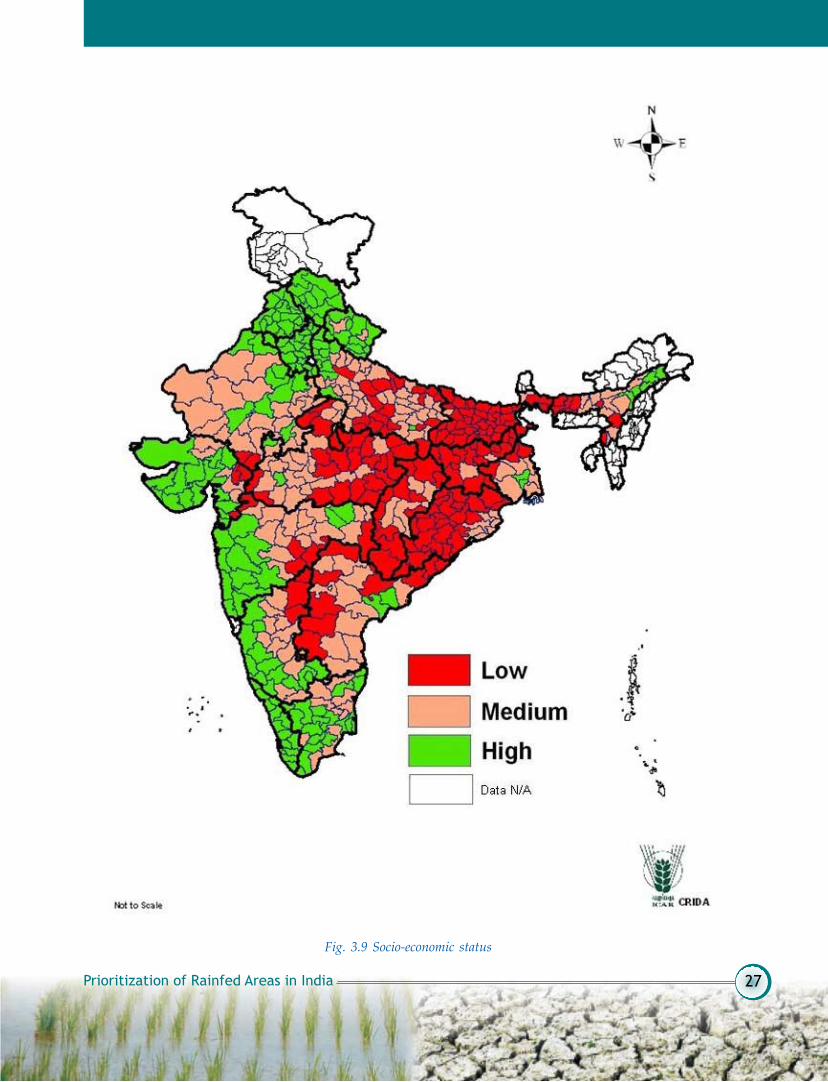
MP, West Bengal, Rayalaseema & Southern Telengana districts of AP. Few districts of Karnataka located adjacent to Rayalaseema and Southern Telangana regions also score low (Fig. 3.9).
Medium status in case of Central India, coastal AP, Parts of Karnataka and Parts of ��
Rajasthan.
High in West Coast region extending from Gujarat, Maharashtra to Kerala, Punjab ��
& Haryana of IGP and Hilly regions of HP.
3.2.2 Health and sanitation
Low in Orissa, Bihar, Jharkand, Chattisgarh, West Bengal, NE Region, few districts ��
in Maharashtra & MP (Fig. 3.10).
Medium in Karnataka, Tamilnadu, North Coastal Andhra, Gujarat & Rajasthan. ��
High in Punjab, Haryana, Western UP, South Coastal AP, Western & Northern parts ��
of Maharashtra, parts of Gujarat.
3.2.3 status of infrastructure
The status of infrastructure is poor in UP, Bihar, Jharkhand, West Bengal, Orissa and few districts of Gujarat, Rajasthan & Maharashtra (Fig. 3.11). Infrastructure development status is high in South India, Punjab, Haryana, Southern part of Gujarat while medium in central India.

Prioritization of Rainfed Areas in India18
3.2.4 status of livelihood (ili)
The combined status of integrated livelihood (ILI) is high on west coast and IGP region while it is medium in northern and central India (Fig. 3.12). Livelihoods status is poor in the eastern parts of India particularly in West Bengal, Bihar, Jharkhand, Chhattisgarh and Orissa while these areas are rich in natural resources (high NRI). Therefore, there is high scope for unexpoited tapping of unexploited natural resources in these regions for improving the livelihood status with meaningful location-specific interventions
3.3 rainfed Areas Prioritization index (rAPi)The ranking of districts was based on RAPI score and the list is presented in Annexure-III. Based on RAPI score, the districts are grouped into low, medium and high priority categories (Fig. 3.13). Of the total 499 districts, the top one-third districts (167) based on RAPI may be considered as high priority districts (Fig. 3.14). Of the 167 districts, 50 of them were further shortilisted possessing high potential for development (i.e. natural resources availability) and large yield gap to address food and livelihood security. These 50 districts have medium to high NRI, low to medium ILI and large yield gap.
Chapters 4 and 5 deal with bio-physical and socio-economic interventions for enhancing crop and livestock productivity, respectively, for the top 167 prioritized districts, while chapter 6 focuses on development perspective and policy issues.

Prioritization of Rainfed Areas in India 19
Fig. 3.1 Climatic classification based on rainfall

Prioritization of Rainfed Areas in India20
Fig. 3.2 Per cent probability of occurrence of severe drought
(two moderate droughts are considered equivalent to one severe drought)

Prioritization of Rainfed Areas in India 21
Fig. 3.3 Available water content (mm)

Prioritization of Rainfed Areas in India22
Fig. 3.4 Percent area under degraded and wasteland to total geographical area

Prioritization of Rainfed Areas in India 23
Fig. 3.5 Percent rainfed area to net sown area

Prioritization of Rainfed Areas in India24
Fig 3.6 Status of groundwater

Prioritization of Rainfed Areas in India 25
Fig 3.7 Irrigation intensity (%)

Prioritization of Rainfed Areas in India26
Fig. 3.8 Status of natural resources based on NRI
Prioritization of Rainfed Areas in India 27
Fig. 3.9 Socio-economic status

Prioritization of Rainfed Areas in India28
Fig. 3.10 Status of health and sanitation

Prioritization of Rainfed Areas in India 29
Fig. 3.11 Status of infrastructure

Prioritization of Rainfed Areas in India30
Fig. 3.12 Status of livelihoods based on ILI

Prioritization of Rainfed Areas in India 31
Fig. 3.13 Priority status based on RAPI

Prioritization of Rainfed Areas in India32
Fig. 3.14 Status of natural resources and livelihoods in high priority districts

Prioritization of Rainfed Areas in India 33
4. Productivity enHAncement of mAjor rAinfed croPs in Prioritized districts
4.1 introductionAs stated earlier the National Agricultural Technology Project (NATP) identified five major production systems viz., coarse cereals based, groundnut based, rainfed rice based, cotton based and soybean based production systems based on soil, climate and cropping pattern for identifying technologies to enhance productivity. The current approach not only accounts for the production systems but also major rainfed crop of each prioritized district. The prioritized districts based on RAPI were further characterized in terms of cultivation of different rainfed crops, their area, production and productivity. For each district crop-wise rainfed area was derived by subtracting the irrigated area from the total area cultivated under the crop. Mostly the data correspond to average of 2004-05, 2005-06 and 2006-07. Data on crop-wise area sown, production and area under irrigation were gathered from multiple sources, viz., Department of Agriculture and Cooperation, GoI, Agricultural Census, GoI, CRIDA-ICRISAT database, CMIE database (Mumbai, India), State Bureaus/ Directorates of Economics and Statistics, State Planning Departments through State government websites, District websites and correspondence. All the crops grown in a district were arranged in descending order of rainfed area and the uppermost crop was identified as major rainfed crop of the district.
Productivity of the major rainfed crop in each prioritized district (167 nos.) has been derived by dividing the total production by total area sown, which is inclusive of irrigated area. Major interventions were suggested based on level of productivity in relation to natural resource and livelihood indices.
4.2 rainfed rice Production systemAll the major rainfed rice growing districts fall under the category of low integrated livelihood index (ILI) indicating association of rainfed rice area with poverty and backwardness. Most of these districts are, however, blessed with medium to high natural resources (NRI) reflecting under-utilization of available resources. Of the 167 top priority districts, there are 44 rainfed rice growing districts that fall mainly in the Central, Eastern and North-Eastern regions of India in the states of Madhya Pradesh (8), Jharkhand (12), Chhattisgarh (5), Orissa (8), Bihar (4), Assam (2), West Bengal (2) and Uttar Pradesh (3).
Of the total area of 55.13 lakh ha under 44 districts growing rice, only four districts (8%

Prioritization of Rainfed Areas in India34
area) possess high productivity (>2.0 t ha-1) followed by 24 districts (54% area) exhibiting medium productivity (1 -2 t ha-1), while the rest 16 districts (38%) are in low category (<1.0 t ha-1) (Table 4.1, Fig. 4.1). Districts having low productivity are mostly confined to Madhya Pradesh (8), Chhattisgarh (3), Orissa (2) and the remaining three are one each in Bihar (Champaran West), UP (Sonbahdra) and Jharkhand (Gadhwa).
As all the above districts fall under the category of low ILI, therefore, there is an immediate need of improving socio-economic condition and infrastructure as the area is rich in natural resources. There is ample scope for integrated farming systems approach of rice-fish-duck/piggery by allocating 10% area to on-farm reservoirs (OFRs). Rainwater harvested in OFRs can be made use for rearing of fish and duck and also for supplemental irrigation to paddy during dry spells. National Agricultural Technology Project (NATP), clearly demonstrated usefulness of on-farm reservoirs (OFRs) in the States of Jharkhand, Chhattisgarh and Orissa and the farmers could realize an additional income of Rs. 8,000 to 10,000/- per hectare. Apart from above the following interventions may be planned and facilitated, which are highlighted in the Table 4.2.
Table 4.1: Relationship between NRI, ILI and rice productivity in rainfed districts of India NRI ILI Name of the State Name of the district Productivity*Low Low CG Sarguja L
CG Bastar MMP Rewa LMP Satna LMP Shahdol LMP Sidhi L
Medium Low Assam Karbi-Anglong MCG Jashpur LCG Raj Nandgaon MCG Dantiwara LJharkhand Dumka MJharkhand Ranchi MJharkhand Gumla MJharkhand West Singbhum MJharkhand East Singbhum MJharkhand Palamu MJharkhand Godda HMP Dindori LMP Seoni LMP Mandla LMP Panna LOrissa Bolangir LOrissa Kalahandi LUP Bahraich MUP Basti MUP Sonbhadra LW. Bengal Cooch Behar MW. Bengal Purulia H

Prioritization of Rainfed Areas in India 35
High Low Assam Kokrajhar MBihar Champaran(West) LBihar Gopalganj MBihar Jamui MBihar Kishanganj MJharkhand Girdih HJharkhand Gadhwa LJharkhand Devgarh HJharkhand Sahebganj MJharkhand Pakud MJharkhand Bokaro MOrissa Gajapati MOrissa Phulbani (Kandhamal) MOrissa Rayagada MOrissa Nawarangpur MOrissa Malkangiri M
* L = <1.0 t ha-1 M = 1.0 – 2.0 t ha-1 H = > 2.0 t ha-1
Table 4.2: Interventions based on NRI, ILI and productivity – Rainfed riceNRI ILI Productivity InterventionsL L L Crop diversification and alternatives to paddy
M Promotion of improved varieties of rice in the Bastar region and on-farm reservoirs (OFRs)
M L L Improved varieties along with INMM Improved varieties along with INM and IPMH All the above plus suitable infrastructure for storage and market support
servicesH L L Diversified farming system as area is rich in natural resource
M Improved varieties and site-specific nutrient management (SSNM) to realize the full potential
H SSNM and OFR for sustaining and improving the productivity
4.3 sorghum Production systemThere are 27 districts with major rainfed crop as sorghum and are mostly confined to few States namely Madhya Pradesh, Maharashtra, Karnataka, Rajasthan, Tamil Nadu and Andhra Pradesh. Sorghum is mostly restricted to districts having low NRI but associated with low to high livelihood indices. Only three districts fall under the category of low ILI, while 14 and 10 under medium and high category, respectively (Table 4.3). The productivity is as low as 0.23 t ha-1 to as high as 1.3 t ha-1 indicating variation and high yield gaps (Fig. 4.2). The total area under 27 districts growing sorghum is 47.23 lakh ha, of that 46.3% is under low productivity (<0.5 t ha-1), 42.7% area under medium productivity (0.5-1.0 t ha-1) and the rest 11% area under high category (>1.0 t ha-1).
As sorghum is grown in areas having poor natural resources (NRs), there is a need for improving NRs through effective soil and water conservation measures. Maharashtra and Karnataka account for substantial area and it is mostly under rabi sorghum. The area under

Prioritization of Rainfed Areas in India36
Fig.
4.1
. A
rea
and
prod
uctiv
ity i
n pr
iori
tized
dis
tric
ts h
avin
g ri
ce a
s a
maj
or r
ainf
ed c
rop
Rice
0.00
0.50
1.00
1.50
2.00
2.50
3.00 Bahraich
Basti Sonbhadra
Champaran(West) Kish
anganj GopalganjJa
mui Kokrajhar
Karbi-Anglong
Cooch BeharPurulia GadhwaPalamu
Girdih Devg
arhGodda SahebganjPaku
dDumkaBoka
roRaanch
iGumla
West Singbhum
East Singbhum Gajapati
Phulbani (Kandhamal) Bolangir Kalahandi Raya
gadaNawarangpur Malka
ngiri Sarguja Jash
purRaj N
andgaonBasta
r Dantiwara
PannaSatnaRewa Shahdol
Sidhi Dindori MandlaSeoni
Area
(Lak
h 'ha
)Yi
eld (t
on/h
a)

Prioritization of Rainfed Areas in India 37
kharif sorghum has declined drastically while there is no change in case of rabi sorghum because of good patronage by people as quality is superior. Kharif sorghum mostly suffers from late rains at the time of harvest and quality gets affected. The area of kharif sorghum is lost mostly to other crops mainly cotton and soybean. Additional efforts are needed to improve the yield of rabi sorghum through improved soil and water conservation measures, support services and price mechanism. Other specific interventions based on NRI, ILI and productivity are set out in Table 4.4.
Table 4.3: Relationship between NRI, ILI and sorghum productivity in rainfed districts of India
NRI ILI Name of the State Name of the district Productivity* Low Low MP Barwani M
MP Betul HMaharashtra Nandurbar H
Low medium MP Rajgarh MRajasthan Ajmer LRajasthan Tonk LRajasthan Kota HMaharashtra Jalna MMaharashtra Beed MMaharashtra Latur HMaharashtra Bagalkot MMaharashtra Bijapur MKarnataka Bidar HKarnataka Raichur MKarnataka Gadag LKarnataka Bellary HKarnataka Chamrajnagar M
Low High Maharashtra Aurangabad MMaharashtra Pune LMaharashtra Ahmednagar LMaharashtra Osmanabad MMaharashtra Solapur LMaharashtra Sangli LAndhra Pradesh Ranga Reddy HKarnataka Belgaum MTamil Nadu Coimbatore LTamil Nadu Dindigul M
* L = <0.5 t ha-1 M = 0.5 – 1.0 t ha-1 H = > 1.0 t ha-1

Prioritization of Rainfed Areas in India38
Table 4.4: Interventions based on NRI, ILI and productivity- sorghumNRI ILI Productivity Interventions
L L M Improved varieties of sorghum plus INM, integration with livestock
H Farm mechanization and post-harvest infrastructure for realizing higher income
L M L Alternative to sorghum, mainly pearl millet
M In-situ and ex-situ water conservation measures plus INM
H Incentives to the farmers, creation of storage facilities and procurement at large scale for supply under PDS
L H L Soil and water conservation measures for enhancing productivity, compartmental bunding and ridge and furrow planting in rabi-sorghum growing areas, recycling of tank silt, mulching, etc.
M Farm mechanization for timely seeding and weed control through custom hiring
H Improved infrastructure for supply of inputs and procurement of output
4.4 Pearl millet (bajra) Production systemThere are 25 districts having major rainfed area under bajra and are mostly confined to few States namely Rajasthan (17), Gujarat (3), Maharashtra (2) and one each in Madhya Pradesh, Karnataka and Tamil Nadu. Bajra is mostly restricted to districts having low NRI with an exception of one district from Madhya Pradesh having medium NRI (Sheopur Kalan). Districts growing bajra are associated with low to high livelihood indices. Only three districts fall under the category of low ILI, while 16 and 6 are under medium and high category, respectively (Table 4.5). This means in these districts people have already diversified and major portion of their income is derived from other sources, particularly livestock. The productivity is as low as 0.29 t ha-1 to as high as 1.95 t ha-1 (Fig. 4.3), indicating high variation and scope for improvement by technology adoption in low productivity
Sorghum
0.00
1.00
2.00
3.00
4.00
5.00
6.00
7.00
Ajmer
Tonk
Kota
Barw
ani
Rajga
rhBe
tul
Nandu
rbar
Jalna
Aurang
abad
Pune
Ahmed
naga
r
Beed
Latur
Osm
anab
ad
Solapu
r
Sang
li
Ranga
redd
y
Belgau
m
Baga
lkot
Bijapu
r
Bida
r
Raich
ur
Gad
ag
Bella
ry
Chamarajan
agar
Coimba
tore
Dindigu
al
Area (Lakh 'ha) Yield (ton/ha)
Fig. 4.2 Area and productivity in prioritized districts having sorghum as a major rainfed crop

Prioritization of Rainfed Areas in India 39
district. The total area under 25 districts growing pearl millet is 53.72 lakh ha, of that 26.7% is under low productivity (<0.6 t ha-1), 57.4% area under medium productivity (0.6-1.2 t ha-1) while the remaining 15.9% area is under high category (>1.2 t ha-1).
As the bajra is grown in areas having poor NRs, there is a need for improving NRs through effective soil and water conservation measures. Rajasthan accounts for large number of districts and substantial area under bajra, which receives very low rainfall. Therefore, in-situ soil and moisture conservation measures and farm mechanization hold the key along with efficient support services. Specific interventions based on NRI, ILI and productivity are set out in Table 4.6.
Table 4.5: Relationship between NRI, ILI and bajra productivity in rainfed districts of India NRI ILI Name of the State Name of the district Productivity*
Low Low Rajasthan Jaisalmer L
Rajasthan Barmer L
Low Medium Rajasthan Bikaner M
Rajasthan Churu L
Rajasthan Alwar H
Rajasthan Bharatpur M
Rajasthan Dholpur H
Rajasthan Karauli H
Rajasthan Sawai Madhapur H
Rajasthan Dausa H
Rajasthan Jaipur H
Rajasthan Nagaur M
Rajasthan Jodhpur M
Rajasthan Jalore M
Gujarat Banaskanta M
Gujarat Patan M
Karnataka Koppal L
Tamil Nadu Thoothukudi H
Low High Rajasthan Jhunjunu M
Rajasthan Sikar M
Rajasthan Pali M
Gujarat Kutch M
Maharashtra Dhule M
Maharashtra Nasik M
Medium Low MP Sheopur Kalan M
* L = <0.6 t ha-1 M = 0.6 – 1.2 t ha-1 H = > 1.2 t ha-1

Prioritization of Rainfed Areas in India40
Table 4.6: Interventions based on NRI, ILI and productivity - bajraNRI ILI Productivity Interventions
L L L Silvipasture management and integration with sheep, arid horticulture, particularly ‘ber’ with provision of supplemental irrigation through drip
L M L Agri-horti system with ber and other arid fruits with provision of supplemental irrigation through drip
M Improved seed, INM and in-situ soil moisture conservation measuresH SSNM and farm mechanization
L H M SSNM and farm mechanizationM L M Intercropping of bajra with pigeon pea as NR is good
4.5 maize Production systemThere are 20 districts having major area under maize and are mostly confined to Rajasthan (10), Madhya Pradesh (6), Gujarat (2) and Karnataka (2). Rainfed maize is mostly cultivated in districts having low NRI with the exception of Dahod in Gujarat with medium NRI. Districts growing maize are associated with low to high ILI. Only five districts fall under the category of low ILI, while 13 and 2 are under medium and high category, respectively (Table 4.7). The productivity is as low as 0.89 t ha-1 to as high as 2.53 t ha-1 (Fig. 4.4), indicating large variation and scope for productivity enhancement. The total area under 20 districts growing maize is 18.4 lakh ha, of that 5.6% is under low productivity (<1. t ha-1), 72.4% area under medium productivity (1.0 - 2.0 t ha-1) and the rest 22% under high category (>2.0 t ha-1).
Rajasthan accounts for large number of districts, which receive low rainfall compared to Madhya Pradesh. Productivity is better in MP than in Rajasthan due to better NRs, however in Southern Rajasthan large area is under rainfed maize and it is staple diet of the region. Maize is responsive to management and inputs as it is grown mostly in districts with poor NRs. There is a need for improving NRs through effective soil and water conservation measures. Therefore, in-situ soil and moisture conservation, water harvesting for supplemental irrigation and farm mechanization hold the key here. Specific interventions based on NRI, ILI and productivity are set out in Table 4.8. Other options for enhancing profitability in maize growing areas need to be explored through processing and value addition.
Table 4.7: Relationship between NRI, ILI and maize productivity in rainfed districts of IndiaNRI ILI Name of the State Name of the district Productivity*
Low Low MP Jhabua MRajasthan Jhalawar MRajasthan Dungarpur LRajasthan Banswara M
Low medium Gujarat Panchmahal MMP Shajapur MMP Ratlam H

Prioritization of Rainfed Areas in India 41
MP Mandsaur HMP Dhar HMP Chhindwara HRajasthan Udaipur MRajasthan Sirohi LRajasthan Rajsamand MRajasthan Chittorgarh MRajasthan Bundi MRajasthan Bhilwara MRajasthan Baran M
Low High Karnataka Haveri MKarnataka Davanagere H
Médium Low Gujarat Dahod M
* L = <1.0 t ha-1 M = 1.0 – 2.0 t ha-1 H = > 2.0 t ha-1
Table 4.8: Interventions based on NRI, ILI and productivity – maizeNRI ILI Productivity InterventionsL L M Improved varieties, seed treatment, seed priming, ridge and furrow planting,
improved seeding devices, soil and water conservation measures, integrated farming systems approach
L M L In-situ soil and moisture conservation measures, improved varieties, weed control and nutrient management
M All the above plus intercropping of maize with blackgram (2:2)H Ridge and furrow making, use of herbicides for weed control, intercropping of
maize with soybean (2:6) M L M Sowing across the slope, improved varieties, nutrient management.
Bajra
0.001.002.003.004.005.006.007.008.009.00
Bik
aner
Chu
ru
Jhun
junu
Alw
ar
Bha
ratp
ur
Dho
lpur
Kar
auli
Saw
ai
Dau
sa
Jaip
ur
Sik
ar
Nag
aur
Jodh
pur
Jais
alm
er
Bar
mer
Jalo
re
Pal
i
She
opur
Kut
ch
Ban
aska
ntha
Pat
an
Dhu
le
Nas
ik
Kop
pal
Tho
othu
kudi
Area (Lakh 'ha) Yield (ton/ha)
Fig. 4.3 Area and productivity in prioritized districts having bajra as a major rainfed crop

Prioritization of Rainfed Areas in India42
4.6 ragi Production systemThere are only six districts having large area under ragi and concentrated in Karnataka (3) and one each in AP, Tamil Nadu and Orissa. Like other millets, ragi is also cultivated mostly in districts having low NRs with the exception of Koraput and Vishakapatnam. The rural areas of these two districts are inhabited by mostly tribals and possess highly undulating topography. Out of six districts only one falls under the category of low ILI, while three and two are under medium and high category, respectively (Table 4.9). The productivity is as low as 0.62 t ha-1 to as high as 1.86 t ha-1 (Fig. 4.5). The total area under six districts growing ragi is 5.68 lakh ha, of that 12.5% area is under low productivity (<0.75 t ha-1), 65.3% area under medium productivity (0.75-1.5 t ha-1) and the rest 22.2% under high category (>1.5 t ha-1).
Karnataka accounts for large area under ragi and is mostly cultivated in areas receiving low rainfall and has high productivity compared to Andhra Pradesh or Orissa having high rainfall but low productivity. Ragi is staple food in Karnataka while it is consumed mostly by tribals in other States. As ragi is confined to areas having poor NRs in Karnataka and Tamil Nadu, thus, there is a need for improving NRs through effective soil and water conservation measures for productivity enhancement besides other measures listed in Table 4.10.
Table 4.9: Relationship between NRI, ILI and ragi productivity in rainfed districts of IndiaNRI ILI Name of the State Name of the district Productivity*Low Medium Karnataka Tumkur M
Karnataka Kolar MLow High Karnataka Bangalore (rural) H
Tamil Nadu Dharmapuri HMedium Medium AP Vishakapatnam MHigh Low Orissa Koraput L
Fig. 4.4. Area and productivity in prioritized districts having maize as a major rainfed crop
Maize
0.00
0.50
1.00
1.50
2.00
2.50
3.00
Sirohi
Bundi
Bhilwara
Rajsam
and
Udaipu
r
Dunga
rpur
Bansw
ara
Chittor
garhBara
n
Jhala
war
Mandsa
ur
Ratlam
Shajap
ur
Jhab
uaDha
r
Chhind
wara
Panch
mahal
Dahod
Haveri
Davan
agere
Area (Lakh 'ha) Yield (ton/ha)

Prioritization of Rainfed Areas in India 43
* L = <0.75 t ha-1 M = 0.75 – 1.50 t ha-1 H = > 1.5 t ha-1
Table 4.10: Interventions based on NRI, ILI and productivity - RagiNRI ILI Productivity Interventions L L M Improved varieties, in-situ soil moisture conservation measure, silt application.
Integrated farming systems approach, intercropping of ragi with pigeonpea in 3:2 ratio
H M Improved varieties, in-situ soil moisture conservation measure, nutrient management, silt application, intercropping of ragi with pigeonpea in 3:2 row ratio
H Farm mechanization for seeding, weeding and SSNMM Sowing across the slope, improved varieties, intercropping of ragi with
pigeonpea in row 3:2 ratio H Ridge and furrow making, use of herbicides for weed control, intercropping of
ragi with pigeonpea in 3:2 row ratioM M M Sowing across the slope, improved varieties, nutrient management,
intercropping of ragi with pigeonpea in 3:2 row ratio.H L L Sowing across the slope, improved varieties, nutrient management.
4.7 groundnut Production systemThere are only 13 districts having large area under groundnut and concentrated in few States namely Gujarat (6), AP (4) and one in each MP, Karnataka and Tamil Nadu. Like millets, groundnut is also cultivated mostly in districts having low NRs but with medium to high ILI with an exception of Shivpuri (Table 4.11). The productivity is as low as 0.46 t ha-1 to as high as 1.21 t ha-1 (Fig. 4.6), indicating wide variability. The total area under 13 districts growing groundnut is 32.44 lakh ha, of that 24.8% area is under low productivity (<0.5 t ha-1), 59.9% area under medium productivity (0.5-1.0 t ha-1) and the rest 15.3% under high category (>1.0 t ha-1).
Ragi
0.00
0.200.40
0.60
0.801.00
1.20
1.40
1.601.80
2.00
Koraput Visakhapatnam Tumkur Kolar Bangalore(Rural)
Dharmapuri
Area (Lakh 'ha) Yield (ton/ha)
Fig. 4.5. Area and productivity in prioritized districts having ragi as a major rainfed crop
Prioritization of Rainfed Areas in India44
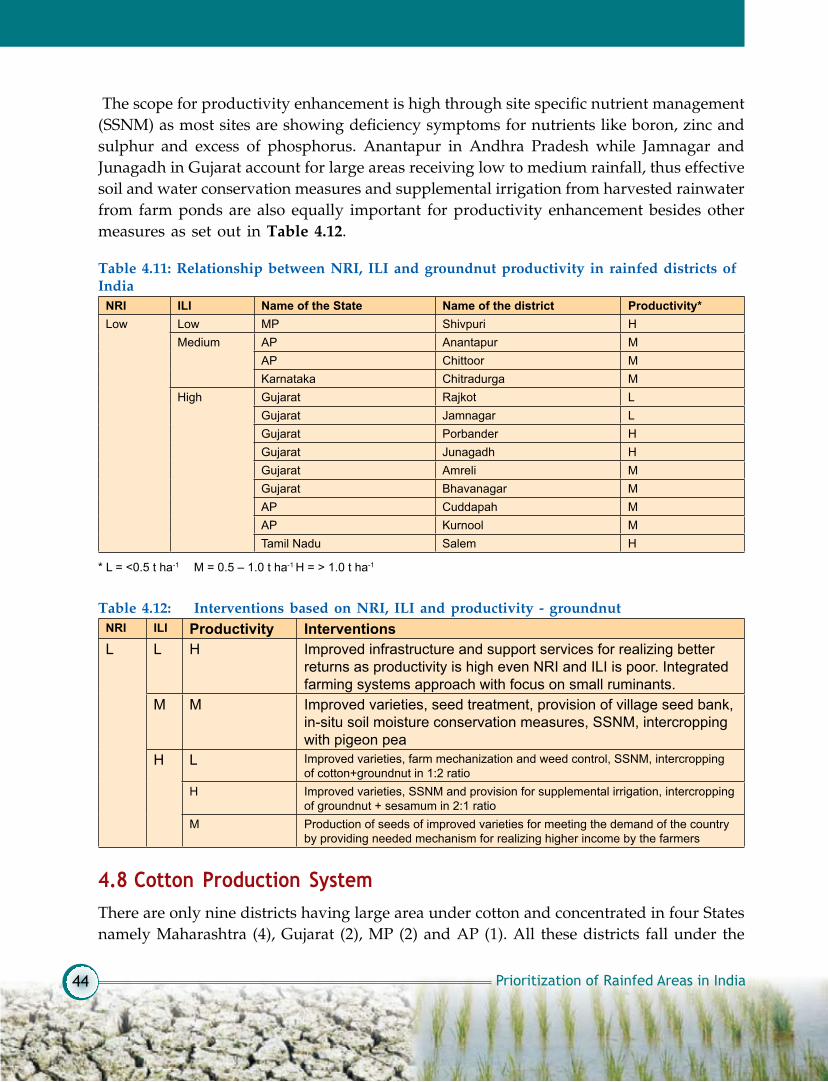
The scope for productivity enhancement is high through site specific nutrient management (SSNM) as most sites are showing deficiency symptoms for nutrients like boron, zinc and sulphur and excess of phosphorus. Anantapur in Andhra Pradesh while Jamnagar and Junagadh in Gujarat account for large areas receiving low to medium rainfall, thus effective soil and water conservation measures and supplemental irrigation from harvested rainwater from farm ponds are also equally important for productivity enhancement besides other measures as set out in Table 4.12.
Table 4.11: Relationship between NRI, ILI and groundnut productivity in rainfed districts of India
NRI ILI Name of the State Name of the district Productivity* Low Low MP Shivpuri H
Medium AP Anantapur MAP Chittoor MKarnataka Chitradurga M
High Gujarat Rajkot LGujarat Jamnagar LGujarat Porbander HGujarat Junagadh HGujarat Amreli MGujarat Bhavanagar MAP Cuddapah MAP Kurnool MTamil Nadu Salem H
* L = <0.5 t ha-1 M = 0.5 – 1.0 t ha-1 H = > 1.0 t ha-1
Table 4.12: Interventions based on NRI, ILI and productivity - groundnutNRI ILI Productivity InterventionsL L H Improved infrastructure and support services for realizing better
returns as productivity is high even NRI and ILI is poor. Integrated farming systems approach with focus on small ruminants.
M M Improved varieties, seed treatment, provision of village seed bank, in-situ soil moisture conservation measures, SSNM, intercropping with pigeon pea
H L Improved varieties, farm mechanization and weed control, SSNM, intercropping of cotton+groundnut in 1:2 ratio
H Improved varieties, SSNM and provision for supplemental irrigation, intercropping of groundnut + sesamum in 2:1 ratio
M Production of seeds of improved varieties for meeting the demand of the country by providing needed mechanism for realizing higher income by the farmers
4.8 cotton Production systemThere are only nine districts having large area under cotton and concentrated in four States namely Maharashtra (4), Gujarat (2), MP (2) and AP (1). All these districts fall under the

Prioritization of Rainfed Areas in India 45
category of low NRs but with medium to high ILI (Table 4.13). The soil depth is low and full potential of Bt. cotton is not realized here due to moisture stress. The productivity of cotton lint is as low as 0.11 t ha-1 to as high as 0.28 t ha-1 (Fig. 4.7). The total area under nine districts growing cotton is 21.09 lakh ha, of that 36.9% area is under low productivity (<0.15 t ha-1), 34.0% area under medium productivity (0.15-0.25 t ha-1) and the rest 29.1% under high category (>0.25 t ha-1).
Groundnut
0.00
1.00
2.00
3.00
4.00
5.00
6.00
7.00
8.00
Shivpur
i
Rajkot
Jamna
gar
Porba
nder
Jung
adh
Amreli
Bhava
nagar
Cudda
pah
Kurno
ol
Anantap
ur
Chittoor
Chitradur
ga
Salem
Area (Lakh 'ha) Yield (ton/ha)
Fig. 4.6 Area and productivity in prioritized districts having groundnut as a major rainfed crop
Fig. 4.7 Area and productivity in prioritized districts having cotton as a major rainfed crop
Cotton
0.000.501.001.502.002.503.003.504.00
Khargo
ne(W
est N
imar)
Khan
dwa(Ea
st N
imar)
Ahmed
abad
Surend
rana
gar
Buldha
na
Amrava
ti
Yava
tmal
Nande
d
Adila
bad
Area (Lakh 'ha) Lint yield (ton/ha)

Prioritization of Rainfed Areas in India46
There is a high scope for productivity enhancement through site-specific nutrient and water management (SSNM) as most sites are showing deficiency symptoms for nutrients like boron, zinc and sulphur. Surendranagar in Gujarat and Yavatmal in Maharashtra account for large areas receiving medium amount of rainfall, thus effective soil amelioration and moisture conservation measures are important for productivity enhancement as it is long duration crop besides other measures as set out in Table 4.14.
Table 4.14: Interventions based on NRI, ILI and productivity -cottonNRI ILI Productivity InterventionsLow Medium L Rainwater harvesting and recycling for supplemental irrigation and
balanced fertilization M In-situ and ex-situ water conservation and SSNM, intercropping of
cotton+groundnut in 1:2 ratio H Need based infrastructure and creation of storage facilities
High L Improved varieties, farm mechanization and weed control, SSNM M Improved varieties, SSNM and provision for supplemental irrigation.H Provision of storage and soft loan for realizing higher price by the farmers
4.9 chickpea Production systemThere are 15 districts having large area under chickpea concentrated in MP (7), UP (5), Rajasthan (2) and AP (1). All these districts fall under the category of low to medium NRI and low to medium ILI except Prakasam and Indore (Table 4.15). Prakasam is a unique example which brought chickpea revolution in Andhra Pradesh. Here the chickpea has substituted tobacco in a decade and showed tremendous growth in area and production mainly due to varietal replacement and complete mechanization of all operations from sowing to threshing. The productivity is as low as 0.32 t ha-1 to as high as 1.78 t ha-1 (Fig.4.8). The total area under 15 districts growing chickpea is 14.07 lakh ha, of that 69.3% area is under low productivity (<0.75 t ha-1), 24.7% area under medium productivity (0.75-1.5 t ha-1) and the rest 6% under high category (>1.5 t ha-1).
Table 4.13: Relationship between NRI, ILI and cotton lint productivity in rainfed districts of India
NRI ILI Name of the State Name of the district Productivity*Low Medium AP Adilabad M
Maharashtra Yavatmal LMaharashtra Nanded MMP Khargone (West) MMP Khandwa L
High Gujarat Ahmedabad MGujarat Surendranagar HMaharashtra Buldhana MMaharashtra Amaravati L
L = <0.15 t ha-1 M = 0.15 – 0.25 t ha-1 H = > 0.25 t ha-1

Prioritization of Rainfed Areas in India 47
Table 4.15: Relationship between NRI, ILI and chickpea productivity in rainfed districts of India
NRI ILI Name of the State Name of the district Productivity*Low Low MP Guna L
UP Banda LMedium MP Dewas M
MP Ujjain MRajasthan Ganganagar LRajasthan Hanumangarh LUP Hamirpur L
High AP Prakasam HMP Indore M
Medium Low MP Chattarpur MMP Sagar LMP Damoh LUP Mahoba LUP Chitrakot L
Medium UP Fatehpur M
L= <0.75 t ha-1 M = 0.75 – 1.5 t ha-1 H = > 1.5 t ha-1
Chickpea is the major crop of Madhya Pradesh and accounts for more than fifty per cent of the total area. Chickpea is mostly grown on conserved moisture during rabi and one or two supplemental irrigations improve the yield by 100 per cent. Areas falling medium NRs with medium to high rainfall have scope for rainwater harvesting and recycling through
Fig. 4.8 Area and productivity in prioritized districts having chickpea as a major rainfed crop
Chickpea
0.00
0.50
1.00
1.50
2.00
2.50
Ganga
naga
r
Hanum
anga
rh
Hamirp
ur
Mah
oba
Banda
Chitra
kut
Fateh
pur
Guna
Chhat
arpur
Sagar
Damoh
Ujjain
Dewas
Indo
re
Praka
sam
Area (Lakh 'ha) Yield (ton/ha)

Prioritization of Rainfed Areas in India48
Table 4.16: Interventions based on NRI, ILI and productivity – chickpeaNRI ILI Productivity InterventionsLow Low L Improved infrastructure and support services, supply of improved
varietiesMedium L Introduction of short duration varieties or crop substitution with lentil/
moth bean, etc. Efficient INM and IPM measuresM Water harvesting for supplemental irrigation in black soil areas, seed
priming and treatment with Rhizobium and Phosphorus solubilizing bacteria (PSB), intercropping with lentil
High H Farm mechanization and programme of seed multiplication of improved varieties for making the crop more remunerative.
Medium Low L Water harvesting, seed priming and treatment with Rhizobium and Phosphorus solubilizing bacteria (PSB).
M Improved varieties and seed treatment and IPM measuresMedium M Intercropping of chickpea with mustard as resource is good
farm ponds. Thus, effective soil and water conservation measures and supplemental irrigation are important for productivity enhancement besides mechanization as it is a post-monsoon rainfed crop (Table 4.16).

Prioritization of Rainfed Areas in India 49
5. Livestock-Based intervention for LiveLihood enhancement
5.1 introductionLivestock sector provides employment to 11 million people as principal status and 8 million as subsidiary status, which is 5% of the total working population in India. Share of livestock sector contribution to the National Agricultural GDP has shown a sharp rise from 6.0% in 1970 to 26.5% in 2006. Livestock plays vital role in sustaining the livelihoods of poor in rainfed areas as they absorb shocks due to droughts.
India has about 15% of world ruminant (Cattle, Buffalo, Sheep & Goat) population with only 2.4% of world’s geographical area. Recent decade saw a slow down in livestock population growth due to declining grazing lands and mechanisation of agriculture. There is also a significant change in the livestock composition with steep fall in bullocks and rise in cross-bred animals and buffaloes. As such, the livestock population is not expected to increase significantly in future, though there could be increase in number of milch animals and small ruminants. Higher small ruminant population in particular puts more pressure on the degraded grazing lands in rainfed areas. The Working Group on Animal Husbandry and Dairying of the Planning Commission in its Report (2002) projected a demand of 1170 m t of green and 650 m t of dry fodder with the corresponding availability figures at 411.3 and 488 m t, respectively. This leaves a deficit of 64.85% for green and 24.92% for dry fodder, respectively. By 2025, with significant increase in the demand for milk and other animal products, it may be necessary to devote at least double the net sown area for fodder production, which is presently around 6.15%. Cropped area under fodder production is about 11 million ha and there is no scope for expansion of fodder cultivation because of pressure on land for food and cash crops. The forest grazing area is also dwindling at a rate of 1.5 million ha per year. The grazing intensity is very high viz. 2.6 adult cattle unit (ACU) per ha in 1996 as against 0.8 ACU per ha in developed countries (Dwivedi and Ramana, 2002).
Income from livestock production accounts for 15-40 % of total farm household earnings in India (World Bank, 1999). Small ruminants is a major source of income for the poor families and their contribution ranges between 17 to 24 % of family income (Rangnekar, 2006) and provides gainful employment of 180 to 330 man-days per annum depending on the size of the flock (Misra et al., 2000). It has also been shown that irrespective of flock size, women and children contribute to labour force to the extent of about 90 % (Deoghare 1997). Hence farmers’ dependence on livestock to complement their agricultural farming, as an alternative source of income, is very encouraging (Singh et al., 2004).

Prioritization of Rainfed Areas in India50
Table 5.1: Relationship between small ruminants’ density and natural resources index (NRI) across selected prioritized districts of India
NRI Small ruminants density (No./km2)Low (<35) Medium (35-71) High (>71)
Low 26MP (13), Gujarat (7), (3), Chhattisgarh (2), Assam (1)
48Rajasthan (14), Maharashtra (9), Karnataka (8), MP (6), UP (5), Gujarat (4), AP (1), Tamil Nadu (1)
44Rajasthan (18), Karnataka (8), AP (7), Tamil Nadu (4), Maharashtra (4), MP (2), Gujarat (1)
Medium 11MP (8), Chhattisgarh (2), UP (1)
12UP (4), Jharkhand (3), Orissa (2), AP (1), MP (1), Chhattisgarh (1)
9Jharkhand (4), UP (2), West Bengal (2), Gujarat (1)
High 7Orissa (6), Assam (1)
2Bihar (1), Jharkhand (1)
8Jharkhand (5), Bihar (3)
Total 44 62 61
Among the rural development programs in rainfed areas, livestock development along with fodder production has become an essential module as it is felt as an instrument in changing livelihood status of the rural poor. The potential of livestock to reduce poverty is enormous as it contributes to the livelihoods of 19 million people, of which women constitute 71 percent (GoI, 2005). The improvement of livestock production will be important in the coming years, in view of the future demand of livestock products, which is expected to be doubled by 2020, while the natural resources that sustain livestock will become increasingly scarce, and degraded (Parthsarathy Rao et al., 2005 and Rangnekar, 2006). The expanding market for livestock products offers an opportunity for the resource-poor farmers and even for those who do not have access to land and could provide livelihoods through livestock production (FAO, 2000; Thomas and Rangnekar, 2004). However, to enable the resource-poor to take benefit of market demand, a favourable policy environment will have to be provided to improve common property resources (CPRs) besides addressing technical and socio-economic constraints.
5.2 Livestock densityThe 499 districts have been categorized into different classes (low, medium and high) based on density of small and large ruminants separately. The 33.3 and 66.6 percentiles have been used to classify them into above three groups. The livestock census (2003) data has been used.
The density classes of small ruminants for 167 prioritized districts are depicted in relation to NRI classes in Fig. 5.1. Of the total 167 districts 44, 62 and 61 districts fall under the category of low, medium and high density of small ruminants, respectively (Table 5.1). Small ruminants is the major source of livelihood for the poor but are also detrimental to natural resource because of high grazing pressure on the land. Therefore, the interventions need to be in conformity with resource base. Areas having high density with low natural resource index are prone to further degradation. Therefore, efforts may be made to reduce the density and promote alternate enterprises like dairy, poultry, apiary, fishery, etc. besides other options discussed in Table 5.2.

Prioritization of Rainfed Areas in India 51
Fig. 5.1 Natural resource index vis-à-vis small ruminants density

Prioritization of Rainfed Areas in India52
Table 5.2: Scope of interventions based on small ruminants’ density and natural resources index (NRI)
NRI Small ruminants density (No./km2)Low (<35) Medium (35-71) High (>71)
Low Resources are poor, therefore number of livestock to be maintained, if possible reduced. More concentration on productivity enhancement of pasture lands through soil and water conservation measures and inclusion of top-feed trees
Silvopastoral systems and supplemental feeding by growing fodder trees.
Efforts to be made to reduce the number and increase the productivity as carrying capacity is low by convincing the small ruminants rearing communities. Breed improvement.
Medium Opportunity exists for agroforestry systems by integrating small ruminants which are more remunerative
The situation is in equilibrium but efforts to be made for improved animal health and supplemental feeding by raising improved perennial pasture, a mixture of grasses and legumes
Development of community owned lands and CPRs through user groups (UGs) and promotion of perennial grasses and legumes, harvest by cut and carry system
High Scope for promotion of agro-silvo-pastoral, silvopastoral and hortipastoral systems by integrating small ruminants
More focus on animal health care and integrated farming systems approach
Dedicated efforts to improve grazing lands through agroforesty and soil and water conservation measures. Introduction of deferred and rotation grazing through community mobilization.
Table 5.3: Relationship between large ruminants’ density and natural resources index (NRI) across selected prioritized districts of India
NRI Large ruminants density (No./km2)Low (<78) Medium (78-139) High (>139)
Low 69Rajasthan (14), Karnataka (12), Maharashtra (10), Gujarat (9), MP (8), AP (8), Tamil Nadu (5), Chhattisgarh (2), Assam (1)
43Rajasthan (14), MP (13), Maharashtra (6), UP (3), Karnataka (4), Gujarat (2), Tamil Nadu (1)
6Rajasthan (4), UP (1), Gujarat (1)
Medium 10MP (5), Chhattisgarh (2), Jharkhand (1), AP (1), Oirssa (1)
14Jharkhand (5), MP (4), UP (3), Chhattisgarh (1),Orissa (1)
8UP (4), West Bengal (2),Jharkhand (1), Gujarat (1)
High 5Orissa (5)
6Jharkhand (3), Bihar (1),Orissa (1), Assam (1)
6Bihar (3), Jharkhand (3)
Total 84 63 20
Similarly density classes of large ruminants have been depicted against different classes of NRI (Fig. 5.2). Of the total 167 districts prioritized, 84, 63 and 20 fall under the category of low, medium and high density, respectively indicating that few districts are in high category unlike small ruminants where large number of districts are under high density. The density of large ruminants is high mostly in Rajasthan, UP, Bihar and Jharkhand (Table 5.3). High density with corresponding low natural resource index calls for immediate attention as it is likely to further deteriorate the resource base. The high population density is manageable wherever resources are better like in Bihar and Jharkhand. The interventions

Prioritization of Rainfed Areas in India 53
Fig. 5.2 Natural resource index vis-à-vis large ruminants density

Prioritization of Rainfed Areas in India54
Table 5.5: Classification of states based on milk productivity of cow and buffaloProductivity (kg/day) StatesCow Low
(<2.7)Assam, Chhattisgarh, Himachal Pradesh, Jharkhand, Maharashtra, Madhya Pradesh, Orissa, Uttar Pradesh, Uttarkhand, West Bengal
High (>2.7)
Andhra Pradesh, Bihar, Gujarat, Haryana, Karnataka, Kerala, Punjab, Rajasthan, Tamil Nadu
Buffalo Low (<3.5)
Assam, Himachal Pradesh, Karnataka, Madhya Pradesh, Orissa
High (>3.5)
Andhra Pradesh, Bihar, Chhattisgarh, Gujarat, Haryana, Jharkhand, Kerala, Maharashtra, Punjab, Rajasthan, Tamil Nadu, Uttar Pradesh, Uttarkhand, West Bengal
(Source of data : Dept. of Animal Husbandry & Dairying-http://www.dahd.nic.in)
need to be planned keeping in view the density and resource base and some of the options are discussed in Table 5.4.
Table 5.4: Scope of interventions based on large ruminants’ density and natural resources index (NRI)
NRI Large ruminants density (No./km2)Low (<78) Medium (78-139) High (>139)
Low Effort to be made for improving natural resource base without increasing the number to make the enterprise sustainable
Sustaining the resource base should receive priority and efforts to be made for location- specific soil and water conservation measures and growing of fodder crops.
Number to be reduced, culling out of non-descript animals and breed improvement
Medium As resource is better and number is low, efforts to be made for introducing improved grasses and legumes for improving productivity
Agroforestry and soil & water conservation and improvement of CPRs
More area to be brought under cultivated fodders plus breed improvement
High A good scope for practicing integrated farming systems approach as resources are rich and number is low
Integrated farming systems approach by growing crops whose byproduct supports livestock
A good scope for dairy industry and necessary support mechanism to be extended. Also efforts to be made for productivity enhancement and breed improvement.
5.3 milk Productivity and Production PotentialThe milk productivity of cow and buffalo varies from 0.3 to 10.3 and 0.5 to 22.4 kg per day, with an average milk yield of 3.0 and 4.3 kg/day, respectively (based on 156 districts data from 10 states). This indicates very high variability in milk productivity of buffalo than cow; however demand for water by buffalo is more than cow. Milk productivity less than 2.70 and 3.54 kg/day of cow and buffalo, respectively was considered as low while more than that as high based on 50 percentile values. A list of States indicating low and high productivity of milk by cow and buffalo is set out in Table 5.5 while names of districts among the prioritized ones for whose data are available in Tables 5.6 & 5.7 in relation to NRI.

Prioritization of Rainfed Areas in India 55
Table 5.6: Relationship between natural resources index (NRI) and milk productivity of cow across selected prioritized districts of India
NRI Milk productivity*(kg/day)
State Districts
Low Low AP Adilabad, Anantapur, Cuddapah, Kurnool, Mahabubnagar, Prakasam, Ranga Reddy
Gujarat Amreli, Jamnagar, Junagadh, Kutch, Rajkot, SurrendranagarKarnataka Belgaum, Bellary, Bidar, Gulbarga, TumkurMaharashtra Amravati, Beed, Buldhana, Dhule, Jalna, Latur, Nanded,
Nasik, Osmanabad, Solapur, YavatmalTamil Nadu Coimbatore, Dharmapuri
High Gujarat Ahmedabad, Banaskantha, Bhavnagar, Panchmahal
Karnataka Bijapur, Chitradurga, Kolar, RaichurMaharashtra Ahmednagar, Pune, SangliTamil Nadu Salem
Medium Low AP Vishakapatnam
Orissa Bolangir, KalahandiWest Bengal Cooch Behar, Pururlia
High - -
High Low Orissa Koraput, Phulbani (Kandmahal)
High -
* Low = <2.7 kg/day, High= >2.7 kg/day(Source of data: INARIS data warehouse, IASRI, New Delhi. The data were available for 156 districts of 10 states only)
Table 5.7: Relationship between natural resources index (NRI) and milk productivity of buffalo across selected prioritized districts of India
NRI Milk productivity*(kg/day)
State Districts
Low Low AP Adilabad, Anantapur, Cuddapah, Kurnool, Mahabubnagar, Prakasam, Ranga Reddy
Gujarat Jamnagar, Karnataka Bellary, Bidar, Gulbarga, TumkurMaharashtra Amravati, Beed, Latur, Nanded, Osmanabad, Solapur,
YavatmalTamil Nadu Coimbator, Dharmapuri
High AP ChittoorGujarat Ahmedabad, Amreli, Banaskantha, Bhavnagar, Junagadh,
Kutch, Panchmahal, Rajkot, Surendranagar Karnataka Belgaum, Bijapur, Chitradurga, Kolar, RaichurMaharashtra Ahmednagar, Buldhana, Dhule, Jalna, Nasik, Pune, SangliTamil Nadu Coimbatore, Salem
Medium Low Orissa Bolangir, KalahandiWest Bengal Pururlia
High AP VishakapatnamWest Bengal Cooch Behar
High Low Orissa Phulbani (Kandmahal)High Orissa Koraput
* Low = <3.5 kg/day, High= >3.5 kg/day

Prioritization of Rainfed Areas in India56
Livestock productivity is constrained by lack of adequate feed and fodder availability and its poor quality besides high incidence of diseases. Several schemes are under implementation to address various types of CPRs.
5.3.1 milk Production Potential
District-wise milk production potential is set out in Annexure-IV alongwith natural resource index (NRI). Districts having medium to high NRI and medium to high milk production potential deserve preference over other districts for promotion of dairy as an enterprise.
5.4 meeting fodder needs during Lean seasonCrop production in uncertain rainfall areas is risky. Low and unstable yields are common and so is the income of dryland farmers. For imparting stability and providing sustainability to the farming systems, a tree-crop-livestock integration holds promise. Alley cropping, one of the options of agroforestry systems can meet the multiple requirements of food, fodder, fuel, fertilizer, etc., besides improved pasture management.
A major shortcoming of most of the common pastures is lack of production during hot summer lean period. A traditional way to overcome this is to use tree leaf fodder during summer. In the pasture lands, lot of trees are seen growing, but these are of least consequence in forage production. If these trees are replaced with top-feed trees species, they would supplement tree leaf fodder during the summer months and thus prolong the grazing period and improve animal productivity of the pasture. More than 60% of the fodder requirement of the goats in India is normally met with shrubs and tree fodder. All the tropical and subtropical grasses, owing to their faster rate of growth during the monsoon provide grazing for the livestock, mainly during rainy and post-rainy seasons. During the lean periods of spring and summer, tree-tops especially Leucaena, Acacia, Gliricidia, Neem etc., come to the rescue of the livestock owners. The young leafy succulent material provides crude protein and minerals, which serves as a concentrate. In view of the above, integrating fodder and fruit trees in terms of silvopastoral and horti-pastoral systems hold promise for non-arable and arable lands, respectively.
5.5 options for improving common Pool resources (cPrs)
5.5.1 Grazing land
Livestock production is one of the main occupations of resource-poor. Common grazing lands have always played a major role in livestock production system. Currently grazing lands are in highly degraded condition and encroachment is rampant. Permanent pastures and grazing lands in India are spread over an area of 11.8 million ha. About one million ha of land in semi-arid region is under degraded pasture/grazing land. There is drastic reduction in common pool grazing lands in most states due to encroachment and privatization.

Prioritization of Rainfed Areas in India 57
Grazing lands in the semi-arid region can be categorised as permanent pastures, areas under tree crops and groves, fallow lands, and areas unsuitable for cultivation and belonging to the village panchayat, the state revenue department or forest department, or a religious trust. Farmers’ fields become another major grazing resource after harvesting of crops and are mostly under open access regime. The productivity of common pool grazing lands is hardly one-third to one-fifth of the privately owned pastures.
Privatization and distribution of land is resulting in the decline of area under common grazing lands. Encroachment of grazing lands has taken place through both legal and illegal means. Currently, many watershed development projects aim to revive the productivity of common grazing lands (public/private). No effective management systems are in vogue and Panchayati Raj Institutions are not actively associated. Attempts by agencies like IFFCO and NDDB in reviving CPRs through silvipasture and other agroforestry models with grassroot level cooperatives need to be encouraged.
5.5.2 forests
It is difficult to separate the causes from the effects of deforestation and forest degradation. Some direct causes of deforestation are land clearances for agriculture (including shifting cultivation), other land use changes including unplanned urbanization, land transfers, different forms of encroachments, over-grazing, uncontrolled and wasteful logging, illegal felling, and excessive fuelwood collection. The area under degraded notified forestland that forms the second largest category of wastelands in India (NRSA, 2000) is mostly either under state property regime or open access regime. Semi-arid region has an area of 8.2 m ha degraded notified forestland and it is spread over 183 districts. This area is subjected to high biotic and abiotic stress and needs suitable management system and higher investment. Undesirable shrubs can have an adverse impact on herbage yield of the CPRs due to their higher magnitude of infestation by reducing the open space for the grasses to grow. The degraded forest area is mostly covered with Prosopis juliflora or by poor quality grass species when verified on ground in a study conducted in Andhra Pradesh (Hebbar, et al., 1993). There is a growing concern among people of semi-arid region due to rapid colonisation of degraded forest/wastelands by P. juliflora leading to reduced availability of grass in Bhavnagar (Gujarat) and lowering of water table in Anantapur (Andhra Pradesh). Management of fringe forest areas with soil and moisture conservation measures and raising tree/grass fodder for augmenting water supplies and fodder availability for villagers hold promise.
5.5.3 tank beds
Village tanks are one type of Common Pool Resources (CPR), which still exist, despite the fact that the encroachment is rampant. Tanks occupy 2 to 5 per cent of the total geographical area in a study in Andhra Pradesh (Ramakrishna et al., 2006). The water is used mainly for irrigation and for drinking water for cattle, washing clothes and religious purposes.

Prioritization of Rainfed Areas in India58
However, due to continuous siltation and reduced flows from the catchment areas, these tanks now remain dry for most part of the year and are serving as percolation pond. In semi-arid areas, more than half the tank bed becomes empty as the water recedes due to evaporation or used up for cultivation. Due to silt deposition, these tank beds are fertile and retain adequate moisture in the soil profile for cultivation of short duration annual fodder crops.
5.5.4 management systems and strategies of cPrs
Livestock do not graze on all plant species equally and they concentrate on the most palatable and nutritious first, thus intensive grazing can lead to the disappearance of beneficial species. The practice of let loose free grazing has to be changed to stall feeding and rotational grazing. The grazing management is done by three ways: 1) managing the number of livestock per hectare of CPRs (called the stocking rate), 2) managing the location and timing of grazing and 3) the placement of watering sites and salt blocks, which can spread grazing more evenly over the CPRs. The single most important factor is the stocking rate, because it directly influences the total amount of forage removal from the CPRs. Deferred rotational grazing system is superior and results in greater number of animal days as compared to continuous system approach. Rotational grazing has steadily gained the popularity over the last two decades because it offers better control over livestock distribution and feeding patterns. An attempt has been made to identify problems, causative factor and suitable remedial measures have been suggested (Table 5.8).
Table 5.8: Identified constraints to low productivity of CPRsProblem Causative factor Remedial measuresPoor regeneration of forages species
Severe damage due to over -grazing and stampede
Rotational and restricted grazing
Low forage production Low yielding annual grass species and competition by unpalatable shrubs and trees
Reseeding of high yielding perennial grass species and bush clearing
Low nutritive value of the forage Lack of legume forage species Seeding of legumes like Stylo just before onset of monsoon and application of P as basal dose
Non-availability of green fodder during lean period
Very few tree species suitable as top feed in CPRs
Development of silvopastoral system

Prioritization of Rainfed Areas in India 59
Table 6.1. Classification of districts for prioritizing investmentNRI ILI Number of districts within the
top 167 prioritized districts based on RAPI score
Districts having high potential for investment and category in
parenthesesLow Low 18 -Low Medium 64 -Low High 35 -Medium Low 30 30 (II)Medium Medium 3 3 (III)Medium High 0 NAHigh Low 17 17 (I)High Medium 0 NAHigh High 0 NATotal 167 50
NA: Not available as no district falls under this category among the top one-third (167) prioritized districts
6. deveLoPment PersPective and PoLicy issues
There is always limitation of funds which cannot be thinly spread over all the districts of the country for any developmental activity. Therefore, prioritization is important for allocating resources. An attempt was made to shortlist the rainfed districts that can give higher marginal rate of returns on investments and have the potential for development based on underutilized natural resources and lower livelihood indices. Among the top one-third districts (167) identified based on high RAPI score, 50 have been shortlisted as the high potential districts based on unexploited natural resources for investment on various interventions. These districts were further grouped into 3 classes (I, II and III) (Fig. 6.1 & Table 6.1) based on medium to high NRI and low to medum ILI. The potential for development is high in these districts as the available resources are not effectively accessed and/or used for the agricultural productivity enhancement as well as livelihoods opportunities. The marginal return from the investments in the above identified 50 districts is expected to be higher in terms of bridging the yield gap and improving the livelihoods. This will also enable higher foodgrain production for meeting the increased demand for food security.
There is a need to come up with new policy guidelines and developmental strategies in relation to natural resources and livelihoods status. It is observed that in India natural resources and livelihoods status are inversely related. Poverty is high in areas with high natural resources indicating scope for improving the livelihoods through better access to natural resources and a need for enabling mechanism and support services.

Prioritization of Rainfed Areas in India60
Table 6.2(a) Districts having potential (high NRI and low ILI)S.No. Name of the
stateName of the district Major rainfed crop Small
ruminant density
Milk production potential
1 Assam Kokrajhar Rice (M) L H2 Bihar Champaran (West) Rice (L) M L3 Bihar Gopalganj Rice (M) H L4 Bihar Jamui Rice (M) H L5 Bihar Kishanganj Rice (M) H L6 Jharkhand Girdih Rice (H) H H7 Jharkhand Gadhwa Rice (L) M H8 Jharkhand Devgarh Rice (H) H M9 Jharkhand Sahebganj Rice (M) H M10 Jharkhand Pakur Rice (M) H M11 Jharkhand Bokaro Rice (M) H M12 Orissa Gajapati Rice (M) L H13 Orissa Phulbani (Kandhamal) Rice (M) L H14 Orissa Rayagada Rice (M) L M15 Orissa Nawarangpur Rice (M) L H16 Orissa Malkangiri Rice (M) L H17 Orissa Koraput Ragi (L) L H
There is higher scope for land use diversification and crop intensification in areas having medium to high NRI and low or medium ILI. Agricultural development should receive high priority in areas having medium or high NRI irrespective of ILI. This calls for support services in the form of technology, infrastructure, credit, capacity building, forward and backward linkages, etc. Rather than individual components, packaging of the technologies in an integrated manner is the need of hour and single window services need to be explored. Areas having low NRI deserve creation of off-farm employment opportunities with focus on landuse diversification, micro-enterprises and industrialization.
Rice crop is associated with 38 districts among the 50 districts identified above, followed by chickpea (6), ragi (2) and one each of bajra, maize, wheat and blackgram (Tables 6.2 a, b & c). All the rice growing districts possess medium to high NRI and low ILI with low to medium productivity level except in four districts. The productivity enhancement of rice should form the main agenda in these districts in a farming system mode for ensuring food and livelihood security. There is an ample possibility of improving rural livelihoods through water harvesting in the form of on-farm reservoirs (OFRs) by integrating rice-fish-duck/pig system or by raising fodder for milch animals and following multiple water use based farming systems.
In case of livestock, there is scope for promoting small ruminants wherever the density is low to medium and large ruminants (milch animals) in districts having medium to high milk production potential. There is a need to practice semi-intensive grazing techniques for small ruminants while breed improvement in case of large ruminants. The area under

Prioritization of Rainfed Areas in India 61
Fig. 6.1 Shortlisted districts having high potential for development and livelihoods security

Prioritization of Rainfed Areas in India62
Table 6.2(b) Districts having medium potential (medium NRI and low ILI)S.No. Name of the
stateName of the district Major rainfed crop Small ruminant
densityMilk production
potential1 Assam Karbi-Anglong Rice (M) L H2 CG Jashpur Rice (L) M H3 CG Raj Nandgaon Rice (M) L H4 CG Dantiwara Rice (L) L H5 Jharkhand Dumka Rice (M) H H6 Jharkhand Ranchi Rice (M) H H7 Jharkhand Gumla Rice (M) M H8 Jharkhand W. Singbhum Rice (M) M H9 Jharkhand E. Singbhum Rice (M) H H10 Jharkhand Palamu Rice (M) M H11 Jharkhand Godda Rice (H) H M12 MP Dindori Rice (L) L H13 MP Seoni Rice (L) L H14 MP Mandla Rice (L) L H15 MP Panna Rice (L) L H16 Orissa Bolangir Rice (L) M M17 Orissa Kalahandi Rice (L) M H18 UP Bahraich Rice (M) H H19 UP Basti Rice (M) M M20 UP Sonbhadra Rice (L) M H21 W. Bengal Cooch Behar Rice (M) H M22 W. Bengal Purulia Rice (H) H H23 MP Sheopur Kalan Bajra (M) L H24 Gujarat Dahod Maize (M) H M25 MP Chattarpur Chickpea (L) M H26 MP Sagar Chickpea (L) L H27 MP Damoh Chickpea (L) L H28 UP Mahoba Chickpea (L) M H29 UP Chitrakot Chickpea (M) M M30 UP Lalitpur Blackgram (M) L M
fodder production needs to be enhanced from currently 5% to 10% to cater the demand of livestock with change in food habits and more demand for milk and meat products. The integrated farming systems approach calls for development of infrastructure and needed support systems. The on-going and new programmes should focus in these districts on enabling mechanisms for improved access to natural resources and needed support systems.
The policy aspects of grazing lands have not been addressed in the recent past either at national or state levels. There is an urgent need for action towards a sustainable feed, fodder and grazing land development policy, which will also have implications for institutionalising development of common lands with a regional and farmer focus.

Prioritization of Rainfed Areas in India 63
It is evident from the analysis of ISPA (1997) that policy interventions remained largely unrealized. There is a large gap between policies and programmes to tackle the issue of dependence on common lands for fodder.
Table 6.2(c) Districts having low potential (medium NRI and medium ILI)S. NO.
Name of the state
Name of the district Major rainfed crop Small ruminant density
Milk production potential
1 AP Vishakapatnam Ragi (M) M M2 MP Vidisha Wheat (M)* L H3 UP Fatehpur Chickpea (M) H M

Prioritization of Rainfed Areas in India64
concLusions
Earlier attempts for prioritization of rainfed regions for region-specific planning largely considered climatic or bio-physical criteria for identifying the targeted regions. It is now realized that this approach has by-passed several other deserving areas, which have a favourable natural resource endowment but remained under-developed due to poor infrastructure and socio-economic status. Therefore, in this study, an integrated approach was followed for prioritization of rainfed districts in India. The study has come up with a new criterion called Rainfed Areas Prioritization Index (RAPI), which integrates the natural resource and socio-economic endowments of a district. Two separate indices viz., Natural Resource Index (NRI) and Integrated Livelihood Index (ILI) were developed for each district separately and integrated as RAPI assigning two-third and one-third weights, respectively.
Accordingly, most of the rural districts covered under Census 2001 have been considered for prioritization and the top one-third districts (167) based on high RAPI score are considered as high priority districts. Among the top one-third districts, 50 have been identified as the most deserving districts that need immediate attention as these districts are resource-wise rich but livelihood status is poor. The marginal return from the investments in these districts is expected to be higher in terms of bridging the yield gap and improving the livelihoods as well as addressing the issue of food security.
As anticipated, several districts in western part of the country have emerged as high priority districts mainly due to poor natural resource base. Many districts with high RAPI score are having low NRI and low to medium ILI. These districts have been receiving good investments on NRM for quite some time. However, our study indicates that these districts require continued attention in terms of NRM, particularly in-situ and ex-situ water harvesting, controlling soil loss and land degradation and rational use of groundwater. Due to high grazing intensity, the CPRs have been completely degraded in these areas. Some improvements in grazing management are urgently needed. For sustaining productivity, diversified land use and efficient cropping patterns which require less water have to be promoted in these areas, if necessary through policy instrument of incentivization.
On the other hand, several traditionally rice producing districts in eastern states, though having high NRI have now figured in high priority districts due to very low ILI. Immediate attention on extensive human and social capital building and infrastructure development is needed in these districts for enabling access to natural resources. We cannot isolate rainfed agriculture development from the overall development of a region. Hence,

Prioritization of Rainfed Areas in India 65
massive investments are needed here on infrastructure, value addition, access to market, communication, extension and capacity building of the communities.
In districts with medium NRI and ILI, equal focus is needed on both. The main focus should be on investments in maintaining the NR status and improving ILI. It is hoped that this study will help in channelizing future developmental efforts in rainfed areas in a more systematic and scientific way with area targeted approach.
The outcome of this study in terms of ranking of districts must be considered keeping view of the methodology adopted and limitation of available district level data. This should be considered as a suggestive proposition.

Prioritization of Rainfed Areas in India66
references
CGWB 2006. Dynamic Ground Water Resources of India (As on March 2004). Central Ground Water Board, Ministry of Water Resources, Govt. of India
Das, H.P. and Kore, P.A. 2003. Pattern of rainfall variability over dry farming zone of India and its agricultural implications. Mausam, 54 (2): 471-476
Deoghare, P. R. 1997 Sustainability of on-farm income and employment through livestock production in Mathura district of Uttar Pradesh. Indian Journal of Animal Sciences, 67:916-919
Dwivedi, R. P. and Ramana, D.B.V. 2002. Livestock production through grassland management. Employment News XXVII (11): 1-2.
F.A.O. 2000. Agriculture Towards 2015/30. Technical Interim Report, April 2000. Economic and Social Department, FAO, Rome.
GOI. 2005. Annual Report 2004-05, Department of Animal Husbandry, Dairying and Fisheries, Ministry of Agriculture, Government of India, New Delhi, India.http://www.dahd.nic.in/rep/Annual%20Report%202004-5%20(English).pdf
Gore P.G., Thakur Prasad and Hatwar. H.R. 2010. Mapping of drought areas over India. National Climate Centre Research Report No. 12/2010. Indian Meteorological Department. Pune, pp:25
Hebbar, B.G. Gurumurthy, Krishnappa, K.M. and Dhanapal, G.N. 1993. A pilot study on the Determination of Extent of Wastelands, Verification on Ground, Present Use and Development Options in Andhra Pradesh. Regional Centre, National Afforestation and Eco-Development Board, Bangalore, Publication No. 26, pp:59
http://www.indiawaterportal.org
http://eands.dacnet.nic.in
ICAR 2010. Degraded and Wastelands of India: Status of Spatial Distribution. Indian Council of Agricultural Research, New Delhi, pp:158
ISPA 1997. Livestock Feeding Situation in Andhra Pradesh: Options for Improvement, Report No. 22/97, August 1997, Indo Swiss Project Andhra Pradesh, India
Khanna, S.S., 1989. The agro-climatic approach. In: Survey of Indian agriculture, 1989. The Hindu, Madras, India. pp.28-35.

Prioritization of Rainfed Areas in India 67
Mandal, C., Mandal, D.K., Srinivas, C.V., Sehgal, J. and Velayutham, M. 1999. Soil-Climatic Database for Crop Planning in India. National Bureau of Soil Survey and Land Use Planning (NBSS & LUP), Technical Bulletin No. 53, Nagpur, India, pp:994
Misra A. K., Reddy B. M. K., Rekha M. S., Reddy, G. S. and Singh, H. P. 2000. Sheep and goat farming in rainfed areas: Constraints and options for improvement on smallholder production systems. In: Thomas, C.K and Sastry, N.S.R. (Eds): Smallholder livestock production in developing courtiers. KAU, Thrissur, pp. 133-144.
MoRD. 1994. Report of the Technical Committee on Drought Prone Areas Programme and Desert Development Programme. Ministry of Rural Development, Govt. of India.
Nagar A.L. and Basu S.R. 2002. Weighting socio-economic indicators of human development –Latent variable approach, in Ullah A. et al. (eds.) Handbook of applied econometrics and statistical inference. Marcel Dekker, New York.
NATP. 2004. Rainfed Agro-Ecosystem, Production Systems Research, Completion Report (1999-2004), National Agricultural Technology Project, Central Research Institute for Dryland Agriculture, CRIDA, Hyderabad, pp:202
NRSA. 2000. Wasteland Atlas of India. National Remote Sensing Agency, Department of Space, Government of India, Balanagar, Hyderabad. pp:81.
Parthasarthy Rao, P., Brithal, P. S. and Ndjeunaga, J. 2005. Crop-Livestock Economies in the Semi-arid Tropics: Facts, Trends and Outlook. Patancheru 502 324, Andhra Pradesh, India. ICRISAT. 68pp.
Ramakrishna, Y.S., Osman, M. and Wani, S.P. 2006. Tank beds as source of livelihoods for poor and need of policy support – case studies of Andhra Pradesh. Paper presented in National Workshop on Rejuvenating tanks for sustainable livelihoods – Emerging trends, August 3-4, 2006, WWF-ICRISAT project, ICRISAT, Patancheru.
Rangnekar, D.V. 2006. Livestock and livelihoods of the underprivileged communities in India: A review. International Livestock Research Institute, Nairobi, Kenya. 72 pp.
Sarkar, R.P., Biswas, B.C. and Khambeter, N.N. 1982. Probability analysis of short period rainfall in dry farming tract in India. Mausam, 33 (3): 269-284
Soman, M.K. and Kumar, K.K. 1990. Some aspects of daily rainfall distribution over India during the south-west monsoon. Int. J. Climatology, 10:229-311
Sehgal, J. Mandal, D.K., Mandal, C. and Vadivelu, S. 1992. Agro-ecological regions of India, NBSS&LUP, Bulletin No. 24, 1992
Sehgal, J., 1995. Soil resource mapping and agro-ecological zoning for land use planning. India perspective Indian farming, January, 1995, p.15-21.
Singh, H. P., Sharma, K .D., Reddy, G. S. and Sharma, K. L. 2004. Dryland agriculture in

Prioritization of Rainfed Areas in India68
India. In: Challenges and strategies for dryland agriculture. CSSA Special Publication no. 32. Madison, USA pp. 67-92
Thomas, D. and Rangnekar, D. V. 2004. Responding to the increasing global demand for livestock products: Implications for the livelihoods of the livestock producers in developing countries. British Society of Animal Sciences, Occasional Publication 33:1-36.
Working Group on Animal Husbandry and Dairying of the Planning Commission in its Report .2002. Ministry of Animal Husbandry and Dairying, Government of India, New Delhi.
World Bank, 1999. India: Livestock sector review: Enhancing growth and development. The World Bank and Allied Publishers: New Delhi.

Prioritization of Rainfed Areas in India 69
annexure-i
Legend description for the agro-ecological sub-regions map
1 Western Himalayas, cold arid eco-region 1.1 Eastern aspect of Ladakh Plateau, cold, hyper-arid eco-
subregion (ESR)1.2 Western Aspect of Ladakh Plateau and north Kashmir
Himalayas, cold to cool, typic-arid ESR2 Western Plain, Kachchh and part of Kathiawar
Peninsula, hot arid eco-region 2.1 Marusthali hot, hyper arid ESR2.2 Kachchh Peninsula (Great Rann of Kutch as inclusion),
hot hyper-arid ESR2.3 Rajasthan Bagar, North Gujarat Plain and South-Western
Punjab Plain, hot typic-arid ESR2.4 South Kachchh and North Kathiawar Peninsula, hot arid
ESR3 Deccan plateau, hot arid ecosubregion 3.0 Karnataka Plateau (Rayalseema as inclusion), hot arid
ESR4 Northern Plain (and Central Highlands) including
Aravallis, hot semi-arid ecoregion 4.1 North Punjab Plain, Ganga-Yamuna Doab and Rajasthan
Upland, hot semi-arid ESR4.2 North Gujarat Plain (inclusion of Aravalli range and east
Rajasthan Uplands), hot dry semiarid ESR4.3 Ganga Yamuna Doab, Rohilkhand and Avadah Plain, hot
moist semi-arid ESR4.4 Madhya Bharat Plateau and Bundelkhand Uplands, hot,
moist semi-arid ESR5 Central (Malwa) Highlands, Gujarat plains and
Kathiawar Peninsula Ecoregion 5.1 Central Kathiawar Peninsula, hot, dry semiarid ESR5.2 Madhya Bharat Plateau, Western Malwa Plateau,
Eastern Gujarat Plain, Vindhyan and Satpura range and Narmada Valley, hot moist semi-arid ESR
5.3 Coastal Kathiawar Peninsula, hot moist semi-arid ESR6. Deccan Plateau, hot semi-arid eco-region 6.1 South Western Maharashtra and North Karnataka
Plateau, hot dry semi-arid ESR6.2 Central and Western Maharashtra Plateau and North
Karnataka Plateau and North Western Telangana Plateau, hot moist semi-arid ESR
6.3 Eastern Maharashtra Plateau, hot moist semi-arid ESR6.4 North Sahyadris and Western Karnataka Plateau, hot dry
subhumid ESR7. Deccan Plateau (Telangana) and Eastern Ghats, hot
semi-arid ecoregion 7.1 South Telangana Plateau (Rayalseema) and Eastern
Ghat, hot dry semi-arid ESR7.2 North Telangana Plateau, hot moist semi-arid ESR7.3 Eastern Ghat (South), hot moist semi-arid/dry subhumid
ESR
11 Chattisgarh/Mahanadi Basin Agro-eco-region11.0 Moderately to gently sloping Chattisgarh/
Mahanadi Basin, hot moist/dry subhumid transitional ESR
12 Eastern Plateau (Chhotanagpur) and Eastern Ghats, hot subhumid eco-region
12.1 Garjat Hills, Dandakaranya and Eastern Ghats, hot moist subhumid ESR
12.2 Eastern Ghats, hot moist subhumid ESR 12.3 Chhotanagpur Plateau and Garjat Hills, hot, dry
subhumid ESR 13 Eastern Plain, hot subhumid (moist) ecoregion 13.1 North Bihar and Avadh Plains, hot dry to moist
subhumid transitional ESR 13.2 Foothills of Central Himalayas, warm to hot moist
subhumid ESR 14.Western Himalayas, warm subhumid (to humid
with inclusion of perhumid) ecoregion 14.1 South Kashmir and Punjab Himalayas, cold and
warm by dry semi-arid/dry subhumid ESR 14.2 South Kashmir and Kumaun Himalayas, warm
moist to dry subhumid transitional ESR 14.3 Punjab Himalayas, warm humid to perhumid
transitional ESR14.4 Kumaun Himalayas, warm humid to perhumid
transitional ESR14.5 Foothills of Kumaun Himalayas (Subdued), warm
moist subhumid ESR 15. Assam and Bengal Plain, hot subhumid to
humid (inclusion of perhumid) eco-region 15.1 Bengal basin and North Bihar Plain, hot moist
subhumid ESR15.2 Middle Brahmaputra Plain, hot humid ESR 15.3 Teesta, lower Brahmaputra Plain and Barak
Valley, hot moist humid to perhumid ESR15.4 Upper Brahmaputra Plain, warm to hot perhumid
ESR
16.Eastern Himalayas, warm perhumid eco-region 16.1 Foot-hills of Eastern Himalayas (Bhutan foot-
hills), warm to hot perhumid ESR 16.2 Darjeeling and Sikkim Himalayas, warm perhumid
ESR 16.3 Arunachal Pradesh (Subdued Eastern
Himalayas), warm to hot perhumid ESR 17.North-eastern Hills (Purvachal), warm perhumid
eco-region 17.1 Meghalaya Plateau land Nagaland Hill, warm to
hot moist humid to perhumid ESR 17.2 Purvachal (Eastern Range), warm to hot
perhumid ESR

Prioritization of Rainfed Areas in India70
8. Eastern Ghats and Tamil Nadu Uplands and Deccan (Karnataka) Plateau, hot semiarid eco-region
8.1 Tamil Nadu Uplands and Leeward Flanks of South Sahyadris, hot dry semi-arid ESR
8.2 Central Karnataka Plateau, hot moist semi-arid ESR8.3 Tamil Nadu Uplands and Plains, hot moist semi-arid ESR9. Northern Plain, hot subhumid (dry) eco-region 9.1 Punjab and Rohilkhand Plains, hot dry/moist subhumid
transitional ESR9.2 Rohilkhand, Avadh and south Bihar Plains, hot dry
subhumid ESR10 Central Highlands (Malwa and Bundelkhand), hot
subhumid (dry) eco-region 10.1 Malwa Plateau, Vindhyan Scarpland and Narmada
Valley, hot dry subhumid ESR10.2 Satpura and Eastern Maharashtra Plateau, hot dry
subhumid ESR10.3 Vindhyan Scarpland and Bundelkhand Plateau, hot dry
subhumid ESR10.4 Satpura range and Wainganga Valley, hot moist
subhumid ESR
18.Eastern Coastal Plain, hot subhumid to semiarid ecoregion
18.1 South Tamil Nadu Plains (Coastal), hot dry semi-arid ESR
18.2 North Tamil Nadu Plains (Coastal), hot moist semi-arid ESR
18.3 Andhra Plain, hot dry subhumid ESR 18.4 Utkal Plain and East Godavari Delta, hot dry
subhumid ESR18.5 Gangetic Delta, hot moist subhumid to humid
ESR 19.Western Ghats and Coastal Plain, hot humid-
perhumideco-region 19.1 North Sahyadris and Konkan Coast, hot humid
ESR 19.2 Central and South Sahyadris, hot moist subhumid
to humid transitional ESR 19.3 Konkan, Karnataka and Kerala Coastal plain, hot
humid to per humid transitional ESR 20. Islands of Andaman-Nicobar and Lakshadweep,
hot humid to perhumid island ecoregion 20.1 Andaman and Nicobar group of Islands, hot
perhumid ESR20.2 Level Lakshadweep and group of Island, hot
humid ESR

Prioritization of Rainfed Areas in India 71
annexure –ii
Principal component analysis (Pca)
The weights used for constructing NRI and ILI were derived by subjecting the data to the Principal component analysis (PCA) after appropriate scaling and normalization of data set. PCA is a multivariate technique applied to a single set of variables to discover which sets of variables in the set form coherent subsets that are relatively independent of one another. Most of the times, the variables under study are highly correlated and as such they are effectively “saying the same thing”. To examine the relationships among a set of p correlated variables, it may be useful to transform the original set of variables to a new set of uncorrelated variables called principal components. These new variables are linear combinations of original variables and are derived in decreasing order of importance.
Let x1, x2, x3, . . . , xp be variables under study, then first principal component may be defined as
P1 = a11 x1 + a12 x2 + ...... + a1p xp
such that variance of P1 is as large as possible subject to the condition that
a112 + a12
2 + ..... + a1p2 = 1
This constraint is introduced because if this is not done, then Var(P1) can be increased simply by multiplying any a1j’s by a constant factor. The second principal component is defined as
P2 = a21 x1 + a22 x2 + ....... + a2p xp
such that Var(P2) is as large as possible next to Var( P1 )subject to the constraint that
a212 + a22
2 + ....... + a2p2 = 1 and cov(P1, P2) = 0 and so on.
Proceeding, in a similar way, p principal components can be defined with constraints as defined above. The estimates aij s are obtained under these constraints and substituted back to different principal component equations to get principal component scores for each record. It is quite likely that first few principal components account for most of the variability in the original data. If so, these few principal components can then replace the initial p variables in subsequent analysis, thus, reducing the effective dimensionality of the problem. An analysis of principal components often reveals relationships that were not previously suspected and thereby allows interpretation that would not ordinarily result. However, Principal Component Analysis is more of a means rather than an end in itself because this frequently serves as intermediate step in much larger investigations by reducing the dimensionality of the problem and providing easier interpretation.

Prioritization of Rainfed Areas in India72
Nagar and Basu (2002) presented more comprehensive presentation of this approach for development of social indicators. Principal component scores (Pi) are used as weighted linear combinations of the variables selected to compose the social indicators. Here weights are inverse of variance of Principal component scores.
Since the variables were expressed in different units, they have to be normalized. The method used for normalization in this study is rescaling method. As per this method the variables which contribute positively to desired index are normalized by using the following expression.
minmax
min
XX
XX i
−−
Where Xi is the value of a variable for ith district
For variables which contribute negatively to desired index, the normalized score will be
minmax
max
XX
XX i
−−
The resultant scores will vary between 0 and 1.
After normalization, correlation matrix R is computed from normalized variables, followed by solving the determinant equation IR λ− =0 for λ where R is a p x p matrix. This provides a pth degree polynomial equation in λ ’s and hence K roots. These roots are called eigen values of correlation matrix R. Theλ ’s are then arranged in descending order of magnitude, as
1λ >
2λ >….> pλ . Corresponding to each value ofλ , the matrix
equation ( ) 0=− αλIR is solved for the px1 eigenvectors ofα , subject to the condition that 1' =αα (normalization condition.). The index is estimated as weighted average of p principal components (P’s), where the weights are the eigen values of the correlation matrix R, and it is known that
)Pvar(.........)Pvar(),Pvar( p112211 =λ==λ=λ
Thus, the index is:
p
pp PPPI
λλλλλλ
++++++
=12
2211
........
.........
In a nutshell, the estimator of the index is computed as the weighted average of the Principal component scores.

Prioritization of Rainfed Areas in India 73
The weight realized from this method for jth variable may be visualized as
∑∑
∑
= =
==p
j
p
iiji
p
iiji
j
a
aW
1 1
1
λ
λ
which will be applied to standardized variables (Z) to derive the desired index.

Prioritization of Rainfed Areas in India74
annexure-iii
rainfed areas Prioritization index (raPi) and component indices (nri & iLi)
State District NRI ILI RAPI Priority Rank
Rajasthan Barmer 0.0000 0.2293 0.9236 1
Rajasthan Jaisalmer 0.1192 0.2375 0.8414 2
Rajasthan Bikaner 0.0834 0.3902 0.8143 3
Rajasthan Jodhpur 0.1870 0.4706 0.7185 4
Rajasthan Churu 0.2759 0.4616 0.6622 5
Rajasthan Nagaur 0.3305 0.4875 0.6172 6
Andhra Pradesh Anantapur 0.4448 0.5381 0.5241 7
Rajasthan Udaipur 0.5261 0.3801 0.5226 8
Rajasthan Jalore 0.5285 0.4208 0.5074 9
Karnataka Gulbarga 0.5318 0.4237 0.5042 10
Maharashtra Ahmednagar 0.4498 0.6347 0.4885 11
Gujarat Kutch 0.5214 0.5746 0.4609 12
Rajasthan Bhilwara 0.5880 0.4544 0.4565 13
Chhattisgarh Dantiwara 0.8184 0.0000 0.4544 14
Rajasthan Chittorgarh 0.6066 0.4311 0.4519 15
Rajasthan Pali 0.5440 0.5594 0.4509 16
Rajasthan Jhalawar 0.6377 0.3736 0.4503 17
Gujarat Patan 0.5737 0.5029 0.4499 18
Rajasthan Ajmer 0.5679 0.5149 0.4497 19
Rajasthan Tonk 0.6341 0.4104 0.4405 20
Rajasthan Rajsamand 0.6062 0.4731 0.4381 21
Karnataka Chitradurga 0.5916 0.5027 0.4380 22
Gujarat Banaskantha 0.6180 0.4506 0.4378 23
Maharashtra Solapur 0.5412 0.6052 0.4375 24
Karnataka Tumkur 0.5957 0.4979 0.4369 25
Karnataka Bijapur 0.6070 0.4835 0.4341 26
Rajasthan Bundi 0.6430 0.4137 0.4334 27
Rajasthan Banswara 0.7029 0.2984 0.4320 28
Rajasthan Hanumangarh 0.5983 0.5094 0.4314 29
Rajasthan Sikar 0.5618 0.5844 0.4307 30
Andhra Pradesh Cuddapah 0.5638 0.5816 0.4303 31
Gujarat Surendranagar 0.5734 0.5633 0.4300 32
Rajasthan Karauli 0.6657 0.3831 0.4285 33
Rajasthan Sirohi 0.6101 0.4997 0.4267 34
Maharashtra Nasik 0.5600 0.6004 0.4265 35
Madhya Pradesh Jhabua 0.7068 0.3081 0.4261 36

Prioritization of Rainfed Areas in India 75
State District NRI ILI RAPI Priority Rank
Rajasthan Jaipur 0.6159 0.4901 0.4261 37
Madhya Pradesh Dhar 0.6268 0.4733 0.4243 38
Chhattisgarh Sarguja 0.7237 0.2928 0.4199 39
Rajasthan Dholpur 0.6911 0.3842 0.4112 40
Andhra Pradesh Adilabad 0.6743 0.4240 0.4091 41
Gujarat Jamnagar 0.5773 0.6183 0.4090 42
Gujarat Ahmedabad 0.5900 0.5930 0.4090 43
Chhattisgarh Bastar 0.7834 0.2070 0.4087 44
Andhra Pradesh Kurnool 0.6014 0.5801 0.4057 45
Rajasthan Dungarpur 0.7024 0.3783 0.4056 46
Maharashtra Beed 0.6570 0.4778 0.4027 47
Karnataka Raichur 0.7048 0.3855 0.4016 48
Madhya Pradesh Sidhi 0.7547 0.2871 0.4012 49
Rajasthan Sawai Madhopur 0.6942 0.4105 0.4004 50
Madhya Pradesh Ratlam 0.6750 0.4644 0.3952 51
Andhra Pradesh Mahabubnagar 0.6621 0.4920 0.3946 52
Madhya Pradesh Guna 0.7259 0.3726 0.3919 53
Rajasthan Alwar 0.6648 0.4971 0.3911 54
Karnataka Kolar 0.6656 0.4977 0.3904 55
Gujarat Amreli 0.5915 0.6479 0.3897 56
Jharkhand West Singbhum 0.8352 0.1615 0.3894 57
Karnataka Bagalkot 0.6588 0.5154 0.3890 58
Madhya Pradesh Shajapur 0.6847 0.4646 0.3886 59
Madhya Pradesh Rajgarh 0.7160 0.4031 0.3883 60
Maharashtra Yavatmal 0.6857 0.4641 0.3881 61
Karnataka Belgaum 0.6135 0.6119 0.3870 62
Rajasthan Dausa 0.7145 0.4129 0.3861 63
Madhya Pradesh Shahdol 0.7722 0.2975 0.3860 64
Assam Karbi-Anglong 0.7967 0.2509 0.3852 65
Uttar Pradesh Sonbhadra 0.7985 0.2523 0.3836 66
Jharkhand Ranchi 0.8009 0.2492 0.3830 67
Madhya Pradesh Shivpuri 0.7452 0.3610 0.3829 68
Madhya Pradesh Dindori 0.8076 0.2366 0.3827 69
Madhya Pradesh Chhindwara 0.7262 0.3996 0.3827 70
Madhya Pradesh Mandsaur 0.6711 0.5108 0.3823 71
Madhya Pradesh Rewa 0.7628 0.3281 0.3821 72
Madhya Pradesh Barwani 0.7629 0.3429 0.3771 73
Orissa Kalahandi 0.8567 0.1578 0.3763 74
Uttar Pradesh Banda 0.7638 0.3446 0.3759 75
Jharkhand Gumla 0.8484 0.1817 0.3738 76
Madhya Pradesh Ujjain 0.7047 0.4691 0.3738 77
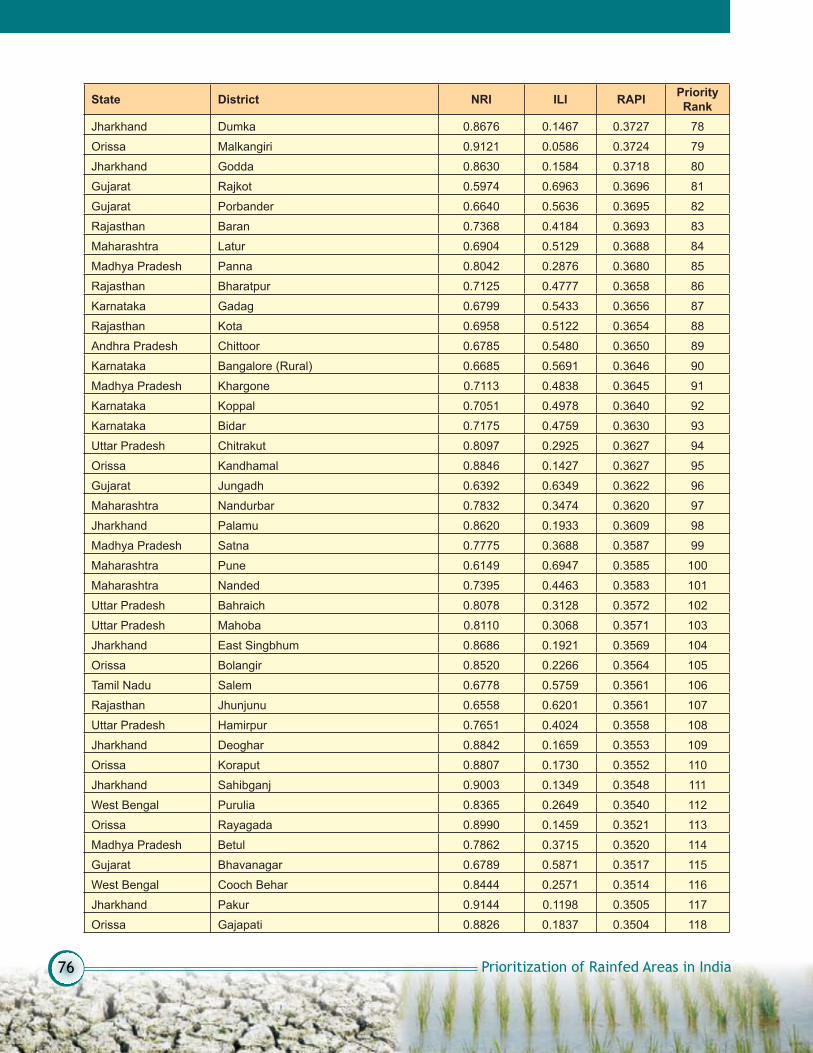
Prioritization of Rainfed Areas in India76
State District NRI ILI RAPI Priority Rank
Jharkhand Dumka 0.8676 0.1467 0.3727 78
Orissa Malkangiri 0.9121 0.0586 0.3724 79
Jharkhand Godda 0.8630 0.1584 0.3718 80
Gujarat Rajkot 0.5974 0.6963 0.3696 81
Gujarat Porbander 0.6640 0.5636 0.3695 82
Rajasthan Baran 0.7368 0.4184 0.3693 83
Maharashtra Latur 0.6904 0.5129 0.3688 84
Madhya Pradesh Panna 0.8042 0.2876 0.3680 85
Rajasthan Bharatpur 0.7125 0.4777 0.3658 86
Karnataka Gadag 0.6799 0.5433 0.3656 87
Rajasthan Kota 0.6958 0.5122 0.3654 88
Andhra Pradesh Chittoor 0.6785 0.5480 0.3650 89
Karnataka Bangalore (Rural) 0.6685 0.5691 0.3646 90
Madhya Pradesh Khargone 0.7113 0.4838 0.3645 91
Karnataka Koppal 0.7051 0.4978 0.3640 92
Karnataka Bidar 0.7175 0.4759 0.3630 93
Uttar Pradesh Chitrakut 0.8097 0.2925 0.3627 94
Orissa Kandhamal 0.8846 0.1427 0.3627 95
Gujarat Jungadh 0.6392 0.6349 0.3622 96
Maharashtra Nandurbar 0.7832 0.3474 0.3620 97
Jharkhand Palamu 0.8620 0.1933 0.3609 98
Madhya Pradesh Satna 0.7775 0.3688 0.3587 99
Maharashtra Pune 0.6149 0.6947 0.3585 100
Maharashtra Nanded 0.7395 0.4463 0.3583 101
Uttar Pradesh Bahraich 0.8078 0.3128 0.3572 102
Uttar Pradesh Mahoba 0.8110 0.3068 0.3571 103
Jharkhand East Singbhum 0.8686 0.1921 0.3569 104
Orissa Bolangir 0.8520 0.2266 0.3564 105
Tamil Nadu Salem 0.6778 0.5759 0.3561 106
Rajasthan Jhunjunu 0.6558 0.6201 0.3561 107
Uttar Pradesh Hamirpur 0.7651 0.4024 0.3558 108
Jharkhand Deoghar 0.8842 0.1659 0.3553 109
Orissa Koraput 0.8807 0.1730 0.3552 110
Jharkhand Sahibganj 0.9003 0.1349 0.3548 111
West Bengal Purulia 0.8365 0.2649 0.3540 112
Orissa Rayagada 0.8990 0.1459 0.3521 113
Madhya Pradesh Betul 0.7862 0.3715 0.3520 114
Gujarat Bhavanagar 0.6789 0.5871 0.3517 115
West Bengal Cooch Behar 0.8444 0.2571 0.3514 116
Jharkhand Pakur 0.9144 0.1198 0.3505 117
Orissa Gajapati 0.8826 0.1837 0.3504 118

Prioritization of Rainfed Areas in India 77
State District NRI ILI RAPI Priority Rank
Tamil Nadu Thoothukudi 0.7067 0.5380 0.3495 119
Gujarat Dahod 0.8033 0.3476 0.3486 120
Maharashtra Amravati 0.6792 0.5964 0.3484 121
Orissa Nawarangpur 0.8928 0.1703 0.3481 122
Madhya Pradesh Mandla 0.8413 0.2748 0.3475 123
Andhra Pradesh Prakasam 0.6944 0.5692 0.3473 124
Jharkhand Giridish 0.8760 0.2062 0.3473 125
Chhattisgarh Jashpur 0.8345 0.2894 0.3472 126
Andhra Pradesh Rangareddy 0.6648 0.6319 0.3461 127
Tamil Nadu Coimbatore 0.6191 0.7272 0.3448 128
Madhya Pradesh Khandwa 0.7477 0.4718 0.3443 129
Uttar Pradesh Basti 0.8176 0.3356 0.3431 130
Karnataka Bellary 0.7296 0.5118 0.3430 131
Rajasthan Ganganagar 0.7172 0.5367 0.3429 132
Madhya Pradesh Sagar 0.8310 0.3137 0.3414 133
Jharkhand Garhwa 0.8950 0.1862 0.3413 134
Madhya Pradesh Dewas 0.7568 0.4629 0.3412 135
Uttar Pradesh Budaun 0.7799 0.4170 0.3411 136
Maharashtra Sangli 0.6235 0.7341 0.3397 137
Maharashtra Dhule 0.6936 0.5942 0.3395 138
Karnataka Chamarajanagar 0.7512 0.4830 0.3382 139
Karnataka Haveri 0.7165 0.5534 0.3379 140
Chhattisgarh Raj Nandgaon 0.8143 0.3580 0.3378 141
Assam Kokrajhar 0.8795 0.2302 0.3369 142
Maharashtra Buldhana 0.7113 0.5671 0.3368 143
Bihar Kishanganj 0.9154 0.1591 0.3367 144
Madhya Pradesh Chhatarpur 0.8313 0.3283 0.3364 145
Madhya Pradesh Vidisha 0.7994 0.3927 0.3361 146
Madhya Pradesh Bhind 0.7762 0.4392 0.3361 147
Tamil Nadu Dharmapuri 0.7118 0.5692 0.3357 148
Madhya Pradesh Seoni 0.8299 0.3333 0.3356 149
Madhya Pradesh Sheopur Kalan 0.8348 0.3235 0.3356 150
Karnataka Davanagere 0.7176 0.5616 0.3344 151
Gujarat Panchmahal 0.7914 0.4170 0.3334 152
Uttar Pradesh Fatehpur 0.8024 0.3952 0.3333 153
Madhya Pradesh Indore 0.6898 0.6227 0.3326 154
Uttar Pradesh Jhansi 0.7755 0.4517 0.3324 155
Maharashtra Osmanabad 0.7174 0.5682 0.3323 156
Tamil Nadu Dindigual 0.6975 0.6091 0.3320 157
Madhya Pradesh Damoh 0.8427 0.3202 0.3315 158
Bihar Gopalganj 0.8830 0.2423 0.3305 159

Prioritization of Rainfed Areas in India78
State District NRI ILI RAPI Priority Rank
Andhra Pradesh Visakhapatnam 0.8054 0.3987 0.3302 160
Maharashtra Jalna 0.7508 0.5101 0.3294 161
Maharashtra Aurangabad 0.7298 0.5532 0.3291 162
Bihar Champaran(West) 0.9085 0.1959 0.3290 163
Jharkhand Bokaro 0.8780 0.2569 0.3290 164
Uttar Pradesh Lalitpur 0.8412 0.3315 0.3287 165
Tamil Nadu Ariyalur 0.7403 0.5360 0.3278 166
Bihar Jamui 0.9164 0.1841 0.3277 167
West Bengal Midnapore 0.8622 0.2935 0.3273 168
Bihar Darbhanga 0.8874 0.2458 0.3265 169
Uttar Pradesh Gonda 0.8229 0.3762 0.3260 170
Jharkhand Chtra 0.9314 0.1610 0.3254 171
Andhra Pradesh Medak 0.7365 0.5509 0.3254 172
Chhattisgarh Kawardha 0.8705 0.2832 0.3253 173
Jharkhand Hazaribag 0.8715 0.2814 0.3252 174
Orissa Mayurbhanj 0.9025 0.2205 0.3248 175
Bihar Banka 0.9248 0.1769 0.3245 176
Chhattisgarh Mahasamund 0.8453 0.3366 0.3243 177
Madhya Pradesh Neemuch 0.7391 0.5493 0.3241 178
Orissa Sundargarh 0.8806 0.2675 0.3237 179
Chhattisgarh Kanker 0.8641 0.3044 0.3225 180
Chhattisgarh Koriya 0.8740 0.2850 0.3223 181
Uttarakhand Tehri Garwal 0.8061 0.4211 0.3222 182
Uttar Pradesh Mirzapur 0.8289 0.3781 0.3214 183
West Bengal Dinajpur (Uttar) 0.9024 0.2318 0.3211 184
Madhya Pradesh Katni 0.8475 0.3438 0.3204 185
Madhya Pradesh Raisen 0.8397 0.3599 0.3202 186
Tamil Nadu Ramanathapuram 0.8016 0.4387 0.3194 187
Orissa Keonjhar 0.8902 0.2623 0.3191 188
Gujarat Sabarkanta 0.7416 0.5627 0.3180 189
Bihar Samastipur 0.8923 0.2616 0.3179 190
Assam Dhubri 0.8947 0.2580 0.3176 191
Haryana Mahendragarh 0.6907 0.6666 0.3173 192
Madhya Pradesh Umaria 0.8721 0.3047 0.3170 193
West Bengal 24-Paraganas (South) 0.8327 0.3837 0.3169 194
Bihar Katihar 0.9295 0.1903 0.3169 195
Bihar Vaishali 0.8968 0.2566 0.3166 196
Gujarat Mehsana 0.6989 0.6528 0.3164 197
Chhattisgarh Bilaspur 0.8641 0.3231 0.3162 198
Uttar Pradesh Kheri 0.8281 0.3957 0.3161 199
Madhya Pradesh Morena 0.8212 0.4094 0.3160 200

Prioritization of Rainfed Areas in India 79
State District NRI ILI RAPI Priority Rank
Bihar Purnea 0.9263 0.2004 0.3157 201
Maharashtra Parbhani 0.7790 0.4953 0.3156 202
Chhattisgarh Raigadh 0.8501 0.3536 0.3154 203
Tamil Nadu Villupuram 0.7641 0.5281 0.3146 204
Assam Barpeta 0.8608 0.3354 0.3143 205
Bihar Araria 0.9342 0.1892 0.3141 206
Bihar Madhubani 0.8932 0.2712 0.3141 207
Uttar Pradesh Shahjahanpur 0.8308 0.3968 0.3139 208
Uttar Pradesh Faizabad 0.7887 0.4817 0.3136 209
Chhattisgarh Durg 0.8214 0.4174 0.3133 210
Madhya Pradesh Sehore 0.8266 0.4100 0.3123 211
Orissa Boudh 0.9465 0.1711 0.3120 212
Bihar Muzafarpur 0.9021 0.2601 0.3119 213
Uttar Pradesh Shravasti 0.8822 0.3013 0.3114 214
Bihar Saran 0.9007 0.2652 0.3111 215
Haryana Sirsa 0.6880 0.6918 0.3107 216
Orissa Deogarh 0.9447 0.1786 0.3106 217
Assam Bongaigaon 0.9019 0.2647 0.3105 218
Orissa Nawapara 0.8976 0.2744 0.3101 219
Uttar Pradesh Agra 0.7668 0.5383 0.3094 220
Assam N C Hills 0.8897 0.2956 0.3083 221
Assam Dhemaji 0.9056 0.2642 0.3082 222
Assam Goalpara 0.8846 0.3077 0.3077 223
Uttar Pradesh Rae-Bareily 0.8244 0.4282 0.3076 224
Chhattisgarh Korba 0.8737 0.3307 0.3073 225
Bihar Bhagalpur 0.9038 0.2730 0.3064 226
Bihar Champaran(East) 0.8962 0.2904 0.3057 227
Bihar Siwan 0.8976 0.2880 0.3056 228
Uttar Pradesh Siddharth Nagar 0.8900 0.3044 0.3052 229
West Bengal Jalpaiguri 0.8611 0.3639 0.3047 230
Uttar Pradesh Etah 0.8174 0.4529 0.3041 231
Uttar Pradesh Ballia 0.8382 0.4123 0.3038 232
Uttar Pradesh Sant Kabir Nagar 0.8772 0.3355 0.3034 233
Uttar Pradesh Allahabad 0.8213 0.4484 0.3030 234
Assam Darrang 0.8690 0.3531 0.3030 235
Uttar Pradesh Hatharas 0.7773 0.5374 0.3027 236
Uttar Pradesh Hardoi 0.8583 0.3753 0.3027 237
Uttar Pradesh Balrampur 0.8656 0.3609 0.3027 238
Jharkhand Lohardaga 0.9449 0.2056 0.3015 239
Orissa Angul 0.9167 0.2623 0.3015 240
Tamil Nadu Namakkal 0.7211 0.6563 0.3005 241

Prioritization of Rainfed Areas in India80
State District NRI ILI RAPI Priority Rank
Uttarakhand Bageshwar 0.8619 0.3761 0.3001 242
Uttar Pradesh Azamgarh 0.8344 0.4317 0.2998 243
Bihar Gaya 0.9362 0.2284 0.2997 244
Madhya Pradesh Tikamgarh 0.8754 0.3519 0.2991 245
Haryana Bhiwani 0.6943 0.7145 0.2990 246
Andhra Pradesh Khammam 0.8114 0.4806 0.2989 247
Jharkhand Koderma 0.9213 0.2639 0.2978 248
Orissa Sambalpur 0.9217 0.2633 0.2978 249
Andhra Pradesh Nalgonda 0.7718 0.5636 0.2976 250
Uttar Pradesh Ghazipur 0.8645 0.3783 0.2975 251
Uttar Pradesh Jalaun 0.8123 0.4828 0.2975 252
Uttar Pradesh Kushi Nagar 0.8716 0.3648 0.2973 253
Madhya Pradesh Jabalpur 0.8643 0.3806 0.2970 254
Maharashtra Jalgaon 0.6996 0.7100 0.2970 255
Uttar Pradesh Deoria 0.8473 0.4148 0.2968 256
Maharashtra Akola 0.7548 0.6006 0.2966 257
Chhattisgarh Raipur 0.8660 0.3785 0.2965 258
Uttar Pradesh Mathura 0.7839 0.5428 0.2965 259
Tamil Nadu Theni 0.7191 0.6734 0.2961 260
Uttar Pradesh Sultanpur 0.8235 0.4648 0.2960 261
Gujarat Vadodara 0.8067 0.4993 0.2958 262
Karnataka Dharwad 0.7671 0.5788 0.2956 263
Uttar Pradesh Jaunpur 0.8388 0.4362 0.2954 264
Maharashtra Hingoli 0.8134 0.4872 0.2954 265
Uttar Pradesh Mainpuri 0.8320 0.4516 0.2948 266
West Bengal Malda 0.9175 0.2820 0.2943 267
Uttar Pradesh Pilibhit 0.8430 0.4316 0.2941 268
Uttar Pradesh Kaushambi 0.8663 0.3856 0.2940 269
Uttar Pradesh Saharanpur 0.7501 0.6183 0.2938 270
Assam Sonitpur 0.8674 0.3842 0.2937 271
Madhya Pradesh Bhopal 0.8279 0.4660 0.2927 272
Assam Kamrup 0.8448 0.4323 0.2927 273
Orissa Baragarh 0.8913 0.3394 0.2927 274
Assam Cachar 0.8627 0.3970 0.2925 275
Maharashtra Washim 0.7908 0.5423 0.2920 276
Gujarat Dang 0.8965 0.3344 0.2909 277
Bihar Buxar 0.9091 0.3138 0.2893 278
Tamil Nadu Vellore 0.7701 0.5921 0.2892 279
Uttar Pradesh Farrukhabad 0.8323 0.4721 0.2878 280
Bihar Bhojpur 0.9001 0.3383 0.2872 281
Orissa Nayagarh 0.9377 0.2634 0.2871 282

Prioritization of Rainfed Areas in India 81
State District NRI ILI RAPI Priority Rank
West Bengal Murshidabad 0.9130 0.3135 0.2868 283
Haryana Fatehabad 0.7260 0.6883 0.2866 284
Assam Golaghat 0.8745 0.3911 0.2866 285
Assam Nalbari 0.8700 0.4025 0.2859 286
Bihar Sitamarhi 0.9423 0.2585 0.2856 287
Jharkhand Dhanbad 0.8906 0.3638 0.2850 288
Bihar Patna 0.8869 0.3723 0.2846 289
Karnataka Mysore 0.8053 0.5387 0.2835 290
Bihar Supaul 0.9496 0.2506 0.2834 291
West Bengal Bankura 0.9299 0.2945 0.2819 292
Gujarat Gandhinagar 0.7416 0.6714 0.2818 293
Uttar Pradesh Aligarh 0.7999 0.5572 0.2810 294
Maharashtra Nagpur 0.7908 0.5755 0.2809 295
Uttar Pradesh Kanpur (Dehat) 0.8628 0.4320 0.2808 296
Bihar Bhabhua(kaimur) 0.9288 0.3027 0.2799 297
Maharashtra Chandrapur 0.8534 0.4538 0.2798 298
Uttar Pradesh Sitapur 0.8844 0.3924 0.2796 299
Orissa Sonepur 0.9580 0.2461 0.2793 300
Bihar Begusarai 0.9259 0.3119 0.2788 301
Bihar Saharsa 0.9563 0.2513 0.2787 302
Uttarakhand Chamoli 0.8484 0.4674 0.2786 303
Bihar Lakhisarai 0.9444 0.2780 0.2777 304
Gujarat Kheda 0.8190 0.5294 0.2775 305
Uttar Pradesh Firozabad 0.8408 0.4877 0.2769 306
Orissa Ganjam 0.9282 0.3145 0.2764 307
Tamil Nadu Virudhunagar 0.7936 0.5845 0.2761 308
Uttar Pradesh Mau 0.8623 0.4489 0.2755 309
Haryana Gurgaon 0.6991 0.7757 0.2753 310
Gujarat Bharuch 0.7719 0.6316 0.2749 311
Assam Nagaon 0.8870 0.4030 0.2744 312
Punjab Firozpur 0.7400 0.6972 0.2743 313
Uttar Pradesh Mharajganj 0.9054 0.3672 0.2740 314
Gujarat Narmada 0.8773 0.4245 0.2736 315
Madhya Pradesh Datia 0.8411 0.4991 0.2729 316
Andhra Pradesh Vizianagaram 0.8461 0.4893 0.2728 317
Maharashtra Gadchiroli 0.9271 0.3279 0.2726 318
Uttar Pradesh Kannauj 0.8750 0.4325 0.2725 319
Bihar Sivhar 0.9658 0.2513 0.2724 320
Karnataka Mandya 0.8102 0.5631 0.2722 321
Maharashtra Thane 0.8168 0.5503 0.2721 322
Madhya Pradesh Narsinghpur 0.8980 0.3898 0.2714 323

Prioritization of Rainfed Areas in India82
State District NRI ILI RAPI Priority Rank
Uttar Pradesh Pratapgarh 0.8810 0.4240 0.2713 324
Uttar Pradesh Chandauli 0.8913 0.4042 0.2711 325
Punjab Mansa 0.7437 0.6993 0.2711 326
Uttar Pradesh Etawah 0.8680 0.4546 0.2698 327
Assam Hailakandi 0.8924 0.4062 0.2697 328
Bihar Aurangabad 0.9463 0.2985 0.2696 329
Uttar Pradesh Auraiya 0.8883 0.4145 0.2696 330
Bihar Nalanda 0.9331 0.3260 0.2693 331
West Bengal Dinajpur (Dakshin) 0.9711 0.2509 0.2690 332
Madhya Pradesh Balaghat 0.9212 0.3508 0.2689 333
Assam Morigon 0.9386 0.3163 0.2688 334
Assam Karimganj 0.8933 0.4095 0.2680 335
Assam Tinsukia 0.8718 0.4528 0.2679 336
Uttar Pradesh Unnao 0.8928 0.4115 0.2676 337
Tamil Nadu Perambalur 0.8213 0.5555 0.2673 338
Uttar Pradesh Gorakhpur 0.9124 0.3736 0.2672 339
Karnataka Hassan 0.8127 0.5730 0.2672 340
Maharashtra Wardha 0.8006 0.5982 0.2669 341
Madhya Pradesh Gwalior 0.8384 0.5238 0.2665 342
Uttar Pradesh Sant Ravidas Nagar 0.8643 0.4771 0.2648 343
Uttar Pradesh Ambedkar Nagar 0.8978 0.4106 0.2646 344
Bihar Jahanabad 0.9518 0.3035 0.2643 345
Chhattisgarh Janjgir 0.9224 0.3665 0.2629 346
Tamil Nadu Thirunelveli 0.8099 0.5943 0.2620 347
Tamil Nadu Thiruvannamalai 0.7933 0.6278 0.2619 348
Haryana Kaithal 0.7384 0.7391 0.2614 349
Himachal Pradesh Chamba 0.8547 0.5066 0.2614 350
Assam Lakhimpur 0.9166 0.3839 0.2610 351
Punjab Faridkot 0.7189 0.7795 0.2609 352
Andhra Pradesh Warangal 0.8516 0.5159 0.2603 353
West Bengal Nadia 0.9080 0.4053 0.2596 354
Bihar Nawadha 0.9660 0.2904 0.2592 355
Uttarakhand Almora 0.8903 0.4429 0.2588 356
Bihar Monghyr 0.9505 0.3235 0.2585 357
Orissa Balasore 0.9619 0.3046 0.2572 358
Uttar Pradesh Varanasi 0.8592 0.5101 0.2571 359
Uttar Pradesh Lucknow 0.8588 0.5128 0.2565 360
Uttar Pradesh Bijnor 0.8246 0.5813 0.2565 361
Uttar Pradesh Moradabad 0.8544 0.5250 0.2554 362
Uttarakhand Haridwar 0.8000 0.6337 0.2554 363
Andhra Pradesh Srikakulam 0.8849 0.4643 0.2553 364

Prioritization of Rainfed Areas in India 83
State District NRI ILI RAPI Priority Rank
Andhra Pradesh Nizamabad 0.8070 0.6206 0.2552 365
Assam Dibrugarh 0.8751 0.4854 0.2548 366
Bihar Madhupura 0.9782 0.2815 0.2540 367
Uttar Pradesh J.B.Fule Nagar 0.8677 0.5054 0.2531 368
Uttarakhand Champawat 0.9093 0.4240 0.2525 369
Orissa Dhenkanal 0.9451 0.3529 0.2523 370
Orissa Jaipur 0.9586 0.3273 0.2518 371
Bihar Khagaria 0.9658 0.3130 0.2518 372
Maharashtra Raigad 0.7961 0.6525 0.2517 373
Haryana Rewari 0.7554 0.7359 0.2511 374
Uttar Pradesh Kanpur City 0.8784 0.4918 0.2505 375
Maharashtra Ratnagiri 0.8112 0.6268 0.2502 376
Chhattisgarh Dhamtari 0.9354 0.3816 0.2492 377
Andhra Pradesh Nellore 0.8528 0.5473 0.2490 378
Uttarakhand Pauri Garhwal 0.8781 0.4966 0.2490 379
Tamil Nadu Pudukkottai 0.8679 0.5178 0.2488 380
Bihar Rohtas 0.9506 0.3528 0.2487 381
Orissa Kendrapara 0.9567 0.3418 0.2483 382
Uttar Pradesh Barabanki 0.9015 0.4530 0.2480 383
Maharashtra Satara 0.7680 0.7228 0.2470 384
West Bengal Darjeeling 0.9062 0.4470 0.2469 385
Andhra Pradesh Karimnagar 0.8372 0.5910 0.2448 386
Uttarakhand Uttarkashi 0.8953 0.4792 0.2434 387
Orissa Jharsuguda 0.9200 0.4318 0.2427 388
Orissa Bhadrak 0.9672 0.3388 0.2422 389
Madhya Pradesh Hoshangabad 0.9321 0.4114 0.2415 390
Haryana Karnal 0.7490 0.7787 0.2411 391
Madhya Pradesh Harda 0.9426 0.3929 0.2407 392
Haryana Panipet 0.7318 0.8144 0.2407 393
Tamil Nadu Nagapattinam 0.8371 0.6041 0.2405 394
Andhra Pradesh Guntur 0.8051 0.6694 0.2402 395
Uttar Pradesh Muzaffarnagar 0.8007 0.6799 0.2395 396
Uttarakhand Pithoragarh 0.9150 0.4526 0.2392 397
Uttar Pradesh Bareilly 0.8939 0.4976 0.2382 398
West Bengal 24-Paraganas (North) 0.9225 0.4456 0.2365 399
Karnataka Bangalore (Urban) 0.7598 0.7750 0.2352 400
Assam Jorhat 0.8941 0.5069 0.2350 401
Assam Sibsagar 0.8744 0.5507 0.2335 402
Bihar Sheikhpura 0.9747 0.3508 0.2332 403
Orissa Jagatsingpur 0.9893 0.3234 0.2327 404
Uttar Pradesh Bagpat 0.8040 0.6987 0.2311 405

Prioritization of Rainfed Areas in India84
State District NRI ILI RAPI Priority Rank
Punjab Moga 0.7272 0.8540 0.2305 406
Tamil Nadu Erode 0.8131 0.6832 0.2302 407
Tamil Nadu Madurai 0.8614 0.5879 0.2298 408
Maharashtra Sindhudurg 0.8334 0.6478 0.2285 409
Tamil Nadu Sivaganagai 0.8733 0.5684 0.2283 410
Maharashtra Gondia 0.9319 0.4531 0.2277 411
Tamil Nadu Thiruvarur 0.8710 0.5762 0.2273 412
Tamil Nadu Kanniyakumari 0.8172 0.6844 0.2271 413
Uttarakhand Rudraprayag 0.8930 0.5339 0.2267 414
Tamil Nadu Thanjavur 0.8661 0.5884 0.2265 415
Orissa Cuttack 0.9907 0.3483 0.2234 416
Uttar Pradesh Bulandshahar 0.8658 0.6006 0.2226 417
Punjab Sangrur 0.7391 0.8567 0.2217 418
Punjab Bathinda 0.7575 0.8210 0.2213 419
Orissa Puri 1.0000 0.3362 0.2213 420
Andhra Pradesh East Godavari 0.8906 0.5553 0.2212 421
Tamil Nadu Cuddalore 0.8842 0.5694 0.2207 422
Tamil Nadu Thiruvallur 0.8496 0.6388 0.2207 423
West Bengal Birbhum 0.9906 0.3573 0.2205 424
Himachal Pradesh Mandi 0.8728 0.5956 0.2196 425
Orissa Khurda 0.9766 0.3888 0.2194 426
Haryana Sonipet 0.7365 0.8697 0.2191 427
Maharashtra Bhandara 0.9280 0.4875 0.2189 428
Tamil Nadu Karur 0.8591 0.6269 0.2183 429
Gujarat Anand 0.8588 0.6289 0.2179 430
Haryana Hissar 0.7983 0.7574 0.2153 431
Himachal Pradesh Simla 0.8283 0.6998 0.2146 432
Tamil Nadu Thiruchirapalli 0.8596 0.6379 0.2143 433
Karnataka Chikmagalur 0.8729 0.6128 0.2138 434
Haryana Faridabad 0.8356 0.6876 0.2137 435
Punjab Amritsar 0.8018 0.7570 0.2131 436
Himachal Pradesh Kulu 0.8303 0.7012 0.2127 437
Uttar Pradesh Rampur 0.9123 0.5496 0.2086 438
Himachal Pradesh Kinnaur 0.8176 0.7404 0.2081 439
Haryana Jhajjar 0.7889 0.7997 0.2075 440
Gujarat Valasad 0.9090 0.5674 0.2049 441
Gujarat Surat 0.8762 0.6342 0.2045 442
Himachal Pradesh Sirmaur 0.9085 0.5756 0.2025 443
Karnataka Uttara Kannada 0.8976 0.6016 0.2010 444
Haryana Jind 0.8275 0.7430 0.2007 445
Punjab Muktsar 0.8365 0.7298 0.1990 446

Prioritization of Rainfed Areas in India 85
State District NRI ILI RAPI Priority Rank
Punjab Gurdaspur 0.8121 0.7881 0.1959 447
Uttar Pradesh Ghaziabad 0.8395 0.7342 0.1956 448
Haryana Kurukshetra 0.7890 0.8369 0.1950 449
Haryana Yamunanagar 0.8161 0.7922 0.1919 450
Tamil Nadu Kancheepuram 0.9006 0.6324 0.1888 451
Maharashtra Kolhapur 0.8449 0.7452 0.1884 452
Himachal Pradesh Kangra 0.8669 0.7035 0.1875 453
West Bengal Howrah 0.9886 0.4649 0.1860 454
Himachal Pradesh Bilaspur 0.8971 0.6507 0.1850 455
Uttarakhand Udham Singh Nagar 0.8985 0.6524 0.1835 456
Punjab Patiala 0.7853 0.8807 0.1829 457
West Bengal Hooghly 0.9795 0.4968 0.1814 458
Punjab Fathegarh Sahib 0.8037 0.8520 0.1802 459
Punjab Kapurthala 0.7576 0.9446 0.1801 460
Kerala Idukki 0.8276 0.8057 0.1797 461
Andhra Pradesh Krishna 0.8985 0.6659 0.1791 462
Uttar Pradesh Meerut 0.8861 0.6935 0.1781 463
West Bengal Burdwan 0.9976 0.4792 0.1752 464
Himachal Pradesh Una 0.8733 0.7461 0.1691 465
Kerala Kasaragod 0.8621 0.7704 0.1685 466
Uttarakhand Dehardun 0.8936 0.7098 0.1677 467
Kerala Wayanad 0.8732 0.7508 0.1676 468
Himachal Pradesh Hamirpur 0.8870 0.7233 0.1676 469
Kerala Kozhikode 0.8655 0.7697 0.1664 470
Punjab Nawan Shehar 0.7947 0.9200 0.1635 471
Andhra Pradesh West Godavari 0.9345 0.6410 0.1634 472
Karnataka Shimoga 0.9568 0.6011 0.1618 473
Uttar Pradesh G.Buddha Nagar 0.8960 0.7245 0.1612 474
Kerala Kannur 0.8701 0.7783 0.1605 475
Himachal Pradesh Lahaul & Spiti 0.9095 0.7028 0.1594 476
Haryana Panchkula 0.8624 0.8044 0.1569 477
Tamil Nadu The Nilgiris 0.8791 0.7756 0.1554 478
Kerala Thiruvanathapuram 0.8631 0.8166 0.1524 479
Kerala Kollam 0.8634 0.8197 0.1512 480
Kerala Palakkad 0.8788 0.7890 0.1511 481
Uttarakhand Nainital 0.9624 0.6242 0.1503 482
Haryana Rohtak 0.8606 0.8322 0.1489 483
Himachal Pradesh Solan 0.9116 0.7335 0.1478 484
Punjab Ludhiana 0.7855 0.9894 0.1465 485
Kerala Malappuram 0.8742 0.8122 0.1465 486
Punjab Jalandhar 0.7832 1.0000 0.1445 487

Prioritization of Rainfed Areas in India86
State District NRI ILI RAPI Priority Rank
Karnataka Kodagu 0.8992 0.7891 0.1375 488
Punjab Rupnagar 0.8340 0.9220 0.1366 489
Gujarat Navsari 0.9612 0.6945 0.1277 490
Punjab Hoshiarpur 0.8564 0.9059 0.1271 491
Haryana Ambala 0.8946 0.8908 0.1066 492
Kerala Alappuzha 0.9098 0.8682 0.1041 493
Kerala Kottayam 0.8680 0.9577 0.1021 494
Kerala Thrissur 0.9108 0.8831 0.0984 495
Karnataka Dakshina Kannada 0.9513 0.8067 0.0969 496
Karnataka Udupi 0.9415 0.8474 0.0898 497
Kerala Eranakulam 0.8982 0.9629 0.0802 498
Kerala Pathanamthitta 0.9049 0.9553 0.0783 499
Note: The figures have been considered up to fourth decimal for depictionRAPI = 2/3 (1-NRI) + 1/3 (1-ILI)

Prioritization of Rainfed Areas in India 87
annexure-iv
district-wise milk Production Potential
Natural Resource Index (NRI)
State District Cow density
% Cross bred cows
Buffalo density
Milk production
index
Potential
High AP East Godavari 18.08 39.25 55.06 0.793 Medium
High AP Krishna 6.82 15.14 91.88 0.807 Medium
High AP Srikakulam 85.12 47.14 14.83 0.766 Low
High AP West Godavari 17.26 28.91 77.60 0.784 Medium
High Assam Bongaigaon 56.44 1.58 0.51 0.934 High
High Assam Dhemaji 60.06 0.06 2.47 0.931 High
High Assam Dhubri 94.65 1.87 4.28 0.885 Medium
High Assam Dibrugarh 62.87 3.64 4.73 0.915 High
High Assam Goalpara 62.85 2.57 1.91 0.922 High
High Assam Golaghat 60.79 2.65 3.42 0.922 High
High Assam Hailakandi 49.75 21.61 13.40 0.870 Medium
High Assam Jorhat 91.98 3.55 6.94 0.880 Medium
High Assam Karimganj 85.73 8.42 14.93 0.862 Medium
High Assam Kokrajhar 60.28 0.14 1.85 0.931 High
High Assam Lakhimpur 102.40 1.46 3.90 0.879 Medium
High Assam Morigon 102.82 7.55 5.33 0.861 Medium
High Assam N C Hills 4.14 27.13 3.65 0.922 High
High Assam Nagaon 111.97 11.70 1.66 0.846 Medium
High Bihar Araria 82.40 21.04 57.36 0.765 Low
High Bihar Aurangabad 82.40 21.04 57.36 0.765 Low
High Bihar Banka 82.40 21.04 57.36 0.765 Low
High Bihar Begusarai 82.40 21.04 57.36 0.765 Low
High Bihar Bhabhua(kaimur) 82.40 21.04 57.36 0.765 Low
High Bihar Bhagalpur 82.40 21.04 57.36 0.765 Low
High Bihar Bhojpur 82.40 21.04 57.36 0.765 Low
High Bihar Buxar 82.40 21.04 57.36 0.765 Low
High Bihar Champaran(East) 82.40 21.04 57.36 0.765 LowHigh Bihar Champaran (West) 82.40 21.04 57.36 0.765 Low
High Bihar Darbhanga 82.40 21.04 57.36 0.765 Low
High Bihar Gaya 82.40 21.04 57.36 0.765 Low
High Bihar Gopalganj 82.40 21.04 57.36 0.765 Low
High Bihar Jahanabad 82.40 21.04 57.36 0.765 Low
High Bihar Jamui 82.40 21.04 57.36 0.765 Low
High Bihar Katihar 82.40 21.04 57.36 0.765 Low
High Bihar Khagaria 82.40 21.04 57.36 0.765 Low
High Bihar Kishanganj 82.40 21.04 57.36 0.765 Low

Prioritization of Rainfed Areas in India88
Natural Resource Index (NRI)
State District Cow density
% Cross bred cows
Buffalo density
Milk production
index
Potential
High Bihar Lakhisarai 82.40 21.04 57.36 0.765 Low
High Bihar Madhubani 82.40 21.04 57.36 0.765 Low
High Bihar Madhupura 82.40 21.04 57.36 0.765 Low
High Bihar Monghyr 82.40 21.04 57.36 0.765 Low
High Bihar Muzafarpur 82.40 21.04 57.36 0.765 Low
High Bihar Nalanda 82.40 21.04 57.36 0.765 Low
High Bihar Nawadha 82.40 21.04 57.36 0.765 Low
High Bihar Patna 82.40 21.04 57.36 0.765 Low
High Bihar Purnea 82.40 21.04 57.36 0.765 Low
High Bihar Rohtas 82.40 21.04 57.36 0.765 Low
High Bihar Saharsa 82.40 21.04 57.36 0.765 Low
High Bihar Samastipur 82.40 21.04 57.36 0.765 Low
High Bihar Saran 82.40 21.04 57.36 0.765 Low
High Bihar Sheikhpura 82.40 21.04 57.36 0.765 Low
High Bihar Sitamarhi 82.40 21.04 57.36 0.765 Low
High Bihar Sivhar 82.40 21.04 57.36 0.765 Low
High Bihar Siwan 82.40 21.04 57.36 0.765 Low
High Bihar Supaul 82.40 21.04 57.36 0.765 Low
High Bihar Vaishali 82.40 21.04 57.36 0.765 Low
High Chhattisgarh Dhamtari 47.38 1.56 8.05 0.932 High
High Chhattisgarh Janjgir 91.05 2.17 6.86 0.884 Medium
High Gujarat Dang 17.21 26.14 2.82 0.911 High
High Gujarat Narmada 20.03 3.42 18.30 0.940 High
High Gujarat Navsari 50.57 71.56 37.56 0.705 Low
High Gujarat Surat 32.89 41.11 48.36 0.783 Medium
High Gujarat Valasad 53.88 41.04 20.07 0.806 Medium
High Haryana Ambala 28.17 57.02 122.81 0.629 Low
High HP Bilaspur 17.74 76.83 78.81 0.661 Low
High HP Hamirpur 11.67 84.04 97.21 0.620 Low
High HP Lahaul & Spiti 0.72 62.15 0.00 0.844 Medium
High HP Sirmaur 55.45 23.40 15.77 0.856 Medium
High HP Solan 45.10 48.01 40.41 0.766 Low
High Jharkhand Bokaro 70.06 7.98 13.34 0.882 Medium
High Jharkhand Chtra 48.83 1.57 13.29 0.922 High
High Jharkhand Deoghar 113.78 2.24 15.88 0.845 Medium
High Jharkhand Dhanbad 13.27 37.72 4.68 0.884 Medium
High Jharkhand Garhwa 57.54 0.56 17.61 0.908 High
High Jharkhand Giridish 71.09 0.99 13.14 0.899 High
High Jharkhand Koderma 44.33 1.56 9.83 0.932 High
High Jharkhand Lohardaga 23.86 7.60 2.80 0.951 High

Prioritization of Rainfed Areas in India 89
Natural Resource Index (NRI)
State District Cow density
% Cross bred cows
Buffalo density
Milk production
index
Potential
High Jharkhand Pakur 77.57 0.36 18.05 0.886 Medium
High Jharkhand Sahibganj 106.35 3.21 25.14 0.836 Medium
High Karnataka Coorg / Kodugu 17.51 34.40 4.07 0.888 Medium
High Karnataka Dakshina Kannada 71.57 43.50 1.08 0.812 Medium
High Karnataka Shimoga 41.92 19.92 17.95 0.876 Medium
High Karnataka Udupi 68.70 26.83 0.98 0.857 Medium
High Karnataka Uttara Kannada 20.96 14.09 8.59 0.928 High
High Kerala Alappuzha 52.21 99.81 1.52 0.691 Low
High Kerala Eranakulam 47.39 97.40 0.83 0.703 Low
High Kerala Palakkad 42.31 92.06 0.71 0.723 Low
High Kerala Pathanamthitta 32.27 99.18 0.22 0.716 Low
High Kerala Thrissur 41.39 97.22 1.85 0.709 Low
High Maharashtra Bhandara 29.28 33.29 19.61 0.853 Medium
High Maharashtra Gadchiroli 19.52 1.21 3.33 0.970 High
High Maharashtra Gondia 29.53 6.49 12.96 0.931 High
High MP Balaghat 26.00 1.29 10.10 0.952 High
High MP Harda 26.03 2.76 20.17 0.932 High
High MP Hoshangabad 32.25 3.08 14.59 0.934 High
High MP Narsinghpur 47.96 3.50 21.12 0.905 High
High MP Tikamgarh 64.23 1.23 49.63 0.847 Medium
High Orissa Angul 30.23 5.45 3.02 0.949 High
High Orissa Balasore (Baleshwar) 117.97 3.43 0.74 0.862 Medium
High Orissa Baragarh 27.03 33.87 2.28 0.882 Medium
High Orissa Bhadrak 165.58 37.34 4.61 0.719 Low
High Orissa Boudh 28.96 5.70 6.31 0.944 High
High Orissa Cuttack 63.32 28.23 5.66 0.851 Medium
High Orissa Deogarh 25.67 23.50 1.34 0.911 High
High Orissa Dhenkanal 51.47 4.10 6.40 0.923 High
High Orissa Gajapati 9.99 27.82 1.67 0.917 High
High Orissa Ganjam 39.80 26.62 5.41 0.881 Medium
High Orissa Jagatsingpur 72.44 33.90 5.99 0.827 Medium
High Orissa Jaipur 133.67 2.69 3.55 0.842 Medium
High Orissa Jharsuguda 33.73 8.85 2.17 0.938 High
High Orissa Kendrapara 101.59 12.36 3.88 0.852 Medium
High Orissa Keonjhar 38.30 7.12 2.20 0.937 High
High Orissa Khurda 3.81 24.60 2.27 0.931 High
High Orissa Koraput 35.65 5.09 5.29 0.940 High
High Orissa Malkangiri 36.21 2.64 3.91 0.948 High
High Orissa Mayurbhanj 31.05 5.74 0.92 0.950 High
High Orissa Nawapara 15.27 5.13 3.94 0.964 High

Prioritization of Rainfed Areas in India90
Natural Resource Index (NRI)
State District Cow density
% Cross bred cows
Buffalo density
Milk production
index
Potential
High Orissa Nawarangpur 26.98 8.72 3.39 0.943 High
High Orissa Nayagarh 30.90 11.75 4.11 0.930 HighHigh Orissa Phulbani (Kandhamal) 13.07 21.75 4.66 0.924 High
High Orissa Puri 76.66 4.60 6.04 0.895 Medium
High Orissa Rayagada 15.51 48.67 7.79 0.849 Medium
High Orissa Sambalpur 19.15 13.07 1.08 0.945 High
High Orissa Sonepur 36.99 23.06 2.56 0.898 High
High Orissa Sundargarh 26.65 2.76 1.96 0.961 High
High Tamil Nadu Cuddalore 70.84 72.56 4.15 0.735 Low
High Tamil Nadu Kancheepuram 104.79 48.74 27.77 0.719 Low
High Tamil Nadu The Nilgiris 12.20 79.74 0.36 0.787 Medium
High UP Ambedkar Nagar 57.38 7.94 91.86 0.770 Medium
High UP Auraiya 40.11 4.71 81.82 0.813 Medium
High UP Barabanki 50.31 3.37 56.96 0.845 Medium
High UP Bareilly 37.69 3.88 90.84 0.803 Medium
High UP Chandauli 54.19 3.84 62.27 0.831 Medium
High UP G.Buddha Nagar 24.06 60.87 169.16 0.549 Low
High UP Gorakhpur 64.65 29.61 55.52 0.766 Medium
High UP Kannauj 46.77 5.42 90.42 0.790 Medium
High UP Kanpur City 55.40 3.49 87.02 0.791 Medium
High UP Meerut 48.86 65.79 255.72 0.370 Low
High UP Mharajganj 29.27 25.55 42.65 0.835 Medium
High UP Pratapgarh 51.98 15.04 50.54 0.824 Medium
High UP Rampur 34.50 21.26 61.15 0.811 Medium
High UP Sant Kabir Nagar 65.15 16.55 63.69 0.785 Medium
High UP Shravasti 55.91 0.98 38.87 0.874 Medium
High UP Siddharth Nagar 35.48 3.14 36.45 0.895 Medium
High UP Sitapur 52.05 0.63 50.85 0.860 Medium
High UP Unnao 42.57 1.89 75.07 0.828 Medium
High Uttarakhand Almora 43.18 13.40 34.88 0.863 Medium
High Uttarakhand Champawat 35.79 18.69 19.26 0.883 Medium
High Uttarakhand Dehardun 38.44 33.34 18.75 0.845 Medium
High Uttarakhand Nainital 29.88 29.22 25.33 0.854 Medium
High Uttarakhand Pauri Garhwal 43.74 7.03 9.63 0.919 High
High Uttarakhand Pithoragarh 19.73 12.69 9.94 0.931 High
High Uttarakhand Rudraprayag 27.76 3.23 20.73 0.928 High
High Uttarakhand Udham Singh Nagar 41.05 57.54 60.74 0.713 Low
High Uttarakhand Uttarkashi 6.87 20.27 4.61 0.934 HighHigh West Bengal 24-Paraganas (North) 168.13 38.03 8.67 0.708 Low
High West Bengal Bankura 129.87 8.91 3.58 0.831 Medium

Prioritization of Rainfed Areas in India 91
Natural Resource Index (NRI)
State District Cow density
% Cross bred cows
Buffalo density
Milk production
index
Potential
High West Bengal Birbhum 124.87 10.54 3.40 0.832 Medium
High West Bengal Burdwan 172.95 16.07 7.48 0.760 Low
High West Bengal Darjeeling 60.85 33.69 1.39 0.847 Medium
High West Bengal Dinajpur (Dakshin) 144.13 4.19 0.11 0.832 Medium
High West Bengal Dinajpur (Uttar) 146.52 7.09 1.73 0.820 Medium
High West Bengal Hooghly 229.70 25.63 6.94 0.675 Low
High West Bengal Howrah 194.27 13.88 7.06 0.742 Low
High West Bengal Malda 119.62 12.27 3.02 0.834 Medium
High West Bengal Murshidabad 162.63 44.26 4.68 0.705 Low
High West Bengal Nadia 159.48 44.24 1.46 0.713 Low
Medium AP Guntur 4.86 7.94 91.27 0.828 Medium
Medium AP Karimnagar 13.44 12.23 47.38 0.878 Medium
Medium AP Khammam 25.11 0.61 39.49 0.907 High
Medium AP Nellore 7.32 11.79 50.79 0.881 Medium
Medium AP Nizamabad 21.82 1.82 50.63 0.890 Medium
Medium AP Visakhapatnam 27.62 37.12 33.06 0.824 Medium
Medium AP Vizianagaram 40.20 48.65 29.77 0.787 Medium
Medium AP Warangal 19.28 3.67 47.64 0.893 Medium
Medium Assam Barpeta 80.80 8.76 2.81 0.886 Medium
Medium Assam Cachar 53.13 6.93 10.53 0.908 High
Medium Assam Darrang 48.49 3.55 2.59 0.934 High
Medium Assam Kamrup 78.41 12.20 0.82 0.883 Medium
Medium Assam Karbi-Anglong 17.33 4.76 0.73 0.968 High
Medium Assam Nalbari 56.91 11.98 1.82 0.905 High
Medium Assam Sibsagar 78.09 3.65 6.09 0.896 Medium
Medium Assam Sonitpur 68.01 5.22 2.19 0.909 High
Medium Assam Tinsukia 38.50 4.48 0.29 0.946 High
Medium Chhattisgarh Bilaspur 57.62 2.55 7.22 0.919 High
Medium Chhattisgarh Dantiwara 14.38 0.69 2.28 0.979 High
Medium Chhattisgarh Durg 76.76 1.48 8.73 0.899 High
Medium Chhattisgarh Jashpur 22.75 2.23 3.03 0.965 High
Medium Chhattisgarh Kanker 23.77 2.55 1.48 0.965 High
Medium Chhattisgarh kawardha 40.40 0.29 3.46 0.950 High
Medium Chhattisgarh Korba 22.65 3.32 4.21 0.960 High
Medium Chhattisgarh Koriya 19.12 1.79 3.56 0.969 High
Medium Chhattisgarh Mahasamund 38.97 4.75 4.65 0.938 High
Medium Chhattisgarh Raigadh 29.78 12.98 2.36 0.931 High
Medium Chhattisgarh Raipur 53.20 2.01 7.49 0.925 High
Medium Chhattisgarh Raj Nandgaon 43.56 0.83 3.67 0.945 High
Medium Gujarat Anand 39.56 51.72 126.88 0.623 Low

Prioritization of Rainfed Areas in India92
Natural Resource Index (NRI)
State District Cow density
% Cross bred cows
Buffalo density
Milk production
index
Potential
Medium Gujarat Dahod 59.75 1.08 60.13 0.835 Medium
Medium Gujarat Kheda 32.26 48.39 134.19 0.627 Low
Medium Gujarat Vadodara 28.47 8.72 53.88 0.860 Medium
Medium Haryana Faridabad 25.10 34.68 139.74 0.661 Low
Medium Haryana Hissar 18.21 25.14 105.18 0.748 Low
Medium Haryana Jind 19.49 15.24 155.04 0.691 Low
Medium Haryana Panchkula 16.70 21.73 67.46 0.819 Medium
Medium Haryana Rohtak 15.69 28.99 132.18 0.697 Low
Medium Haryana Yamunanagar 48.24 68.56 99.42 0.616 Low
Medium HP Chamba 27.47 14.22 5.61 0.925 High
Medium HP Kangra 38.37 64.11 24.73 0.758 Low
Medium HP Kinnaur 2.69 54.60 0.02 0.860 Medium
Medium HP Kulu 25.64 54.08 0.15 0.837 Medium
Medium HP Mandi 75.31 56.00 19.24 0.747 Low
Medium HP Simla 41.53 48.10 2.50 0.830 Medium
Medium HP Una 19.34 63.21 72.53 0.704 Low
Medium Jharkhand Dumka 68.43 1.43 6.20 0.912 High
Medium Jharkhand East Singbhum 43.23 8.31 2.62 0.928 High
Medium Jharkhand Godda 105.70 0.73 25.35 0.842 Medium
Medium Jharkhand Gumla 41.83 0.56 5.04 0.945 High
Medium Jharkhand Hazaribag 60.86 3.33 9.18 0.911 High
Medium Jharkhand Palamu 45.57 1.16 13.28 0.926 High
Medium Jharkhand Ranchi 32.21 10.92 6.05 0.928 High
Medium Jharkhand West Singbhum 14.40 5.66 1.40 0.968 High
Medium Karnataka Chikmagalur 32.80 19.07 11.45 0.898 High
Medium Karnataka Hassan 63.71 33.18 25.12 0.807 Medium
Medium Karnataka Mandya 56.13 53.21 32.60 0.753 Low
Medium Karnataka Mysore 57.56 32.45 8.82 0.842 Medium
Medium Kerala Idukki 32.78 94.38 0.43 0.728 Low
Medium Kerala Kannur 35.75 96.94 0.17 0.718 Low
Medium Kerala Kasaragod 35.62 56.58 1.26 0.818 Medium
Medium Kerala Kollam 46.14 99.24 1.10 0.700 Low
Medium Kerala Kottayam 52.71 99.58 0.58 0.693 Low
Medium Kerala Kozhikode 49.38 82.85 0.26 0.739 Low
Medium Kerala Malappuram 25.87 93.35 1.82 0.735 Low
Medium Kerala Thiruvanathapuram 63.75 98.88 0.83 0.682 Low
Medium Kerala Wayanad 27.56 94.18 0.60 0.733 Low
Medium Maharashtra Chandrapur 19.90 5.67 6.09 0.954 High
Medium Maharashtra Hingoli 23.83 6.36 14.33 0.935 High
Medium Maharashtra Kolhapur 19.60 79.09 78.42 0.654 Low

Prioritization of Rainfed Areas in India 93
Natural Resource Index (NRI)
State District Cow density
% Cross bred cows
Buffalo density
Milk production
index
Potential
Medium Maharashtra Ratnagiri 19.25 6.79 4.40 0.955 High
Medium Maharashtra Sindhudurg 12.45 10.59 10.23 0.943 High
Medium Maharashtra Thane 19.11 4.36 16.48 0.942 High
Medium Maharashtra Wardha 28.12 21.62 8.49 0.902 High
Medium MP Bhopal 36.80 17.18 34.17 0.862 Medium
Medium MP Chhatarpur 35.34 0.33 32.13 0.909 High
Medium MP Damoh 49.31 0.24 13.97 0.923 High
Medium MP Datia 30.92 0.69 60.78 0.867 Medium
Medium MP Dindori 21.98 0.03 5.11 0.968 High
Medium MP Gwalior 35.09 4.38 48.44 0.873 Medium
Medium MP Jabalpur 46.92 5.03 17.82 0.908 High
Medium MP Katni 54.21 0.42 13.54 0.918 High
Medium MP Mandla 38.61 1.09 7.47 0.943 High
Medium MP Morena 20.74 2.39 81.68 0.840 Medium
Medium MP Panna 42.84 0.30 18.41 0.923 High
Medium MP Raisen 34.03 2.74 13.12 0.935 High
Medium MP Sagar 53.40 0.62 18.85 0.910 High
Medium MP Sehore 35.14 14.45 16.55 0.899 High
Medium MP Seoni 26.64 4.05 11.02 0.943 High
Medium MP Sheopur Kalan 28.61 0.17 16.08 0.943 High
Medium MP Umaria 36.35 0.47 8.99 0.945 High
Medium MP Vidisha 37.60 0.73 18.36 0.928 High
Medium Orissa Bolangir 32.30 30.56 8.72 0.874 Medium
Medium Orissa Kalahandi 14.48 6.43 3.15 0.963 High
Medium Punjab Amritsar 18.88 90.32 57.51 0.661 Low
Medium Punjab Fathegarh Sahib 35.85 97.24 131.81 0.505 Low
Medium Punjab Gurdaspur 34.71 83.77 72.68 0.635 Low
Medium Punjab Hoshiarpur 28.88 84.09 60.24 0.661 Low
Medium Punjab Muktsar 27.32 74.05 52.64 0.700 Low
Medium Punjab Rupnagar 12.01 91.97 69.06 0.646 Low
Medium Tamil Nadu Erode 51.41 80.83 22.16 0.706 Low
Medium Tamil Nadu Kanniyakumari 46.78 94.07 1.08 0.712 Low
Medium Tamil Nadu Karur 35.80 74.74 17.03 0.747 Low
Medium Tamil Nadu Madurai 81.72 82.80 1.40 0.702 Low
Medium Tamil Nadu Nagapattinam 95.84 60.96 10.43 0.726 Low
Medium Tamil Nadu Perambalur 46.46 89.29 1.58 0.724 Low
Medium Tamil Nadu Pudukkottai 96.48 42.93 12.28 0.768 Medium
Medium Tamil Nadu Ramanathapuram 24.92 99.49 0.60 0.723 Low
Medium Tamil Nadu Sivaganagai 39.50 33.34 1.45 0.871 Medium
Medium Tamil Nadu Thanjavur 93.98 68.18 6.40 0.717 Low

Prioritization of Rainfed Areas in India94
Natural Resource Index (NRI)
State District Cow density
% Cross bred cows
Buffalo density
Milk production
index
Potential
Medium Tamil Nadu Thiruchirapalli 73.67 79.64 8.51 0.707 Low
Medium Tamil Nadu Thirunelveli 54.83 72.75 12.19 0.739 Low
Medium Tamil Nadu Thiruvallur 51.37 69.88 30.60 0.720 Low
Medium Tamil Nadu Thiruvarur 86.48 66.96 2.63 0.734 Low
Medium UP Aligarh 41.92 26.28 194.00 0.576 Low
Medium UP Allahabad 66.30 9.62 77.19 0.779 Medium
Medium UP Azamgarh 79.03 24.35 73.52 0.735 Low
Medium UP Bagpat 39.67 48.09 203.11 0.509 Low
Medium UP Bahraich 36.64 0.77 32.53 0.906 High
Medium UP Ballia 93.54 15.64 63.56 0.757 Low
Medium UP Balrampur 41.64 3.18 33.00 0.894 Medium
Medium UP Basti 50.53 9.84 70.30 0.807 Medium
Medium UP Bijnor 29.58 22.75 74.17 0.791 Medium
Medium UP Bulandshahar 26.95 46.51 166.66 0.586 Low
Medium UP Chitrakut 53.36 0.31 38.03 0.880 Medium
Medium UP Deoria 61.95 24.82 61.06 0.772 Medium
Medium UP Etah 23.02 20.36 124.43 0.723 Low
Medium UP Etawah 34.81 4.56 77.18 0.826 Medium
Medium UP Farrukhabad 35.73 9.11 86.62 0.799 Medium
Medium UP Fatehpur 34.99 4.04 80.04 0.823 Medium
Medium UP Firozabad 32.53 31.78 133.34 0.670 Low
Medium UP Ghaziabad 70.26 46.64 310.10 0.307 Low
Medium UP Ghazipur 76.11 9.17 94.65 0.742 Low
Medium UP Gonda 63.84 7.87 57.20 0.819 Medium
Medium UP Hardoi 48.61 0.93 64.28 0.841 Medium
Medium UP J.B.Fule Nagar 35.46 34.63 162.28 0.613 Low
Medium UP Jalaun 35.93 2.29 40.82 0.889 Medium
Medium UP Jaunpur 85.33 19.07 78.01 0.734 Low
Medium UP Kanpur (Dehat) 41.78 12.91 77.94 0.797 Medium
Medium UP Kaushambi 0.00 0.00 0.00 1.000 High
Medium UP Kheri 33.42 6.10 36.62 0.889 Medium
Medium UP Kushi Nagar 40.60 47.13 49.41 0.758 Low
Medium UP Lalitpur 51.00 0.13 30.03 0.896 Medium
Medium UP Lucknow 51.31 3.79 56.97 0.843 Medium
Medium UP Mahoba 40.32 0.78 31.78 0.903 High
Medium UP Mainpuri 22.72 3.13 93.56 0.817 Medium
Medium UP Mau 76.36 16.70 70.99 0.761 Low
Medium UP Mirzapur 76.61 14.64 46.86 0.804 Medium
Medium UP Moradabad 34.79 21.20 136.97 0.688 Low
Medium UP Muzaffarnagar 40.28 60.95 141.46 0.576 Low

Prioritization of Rainfed Areas in India 95
Natural Resource Index (NRI)
State District Cow density
% Cross bred cows
Buffalo density
Milk production
index
Potential
Medium UP Pilibhit 28.88 4.93 39.75 0.892 Medium
Medium UP Rae-Bareily 65.03 6.94 61.84 0.812 MediumMedium UP Sant Ravidas Nagar 141.28 6.95 118.61 0.638 Low
Medium UP Shahjahanpur 28.53 2.33 45.10 0.890 Medium
Medium UP Sonbhadra 44.55 1.48 15.61 0.923 High
Medium UP Sultanpur 68.49 9.76 58.74 0.806 Medium
Medium UP Varanasi 130.29 16.06 99.59 0.657 Low
Medium Uttarakhand Bageshwar 25.36 2.51 18.77 0.936 High
Medium Uttarakhand Chamoli 12.65 3.83 6.21 0.967 High
Medium Uttarakhand Haridwar 41.13 54.16 86.98 0.680 Low
Medium Uttarakhand Tehri Garwal 13.68 2.99 28.22 0.932 HighMedium West Bengal 24-Paraganas (South) 77.46 5.01 0.71 0.902 High
Medium West Bengal Cooch Behar 174.49 9.47 0.52 0.786 Medium
Medium West Bengal Jalpaiguri 95.20 12.27 1.21 0.864 Medium
Medium West Bengal Midnapore 183.28 9.93 1.27 0.774 Medium
Medium West Bengal Purulia 59.90 2.98 2.78 0.923 High
Low AP Adilabad 30.57 0.61 19.80 0.933 High
Low AP Anantapur 22.03 20.52 24.45 0.885 Medium
Low AP Chittoor 56.66 76.53 7.78 0.734 Low
Low AP Cuddapah 5.28 23.26 28.92 0.889 Medium
Low AP Kurnool 11.81 1.04 31.88 0.933 High
Low AP Mahabubnagar 19.91 7.47 20.23 0.927 High
Low AP Medak 20.72 4.22 36.48 0.908 High
Low AP Nalgonda 17.45 4.51 45.17 0.897 Medium
Low AP Prakasam 2.06 2.91 61.16 0.892 Medium
Low AP Rangareddy 18.24 14.16 30.02 0.896 Medium
Low Chhattisgarh Bastar 20.42 1.35 1.71 0.972 High
Low Chhattisgarh Sarguja 20.84 2.35 5.10 0.963 High
Low Gujarat Ahmedabad 20.92 8.34 37.94 0.895 Medium
Low Gujarat Amreli 17.15 4.19 24.23 0.932 High
Low Gujarat Banaskantha 40.08 26.33 77.34 0.766 Low
Low Gujarat Bharuch 9.44 22.74 20.49 0.900 High
Low Gujarat Bhavanagar 20.16 4.18 30.12 0.919 High
Low Gujarat Gandhinagar 54.61 53.69 155.41 0.556 Low
Low Gujarat Jamnagar 10.59 0.58 16.69 0.960 High
Low Gujarat Jungadh 26.41 3.88 38.54 0.899 High
Low Gujarat Kutch 6.29 2.21 4.22 0.981 High
Low Gujarat Mehsana 39.39 52.27 119.07 0.634 Low
Low Gujarat Panchmahal 43.12 14.60 103.62 0.749 Low
Low Gujarat Patan 16.69 7.72 58.06 0.869 Medium

Prioritization of Rainfed Areas in India96
Natural Resource Index (NRI)
State District Cow density
% Cross bred cows
Buffalo density
Milk production
index
Potential
Low Gujarat Porbander 15.19 3.84 43.37 0.904 High
Low Gujarat Rajkot 21.75 6.98 29.32 0.912 High
Low Gujarat Sabarkanta 46.52 39.66 92.73 0.701 Low
Low Gujarat Surendranagar 24.45 1.25 24.46 0.931 High
Low Haryana Bhiwani 13.48 24.61 87.30 0.783 Medium
Low Haryana Fatehabad 17.14 38.60 105.01 0.715 Low
Low Haryana Gurgaon 9.65 44.12 42.13 0.811 Medium
Low Haryana Jhajjar 17.03 32.99 110.37 0.721 Low
Low Haryana Kaithal 21.35 36.15 136.85 0.666 Low
Low Haryana Karnal 40.68 72.79 126.43 0.570 Low
Low Haryana Kurukshetra 45.34 79.56 141.67 0.523 Low
Low Haryana Mahendragarh 14.24 27.13 106.58 0.745 Low
Low Haryana Panipet 24.69 42.06 158.54 0.612 Low
Low Haryana Rewari 14.74 34.14 96.39 0.743 Low
Low Haryana Sirsa 34.32 46.72 67.93 0.736 Low
Low Haryana Sonipet 25.34 36.85 134.79 0.663 Low
Low Karnataka Bagalkot 26.28 15.95 34.87 0.875 Medium
Low Karnataka Bangalore (Rural) 62.44 54.11 11.45 0.778 Medium
Low Karnataka Bangalore (Urban) 50.92 84.06 4.75 0.727 Low
Low Karnataka Belgaum 22.86 31.27 58.73 0.802 Medium
Low Karnataka Bellary 23.63 7.34 21.84 0.921 High
Low Karnataka Bidar 27.91 7.43 28.71 0.905 High
Low Karnataka Bijapur 12.45 0.78 16.03 0.959 High
Low Karnataka Chamarajanagar 36.47 48.85 4.96 0.830 Medium
Low Karnataka Chitradurga 18.99 13.83 20.44 0.912 High
Low Karnataka Davanagere 39.42 41.21 33.48 0.800 Medium
Low Karnataka Dharwad 23.64 34.38 21.08 0.854 Medium
Low Karnataka Gadag 15.38 18.77 15.22 0.912 High
Low Karnataka Gulbarga 30.73 2.23 13.37 0.939 High
Low Karnataka Haveri 29.05 35.24 22.10 0.845 Medium
Low Karnataka Kolar 45.67 73.73 11.59 0.747 Low
Low Karnataka Koppal 18.67 10.51 13.60 0.931 High
Low Karnataka Raichur 33.21 4.29 27.45 0.909 High
Low Karnataka Tumkur 38.08 33.78 21.02 0.840 Medium
Low Maharashtra Ahmednagar 58.37 73.29 12.56 0.733 Low
Low Maharashtra Akola 22.71 8.29 10.22 0.938 High
Low Maharashtra Amravati 19.78 9.13 8.88 0.941 High
Low Maharashtra Aurangabad 22.17 36.60 8.65 0.870 Medium
Low Maharashtra Beed 29.15 43.27 20.60 0.827 Medium
Low Maharashtra Buldhana 23.52 16.15 14.02 0.911 High

Prioritization of Rainfed Areas in India 97
Natural Resource Index (NRI)
State District Cow density
% Cross bred cows
Buffalo density
Milk production
index
Potential
Low Maharashtra Dhule 20.35 23.46 12.61 0.899 High
Low Maharashtra Jalgaon 20.81 18.88 20.39 0.897 High
Low Maharashtra Jalna 19.40 14.25 9.77 0.927 High
Low Maharashtra Latur 22.69 11.52 30.85 0.897 Medium
Low Maharashtra Nagpur 26.99 24.35 8.49 0.896 Medium
Low Maharashtra Nanded 30.82 3.90 20.52 0.924 High
Low Maharashtra Nandurbar 27.15 5.85 13.51 0.934 High
Low Maharashtra Nasik 29.07 27.75 11.88 0.880 Medium
Low Maharashtra Osmanabad 25.62 45.67 19.51 0.826 Medium
Low Maharashtra Parbhani 25.90 3.30 19.07 0.933 High
Low Maharashtra Pune 33.14 72.89 17.61 0.753 Low
Low Maharashtra Raigad 18.04 4.28 8.02 0.957 High
Low Maharashtra Sangli 20.62 49.86 54.86 0.764 Low
Low Maharashtra Satara 22.45 63.23 30.57 0.768 Medium
Low Maharashtra Solapur 30.56 52.61 23.97 0.796 Medium
Low Maharashtra Washim 26.01 3.98 13.79 0.940 High
Low Maharashtra Yavatmal 25.29 4.48 8.26 0.948 High
Low MP Barwani 30.73 0.39 19.18 0.935 High
Low MP Betul 25.05 7.89 13.94 0.931 High
Low MP Bhind 24.69 4.81 62.50 0.860 Medium
Low MP Chhindwara 29.31 3.63 11.66 0.940 High
Low MP Dewas 29.15 7.93 30.14 0.900 High
Low MP Dhar 32.74 4.64 24.30 0.914 High
Low MP Guna 37.30 1.10 23.92 0.918 High
Low MP Indore 36.60 30.04 49.76 0.805 Medium
Low MP Jhabua 38.92 2.07 34.26 0.897 High
Low MP Khandwa(East Nimar) 21.89 1.19 13.22 0.952 High
Low MPKhargone(West Nimar) 30.45 0.93 21.58 0.930 High
Low MP Mandsaur 36.35 12.49 32.72 0.876 Medium
Low MP Neemuch 38.38 7.31 25.96 0.898 High
Low MP Rajgarh 45.86 1.88 80.56 0.815 Medium
Low MP Ratlam 35.24 6.83 29.24 0.897 High
Low MP Rewa 84.82 1.59 30.55 0.854 Medium
Low MP Satna 80.02 1.88 24.65 0.868 Medium
Low MP Shahdol 33.63 1.66 8.91 0.945 High
Low MP Shajapur 37.42 4.89 38.58 0.885 Medium
Low MP Shivpuri 37.93 0.93 29.97 0.908 High
Low MP Sidhi 47.00 2.29 17.67 0.915 High
Low MP Ujjain 36.75 8.12 46.90 0.864 Medium
Low Punjab Bathinda 20.70 62.98 72.26 0.703 Low

Prioritization of Rainfed Areas in India98
Natural Resource Index (NRI)
State District Cow density
% Cross bred cows
Buffalo density
Milk production
index
Potential
Low Punjab Faridkot 24.79 76.21 80.17 0.653 Low
Low Punjab Firozpur 29.60 67.59 68.23 0.689 Low
Low Punjab Jalandhar 31.99 99.95 80.78 0.585 Low
Low Punjab Kapurthala 28.82 96.12 77.99 0.602 Low
Low Punjab Ludhiana 32.00 87.59 133.28 0.531 Low
Low Punjab Mansa 15.00 43.71 92.91 0.725 Low
Low Punjab Moga 32.48 78.64 99.07 0.608 Low
Low Punjab Nawan Shehar 27.45 90.50 89.06 0.600 Low
Low Punjab Patiala 18.89 72.98 82.86 0.663 Low
Low Punjab Sangrur 26.56 72.50 134.50 0.573 Low
Low Rajasthan Ajmer 35.98 5.11 34.82 0.892 Medium
Low Rajasthan Alwar 19.05 6.54 103.94 0.795 Medium
Low Rajasthan Banswara 51.06 1.62 48.35 0.862 Medium
Low Rajasthan Baran 34.00 0.77 26.92 0.918 High
Low Rajasthan Barmer 17.92 0.06 4.69 0.973 High
Low Rajasthan Bharatpur 20.65 9.11 82.33 0.822 Medium
Low Rajasthan Bhilwara 39.06 14.16 25.36 0.881 Medium
Low Rajasthan Bikaner 19.97 6.48 4.11 0.955 High
Low Rajasthan Bundi 28.61 2.24 42.12 0.895 Medium
Low Rajasthan Chittorgarh 42.50 7.08 37.66 0.875 Medium
Low Rajasthan Churu 12.94 4.93 11.39 0.955 High
Low Rajasthan Dausa 29.41 11.80 108.18 0.764 Low
Low Rajasthan Dholpur 16.18 1.81 91.33 0.831 Medium
Low Rajasthan Dungarpur 45.94 0.59 55.48 0.859 Medium
Low Rajasthan Ganganagar 43.65 16.35 23.16 0.874 Medium
Low Rajasthan Hanumangarh 34.25 10.24 30.30 0.888 Medium
Low Rajasthan Jaipur 37.83 35.16 75.83 0.749 Low
Low Rajasthan Jaisalmer 7.09 0.18 0.06 0.992 High
Low Rajasthan Jalore 20.75 0.09 34.69 0.921 High
Low Rajasthan Jhalawar 41.32 0.29 39.72 0.890 Medium
Low Rajasthan Jhunjunu 25.65 52.23 56.70 0.750 Low
Low Rajasthan Jodhpur 23.54 5.65 9.89 0.944 High
Low Rajasthan Karauli 14.91 2.30 63.97 0.875 Medium
Low Rajasthan Kota 34.00 1.73 36.65 0.900 High
Low Rajasthan Nagaur 19.68 3.50 22.11 0.934 High
Low Rajasthan Pali 21.91 1.55 22.52 0.936 High
Low Rajasthan Rajsamand 47.08 10.53 50.91 0.840 Medium
Low Rajasthan Sawai Madhopur 17.16 1.62 48.50 0.899 High
Low Rajasthan Sikar 26.97 30.06 59.29 0.800 Medium
Low Rajasthan Sirohi 26.99 0.56 29.13 0.922 High

Prioritization of Rainfed Areas in India 99
Natural Resource Index (NRI)
State District Cow density
% Cross bred cows
Buffalo density
Milk production
index
Potential
Low Rajasthan Tonk 23.47 2.30 37.85 0.908 High
Low Rajasthan Udaipur 34.56 3.46 34.05 0.899 High
Low Tamil Nadu Ariyahur 78.26 55.24 6.65 0.766 Low
Low Tamil Nadu Coimbatore 35.91 94.87 4.00 0.717 Low
Low Tamil Nadu Dharmapuri 38.43 67.50 5.85 0.780 Medium
Low Tamil Nadu Dindigual 36.06 86.20 11.61 0.726 Low
Low Tamil Nadu Namakkal 67.57 89.74 52.02 0.618 Low
Low Tamil Nadu Salem 85.78 83.50 21.65 0.663 Low
Low Tamil Nadu Theni 42.12 88.16 1.42 0.731 Low
Low Tamil Nadu Thiruvannamalai 87.26 79.62 2.72 0.701 Low
Low Tamil Nadu Thoothukudi 166.23 68.43 52.22 0.564 Low
Low Tamil Nadu Vellore 73.27 76.34 4.22 0.722 Low
Low Tamil Nadu Villupuram 77.73 54.28 3.30 0.774 Medium
Low Tamil Nadu Virudhunagar 50.16 70.41 3.27 0.764 Low
Low UP Agra 25.07 22.22 116.59 0.729 Low
Low UP Banda 43.14 0.55 50.64 0.870 Medium
Low UP Budaun 34.63 5.61 119.90 0.755 Low
Low UP Faizabad 76.89 2.97 84.54 0.773 Medium
Low UP Hamirpur 32.28 2.87 37.41 0.897 High
Low UP Hatharas 31.56 18.49 178.75 0.631 Low
Low UP Jhansi 34.31 0.52 29.40 0.914 High
Low UP Mathura 33.46 11.27 105.74 0.765 Low
Low UP Saharanpur 39.59 25.59 116.45 0.705 Low
Note: Density = No./Sq KmDistricts having medium to high natural resource index and medium to high milk production potential deserve preference over other districts for promotion of dairy as an enterprise.

Prioritization of Rainfed Areas in India100
study team
CRIDA, Hyderabad IASRI, New Delhi
Dr. Mohammed Osman,Principal Scientist (Agronomy) & Head, PME Cell
Dr. Anil Rai, Principal Scientist &Head, Centre for Agricultural Bio-informatics
Dr. B.M.K. Raju, Senior Scientist (Agril. Statsitics)
Dr. Prachi Misra SahooSenior Scientist (Agril. Statistics)
Dr. P.K. Mishra, Project Coordinator,AICRPDA
Dr. P.K. Malhotra, Head & Professor,Division of Computer Applications
Dr. K.V. Rao, Senior Scientist (S&WCE) Dr. V.K. Bhatia, Director
Mr. A.V.M. Subba Rao, Scientist Sr. Scale (Ag. Meteorology)
Dr. C. A. Rama Rao, Principal Scientist(Ag. Economics)
Dr. K. Kareemulla, Prinicpal Scientist (Ag. Economics)
Dr. B. Venkateswarlu, Director


NATIONAL RAINFED AREA AUTHORITYPLANNING COMMISSIONGOVERNMENT OF INDIA
NEW DELHI