prioritizing patients for emergency evacuation from a
TRANSCRIPT

Clemson UniversityTigerPrints
All Dissertations Dissertations
8-2010
Prioritizing Patients for Emergency EvacuationFrom a Healthcare FacilityAshley ChildersClemson University, [email protected]
Follow this and additional works at: https://tigerprints.clemson.edu/all_dissertations
Part of the Industrial Engineering Commons
This Dissertation is brought to you for free and open access by the Dissertations at TigerPrints. It has been accepted for inclusion in All Dissertations byan authorized administrator of TigerPrints. For more information, please contact [email protected].
Recommended CitationChilders, Ashley, "Prioritizing Patients for Emergency Evacuation From a Healthcare Facility" (2010). All Dissertations. 595.https://tigerprints.clemson.edu/all_dissertations/595

Prioritizing Patients for Emergency Evacuation From aHealthcare Facility
A Dissertation
Presented to
the Graduate School of
Clemson University
In Partial Fulfillment
of the Requirements for the Degree
Doctor of Philosophy
Industrial Engineering
by
Ashley Kay Childers
August 2010
Accepted by:
Dr. Kevin Taaffe, Committee Chair
Dr. Maria Mayorga
Dr. Janet Craig
Dr. Sandra Garrett

Abstract
The success of a healthcare facility evacuation depends on communication and decision-making at
all levels of the organization, from the coordinators at incident command to the clinical staff who
actually carry out the evacuation. One key decision is the order in which each patient is chosen
for evacuation. While the typical planning assumption is that all patients are to be evacuated,
there may not always be adequate time or resources available to move all patients. In these cases,
prioritizing or ordering patients for evacuation becomes an extremely difficult decision to make.
These decisions should be based on the current state of the facility, but without knowledge of the
current patient roster or available resources, these decisions may not be as beneficial as possible.
Healthcare facilities usually consider evacuation a last-resort measure, and there are often system
redundancies in place to protect against having to completely evacuate all patients from a facility.
Perhaps this is why there is not a great deal of research dedicated to improving patient transfers.
In addition, the question of patient prioritization is a highly ethical one.
Based on a literature review of 1) suggested patient prioritization strategies for evacuation planning
as well as 2) the actual priorities given in actual facility evacuations indicates there is a lack of con-
sensus as to whether critical or non-critical care patients should be moved away from a facility first
in the event of a complete emergency evacuation. In addition, these policies are “all-or-nothing”
policies, implying that once a patient group is given priority, this entire group will be completely
evacuated before any patients from the other group are transferred. That is, if critical care patients
are given priority, all critical care patients will be transferred away from the facility before any
ii

non-critical care patient.
The goal of this research is to develop a decision framework for prioritizing patient evacuations,
where unique classifications of patient health, rates of evacuation, and survivability all impact the
choice. First, I provide several scenarios (both in terms of physical processing estimates as well
as competing, ethically-motivated objectives) and offer insights and observations into the creation
of a prioritization policy via dynamic programming. Dynamic programming is a problem-solving
technique to recursively optimize a series of decisions. The results of the dynamic programming
provide optimal prioritization policies, and these are tested with simulation analysis to observe sys-
tem performance under many of the same scenarios. Because the dynamic programming decisions
are based on the state of the system, simulation also allows the testing of time-based decisions.
The results from the dynamic programming and simulation, as well as the structural properties of
the simulation are used to create assumptions about how evacuations could be improved.
The question is not whether patient priorities should be assigned - but how patient priorities should
be assigned. Associated with assigning value to patients are a variety of ethical dilemmas. In this
research, I attempt to address patient prioritization from an ethical perspective by discussing the
basic principles and the potential dilemmas associated with such decisions.
The results indicate that an all-or-nothing, or a “greedy” policy as discussed in the literature
may not always be optimal for patient evacuations. In some cases, a switching policy may occur.
Switching policies begin by evacuating patients from one classification and then switch to begin
evacuations from the second patient class. A switch can only be made once; after a switch is made,
all remaining patients from the new group should be evacuated. When there are no more patients
of that group remaining in the system, the remaining patients from the class that was initially given
priority should be evacuated. In the case of critical and non-critical care patients, switching policies
first give priority to non-critical care patients. When the costs of holding patients in the system are
not included in the models — and the decisions are just based on maximizing the number of saved
iii

lives — the switching policies may perform as good or better than the greedy policies suggested in
the literature. In addition, when holding costs are not included, it is easier to predict whether the
optimal policy is a greedy policy or a switching policy.
Prioritization policies can change based on the utility achieved from evacuating individual patients
from each class, as well as for other competing objective functions. This research examines a
variety of scenarios — maximizing saved lives, minimizing costs, etc. — and provides insights
on how the selection of an objective impacts the choice. Another insight of this research is how
multiple evacuation teams should be allocated to patients. In the event that there is more than
one evacuation team dedicated to moving a group of patients, the two teams should be allocated
to the same patient group instead of being split between the multiple patient groups.
iv

Dedication
This dissertation is dedicated to my mom, who when I was 16 years old, told me that women with
multiple earrings could not be successful and to my sister who did not believe her but instead
supported me.
In addition, it is my opinion — after years of research aimed at improving evacuations — that my
Aunt Louise should be given priority if her healthcare facility is ever forced to evacuate.
v

Acknowledgments
I am so fortunate to have had a committee so willing to support me through this process, and I
would like to express my sincerest gratitude to my advisor, Kevin Taaffe as well as my committee
members: Janet Craig, Sandra Garrett, and Maria Mayorga. The guidance, input, time, and effort
that each committee member has given me is more than I ever expected, and I am so grateful to
each for their unique contributions to my education, research, and future.
I also have to thank my “unofficial committee members” for her support along the way as well as
all of the other faculty members in the Department of Industrial Engineering. I feel so privileged
to have learned from you all.
I must also thank my friend, Gurucharann Visagamurthy, who helped me so much as I started the
research process. He tailored Dr. Mayorga’s wonderful code and taught me so much along the way.
Finally, I must thank my family and all of my friends who have endured this process with me.
vi

Table of Contents
Title Page . . . . . . . . . . . . . . . . . . . . . . . . . . . . . . . . . . . . . . . . . . . i
Abstract . . . . . . . . . . . . . . . . . . . . . . . . . . . . . . . . . . . . . . . . . . . . ii
Dedication . . . . . . . . . . . . . . . . . . . . . . . . . . . . . . . . . . . . . . . . . . . v
Acknowledgments . . . . . . . . . . . . . . . . . . . . . . . . . . . . . . . . . . . . . . vi
List of Tables . . . . . . . . . . . . . . . . . . . . . . . . . . . . . . . . . . . . . . . . . ix
List of Figures . . . . . . . . . . . . . . . . . . . . . . . . . . . . . . . . . . . . . . . . . x
1 Introduction . . . . . . . . . . . . . . . . . . . . . . . . . . . . . . . . . . . . . . . . 11.1 Background . . . . . . . . . . . . . . . . . . . . . . . . . . . . . . . . . . . . . . . . . 11.2 Objectives of Research . . . . . . . . . . . . . . . . . . . . . . . . . . . . . . . . . . . 31.3 Outline . . . . . . . . . . . . . . . . . . . . . . . . . . . . . . . . . . . . . . . . . . . 51.4 Scope of Research . . . . . . . . . . . . . . . . . . . . . . . . . . . . . . . . . . . . . 61.5 Need, Significance, and Potential for Research . . . . . . . . . . . . . . . . . . . . . . 8
2 Review of the Literature . . . . . . . . . . . . . . . . . . . . . . . . . . . . . . . . 112.1 Healthcare Facility Evacuations and Lessons Learned . . . . . . . . . . . . . . . . . . 122.2 Prioritizing Patients for Evacuations . . . . . . . . . . . . . . . . . . . . . . . . . . . 222.3 General Evacuation Research . . . . . . . . . . . . . . . . . . . . . . . . . . . . . . . 262.4 Research for Improving Healthcare Facility Evacuations . . . . . . . . . . . . . . . . 292.5 Emergency Preparedness in Healthcare . . . . . . . . . . . . . . . . . . . . . . . . . . 342.6 Modeling Policy Decisions . . . . . . . . . . . . . . . . . . . . . . . . . . . . . . . . . 382.7 Evacuation and Transportation Data . . . . . . . . . . . . . . . . . . . . . . . . . . . 432.8 Goals . . . . . . . . . . . . . . . . . . . . . . . . . . . . . . . . . . . . . . . . . . . . 472.9 Ethical Considerations . . . . . . . . . . . . . . . . . . . . . . . . . . . . . . . . . . . 47
3 Ethics and Objectives . . . . . . . . . . . . . . . . . . . . . . . . . . . . . . . . . . 503.1 Ethical Perspectives . . . . . . . . . . . . . . . . . . . . . . . . . . . . . . . . . . . . 533.2 Ethics and Public Policy . . . . . . . . . . . . . . . . . . . . . . . . . . . . . . . . . . 563.3 Ethical Perspectives in Healthcare Emergency Preparedness . . . . . . . . . . . . . . 57
4 Evacuation Survey . . . . . . . . . . . . . . . . . . . . . . . . . . . . . . . . . . . . 614.1 Survey Creation . . . . . . . . . . . . . . . . . . . . . . . . . . . . . . . . . . . . . . 61
vii

4.2 Survey Responses . . . . . . . . . . . . . . . . . . . . . . . . . . . . . . . . . . . . . . 624.3 Survey Conclusions . . . . . . . . . . . . . . . . . . . . . . . . . . . . . . . . . . . . . 64
5 Markov Decision Process Model, Dynamic Programming, and Simulation . . . 665.1 Model Introduction . . . . . . . . . . . . . . . . . . . . . . . . . . . . . . . . . . . . . 675.2 Model Parameters and Assumptions . . . . . . . . . . . . . . . . . . . . . . . . . . . 685.3 Basic Two-Class Model . . . . . . . . . . . . . . . . . . . . . . . . . . . . . . . . . . 705.4 Numeric Tests and Initial Patient Selection Decisions . . . . . . . . . . . . . . . . . . 735.5 Patient Selection Decisions with Simulation . . . . . . . . . . . . . . . . . . . . . . . 805.6 Conclusions from the Single Server Model . . . . . . . . . . . . . . . . . . . . . . . . 92
6 Properties of the Single Server Model . . . . . . . . . . . . . . . . . . . . . . . . 936.1 Sensitivity Analysis . . . . . . . . . . . . . . . . . . . . . . . . . . . . . . . . . . . . . 946.2 Structural Properties . . . . . . . . . . . . . . . . . . . . . . . . . . . . . . . . . . . . 1116.3 Policy Possibilities . . . . . . . . . . . . . . . . . . . . . . . . . . . . . . . . . . . . . 1146.4 Model Properties Conclusions . . . . . . . . . . . . . . . . . . . . . . . . . . . . . . . 115
7 Modeling Extensions . . . . . . . . . . . . . . . . . . . . . . . . . . . . . . . . . . . 1237.1 Two-server Model . . . . . . . . . . . . . . . . . . . . . . . . . . . . . . . . . . . . . 1237.2 Patient Transitions between Classes . . . . . . . . . . . . . . . . . . . . . . . . . . . 132
8 Findings, Implications, and Conclusions . . . . . . . . . . . . . . . . . . . . . . . 1348.1 Modeling Conclusions and Insights for Practitioners . . . . . . . . . . . . . . . . . . 1368.2 Need for Future Research . . . . . . . . . . . . . . . . . . . . . . . . . . . . . . . . . 1398.3 Concluding Remarks . . . . . . . . . . . . . . . . . . . . . . . . . . . . . . . . . . . 140
Appendices . . . . . . . . . . . . . . . . . . . . . . . . . . . . . . . . . . . . . . . . . . 142A Hospital Evacuation Survey . . . . . . . . . . . . . . . . . . . . . . . . . . . . . . . . 143B Mock Evacuation Experiences . . . . . . . . . . . . . . . . . . . . . . . . . . . . . . . 150C Dynamic Programming Models . . . . . . . . . . . . . . . . . . . . . . . . . . . . . . 152D Simulation . . . . . . . . . . . . . . . . . . . . . . . . . . . . . . . . . . . . . . . . . . 154E Electronic Attachments . . . . . . . . . . . . . . . . . . . . . . . . . . . . . . . . . . 157
Bibliography . . . . . . . . . . . . . . . . . . . . . . . . . . . . . . . . . . . . . . . . . . 160
viii

List of Tables
2.1 Factors that Affect the Decision to Evacuate. . . . . . . . . . . . . . . . . . . . . . . 322.2 Papers That Discuss Rationing in Healthcare. . . . . . . . . . . . . . . . . . . . . . . 362.3 Time Required to Evacuate Patients. . . . . . . . . . . . . . . . . . . . . . . . . . . . 45
3.1 Internal Stakeholders in a Healthcare Facility. . . . . . . . . . . . . . . . . . . . . . . 503.2 Breakdown of Healthcare Evacuation Dilemmas by Type. . . . . . . . . . . . . . . . 52
4.1 Which patient group would you most likely transport first? . . . . . . . . . . . . . . 634.2 Which patient age group do you think has priority in transporting to safety? . . . . 63
5.1 Summary of Test Parameters. . . . . . . . . . . . . . . . . . . . . . . . . . . . . . . . 745.2 Average Performance Measures of Dynamic Programming Policies. . . . . . . . . . . 815.3 Comparison of the Optimal Policies with Greedy Policies - 8 Hours. . . . . . . . . . 885.4 Comparison of the Optimal Policies with Greedy Policies - 16 Hours. . . . . . . . . . 895.5 Suggested Switching Times. . . . . . . . . . . . . . . . . . . . . . . . . . . . . . . . . 91
6.1 Constant DOE Parameters for Sensitivity Analysis of the Single Server Model . . . . 956.2 Variable DOE Parameters for Sensitivity Analysis of the Single Server Model . . . . 966.3 Parameters Settings for DOE Test #1 . . . . . . . . . . . . . . . . . . . . . . . . . . 966.4 Sensitivity Analysis Results for the Single Server Model, 1 of 2 . . . . . . . . . . . . 1166.5 Sensitivity Analysis Results for the Single Server Model, 2 of 2 . . . . . . . . . . . . 1176.6 Sensitivity Runs Selected for Additional Analysis. . . . . . . . . . . . . . . . . . . . . 1186.7 Values Chosen for the Additional, Incremental Analysis. . . . . . . . . . . . . . . . . 1186.8 Parameter Ratios for Greedy, Type 1 Policies with No Holding Costs. . . . . . . . . 1196.9 Parameter Ratios for Greedy, Type 2 Policies with No Holding Costs. . . . . . . . . 1206.10 Parameter Ratios for Switching Policies with No Holding Costs. . . . . . . . . . . . . 1216.11 Possible Policies for the Single Server Model based on Changes in X1. . . . . . . . . 1216.12 Possible Policies for the Single Server Model based on Changes in X2. . . . . . . . . 122
7.1 Sensitivity Analysis Results for the Single Server Model, 1 of 2 . . . . . . . . . . . . 1267.2 Sensitivity Analysis Results for the Single Server Model, 2 of 2 . . . . . . . . . . . . 127
1 Mock Evacuation Data Collection - Facility 1. . . . . . . . . . . . . . . . . . . . . . . 1502 Mock Evacuation Data Collection - Facility 2. . . . . . . . . . . . . . . . . . . . . . . 1513 List of Randomized Sensitivity Analysis Trials for the Single Server Model, 1 of 2 . . 1584 List of Randomized Sensitivity Analysis Trials for the Single Server Model, 2 of 2 . . 159
ix

List of Figures
2.1 Summary of prioritization strategies for critical and non-critical care patients. . . . . 26
3.1 Example of the moral universe for healthcare facility evacuations. . . . . . . . . . . . 51
5.1 Transition diagram for the single server model when Policy 1 is chosen. . . . . . . . 725.2 Initial observations - Test 1 policy decisions. . . . . . . . . . . . . . . . . . . . . . . . 755.3 Initial observations - Test 2 policy decisions. . . . . . . . . . . . . . . . . . . . . . . . 765.4 Initial observations - Tests 3 and 4 policy decisions. . . . . . . . . . . . . . . . . . . . 785.5 Initial observations - Tests 4, 5, and 6 policy decisions. . . . . . . . . . . . . . . . . . 795.6 Simulation results for DP policy - Test 1. . . . . . . . . . . . . . . . . . . . . . . . . 825.7 Simulation results for DP policy - Test 2. . . . . . . . . . . . . . . . . . . . . . . . . 835.8 Simulation results for DP policy - Test 3. . . . . . . . . . . . . . . . . . . . . . . . . 845.9 Simulation results for DP policy - Test 4. . . . . . . . . . . . . . . . . . . . . . . . . 855.10 Simulation results for DP policy - Test 5. . . . . . . . . . . . . . . . . . . . . . . . . 865.11 Simulation results for DP policy - Test 6. . . . . . . . . . . . . . . . . . . . . . . . . 87
6.1 Optimal policy diagrams: Switching curve moving down. . . . . . . . . . . . . . . . . 946.2 Optimal policy diagrams: Switching curve moving up. . . . . . . . . . . . . . . . . . 956.3 Sample output file: “DataOUT.txt” for DOE Run #1. . . . . . . . . . . . . . . . . . 976.4 Sample value function output: DOE Run #1. . . . . . . . . . . . . . . . . . . . . . . 976.5 Property 1: Sample value functions for selected fixed values of X1: DOE Run #1. . 986.6 Property 1: Sample value functions for selected fixed values of X2: DOE Run #1. . 986.7 Sample policy diagrams at the low, medium, and high ratio settings. . . . . . . . . . 996.8 Factorial design analysis for impact on policy response. . . . . . . . . . . . . . . . . . 1016.9 Factorial design analysis for impact on value response. . . . . . . . . . . . . . . . . . 1026.10 Incremental changes to DOE #18. . . . . . . . . . . . . . . . . . . . . . . . . . . . . 1036.11 Incremental changes to DOE #24. . . . . . . . . . . . . . . . . . . . . . . . . . . . . 1046.12 Incremental changes to DOE #27. . . . . . . . . . . . . . . . . . . . . . . . . . . . . 1056.13 Incremental changes to DOE #41. . . . . . . . . . . . . . . . . . . . . . . . . . . . . 1066.14 Incremental changes to DOE #44. . . . . . . . . . . . . . . . . . . . . . . . . . . . . 1076.15 Incremental changes to DOE #59. . . . . . . . . . . . . . . . . . . . . . . . . . . . . 1086.16 Incremental changes to DOE #62. . . . . . . . . . . . . . . . . . . . . . . . . . . . . 109
7.1 Optimal policies for the two-server: DOE Runs #44 and #53. . . . . . . . . . . . . . 1257.2 Optimal policies for the two-server: DOE Runs #62 and #68. . . . . . . . . . . . . . 1287.3 Optimal policies for the two-server: DOE Runs #71 and #77. . . . . . . . . . . . . . 1287.4 Optimal policies for the two-server: DOE Run #80. . . . . . . . . . . . . . . . . . . 129
x

1 Simulation screen shot: Patient creation and classification. . . . . . . . . . . . . . . . 1542 Simulation screen shot: Hold then evacuate. . . . . . . . . . . . . . . . . . . . . . . . 1543 Simulation logic: Hold Type 1 patients and evacuate Type 2. . . . . . . . . . . . . . 1554 Simulation screen shot: Remove patients from evacuation queues. . . . . . . . . . . . 1555 Simulation screen shot: Control entity to determine incomplete evacuations. . . . . . 156
xi

Chapter 1
Introduction
1.1 Background
Over the past few years, there has been an increase in research and literature related to emergency
preparedness and response. Most of this research relates to the preparation for, or response to, mass
casualty emergencies. In these events, a healthcare facility is expected to be a resource to the af-
fected population, and the facility must make decisions associated with sudden, increased demands.
There are a number of papers that focus on creating and maintaining “surge capacity” in hospitals
or rationing scarce resources — including patient beds, operating rooms, ventilators, etc. — after
a mass casualty event (see Chapter 2, Section 2.5). There is not a good deal of research, however,
that considers decision making in healthcare when the facility itself is a victim of an emergency
([19], [108], [143]). Some emergency types may affect a healthcare facility’s ability to function and
may therefore force the need for a complete evacuation. Healthcare facility evacuations present a
number of challenges for patients as well as clinical staff and administrators.
A healthcare facility may be the victim of an emergency if 1) its resources are overwhelmed with
sudden and unexpected demands or 2) the emergency causes - or presents potential for - damage
to the facility. Terrorist attacks, pandemic outbreaks, or some other type of external emergency
may cause this first scenario. In these types of emergency situations, a hospital is expected to be
1

a resource for response efforts. A fire, flood, bomb threat, or other internal emergency, may cause
the second scenario. Hurricanes or other natural disasters may cause both. In order to meet the
demands of new patients, or to continue to care for their existing patients, a healthcare facility
may have to evacuate some or all of its occupants. Depending on the type of facility, less critical
patients can be discharged early to decrease the number of patients that require coordinated evac-
uation efforts, but those that need continued care will have to be transferred to another facility.
Every healthcare facility is required to have an evacuation plan in place ([13], [143], [156]), and
although considered a last resort, it is almost certain that every healthcare facility has the potential
for some sort of emergency that would require patient transfers. Based on their location, certain
facilities will have varying levels of risk. For example, facilities on the East Coast are more likely to
have to evacuate patients due to hurricanes. In addition, these types of emergencies are forecasted,
and the facility may be able to make evacuation decisions in advance of the event and even execute
a “preemptive” evacuation.
Evacuation is considered a last-resort measure by many healthcare facility operators, especially due
to the cost and advanced care often required by the patients. Some will even go as far as saying
“we will not evacuate” [64]. The facility would prefer not to shut down, and they often have system
redundancies in place to protect against catastrophic failures. Perhaps this is why there is not a
great deal of research aimed at improving policies and methods for healthcare facility evacuations.
Experiences during recent hurricanes, however, identified many healthcare facilities having to per-
form last-minute, pre-storm evacuations, as well as some post-storm evacuations.
Healthcare facilities usually implement one of the following generalized coordination structures to
address decision making: the Hospital Incident Command System (HICS) [7] or the National In-
cident Management System (NIMS) [8]. Both of these emergency management systems utilize a
central Incident Command System (ICS) and can actually be used in conjunction with each other.
The ICS is an all-hazard incident management system that defines the components and character-
istics of the management structure during the entire incident.
2

It is difficult to create a complete and comprehensive evacuation plan that includes all emergency
types and response options [151]. Therefore, healthcare facility evacuation plans tend to be high-
level, generic documents. Some researchers suggest that evacuation plans are written just to satisfy
the requirements of accrediting agencies and are rarely practiced ([108], [152]). Decision-making
guidelines are usually nondescriptive, especially concerning the order in which patients will be
selected for transfer. However, an evacuation plan that addresses the patient roster, staffing re-
quirements, supplies, and equipment must be laid out in great detail in order for an evacuation to
be implemented effectively [156].
1.2 Objectives of Research
The typical planning assumption of a complete, emergency evacuation is that all patients will
be transferred away from the facility, so most evacuation plans do not discuss which patients to
evacuate if there is inadequate time available to transfer all patients. Moreover, there is no docu-
mentation about which patient types should be transported first or if transporting a certain patient
type actually adds more risk than sheltering that patient in place. When there are limited time and
resources, a plan that includes a patient prioritization scheme could provide healthcare providers
guidance in setting patient priorities for evacuation. To further support this, it has been noted
that unclear lines of authority have contributed to a large number of response failures [45]. By
specifying an authority structure clearly and providing decision-makers with the best information
about patient priorities, the clinical staff may have an increased ability to respond to the right
patients at the right time.
In addressing the issues outlined above, the following questions come to mind:
• What are the current policies for patient selection decisions during evacuations?
• If there are limited resources and time, which patients should be evacuated first?
3

• When is a greedy, all-or-nothing policy optimal?
• Can patients be classified based on certain characteristics?
• What are the underlying objectives of evacuation decisions?
• Can we provide patient priority guidelines based on the risks and rewards?
• What are the ethical implications of various evacuation policies?
• Can patient priority guidelines be included in evacuation plans?
This research proposes a two-phase modeling approach to determine the order in which patients
should be chosen for evacuation. Unique classifications of patient health, rates of evacuation, and
survivability all impact the choice. First, I consider several scenarios (both in terms of physical
processing estimates as well as competing, ethically-motivated objectives) and offer insights and
observations into the creation of a prioritization policy. Dynamic programming is used to model the
system, run a variety of tests to observe the optimal policy, and observe properties of the optimal
solutions. The results of the numeric tests from the dynamic program are used in simulation analy-
sis to observe system performance under many of the same scenarios. In addition, I use simulation
analysis for tests that complicate the dynamic program. These two tools can be used together
to analyze an evacuation for any facility: 1) the dynamic program is used to develop a decision
framework for prioritizing patient evacuations and determine properties of the optimal solutions,
and 2) the simulation model measures the performance of the optimal evacuation policy or extends
the modeling capabilities.
During an emergency, the ethical perspective is utilitarian: do the most good for the most amount
of people (beneficence). Should this be interpreted as “get the most out”? Is there a better objec-
tive to incorporate fairness, a second principle of ethical healthcare? The prioritization policies that
will be discussed in this research can be categorized in two ways: greedy and switching. A greedy
policy chooses to evacuate one patient group entirely before starting to evacuate any other patient
groups, and a switching policy begins evacuating a patient class and then switches to another based
4

on the number of each type remaining in the system. As shown in Chapters 5, 6, and 7, the policies
change with the choices for model inputs.
Is it ethical to enact a policy that requires all of a certain patient group to be evacuated before
beginning to evacuate any other patient groups? For obvious reasons, and reasons that will be
discussed in Chapter 3, it would be unlikely that a clinical staff would be comfortable with this
decision, especially when their patients are not categorized as the first to be evacuated. Manipu-
lating values, such as holding costs or rewards, encourages changes to the policies, such that other
patient groups get attention more quickly, but is this ethical?
Finally, this research considers how the utilitarian views of evacuation conflict with the ethics of
virtue that tend to guide healthcare practitioners. How will conflicting ethical perspectives of a
clinical staff, whose work is based more on morals than consequences, affect an evacuation based
on utility? These issues will be discussed in Chapter 3. How value is placed and modeled on
transferring patients, patient deaths, and keeping patients in the system will also be examined and
used in Chapter 5.
1.3 Outline
The dissertation is structured in the following manner. Chapter 2 introduces the relevant literature
including lessons learned from previous evacuations, research directly related to healthcare facility
evacuation, other emergency preparedness literature, and modeling. Chapter 3 includes a detailed
discussion of the ethical dilemmas and perspectives related to this problem. In order to gain a base-
line understanding of local evacuation plans, a survey was distributed to healthcare facilities across
South Carolina. Chapter 4 discusses the survey results. In Chapter 5, the model assumptions and
parameters are introduced, and a single-server model is introduced and tested with dynamic pro-
gramming and simulation analysis. In Chapter 6, the dynamic programming optimality equation
for the single server model is further examined including a sensitivity analysis and a discussion of
5

the properties of the optimal solutions and implications for practitioners. Chapter 7 presents an
overview of model extensions, and Chapter 8 contains conclusions and recommendations for future
work.
1.4 Scope of Research
Healthcare facilities, like police stations, airports, and schools, are classified as essential facilities
because they are facilities that the community depends on for support and/or resources. During
an emergency event, the population looks to essential facilities, such as a hospital or even a nursing
home, to provide medical care, and in some cases, even the most basic resources such as food, water,
and shelter. In addition, the dependence of a healthcare facility’s occupants on its staff leads to
a second classification as a vulnerable facility. Falling into either of these categories - an essential
facility or a vulnerable facility - requires specific considerations for evacuation decisions [152]. Since
a healthcare facility falls into both, evacuation plans should include guidelines for how to handle
both internal and external emergencies. If patient evacuations are forced by an external emergency,
the facility may be faced with sudden, increased demands. If an evacuation is underway, it has
already been determined that the facility cannot function fully or safely, and special considerations
need to be given as to how to handle incoming patients. This research focuses on prioritizing the
vulnerable or dependent population of a healthcare facility and does not consider the effects of the
classification of an essential facility.
Every facility may be faced with an emergency situation that would require an evacuation. No-
notice emergencies (such as fires) leave little to no time for decision making. Other emergencies
may threaten in advance or cause damages afterwards, such as a hurricane. Depending on the
location of the facility, external events such as hurricanes or floods give an advanced notice that
an evacuation may be necessary. Manmade emergencies or the aftereffects of disasters (i.e. loss of
power, water, or oxygen) could require an evacuation after an emergency. In either of these cases,
the administrative and clinical staff would very likely have some sort of decision window to prepare
6

for patient transfers. In such cases, an Incident Command Center may be established. Fires or
other emergencies that cause immediate damage to the facility and danger to the patients require
an immediate response. In these cases, the staff must act instantaneously, and there will be no time
for Incident Command to delegate the staff’s assignments. This research pertains to evacuations
with short- or long-term notice though insights from the results may be beneficial when planning
for evacuations due to fires and other no-notice emergencies. In addition, having knowledge of the
guidelines will likely help the clinical staff know how to respond in real-time when there is no time
for direction from management.
As previously mentioned, certain emergencies may only require a healthcare facility to evacuate
some of its patients. These partial evacuations can occur when some type of external emergency has
increased demands by causing a patient surge. Some patients may need to be transferred to other
facilities so that there are enough beds available to accommodate these incoming patients. Other
emergencies may require a small area of the facility to temporarily evacuate some of its patients
to directly outside of the facility, but these patients can usually return to their beds or some other
area within a reasonable amount of time.
In the case of a forecasted emergency, the staff would likely discharge as many patients as possi-
ble to decrease the number of patients for which the healthcare facility would be responsible for
transport. For the remainder of the discussions, we assume that the patient population has already
been reduced by early discharges and that all patients remaining in the facility will have to be
transported. This research focuses on an emergency that would require a full evacuation where all
patients in the facility are at risk due to some type of internal or external emergency; sheltering-in-
place is not an option. The additional assumption is that there are not enough resources available
to transport all patients away from the facility before the emergency occurs or some critical time
window ends.
7

1.5 Need, Significance, and Potential for Research
There are a variety of papers that clearly indicate that methods for ethically prioritizing patients
for evacuation would be a beneficial contribution.
• “The whole topic of the evacuation of institutionalized populations badly needs research for it
seems to require inordinate attention and resources, and generates many problems when such
withdrawal movements are required” Hans and Sell, 1974 in Evacuation Risks: A Tentative
Approach for Quantification [68].
• “Because of the large number of health care facilities in the United States, their placement and
geographical presence in the population, their centrality in developing an adequate community
response to a disaster, and the huge level of risk to patients associated with evacuation, it is
important for health care executives to make sound decisions concerning the process of facility
evacuation... Most research has focused on disaster events or facility planning for disaster
types and not the decision processes required for a specific response or outcome in disasters”
Kathlyn McGlown, in her 1999 dissertation Determinants of the Evacuation of Health Care
Facilities [108].
• “Explicit guidelines for decision making on residents’ evacuation must be developed” Insights
from the “Hurricane Summit,” funded by the John. A Hartford Foundation in 2006 [78].
• “Familiarity with and utilization of a framework for ethical decision-making may facilitate
health care professionals in maneuvering through disaster-instigated ethical dilemmas” “Dis-
aster Ethics, Healthcare and Nursing: A Model Case Study to Facilitate the Decision Making
Process” in the Online Journal of Health Ethics [129].
• “The goals of triage in different environments and contexts can lead to divergent perspectives
of what constitutes ethically sound decision making,” and “a system that allows real-time
classification of risks and benefits...would be a great advantage in ethical decision making” in
“Lifeboat Ethics: Considerations in the Discharge of Inpatients for the Creation of Hospital
Surge Capacity” [93].
8

• “Advance agreement is needed among key parties about which patients will be evacuated first.
Several disputes developed over priorities in the days after Katrina. There was disagreement,
for example, over whether the sickest patients or those more likely to survive should be
evacuated first” in “Hospitals in Hurricane Katrina: Challenges Facing Custodial Institutions
in a Disaster” [63].
• “Medical and social needs must be considered in trigging evacuees. The traditional medical
model for triage in the U.S. is to treat the most critically injured first; in an overwhelming
disaster situations, health care providers may shift to battlefield triage practices in which
those with the highest probability of survival are treated first. Little is known about lay
clinicians’ abilities to shift paradigms during response” from the AHRQ’s “Recommendations
for a National Mass Patient Evacuee Movement, Regulating, and Tracking System” [51].
• “The ethical decisions inherent in triage decisions should not be first considered during a
real event. Rather, they should be rehearsed and discussed long before they are needed” from
“Terrorism and the Ethics of Emergency Medical Care” in the Annals of Emergency Medicine
[126].
The goal of this research is to address these issues by developing patient prioritization guidelines to
improve decision-making during an emergency evacuation from a healthcare facility. By modeling
the system and decisions mathematically - and by considering the ethical dilemmas associated with
these types of decisions - some of the decision responsibility can be taken out of the clinical staff’s
hands. This will allow them to focus on their primary task of safely performing patient transfers.
This research will promote a safe and effective means for continuing patient care during a disaster
and thereby improve the standards for the quality of care during an emergency.
There are two obvious benefits to this research: first, the insights from this research can help emer-
gency planners evaluate and determine guidelines and policies for evacuations. Such guidelines are
based on mathematical modeling and will be suggested in this research. These can be included
within emergency plans and practiced by the staff. Second, the insights from the guidelines and
9

policies can be used to assist a clinician when faced with real-time decision making dilemmas during
situations that have not been planned.
Finally, it should be noted that this research is not intended to direct clinicians from a medical
perspective. Real-time decision making obviously requires unique, medical information for each
patient. This research assumes, however, that the outcomes of such decisions can be improved by
supplementing medical expertise with the insights from the models.
10

Chapter 2
Review of the Literature
This chapter will discuss the relevant literature from a variety of disciplines including healthcare,
engineering, and ethics. The purpose is to review similar work and research efforts as well as to
develop a base understanding of healthcare evacuation decision making. In addition, this literature
review sets the stage for the modeling efforts being introduced and explored in the subsequent
chapters.
This chapter begins by reviewing papers that discuss actual healthcare facility evacuations (Section
2.1) and the lessons learned. Section 2.2 discusses the patient prioritization strategies for evacua-
tion based on a review of actual patient transfers or suggested protocol.
The next section, Section 2.3, discusses a higher-level stream of research dedicated to how the
general population responds to evacuations. This includes how decisions are made about whether
to evacuate, when to evacuate, and how to evacuate (selection of routes).
Section 2.4 outlines the research that directly relates to improving healthcare facility evacuations.
Most of the healthcare emergency preparedness literature focuses on the healthcare facility’s role
during an emergency - instead of directly discussing evacuations only - so this much larger stream of
research - including surge capacity, triage, and altered standards of care - is explored in Section 2.5.
11

Section 2.6 focuses on modeling techniques for allocating resources to time-sensitive tasks. The
focus is on two papers, Glazebrook et al. and Argon et al. that are directly related to this research.
In addition, examples of the use of dynamic programming and simulation for healthcare policies or
improvement are outlined. The modeling parameters that will be considered in future chapters are
discussed in Section 2.7.
Section 2.9 presents literature related to the ethical considerations in this problem. A more detailed
discussion of ethics, however, is presented in Chapter 3.
2.1 Healthcare Facility Evacuations and Lessons Learned
The following section details the lessons learned during actual healthcare facility evacuations. Each
subsection outlines the lessons learned and needs for improvement for pre-disaster planning, de-
cision making, patient care and transportation, staffing, record-keeping, and communication as
identified in the papers. The following papers describe emergency events and are were used to
summarize the lessons lessons learned in Sections 2.1.1 - 2.1.6.
• Sternberg et al. [152] investigated databases to make assumptions about the types of haz-
ards that resulted in 275 hospital evacuations in the United States between 1971 and 1999.
Over half of these healthcare facility evacuations could be primarily attributed to internal
emergencies such as a fire or potential exposure to hazardous materials.
• Schultz et al. [143] created and issued a questionnaire to personnel at area hospitals that
were on duty during the Northridge, California earthquake. The earthquake resulted in eight
hospital evacuations: six were evacuated with 24 hours of the earthquake, one evacuated
3 days after the earthquake, and one evacuated 2 weeks after the earthquake. For the six
hospitals that evacuated soon after the earthquake, the decision to evacuate was based on
12

non-structural damage. The other two hospitals had to evacuate patients because of non-
repairable structural damage.
• Cocanour et al. [31] described the “Lessons Learned From the Evacuation of an Urban
Teaching Hospital” after Hurricane Allison caused flooding and forced the full evacuation of
Memorial Hermann Hospital and Memorial Hermann Children’s Hospital. The facilities were
able to discharge 169 patients but still had to evacuate 406 patients. These patients were
transferred to 29 other facilities within approximately 30 hours.
• Bowers et al. [19] described the lessons learned from the perspective of Texas Medical Center’s
entire hospital system after Hurricane Allison.
• Hyer et al. [77] documented the experiences of almost 300 nursing homes during the 2004
Hurricane Season. Approximately 16% of facilities had to evacuate at least once.
• Augustine and Schoettmer [11] described a complete evacuation forced by a bomb threat.
The staff of Galion Community Hospital in Columbus, Ohio evacuated all 46 of its patients
to a single, similar-sized facility located 20 miles from their hospital.
• Bovender and Carey [18] summarized the experiences and lessons learned from the evacua-
tion of Tulane Hospital after Hurricane Katrina. When the decision to evacuate was made,
there were approximately 1,300 people at Tulane Hospital. Only 121 were patients; the rest
were staff members, medical students and faculty, family members of patients and staff, and
“medically fragile” patients sent from the Superdome. There were also 71 pets.
• Lach et al. [95] reviewed the basic considerations for evacuating older patients based on
evacuations during Hurricanes Katrina and Rita.
• Gray and Hebert [63] conducted interviews with hospital executives, public officials, and
others in New Orleans-area hospitals to summarize the effects of evacuations conducted before
and after Hurricane Katrina.
• Castro et al. [25] distributed surveys to assess the response of long-term care facilities during
Hurricanes Katrina and Rita.
13

• Dosa et al. [36] interviewed twenty nursing home administrative directors about the evacua-
tion decisions made during Hurricanes Katrina and Rita.
• Laditka et al. [96] described the care of nursing home evacuees after transport based on
interviews with staff members in receiving facilities after Hurricane Katrina.
• Hyer et al. [78] described need for improvements as identified at the John A. Hartford
Foundation’s “Hurricane Summit” in 2006. This report pertains to the preparation for and
response to emergencies at long-term acute care facilities.
• The U.S. Government Accountability Office’s “Limitations in Federal Evacuation Assistance
for Health Care Facilities Should be Addressed” [1] discussed the federal government’s in-
volvement in hospitals’ and nursing homes’ preparation for evacuation.
• A report from the Office of Inspector General evaluated “Nursing Home Emergency Pre-
paredness and Response During Recent Hurricanes” [2] by analyzing survey and interview
responses as well as emergency plans.
• Lewis [98] described the evacuation response and lessons learned after a tornado damaged a
facility in Americus, Georgia in 2007. Before the tornado, all patients were moved to interior
hallways. Fifty-three patients were evacuated to local hospitals in approximately 3 hours.
• Barnett et al. [13] described two healthcare facility evacuations in Southern California to
avoid damage from the wildfires in 2008. A hospital and a skilled nursing facility evacuated
77 inpatients and 122 skilled nursing facility patients to 7 hospitals and 13 long-term care
facilities within 7 hours.
2.1.1 Pre-disaster Planning
This section discusses issues identified during evacuations that can be categorized as pre-disaster
planning. Many of the lessons learned in the papers listed above relate to areas that should have
been (or were successfully) discussed and implemented well in advance of any of the disasters de-
scribed above.
14

Some of the lessons learned pertain to architectural or design concerns and should therefore be
considered when developing a new or renovating an existing facility. For example, services that
are critical to continued patient care - pharmacy, nursing units, etc. - should not be placed in
areas that may be affected by flooding ([31], [63]). When these essential services are unnecessarily
damaged, an evacuation that might otherwise be avoidable may be required. During Hurricane
Katrina, generators were damaged, and facilities were forced to evacuate. Gray and Herbert [63]
suggested that, had they been placed in areas that were not subject to flooding, some of the post-
storm conditions may not have been as dangerous at multiple facilities. Even when generators are
used as a means of backup power, it is important for the staff to consider that power outages may
not necessarily be temporary [31], and generators are not likely to support the requirements for a
facility to operate ([63], [78]), and evacuations may be necessary.
As mentioned before, every facility is required to have an evacuation plan in place. These should
be reviewed and updated on a regular basis [11]. Most hospital evacuations are caused by internal
emergencies such as fires, utility failures, or exposure to hazardous materials, but hospitals should
plan for multiple hazard types [152]. To be effective, receiving facilities - the facilities to which the
patients will be transferred - should be identified prior to an emergency event ([63], [77], [78]). Plan-
ners must also consider that certain types of emergencies may affect multiple local hospitals ([11],
[18], [152]). Therefore, local facilities should be identified to receive patients from facilities that
are affected by an internal emergency, and non-regional facilities should be identified for external
emergencies that may affect an entire community. In these cases, patients may have to travel longer
distances to be relocated to safety. These types of regional emergencies may also cause demands
at a hospital to increase. In addition, community-wide disasters will place increased demands on
transportation resources ([1], [78]). During external emergencies, other local facilities may have to
shut down, so plans must include guidelines for how to handle new, incoming patients ([1], [63]).
Since a hospital is considered a resource in an emergency, plans should also include how to handle
the non-patient population that arrives seeking basic needs such as food, water, or shelter ([18],
15

[63]).
Good relationships with community organizations - churches, nursing homes, or school systems -
may provide an additional opportunity for resources [11] whether it be supplies, water, or trans-
portation resources. Additional resources such as staff, transportation, and supplies should be
identified prior to a disaster for use after an event [95].
Evacuation plans should include backup policies and devices to handle power losess ([18], [31],
[78]). This includes generators as previously discussed and also batteries for flashlights, alternate
methods for recording patient information, and alternatives for equipment such as ventilators and
medication storage systems. In addition, backup plans for communication ([18], [31], [98]) and
patient care ([13], [31], [63], [143]) are essential. In the more recent papers, some of the authors
suggested that patients, staff, and equipment may need protection during or after the evacuation
([18], [63], [98]).
Facilities that may be at a higher risk for evacuation may benefit from planning at a much lower
level. Creating unit-specific “evacuation packs” that include patient worksheets, important contact
information, and the supplies necessary to take care of the patients will help save critical time
when evacuation orders are given [11]. Medications, food, and other supplies should be prepared in
advanced and made easily portable [95]. Whether this level of planning is appropriate for a facility
depends on the how the management views the risks and benefits, which will be further discussed
in the next section.
Finally, the majority of nursing homes surveyed after Hurricanes Katrina and Rita indicated that
nursing home facilities need more considerations for preparations or response in public health emer-
gencies planning ([25], [36], [78], and [96]).
16

2.1.2 Decision Making
Whether planning for a potential disaster or facing an actual emergency, decision-makers must
balance the uncertainty, risks, costs, and the narrowing window for evacuations [63]. This includes
deciding whether to evacuate in advance when an emergency is forecasted. If the risks of transport-
ing patients are greater than sheltering-in-place, then it is likely that a facility will choose not to
move the patients. If the nature of the emergency threatens to affect the facility’s ability to provide
care, the facility must decide if and when to evacuate. Obviously the probability of predicting
where a hurricane will make landfall increases as the time until landfall decreases. If patients are
moved too soon, the forecasted event may not affect the facility at all. “Unnecessary” evacuations
put patients at otherwise avoidable risks, and they are expensive for the facility. An advanced
evacuation, however, may allow the facility access to resources that may decrease in availability
as the time window decreases. Making the decision not to evacuate in advance may lead to some
of the well-publicized complications that are reviewed in the papers that discuss the aftermath of
Hurricane Katrina ([18], [63]) though advanced evacuation still puts patients at a variety of risks.
Dosa et al. [36] discussed the issues inherent in evacuating frail patients from nursing homes and
how this may influence the decision to evacuate or not. As part of their call for additional research
in this area, they pose a framework for assessing the risk based on three key elements - the indi-
vidual patient, the facility, and the emergency event. Such an approach to quantifying risk could
be used in deciding whether to evacuate or not, as well as in prioritizing patient transfers once a
decision to evacuate has been made.
Once the decision has been made to evacuate patients, there are no established guidelines about
how to prioritize patients for transfer. Typically, triage refers to allocating scarce medical resources
to a surge of incoming patients after an emergency such as a mass casualty event. Patients are
chosen for treatment by determining who will benefit the most. In the context of a healthcare
facility evacuation, patients may be “triaged” to determine the best prioritization scheme. The
Center for Bioterrorism Preparedness and Planning [115] suggested that the patients that require
the most assistance should be transferred away from the facility first. Gray and Hebert [63] agreed
17

with this strategy for advanced evacuations. The Association of periOperative Registered Nurses
(AORN) [3] and the New York Centers for Terrorism Preparedness and Planning [131] suggested
that patients should be prioritized from least to most critical. Schultz [143] suggested that the ef-
fectiveness of triage decisions depends on the situation. Triaging patients will be further discussed
in Section 2.2. Regardless of the strategy chosen to move patients, a staff member with knowledge
of the current patient roster is critical to patient “triage.” There should be multiple staff capable
of filling this role so that there is someone on site at all times [31].
2.1.3 Patient Care and Transportation
Facilities need to remember that vehicles other than ambulances can be used to move patients. If
the emergency affects the availability of transportation resources or routes, other forms of alternate
transportation may be required ([18], [19], [25], [31], [63], [77], [78]). Access to transportation
resources has been identified as a major issue during evacuations, particulary for nursing homes
[77]. Since multiple facilities may have contracts with the same transportation service providers,
demands may exceed availability during community-wide emergencies.
Even though some long-term care facilities had planned arrangements for patient transfers to spe-
cific receiving facilities, so many other facilities were overwhelmed by Hurricanes Katrina and Rita.
These facilities may have also been forced to evacuate or may have already reached capacity by
accepting other evacuees; therefore, the intended receiving facilities were unavailable [77]. In addi-
tion, some healthcare facilities may not be prepared or willing to accept some of the more critical
patients due to resource or staffing constraints. One third of the nursing homes surveyed indicated
that they were unable to find a place to transfer their special needs residents, and they were re-
quired to shelter in place [77]. Transport may negatively impact a patient’s health, particularly for
nursing home patients ([36], [2]).
Depending on the type of emergency and the conditions at the receiving facilities, it may be easier
18

for a facility to choose to send all of its patients to a single facility. In the case of the bomb threat
as described in Augustine and Schoettmer [11], the patient population was small enough - and
the capacity at a receiving facility large enough - so that all of the staff could move with their
patients to continue care. This allowed for less planning and paperwork. When it is not possi-
ble to redistribute the staff for uninterrupted care, sending patients to multiple facilities helps to
avoid overwhelming a single facility [31]. If a receiving facility cannot immediately accept patients,
there must be a plan in place for continuing patient care outside of a healthcare facility ([13], [143]).
Patients’ special requirements and limitations should be considered when preparing them for trans-
port ([1], [18], [25], [63], [77], [95]), and coordinating patients in vehicles leads to better utilization
of that resource [31]. Particulary for older patients, stretchers or other equipment for transporting
patients may be difficult to use and time-consuming [78]. Charts ([11], [63]) and medications [11]
should travel with the patient, and patients should have some sort of identification attached to
them [63]. For longer travel, supplies for heating and cooling the patients, as well as food and
water, will need to travel with the patients ([96], [2]). For older patients that may have problems
communicating, identification, medical history, and medication information should travel with the
patients [95]. Finally, family members and volunteers may either help ([31], [63]) or hinder ([63],
[98]) the evacuation efforts. In some cases, family members can assist with patient transfers, but
in other cases, they may add to the problem by seizing scarce resources or getting in the way of
the clinical staff and hindering the evacuation efforts.
2.1.4 Staffing
There are not many lessons learned that discuss staffing plans, roles, or requirements though it
seems intuitive that an evacuation is highly dependent on staff’s participation and cooperation.
Most of the papers stress the importance of having evacuation plans, and authors stress the im-
portance of training the staff to understand the plan ([11], [19], [25]). Lach et al. [95] suggested
that nurses should be educated about the various types of disasters and their potential consequences.
19

As mentioned above, certain patient types may be difficult to transport, and may require the coor-
dination and use of many staff resources [77]. Most of the papers credit their staff for participation,
teamwork, and response.
Whether patients are assigned to be transported to a single receiving facility or to multiple ones,
some authors suggested that the staff should be reassigned to the new facilities to continue caring
for patients ([19], [31]) though these authors do not make it clear how such arrangements should
be made or managed.
Staff at long-term residential facilities must take special care when transporting long-term care
patients. The patients may be confused or scared, and the staff must be “calm and reassuring, yet
firm in their directions. It is important to move quickly and confidently, without causing panic and
further disorientation [95].” Though most nursing homes indicated that they had sufficient staff to
evacuate patients during the 2004 hurricanes, maintaining adequate staffing levels throughout the
evacuations was difficult, and the administration had to enforce staff participation [77]. Allowing
the staff to travel with their families - or allowing families to come into the facility - may improve
staffing levels [25].
In addition to the papers listed in this section, Qureshi [134] examines the staff’s “ability and
willingness to report to duty during catastrophic disasters,” and Chaffee [26] discussed the impact
of disasters on nurses and the ethical dilemmas associated with reporting to work. Qureshi et
al. [134] surveyed healthcare workers around New York City about a wide range of disaster types
including mass casualty events, environmental disasters, and epidemics. The authors discussed
the barriers that affect healthcare workers’ ability and willingness to report to work. Chaffee [26]
listed “what employeers can do,” to plan for emergencies. These include developing an outline of
what is expected from employees during an emergency, determining which employees would not be
available due to special needs or other volunteer obligations, and identifying services that would be
20

made available to those employees who do work during an emergency (child care, pet care, food,
shelter, counseling, etc.).
2.1.5 Record-keeping
Once patient evacuations are underway, there should be systems in place for tracking the evacuees
([63], [78], [98]) as well as a system to monitor bed availability at area hospitals [78]. Because loss
of electricity may be a potential result of the disaster, a hard copy list of patient transfers should
be maintained [11] at both the transferring and receiving facilities [31]. In addition, equipment
transfers should be monitored [31], and a system that tracks costs would be beneficial [11].
2.1.6 Communications
Clearly reliable communication and coordination are essential to patient transfers ([11], [18], [31])
and potentially the most important factor that contributes to a successful evacuation [18]. This
includes having back-up plans in place as discussed in Section 2.1.1 . Though communication
channels are described as contributing to the success of the Southern California evacuation, it was
determined to be the area that needed the most improvement in the debriefing session [13]. The
lessons learned from the nursing home evacuations during Hurricanes Katrina and Rita indicate
that there should be improvements to communication between the staff and physicians or medical
directors before moving patients [25]. Communication needs to flow within the facility and to the
receiving facilities ([18], [31], [63]).
One less obvious communication-related consideration relates to the media’s effect on the evacu-
ation. Bowers et al. suggested that communication with the media is important [19]. Hospitals
can utilize the media to communicate where patients have been transferred or if there is any dam-
age that would prevent providing care to incoming patients. However, the media may broadcast
inaccurate information. This should certainly not be a primary concern, but the planners should
21

be aware that the media may be present and may have an effect on the public’s perception of the
event [18].
2.2 Prioritizing Patients for Evacuations
A literature review of 1) suggested patient prioritization strategies for evacuation planning as well
as 2) the transport priorities as used in actual facility evacuations shows that there is a lack of
consensus about whether non-critical or critical care patients should be moved away from a facility
first in the event of a complete emergency evacuation. In this section, the actual and suggested
patient prioritization strategies are discussed. Figure 2.2.2 at the end of the section summarizes
the prioritization strategies presented in the literature.
2.2.1 Evacuation Plans
The Center for Bioterrorism Preparedness and Planning [115] suggested a complete evacuation
should happen in two phases: first, patients should be moved to a staging area. Because ambula-
tory patients require the least assistance, the Center for Bioterrorism Preparedness and Planning
suggested that these patients be moved to the staging area first and that the more critical care
patients be moved to the staging area last because moving these patients will require many more
resources. Once the patients have been staged, however, the patients that require the most assis-
tance should be transferred away from the facility first. These procedures are based on the START
triage strategy where the staging phase follows the reverse triage rules and the transportation phase
follows the traditional START triage rules. Gray and Hebert [63] agree with this strategy for ad-
vanced, pre-emergency evacuations because of the level of difficulty and the resources associated
with transporting these patients.
The New York Centers for Terrorism Preparedness and Planning [131] and the Association of peri-
Operative Registered Nurses (AORN) [3] suggested that patients should be prioritized from least to
22

most critical. It should be noted, however, that the New York Centers for Terrorism Preparedness
and Planning’s Hospital Evacuation Protocol [131]is obviously written with a sudden, unexpected
event. The AORN Guidance Statement: Mass Casualty, Triage, and Evacuation outlines that all
ambulatory patients be lead out of the facility first, and then non-ambulatory patients should be
prioritized from least to most critical. It is difficult to determine for what type of even the AORN
statement was developed. At times, it would seem that the procedures refer to an immediate emer-
gency such as a fire. For example, “staff members should assemble ambulatory patients together
and designate one or more staff members to lead patients to the designated safe area.” However,
the document outlines considerations for patient evacuations including patient assessment, weight,
stability, and transportability as well as resource requirements and equipment such as ventilators,
tanks, monitors, and medications; it seems that such assessments refer to advanced evacuation due
to a forecasted event.
In a discussion of simulation modeling to evaluate risks, Johnson [83] supports this prioritization
strategy by stating that “the implicit objective at each stage is to maximize the number of people
who can be moved to safety in the shortest available period of time.” By stages, he is referring
to the same phases as the AORN Guidance Statement, where ambulatory patients are moved first
and then non-ambulatory patients are moved in the priority of least to most critical.
Moskop and Iserson [111] propose that patient evacuations follow reverse logic of normal triage
methods and that attention must first be paid to ambulatory patients before evacuating those that
are dependent on higher levels of care. The authors also suggested that triage in order to evacuate
a hospital may be more difficult than “out-of-hospital.” Finally, though the authors do not cite the
sources, Lach et al. [95] discussed the complexities of nursing home triage “because triage protocols
call for helping those in the best condition and most likely to survive first.”
The actual patient transfers after the Northridge, California earthquake will be discussed in the
next section. In a paper that discussed the eight hospital evacuations after the earthquake, Schultz
23

et al. [143] summarized what they believe to be the most effective prioritization strategies: when
the threat to patients is immediate, patients should be prioritized from least to most critical. When
the treat is not immediate, the most critical patients should be given priority in order to decrease
the burden on the staff and other resources.
2.2.2 Actual Patient Transfers
The Northridge, California earthquake in 1994 caused six hospitals to completely evacuate all of
their patients and two others to partially evacuate. Six of these facilities chose to evacuate imme-
diately, and they all cited nonstructural damage (such as loss of power) as a primary reason for
evacuation (one facility also cited structural damage as a reason for evacuation). Five of these six
facilities did not feel that their patients were in immediate danger, so they chose to evacuate their
most critical patients first. The sixth hospital, however, felt that the damage was significant enough
to put their patients at a serious risk, so they chose to evacuate their non-critical care patients first.
The hospital moved all 334 patients to outside of the facility within 2 hours by prioritizing least to
most critical. The final patients to leave the building were those who had been trapped inside the
facility due to the structural damage from the earthquake.
After Tropical Storm Allison, facilities with the Texas Medical Center lost power and evacuated
both of their hospitals. Patients from the intensive care units were evacuated first [19]. These
patients and their records were transferred to other facilities within the system up to 200 miles
away.
Gray and Hebert [63] summarized the challenges at multiple hospitals during Hurricane Katrina.
They discussed the experiences at Lindy Boggs Medical Center where doctors prioritized patients
into one of three categories: ambulatory patients, patients that needed medical attention, and crit-
ical patients. According to the hospital’s existing evacuation policy, the critical patients were to
be evacuated first, but the rescue teams insisted that women, children, and ambulatory patients
24

had to be evacuated first because of the conditions in New Orleans. At Charity Hospital, the most
critical patients (excluding intensive care babies) were evacuated first. Two of these patients were
prisoners, and there were conflicts among the staff members since these patients were evacuated
before other patients. Though not completely clear, Gray and Hebert [63] imply that the Veterans
Affairs hospital evacuated its critically care patients first. The authors do not provide any insight
on the prioritization strategies used at Tulane University Hospital or Children’s Hospital. In the
“Lessons Learned” summary, Gray and Hebert [63] conclude that “advance agreement is needed
about which patients will be evacuated first.”
Hodge et al. [12] also review the prioritization protocols used during Hurricane Katrina: at Memo-
rial Medical Center, the healthy patients were evacuated first. In her discussion of Dr. Ana Pou -
the surgeon accused of euthanizing patients in the wake of Hurricane Katrina - Okie [13] clarifies
Memorial Medical’s approach for patient priorities. Initially, the most critical care patients were
evacuated first, but when help was not immediately available, the least critical patients were chosen
for evacuation because they had the greatest chance of surviving. As the evacuation continued,
the most critical care patients remained at Memorial. Approximately 200 patients were evacuated,
however, and these included ICU patients, bariatrics patients, and patients with “do not resusci-
tate” (DNR) orders.
A few months after Katrina, Hurricane Rita threatened the University of Texas Medical Branch at
Galveston. Until 2005, the University of Texas Medical Branch at Galveston’s evacuation plan was
to discharge healthy patients and to shelter-in-place and care for the critical patients [14]. When
Hurricane Rita threatened a few months after Katrina, the facility changed its plan and chose to
evacuate the most critical patients first.
25

Figure 2.1: Summary of prioritization strategies for critical and non-critical care patients.
2.2.3 Prioritization Discussion
The important purpose of this section is to highlight two main points. First, there are not general
guidelines for patient prioritization during healthcare facility evacuations. In addition, there is a
lack of consensus about which patient types - critical care or non-critical care - should be evacuated
first. Second, the policies included in evacuation protocols and those chosen for patient selection
decisions in actual evacuations - with the exception of the actual patient transfers at Memorial
Medical Center after Hurricane Katrina - are “all-or-nothing” policies meaning that the examples
in this section advise completely evacuating all of one patient type before beginning to evacuate
any patients that fall into the other classification. At Memorial, the plan was to evacuate the most
critical care patients first, so the evacuations started with these patients. Because of the conditions,
however, the patient prioritization switched to choosing patients with the greatest probability of
survival.
2.3 General Evacuation Research
The general evacuation research typically relates to how individuals respond and move away from
danger, beginning with the seminal paper by Quarantelli [132]. This paper collects and analyzes
information related to evacuation characteristics and presents the findings of the literature and
26

research in an analytical model of evacuation behavior at the local community level. The model
describes the relationship between the context, threat conditions, social processes, behavior pat-
terns, and consequences. This and other research in this stream address human decision making
and how the general public makes decisions about evacuation. Specific to hospitals and special
needs populations, Vogt [167], [168] and McGlown [108], [109] analyze the decision making process
prior to and during evacuations (see Section 2.4.3).
2.3.1 Deciding to Evacuate
Various researchers have attempted to model the factors that influence how a person responds to a
threat of an emergency including when to evacuate or whether to leave at all (see, e.g., [46], [117],
and [150]).
Fitzpatrick and Mileti [47] discussed the factors that affect the public’s perception about an evac-
uation. The paper references a variety of leading evacuation researchers including Clifford [30],
Drabek ([37], [38], [39]), Fritz ([54], [55]), Perry ([118], [119], [120], [121], [122], [123], [124], [125])
Quarantelli ([132], [133]), Sorensen ([148], [149]), and Turner ([160], [161], [162]). Fitzpatrick and
Mileti summarized the factors that affect the risk perception and therefore evacuation behavior as:
• Source - the credibility of where information about the risk is coming from,
• Consistency - whether the evacuation warning information is consistent with other types ofwarnings,
• Accuracy - the level of detail within the evacuation warning,
• Clarity - how easily the warning is understood,
• Certainty - how believable the evacuation warning is,
• Sufficiency - the appropriate amount of information - not too little such that the warning isconfusing and not too much that the warning message is overwhelming,
• Guidance - the level to which the solution is outlined,
• Frequency - how often the warnings are delivered for a particular emergency,
• Specificity - where is the actual danger,
27

• Channel - the method(s) by which the information was delivered,
• Cues - the number of physical cues,
• Social Setting - what is happening when the information is delivered and what others aredoing in response to the warning,
• Social Ties - various connections to people and places,
• Social Structure - characteristics of those who receive the warning,
• Psychological Factors - personal traits that affect how the warning is received, and
• Pre-warning Perceptions - perception of the actual risks
Notice that the first ten of these relate to the way the information about the evacuation is pre-
sented. The last six relate to personal and public factors. These all work together to contribute to
perception, and then motivation and perception lead to action.
2.3.2 Deciding When to Evacuate
Sorensen studies the factors that influence an evacuee’s decision on when to leave [150]. His gen-
eral model considers the variation in individual’s response times to an evacuation warning. The
model confirms that the most important factor that influences an individual’s evacuation decision
depends on when they were warned, and the time that an individual receives a warning varies
with the warning channel. In addition, personalized warnings decrease the response time, but it is
obvious that personalized warnings take longer to create and deliver.
These factors are different for healthcare facilities where the occupants face greater risks during
transport. In addition, most occupants of a healthcare facility are a dependent population, and
they rely on direction and assistance from the staff as well as the availability of transportation and
other resources.
28

2.3.3 Selection of Evacuation Routes and Resources
There is an entire stream of literature focusing on moving general populations away from hazards
using roadway/highway infrastructure. For research contributions in macro/meso-simulation and
network-based methods to evaluate traffic flow (see e.g., [33], [72], [127], and [145]). More recently,
the application of micro-simulation and dynamic optimization has increased (see, e.g., [27], [52],
and [73]). Many of these researchers propose operational policies for mass evacuations. Sumalee
[154] focus on traffic networks after a major disaster.
2.4 Research for Improving Healthcare Facility Evacuations
Emergency preparedness and response has been researched for decades. However, since the World
Trade Center attacks on September 11, 2001 and several other large-scale disasters (Hurricane
Katrina, wildfires, tsunamis, etc.), there has been an additional focus on the preparation for, or re-
sponse to, mass casualty emergencies. In fact, several papers specifically address triaging incoming
patients (to evaluate the need and benefit of medical resources) and/or creating surge capacity in
hospitals after a mass casualty event. There is significantly less research that considers healthcare
facilities as the victims of these emergencies ([19], [36], [108], and [143]).
In this section, the current engineering contributions related to healthcare facility evacuations are
highlighted. There are a number of papers that focus on each of the topics addressed in the
following sections - healthcare facility design, evacuation plans, making the decision to evacuate,
pre-evacuation times, and the selection of evacuation routes and resources - but there are limited
sources that address these with respect to evacuations. Such papers will be discussed in Section
2.3. The papers presented in this section focus specifically on research related to improving health-
care facilities. The following section, Section 2.5, briefly highlights some of the other healthcare
emergency preparedness research streams.
29

2.4.1 Healthcare Facility Design
Unlu et al. [112] present a space syntax model to consider the navigation issues during a hospital
evacuation. The authors site the shape of the building and evacuation routes, ergonomics, and
characteristics of the occupants as the main factors that influence circulation out of a hospital dur-
ing an evacuation. The model can be used to test designs for new facilities and analyze weaknesses
as related to patient evacuations.
Various risk assessment techniques can be used to identify potential hazards, but it is difficult to
estimate how these risks may further complicate patient evacuations. For example, certain emer-
gencies may affect exit routes, elevators, or equipment. Congestion in corridors or smoke in the
air may slow evacuation times or alter routes. Instead of staging several drills to test the various
complications, Johnson [83] created a simulation model of the evacuation of Glasgow Hospital and
considered the various risks to estimate the average and worst-case evacuation times.
2.4.2 Evaluating Evacuation Plans
By examining more than 2,000 nursing home evacuation plans, Castle [24] determined the elements
that were most often excluded: staffing procedures for the evacuation (44%), plans for coordina-
tion with the community (42%), reentry to the facility (40%), consideration of residents’ medical
and personal needs (37%), maintaining water supply (36%), consideration of residents’ personal
belongings (35%), and pre-identified evacuation routes and travel time estimates (31%).
In her dissertation, McGlown [108] suggested that hospital evacuations plans are usually only “pro-
duction documents” that are written only to meet the standards set by accrediting agencies. Vogt
[168] surveyed nursing home facilities and used Quarantelli’s model to evaluate the threats, re-
sources, social climate, and other extracommunity factors as they relate to the effectiveness of an
evacuation. While many of the issues are common to general population evacuations, Vogt [168]
identified the need for different evacuation strategies for dependent populations.
30

2.4.3 Deciding to Evacuate and Pre-evacuation Times
For a discussion for the general population, see Section 2.3.1.
McGlown’s [108] main research focus is to consider the variables that contribute to a healthcare
facility’s decision to evacuate, and they fall into five categories: infrastructure impediments, event
monitoring, time and risk factors, the internal environment, and the external environment. The
study participants included those with the authority to make evacuation decisions including man-
agement from healthcare facilities and “prehospital agencies” (EMS and fire). She presents a
conceptual model for “interpretation of variables relevant” to making a decision to evacuate based
on these factors. Her method for analyzing the relationships of the variables was based on Quar-
antelli’s framework [132], and the findings are similar. For example, the variables are related as
shown in Table 2.1 below. Note: the table was adapted from a figure in [108].
Once the decision to evacuate has been made, it is important to note another difference in the evac-
uation of a healthcare facility. Gwynne et al. [66] studied the pre-evacuation time - the difference
between the time the occupant started to evacuate and the time the evacuation order was given -
at a university residence hall and at a hospital. In the hospital case study, the authors point out
that the behavior of the staff directly affects the patients’ response to - and activities during - an
emergency. They suggested that any hospital evacuation model should include some element to
represent pre-evacuation time, but the factors that affect pre-evacuation time need further research.
2.4.4 Selection of Evacuation Routes and Resources
In the event of an external, regional disaster, other healthcare facilities - as well as the general
population - may also be evacuating, and the patients may have to compete for transportation
resources including vehicles and routes. If an internal emergency forces a facility to evacuate, the
31

Table 2.1: Factors that Affect the Decision to Evacuate.Quarantelli McGlown
(General Population) (Healthcare)
Threat Event MonitoringSituational Variables Disaster type/severity
Agent variables Imminent dangerSocial-psychological variables weather conditions
Resources Infrastructure ImpedimentsEvacuation drills Loss of [utilities]
Evacuation planning Structural damagePersonnel Fire/smoke, bomb treat or discovery
Physical/safety structures
Social Climate Time and RiskRisk perception Time factors
Hierarchy of decision making PreparationComplexity of organization Level of risk and assessmentsAbility to receive warnings
Constraints on decision making
Organizational Characteristics External EnvironmentRegulations Regulations or legal authorization
External resources Community resources or servicesAbility to predict hazard Community infrastructure
Ability to winDefinition of threat or risk
Social Linkages Internal EnvironmentInterorganizational linkages Facility resourcesIntraorganizational linkages Facility census, acuity, staffing
Previous organization interaction Alternatives or alternate facilitiesSpecially designated emergency units Special needs
32

facility may have access to additional resources to help with an evacuation. Taaffe et al. [155] used
simulation to evaluate various scenarios for evacuation time requirements. Tayfur and Taaffe [158]
developed a model to determine the allocation of staffing and transportation resources during a
pre-specified evacuation window that minimizes cost.
The Agency for Healthcare Research and Quality (AHRQ) provides a web-based evacuation plan-
ning tool for healthcare facilities. Based on the user’s input assumptions including the number and
types of available transportation resources as well as the number and types of patients to be evac-
uated, the model provides estimates for the times to evacuate patients and transportation resource
utilization. Patients are classified by their transportation requirements, and the assumption is that
this reflects their acuity. Patient relocation assignments are made such that the sickest patients are
transferred to the closest facilities to reduce travel time [50].
Tayfur and Taaffe [157] used simulation to evaluate various scenarios for evacuation time require-
ments. Tayfur and Taaffe [158] developed a model to determine the allocation of staffing and
transportation resources during a pre-specified evacuation window that minimizes cost. Though
the authors do not incorporate traffic simulation, they instead include a traffic congestion factor to
include additional delays in travel times.
Duanmu et al. [40] recognized the variety of emergency and evacuation planning at healthcare
facilities but identified a need for research related to external disasters that force the general popu-
lation and healthcare facilities to simultaneously evacuate. The authors create a traffic simulation
model to analyze the interaction and the effects on evacuation time, delays, and routes. The model
can be used to test various evacuation start times by estimating travel ties between the evacuating
and receiving facilities. A case study of the Charleston, South Carolina metropolitan area indicated
that in order to evacuate all patients from a large hospital prior to a hurricane’s landfall, a hospital
evacuation should begin no less than 12 hours prior to the community’s mandatory evacuation
orders or both can begin simultaneously if both the hospital and community evacuations begin 2
33

days prior to landfall.
2.5 Emergency Preparedness in Healthcare
This section briefly highlights the more researched emergency preparedness topics including surge
capacity, triage, and rationing, and battlefield medicine. The ethical dilemmas associated with
these will be further discussed in Chapter 3.
2.5.1 Surge Capacity
Surge capacity refers to a facility’s ability to quickly make room for incoming patients when there
is an unexpected increase in demand due to an emergency or disaster [85]. There are a variety
of papers that discuss hospital surge capacity during emergencies (see e.g., [23], [44], [71], [85],
[116], [142], and [144]). Hick [71] et al. and Kaji [85] et al. present conceptual models, but none
of these use any mathematical modeling techniques for responding to increased demands. Both
papers discuss the differences in normal daily volume surges with emergency surges.
Though presented in the context of surge capacity, I think the discussion of a successful surge
response could also be applied to a discussion of the requirements for a successful evacuation. Hick
et al. [71] cite the four most important factors that contribute to successful surge capacity as
system, space, staff, and supplies. The authors describe classifications for these four components
in terms of conventional, contingency, and crisis capacity levels. In order for these parameters to
be effective, the following “underlying system components” must be in place:
• Command - an incident command system should be included in the emergency plan and
practiced for application
• Control - the facility can control their building by managing the people and even the air that
is allowed to enter the facilities
34

• Communication - internal and external communication links are required
• Coordination - particulary for emergencies that affect more than just the facility, incident
command should coordinate with other healthcare facilities as well as public safety support
• Continuity of operations - to provide continued care
• Community infrastructure - support from local agencies may help provide assets. In addition,
the facility has to be prepared to handle its existing and new, incoming patients.
Kanter and Morgan examined hospital occupancy rates in New York and found that there may not
be enough capacity to handle demands after certain types of mass casualty events. In order to be
able to meet the demands, the authors suggested that altered standards of care may be necessary
[86]. See Section 2.5.3.
2.5.2 Triage and Rationing
Triage refers to the allocation decisions that must be made when the available resources cannot
satisfy the available demands. It refers to prioritization of patients, and in some cases, “some
[demands] may not be satisfied at all” [110]. The concept of triage is generally considered in terms
of a response to an emergency situation - in what order should victims be treated - to increase
chances of survival.
Rationing refers to “any implicit or explicit mechanisms that allow people to go without beneficial
services” [164]. Rationing does not only refer to the allocation of medical supplies; physician bed-
side rationing refers to determining whether certain clinical interventions are necessary [76] .
Hurst [76] describes the three forms of rationing by clinical judgement: triage (a number of patients
competing for limited resources), strained or fixed resources (actual patients are not competing,
but candidates for a resource are compared to potential candidates), and by opinion of the gains
35

(comparison of the costs to the benefits). Examples of triage rationing include dividing time be-
tween patients during rounds or admitting patients to an ICU. Deciding how to allocate limited
blood supplies or vaccines is an example of comparing patients to other potential patients.
The papers listed in Table 2.2 are just a sample of those that discuss strategies for triage and
rationing.
Table 2.2: Papers That Discuss Rationing in Healthcare.
Author Topic
Cookson and Dolan [32] JusticeEgol et al. [41] ICU AdmissionHam and Coulter [67] Determining coverage for the insuredJacobs et al. [81] Oregon Health PlanKrızova and Simek [94] Expensive care in a “transition country”Roberts et al. [138] Mass care with scarce resourcesSinuff et al. [147] Critical care bedsUbel and Goold [163] Bedside rationing
2.5.3 Altered Standards of Care
In 2005, before Hurricanes Katrina and Rita, the Agency of Healthcare Research and Quality
published the “Altered Standards of Care in Mass Casualty Events” [79]. Because of the terrorist
attacks in 2001, it became obvious that the ability of providers to administer the usual levels of
quality care may decrease during a mass casualty event. The usual levels of care are determined
by [79]:
• “What - what types of interventions, clinical protocols, standing orders, and other specifica-
tions should be used in providing health and medical care?”
• “To whom - which individiuals should receive health and medical care according to their
condition or likelihood of response?”
• “When - with what urgency should health and medical care be provided?”
36

• “By whom - which individuals are certified and/or licensed to provide care within a defined
scope of practice and other regulations?”
• “Where - what facility and system standards (pre-hospital, hospital, alternate care site, etc.)
should be in place for the provision of health and medical care?”
“The standard of care is often defined as the level at which average, prudent, similarly qualified
providers in a given community would have managed the patient’s care under the same or similar
circumstances” [171]. Such definitions are necessary for liability, and therefore it is necessary to
define the altered standards of care for situations in which those usually accepted levels are not
possible.
As mentioned above, Hick et al. [71] discussed the four elements of surge capacity in terms of con-
ventional, contingency, and crisis capacities. When at “contingency capacity,” the patient volumes
are higher than the usual, “conventional” capacity, but the additional patient volumes have little
to no impact on patient care. “Crisis capacity,” on the other hand refers to limited space, staff,
or supplies that are inconsistent with the usual levels of care in a disaster setting. The goal in
such a case is to “provide the best possible care to patients given the circumstances and resources
available.”
The Indiana State Department of Health [113] published a document regarding the altered stan-
dards of care with respect to pandemic influenza. Such decisions are not only regarding how patient
care will change but also how the use of supplies and equipment (such as ventilators) will be man-
aged and rationed if necessary.
37

2.6 Modeling Policy Decisions
2.6.1 Scheduling Impatient Jobs
Queuing theory has been applied to healthcare as a tool to examine utilization ([21], [146]), de-
termine appropriate appointment or staff schedules ([65], [88]), model patient flow ([22], [91]), and
assess waiting lists for services such as transplants ([9], [175]). Many researchers have also con-
sidered how to distribute resource-constrained service to jobs or customers that are “impatient.”
Bhattacharya and Ephremides [16] and Panwar et al. [114] consider jobs with deadlines and single
servers and prove that scheduling the most time-critical jobs is the optimal policy when the ob-
jective is to minimize the number of tardy jobs. Bhattacharya and Ephremides [17] further their
research and suggested state-dependent policies when considering a single server with two queues
and minimizing average tardiness per job. Dalal and Jordan [34] consider scheduling impatient jobs
and prove that the optimal policy to maximize reward chooses the job with the highest product
of reward and service rate. Additional papers consider deadlines while assuming that all jobs are
available immediately (see, e.g., [20], and [42], [128]).
In Glazebrook et al. [58], the authors propose models for determining single-server service allo-
cation schedules where (1) service is preemptive or nonpreemptive, (2) jobs reside in one or more
classes, and (3) jobs arrive randomly or are available immediately. When all jobs are waiting in the
system at time zero, the objective is to maximize the rewards until no jobs remain in the system or
to minimize the rewards lost through abandonment. The near-optimal policy is based on strictly
ordered tasks and therefore chooses tasks with small service times and large reward-rate loss. For a
multi-class problem, each customer classification is associated with a unique abandonment time as
well as a unique reward for successful completion of service. The resulting index policy approaches
decisions based on the maximum available reward rate [58].
The work of Argon, Ziya, and Righter [10] pertains to scheduling impatient jobs in the context of
emergency triage. Where our research addresses the evacuation of a hospital due to an emergency,
38

Argon et al. [10] consider a surge on a hospital’s operating rooms due to a mass casualty emergency.
Their mode could also be used to determine patient priorities for allocating scarce resources in re-
sponse to an emergency event. Their triage system is modeled as a single-server clearing system
where patients are classified by two distributions - one to represent how long the patient has to live
and another to represent their service times. These jobs or patients already exist in the system (no
consideration of arrivals) and abandon the system if they 1) are selected for service or 2) if they
are not selected for service within their lifetime.
The problem discussed in this dissertation is similar to the one presented by Argon et al. [10] in
that there are a finite number of patients waiting for service and that new patients will not arrive
to the system. Key differences include:
• In this research, we examine a two-server model in addition to the single server model;
• In [10], once a patient is chosen for service, it does not abandon the system. In the models
presented in this paper, there is a probability of successful a successful evacuation (service)
to represent the fact that patients may not survive the evacuation conditions;
• The model in Argon et al. [10] does not consider holding costs;
• The goal of the model in [10] is to maximize the number of patients chosen for service. For
this research, the models were created to examine multiple objectives including maximizing
saved lives and minimizing cost; and
• In some of the models developed for this research, patient transitions between classes are
allowed.
Argon et al. [10] show that when the order of jobs based on service times is identical to the indexed
order of lifetimes, then the job with the shortest service/lifetime is treated first. However, the least
severe cases typically do not require the longest service times. Argon et al. [10] propose a dynamic
program to determine server allocation when maximizing the total number of patients taken into
service, and they show that when the number of jobs is high, the servers should be allocated to
39

the “less time-critical patients with shorter treatment times.” As the total number in the system
becomes infinitely large, the “shortest expected process time first” rule becomes the optimal policy.
For the case when time-critical jobs have long service times (as is to be expected), the authors
develop two heuristic approaches and provide numerical results on the performance of the resulting
policies. Argon et al. [10] acknowledge that decisions to admit patients into an operating room
would require much more system knowledge and human interaction, and therefore their work is not
to suggest policies, but to provide insights on triage decision making.
Note: Argon et al. [10] refer to their evacuation system as a “clearing system.” In the 1970’s, Shaler
Stidham, Jr. ([139], [140]) classified certain stochastic processes as clearing systems. These systems
accumulate queues and are intermittently and instantaneously cleared. For example, consider the
arrivals of passengers at a bus stop. When the bus arrives, the queue is instantly emptied. Though
their model aims to clear a group of incoming patients through triage, the system is not actually a
clearing system.
In Glazebrook et al. [58] and Argon et al. [10] (as well as many others), the cµ rule plays a key
role in their results. The cµ rule minimizes cost by giving priority to the job with the highest value
of ciµi where ci is the cost of keeping job i in the system and µi is the service rate for job type i
(see, e.g., Iravani and Kolfal [80] and Van Mieghem [165]).
The work of Glazebrook et al. [58] and Argon et al. [10] has connection to our proposed research,
but there are some fundamental differences in our approach. One major difference in our system is
that our parameters are not necessarily stationary over time. For example, only a small percentage
of patients should have expiring lifetimes during the evacuation period (die waiting for evacuation).
Once the evacuation period is over and the disaster occurs, depending on the nature of the disaster,
all patients lifetimes may expire instantaneously. Another difference is the decision horizon. In the
case of a patient surge on an emergency room, there is no time limit, and the decisions will be made
until all patients have been triaged. In our research, there is a limited time window between the
40
decision to evacuate and the impending disaster. As the disaster approaches, we also believe it is
important to consider how the standard level of care changes, and how that will impact service or
evacuation times, as well as patient selection decisions. For these reasons, we strongly believe this
is a rich area of research, where advancements in modeling (via tools such as dynamic programming
and simulation) will be abundant.
2.6.2 Healthcare Policy Decisions with Dynamic Programming and Simulation
This section discusses the application of dynamic programming and simulation in healthcare. Dy-
namic programming consists of a variety of techniques used to determine the optimal solution for
problems where decisions are required within a sequence of events [14]. This problem-solving ap-
proach can apply to a wide range of problems including both deterministic and stochastic problems.
Dynamic programming can be used to numerically solve problems as well as develop conclusions
about the structural properties of the optimal policy. Most dynamic programs are solved by back-
wards induction, so therefore the optimal policy consists of the optimal policies for a series of
subproblems.
When the routine performance of a system is represented, simulation can be used to test ”what if”
scenarios without requiring the initial investment and actual implementation of each scenario. This
allows an opportunity to analyze how changes to various inputs, resources, or time requirements
affect the entire system. Simulation is used often in healthcare as teaching opportunities for the
clinical staff. These simulations are usually in the form of physical models of the system. For
example, simulation labs are used to create scenarios for mock patients, and even evacuations or
other emergency events can be simulated. Computer simulation is obviously preferred when actual
simulations would be too expensive, complicated, intrusive, or impossible.
41

2.6.2.1 Dynamic Programming in Healthcare
The following are examples of applications of dynamic programming to policy decisions in health-
care:
• As early as 1969, dynamic programming was used to model healthcare decisions. Esogbue
[43] modeled the operating rooms in hospitals.
• Fries and Marathe [53] used dynamic programming to examine appointment systems in am-
bulatory care clinics.
• Weiss [172] modeled an operating room as a single machine job shop where the operations
are jobs that are either 1) already scheduled or 2) used to determine the optimal order. In
both cases, the estimated start times of the procedures depend on the two costs considered
in the problem (idle cost and surgeon’s waiting cost).
• In order to estimate price expectations of over-the-counter pain relievers, Gonul [60] developed
a dynamic program to examine brand choice.
• Claxton and Thompson used dynamic programming to optimize the design clinical trials [29]
including sample size, allocation, and the “societal payoff to proposed research.”
• Maxwell et al. [105] used approximate dynamic programming to determine re-deployment
strategies for minimizing the time it takes an emergency medical service (EMS) crew to
respond to a call.
2.6.2.2 Simulation in Healthcare
Jun et al. [84] and Gnal et al. [59] two of the most recent papers that review the use of discrete-event
simulation in healthcare. The following are examples of applications of discrete-event simulation
in healthcare with respect to policy making:
• Hupert et al. demonstrated the usefulness of discrete event simulation modeling improving
response to emergency events. The authors created a model to design antibiotic distribution
centers after a bioterrorism attack [75]
42

• Giachetti et al. [57] developed a simulation model to evaluate scheduling policies in an
outpatient clinic.
• Fletcher et al. [48] discussed a simulation model used to evaluate patient visits to England’s
Accident & Emergency departments in accordance with the national policy of completing
98% of patient visits within 4 hours of their arrival.
• As described in Section 2.4.4, Taaffe et al. [155], Tayfur and Taaffe ([158], [157]) and Duanmu
et al. [40] used simulation to examine the resources and routes associated with evacuating
healthcare facilities.
• Ramwadhdoebe et al. [136] developed a discrete-event simulation model to determine a policy
for testing infants for developmental dysplasia in the Netherlands.
• Werker et al. [173] examined waiting times for radiation therapy at the British Columbia
Cancer Agency and tested a variety of scenarios to shorten waiting times.
• Konganakorn et al. [92] used discrete-event simulation to test the economic benefit of two
different treatments for pneumonia.
2.7 Evacuation and Transportation Data
The models in Chapters 5, 6, and Chapter 7 will consider the following input parameters: patient
evacuation rates, probabilities of successful evacuations, and patient death rates while waiting for
evacuation. To our knowledge, there are no papers that estimate these parameters. This section
will examine any relevant data points from the papers discussed in this chapter.
Løvas [103] studies the complex system that results when a building is evacuated. Though not
healthcare facility-specific, the performance measures of interest apply: number of deaths, number
of safe evacuees, and the time needed to evacuate a given number of people. In addition, Løvas
provides an excellent discussion on how to measure evacuation systems based on these key outcomes
or objectives. These suggestions of past researchers clearly identify the need for improved decision
43

making during healthcare emergencies.
2.7.1 Time to Evacuate
The time it takes a person to evacuate a building depends on his or her response time to the
emergency and how long it takes to physically move to an exit. Evacuation time estimates have
been studied in the context of nuclear power plants [73], communities [27], and traffic [100]. In the
case of a healthcare facility, the building’s occupants cannot immediately leave the facility. Most
patients must rely on the decisions of the clinical staff, and the clinical staff must remain in the
building to carry out the evacuation. For the models described in the following sections, most of
the evacuation time parameters are based on our observations of a mock evacuation.
In his summary of a simulation created for a London hospital, Johnson [83] reminds modelers about
the delays associated with moving patients. He estimates the minimum and maximum delays as-
sociated with the preparation for the helping the patient evacuate. For “mobile patients able to
move on their own,” the minimum delay is 30 seconds, and the maximum delay is 90 seconds. For
“immobile patients who could be moved with relative ease,” the minimum delay is 1 minute, and
the maximum delay is 3 minutes. For other immobile patients, the minimum delay is 3 minutes,
and the maximum delay is 15 minutes. These times, however, are only associated with preparing
the patient for physical movement; there is no discussion of locating and preparing medications,
charts, and other equipment that may have to travel with the patient. Johnson [83] also estimates
the time required for a nurse to transport a patient. He gives “fast,” “medium,” and “slow” esti-
mates. The time required for a nurse to push a patient in a bed is estimated to be 20, 25, or 35
seconds per 10 meters. For a nurse to push a patient in a wheelchair, the times are between 12, 16,
and 20 seconds per 10 meters. Finally, for a nurse to walk alone with a patient, the travel times
per 10 meters are estimated to be between 8, 12, and 16 seconds.
Table 2.3 was adapted from Schultz et al. [143] to provide insight on the time required to complete
44

an evacuation. These time requirements are for both partial and complete evacuations, and the
time required was measured from the beginning of the evacuation to the moment that the last
patient was transported away from the facility.
Table 2.3: Time Required to Evacuate Patients.
Number of PatientsEvacuated
Time Required forEvacuation [hours]
Average Time per Patient[minutes]
25 13 31.22 1 30320 9 1.69125 19 9.12270 9 2202 10 2.9746 12 15.6576 13 10.26
There is no direct discussion in [143] of why the average time per patient is so different. Note
that the least amount of time per patient is associated with the facility that moved their patients
to a staging area directly outside of the facility. It is easy to understand that the differences in
resource requirements, patient volumes, and transportation distances can cause such differences in
the average evacuation time per patient, but it is difficult to understand exactly how a patient can
be evacuated in less than 2 minutes.
2.7.2 Transportation Risk
According to a study conducted in 2005 that analyzed the vital signs of critically ill patients trans-
ferred to the intensive care unit of a tertiary referral center, 37% of these patients exhibited a vitals
increase beyond predefined thresholds after transport. Either a nurse or physician was present in
80% of the transports, and the distance of transport did not correlate with the condition on arrival
[99]. The data collected from this study shows there is a definite increase in risk associated with
a transfer. Among those parameters that differed after arrival were oxygen saturation, heart rate,
temperature, and glucose level.
45

A patient’s age will also affect the likelihood of mortality or increased complications during trans-
fer. Patients 75 years or older account for 1.8 million trauma-related visits per year. Over 40%
of these visits require ambulatory assistance. Patients in younger age groups are not as likely to
be admitted into a hospital with ambulatory assistance [49]. These patients who are 85 years or
older have a mortality rate 2 times those under 85 years old [153]. Often transfers for continued
medical care were more common among younger patients while older patients more frequently fell
into the categories of emergency and urgent admissions, indicating a natural increase in risk when
transferred (see, e.g., [35] and [170]). Inter-hospital transfers also present an increase in risk to
the patient. In an analysis performed by the National Institute of Health in 2006, the risk of in-
hospital mortality was 2.25 times higher among those transferred compared with those who were
not transferred. However, the study concluded that the risks differed with the experience of the
attending physician at the receiving hospital [170].
The following are related to patient complications during actual evacuations:
• One patient experienced complications related to evacuation after evacuating Galion Com-
munity Hospital in response to a bomb threat [11].
• There were no deaths reported from the eight hospital evacuations after the Northridge,
California earthquake [143].
• After Hurricane Katrina, none of patients from Tulane University Hospital died during the
evacuation, but two patients from Charity Hospital that had been transported to Tulane died
during the evacuation [63].
• St. Charles Parish Hospital did not evacuate until after Hurricane Katrina, and there were
no deaths reported [63]. There were 8 patient deaths at Charity Hospital, 19 at Lindy Boggs,
and 45 at Memorial Hospital.
• There were no deaths reported in the summary of lessons learned from the evacuation of
Texas Medical Center during Tropical Storm Allison [31].
46

2.8 Goals
The following discuss the goals or objectives of evacuation, triage, and allocation decisions.
• With respect to evacuation and surge capacity at Robert Wood Johnson University Hospital,
the goal is to “maximally reduce the number of casualties” [82].
• The goal of allocation decisions should be “maximizing the survival rate” [87].
• Based on Texas Medical Center’s experiences during Tropical Storm Allison, receiving facili-
ties should be chosen that avoid “overwhelming a facility with too many patients arriving at
once” [31].
• According to a draft published by the Massachusetts Department of Public Health and the
Harvard School of Public Health [4], “priority for limited medical resources and [altered
standard of care clinical] protocols will be based upon the allocation of scarce resources to
maximize the number of lives saved.”
• “The goal of a ... response [is] to maximize the number of lives saved” [79].
• White et al. discuss ethical decision making in the context of allocating ventilators to hos-
pitalized patients during an pandemic influenza outbreak [174]. The authors point out that
many allocation decision criteria are based on maximizing the number of people that survive
until hospital discharge.
2.9 Ethical Considerations
Hardin [69] introduced the concept of lifeboat ethics: there is only room in the limited supply of
lifeboats for some percentage of the population, and the rest of the population are left to swim
on their own. There are a number of decision criterion that can be used to make decisions about
how to “fill the lifeboats.” In a healthcare context, Kraus et al. [93] consider a hospital as a
lifeboat for a community during a disaster. With a patient surge, the authors suggested that triage
47

decisions should balance the basic medical ethical principles: autonomy (respect for patients as de-
cision makers), beneficence (maximizing benefits and minimizing injury), nonmaleficence (avoiding
harm), and justice (fairness). Patient triage during disaster events typically takes on a utilitarian
view: do the most amount of good for the most amount of people. In order to do this, the public
accepts that the standard quality of care may decrease, and thus “sufficient” care becomes accept-
able. This leads to a key question in our research: how do ethical decision making and acceptable
level of care impact the selection of the next patient for evacuation?
Most triage decisions are made by the patient roster, and clinical staff does not necessarily have
access to information about the available resources, risks, and rewards. Kraus et al. [93] further
suggested that “a system that allows real-time classification of risks and benefits...would be a great
advantage in ethical decision making.”
An ethical dilemma, according to Rushworth Kidder [89], is a problem where more than one “right”
option conflict. These can generally be categorized into one or more of the following categories:
individual versus community, short-term versus long-term, truth versus loyalty, and justice versus
mercy [89]. Once the evacuation orders are underway, other potential ethical dilemmas include
[97], but are not limited to
• Determining when to evacuate,
• Prioritizing patients for evacuation,
• Deciding which staff members should report to work,
• Allocating and distributing scarce resources,
• Maintaining privacy and granting patient autonomy,
• Identifying authority and managing teamwork, power, and roles,
• Determining how to best use non-clinical staff such as family members and volunteers,
48

• Determining acceptable levels of care,
• Deciding the best plan for patients that will inevitably die, and
• Handling admissions and emergent patients from outside of the facility
Note: Ethical dilemmas are not categorized in [89] or [97]; Larkin [97] suggested some potential
dilemmas and Kidder [89] suggests the categories. The ethical dilemmas will be further discussed
in Chapter 3 along with a discussion of the four main ethical frameworks.
49

Chapter 3
Ethics and Objectives
This chapter discusses the ethical dilemmas associated with healthcare facility evacuations. It must
be noted that there are a number of stakeholders in healthcare ethical dilemmas, and each has a
shared objective: patients’ health. These stakeholders, however, also have additional - and some-
times competing - objectives. Consider the following in Table 3.1.
Table 3.1: Internal Stakeholders in a Healthcare Facility.
Stakeholder Goal
Patients HealthPatients’ Family and Friends Health of the patientPatients’ Employer Want employee to return to workNurses Deliver quality carePhysicians Diagnose and deliver quality careFacility administrators Maximize revenue; deliver quality careThird party payers Maximize revenue; develop cost-effective treatment plans
It is an assumption that the patients should always be at the center of the “moral universe” (a
term used in [89]) for healthcare decisions. Including additional stakeholders into ethical decision
making compounds and increases the complexity of ethical dilemmas. My opinion of the moral
universe with respect to evacuations, or at least how I would like it to be, is represented in Figure
3.1, though there are no papers to support this idea.
50

Figure 3.1: Example of the moral universe for healthcare facility evacuations.
An ethical dilemma, according to Rushworth Kidder [89], is a problem where more than one “right”
option conflict. These can generally be categorized into one or more of the following categories:
individual versus community, short-term versus long-term, truth versus loyalty, and justice versus
mercy [89]. There are a variety of ethical dilemmas associated with healthcare facility evacuations
[97], and these are listed in Table 3.2. Note the list is not classified in [97] as in the table.
The ethical dilemma at the focus of this chapter is determining the order in which patients should
be transported. According to Bernard Gert [56], “a person acts irrationally when (s)he acts in a
way that (s)he knows (justifiably believes), or should know, will significantly increase the proba-
bility that (s)he, or those (s)he cares for, will suffer death, pain, disability, loss of freedom, or loss
of pleasure: and (s)he does not have an adequate reason for acting so.” Patients are a dependent
population, and in order for most to get to safety, they will require the assistance of the clinical
staff. When the choice to transport one patient causes another to be left behind, this may directly
cause harm. In the case of an emergency evacuation with limited time for transport, there actually
is the potential for “death, pain disability, loss of freedom, or loss of pleasure.” The caveat at the
end of Gert’s definition of rationality “justifies” causing harm as proper prioritization policies will
lessen the harm for the entire system.
51

Table 3.2: Breakdown of Healthcare Evacuation Dilemmas by Type.
Dilemma Individual vs.Community
Short-term vs.Long-term
Truth vs.Loyalty
Justicevs. Mercy
Determining when to evacuate XPrioritizing patients for evacua-tion
X X X
Clinical staff reporting to work X XDuty to patients versus family XDistributing scarce resources X X XMaintaining privacy X XGranting patient autonomy X X XIdentifying authority X X XTeamwork, power, and roles X X XUse of non-clinical staff, volun-teers
X X
Determining acceptable levels ofcare
X X X
What to do when a patient willinevitably die?
X X X
How to handle admissions, emer-gent patients
X X
Receiving facilities:resource dis-tribution
X X X
52

3.1 Ethical Perspectives
“Morality is, at the very least, the effort to guide one’s conduct by reason” [135], and Ethics is
“the obedience to the unenforceable” [89]. There are four, main ethical perspectives that guide
such decision making: utilitarian, deontological, care-based, and virtue-based ethics. Care-based
ethics will not be discussed as it is not a good model for policy making or occupational behavior;
however, it is interesting to consider that those carrying out an evacuation are in care-giving roles.
3.1.1 Utilitarianism and Evacuations
“Utilitarian theories assign people responsibility for producing certain results, leaving the individ-
uals concerned broad discretion in how to achieve those results” [62]. As compared to the other
ethical perspectives, utilitarianism is the best guide for public policy, and its concepts can help
evaluate options for the proper objective functions for evacuations. Using a utilitarian framework,
right and wrong are evaluated based on consequences alone, and these consequences - or utility -
are the most important. The goals of a Utilitarian are to do the greatest good for the greatest
amount. We assume that each person is the best judge of their preferences and interests except in
the case when they are the only ones to suffer from potential consequences. The “greatest good”
was originally considered to be “happiness” by Jeremy Bentham, one of the philosophers originally
credited with Utilitarianism [135]. In Utilitarianism, each person’s happiness should be given equal
consideration: “each counts for one and no one counts for more than one” [62]. Finally, “it is
legitimate for the collectivity to impose sanctions upon individuals in pursuit of [a] goal” [62].
During an emergency, the public generally accepts Utilitarian decision making [93]. Therefore, it is
fair to assume the “public health model” as a standard; “the patient is the public, and the mission
is to promote the public’s health” [169].
53

“The greatest good for the greatest amount” presents the most challenging aspect of our research.
How should the greatest good be quantified: number of evacuees, profit, number of life years? In
addition, there are some limitations to using utilitarian principles to improve evacuations. First,
it is hard to foresee consequences. Our models only look at the immediate consequences: life or
death. However, there are so many different stakeholders, and the potential effects of an evacuation
grow exponentially as more people are included and the costs, happiness, time, etc. are considered.
That being said, there is no way to represent what is the “greatest good” for individuals, and it is
hard to know what to include in trying to quantify this for a community. Further, “there is no obvi-
ous place within utilitarian theories for people’s idiosyncratic perspectives, histories, attachments,
loyalties or personal commitments” [62]. We cannot assume that those carrying out an evacuation
would not have some sort of personal relationship with the patients that they would be responsible
for evacuating.
This leads us to our discussion of responsibilities and Deontological ethics. However, before I tran-
sition from utilitarianism to Kantian ethics, it is important to consider the middle-ground or “rule
utilitarianism” as it directly applies to decision making in evacuations. Once determining the set
of rules that it optimal, “we do not have to invoke the principle again to determine the rightness of
particular actions” [135]. That is, once the set of optimal policies that “does the most good for the
most amount” has been determined, it is not necessary to reconsider each individual decision-epoch
from a utilitarian perspective.
3.1.2 Deontological Ethics and Evacuations
The major concepts in Deontological, or Kantian, ethics include duty and respect for persons.
The ethical rules are absolute, and the morality of a particular action depends on the intent and
purpose, not the final consequences. In order to determine if an action is ethical from a Kantian
perspective, consider if it would be acceptable as a universal law. The consequences of the action
do not matter; the duty is what is important.
54

In a Kantian framework, people should not be treated as a means to an end, and patient autonomy
should be respected. As noted before, it is easier to grant patient autonomy in cases where the out-
comes only affect the patient or a small group. Kantian ethics does not focus on outcomes, so it is
important to remember that evacuation is a utilitarian concept. During an evacuation though, the
staff have a duty to keep their patients safe. They also have other duties that may be competing.
In the event of a community-wide emergency, a staff member may have family obligations. Even
when someone from the clinical staff assists with evacuations, there could be different motives for
fulfilling this duty. Are they helping only because it is their job? It is fair to assume that those in
the business of care-giving have virtuous traits. It is a combination of their virtues and duties that
motivates them to assist with evacuations. In the case of an emergency evacuation, however, duties
may conflict. In the event that duties as identified by a utilitarian policy diverge, a virtue-based
approach to ethics may help identify solutions.
3.1.3 Virtue-Based Ethics and Evacuations
As stated before, utilitarianism is the best guide for policy making. Therefore, the hope is that
we can outline the most ethical procedures for prioritizing patients based on the greatest good.
There will, however, likely be unplanned events that require immediate decisions. Such decisions
will be ethical decisions, and will test the “ethical fitness” [89] of those carrying out the evacuation.
Coincidentally, health care professionals are known for their virtuous traits. The ethical codes
for nurses and physicians center on moral values and require compassion, respect, commitment,
responsibility, accountability, integrity, dedication, and truthfulness [5], [6].
Larkin and Arnold identified the virtues for healthcare workers during an emergency: “prudence,
courage, justice, stewardship, resilience, vigilance, and charity” [97]. “Virtue-based ethics are more
adaptable to the multiplicity of rapidly changing disaster circumstances than mere principles, rules
and protocols, particularly since the scope, magnitude, and dynamics of a particular challenge
55

cannot be determined in advance [97]”.
Priel and Dolev [130] and Kraus et. al [93] suggest that medical decisions must balance beneficence,
nonmaleficence, autonomy, and justice. Priel and Dolev [130] extend Larkin and Aronld’s [97] list,
and include “compassion, trustworthiness, discernment, and integrity” as the four virtues essential
to medical practitioners and suggest these “be manifested in mass casualty situations.”
3.2 Ethics and Public Policy
According to Goodin, “utilitarianism can be a good normative guide to public affairs without nec-
essarily being the best practical guide to personal conduct. But special circumstances confound
the direct application of utilitarianism to personal affairs, and in such circumstances utilitarianism
itself recommends that people’s conduct be guided by more indirectly utilitarian mechanisms -
obeying rules of conduct or developing traits of character” [62]. The middle ground between Util-
itarianism and Kantian is rule-based utilitarianism where the consequences guide the formulation
of a set of rules. The utilitarian concepts determine the policies, these guidelines define roles and
responsibilities, and virtues contribute to the success of an evacuation.
The optimal policies vary with the choice of objectives, and the purpose of this research is to in-
vestigate the options for objectives and determine the one(s) that best balance the basic ethical
principles.
Current evacuations operate based on beneficence (maximize benefit and minimize harm). In con-
versations with healthcare officials, the typical opinion is that non-critical care patients should be
evacuated first. Will this produce justice and equity to all patient classes? We address this issue
in Chapter 5 by incorporating ethical considerations into the modeling objective.
56

3.3 Ethical Perspectives in Healthcare Emergency Preparedness
During an emergency, when allocation decisions are to be made, the accepted perspective is Utili-
tarian: do the most good for the most amount ([93], [70], [107], and [126]).
In collecting papers regarding ethical decision making for emergency events in healthcare, it is al-
most always easy to predict how the arguments for ethical behavior will be framed. If the author is
a doctor or a nurse, the arguments will most likely focus on values and virtues. Lawyers and those
in public health tend to argue for the greatest good (utility). Robert Veatch, Ph.D. agrees that
there are two major, moral principles for triage; one is to choose to care for victims that would bene-
fit the most from care (utility), and the other is to care for those in the greatest need (justice) [166].
The purpose of this section is to suggest a potential conflict in the ethical perspectives. Because
this research focuses on the utilitarian concept of doing the most good for the most number, it is
important to consider that those actually carrying out the utilitarian policies may not agree with
the decision.
• “Many [medical professionals] are simply not prepared to modify their intransigent principle
of unwavering duty to their patients’ individual interest” [104]
• “Nursing is a discipline rich in values” [137]
• “Public health ethics differs from clinical ethics by giving priority to promoting the common
good over protecting the individual autonomy.... Public health policies, which focus primarily
on population-level health outcomes, may subordinate the interests and rights of indviduals
to the common good.... The notion that public health measures could shape life-or-death
choices for all ... patients is foreign to most clinicians and patients” [174]
The papers outlined in the following subsections address ethical concerns during emergency events
with an emphasis on virtues, values, and morals.
57

3.3.1 Values and Virtues
In their discussion of triage in healthcare, Moskop and Iserson [111] suggest that it is “important
that triage officers understand the triage system they employ and the moral values and principles
upon which it is based” [111]. “To begin an ethical analysis of triage,” the authors “first consider
how triage fosters the values of human life, health, efficient use of resources and fairness.” “Triage
and Values” is their first major section, and the authors discuss the values inherent and foreign
to triage [111]. Though there is a lengthy discussion of utility, it is in a subsection of “Triage
and Principles of Distributive Justice” that comes after the discussion. Moskop is a Professor of
Medical Humanities at East Carolina University and Kenneth Iserson is an M.D. and Professor of
Emergency Medicine.
Larkin and Arnold [97] present the ethical dilemmas that may be associated with a terrorist at-
tack, and discuss virtue-based ethics as the best approach for “emergency planning, preparedness,
and response to acts of terrorism.” Larkin and Arnold are both M.D.s. In fact, they support the
hypothesis that M.D.s may be predisposed to think of ethics in terms of virtue rather than utility
by stating “we espouse the notion that virtue-based ethics are more adaptable to the multiplicity
of rapidly changing disaster circumstances than mere principles, rules and protocols.”
The ethical framework presented in [159] for decision making in pandemic influenza preparedness
is based on the following. First, the ethical decision making process should include the following
values: accountability, inclusiveness, openness and transparency, reasonableness, and responsive-
ness. Decisions should be made based on: duty to provide care, equity, individual liberty, privacy,
protection of the public from harm, reciprocity, solidarity, stewardship, and trust. Notice that the
Utilitarian concept of stewardship is included as a value. Thompson et al. [159] state that “deci-
sion makers have a responsibility to avoid and/or reduce collateral damage that may result from
resource allocation decisions; maximize benefits when allocating resources; protect and develop re-
sources where possible;” and “consider good outcomes (i.e. benefits to the public good) and equity
(i.e., fair distribution of benefits and burdens).”
58

The following papers also examine ethical dilemmas with a virtue-based framework:
• Linda Good, R.N. [61], also discusses disaster ethics in terms of virtue. “The same fundamen-
tal virtue-based ethics that have guided health care decisions ... provide the moral foundation
to carry out the challenging task of triage.”
• G. Richard Holt, M.D., reviews literature to summarize the ethical challenges and perspectives
of medical care during mass casualty events [74]. He concludes that “it is necessary to...
formulate a virtue-based, yet practical, ethical approach to medical care under such extreme
conditions.”
• Nora Bell [15] challenges the utilitarian-based triage system: “the ‘more is better’ principle
lacks the status of a universal moral obligation and leads to an impersonal view of the valuing
of life.”
3.3.2 Duties
In addition to utilitarian- and virtue-based ethics, there is another framework, Deontological or
duty-based ethics, that is based on rules and obligations. In her discussion of whether nurses
should report to work during an emergency situation, Chaffee’s [26] arguments appeal to “duty,”
“responsibility,” and “obligation.” It could be argued, however, that whether a nurse decides to
report to work as a function of such commitments could be a reflection of his or her personal virtues.
In the Indiana State Department of Health’s [113] report on altered standards of care, the following
ethical framework is suggested for determining how breathing equipment should be allocated during
pandemic influenza: “duty to care, duty to steward resources, duty to plan, distributive justice,
and transparency.” “Duty to steward resources” refers to utilitarian principles in that allocation
decisions must be made based on the saving the most lives.
59

3.3.3 Utilitarian Approach
The following papers discuss triage and other allocation decisions from a Utilitarian perspective:
• “Lifeboat Ethics: Considerations in the Discharge of Inpatients for the Creation of Hospital
Surge Capacity” was written by Kraus (M.P.H), Levy (M.D, J.D), and Kelen (M.D.) [93].
• Ken Kipnis, a professor of Philosophy, does not appeal to the values and virtues behind triage
decisions but instead says that triage decisions are to “produce the best outcome” [90].
• Rhonda Hartman, a lawyer, argues that “the rationale for triage is utilitarianism” [70].
• Linzer et al. [101] agree that “triage is largely utilitarian in nature,” and suggest that social
workers rely on Utilitarian and Deontological ethics to make decisions. The authors are
professors with degrees in social work.
In summary, the discussion in this chapter was to illustrate that there may be some conflicting and
competing ethical perspectives during a healthcare facility evacuation. When doctors and nurses,
who are driven by virtues and values, are asked to carry out policies that are based on utilitarian
principles, ethical dilemmas beyond those already inherent in the evacuation process may further
complicate the decision making process.
60

Chapter 4
Evacuation Survey
In research funded by South Carolina State University’s James E. Clyburn University Transporta-
tion Center, we developed and distributed an evacuation survey to hospitals and nursing homes
across the state. Approximately 30 surveys were mailed to contacts, but only 7 were returned. De-
spite the low response rate, the information helped set a baseline for our understanding of healthcare
facility evacuation plans across our state. It is important to note that none of the facilities reported
having a prioritization plan or instructions on who to evacuate if only a limited number of patients
could be moved. In addition, we received nine evacuation plans to review and compare with the
survey results.
4.1 Survey Creation
In 2005, Schultz et al. [141] noted the lack of standardized data collection for hospital evacuations.
The team created a survey tool for systematically collecting data on the actual emergency, hos-
pital demographics, existing emergency plans, incident command, patient transfers, and “hospital
recovery.”
The survey distributed for this research used, amended, and supplemented questions from [141]. A
copy of the survey informational letter and the actual survey can be found in Appendix 4. Sample
61

questions included:
• With regard to evacuation, are there strategies used to determine transfer/movement priority
in the evacuation plan? If so, please describe.
• Does your evacuation plan address patient evacuation out of the facility?
• Does the plan include an estimate for the time required for a full evacuation?
• Does the evacuation plan address what to do if there is a limited time window for evacuation
(not enough time to get all patients out of the facility)?
• What transportation resources are available to actually move patients?
• Which patient group would you most likely transport first?
• Which patient age group do you think have priority in transporting to safety?
This survey was created and distributed in the beginning phases of this entire body of research.
The purpose was to determine whether any prioritization guidelines were currently being included
in emergency planning.
4.2 Survey Responses
Seven surveys were returned from various sized hospitals including a 53-bed facility, a 54-bed facil-
ity, a 56-bed facility, a 145-bed facility, a 296-bed facility, a 588-bed facility, and an 845-bed facility.
The number of staffed beds in these facilities ranged from 28-850 beds. These facilities were 2-, 1-,
3-, 5-, 7-, 8-, and 6-stories tall, respectively.
With respect to transportation priority, two facilities indicated that ambulatory patients would be
evacuated first. Two of the facilities indicated that their evacuation plans addressed which patients
should be chosen for transport in the event that there was not enough time to get all of the patients
out, though such guidelines could not be identified in the evacuation plans that they provided to
62

us. The other 5 facilities indicated that there were no guidelines for patient selection if there was
not enough time available to move patients. The two largest facilities estimated it would take “24
hours” and between “36-48 hours” to evacuate. The smaller hospital replied “yes,” there is an
estimate for how long a complete evacuation would take, but no estimate was given. Another of
the smaller facilities is a nursing home, and they estimate that a complete patient evacuation would
take between 3-4 hours to complete.
The following tables represent the responses to the prioritization questions. Table 4.1 represents
patient groups, and Table 4.2 represents age groups.
Table 4.1: Which patient group would you most likely transport first?
Facility No. Hospice Acutely Ill Chronically Ill Immediate Care Other
1 X2 X3 skilled nursing4 X X5 X6 X X X X
Facility 7 did not check any of the options listed in Table 4.1 but instead answered: “ethical ques-
tion; answer determined by event type (pan flu event vs. mass casualty event for best likelihood of
survival/best good for most/etc. or whatever ethics model is for event type.” There was however,
no mention of ethics models in the evacuation plans.
Table 4.2: Which patient age group do you think has priority in transporting to safety?
Facility No. Infants Children 21-35 35-65 66+
1 X X23 X4 X X X X X5 X6 X
63

Facility 7 did not respond to the age prioritization question.
As expected, all facilities indicated that their disaster plans specified transferring medical records,
medication, and equipment with patients. Four of the facilities (including the smallest and the
largest hospitals) indicated that the nearest facility to shelter its patients was within 5 miles. The
296-bed facility indicated that the closest facility was within 5 miles, but if there was no room for
their patients at this receiving facility, patients would have to be transferred out of the state.
The survey included questions about the types of transportation vehicles available. All would have
access to ambulances for an evacuation. Public busses, personal and facility-owned vehicles, and
helicopters would also be available to some of the facilities. The two largest hospitals - along with
one other facility - indicated that they had resources that would allow them to move more than
10 people at a time. Two other facilities estimated that they would be capable of moving between
20 and 25 people at a time. Only two facilities indicated that they could only move up to 5 and 6
patients at a time.
Each of the facilities require annual evacuation training for their personnel. Six of the six responses
to this question indicated that nurses were required to be trained annually, but only 3 of the 6
indicated that doctors were required to be trained annually.
4.3 Survey Conclusions
The limited response to the survey was disappointing but helpful, and it indicated and foreshadowed
the limited focus in this research area. The survey, however, provided us with a baseline knowledge
of facility sizes and helped us identify points of contact with an interest in our work. Over the
next two years, discussions with clinicians and presentations at healthcare conferences continued to
confirm that patient prioritization during facility evacuations are rarely discussed - likely because of
the associated highly ethical decisions and liabilities - but most everyone we presented the research
64

idea to confirmed the potential research benefits.
65

Chapter 5
Markov Decision Process Model,
Dynamic Programming, and
Simulation
This chapter presents a basic, single server model used for determining priorities for evacuation
selection decisions. The basic model is discussed and tested with dynamic programming and sim-
ulation. Most of the information within this chapter is based on a paper that was selected for
publication in the Transportation Research Record [28].
First, the model parameters and assumptions are introduced. Next, the dynamic programming
model is described and tested with six scenarios. Then, the optimal policies from the dynamic
program are analyzed with discrete-event simulation. An additional simulation discussion follows
where patient selection decisions are based on the time remaining in the evacuation window (as
opposed to state-dependent policies resulting from the dynamic program).
66

5.1 Model Introduction
A complete evacuation from a healthcare facility would very likely be accomplished by multiple
unit-, department-, or floor-level evacuations occurring simultaneously. Within each evacuation, an
evacuation team - or multiple evacuation teams - would be responsible for moving the patients to
safety, and these evacuation teams would likely consist of some subset of the clinicians who usually
staff that area. The model presented in this chapter will be used to examine policies and create
assumptions for evacuation guidelines. The model is designed to prioritize patients within floors or
units instead of choosing patients from the entire set of patients throughout the facility as teams
are unlikely to leave their patients.
Consider a system in which there are N jobs (patients) to be serviced (evacuated). After each
evacuation, there are (N - 1) patients remaining in the system. In addition, a patient death also
reduces the number of patients remaining in the system. Assuming that the evacuation and death
transition rates are exponentially distributed, the system can be modeled as a Markov chain. If
the N jobs are divided into groups that are classified by their transition rates (i.e., N1 + N2 =
N), the state of the system can be represented by the number of both types of patients awaiting
evacuation. When there are rewards and costs associated with decisions and transitions from each
state, the system can be modeled as a Markov decision process. Therefore, there is an optimal
sequence of selecting jobs for service. In this work, the optimal sequence of patient evacuations will
maximize the overall expected reward.
In the case of a healthcare facility evacuation, patients abandon the system if they 1) are success-
fully transferred to another facility, 2) die waiting for evacuation, or 3) die during the evacuation.
In the case of a forecasted emergency that requires an evacuation (i.e., hurricane), it is likely that
the facility will discharge as many patients as possible to reduce the number of patient evacuations.
67

5.2 Model Parameters and Assumptions
During an evacuation, the staff must decide where they will allocate their resources for evacuating
the next patient. The following parameters are used to determine how resources should be allocated.
Let λi denote the rate of evacuating type i patients. The evacuation rate represents the time
needed for the team to complete a patient transfer before starting a new patient. This rate can be
interpreted differently and updated according to the role of the evacuation team. For example,
• Some evacuation teams may only be in charge of prepping patients for transfer, and separate
teams of facility workers or emergency medical services (EMS) crews may transport patients
from their rooms. Remember in Chapter 2, the minimum and maximum times to prepare a
patient for transport were presented based on estimates from Johnson [83];
• An evacuation team could prep a patient in his room and then take him to a designated
staging point for transport. Johnson [83] also presented estimates for the walking speeds to
transport patients alone, in a wheelchair, or in a bed;
• An evacuation team may travel with a patient to the receiving facility and then return to the
evacuating facility. In this case, λi is the time required for a round trip.
This rate may also include the time required to order and prepare medications, collect the medical
record and any equipment, and physically prepare the patient for transportation.
During the evacuation process, there is a risk of mortality based on the patient’s medical condition
or the transportation conditions. Assume that a type i patient can be successfully evacuated with
probability pi (and, likewise, a patient will die during evacuation or transport with probability
(1 − pi)). Based on these parameters, the effective rate of a successful evacuations is λipi for
patient type i. During the evacuation process, the classification status of patients can also change
as they wait for medical staff to move them to safety. Such transitions could occur because of
a change in the patient’s health status or because of his relative location to the emergency (i.e.
non-critical care patients that are located close to a fire or exposed to a chemical or toxin could take
68

longer to evacuate and have an increased death rate). Therefore, assume that a patient transitions
to the other patient class at rate βi. Such a transition would decrease the number of type i patients
(Xi − 1) and increase the number of type j patients (Xj + 1). Finally, patients may perish as they
wait for evacuation, and we denote the rate at which type i patients die as αi. This can be thought
of as the usual mortality rate of the patients though the rate may be increased due to the nature
of the emergency. For example, exposure to a hazardous chemical could increase the patient death
rates. In summary,
• Xi - denotes the number of type i patients in the system;
• λi - denotes the rate of evacuating type i patients;
• pi - denotes the probability of a successful evacuation of a type i patient;
• βi - represents the rate at which a type i patient becomes the other type; and
• αi - denotes the death rate for type i patients while waiting for evacuations.
Each successful evacuation is associated with a reward, lei , and each death is associated with a cost,
ldi . These are assigned at the time a patient leaves the system. There could also be costs associated
with holding type i patients in the system, so let hi denote the cost of holding a type i. The
holding rates are charged after every transition based on the number remaining to be evacuate. In
summary,
• lei - denotes the reward for a patient i evacuation;
• ldi - denotes the cost for a patient i death; and
• hi - denotes the cost of holding a type i patient in the system.
69

5.3 Basic Two-Class Model
The dynamic programming and simulation models in this section consider evacuations where pa-
tients can be classified into one of two patient classes, usually assumed to be critical and non-critical
care patients. It is fair to assume that certain scenarios, however, will alter these assumptions, and
these will be discussed as they are presented.
In addition, the numeric tests described in this chapter will assume that there are 20 critical care
patients and 20 non-critical care patients to be evacuated. Some of the values of the parameters
listed in the previous section will be based on observations from two local mock evacuations since
there is not data available for the models otherwise (see Appendix B for a discussion of data col-
lected at mock evacuations). Most tests will assume that between 1 - 4 critical care patients can be
evacuated per hour and between 2 - 6 non-critical care patients can be evacuated per hour. Because
few of the papers described in Chapter 2 discuss any transportation-related deaths, the probability
of a successful evacuation is assumed to be high.
The objectives of the models are to maximize a value. This can be thought of as a profit when
holding costs are included for patients in the system. Without holding costs, the objective can
be considered as maximizing reward where every successful evacuation contributes to the overall
reward and every death costs.
Assume that there are N patients in the system that require service, and that these patients belong
to either classification group, so there are N1 Type 1 patients and N2 Type 2 patients to be evacu-
ated where N1 + N2 = N . The continuous-time state description of such a system can be defined
by (X1(t), X2(t)), where X1(t) denotes the number of Type 1 patients remaining in the system
(X1(t) ∈ {0, 1, . . . , N1}) at time t, and X2(t) denotes the number of Type 2 patients remaining in
the system (X2(t) ∈ {0, 1, . . . , N2}) at time t.
70

5.3.1 Model Description
As previously mentioned, transitions can occur at any point in time t, so the state description in-
cludes continuous-time parameters. With uniformization techniques, the problem can be converted
to an equivalent discrete-time problem. First used by Lippman in 1975 [102], all of the transition
rates are scaled by the maximum rate of transition (refereed to as γ in this research). After uni-
formization is applied, “fictitious” transitions may be introduced, and all transitions happen at the
same rate. If it was not time for the system to transition, the state will remain unchanged based
on the fictitious transition. The state of the system for the discrete-time problem is (X1, X2) where
Xi denotes the number of type i patients remaining in the system.
Let the policy π describe how to allocate resources for evacuating the next patient, based on the
current state. Policy π is therefore a sequence of decisions π = {a1, a2, . . .}, where ak is a vector
of actions to be taken based on the current state. Let Π be the set of all such policies. For the
discrete time problem, let (X1, X2) represent the state of the system at time n and ak denote the
actions taken at time k under policy π. The resulting n-stage expected reward is given by
vn(X1, X2) = Eπ(X1,X2)
[n−1∑k=0
r(x1k, x2k, ak(x1k, x2k))
], (5.1)
where r() denotes the reward achieved at stage or time k. This leads to the optimal n-stage expected
reward of
v∗n(X1, X2) = supπ∈Π
vπn(X1, X2). (5.2)
For the evacuation prioritization decision making problem, the evacuation teams can choose from
which patient class to evacuate the next patient. This leads to the following decision at any epoch:
π =
(λ1, 0) evacuate type 1 next - Policy 1
(0, λ2) evacuate type 2 next - Policy 2, (5.3)
where λi denotes the selected evacuation rate and implies selection of a type i patient. Figure 5.1
71

below represents the state transition diagram if Policy 1 is applied at all decision points for a single
server evacuation. For the purpose of the figure, assume that each patient class has 20 patients to
be evacuated. The dashed lines represent the fictitious transitions used in uniformization. For this
problem, the maximum rate of transition, γ = λ1 + λ2 + N1α1 + N2α2, is used to scale the rates
in the Equation (5.3.1). Remember that Ni represents the total number of type i patients to be
evacuated, and Xi represents the number of type i patients remaining in the system. Therefore, the
fictitious transition rate - shown as a dashed line in Figure 5.1 - is (N1−X1)α1 + (N2−X2)α2 +λ2
when Policy 1 is chosen and (N1 −X1)α1 + (N2 −X2)α2 + λ1 when Policy 2 is chosen (not shown
in a transition diagram).
Figure 5.1: Transition diagram for the single server model when Policy 1 is chosen.
The optimality equation for the single server finite horizon evacuation decision problem shown
below in Equation (5.3.1).
ν(X1, X2) = X1α1
[ν(X1 − 1, X2)− ld1
]+X2α2
[ν(X1, X2 − 1)− ld2
]− h1X1 − h2X2
+max
λ1p1 [ν(X1 − 1, X2) + le1] + λ1(1− p1)[ν(X1 − 1, X2)− ld1
]+ [(N1 −X1)α1 + (N2 −X2)α2 + λ2]ν(X1, X2)
λ2p2 [ν(X1, X2 − 1) + le2] + λ2(1− p2)[ν(X1, X2 − 1)− ld2
]+ [(N1 −X1)α1 + (N2 −X2)α2 + λ1]ν(X1, X2)
The first two terms in Equation (5.3.1) represent patient deaths while waiting for evacuation. Based
72

on the number of patients remaining in the system, a patient death - unrelated to the evacuation
decision but dependent on the normal operations of the facility or the emergency type - will occur.
When a patient death occurs, the number of patients waiting in the system is reduced and a penalty
is assigned. The next two terms represent the costs of holding each patient type in the system.
The final term represents the choice: either evacuate a Type 1 patient or a Type 2 patient. With
both choices, there is a chance of an unsuccessful evacuation, so the number of patients in the
system will be reduced, and either a reward or penalty will be assigned based on the probability
of a successful evacuation. In addition, each decision is associated with a fictitious transition rate
that is used for uniformization.
5.4 Numeric Tests and Initial Patient Selection Decisions
A dynamic program was created based on the work of Mayorga et al. [106]. The program reads the
input parameters from a text file and returns the value of Policy 1 at each combination of (X1, X2),
the value of executing Policy 2 at each combination of (X1, X2), the value of the optimality equation
at each combination of (X1, X2), and the optimal sequence of decisions based on those parameters.
See Appendix C for an example of the input and output files as well as discussion of the dynamic
programming code.
For the purpose of continuity, assume that the floor, unit, or department has 20 critical care pa-
tients and 20 non-critical care patients to be evacuated. Within the following sections, the optimal
patient selection policy is shown in a diagram. These diagrams indicate which patient should be
evacuated (Type 1 or Type 2) for any combination of (X1,X2) which represents the number of Type
1 and Type 2 patients remaining in the system at that point in time. For these tests, values for
(X1,X2) can range from (0,0) to (20,20). It is assumed, however, that a floor-, unit-, or department-
level evacuation would not consist of 40 patients. Because dynamic programming works by solving
problems recursively, the policy diagrams still apply for any subset of patients.
73

It is fair to assume that non-critical care patients have quicker evacuation rates, higher probabil-
ities of successful evacuations, and slower death rates than critical care patients. Table 5.1 below
summarizes the test parameters that will be used for the initial tests described in the remainder of
this chapter.
Table 5.1: Summary of Test Parameters.
Parameter Test 1 Test 2 Test 3 Test 4 Test 5 Test 6
λ1 2.5/hour 2.5/hour 2.5/hour 2.5/hour 2.5/hour 2.5/hourλ2 4/hour 4/hour 4/hour 4/hour 4/hour 4/hourp1 0.99 0.99 0.99 0.99 0.99 0.99p2 0.999 0.999 0.999 0.999 0.999 0.999α1 0.055 0.1 0.1 0.1 0.1 0.1α2 0.055 0.055 0.055 0.055 0.055 0.055h1 0 0 0.02 0.035 0.035 0.035h2 0 0 0.02 0.02 0.02 0.02le1 1 1 1 1 0 1ld1 1 1 1 1 0 2le2 1 1 1 1 0 1ld2 1 1 1 1 0 2
5.4.1 Maximizing Saved Lives
Let us first consider a case where the objective is to maximize the number of lives. In this case, the
reward for a saved life is the same for both patient classes, and it is equal to the cost of a patient
death for both patient classes (lei = ldi = 1 for i = 1, 2). Assume that there is no cost for holding
either type of patient in the system (hi = 0 for i = 1, 2) and that patients will never transition to
the other type of patient (βi = 0 for i = 1, 2). In most evacuation settings, it is logical to assume
that patient transfer times are lower for the less critical patients, and that this group of patients
is less likely to die during transport (have higher probabilities of successful evacuation). However,
assume the unlikely case that these patients also have a quicker rate of death while waiting for
evacuation. Therefore, assume that
• The rate of a successful evacuation rate is higher for Type 2 patients than it is for Type 1
patients, and
74

• Type 2 patients die at a quicker rate while waiting for evacuation than Type 1 patients.
These observations lead to the following property:
Property 1. For a 2-class system as shown in Equation (5.3.1), λipi ≥ λjpj and αi ≥ αj implies
priority should always be given to type i patients.
Though this property has not yet been proven, intuitively, however, it makes sense that removing
such patients first would maximize the objective function. Consider the parameters given for Test
1 in which the conditions of Property 1 are satisfied. Priority should be given to all Type 2 patients
first. This means that all Type 2 patients should be evacuated first before beginning to evacuate
any Type 1 patients. Figure 5.2 shows the optimal policy diagram for this “greedy” policy. In
a greedy policy, the choice is to completely evacuate all of one patient type before beginning to
evacuate any from the other.
Figure 5.2: Initial observations - Test 1 policy decisions.
75

To illustrate Property 1, we have assumed that Type 1 and Type 2 patients die at the same rate
for Test 1. While this could occur based on the type of threat and the location of the patients in a
facility, α1 = α2 is not the typical case. Instead, it is fair to assume that critical care patients would
die at a faster rate than non-critical care patients. To examine this more typical case, assume the
Test 2 parameters. Now, assume α1 > α2, and all other conditions are the same as described above
for Test 1. The objective is still to maximize the number of evacuees that leave the system. The
policy structure for this case is shown in Figure 5.3. Notice how the optimal sequence of decisions
chooses non-critical care patients when there are larger numbers of both patient classes still in the
system waiting to be evacuated. As we transfer the non-critical care patients - and patients from
both groups die while waiting to be evacuated - there will be a point at which priority should switch
to the critical care patients. All critical care patients remaining in the system would be evacuated
before returning attention to non-critical care patients.
Figure 5.3: Initial observations - Test 2 policy decisions.
76

5.4.1.1 Including Holding Costs
In Section 5.4.1, the objective was to maximize the number of lives saved (where le1 = ld1 = le2 =
ld2 = 1), with no consideration for how long each patient waits in the system for evacuation. By
including non-zero holding costs (hi 6= 0) in Equation (5.3.1), the model now considers the speed
at which patients are leaving the system to avoid penalties from holding them in the system. As
mentioned before, holding rates are charged after every transition based on the number still in the
system, while rewards and penalties are assigned when a patient leaves the system. Now, the model
is driven by getting the most number of evacuees out as quickly as possible.
Using the same parameter values for Test 2, we now include h1 = h2 = 0.02 for Test 3 (please
refer back to Table 5.1 for parameter values). In this case the policy is greedy and recommends
evacuating all patient non-critical patients first (the policy diagram is not shown as it is the same
as Test 1, shown in Figure 5.2). Recall that the optimal policy in Test 2 requires switching between
choosing Type 2 and Type 1 depending on how many patients remain in the system. By including
holding costs, we now choose to evacuate all non-critical care patients first (i.e., the policy is greedy
and is optimal for both Tests 1 and 3). Since these patients have a higher evacuation rate, we can
add more value to the objective function by getting more patients out quickly.
Note that “equal holding costs” does not imply that the group that can be evacuated more quickly
will always be chosen for transport first. The resulting policy depends on the other input parame-
ters discussed in this section, but it has been shown that the addition of holding costs can change a
switching policy to a greedy policy. As a comparison, the following test sets unequal holding costs
for the critical and non-critical care patients. Assuming that it costs more to hold a critical care
patient in the system (h1 = 0.035 and h2 = 0.02), Test 4 is discussed again in the following section,
and Figure 5.4 contains the optimal policy structure for selecting patients for evacuation.
77

Figure 5.4: Initial observations - Tests 3 and 4 policy decisions.
5.4.2 Initial Ethical Observations
One of the more interesting pieces of this research is determining the objective that best balances
the ethical principles. This involves considering the information available in the medical record,
estimating costs and rewards, and determining the best way to incorporate these into the model.
In this section, consider how we place and model value on transferring patients, patient deaths, and
keeping patients in the system. As shown in the previous sections, the optimal policies can change
with the addition of and choices for evacuation rewards, death penalties, and holding costs.
In Figure 5.5, we compare three scenarios for how rewards and costs are weighed into the objective
function. Beginning with Test 4 (h1 = 0.035 > h2 = 0.02) as discussed in the previous section,
the optimal policy varies between selecting a critical care or non-critical care patient next based
on the remaining number in each class. In Test 5, we then consider a case that places no value
on saved or lost lives (i.e., only holding costs are used). Since this objective focuses on the cost
of those patients not evacuated yet, we would more often want to evacuate non-critical patients
78

as opposed to critical patients. This is observed by the slight shift in the threshold for when the
policy switches between Type 1 and 2. Finally, Test 6 compares making a death twice as costly as
the saving of a life (as opposed to Test 4 where the cost and reward are the same). All other input
parameters are identical for the tests. Now, we observe that critical care patients have more of an
increased priority than in Test 4 (i.e., the shaded region of 1s is larger).
Figure 5.5: Initial observations - Tests 4, 5, and 6 policy decisions.
5.4.3 Additional Dynamic Programming Observations
First, note that when the optimal policy is a switching policy, the Type 1 regions form triangles.
In their research, Argon et al. [10] show that the “triangle heuristic” os a good representation of
the optimal policy.
While we can make several valuable observations concerning which patient class to transfer at
various time epochs, we can also discern evacuation performance by modeling these policies using
simulation. Note that the above analysis assumes an infinite horizon. In reality, there is likely some
finite time available for decisions to be made. In some situations, patients may be left behind. An
impending threat could mean that every patient dies when the disaster occurs. In other situations,
79

patients may not die, but the availability of quality healthcare would decrease and therefore their
death rates would likely increase. Now, such situations can be described and modeled using simu-
lation.
5.5 Patient Selection Decisions with Simulation
This section describes a simulation model that was created to 1) test the policies generated by the
dynamic program and 2) examine other scenarios that complicate a dynamic programming model.
For a discussion of how the simulation model works, please see Appendix D.
Again, each test considers a population of 40 (N1= 20 critical care patients and N2 = 20 non-
critical care patients). The tests in the following sections, Sections 5.5.1, 5.5.2, and 5.5.3 are for
250 replications each. This resulted in extremely small confidence intervals on the true mean of
each performance measure recorded (typically, the half-width value for the number of evacuees was
less than 0.3 and less than 0.2 for deaths and evacuation times).
5.5.1 Simulating Dynamic Programming Policies
The dynamic program generates a policy structure but does not return any statistics that represent
the performance of that policy. Therefore, the suggested patient selection decisions are embedded
into the simulation to determine the number of evacuees and deaths as well as the time to complete
the evacuation process. Based on the input values including the number of patients in each class to
be evacuated, the evacuation rates, the death rates, and the probability of a successful evacuation;
the evacuation window; and the prioritization strategy (see Appendix D), the simulation returns
the following statistics:
• The percentage of incomplete evacuations based on the given evacuation window;
• The total number of Type 1 and Type 2 evacuees;
80

• The total number of Type 1 and Type 2 deaths; and
• The average completion time (the time taken to completely clear the system of all patients).
Table 5.2 summarizes the performance measures of the policies suggested for Tests 1 - 6 in the previ-
ous section. We run each test as if there are two evacuation windows: 8 and 16 hours. In some cases,
there may not be enough time to completely evacuate, and this is reflected in the table as well under
the “Complete” column. This column indicates the percentage of completed evacuations - or the
percentage of runs in which the system was completely cleared during the given evacuation window.
Table 5.2: Average Performance Measures of Dynamic Programming Policies.EvacuationWindow
TestNo.
Complete(%)
TotalType 1Evacuees
TotalType 2Evacuees
TotalType 1Deaths
TotalType 2Deaths
Numberof LivesSaved
Average Com-pletion Time(hours)
8 hours 1 31.6 9.272 16.18 7.548 3.82 14.084 7.78438 hours 2 55.2 9.5680 14.232 9.828 4.804 9.168 7.35568 hours 3 60.8 7.924 16.216 10.808 3.784 9.548 7.29888 hours 4 57.6 8.372 15.092 10.488 4.492 8.484 7.29478 hours 5 54.4 7.5720 15.608 10.7 4.236 8.244 7.37718 hours 6 60 8.656 14.908 10.412 4.592 8.56 7.287
16 hours 1 100 12.008 16.18 7.992 3.82 16.378 8.899316 hours 2 100 10.0960 15.128 9.904 4.872 10.448 7.826616 hours 3 100 8.98 16.216 11.02 3.784 10.392 7.765216 hours 4 100 9.328 15.484 10.672 4.516 9.6124 7.777516 hours 5 100 8.984 15.756 11.016 4.244 9.48 8.030416 hours 6 100 9.456 15.368 10.544 4.632 9.648 7.7539
Tests 1 and 3 are greedy policies and are run by evacuating all non-critical patients before starting
to evacuate critical patients. The input parameters are the same for both tests except α1. For Test
2 and each test after, the death rate increases to almost twice the rate for critical care patients.
Notice that Tests 1 and 2 have the highest percentage of incomplete evacuations in an 8-hour evac-
uation window; these are the only two tests that do not consider holding costs.
Tests 2, 4, 5, and 6 have similar switching curves, so their performance is very similar. It is inter-
esting, however, to note the effect of the objective on the results. For example, the only difference
in the parameters of Tests 2 and 3 is that holding costs are introduced in Test 3. We see that doing
this actually saves fewer lives (10.392 versus 10.448 for a 16-hour window), but the objective is
81

weighted to reduce the total number waiting, not simply the total number evacuated as in Test 2.
Figure 5.7 graphically depicts the simulation results from Test 2. It shows the number of evacuees
of each patient type for evacuation windows between 1 and 16 hours as well as the percentage of
incomplete evacuations in a given time window (over 250 replications).
Figure 5.6: Simulation results for DP policy - Test 1.
Tests 3 and 4 have the same input parameters except it is more expensive to hold Type 1 patients
in Test 4. This changes the policy from a greedy policy (Test 3) to another switching policy where
it is better to evacuate non-critical care patients when there are greater numbers of both types
of patients in the system and evacuate critical patients when the number of patients remaining in
both classes is low.
82

Figure 5.7: Simulation results for DP policy - Test 2.
83

Figure 5.8: Simulation results for DP policy - Test 3.
84

Figure 5.9: Simulation results for DP policy - Test 4.
85

Figure 5.10: Simulation results for DP policy - Test 5.
86

Figure 5.11: Simulation results for DP policy - Test 6.
87

5.5.2 Policy Comparisons with Simulation
In this section, the performance of the dynamic programming policies, including the number of
evacuees, deaths, and saved lives, as well as the average evacuation completion time (as shown
in Table 5.2 above), is compared to the performance of the all-or-nothing, greedy policies that
suggested in the literature or used in practice. For each combination of parameters, there are two
additional simulation runs to compare to the optimal policy: all Type 1 patients are evacuated
first and all Type 2 patients are evacuated first. Table 5.3 represents an 8-hour evacuation window,
and Table 5.4 represents a 16-hour window. The simulation only uses the rates of evacuation and
death, as well as the probabilities of successful evacuation as input parameters. Because the only
difference in Tests 2 - 6 were the rewards and costs, the simulation output for a greedy Type 1
policy is the same for Tests 2 - 6, and the simulation output for a greedy Type 2 policy is the
same. However, they are listed in the table to compare to the results of simulation of the dynamic
programming policies.
Table 5.3: Comparison of the Optimal Policies with Greedy Policies - 8 Hours.EvacuationWindow
TestNo.
Complete(%)
TotalType 1Evacuees
TotalType 2Evacuees
TotalType 1Deaths
TotalType 2Deaths
Numberof LivesSaved
Average Com-pletion Time(hours)
Type 1 1 28.4 14.78 7.696 5.076 7.604 9.796 7.7829DP 1 31.6 9.272 16.18 7.548 3.82 14.084 7.7843Type 2 1 31.6 9.272 16.18 7.548 3.82 14.084 7.7843
Type 1 2 45.6 12.96 9.42 7.004 7.484 7.892 7.5874DP 2 55.2 9.5680 14.232 9.828 4.804 9.168 7.3556Type 2 2 60.8 7.924 16.216 10.808 3.784 9.548 7.2988
Type 1 3 45.6 12.96 9.42 7.004 7.484 7.892 7.5874DP 3 60.8 7.924 16.216 10.808 3.784 9.548 7.2988Type 2 3 60.8 7.924 16.216 10.808 3.784 9.548 7.2988
Type 1 4 45.6 12.96 9.42 7.004 7.484 7.892 7.5874DP 4 57.6 8.372 15.092 10.488 4.492 8.484 7.2947Type 2 4 60.8 7.924 16.216 10.808 3.784 9.548 7.2988
Type 1 5 45.6 12.96 9.42 7.004 7.484 7.892 7.5874DP 5 54.4 7.5720 15.608 10.7 4.236 8.244 7.3771Type 2 5 60.8 7.924 16.216 10.808 3.784 9.548 7.2988
Type 1 6 45.6 12.96 9.42 7.004 7.484 7.892 7.5874DP 6 60 8.656 14.908 10.412 4.592 8.56 7.287Type 2 6 60.8 7.924 16.216 10.808 3.784 9.548 7.2988
First, notice that a 16-hour window was enough to completely evacuate all patients at the input
88

Table 5.4: Comparison of the Optimal Policies with Greedy Policies - 16 Hours.EvacuationWindow
TestNo.
Complete(%)
TotalType 1Evacuees
TotalType 2Evacuees
TotalType 1Deaths
TotalType 2Deaths
Numberof LivesSaved
Average Com-pletion Time(hours)
Type 1 1 100 14.912 11.944 5.088 8.056 13.712 8.9077DP 1 100 12.008 16.18 7.992 3.82 16.376 8.8993Type 2 1 100 12.008 16.18 7.992 3.82 16.376 8.8993
Type 1 2 100 12.992 12.192 7.008 7.808 10.363 8.3098DP 2 100 10.0960 15.128 9.904 4.872 10.4448 7.8266Type 2 2 100 8.98 16.216 11.02 3.784 10.392 7.7652
Type 1 3 100 12.992 12.192 7.008 7.808 10.363 8.3098DP 3 100 8.98 16.216 11.02 3.784 10.392 7.7652Type 2 3 100 8.98 16.216 11.02 3.784 10.392 7.7652
Type 1 4 100 12.992 12.192 7.008 7.808 10.363 8.3098DP 4 100 9.328 15.484 10.672 4.516 9.6124 7.7775Type 2 4 100 8.98 16.216 11.02 3.784 10.392 7.7652
Type 1 5 100 12.992 12.192 7.008 7.808 10.363 8.3098DP 5 100 8.984 15.756 11.016 4.244 9.48 8.0304Type 2 5 100 8.98 16.216 11.02 3.784 10.392 7.7652
Type 1 6 100 12.992 12.192 7.008 7.808 10.363 8.3098DP 6 100 9.456 15.368 10.544 4.632 9.648 7.7539Type 2 6 100 8.98 16.216 11.02 3.784 10.392 7.7652
value settings chosen for these simulation runs. Therefore, examine Table 5.4 and notice that the
number of saved lives is as good as or greater than the number of saved lives when one of the greedy
policies is chosen for Tests 1 and 2. These are the only two tests that did not include holding costs.
In Tests 3 - 6, holding costs were included so that the objective included more than just a reward for
an evacuee and a penalty for a patient death (in Test 5, however, only holding costs are considered;
remember that there was no reward for an evacuee or cost for a death). When the holding costs are
introduced in the models, additional costs are incurred at every transition based on the number of
patients remaining in the system.
The differences in the performance are at the heart of one of the issues surrounding this research:
any policy decisions that maximize the number of saved lives would likely be preferred to those
that include additional costs by most stakeholders, except for perhaps the administrators. The fact
that the number of saved lives is similar for the greedy policies and the switching policies — and
the time to complete an evacuation is similar — is likely due to the fact that the rates at which
the two patient types are leaving the system are similar for the values chosen. For example, Type
1 patients are evacuated at a rate of 2.5/hour, and they die while waiting at a rate of 0.1 per hour;
89

and Type 2 patients are evacuated at a rate of 4/hour, and they die while waiting at a rate of 0.055
per hour (the probability of a successful evacuation was very high for both at 0.99 and 0.999 for
Type 1 and Type 2 patients, respectively). These results prompt the need for further testing and
comparisons.
5.5.3 Patient Selection with Simulation
For the following tests, consider now that the policy is based on the amount of time until the
disaster occurs rather than the number of patients in the system. In order to test these policies,
a switch time is imposed for stopping the evacuation of one group and beginning the evacuation
of the other. That is, the evacuation begins by evacuating either type of patient. For example,
assume that the evacuation begins with Type 2 patients. At the switch time, the simulation would
switch to Type 1 patient evacuations and clear this group before completing any remaining Type
2 evacuations.
Each 15-minute increment of time between the start of the evacuation and the end of the evacuation
window is evaluated as a possible switch time. Using Arena’s OptQuest optimization package, the
optimal switch time is determined to be the time that maximizes the number of evacuees minus
the number of deaths.
First, two of the tests from the previous sections, Tests 1 and 2, were chosen for testing in order
to compare the number of evacuees when the optimal policy decisions are based on the number
of patients remaining in the system (Table 5.2) to a policy driven by time (see Table 5.5 below).
Table 5.5 includes the new information on the switch time as well as the number of lives saved
when the switch is made at that time. In addition, two new scenarios, Tests 7 and 8, are presented
in which slower death and evacuation rates were used. In particular, the death rates are now set to
between 0.004 deaths/hour and 0.01 deaths/hour and more accurately represent non-catastrophic
emergency events and provide a sense of how frequently deaths could occur within a controlled,
90

mass patient transfer or evacuation. As a result, the simulations also now require a 24-hour win-
dow since a full evacuation cannot be completed in 16 hours (patients do not perish as quickly and,
therefore, must still be evacuated).
Table 5.5: Suggested Switching Times.TestNo.
λ1 p1 α1 λ2 p2 α2 EvacuationWindow(hours)
Numberof SavedLives- StartwithType 1
TimetoSwitchFrom1 - 2
Numberof SavedLives- StartwithType 2
TimetoSwitchFrom2 - 1
1 2.5 0.99 0.055 4 0.999 0.055 8 13.9 0 13.0 3.251 2.5 0.99 0.055 4 0.999 0.055 16 16.3 0 16.0 3.252 2.5 0.99 0.1 4 0.999 0.055 8 10.3 0 9.3 2.02 2.5 0.99 0.1 4 0.999 0.055 16 11.3 1.0 11.3 0.257 1.33 0.99 0.01 3 0.999 0.004 8 16.6 0 15.2 6.07 1.33 0.99 0.01 3 0.999 0.004 16 26.5 0.5 23.5 4.257 1.33 0.99 0.01 3 0.999 0.004 24 29.5 7.0 29.4 08 2 0.99 0.006 2 0.999 0.006 8 12.7 0.75 12.7 5.08 2 0.99 0.006 2 0.999 0.006 16 26.7 2.25 26.6 2.258 2 0.99 0.006 2 0.999 0.006 24 30.4 2.0 30.5 0
Consider Test 1. If the plan is to start evacuating Type 1 patients, the simulation shows an optimal
switch time at t = 0 which implies that we should start evacuating Type 2 patients first. Remem-
ber that the dynamic program suggested this greedy policy as well. For an 8-hour evacuation, the
simulations show 13.8 lives saved (evacuees minus deaths) in Table 2 and 13.9 lives saved in Table
5.5. The times to switch from Type 2 to Type 1 are 3.25 hours for both evacuation windows as a
full evacuation takes approximately 8 hours.
It is expected that the time to switch from Type 1 patients to Type 2 patients would increase
and the time to switch from Type 2 patients to Type 1 patients would decrease as the available
evacuation window increased when Type 1 patient die at a faster rate (Tests 7 and 8).
In Test 8, the patient types have the same parameters except for the probabilities for successful
evacuation, and therefore the switch time is not as important and the number of lives saved is
similar during each evacuation window.
91

5.6 Conclusions from the Single Server Model
This chapter presented and discussed the first dynamic programming and simulation tests for
healthcare facility evacuations. Based on these tests, the following trends were observed:
• A policy can be categorized as either 1) a greedy, Type 1 policy; 2) a greedy, Type 2 policy;
or 3) a switching policy.
• There is at most one switch.
• Any switching policy for critical and non-critical care patients starts by evacuating non-critical
care patients and then switches to evacuate all remaining critical care patients.
The results presented in this chapter has limited ability for direct implementation by practitioners,
and it would be unfair to assume that the clinical staff would have all of the suggested input
parameters to run these models. Therefore, the aim of the following chapters is to identify generic
policies or characteristics of the optimal policy that would improve decision making during an
emergency evacuation.
92

Chapter 6
Properties of the Single Server Model
The purpose of this chapter is to further investigate the single server evacuation model (presented
in the previous chapter) and determine properties of the optimal solutions that will in turn provide
insights into patient selection decisions. Section 6.1 describes a sensitivity analysis for critical and
non-critical care patients, and the trends and observations from these tests are discussed in Section
6.2. For the discussion in this chapter, it is assumed that the reward resulting from a complete
patient evacuation is the same for both patient classes, and in addition, the value is equal in mag-
nitude to the cost of a lost life from either of the patient classes. That is, le1 = le2 = ld1 = ld2 =
1. This assumption follows the utilitarian logic: every patient counts equally towards the greater
good such that no patient is considered more valuable than another.
When patients are categorized as critical and non-critical care patients, it is assumed that
1. Non-critical patients can be evacuated more quickly than critical care patients.
• λ1 < λ2
2. Non-critical patients have a higher probability of a successful evacuation.
• p1 < p2
3. Critical care patients die while waiting at a quicker rate than non-critical patients.
• α1 > α2
93

6.1 Sensitivity Analysis
In order to investigate how the input parameters affect the optimal policy, a sensitivity analysis
was performed to examine the location of the switching curve in the optimal policy diagram (the
switching curve may be so low or so high that a switch does not exist; therefore, the optimal policy
is a greedy policy). Figures 6.1 and 6.2 illustrate the movement of the switching curve. Incremental
changes to the input parameters can create small shifts in the location of the switching curve and
therefore the size of the classification regions, and eventually the relationships may lead to greedy
policies.
Figure 6.1: Optimal policy diagrams: Switching curve moving down.
A full factorial design of experiments (DOE) was created to study the effects of the input param-
eters. In order to decrease the number of runs, the ratios of the eight input parameters (λ1/λ2,
p1/p2, α1/α2 and h1/h2) were selected as the adjustable factors. The parameters for the Type 2
patients were held constant while the parameters for the Type 1 patients were varied. With three
94

Figure 6.2: Optimal policy diagrams: Switching curve moving up.
levels for each of the ratios - low, medium, and high - required only 81 runs to account for ratio
changes as opposed to 6,561 if all eight parameters were examined separately!
6.1.1 Sensitivity Analysis Setup and Output
The design of experiments tests are described below, and then a discussion of the additional anal-
ysis follows. The values chosen to remain constant for the Type 2 patients are shown in Table 6.1,
and Table 6.2 includes the parameter settings chosen to be varied.
Table 6.1: Constant DOE Parameters for Sensitivity Analysis of the Single Server Model
λ2 p2 α2 h2
4 patients/hour 1.0 0.001 patients/hour 0.02
An example of the output for one run is shown here, and the output from the other runs has been
submitted in the electronic appendices (please see the file “Sensitivity Analysis.xlsx”). The first
95

Table 6.2: Variable DOE Parameters for Sensitivity Analysis of the Single Server Model
Parameter Low Medium Highλ1 2 3 3.5p1 0.5 0.75 0.95α1 0.025 0.05 0.075h1 0.01 0.02 0.03
run (DOE #1) was chosen to be an example for the discussion of the steps taken in the sensitivity
analysis. The parameter settings for DOE #1 were as shown in Table 6.3.
Table 6.3: Parameters Settings for DOE Test #1Type λ p α h
1 2 patients/hour 0.5 0.05 patients/hour 0.022 4 patients/hour 1.0 0.001 patients/hour 0.02
The dynamic program generates multiple output files including a list of the resulting value func-
tion at each combination of (X1, X2) (see Figure 6.3). This value represents the expected average
reward associated with starting to evacuate patients in that particular state. These values, for each
(X1, X2) can be copied into Excel relatively quickly and arranged in a matrix of corresponding X1
and X2 rows and columns (see Figure 6.4). Though not labeled, the rows represent a fixed number
of Type 1 patients, and the columns represent a fixed number of Type 2 patients. Therefore, the
value circled in the figure represents the expected average reward of an evacuation starting with
four Type 1 patients and nineteen Type 2 patients remaining in the system. This format is opposite
of the method for displaying the optimal policy diagrams. In addition, the optimal policy diagrams
reduce to (0, 0) in the bottom, left corner, and the figure shows the value for (0, 0) in the bottom,
right corner.
In addition to the list of values, the dynamic program generates a text file with the optimal policy
choice (1 or 2) for each (X1, X2). These values are copied into a template to create the optimal
policy diagrams that were introduced in Chapter 5. In order to better visualize the trends, two
graphs were created: one that shows the value function at fixed values of X1 and another that
96

Figure 6.3: Sample output file: “DataOUT.txt” for DOE Run #1.
Figure 6.4: Sample value function output: DOE Run #1.
shows the value function at fixed values of X2. So that the graphs do not appear convoluted, only
increments of 5 are displayed. Figures 6.5 and 6.6 illustrate sample plots for fixed values of X1 and
X2 (Xi = 0, 5, 10, 15, and 20 for i = 1, 2).
97

Figure 6.5: Property 1: Sample value functions for selected fixed values of X1: DOE Run #1.
Figure 6.6: Property 1: Sample value functions for selected fixed values of X2: DOE Run #1.
6.1.2 Sensitivity Analysis Results
The parameters used for each run as well as the optimal policy and resulting value function are
shown in the tables below. A greedy policy is indicated by either “1” or “2.”
98

Each set of tests shown in the tables represents a unique combination of parameters with only one
parameter varied so that a low, medium, and high ratio is achieved. Each subgroup is listed so that
the holding costs are varied; the lowest ratio is shown first, the medium ratio is shown second, and
the highest ratio shown third. Notice that within each group, for the set of parameters chosen, a
greedy Type 1 policy (denoted by “1”) is never optimal for the low ratio within each set.
In addition, within each group, if the policy changes, it changes along the order of “Type 2,”
“Switch,” and then “Type 1.” This does not imply that a “Switch” policy always follows a “Type
2” policy, but it does imply that the switching curve is moving upwards as the ratios are increasing.
For example, consider the set of parameters listed third to last in Figure 6.5 (Tests #73 - #75).
Figure 6.7 illustrates the optimal policies for the low, medium, and high ratio settings (from left
to right). Therefore if a “Switch” policy is optimal at the low settings, the only possibilities for
the medium setting would be a second “Switch” policy (with a larger region associated with Type
1 patients than was observed in the low settings ) or a “Type 1” policy. If a “Type 1” policy is
shown to be the optimal policy for any of the levels, then the optimal policy at each subsequently
higher level will also be “Type 1.”
Figure 6.7: Sample policy diagrams at the low, medium, and high ratio settings.
99

For the set of parameters chosen for the sensitivity analysis, the optimal policy for the lowest values
of λ1 most often observed is a greedy, Type 2 policy. In only 3 of the 27 tests at this setting was
the optimal policy a switching policy, and each of these occurred at the highest settings of h1. All
three policy options are most often observed at the highest values of λ1 (λ1 = 3.5). We also note
that, within each subgroup, the value function is decreasing. This was expected as each subgroup
represents increasing Type 1 holding costs.
The results were analyzed in Minitab to determine if there were any significant predictors of the
optimal policy. First, the DOE was analyzed to determine which factors had a significant effect
on the policy (each policy was coded categorically where 1 represented a greedy, Type 1 policy; 2
represented a greedy, Type 2 policy; and 0 represented a switching policy). Figure 6.8 represents
the Minitab summary output. In the figure, factors A, B, C, and D represent the ratios of the λ, p,
α, and h values, respectively. Any p-value less than 0.05 represents a factor that has a significant
effect on the response. As expected, and based on the previous discussion, the rate of evacuation
(Factor A) and the holding cost (Factor D) have the most significant effect on the policy. However,
the death rate (Factor C) also significantly impacts the optimal policy. In addition, the interaction
between the rate of evacuation and the holding cost (Factor A*D) also significantly impacts the
optimal policy.
The results of the factorial design were also analyzed to study the effect on the value function. As
expected, each primary factor, as well as most interactions, have a significant effect on the value
function. An additional analysis showed that there is no correlation between the value function
and the optimal policy.
6.1.3 Additional Sensitivity Tests
In this section, the effects of the parameters on the location of the switching curve are further ex-
amined. From the sensitivity analysis tests, the parameter combinations that resulted in a similarly
100

Figure 6.8: Factorial design analysis for impact on policy response.
sized region of Type 1 patients were chosen (i.e., the switching curve is located in approximately
the same place). In the additional tests, three of the ratios were held constant at the initial settings
while the fourth was incrementally increased. The tests chosen for further investigation are listed
in Table 6.6, and the increments chosen are listed in Table 6.7.
For each additional test, four figures are shown together: one includes the incremental changes to
λ1, one includes the incremental changes to p1, one includes the incremental changes to α1, and
one includes the incremental changes to h1. Within each diagram, the original size of the Type 1
101

Figure 6.9: Factorial design analysis for impact on value response.
102

region is represented by the solid line. In addition, if a particular linetype is shown in the legend
but not in the diagram, this indicates that this particular parameter combination resulted in a
greedy, Type 1 policy.
Figure 6.10: Incremental changes to DOE #18.
103

Figure 6.11: Incremental changes to DOE #24.
104

Figure 6.12: Incremental changes to DOE #27.
105

Figure 6.13: Incremental changes to DOE #41.
106

Figure 6.14: Incremental changes to DOE #44.
107

Figure 6.15: Incremental changes to DOE #59.
108

Figure 6.16: Incremental changes to DOE #62.
109

Changes to λ1 show a fairly consistent trend in the movement and location of the switching curve.
As expected, as the ratio λ1/λ2 increases, an incremental increase to h1 becomes increasingly im-
portant to the location of the switching curve. In other words, faster evacuation rates for critical
care patients results in holding costs increases having a larger impact.
One of the more noticeable trends during the testing phase was that incremental increases in α1
have less and less of an effect on the location of the switching curve. Based on the values chosen
for the sensitivity analysis, Tables 6.4 and 6.5 lead to the assumption that increasing the ratios
increased the size of the Type 1 priority region. This would be true if holding costs were not in-
cluded. During these further analyses, however, it was observed that as the value of α1 (the death
rate while waiting for evacuation) increased, the location of the switching curve seem to approach
a limiting or bounding location on the (X1, X2) diagram. This observation lead to additional tests,
that indicate that, when holding costs are included, additional incremental increases to α1 actually
cause the switching curve to start moving downward, thereby increasing the region in which Type
2 patients are given priority. This result is intuitive, however. Increasing the rate of a Type 1
patient evacuation, or increasing the probability of a successful Type 1 patient evacuation, encour-
ages the selection of Type 1 patients. Likewise, increasing the holding costs associated with these
patients makes it more expensive not to choose Type 1 patients for transport. It makes sense that,
eventually, if the rate at which Type 1 patients die while waiting for evacuation is high enough,
it will not be optimal to choose these patients. It should be noted however, that the α1 rates at
which the switching curve started moving downward were between 600 - 800 times the death rate
of a Type 2 patient. This could be a realistic scenario, however, if a localized threat were to put
some patients in immediate danger. At some point, the danger is just too great to put resources
into moving these patients when efforts to move the other patients would provide value.
110

6.2 Structural Properties
Based on the 81 runs from the formalized design of experiments - and more than 25 other runs
with randomly chosen values for the input parameters - several properties of the single-server model
were identified. The electronic attachments include tabs where these relationships were identified
with conditional statements. In this section, these properties and their implications for patient
selection decisions are discussed. Though it has been difficult to attempt to prove mathematically,
the following properties have been shown computationally:
1. The value function, ν(X1, X2), is concave in X1 and X2. For all (X1, X2),
(a) ν(X1 + 1, X2)− ν(X1, X2) ≤ ν(X1, X2)− ν(X1 − 1, X2)
(b) ν(X1, X2 + 1)− ν(X1, X2) ≤ ν(X1, X2)− ν(X1, X2 − 1)
2. (Supermodularity) For all (X1, X2),
(a) ν(X1, X2 + 1)− ν(X1, X2) ≥ ν(X1 + 1, X2 + 1)− ν(X1 + 1, X2)
3. (Diagonal Dominance) For all (X1, X2)
(a) ν(X1 + 1, X2 + 1)− ν(X1, X2) ≥ ν(X1 + 1, X2 + 2)− ν(X1, X2 + 1)
(b) ν(X1 + 1, X2 + 1)− ν(X1, X2) ≥ ν(X1 + 2, X2 + 1)− ν(X1 + 1, X2)
Refer back to Figures 6.5 and 6.6 to see these properties within the plots.
Concavity in X1 and X2 implies that the marginal change in the value associated with evacuating
a patient is increasing as the number of patients in the system decreases. That is, the change in
the value of evacuating a Type 1 patient is greater at a lower value of X1 than a higher value of
X1, and the change in the value of selecting a Type 2 patient for evacuation is greater at a lower
value of X2 than at a higher value of X2.
The supermodularity relationship implies that the action chosen is a function of the state; and in
this case, the marginal change in the value of evacuating a Type 2 patient becomes greater as the
111

number of Type 1 patients in the system decreases. That is, as more Type 1 patients are removed
from the system, the marginal change in the value of choosing a Type 2 patient is increasing. Simi-
larly, the marginal change in the value associated with evacuating a Type 1 patient becomes greater
as the number of Type 2 patients in the system decreases. That is, as more Type 2 patients are re-
moved from the system, the marginal change in the value of choosing a Type 1 patient is increasing.
The diagonal dominance relationship refers to the change in the value as a change is made to both
X1 and X2. Though patient selection decisions cannot be made diagonally, the property may be
helpful in future work. Again, the marginal change associated with a diagonal change is increasing
as the number of patients in the system decreases. That is, the change in the value function asso-
ciated with removing a patient from both groups is greater at lower values of both X1 and X2.
The insights for practitioners based on these relationships will be discussed in Chapter 8.
6.2.1 Policy Determination when Holding Costs are Excluded
In previous, informal testing of the optimality equation, the optimal policies were often shown to
be either a switching policy or a greedy, Type 2 policy. The fact that all 81 DOE tests showed
a greedy, Type 1 policy was initially surprising, but upon further examination and comparison
to other policies, it was determined that a greedy policy could be predicted by examining a ratio
consisting of the Type 1 and Type 2 parameter values. Similar to the cµ rule ([80] and [165]), which
gives priority to jobs with the largest value of ciµi (where ci is the reward if a job is completed and
µi is the service rate for jobs i = 1, 2, ..., I), the optimal policy for the evacuation systems can be
predicted by considering the following relationship.
λ1p1α1
λ2p2α2(6.1)
In all 81 DOE cases, the ratio of the input parameters ranges from 6.25 to 62.34375. As a com-
parison, more tests were run, and the ratios were calculated. Tables 6.8, 6.9, and 6.10 contain the
112

input parameters for Type 1 policies, Type 2 policies, and switching policies, respectively.
113

It makes sense that, without holding costs, the patient group with the higher value of λpα will more
quickly contribute to the reward or incur a penalty; therefore, these patients should be evacuated
first. It should be noted, however, that none of these ratios predicts that a switching policy will
be optimal. Based on extensive testing, if the ratio is between 1 and 1.3, a switching policy may
occur and the model should be run to determine if a switch would in fact be optimal.
In summary, if h1 = h2 = 0 and λ1p1α1/λ2p2α2 is
• > 1.3, a greedy, Type 1 policy is likely the optimal policy,
• > 1 and < 1.3, a switching policy may occur, or
• < 1, a greedy, Type 2 policy is likely the optimal policy.
6.3 Policy Possibilities
Because the more interesting cases are for when holding costs are considered in the optimality equa-
tion, the discussions in the remainder of this chapter will assume that holding costs are included
as input parameters.
As discussed in the previous sections, the switching curve moves up or down depending on the
selected input parameters. The switching curve implies a monotone switching policy. That is, a
switch can only be made up to one time. In addition, if a switch does occur, it will only be after the
evacuation has begun with Type 2 patients, and a switch can be made to evacuate Type 1 patients.
Once it is optimal to begin evacuating Type 1 patients after switching from Type 2 patients, it
will be optimal to continue evacuating Type 1 patients until there are no more patients from this
group remaining in the system. If the evacuation begins with Type 1 patients, the policy will be
a greedy, Type 1 policy. That is, a switch from Type 1 patients to Type 2 patients is never optimal.
Tables 6.11 and 6.12 show the possible policies for critical and non-critical care patients. It has
been difficult to prove that these switching relationships hold and therefore show that a switch can
114

only occur up to one time.
6.4 Model Properties Conclusions
Because the appropriate input parameters are unknown, the purpose of this chapter was to examine
the behavior and properties of the single server model. The model was discussed from two perspec-
tives: without holding costs and with holding costs included. Without holding costs, increasing the
values of the input parameters for either patient type moves the switching curve in favor of that
patient. When holding costs are included, only increases to the rate of evacuation, probability of a
successful evacuation, and holding cost move the switching curve in favor of that patient type. At
lower values, increases to the death rate do move the switching curve to create a larger region of
priority for that patient type. Eventually, however, increases in α approach some bounding point,
and then the switching curve starts to move in the other direction thereby decreasing the region of
priority for that patient. At higher evacuation rates, the model is more sensitive to the changes in
the holding costs.
Several relationships were identified through extensive testing including concavity, supermodular-
ity, and diagonal dominance for all (X1, X2). These relationships give insight into the marginal
changes associated with choosing patients. Because the value function is concave in X1 and X2,
the change in the value function when there are greater numbers of patients in the system is less
than when there are less number of patients in the system. That is to say that when there are fewer
patients remaining in the system, the choice has more of an impact on the overall reward. The
supermodularity relationship implies that the marginal change associated with choosing Type 2 pa-
tients increases as the number of Type 1 patients in the system decreases. Similarly, the marginal
change associated with choosing Type 1 patients for evacuation is increases as the number of Type 2
patients in the system decreases. The diagonal dominance relationship does not have any relevance
for the two possible choices in our models, but the property will likely be valuable as the items
presented in this chapter are proven in future work.
115

Table 6.4: Sensitivity Analysis Results for the Single Server Model, 1 of 2
Test # λ1 λ2 p1 p2 α1 α2 h1 h2 Policy ν(20, 20)
1 2 4 0.5 1 0.025 0.001 0.01 0.02 2 -1.8657082 2 4 0.5 1 0.025 0.001 0.02 0.02 2 -12.6637373 2 4 0.5 1 0.025 0.001 0.03 0.02 2 -23.461765
4 2 4 0.5 1 0.05 0.001 0.01 0.02 2 -4.2457485 2 4 0.5 1 0.05 0.001 0.02 0.02 2 -14.0545856 2 4 0.5 1 0.05 0.001 0.03 0.02 2 -23.863421
7 2 4 0.5 1 0.075 0.001 0.01 0.02 2 -6.1717338 2 4 0.5 1 0.075 0.001 0.02 0.02 2 -15.2828339 2 4 0.5 1 0.075 0.001 0.03 0.02 2 -24.393932
10 2 4 0.75 1 0.025 0.001 0.01 0.02 2 6.0641411 2 4 0.75 1 0.025 0.001 0.02 0.02 2 -4.73388912 2 4 0.75 1 0.025 0.001 0.03 0.02 2 -15.531917
13 2 4 0.75 1 0.05 0.001 0.01 0.02 2 2.26106814 2 4 0.75 1 0.05 0.001 0.02 0.02 2 -7.54776915 2 4 0.75 1 0.05 0.001 0.03 0.02 2 -17.356605
16 2 4 0.75 1 0.075 0.001 0.01 0.02 2 -0.71516417 2 4 0.75 1 0.075 0.001 0.02 0.02 2 -9.82626318 2 4 0.75 1 0.075 0.001 0.03 0.02 Switch -18.937356
19 2 4 0.95 1 0.025 0.001 0.01 0.02 2 12.40801820 2 4 0.95 1 0.025 0.001 0.02 0.02 2 1.60998921 2 4 0.95 1 0.025 0.001 0.03 0.02 2 -9.18804
22 2 4 0.95 1 0.05 0.001 0.01 0.02 2 7.46652123 2 4 0.95 1 0.05 0.001 0.02 0.02 2 -2.34231624 2 4 0.95 1 0.05 0.001 0.03 0.02 Switch -12.151153
25 2 4 0.95 1 0.075 0.001 0.01 0.02 2 3.65009126 2 4 0.95 1 0.075 0.001 0.02 0.02 2 -5.46100827 2 4 0.95 1 0.075 0.001 0.03 0.02 Switch -14.565383
28 3 4 0.5 1 0.025 0.001 0.01 0.02 2 -2.37687129 3 4 0.5 1 0.025 0.001 0.02 0.02 2 -13.18638830 3 4 0.5 1 0.025 0.001 0.03 0.02 1 -22.312013
31 3 4 0.5 1 0.05 0.001 0.01 0.02 2 -4.7704932 3 4 0.5 1 0.05 0.001 0.02 0.02 2 -14.79456133 3 4 0.5 1 0.05 0.001 0.03 0.02 Switch -23.487185
34 3 4 0.5 1 0.075 0.001 0.01 0.02 2 -6.75787735 3 4 0.5 1 0.075 0.001 0.02 0.02 Switch -16.19139436 3 4 0.5 1 0.075 0.001 0.03 0.02 Switch -24.405677
37 3 4 0.75 1 0.025 0.001 0.01 0.02 2 5.82633938 3 4 0.75 1 0.025 0.001 0.02 0.02 2 -4.98317739 3 4 0.75 1 0.025 0.001 0.03 0.02 1 -13.098592
40 3 4 0.75 1 0.05 0.001 0.01 0.02 2 2.10476941 3 4 0.75 1 0.05 0.001 0.02 0.02 Switch -7.91925642 3 4 0.75 1 0.05 0.001 0.03 0.02 1 -14.977056
116

Table 6.5: Sensitivity Analysis Results for the Single Server Model, 2 of 2
Test # λ1 λ2 p1 p2 α1 α2 h1 h2 Policy ν(20, 20)
43 3 4 0.75 1 0.075 0.001 0.01 0.02 2 -0.90996944 3 4 0.75 1 0.075 0.001 0.02 0.02 Switch -10.24831945 3 4 0.75 1 0.075 0.001 0.03 0.02 1 -16.698915
46 3 4 0.95 1 0.025 0.001 0.01 0.02 2 12.38890847 3 4 0.95 1 0.025 0.001 0.02 0.02 2 1.57939148 3 4 0.95 1 0.025 0.001 0.03 0.02 1 -5.727855
49 3 4 0.95 1 0.05 0.001 0.01 0.02 2 7.60497650 3 4 0.95 1 0.05 0.001 0.02 0.02 Switch -2.31462251 3 4 0.95 1 0.05 0.001 0.03 0.02 1 -8.122454
52 3 4 0.95 1 0.075 0.001 0.01 0.02 2 3.76835753 3 4 0.95 1 0.075 0.001 0.02 0.02 Switch -5.01984354 3 4 0.95 1 0.075 0.001 0.03 0.02 1 -10.277683
55 3.5 4 0.5 1 0.025 0.001 0.01 0.02 2 -2.92323356 3.5 4 0.5 1 0.025 0.001 0.02 0.02 2 -13.92118557 3.5 4 0.5 1 0.025 0.001 0.03 0.02 1 -20.186991
58 3.5 4 0.5 1 0.05 0.001 0.01 0.02 2 -5.29479959 3.5 4 0.5 1 0.05 0.001 0.02 0.02 Switch -15.54082160 3.5 4 0.5 1 0.05 0.001 0.03 0.02 1 -21.505387
61 3.5 4 0.5 1 0.075 0.001 0.01 0.02 2 -7.28229362 3.5 4 0.5 1 0.075 0.001 0.02 0.02 Switch -16.84854763 3.5 4 0.5 1 0.075 0.001 0.03 0.02 1 -22.756697
64 3.5 4 0.75 1 0.025 0.001 0.01 0.02 2 5.36260565 3.5 4 0.75 1 0.025 0.001 0.02 0.02 Switch -5.6301566 3.5 4 0.75 1 0.025 0.001 0.03 0.02 1 -10.870981
67 3.5 4 0.75 1 0.05 0.001 0.01 0.02 2 1.69582668 3.5 4 0.75 1 0.05 0.001 0.02 0.02 Switch -8.05504369 3.5 4 0.75 1 0.05 0.001 0.03 0.02 1 -12.76471
70 3.5 4 0.75 1 0.075 0.001 0.01 0.02 2 -1.30971 3.5 4 0.75 1 0.075 0.001 0.02 0.02 Switch -9.9471672 3.5 4 0.75 1 0.075 0.001 0.03 0.02 1 -14.508837
73 3.5 4 0.95 1 0.025 0.001 0.01 0.02 2 11.99127574 3.5 4 0.95 1 0.025 0.001 0.02 0.02 Switch 1.22226275 3.5 4 0.95 1 0.025 0.001 0.03 0.02 1 -3.418173
76 3.5 4 0.95 1 0.05 0.001 0.01 0.02 2 7.28832677 3.5 4 0.95 1 0.05 0.001 0.02 0.02 Switch -1.46730178 3.5 4 0.95 1 0.05 0.001 0.03 0.02 1 -5.772169
79 3.5 4 0.95 1 0.075 0.001 0.01 0.02 Switch 3.47024280 3.5 4 0.95 1 0.075 0.001 0.02 0.02 1 -3.69609881 3.5 4 0.95 1 0.075 0.001 0.03 0.02 1 -7.910549
117

Table 6.6: Sensitivity Runs Selected for Additional Analysis.
Run # λ Ratio p Ratio α Ratio h Ratio
18 Low Medium High High24 Low High Medium High27 Low High High High41 Medium Medium Medium Medium44 Medium Medium High Medium59 High Low Medium Medium62 High Low High Medium
Table 6.7: Values Chosen for the Additional, Incremental Analysis.
Parameter Change
λ1 0.25p1 0.05α1 0.025h1 0.01
118

Table 6.8: Parameter Ratios for Greedy, Type 1 Policies with No Holding Costs.
Test # λ1 λ2 p1 p2 α1 α2 Ratio
1 4 5 0.6 0.95 0.002 0.001 1.0105262 2 15 0.75 0.95 0.01 0.001 1.0526323 2 7 0.75 0.95 0.005 0.001 1.127824 2 10 0.6 0.95 0.01 0.001 1.2631585 5 5 0.6 0.95 0.002 0.001 1.2631586 2.7 4 0.95 0.999 0.11 0.056 1.3075587 3.1 4 0.8 0.999 0.12 0.056 1.3299018 3 16 0.75 0.95 0.01 0.001 1.4802639 2 10 0.75 0.95 0.01 0.001 1.57894710 6 12 0.4 0.999 0.16 0.017 1.88423711 2 8 0.75 0.95 0.01 0.001 1.97368412 4.5 16 0.8 0.9 0.08 0.01 2.00013 6.635 12.5 0.4 0.999 0.16 0.017 2.00030614 2 6 0.8 0.999 0.15 0.02 2.00200215 4 6 0.8 0.999 0.075 0.02 2.00200216 4 6 0.8 0.999 0.15 0.04 2.00200217 2 6 0.8 0.999 0.15 0.02 2.00200218 5 10 0.8 0.999 0.15 0.03 2.00200219 6 12 0.08 0.999 0.15 0.03 2.00200220 12 12 0.4 0.999 0.15 0.03 2.00200221 6 12 0.4 0.999 0.15 0.015 2.00200222 6.61 12.4 0.4 0.999 0.16 0.017 2.0088423 3.75 4 0.8 0.999 0.15 0.056 2.0109424 4.3 15 0.8 0.9 0.08 0.01 2.03851925 4.6 16 0.8 0.9 0.08 0.01 2.04444426 6.8 12.5 0.4 0.999 0.16 0.017 2.0500527 4.5 16 0.7 0.95 0.01 0.001 2.07236828 6.4 12 0.4 0.999 0.16 0.017 2.00985329 3 9 0.6 0.95 0.01 0.001 2.10526330 7 12 0.4 0.999 0.163 0.017 2.19827731 10 12.4 0.4 0.999 0.16 0.017 3.03909232 4 8 0.75 0.95 0.01 0.001 3.94736833 1 16 0.9 0.5 0.09 0.017 5.95588234 10 12.4 0.4 0.999 0.05 0.017 9.49716335 10 12.4 0.4 0.999 0.9 0.017 17.09489
119

Table 6.9: Parameter Ratios for Greedy, Type 2 Policies with No Holding Costs.
Test # λ1 λ2 p1 p2 α1 α2 Ratio
1 2 5.999 0.25 0.99 0.591 0.999 0.0498062 2 5.999 0.25 0.99 0.29 0.05 0.4882973 4 12 0.75 0.95 0.002 0.001 0.52631664 2 7 0.75 0.95 0.0025 0.001 0.563915 2 10 0.75 0.95 0.01 0.0025 0.6315796 2 10 0.75 0.95 0.004 0.001 0.6315797 2 12 0.75 0.95 0.01 0.002 0.6578958 2 7 0.75 0.95 0.004 0.001 0.90225569 3.2 4 0.8 0.999 0.11 0.75 0.93960610 3 4 0.85 0.999 0.11 0.073 0.96157811 4 6 0.25 0.99 0.29 0.05 0.97643112 4.097 6 0.25 0.99 0.29 0.051 0.98049913 2 16 0.75 0.95 0.01 0.001 0.98684214 2 8 0.75 0.95 0.01 0.002 0.98684215 1 8 0.75 0.95 0.01 0.001 0.98684216 4.05 6 0.25 0.99 0.29 0.05 0.98863617 4.06 6 0.25 0.99 0.29 0.05 0.99107718 3.2 0.5 0.99 0.99 0.11 0.071 0.99154919 3.2 4 0.8 0.999 0.11 0.071 0.99254220 4.07 6 0.25 0.99 0.29 0.05 0.99351921 3.1 4 0.85 0.999 0.11 0.073 0.99363122 3.3 5 0.99 0.99 0.11 0.073 0.99452123 2 5.999 0.25 0.99 0.591 0.05 0.99511524 5 6 0.25 0.99 0.35 0.074 0.99531325 4.08 6 0.25 0.99 0.29 0.05 0.9959626 3.2 4 0.85 0.999 0.11 0.075 0.99833227 4.09 6 0.25 0.99 0.29 0.05 0.99840128 4.095 5.999 0.25 0.99 0.29 0.05 0.99978829 4.0955 5.999 0.25 0.99 0.29 0.05 0.9999130 4.0958 5.999 0.25 0.99 0.29 0.05 0.99998331 4.096 6 0.25 0.99 0.29 0.05 0.99986532 4.097 6 0.25 0.99 0.29 0.05 1.00010933 4.097 5.999 0.25 0.99 0.29 0.05 1.00027634 3 4 0.75 0.999 0.1 0.056 1.0054735 3.1 4 0.85 0.999 0.11 0.71 1.02162
120

Table 6.10: Parameter Ratios for Switching Policies with No Holding Costs.
Test # λ1 λ2 p1 p2 α1 α2 Ratio
1 2.5 4 0.9 0.999 0.1 0.056 1.005472 3.1 4 0.85 0.999 0.11 0.072 1.0074313 3.3 4 0.8 0.999 0.11 0.07 1.381814 2.25 4 0.999 0.999 0.1 0.055 1.0227275 3.1 4 0.85 0.999 0.11 0.07 1.0362156 3.2 4 0.8 0.999 0.11 0.068 1.036337 2.5 4 0.999 0.999 0.1 0.06 1.0416678 2.6 4 0.9 0.999 0.1 0.056 1.0456899 3.2 4 0.9 0.999 0.11 0.066 1.06773410 3.2 4 0.8 0.999 0.11 0.065 1.08416111 3.2 4 0.8 0.999 011 0.065 1.08416112 2.8 4 0.8 0.999 0.11 0.056 1.10110113 2.5 4 0.9 0.999 0.11 0.0526 1.10601714 2.5 4.1 0.999 0.999 0.1 0.055 1.10864715 2.5 4 0.999 0.999 0.1 0.056 1.11607116 2.5 4 0.999 0.999 0.1 0.055 1.13636417 2.9 4 0.8 0.999 0.11 0.056 1.14042618 2.6 4 0.9 0.999 0.11 0.056 1.15025719 2.5 4 0.999 0.999 0.1 0.054 1.15740720 3.1 4 0.85 0.89 0.11 0.07 1.16312221 2.5 3.9 0.999 0.999 0.1 0.055 1.16550122 3.2 4 0.8 0.999 0.11 0.06 1.17450823 3 4 0.8 0.999 0.11 0.056 1.17975124 2.7 4 0.9 0.999 0.11 0.056 1.19449825 3.1 4.4 0.8 0.999 0.12 0.056 1.20900126 3.2 4 0.8 0.999 0.11 0.058 1.21500827 2.7 4 0.9 0.999 0.11 0.055 1.21621628 3.1 4 0.8 0.999 0.11 0.056 1.21907629 3.2 4 0.8 0.999 0.11 0.057 1.23632430 2.5 4 0.999 0.999 0.1 0.05 1.2531 2.5 4 0.999 0.999 0.11 0.055 1.2532 3.2 4 0.8 0.999 0.11 0.056 1.25840133 2.7 4 0.95 0.999 0.11 0.056 1.26085934 2.7 4 0.95 0.999 0.11 0.0555 1.27221834 2.7 4 0.95 0.999 0.11 0.055 1.283784
Table 6.11: Possible Policies for the Single Server Model based on Changes in X1.
Scenario Policy at (X1, X2) Policy at (X1 + 1, X2) Possible?
1 1 1 yes2 2 2 yes3 1 2 yes4 2 1 no
121

Table 6.12: Possible Policies for the Single Server Model based on Changes in X2.
Scenario Policy at (X1, X2) Policy at (X1, X2 + 1) Possible?
1 1 1 yes2 2 2 yes3 1 2 yes4 2 1 no
122

Chapter 7
Modeling Extensions
This chapter proposes and discusses extensions to the basic model discussed in Chapters 5 and
6. The two additional models include a two-server model and a model that accounts for patient
transitions between classes.
7.1 Two-server Model
There will likely be multiple teams available to evacuate patients during a unit-, floor-, or department-
level evacuations. In this section, a model for assigning two servers - or evacuation teams - is
examined with dynamic programming. Assume that that there are two evacuation teams available
to move patients, and that the two teams can be allocated to patient evacuations according to any
one of the following three policies: either both teams can evacuate Type 1 patients, the teams can
be split so that one team is dedicated to moving Type 1 and one team is dedicated to moving Type
2 patients, or both teams can evacuate Type 2 patients. This leads to the following decision at any
epoch:
123

π =
(2λ1, 0) both teams evacuate Type 1 patients - Policy 1
(λ1, λ2) teams split between both patient types - Policy 2
(0, 2λ2) both teams evacuate Type 2 patients - Policy 3
, (7.1)
The state description as well as the n-stage expected reward remains the same as in the previously
discussed models. The uniformization rate, based on the maximum rate of transition, used for this
model is γ = 2λ1 + 2λ2 +N1α1 +N2α2. The transition diagram is similar to the one shown for the
single server model in Chapter 5 though the transition rates are different. The fictitious transition
rate in this case is (N1 − X1)α1 + (N2 − X2)α2 + 2λ2 when Policy 1 is chosen, (N1 − X1)α1 +
(N2−X2)α2 +λ1 +λ2 when Policy 2 is chosen, and (N1−X1)α1 + (N2−X2)α2 + 2λ1 when Policy
3 is chosen. The optimality equation used to determine how the two evacuation teams should be
allocated and therefore prioritize the patients for evacuation is shown in Equation (7.2) below.
ν(X1, X2) = X1α1
[ν(X1 − 1, X2)− ld1
]+X2α2
[ν(X1, X2 − 1)− ld2
]− h1X1 − h2X2
+max
2λ1p1 [ν(X1 − 1, X2) + le1] + 2λ1(1− p1)[ν(X1 − 1, X2)− ld1
]+[(N1 −X1)α1 + (N2 −X2)α2 + 2λ2]ν(X1, X2)
λ1p1 [ν(X1 − 1, X2) + le1] + λ1(1− p1)[ν(X1 − 1, X2)− ld1
]+λ2p2 [ν(X1, X2 − 1) + le2] + λ2(1− p2)
[ν(X1, X2 − 1)− ld2
]+[(N1 −X1)α1 + (N2 −X2)α2 + λ1 + λ2]ν(X1, X2)
2λ2p2 [ν(X1, X2 − 1) + le2] + 2λ2(1− p2)[ν(X1, X2 − 1)− ld2
]+[(N1 −X1)α1 + (N2 −X2)α2 + 2λ1]ν(X1, X2)
(7.2)
As before, the first two terms of the optimality equation represent patient deaths while waiting for
evacuation, and the second two terms represent the costs of holding all remaining patients of both
types in the system. The final term represents the choice between the three allocation options, and
each includes a fictitious transition rate.
124

7.1.1 Dynamic Programming Results for the Two-server Model
The two-server model was tested at each of the parameter settings used in the single server sensi-
tivity analysis. The resulting policies are presented in two tables below. These tables also include
the single server results as previously shown in Chapter 6 for comparison. As before, a “1” or “2”
in the Policy1 column represents a greedy Type 1 policy or a greedy Type 2 policy, respectively.
In column Policy2, a “1” indicates a greedy policy that chooses all Type 1 patients first, a “2”
represents that the evacuation teams should be split, and a “3” represents a greedy policy that
chooses to evacuate Type 2 patients first. The superscripts “1” and “2” represent the single server
model and two-server model, respectively.
The table does not completely represent the fact that policy 2 is never optimal. That is, it is never
optimal to split the evacuation teams between both patients. Therefore, a “Switch” in column
Policy2 represents an evacuation that begins by giving priority to Type 2 patients (both teams
evacuate Type 2 patients) and then switches so that both teams evacuate Type 1 patients. The
optimal policy is a switching policy for the following tests: #44, #53, #62, #68, #71, #77, and
#80. These policy diagrams are shown below in Figures 7.1 - 7.4.
Figure 7.1: Optimal policies for the two-server: DOE Runs #44 and #53.
125

Table 7.1: Sensitivity Analysis Results for the Single Server Model, 1 of 2Test # λ1 λ2 p1 p2 α1 α2 h1 h2 Policy1 ν(20, 20)1 Policy2 ν(20, 20)2
1 2 4 0.5 1 0.025 0.001 0.01 0.02 2 -1.8657 3 -0.35982 2 4 0.5 1 0.025 0.001 0.02 0.02 2 -12.6637 3 -11.8173 2 4 0.5 1 0.025 0.001 0.03 0.02 2 -23.4617 3 -23.275
4 2 4 0.5 1 0.05 0.001 0.01 0.02 2 -4.2457 3 -1.80655 2 4 0.5 1 0.05 0.001 0.02 0.02 2 -14.0545 3 -12.5946 2 4 0.5 1 0.05 0.001 0.03 0.02 2 -23.8634 3 -23.381
7 2 4 0.5 1 0.075 0.001 0.01 0.02 2 -6.1717 3 -3.06908 2 4 0.5 1 0.075 0.001 0.02 0.02 2 -15.2828 3 -13.31579 2 4 0.5 1 0.075 0.001 0.03 0.02 2 -24.3939 3 -23.5623
10 2 4 0.75 1 0.025 0.001 0.01 0.02 2 6.0641 3 8.496111 2 4 0.75 1 0.025 0.001 0.02 0.02 2 -4.7338 3 -2.961512 2 4 0.75 1 0.025 0.001 0.03 0.02 2 -15.5319 1 -14.4193
13 2 4 0.75 1 0.05 0.001 0.01 0.02 2 2.2610 3 -6.122114 2 4 0.75 1 0.05 0.001 0.02 0.02 2 -7.5477 3 -4.665415 2 4 0.75 1 0.05 0.001 0.03 0.02 2 -17.3566 3 -15.453
16 2 4 0.75 1 0.075 0.001 0.01 0.02 2 -0.7151 3 4.088817 2 4 0.75 1 0.075 0.001 0.02 0.02 2 -9.8262 3 -6.157718 2 4 0.75 1 0.075 0.001 0.03 0.02 Switch -18.9373 3 -16.4044
19 2 4 0.95 1 0.025 0.001 0.01 0.02 2 12.4080 3 15.580920 2 4 0.95 1 0.025 0.001 0.02 0.02 2 1.6099 3 4.123221 2 4 0.95 1 0.025 0.001 0.03 0.02 2 -9.1880 3 -7.3344
22 2 4 0.95 1 0.05 0.001 0.01 0.02 2 7.4665 3 12.465023 2 4 0.95 1 0.05 0.001 0.02 0.02 2 -2.3423 3 1.677424 2 4 0.95 1 0.05 0.001 0.03 0.02 Switch -12.1511 3 -9.1100
25 2 4 0.95 1 0.075 0.001 0.01 0.02 2 3.6500 3 9.815126 2 4 0.95 1 0.075 0.001 0.02 0.02 2 -5.4610 3 -0.431427 2 4 0.95 1 0.075 0.001 0.03 0.02 Switch -14.5653 3 -10.6781
28 3 4 0.5 1 0.025 0.001 0.01 0.02 2 -2.3768 3 -0.911929 3 4 0.5 1 0.025 0.001 0.02 0.02 2 -13.1863 3 -12.215430 3 4 0.5 1 0.025 0.001 0.03 0.02 1 -22.3120 1 -21.5288
31 3 4 0.5 1 0.05 0.001 0.01 0.02 2 -4.7704 3 -2.323132 3 4 0.5 1 0.05 0.001 0.02 0.02 2 -14.7945 3 -13.125833 3 4 0.5 1 0.05 0.001 0.03 0.02 Switch -23.4871 1 -22.1731
34 3 4 0.5 1 0.075 0.001 0.01 0.02 2 -6.7578 3 -3.582735 3 4 0.5 1 0.075 0.001 0.02 0.02 Switch -16.1913 3 -13.962836 3 4 0.5 1 0.075 0.001 0.03 0.02 Switch -24.4056 1 -22.8021
37 3 4 0.75 1 0.025 0.001 0.01 0.02 2 5.8263 3 8.114938 3 4 0.75 1 0.025 0.001 0.02 0.02 2 -4.9831 3 -3.188439 3 4 0.75 1 0.025 0.001 0.03 0.02 T 1 -13.0985 1 -11.9429
40 3 4 0.75 1 0.05 0.001 0.01 0.02 2 2.1047 3 5.878741 3 4 0.75 1 0.05 0.001 0.02 0.02 Switch -7.9192 3 -4.9238742 3 4 0.75 1 0.05 0.001 0.03 0.02 1 -14.9770 1 -12.9597
126

Table 7.2: Sensitivity Analysis Results for the Single Server Model, 2 of 2Test # λ1 λ2 p1 p2 α1 α2 h1 h2 Policy1 ν(20, 20)1 Policy2 ν(20, 20)2
43 3 4 0.75 1 0.075 0.001 0.01 0.02 2 -0.9099 3 3.909244 3 4 0.75 1 0.075 0.001 0.02 0.02 Switch -10.2483 Switch -6.470845 3 4 0.75 1 0.075 0.001 0.03 0.02 1 -16.6989 1 -13.9262
46 3 4 0.95 1 0.025 0.001 0.01 0.02 2 12.3889 3 15.336447 3 4 0.95 1 0.025 0.001 0.02 0.02 2 1.5793 3 4.033048 3 4 0.95 1 0.025 0.001 0.03 0.02 1 -5.7278 1 -4.2742
49 3 4 0.95 1 0.05 0.001 0.01 0.02 2 7.6049 3 12.4403350 3 4 0.95 1 0.05 0.001 0.02 0.02 Switch -2.3146 3 1.637651 3 4 0.95 1 0.05 0.001 0.03 0.02 1 -8.1224 1 -5.5889
52 3 4 0.95 1 0.075 0.001 0.01 0.02 2 3.7683 3 9.9027453 3 4 0.95 1 0.075 0.001 0.02 0.02 Switch -5.0198 Switch -0.476854 3 4 0.95 1 0.075 0.001 0.03 0.02 1 -10.2776 1 -6.8254
55 3.5 4 0.5 1 0.025 0.001 0.01 0.02 2 -2.9232 3 -1.48856 3.5 4 0.5 1 0.025 0.001 0.02 0.02 2 -13.9211 3 -12.944157 3.5 4 0.5 1 0.025 0.001 0.03 0.02 1 -20.1869 1 -19.3687
58 3.5 4 0.5 1 0.05 0.001 0.01 0.02 2 -5.2947 3 -2.871859 3.5 4 0.5 1 0.05 0.001 0.02 0.02 Switch -15.5408 3 9.815160 3.5 4 0.5 1 0.05 0.001 0.03 0.02 1 -21.5053 1 -20.0616
61 3.5 4 0.5 1 0.075 0.001 0.01 0.02 2 -7.2822 3 -4.116162 3.5 4 0.5 1 0.075 0.001 0.02 0.02 Switch -16.8485 Switch -14.711563 3.5 4 0.5 1 0.075 0.001 0.03 0.02 1 -22.7566 1 -20.7342
64 3.5 4 0.75 1 0.025 0.001 0.01 0.02 2 5.3626 3 7.589265 3.5 4 0.75 1 0.025 0.001 0.02 0.02 Switch -5.630 3 -3.866866 3.5 4 0.75 1 0.025 0.001 0.03 0.02 1 -10.8709 1 -9.7263
67 3.5 4 0.75 1 0.05 0.001 0.01 0.02 2 1.6958 3 5.412768 3.5 4 0.75 1 0.05 0.001 0.02 0.02 Switch -8.0550 Switch -5.567569 3.5 4 0.75 1 0.05 0.001 0.03 0.02 1 -12.7647 1 -10.7455
70 3.5 4 0.75 1 0.075 0.001 0.01 0.02 2 -1.309 3 3.478671 3.5 4 0.75 1 0.075 0.001 0.02 0.02 Switch -9.9471 -6.877772 3.5 4 0.75 1 0.075 0.001 0.03 0.02 1 -14.5088 1 -11.7175
73 3.5 4 0.95 1 0.025 0.001 0.01 0.02 2 11.9912 3 14.851174 3.5 4 0.95 1 0.025 0.001 0.02 0.02 Switch 1.2222 3 3.395075 3.5 4 0.95 1 0.025 0.001 0.03 0.02 1 -3.4181 1 -2.0124
76 3.5 4 0.95 1 0.05 0.001 0.01 0.02 2 7.2883 3 12.040477 3.5 4 0.95 1 0.05 0.001 0.02 0.02 Switch -1.46730 Switch 1.314578 3.5 4 0.95 1 0.05 0.001 0.03 0.02 1 -5.7721 1 -3.2927
79 3.5 4 0.95 1 0.075 0.001 0.01 0.02 Switch 3.4702 3 9.554580 3.5 4 0.95 1 0.075 0.001 0.02 0.02 1 -3.6960 Switch -0.119981 3.5 4 0.95 1 0.075 0.001 0.03 0.02 1 -7.9105 1 -4.5042
127

Figure 7.2: Optimal policies for the two-server: DOE Runs #62 and #68.
Figure 7.3: Optimal policies for the two-server: DOE Runs #71 and #77.
128

Figure 7.4: Optimal policies for the two-server: DOE Run #80.
It can be shown mathematically that the optimal policy for the two-server model is to allocate the
two evacuation teams to the same patient group such that two patient evacuations from the same
class occur simultaneously.
7.1.2 Optimal Server Allocation
As shown in the previous section, the optimal policy for the two-server model is either Policy 1
or Policy 3 (evacuation teams should both be allocated to evacuate Type 1 patients or Type 2
patients, respectively). It is never optimal to split the evacuation teams between the two patient
groups (Policy 2). Though the structural properties of the optimality equations are difficult to
prove, it is relatively easy to show that the evacuation teams should be allocated to the same
patient group.
Theorem 1. The optimal policy for Equation (7.2) is either to assign both evacuation teams to
Type 1 patients or to assign both evacuation teams to Type 2 patients; therefore, it is never optimal
to split the two evacuation teams between the two patient groups so that one team evacuates Type
1 patients and one team evacuates Type 2 patients.
129

Proof. From the two-server optimality equation (Equation [7.2]), we see that the choice is between
three options, and ν(X1, X2) is optimized by determining the maximum of applying Policies 1, 2,
and 3. With a bit of algebra, this implies a comparison of
max
2λ1v(X1 − 1, X2) + 2λ2v(X1, X2)
λ1v(X1 − 1, X2) + λ2v(X1, X2 − 1) + (λ1 + λ2)v(X1, X2)
2λ2v(X1, X2 − 1) + 2λ1v(X1, X2)
(7.3)
First, suppose that applying Policy 1 results in a higher value than applying Policy 3. This implies
that
2λ1v(X1 − 1, X2) + 2λ2v(X1, X2) > 2λ2v(X1, X2 − 1) + 2λ1v(X1, X2) (7.4)
from Equation (7.3). Dividing both sides of Equation (7.4) by 2, results in the following:
λ1v(X1 − 1, X2) + λ2v(X1, X2) > λ2v(X1, X2 − 1) + λ1v(X1, X2), (7.5)
and by adding λ2ν(X1, X2) to both sides, the following is obtained:
λ1v(X1 − 1, X2) + 2λ2v(X1, X2) > λ2v(X1, X2 − 1) + (λ1 + λ2)v(X1, X2). (7.6)
Next, by adding λ2ν(X1 − 1, X2) to both sides of Equation (7.6), a final inequality is obtained:
2λ1v(X1−1, X2) + 2λ2v(X1, X2) > λ1v(X1−1, X2) +λ2v(X1, X2−1) + (λ1 +λ2)v(X1, X2). (7.7)
Note that the left hand side of Equation (7.7) still represents the value of applying Policy 1, but
now the right hand side of Equation (7.7) is equal to the value of applying Policy 2. Therefore, to
assume that Policy 1 results in a greater value than Policy 3 is also to assume that Policy 1 results
in a greater value than Policy 2.
130

Now suppose that Policy 3 results in a higher value than applying Policy 1. Similar logic shows
that if Policy 3 results in a greater value than Policy 1, the value from applying Policy 3 must also
be greater than the value from applying Policy 2. First, suppose that applying Policy 3 results in
a higher value than applying Policy 1. This implies that
2λ2v(X1, X2 − 1) + 2λ1v(X1, X2) > 2λ1v(X1 − 1, X2) + 2λ2v(X1, X2) (7.8)
from Equation (7.3). Dividing both sides of Equation (7.8) by 2, the following is obtained
λ2v(X1, X2 − 1) + λ1v(X1, X2) > λ1v(X1 − 1, X2) + λ2v(X1, X2), (7.9)
and by adding λ1ν(X1, X2) to both sides, the following is obtained:
λ2v(X1, X2 − 1) + 2λ1v(X1, X2) > λ1v(X1 − 1, X2) + (λ1 + λ2)v(X1, X2), (7.10)
Next, by adding λ2ν(X1, X2 − 1) to both sides of the equation, a final inequality is obtained:
2λ2v(X1, X2−1)+2λ1v(X1, X2) > λ1v(X1−1, X2)+λ2v(X1, X2−1)+(λ1 +λ2)v(X1, X2) (7.11)
Note that the left hand side of Equation (7.11) still represents the value of applying Policy 3, but
now the right hand side of Equation (7.11) is equal to the value of applying Policy 2. Therefore, to
assume that Policy 3 results in a greater value than Policy 1 is also to assume that Policy 3 results
in a greater value than Policy 2.
Therefore, the optimal policy decision in the two-server model is either to allocate both teams to
evacuate Type 1 patients or to allocate both teams to evacuate Type 2 patients.
131

7.2 Patient Transitions between Classes
As mentioned in Chapter 5, there is a chance that the patients’ classification could change dur-
ing the course of the evacuation. For example, a patient’s health status could diminish from a
non-critical care patient or a patient could be relocated so that their physical position relative to
location of the emergency within the facility changes their rates for evacuation and chances for
survival while waiting to be evacuated. In addition, the standard of care could change so that some
critical care patients are treated like non-critical care patients.
In this section, the model formulations are only set up (there is no discussion or testing) and include
the βi parameter to represent the rate at which type i patients become a type j patient. Such a
transition would decrease the number of type i patients (Xi − 1) and increase the number of type
j patients (Xj + 1).
7.2.1 Single Server Beta Model
Equation (7.12) presents the optimality equation for the single server beta model.
ν(X1, X2) = X1α1
[ν(X1 − 1, X2)− ld1
]+X2α2
[ν(X1, X2 − 1)− ld2
]+X1β1 [ν(X1 − 1, X2 + 1)] +X2β2 [ν(X1 + 1, X2 − 1)]− h1X1 − h2X2
+ max
λ1p1 [ν(X1 − 1, X2) + le1] + λ1(1− p1)[ν(X1 − 1, X2)− ld1
]+[(N1 −X1)α1 + (N2 −X2)α2 + (N1 −X1)β1 + (N2 −X2)β2 + λ2]ν(X1, X2)
λ2p2 [ν(X1, X2 − 1) + le2] + λ2(1− p2)[ν(X1, X2 − 1)− ld2
]+[(N1 −X1)α1 + (N2 −X2)α2 + (N1 −X1)β1 + (N2 −X2)β2 + λ1]ν(X1, X2)
(7.12)
First, the model was tested with β1 = β2 = 0 to ensure the optimal policies were consistent with
the results presented in Chapter 5.
132

7.2.2 Two-server Transitions Model
Though no formal tests have been completed, Equation (7.13) presents the optimality equation for
the the two-server beta model.
ν(X1, X2) = X1α1
[ν(X1 − 1, X2)− ld1
]+X2α2
[ν(X1, X2 − 1)− ld2
]+X1β1[ν(X1 − 1, X2 + 1) +X2β2[ν(X1 + 1, X2 − 1)− h1X1 − h2X2
+ max
2λ1p1 [ν(X1 − 1, X2) + le1] + 2λ1(1− p1)[ν(X1 − 1, X2)− ld1
]+[(N1 −X1)α1 + (N2 −X2)α2 + (N1 −X1)β1 + (N2 −X2)β2 + λ2]ν(X1, X2)
λ1p1 [ν(X1 − 1, X2) + le1] + λ1(1− p1)[ν(X1 − 1, X2)− ld1
]+λ2p2 [ν(X1, X2 − 1) + le2] + λ2(1− p2)
[ν(X1, X2 − 1)− ld2
]+[(N1 −X1)α1 + (N2 −X2)α2 + (N1 −X1)β1 + (N2 −X2)β2 + λ1]ν(X1, X2)
2λ2p2 [ν(X1, X2 − 1) + le2] + 2λ2(1− p2)[ν(X1, X2 − 1)− ld2
]+[(N1 −X1)α1 + (N2 −X2)α2 + λ1]ν(X1, X2)
(7.13)
133

Chapter 8
Findings, Implications, and
Conclusions
Over the course of developing this research, it has become obvious to me that the most difficult piece
of this problem to discuss, write, or model is the ability of clinicians and healthcare administrators
to actually make patient prioritization decisions - whether it be because the resources to make the
decisions or carry out the decisions are unavailable, or because clinicians themselves have ethical
concerns or even liability concerns. Therefore, it seems that there is a need and significance for this
research. In June 2010, the South Carolina Hospital Association held a meeting: the “Summit on
Lessons Learned from the H1N1 Outbreak and Making Medical Decisions During Incidents with
Scarce Resources.” The purpose of the meeting was to discuss the state’s response to the recent
H1N1 outbreak from the hospitals’ perspectives. The first presentation, given by Joseph Barbera,
MD and Associate Professor of Engineering Management from George Washington University, dis-
cussed “Critical Care Delivery in the Scarce Resource Situation” [12]. In this presentation, the
standard of care during emergency situations was discussed, and it was obvious that there are
a variety of liability concerns and ethical conflicts associated with making such decisions. There
were no fixed conclusions for how scarce resources should be allocated — “in emergency type x do
y,”— but there was consensus that data-driven, ethical models are needed well in advance of an
emergency situation in which they could be put to use. In addition, clinicians want consensus on
134

what decisions should and can be made — from all levels of their management all the way up to the
accrediting and licensing agencies — for protection of their own decisions during actual emergency
events.
The purpose of this research is therefore to provide insights into the problem of patient prioritiza-
tion during complete evacuations from healthcare facilities. To date, this problem has been rarely
discussed - likely due to the fact that most facilities have system redundancies in place (to protect
their patients, equipment, supplies, pharmacy, etc. so that an emergency does not create the need
for an evacuation) as well as the highly ethical nature of the prioritization discussion. In the few
cases where patient prioritization strategies are suggested or explained, there is a lack of consensus
about (1) which patients should be selected first and (2) which patients were selected first during
actual emergency evacuations.
Every prioritization policy discussed in the literature, however, is an all-or-nothing, greedy policy.
That is, the policies in the literature choose either critical care or non-critical care patients for
evacuation. It has been shown, however, that a greedy policy is not always optimal. In his pre-
sentation, Dr. Barbera challenged the audience multiple times to avoid “all-or-nothing” decisions
when making scarce resource allocation decisions. Instead of decisions that just benefit one person
(or group), creative solutions that give more opportunities to the patients are necessary. Though
speaking specifically about ventilator allocation during a pandemic influenza outbreak, the point
translates to this research.
During an actual emergency evacuation event, transportation decisions would likely depend on
more than the number and classification of the patients in the system. The availability of trans-
portation resources and beds at receiving facilities are likely a large determinant of how patients
are chosen for evacuation. For example, if an ambulance capable of transporting an ICU patient is
available, and an ICU bed is open at a neighboring facility, it is highly unlikely that this ambulance
would transport a non-critical care patient. Particularly during a regional disaster, it is likely that
135

evacuation prioritization decisions will be very highly dependent on the transportation resources
that can even be made available to the patients since multiple facilities often have contracts with
the same transportation services and will therefore be competing for their use. Reducing the prior-
itization problem to a decision based on the number of the patients in the system — as presented
in Chapters 5 - 7 — is an unlikely representation of the system in practice, but it is the first step
in understanding the problem. During an evacuation, clinicians and hospital administrators would
be required to make a variety of decisions under uncertainty, continually changing conditions, and
incomplete information. Having understood and practiced the insights from this research may en-
able decision makers to be more comfortable with the patient prioritization problem.
8.1 Modeling Conclusions and Insights for Practitioners
The following section summarizes the insights from the literature review as well as the models that
were presented and tested in Chapters 5 - 7.
There is a lack of consensus about which patient type should be given priority during a complete
healthcare facility evacuation. Some papers suggest that critical care patients should be trans-
ported away from the facility first, and others recommend that non-critical care patients be given
evacuation priority. The dynamic programming models indicate that such greedy policies are not
always optimal for patient selection decisions.
Clinicians generally make ethical decisions based on values and virtues. Their jobs are to care
for patients, and therefore prioritization decisions may be difficult for nurses and doctors. Public
policy decisions, however, are based on the utilitarian principle of doing the most good for the most
amount. In this framework, ethical decisions are resolved by considering how the overall utility
can be maximized, and at times, the resolutions to which virtues and values lead may be in direct
conflict.
136

The optimal policies for the evacuation dynamic programming model can be characterized as one
of three different policy types: either a greedy, Type 1 policy; a switching policy; or a greedy, Type
2 policy. In fact, the switching curve is embedded even within the greedy policies, but it has either
located so far down and to the left or up and to the right so that only one policy is shown for
all decision points (except when there are 0 patients remaining of a certain patient type; then the
only other choice is to evacuate the other patient type). In the context of critical and non-critical
care patients, a downward shift in the location of the switching curve results in a greedy policy in
favor of the non-critical care patients. A shift upwards results in a greedy policy in favor of the
critical care patients. This implies that a switching policy should begin with the evacuation team
— or teams — selecting non-critical care patients first for evacuation. At some point, depending on
the patient classification rates, a switch should be made so that all remaining critical care patients
are selected for evacuation. Once all critical care patients have been removed from the system, all
remaining non-critical care patients should be transported away from the facility. When holding
costs are not considered, it has been shown that using the dynamic programming policies saves
more lives than using a greedy policy similar to those suggested in the literature.
When holding costs are not included as a variable for determining which patients should be chosen,
and in the event that a patient group can be evacuated more quickly and also die more quickly
while waiting to be evacuated, it is obvious that this patient group should be given priority. Such
a scenario could occur based on the patients’ relative location to the hazard. It is more likely,
however, that patients will be categorized as critical or non-critical care patients. This assumes
that non-critical care patients can be evacuated more quickly, that non-critical care patients have a
higher probability of a successful evacuation, and that critical care patients die while waiting to be
evacuated more quickly than non-critical care patients. When holding costs are not considered, a
greedy policy can very likely be predicted by considering the ratio of the input parameters. When
the ratio λ1p1α1/λ2p2α2 < 1, a greedy, Type 2 policy is most likely optimal. If λ1p1α1/λ2p2α2 > 1
and λ1p1α1/λ2p2α2 < 1.3, a switching policy is much more likely to occur, and the model should
be run to determine the exact patient prioritization scheme. If λ1p1α1/λ2p2α2 > 1.3, it is likely
137

that a greedy, Type 1 policy is optimal.
When discussing our models, I have heard it said that cost should not be considered when making
evacuation decisions. Whether the actual monetary costs should be included may be debatable,
but it is certain that there are costs associated with choosing one patient group over another. For
example, choosing to evacuate non-critical care patients leaves critical care patients in the facility,
and these patients require more resources. When holding costs are included, it is more difficult to
predict whether a greedy or a switching policy is optimal. When examining the output of more
than 100 tests, however, a number of common properties were identified for the single server model
(both with and without holding costs) as well as the two-server model. It was shown that the
value function is concave in both X1 and X2 and that supermodularity and diagonal dominance
relationships exist (both with and without holding costs).
In terms of critical and non-critical care patients, the concavity relationships imply that the change
in the average reward per patient associated with selecting a critical or non-critical care patient
increases as the number of critical or non-critical care patients in the system, respectively, de-
creases. The supermodularity relationship implies that the change in the average value resulting
from evacuating non-critical care patients increases as the number of critical care patients in the
system decreases. Similarly, the change in the value associated with evacuating critical care patients
becomes greater as the number of non-critical care patients in the system decreases. Therefore, as
the number of patients in the system decreases, the decisions between the two patient groups have
more of an impact than those decisions made at the beginning of the evacuation.
The models are most sensitive to holding costs, and the holding costs have a more significant impact
on the location of the switching curve when the ratio of λ1/λ2 is increased. Incremental increases to
the rates of evacuation, probability of a successful evacuation, and holding costs move the switching
curve in favor of that particular patient type. For example, in the sensitivity analysis from Chapter
7, these parameters were increased for Type 1 patients, and as a result, the switching curve moved
138

up in turn creating a larger region of Type 1 priorities. If these parameters had been increased
for the Type 2 patients, the switching curve would have moved downward and therefore created a
larger region of Type 2 priorities. Eventually, incremental increases to these parameters result in
greedy policies. This is not true, however, of the α values. At certain values, incremental changes
to α “work in favor” of that patient type. Eventually, the switching curve will start to move in the
other direction and therefore decrease the region of priority for that patient type. For example,
when α1 was increased in the sensitivity analysis, the switching curve starting moving upwards and
created a larger region of Type 1 priorities. However, at a certain point — the exact values have
not yet been determined — the switching curve started moving back down and therefore decreasing
the Type 1 region. If the death rate of one patient group is very large, at some point, it is not
optimal to use resources to attempt to evacuate these patients but instead save the patients who
will contribute to the overall reward.
When there are two evacuation teams available to move patients, the optimal policy is either to
assign both teams to transport Type 1 patients or to assign both teams to evacuate Type 2 pa-
tients; it is never optimal to split the evacuation teams between the two patient groups. However,
a switching policy may still be the optimal choice, and in the case of critical and non-critical care
patients, a switching policy should begin with non-critical care patient evacuations followed by a
switch to critical care patient evacuations.
8.2 Need for Future Research
There are certainly opportunities for a variety of modeling extensions. The current model looks
only at the prioritization decision; a more realistic model would consider the availability of trans-
portation resources as well as the availability of beds at receiving facilities.
It may be beneficial to extend the number of patient classifications. For example, there are neonatal
intensive care unit (NICU) babies that are likely to have different requirements and characteristics
139

than those of adult ICU patients. Along those same lines, the rewards for the patient classifica-
tions could be expanded further solely than counting the number of saved lives. For example, the
number of life years after the evacuation, quality-adjusted life years, or some other measure would
allow for further prioritization within the groups. In addition, the effects of incorrectly classifying a
patient as a critical or non-critical care patient — or incorrectly assigning the input parameters —
need consideration. Regardless of how the models are altered, a better understanding of the actual
values for the input parameters would improve the modeling efforts. While the rates of evacuation
chosen in the previous chapters were based on observations at mock evacuations, there are no data
available for estimating the holding costs. Knowing the input values would allow a better analysis
of the location and movement of the switching curve.
A major assumption of these models is that the input parameters are stationary. In reality, the
rates at which patients can be evacuated, the rates at which patients die while waiting to be evacu-
ated, and the probability of a successful evacuation are likely to change over time as the evacuation
window decreases.
Maybe most importantly, there needs to be continued discussion among healthcare workers about
the ethical dilemmas associated with making evacuation decisions as well as other scarce resource
allocation decisions. Even if the insights from this research were presented to a hospital staff,
clinicians are not likely to be comfortable making these decisions because of the ethical dilemmas
and potential legal consequences. Without support from all levels and management, as well as
accrediting and licensing agencies, data-driven optimization models and research will not be as
beneficial as possible.
8.3 Concluding Remarks
These models may not yet be ready for implementation, but they are certainly ready for discussion.
It has been shown that the optimal policy resulting from the dynamic programs may be different
140

from those described in the literature. Switching policies may be considered a more ethical ap-
proach than greedy policies to a virtues-based thinker, and when optimal, they are also the best
policies from a utilitarian perspective. Making data-driven evacuation decisions is improvement,
and continued discussion, data collection, and modeling efforts can help clinicians improve evacu-
ations. The hope is that the insights from this research have laid a foundation and will encourage
discussions for improving existing emergency plans.
141

Appendices
142

Appendix A Hospital Evacuation Survey
Information Concerning Participation in a Research Study
Evacuation Survey for Healthcare Facilities
Dr. Kevin Taaffe and Ashley Kay Childers, Clemson University
Dr. Eva Njoku and Dr. Innocent Nkwocha, South Carolina State University
You are invited to participate in a research study conducted by Dr. Kevin Taaffe and Ashley Kay Childers
of Clemson University and Drs. Eva Njoku and Innocent Nkwocha of South Carolina State University. The
purpose of this research is to examine the decisions that are made for prioritizing patients for evacuation
during emergencies.
Your participation will involve completing the survey included and submitting your facility’s evacuation
plans. The survey should take only a few minutes for a person who is familiar with your facility’s evacuation
plan.
Potential benefits
Reviewing your evacuation plans will help us to understand the structure of evacuation plans and help us
identify any current policies for determining the order to transport patients when there is a limited window
for evacuation.
For your participation, we will provide your facility with any of the results of our research. In the short-term,
we will only be evaluating evacuation plans. In the long-term, we hope to develop guidelines to aid healthcare
officials in evacuation decision making.
Voluntary participation
Your participation in this research study is voluntary. You may choose not to participate and you may
withdraw your consent to participate at any time. You will not be penalized in any way should you decide
not to participate or to withdraw from this study.
Contact information
If you have any questions or concerns about this study or if any problems arise, please contact Ashley Kay
Childers ([email protected]).
143

144

145
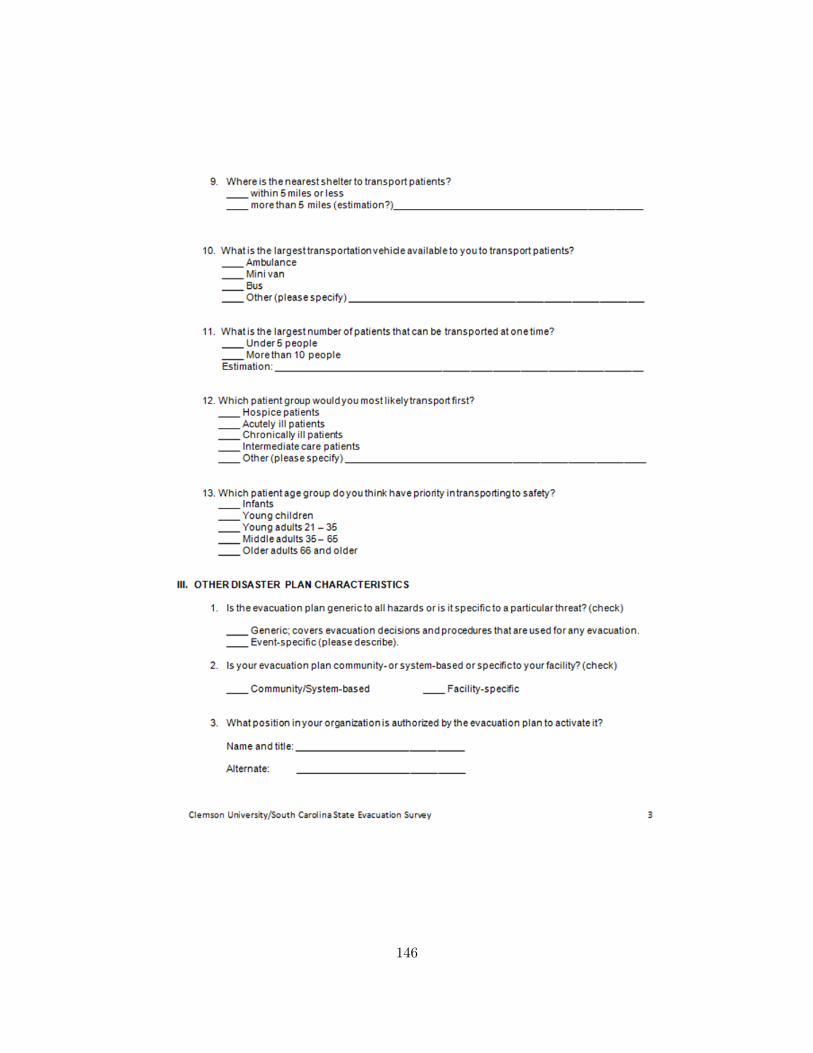
146

147

148

149

Appendix B Mock Evacuation Experiences
In the Spring and Fall semesters of 2008, an undergraduate Creative Inquiry team gathered data
at two mock evacuations. The data collected is included below in Tables 1 and 2. Patient types are
listed as “Non” to represent inpatients from floors, and “Critical” represents those patients that
were transferred from an ICU bed.
Table 1: Mock Evacuation Data Collection - Facility 1.
Type Start Prep [min] Move [min] Stage [min] Load [min] Depart
Non 8:04 7.17 2.83 0 0.75 8:15Non 8:10 12.0 2.0 0 0.5 8:25Non 8:22 28.6 4 0 1.43 8:56Non 8:35 14.48 5.98 0.1 0.4 8:56Non 9:11 9.95 3.48 0.17 0.67 9:28Non 9:29 12.1 3.21 0 0.87 9:45Non 9:40 5.87 3.93 0 0.8 9:49Non 9:55 3.32 4.93 0 0.88 10:04Non 10:08 4 3.33 2 2.5 10:20Non 10:17 9.78 2.88 1.45 0.57 10:29Non 9:22 9.3 4 0 0.38 10:36Non 10:15 23 3.38 0 1.17 10:45Non 10:42 5.4 3.12 0 1.43 10:53Non 10:49 3.3.5 5.97 0 0.73 11:01Non 11:06 10.07 5.55 1.7 0.5 11:24Non 11:20 4.2 6.08 0.72 1.08 11:33Non 11:32 14.1 2.45 0 0 11:50Non 11:44 7.72 3.68 0.52 1.33 11:57Non 11:52 3 2.72 3.07 0.53 12:02Non 12:24 4.95 3 1.65 0.95 12:34Non 12:27 9 5.12 0 1.0 12:43Non 12:47 8 4.28 0 1.42 1:01Non 1:02 13.85 5.22 0.33 1.33 1:23
Critical 8:10 27 4.83 0 0.5 8:43Critical 8:03 35 5.75 0 1.5 8:45Critical 8:35 19 3.6 15.83 3.25 9:16Critical 8:57 24 7.67 0 0 9.31Critical 9:25 25.72 3.97 0 1.85 9:57Critical 10:32 16.5 3.23 0 0.57 10:54
150

Table 2: Mock Evacuation Data Collection - Facility 2.
Type Start Prep [min] Move [min] Stage [min] Load [min] Depart
Non unknown 3.97 1.72 1.05 0.72 unknownNon unknown 5.75 2.23 0.77 1.23 unknownNon 10:18 5.0 2.0 2.0 1.0 10:31Non 10:28 5.55 2.5 0.78 2.9 10:40Non 10:42 2.0 2.98 0.33 0.63 10:51Non 11:02 4.0 2.0 2.0 1.0 11:15Non 11:12 14.82 1.63 0.67 1.35 11:31Non 11:21 7.0 3.0 1.0 1.0 11:37Non 11:54 6.17 4.2 0.68 1.75 12:07Non 12:15 10.0 2.45 0.7 0.8 12:38Non 12:16 3.32 2.12 0.48 1.12 12:25Non 12:17 7.0 2.0 1.0 1.0 12:28Non 12:37 5.0 3.0 2.0 1.0 12:48Non 12:44 4.08 3.83 0.75 1.7 12:55Non 1:03 3.55 2.38 1.38 0.97 1:13
Critical 9:12 8.0 8.0 1.0 1.0 9:30Critical 9:28 7.5 2.03 2.08 1.52 9:44Critical 9:33 9.33 3.53 2.5 2.0 10:03Critical 9:36 1.0 7.0 1.0 1.0 9:56Critical 10:05 14.15 1.85 0.5 0.47 10:21
151

Appendix C Dynamic Programming Models
The code for solving the dynamic program was written in Microsoft Visual Studio. A description
of the code follows:
• Declare the number of critical and non-critical care patients to be evacuated.
• Declare global variables and functions.
– For example, the variables “VOLD[N1+1][N2+1]” and “VNEW[N1+1][N2+1]” track the
value of the function at the previous and current iterations.
• The rates are scaled to convert the continuous-time problem to an equivalent discrete-time
problem.
• The main program consists of the following functions, and they are called in the following
order:
– Read-data - Reads values from the text file “DataIn.txt” in the following order:
∗ λ1 - the rate Type 1 patients are evacuated
∗ λ2 - the rate Type 2 patients are evacuated
∗ p1 - the probability of a successful evacuation of a Type 1 patient
∗ p2 - the probability of a successful evacuation of a Type 2 patient
∗ α1 - the death rate while waiting of a Type 1 patient
∗ α2 - the death rate while waiting of a Type 2 patient
∗ r1 - the reward or penalty for an evacuee or death of a Type 1 patient
∗ r2 - the reward or penalty for an evacuee or death of a Type 2 patient
– Initialize - the value function is set to 0
– Formulation - evaluates the value function for all policy options
– Iteration - determines if an iteration should be included for (X1, X2)
– Exchange - if an iteration is carried out, the value function is updated
152

– Find Policy - determines which policy maximizes the value function
– Store - writes data to output files
• The program returns the following output files:
– “DataOut.txt” - returns the value at each combination of X1 and X2
– “DataPolicy.txt” - returns the optimal policy at each combination of X1 and X2
– “FinalPolicy1.txt” - returns the value of choosing Policy 1 at each combination of X1
and X2
– “FinalPolicy2.txt” - returns the value of choosing Policy 2 at each combination of X1
and X2
153

Appendix D Simulation
This section describes the simulation used to test the optimal policies or examine “switch times.”
Figure 1: Simulation screen shot: Patient creation and classification.
Figure 2: Simulation screen shot: Hold then evacuate.
Figures 1 and 2 represent the main portion of the simulation logic for patient evacuations. At
the beginning of the simulation, patients are split into their categories and then held according
to appropriate policy. For example, the following conditions were used to hold patients for Test
2 described in Chapter 5. Figure 2 shows the remainder of the evacuation portion of the simulation.
For example, Figure 3 shows the logic used to hold Type 1 patients while Type 2 patients are given
priority for evacuation.
Figures 4 and 5 show the “background” portion of the simulation. There are two control entities
that search the Type 1 and Type 2 holding queues to remove patients; this represents αi, or the
154

Figure 3: Simulation logic: Hold Type 1 patients and evacuate Type 2.
death rate while waiting for an evacuation for a type i patient. There is a third control entity that
determines the percentage of incomplete evacuations; that is, the proportion of runs in which the
facility was not completely cleared of all of its patients.
Figure 4: Simulation screen shot: Remove patients from evacuation queues.
The simulation output includes
• The number of successful Type 1 evacuations.
• The number of successful Type 2 evacuations.
• The number of Type 1 patients that died during evacuation.
155

Figure 5: Simulation screen shot: Control entity to determine incomplete evacuations.
• The number of Type 2 patients that died during evacuation.
• The number of Type 1 patients that died while waiting to be evacuated.
• The number of Type 2 patients that died while waiting to be evacuated.
• The average time to completely clear the patients from the system.
• The percentage of incomplete evacuations.
In addition to running simulations of the optimal policies from the dynamic program, the simulation
was also used to determine the optimal switch time. In these cases, the decisions are based on the
time rather than the state of the system. There are two different models to examine the switch
time: one that begins by evacuating Type 1 patients and another that begins by evacuating Type
2 patients. A variable to represent the “switch time” is included. In these models, the holding
conditions are based on whether the switch time has passed and whether there are still patients in
the other queue.
156

Appendix E Electronic Attachments
E.1 Sensitivity Analysis Files
The electronic attachments include the results of the design of experiments tests. Because the DOE
was created as a list of randomized trials, the order in which the tests were run does not correspond
to how the tests are presented in Tables 6.4 and 6.5. The following table maps the order of the
runs in the Excel file to the order in which they are displayed in this document.
157

Table 3: List of Randomized Sensitivity Analysis Trials for the Single Server Model, 1 of 2
In Document In File1 142 513 524 655 16 237 638 39 1610 5011 512 1813 4414 3415 7116 5417 918 4219 6120 4921 6422 3323 2724 5925 1926 7827 5528 4829 7730 1331 1232 1533 3034 5635 2536 837 6938 6239 6840 6041 39
158

Table 4: List of Randomized Sensitivity Analysis Trials for the Single Server Model, 2 of 2
In Document In File42 2143 3644 5345 4646 8047 3748 4049 4150 7651 7052 4353 2454 2255 2856 2657 3858 2959 2060 761 1162 7263 664 3565 7566 8167 7368 7469 5870 1771 7972 3273 6674 4575 3176 4777 5778 479 1080 281 67
159

Bibliography
[1] Disaster preparedness: Limitations in federal evacuation assistance for health facilities shouldbe addressed. Technical Report GA-06-826, United States Government Accountability Office,2006.
[2] Nursing home emergency preparedness and response during recent hurricanes. TechnicalReport OEI-06-06-00020, United States Department of Health and Human Service, Office foInspector General, 2006.
[3] AORN guidance statement: Mass casualty, triage, and evacuation. Association of periOper-ative Registered Nurses Journal, 85(4):792–800, 2007.
[4] Draft guidelines for the development of altered standards of care for influenza pandemic.Technical report, Massachusetts Department of Public Health and the Harvard School ofPublic Health, 2007.
[5] Code of ethics for nursing. Technical report, American Nursing Association,http://www.nursingworld.org/mainmenucategories/thepracticeofprofessionalnursing/ethicsstandards,October 2008.
[6] Principles of medical ethics. Technical report, American Medical Institution,http://www.ama-assn.org/ama/pub/category/2512.html, November 2008.
[7] Hospital Incident Command System. Technical report, Center for HICS Education and Train-ing, Washington Hospital Center and Kasier Permanente, http://www.hicscenter.org/, 2009.
[8] NIMS Resource Center. Technical report, Federal Emergency Management Agency, U.S.Department of Homeland Security, http://www.fema.gov/emergency/nims, 2009.
[9] O. Alagoz, L.M. Maillart, A.J. Schaefer, and M.S. Roberts. The optimal timing of living-donorliver transplantation. Management Science, 50(10):1420–1430, October 2004.
[10] N.T. Argon, S. Ziya, and R. Righter. Scheduling impatient jobs in a clearing system withinsights on patient triage in mass casualty incidents. Probability in the Engineering andInformational Sciences, 22(3):301–332, 2008.
[11] J. Augustine and J.T. Schoettmer. Evacuation of a rural community hospital: Lessons learnedfrom an unplanned event. Disaster Management and Response, 3(3):68–72, 2005.
160

.
[12] J.A. Barbera. Critical Care Delivery in the Scarce Resource Situation: What it Meansfor Your Organization. presented at the South Carolina Hospital Association’s Summit onLessons Learned from the H1N1 Outbreak and Making Medical Decisions During Incidentswith Scarce Resources, June 2010.
[13] J. Barnett, M. Dennis-Rouse, and V. Martinez. Wildfire disaster leads to facilities evacuation.Orthopaedic Nursing, 28(1):17–20, 2009.
[14] J. Bather. Decision Theory: An Introduction to Dynamic Programming and Sequential De-cisions. John Wiley & Sons LTD, Chichester, 2000.
[15] N.K. Bell. Triage in medical practices: An unacceptable model? Social Science and Medicine,Part F, 15F(4):151–156, 1981.
[16] P.P. Bhattacharya and A. Ephremides. Optimal scheduling with strict deadlines. IEEETransactions on Automatic Control, 34(7):721–728, 1989.
[17] P.P. Bhattacharya and A. Ephremides. Optimal allocation of a server between two queueswith due times. IEEE Transactions on Automatic Control, 36(12):1417–1423, 1991.
[18] J. Bovender and B. Carey. A week we don’t want to forget: Lessons learned from Tulane.Frontiers of Health Services Management, 23(1):3–12, 2006.
[19] P. Bowers, M. Maguire, P. Silva, and R. Kitchen. Everybody out!! Nursing Management,35(4):50–54, 2004.
[20] O.J. Boxma and F.G. Forst. Minimizing the expected weighted number of tardy jobs instochastic flow shops. Operations Research Letters, 5(3):119–126, 1986.
[21] J.R. Broyles and J.K. Cochran. Estimating business loss to a local hospital departmentfrom patient reneging by queuing-based regression. In Proceedings of the 2007 IIE ResearchConference, pages 613–618, Nashville, TN, 2007.
[22] A. Bruin, A.C. Rossum, M.C. Visser, and G.M. Koole. Modeling the emergency cardiac in-patient flow: An application of queuing theory. Health Care Management Science, 10(2):125–137, June 2007.
[23] J.P. Casani and A.J. Romanosky. Disaster Medicine, chapter Surge Capacity, pages 193–202.Mosby Elsevier, 2006.
[24] N. Castle. Nursing home evacuation plans. The American Journal of Public Health,98(7):1235–1240, 2008.
[25] C. Castro, D. Persson, N. Bertstrom, and S. Cron. Surviving the storms: Emergency pre-paredness in Texas nursing facilities and assisted living facilities. Journal of gerontologicalNursing, 34(8):9–16, 2008.
[26] M.W. Chaffee. Making the decision to report to work in a disaster. American Journal ofNursing, 106(9):54–57, 2006.
161

[27] X. Chen, J.W. Meaker, and F.B. Zhan. Agent-based modeling and analysis of hurricaneevacuation procedures for the Florida Keys. Natural Hazards, 38(3):321–338, 2006.
[28] A.K. Childers and K.M. Taaffe. Evacuating patients based on priority modeling. In J. Fowlerand S. Mason, editors, Proceedings of the 2008 Industrial Engineering Research Conference,pages 1813–1818, Vancouver, British Columbia, 2008.
[29] K. Claxton and K.M. Thompson. A dynamic programming approach to the efficient designof clinical trials. Journal of Healthcare Economics, 20(5):797–822, 2001.
[30] R.A. Clifford. The Rio Grande Flood: A comparative study of boarder communities. Tech-nical report, National Research Council Disaster Study 7, Washington, DC, 1956.
[31] C.S. Cocanour, S.J. Allen, J. Mazabob, J.W. Sparks, C.P. Fischer, J. Romans, and K.P.Lally. Lessons learned from the evacuation of an urban teaching hospital. Archives of Surgery,137(10):1141–1145, 2002.
[32] R. Cookson and P. Dolan. Principles of justice in health care rationing. Journal of MedicalEthics, 26(5):323–329, 2000.
[33] T.J. Cova and J.P. Johnson. A network flow model for land-based evacuation routing. Trans-portation Research Part A, 37:579–604, 2003.
[34] A.C. Dalal and S. Jordan. Optimal scheduling in a queue with differentiated impatient users.Performance Evaluation, 59(1):73–84, 2005.
[35] S.M. Distefano. Getting kids from the Big Easy hospitals to our place Not Easy: Prepar-ing, improvising, and caring for children during mass transport after a disaster. Pediatrics,117(5):S421–S427, 2006.
[36] D. Dosa, N. Grossman, T. Wetle, and V. Mor. To evacuate or not to evacuate: Lessonslearned from Louisiana nursing home administrators following Hurricanes Katrina and Rita.Journal of the American Medical Directors Association, 8(3):142–149, 2007.
[37] T.E. Drabek. Social processes in disaster: Family evacuation. Social Problems, 16:336–349,1969.
[38] T.E. Drabek and K. Boggs. Families in disaster: Reactions and relatives. Journal of Marriageand the Family, 30:443–451, 1968.
[39] T.E. Drabek and III J.S. Stephenson. When disaster strikes. Journal of Applied SocialPsychology, 1(2):187–203, 1971.
[40] J. Duanmu, K.M. Taaffe, and M. Chowdhury. Minimizing patient transport times during masspopulation evacuations. Technical report, Department of Industrial Engineering, ClemsonUniversity, Clemson, SC, 2009.
[41] A. Egol, R. Fromm, K.K. Guntupalli, M. Fitzpatrick, D. Kaufman, S. Nasraway, D. Ryon, andJ. Zimmerman. Guidelines for intensive care unit admission, discharge, and triage. CriticalCare Medicine, 27(3):633–638, 1999.
162

[42] H. Emmons and M. Pinedo. Scheduling stochastic jobs with due dates on parallel machines.European Journal of Operational Research, 41(1):49–55, 1990.
[43] A.M.O. Esogbue. Dynamic programming and optimal control of variable multichannelstochastic service systems with applications. Mathematical Biosciences, 5(1-2):133–142, 1969.
[44] P.L. Estacio. Surge capacity for health care systems: Early detection, methodologies, andprocess. Academic Emergency Medicine, 13(11):1135–1137, 2006.
[45] Federal Emergency Management Agency (FEMA). IS-700 National Inci-dent Management System (NIMS) Course Summary, 2007. Available athttp://training.fema.gov/EMIWeb/downloads/IS700-NIMS.pdf.
[46] J. Fischer, G. Stine, B. Stoker, M. Trowbridge, and E. Drain. Evacuation behaviour: Whydo some evacuate, while others do not? a case study of the Ephrata, Pennsylvania (USA)evacuation. Disaster Prevention and Management, 4(4):30–36, 1995.
[47] C. Fitzpatrick and D.S. Mileti. Motivating public evacuation. International Journal of MassEmergencies and Disasters, 9(2):137–153, 1991.
[48] A. Fletcher, D. Halsall, D. Huxham, and D. Worthington. The DH accident and emergencydepartment model: A national generic model used locally. Journal of the Operational ResearchSociety, 58(12):1554–1562, 2007.
[49] Centers for Disease Control and Prevention. Percentage of trauma-related visits to emergencydepartments, by transport mode and patient age group - National Hospital AmbulatoryMedical Care Survey, United States - 2003–2004. Morbidity and Mortality Weekly Report,56(6):122, 2006.
[50] Agency for Healthcare Research and Quality. Mass evacuation transportation planning model.online, September 2009.
[51] Agency for Healthcare Research and Quality. Recommendations for a national mass pa-tient and evacuee movement, regulating, and tracking system. Technical report, Agency forHealthcare Research Quality, Rockville, MD, 2009.
[52] O. Franzese and S. Joshi. Traffic simulation application to plan real-time distribution routes.In Proceedings of the 2002 Winter Simulation Conference, San Diego, CA, 2002.
[53] B.E. Fries and V.P. Marathe. Determination of optimal variable-sized multiple-block appoint-ment systems. Operations Research, 29(2):324–345, 1981.
[54] C.E. Fritz. Contemporary Social Problems, chapter Disasters, pages 651–694. Harcourt, 1961.
[55] C.E. Fritz and E.S. Marks. The NORC studies of human behavior in disaster. The Journalof Social Issues, 10(3):26–41, 1954.
[56] B. Gert. Ethics: The Big Question, chapter Moral Theory and Rationality, pages 84–93.Blackwell Ltd, 1998.
163

[57] R.E. Giachetti, E.A. Centeno, M.A. Centeno, and R. Sundaram. Assessing the viability ofan open access policy in an outpatient clinic: A discrete-event and continuous simulationmodeling approach. In M.E. Kuhl, N.M. Steiger, F.G. Armstrong, and J.A. Joines, editors,Proceedings of the 2005 Winter Simulation Conference, pages 2246–2255, Orlando, Florida.
[58] K.D. Glazebrook, P.S. Ansell, R.T. Dunn, and R.R. Lumley. On the optimal allocation ofservice to impatient tasks. Journal of Applied Probability, 41(1):51–72, 2004.
[59] M.M. Gnal and M. Pidd. Discrete event simulation for performance modelling in health care:A review of the literature. Journal of Simulation, 4:42–51, 2010.
[60] F. Gonul. Estimating price expectations in the OTC medicine market: An application ofdynamic stochastic discrete choice models to scanner panel data. Journal of Econometrics,89(1-2):41–56, 1999.
[61] Linda Good. R. Journal of Emergency Nursing, 34:112–115, 2008.
[62] R.E. Goodin. Utilitarianism as a Public Policy. Cambridge University Press, 1995.
[63] B.H. Gray and K. Hebert. Hospitals in Hurricane Katrina: Challenges facing custodialinstitutions in a disaster. Journal of Health Care for the Poor and Undeserved, 18(2):283–298, 2007.
[64] L. Greene. Tampa General’s plan to stay put ‘touchy’. St. Petersburg Times, September2005.
[65] I. Gupta, J. Zoreda, and N. Kramer. Hospital manpower planning by use of queuing theory.Health Services Research, 6(1):76–82, Spring 1971.
[66] S. Gwynne, E. Galea, J. Parke, and J. Hickson. The collection and analysis of pre-evacuationtimes derived from evacuation trials and their application to evacuation modeling. FireTechnology, 39(2):179–195, 2009.
[67] C. Ham and A. Coulter. Explicit and implicit rationing: Taking responsibility and avoidingblame for health care choices. Journal of Health Services Research & Policy, 6(3):163–169,2001.
[68] J.M Hans and T.C. Sell. Evacuation risks – An evalation. Technical report, U.S. Environ-mental Protection Agency; Office of Radiation Programs, Las Vegas, NV, 1974.
[69] G. Hardin. Lifeboat ethics; the case against helping the poor. Psychology Today, 8:38–43,1974.
[70] R.G. Hartman. Tripartite triage concerns: Issues for law and ethics. Critical Care Medicine,31(5):S358–S361, 2003.
[71] J. Hick, J. Barbera, and G. Kelen. Refining surge capacity: Conventional, contingency, andcrisis capacity. Disaster Medicine and Public Health Preparedness, 3(1):S59–S67, 2009.
[72] A.G. Hobeika and B. Jamei. Massvac: A model for calculating evacuation times under naturaldisaster. Emergency Planning, Simulation Series, 15:23–28, 1985.
164

[73] A.G. Hobeika and C. Kim. Comparison of traffic assignments in evacuation modeling. IEEETransactions of Engineering Management, 45(2):192–198, 1998.
[74] G.R. Holt. Making difficult ethical decisions in patient care during natural disasters andother mass casualty events. Otolaryngology - Head and Neck Surgery, 139(2):181–186, 2008.
[75] N. Hupert, A.I. Mushlin, and M.A. Callahan. Modeling the public health response to bioter-rorism: Using discrete event simulation to design antibiotic distribution centers. MedicalDecision Making, 22(1):S17–S25, 2002.
[76] S.A. Hurst and M. Danis. A framework for rationing by clinical judgment. Kennedy Instituteof Ethics Journal, 17(3):247–266, 2007.
[77] K. Hyer, L. Brown, J. Christensen, and K. Thomas. Weathering the storm: Challenges tonurses providing care to nursing home residents during hurricanes. Applied Nursing Research,22:e9–e14, 2009.
[78] K. Hyer, L.M. Brown, A. Berman, and L. Polivka-West. Establishing and refining hurricaneresponse systems for long-term care facilities. Health Affairs, 25(5):407–411, 2006.
[79] Health Systems Research Inc. Altered standards of care in mass casualty events. TechnicalReport AHRQ Publication Number 05-0043, Agency for Healthcare Research and Quality,Rockville, MD, 2005.
[80] S.M.R. Iravani and B. Kolfal. When does the cµ rule apply to finite-population queueingsystem? Operations Research Letters, 33:301–304, 2004.
[81] L. Jacobs, T. Marmor, and J. Oberlander. The Oregon health plan and the political paradoxof rationing: What advocates and critics have claimed and what Oregon did. Journal ofHealth Politics, Policy, and Law, 24(1):161–180, 1999.
[82] M. Jafari. Evacuation planning and emergency management study of Robert Wood JohnsonUniversity Hospital. Technical Report RWJ-RU4474, State of New Jersey Department ofHealth and Senior Services and Robert Wood Johnson University Hospital, November 2005.
[83] C. Johnson. Using computer simulations to support a risk-based approach for hospital evac-uation. Technical report, Glasgow Accident Analysis Group, University of Glasgow, 2006.
[84] J.B. Jun, S.H. Jacobson, and J.R. Swisher. Application of discrete-event simulation in health-care clinics. Journal of the Operational Research Society, 50(2):109–123, 1999.
[85] A. Kaji, K.L. Koenig, and T. Bey. Surge capacity for healthcare systems: A conceptualframework. Academic Emergency Medicine, 13(11):1157–1159, 2006.
[86] R.K. Kanter and J.R. Morgan. Hospital emergency surge capacity: An empiric New Yorkstatewide study. Annals of Emergency Medicine, 50(3):314–319, 2007.
[87] M. Katz. Ethics of scarce medical resource allocation. Georgetown Journal of Legal Ethics,21(3):795–826, R.
[88] M.R. Khan and B.B. Callahan. Planning laboratory staffing with a queuing model. EuropeanJournal of Operational Research, 67(3):321–331, June 1993.
165

[89] R.M. Kidder. How Good People Make Tough Choices. Harper, 1995.
[90] K. Kipnis. Triage and ethics. Virtual Mentor: American Medical Association Journal ofEthics, 4(1), 2002.
[91] N. Koizumi, E. Kuno, and T. Smith. Modeling patient flows using a queuing network withblocking. Health Care Management Science, 8(1):49–60, February 2005.
[92] T. Kongnakorn, M. Mwamburi, S. Murchant, K. Akhras, J.J. Caro, and D. Nathwani. Eco-nomic evaluation of doripenem for the treatment of nosocomial pneumonia in the US: Discreteevent simulation. Current Medical Research & Opinion, 26(1):17–24, 2010.
[93] C.K. Kraus, F. Levy, and G.D. Kelen. Lifeboat ethics: Considerations in the discharge ofinpatients for the creation of hospital surge capacity. Disaster Medicine and Public HealthPreparedness, 1(1):51–56, July 2007.
[94] E. Krızova and J. Simek. Rationing of expensive medical care in a transition country - NihilNovum? Journal of Medical Ethics, 28(5):308–312, 2002.
[95] H.W. Lach, J.C. Langan, and D.C. James. Disaster planning: Are gerontological nursesprepared? Journal of Gerontological Nursing, 31(11):21–27, 2005.
[96] S. Laditka, J. Laditka, S. Xirasagar, C. Cornman, C. Davis, and J. Richter. Providing shelterto nursing home evacuees in disasters: Lessons from Hurricane Katrina. American Journalof Public Health, 98(7):1288–1293, 2008.
[97] G.L. Larkin and J. Arnold. Ethical considerations in emergency planning, preparedness, andresponse to acts of terrorism. Prehospital Disaster Medicine, 18(3):170–178, 2003.
[98] S. Lewis. Georgia hospital hit by F3 tornado - all patients evacuated through the ed. EDManagement, 19(4):37–39, 2007.
[99] J.J. Ligtenberg, L.G. Arnold, Y. Stienstra, T.S. van der Werf, J.H. Meertens, J.E. Tulleken,and J.G. Zilstra. Quality of interhospital transport of critically ill patients: A prospectiveaudit. Critical Care, 9(4):R446–R451, 2005.
[100] M.K. Lindell and C.S. Prater. Critical behavioral assumptions in evacuation time estimateanalysis for private vehicles: Examples from hurricane research and planning. Journal ofUrban Planning and Development, 133(1):18–29, 2007.
[101] N. Linzer, J. Sweifach, and J. Heft-LaPorte. Triage and ethics: Social workers on the frontline. Journal of Human Behavior in the Social Environment, 18(2):184–203, 2008.
[102] S.A. Lippman. Applying a new device in the optimization of exponential queueing systems.Operations Research, 23(4):687–710, 1975.
[103] G.G. Løvas. On performance measures for evacuation systems. European Journal of Oper-taional Research, 85(2):352–367, 1995.
[104] P. Mack. Utilitarian ethics in healthcare. International Journal of the Computer, the Internetand Management, 12(3):63–72, 2004.
166

[105] M.S. Maxwell, S.G. Henderson, and H. Topaloglu. Ambulance redeployment: An approximatedynamic programming approach. In M.D. Rossetti, R.R. Hill, B. Johansson, A. Dunkin, andR.G. Ingalls, editors, Proceedings of the 2009 Winter Simulation Conference, pages 1850–1860, 2009.
[106] M. E. Mayorga, H.S. Ahn, and J.G. Shanthikumar. Optimal control of make-to-stock pro-duction system with adjustable service rate. Probability in the Engineering and InformationalSciences, 20(4):609–634, 2006.
[107] L. McDonald, T. Butterworth, and D.W. Yates. Triage: A literature review 1985-1993.Accident and Emergency Nursing, 3(4):201–207, 1995.
[108] K.J. McGlown. Determinants of the Evacuation of Health Care Facilities. PhD thesis, Uni-versity of Alabama at Birmingham, 1999.
[109] K.J. McGlown. Evacuation of health care facilities: A new twist to a classic model. NaturalHazards Review, 2(2):90–99, 2001.
[110] J.C. Moskop and K.V. Iserson. Triage in medicine, Part I: Concept, history, and types.Annals of Emergency Medicine, 49(3):275–281, 2007.
[111] J.C. Moskop and K.V. Iserson. Triage in medicine, Part II: Underlying values and principles.Annals of Emergency Medicine, 49(3):282–287, 2007.
[112] A. nl, G. lken, and E. Edg. A space syntax based model in evacuation of hospitals. In A. vanNes, editor, Proceedings of the 5th International Space Syntax Symposium, pages 161–171,Delft, Holland, 2005. Space Syntax Laboratory.
[113] Altered Standards of Care Community Advisor Group. Altered standards of care guidancewith an emphasis on pandemic influenza. Technical report, Indiana State Department ofHealth, 2008.
[114] S.S. Panwar, D. Towsley, and J.K. Wolf. Optimal scheduling policies for a class of queueswith customer deadlines to the beginning of service. Journal of the Association for ComputingMachinery, 35(4):832–844, 1988.
[115] Continuum Health Partners. Evacuation planning for hospitals draft document. Technicalreport, Center for Bioterrorism Preparedness and Planning, 2006.
[116] K. Peleg and A. Kellermann. Enhancing hospital surge capacity for mass casualty events.Journal of the American Medical Association, 302(5):565–567, 2009.
[117] R. Perry and M. Lindell. The effects of ethnicity on evacuation decision making. InternationalJournal of Mass Emergencies and Disasters, 9(1):47–68, 1991.
[118] R.W. Perry. The Social Psychology of Civil Defense. Lexington Books,, Lexington, MA, 1979.
[119] R.W. Perry. Threat perception and public response to volcano hazard. Journal of SocialPsychology, 116(199-204), 1982.
[120] R.W. Perry. Sociology of Disasters, chapter Disaster Preparedness and Response AmongMinority Citizens, pages 135–151. Franco Angeli LIbri, Milano, Italy, 1987.
167

[121] R.W. Perry and M.R. Greene. The role of ethnicity in the emergency decision-making process.Sociological Inquiry, 52:309–334, 1982.
[122] R.W. Perry and M.R. Greene. American minority citizens in disaster. Technical report,Battelle Human Affairs Research Center, Seattle, WA, 1983.
[123] R.W. Perry and M.R. Greene. Citizen Response to Volcanic Eruptions: The Case of Mt. St.Helens. Irving Publishers, Inc., New York, NY, R.
[124] R.W. Perry and M.K. Lindell. Twentieth-century volcanicity at Mt. St. Helens: The rou-tinization of life near an active volcano. Technical report, School of Public Affairs, ArizonaState University, Tempe, AZ, 1986.
[125] R.W. Perry, M.K. Lindell, and M.R. Greene. Evacuation Planning in Emergency Manage-ment. Lexington Books, Lexington, MA, 1981.
[126] N. Pesik, M.E. Keim, and K.V. Iserson. Terrorism and the ethics of emergency medicial care.Annals of Emergency Medicine, 37(6):642–646, 2001.
[127] M. Pidd, F.N. deSilva, and R.W. Eglese. A simulation model for emergency evacuation.European Journal of Operational Research, 90(3):413–419, 1996.
[128] M. Pinedo. Stochastic scheduling with release dates and due dates. Operations Research,31(3):559–572, 1983.
[129] Y. Powell-Young, J. Baker, and J. Jogan. Disaster ethics, health care and nursing: A modelcase study to facilitate the decision making process. Online Journal of Health Ethics, 1(2),2006.
[130] I.E. Priel and E. Dolev. [ethical considerations in mass casualty situations], article in hebrew.Harefuah, 140(7):574–577,680, 2001.
[131] Bioterrorism Hospital Preparedness Program. Hospital evacuation protocol. Technical report,NYC Department of Health and Mental Hygiene, 2006.
[132] E.L. Quarantelli. Evacuation behavior and problems: Findings and implications from theresearch literature. Disaster Research Center, Ohio State University, Columbus, OH, 1980.
[133] E.L. Quarantelli. Perceptions and reactions to emergency warnings of sudden hazards. Ek-istics, 309:511–515, 1984.
[134] K. Qureshi, R. Gershon, M. Sherman, T. Straub, E. Gebbie, M. McCollum, M. Erwin, andS. Morse. Health care workers’ ability and willingness to report to duty during catastrophicdisasters. Journal of Urban Health, 82(3):378–388, 2005.
[135] J. Rachels and S. Rachels. The Elements of Moral Philosophy. McGraw-Hill, 5th edition,2007.
[136] S. Ramwadhdoebe, E. Buskens, R.J.B. Sakkers, and J.E. Stahl. A tutorial on discrete-eventsimulation for health policy design and decision making: Optimizing pediatric ultrasoundscreening for hip dysplasia as an illustration. Health Policy, 93(2-3):143–150, 2009.
168

[137] M. Rassin. Nurses’ professional and personal values. Nursing Ethics, 15(5):614–630, 2008.
[138] M. Roberts, J.G. Hodge, E. Gabriel, J.L. Hick, S. Cantrill, A.M. Wilkinson, and M. Matzo.Mass medical care with scarce resources: A community planning guide. Technical ReportContract No. 290-04-0010, Agency for Healthcare Research and Quality, 2007.
[139] Jr. S. Stidham. Cost models for stochastic clearing systems. Operations Research, 25(1):100–127, 1977.
[140] Jr. S. Stidham. Stochastic clearing systems. European Journal of Operational Research,47(1):49–55, 1990.
[141] C. Schultz, K. Koenig, E. Auf der Heide, and R. Olson. Benchmarking for hospital evacuation:A critical data collection tool. Prehospital and Disaster Medicine, 20(5):331–342, 2005.
[142] C. Schultz and S. Stratton. Improving hospital surge capacity: A new concept for emergencycredentialing of volunteers. Annals of Emergency Medicine, 49(5):602–609, 2007.
[143] C.H. Schultz, K.L. Koenig, and R.J. Lewis. Implications of hospital evacuation after theNorthridge, California, earthquake. The New England Journal of Medicine, 348(14):1349–1355, 2003.
[144] D.S. Shapiro. Surge capacity for response to bioterrorism in hospital clinical microbiologylaboratories. Journal of Clinical Microbiology, 41(12):5372–5376, 2003.
[145] Y. Sheffi, H. Mahmassani, and W.B. Powell. A transportation network evacuation model.Transportation Research Part A, 16(3):209–218, 1982.
[146] K. Siddhartan, W.J. Jones, and J.A. Johnson. A priority queuing model to reduce waitingtime in emergency care. International Journal of Health Care Quality Assurance, 9(5):10–16,1996.
[147] T. Sinuff, K. Kahnamoui, D.J. Cook, J.M. Luce, and M.M. Levy. Rationing critical carebeds: A systematic review. Critical Care Medicine, 32(7):1588–1597, 2004.
[148] J.H. Sorenesen. Knowing how to behave under the threat of disaster: Can it be explained?Environment and Behavior, 15:438–457, 1985.
[149] J.H. Sorensen. Evacuation of the emergency warning system at the Fort St. Vrain NuclearPower Plant. Technical report, Oak Ridge National Laboratory, Oak Ridge, TN, 1982.
[150] J.H. Sorensen. When shall we leave? factors affecting the timing of evacuation departures.International Journal of Mass Emergencies and Disasters, 9(2):153–165, 1991.
[151] E. Sternberg. Planning for resilience in hospital internal disaster. Prehospital and DisasterMedicine, 18(4):291–300, 2003.
[152] E. Sternberg, G.C. Lee, and D. Huard. Counting crises: US hospital evacuations. Prehospitaland Disaster Medicine, 19(2):1971–1999, 2004.
169

[153] M.G. Stineman, R. Ross, G. Maislin, R.C. Fiedler, and C.V. Granger. Risks of acute hos-pital transfer and mortality during stroke rehabilitation. Archives of Physical Medicine andRehabilitation, 84(5):712–718, 2006.
[154] A. Sumalee and F. Kurauchi. Network capacity reliability analysis considering traffic regula-tion after a major disaster. Network and Spatial Economics, 6(3):2005–219, 2006.
[155] K. Taaffe, M. Johnson, and D. Steinmann. Improving hospital evacuation using simulation.In M.E. Kuhl, N.M. Steiger, F.B. Armstrong, and J.A. Joines, editors, Proceedings of the2006 Winter Simulation Conference, pages 509–515, Orlando, FL, 2006.
[156] K. Taaffe, R. Kohl, and D.L. Kimbler. Hospital evacuation: Issues and complexities. In M.E.Kuhl, N.M. Steiger, F.B. Armstrong, and J.A. Joines, editors, Proceedings of the 2005 WinterSimulation Conference, pages 943–950, Orlando, Florida, 2005.
[157] E. Tayfur and K. Taaffe. Allocation of resources for hospital evacuations via simulation.In S.G. Henderson, B. Biller, M.H. Hsieh, J. Shortle, J.D. Tew, and R.R. Barton, editors,Proceedings of the 2007 Winter Simulation Conference, pages 1148–1154, 2007.
[158] E. Tayfur and K. Taaffe. A model for allocating resources during hospital evacuations. Com-puters & Industrial Engineering, to appear, 2009.
[159] A.K. Thompson, K. Faith, J.L. Gibson, and R.E.G. Upshur. Pandemic influenza prepared-ness: An ethical framework to guide and decision-making. BMC Medical Ethics, 7(12):1–1,2006.
[160] R.H. Turner. Waiting for disaster: Changing reactions to earthquakes in Southern California.International Journal of Mass Emergencies and Disasters, 1(2):307–334, 1983.
[161] R.H. Turner, J.M. Nigg, D.H. Paz, and B.S. Young. Earthquake threat: The human responsein Southern California. Technical report, Institute for Social Science Research, University ofCalifornia, Los Angeles, CA, 1979.
[162] R.H. Turner, J.M. Nigg, D.H. Paz, and B.S. Young. Community response to earthquakethreats in Southern California. Technical report, University of California Press, Los Angeles,CA, 1981.
[163] P.A. Ubel and S. Goold. Recognizing bedside rationing: Clear cases and tough calls. Annalsof Internal Medicine, 126(1):74–80, 1997.
[164] P.A. Ubel, G. Loewenstein, J. Hershey, J. Baron, T. Mohr, D.A. Asch, and C. Jepson. Dononpatients underestimate the quality of life associated with chronic health conditions becauseof a focusing illusion? Medical Decision Making, 21(3):190–199, 2001.
[165] J. Van Miegham. Dynamic scheduling with convex delay costs: the generalized cµ rule.Annals of Applied Probability, 5(3):808–833, 1995.
[166] R.M. Veatch. Disaster preparedness and triage: Justice and the common good. Mt. SinaiJournal of Medicine, 72(4):236–241, 2005.
170

[167] B.M. Vogt. Evacuation of institutionalized and specialized populations. Oak Ridge NationalLaboratory, Oak Ridge, TN, 1990.
[168] B.M. Vogt. Issues in nursing home evacuations. International Journal of Mass Emergenciesand Disasters, 9(2):247–265, 1991.
[169] R. Wachbroit. Who is the patient? Maryland Medical Journal, 38(11):957–959, 1989.
[170] M.M. Ward and J.J. Odutola. Inter-hospital transfers of patients with systemic lupuserythematosus: Characteristics, predictors, and outcomes. The Journal of Rheumatology,33(8):1578–1585, 2006.
[171] J.M. Weaver. What is the standard of care for anesthesia? Who determines it? AnesthesiaProgress, 56(1):1–2, 2009.
[172] E.N. Weiss. Models for determining estimated start times and case orderings in hospitaloperating rooms. IIE Transactions, 22(2):143–150, 1990.
[173] G. Werker, A. Saure, J. French, and S. Shechter. The use of discrete-event simulation mod-elling to improve radiation therapy planning processes. Radiotherapy and Oncology, 92(1):76–82, 2009.
[174] D.B. White, M.H. Katz, J.M Luce, and B. Lo. Who should receive life support during apublic health emergency? using ethical principles to improve allocation decisions. Annals ofInternal Medicine, 150:132–138, 2009.
[175] D. Worthington. Hospital waiting list management models. The Journal of the OperationalResearch Society, 42(10):833–843, October 1991.
171