priority nutrient reduction activities for the gippsland
TRANSCRIPT

Priority nutrient reduction activities for the Gippsland Lakes and catchments
Part 2 – Application of Best management Practices to reduce nutrient loads
September 2006
Prepared for the Gippsland Lakes Task Force
by
Peter Cottingham, Rodger Grayson, Tony Ladson and John Tilleard

Priority nutrient reduction activities for the Gippsland Lakes and catchments
Peter Cottingham & Associates
i
Executive Summary The Gippsland Lakes Task Force (the Task Force) prepared the Gippsland Lakes Future Directions and Actions Plan (GLTF 2002) in response to water quality and other issues related to the management of the Gippsland Lakes. A key component of the Actions Plan is the reduction of nutrient loads that support primary production in the Lakes, as there is widespread acknowledgment that an increased frequency and duration of algal blooms is the biggest risk to water quality and the ecological health of the Lakes. High nutrient loading and limited flushing means that nutrients transported from the surrounding catchments are largely retained in the Lakes, potentially supporting algal blooms well into the future. The Actions Plan established a vision and shared commitment by Government and stakeholders to achieving a 40% reduction in nutrient loads entering the Lakes over the next 20 years. The Task Force commissioned a number of research projects in order to provide information to guide future investments in managing nutrient inputs to the Lakes. These studies have provided valuable new insights into the generation, transport and availability of nutrients that support algae production in the Gippsland Lakes. The Actions Plan has been in place for 4 years and the Task Force is currently considering its next phase of investment. Part of this process is to reassess the priority areas that will be the focus of action and investigation for the next 3 years. This report has used recent updates of sediment and nutrient load estimates, and of best management practices (BMPs), to assess the maximum likely reduction in phosphorus loads from implementation of BMPs throughout the catchment. The results suggest that with continued incentives and sustained effort at extension, BMPs are likely to reduce phosphorus loads by approximately 39 t/yr, or 14%. While this is a significant reduction, it suggests that meeting the target of a 40% reduction in nutrient loads is not possible without new technology or significant land use change in the catchment. However, even small decreases in nutrient loads can benefit the Lakes. Small reductions in nutrients lead to proportional decreases in chlorophyll concentration but disproportionately large improvements in bottom oxygen due to non-linear feedbacks in the modelled nutrient and carbon cycles. Thus, there are potentially significant environmental benefits to the Lakes in reducing catchment sediment and nutrient loads even if the 40% target is not achieved. The greatest gains in terms of reducing nutrient loads to the Lakes will be achieved by applying the most cost-effective BMPs to the sub-catchments contributing the greatest proportional load. Highest priority should therefore go to applying BMPs to: • Irrigation areas in the western catchments that contain the Macalister Irrigation
District (MID), • Point sources in the Western sub-catchments, and then • Streambank erosion in dryland/ areas in the Western sub-catchments and in the
Lower Mitchell and Upper Tambo. With the exception of point sources in the Latrobe Tributaries and Lower Latrobe, BMPs applied to all the above sources are estimated to reduce TP load to the Lakes by 1.0 t/yr per year or more.
Priority nutrient reduction activities for the Gippsland Lakes and catchments
Peter Cottingham & Associates
ii
Applying BMPs to dryland/grazing areas carries the largest cost in terms of $/kg TP removed. To maximise the benefits, priority should be given to applying BMPs to dryland/grazing areas that coincide with areas affected by high rates of stream bank erosion. Identifying areas with the highest stream erosion rates requires further consideration but, along with investigations of new or better targeted BMPs for dryland areas, will help to identify dryland areas most amenable to management at the lowest possible cost. It is also recommended that the implications of diminishing returns for applying BMPs be investigated. This will help to identify when the returns from one BMP decline to that of the next most cost-effective BMP, and so on. This will ensure that future funding is deployed to maximum effect and that nutrient reduction targets are achieved at the lowest possible cost. In summary, it is recommended that the Task Force consider the following in its next round of funding: • Applying existing BMPs to the priority nutrient sources of irrigated land in the
MID, point sources in the Western sub-catchments and hotspots of stream bank erosion in the Western sub-catchments and the Lower Mitchell and Upper Tambo.
• Review the relative contribution of stream erosion in the Upper Mitchell sub-catchment to sediment and nutrient loads, and their contribution to the Lakes.
• Investigating in greater detail the costs of applying BMPs to specific locations, starting with the priority areas identified above, and factors that may promote or constrain the effectiveness or adoption of BMPs at specific locations.
• Review any emerging technologies that may lead to new BMPs, particularly those that may be applied to diffuse sources such as dryland/grazing and forest land uses.
• An economic study to evaluate marginal returns and the cost-effectiveness of increasing levels of adoption of BMPs.

Priority nutrient reduction activities for the Gippsland Lakes and catchments
Peter Cottingham & Associates
iii
Contents
1 INTRODUCTION....................................................................................................................................... 1
1.1 APPROACH ................................................................................................................................................ 2
2 CATCHMENT NUTRIENT LOADS........................................................................................................ 5
3 NUTRIENT BEST MANAGEMENT PRACTICES ............................................................................. 11
3.1 IRRIGATED DAIRY ................................................................................................................................... 15 3.2 DRYLAND AGRICULTURE (GRAZING/PASTURE) ....................................................................................... 16 3.3 FOREST ................................................................................................................................................... 16 3.4 STREAM EROSION .................................................................................................................................... 17 3.5 POINT SOURCES....................................................................................................................................... 19 3.6 HORTICULTURE....................................................................................................................................... 19 3.7 SUMMARY OF BMP EFFECTIVENESS IN REDUCING TP LOADS TO THE GIPPSLAND LAKES ....................... 19
4 PRIORITY NUTRIENT REDUCTION ACTIVITIES ......................................................................... 21
4.1 SUMMARY OF PRIORITIES ........................................................................................................................ 27
5 REFERENCES.......................................................................................................................................... 30
Acknowledgments Chris Barry (Gippsland Coastal Board) and those who attended the August 2006 workshop (Appendix 1) have provided considerable advice and data that was invaluable for compiling this report. Our thanks are extended to them all.

Priority nutrient reduction activities for the Gippsland Lakes and catchments
Peter Cottingham & Associates
1
1 INTRODUCTION
The Gippsland Lakes Task Force (the Task Force) prepared the Gippsland Lakes Future Directions and Actions Plan (GLTF 2002) in response to water quality and other management issues raised by the Gippsland Lakes Environmental Audit (Harris et al. 1998) and the Gippsland Lakes Environmental Study (Webster et al. 2001). The Actions Plan included a framework based on five themes for managing the Gippsland Lakes: • Nutrients and sediments, • Water management, • Capacity building, • Wetlands biodiversity, • Planning, monitoring and evaluation. The Actions Plan includes a set of principles as a guide for resource managers in developing and implementing programs aligned with this Plan (GLTF 2002). They are: • Adherence to the precautionary principle when considering the impact of
management actions; • Management of the Gippsland Lakes in accordance with Ramsar objectives and
Victoria’s Biodiversity Strategy; • Consideration of economic, environmental and social implications and measures; • Definition of shared outcomes to enable shared decision-making; • Facilitation of broad community ownership; and • Use of adaptive management principles. There is widespread acknowledgment that an increased frequency and duration of algal blooms is the biggest risk to water quality and the ecological health of the Gippsland Lakes (e.g. Malcolm 2002, Webster et al. 2001). High nutrient loading and limited flushing means that nutrients transported from the surrounding catchments are largely retained in the Lakes. The Actions Plan established a vision and shared commitment by Government and stakeholders to achieving a 40% reduction in nutrient loads entering the Lakes over the next 20 years. This is to be achieved through programs that focus on: • Agriculture nutrient reduction, • Forestry and public land sediment reduction, • Waterways erosion control, • Urban and industrial nutrient reduction, and • Gippsland Lakes and hinterland nutrient reduction. A number of research projects were commissioned by the Task Force to identify and refine the specific activities and locations that would make the greatest contributions to nutrient reductions. These include: • A SedNet and sediment tracing study by CSIRO (Wilkinson et al. 2005, 2006),
complemented by a review of catchment sediment and nutrient loads (Grayson 2006);
• An investigation into the effectiveness of wetlands in reducing nutrient loads (Boon et al. 2006); and
Priority nutrient reduction activities for the Gippsland Lakes and catchments
Peter Cottingham & Associates
2
• The identification of the most valuable Best Management Practices (BMPs) for nutrient reduction (Ladson and Tilleard 2006);
• A sensitivity study on key aspects of the original Gippsland Lakes Environmental Study modelling (Grigg et al., 2004)
• A study informing the potential for phosphorus stores in the Lakes to support algal blooms into the future (Longmore 2006);
• A study into the contributions of roads to sediment in the Tyers catchment (Sheridan 2003 and Sheridan and Noske 2005),
• An analysis of sediment cores from the Lakes to identify net deposition rates (Hancock et al., 2006).
The studies listed above provided valuable new insights into the generation, transport and availability of nutrients that support algae production in the Gippsland Lakes. The Actions Plan has been in place for 4 years and the Task Force is currently considering its next phase of investment. Part of this process is to reassess the priority areas that will be the focus of action and investigation for the next 3 years.
Objective :
The objective of this study is:
• For each identified priority area within the catchment of the Gippsland Lakes, list BMPs that will reduce the nutrient and/or sediment loads, and assess and identify which BMPs make the greatest impact on nutrient reductions and their associated costs.
1.1 Approach
The project brief identified the following tasks:
1. Using the latest data, prepare a summary of the contributions of TP, TN and TSS from each major catchment entering the Gippsland Lakes (presented as average annual loads plus an estimate of the uncertainty or range in these loads).
2. Using latest data, identify the 2-3 major sources of nutrients and TSS in each catchment.
3. Prepare a map (conceptual diagram) that clearly shows the above information in a form that can be easily assimilated by decision-makers.
4. For each priority area, list BMPs that will reduce the nutrient and/or TSS loads, and assess and identify which BMPs make the greatest impact on nutrient reductions and their associated costs.
Tasks 1-3 were undertaken by Rodger Grayson from Catchment to Sea Pty. Ltd. This report relates to task 4.

Priority nutrient reduction activities for the Gippsland Lakes and catchments
Peter Cottingham & Associates
3
SedNet modelling of nutrients transported from the various sub-catchments to the Gippsland Lakes () was conducted by the CSIRO in a 2-stage process (Wilkinson et al. 2005, 2006). Preliminary estimates of nutrient loads based on existing data were calculated in Stage 1 (Wilkinson 2005). The SedNet predictions were then updated in Stage 2 using new input data that accounted for changes to load generation associated with processes such as bushfire and tunnel erosion, and the results of tracer studies of sediment and soil samples collected from the catchment and rivers (Wilkinson 2006). For this project, the Gippsland Lakes catchments were divided up as shown in Figure 1, with the additional split of the Upper Thomson (above Thomson dam) and Upper Macalister (above Lake Glenmaggie) from the lower reaches of the Thomson and Macalister (see also Grayson 2006). The Latrobe, Thomson, Macalister and Avon/Perry sub-catchments are collectively called the Western catchments throughout in this report. The Mitchell, Nicholson, Tambo and catchments proximal to the Lakes all called the Eastern catchments.
Figure 1: Sub-catchments of the Gippsland Lakes (from Wilkinson et al. 2006)
The SedNet modelling output data were complemented by additional information that accounted for localised differences in land use and sediment and nutrient load generation in the sub-catchments of the Lakes (Grayson 2006). This combined information provides the most comprehensive assessment of the nutrient loads entering the Lakes yet attained, and was used to identify the major sources of

Priority nutrient reduction activities for the Gippsland Lakes and catchments
Peter Cottingham & Associates
4
nutrients transported from the sub-catchments. The nutrient and sediment loads reaching the Lakes from the various sub-catchments are summarised in Chapter 2. Chapter 3 summarises the latest thinking on BMPs for nutrient reduction relevant to the Gippsland Lakes catchments and sub-catchments. This is based on the work of Ladson and Tilleard (2006) and findings from a workshop held at Monash University on the 29th August 2006. The workshop was attended by scientists and managers (Appendix 1) with experience and detailed knowledge of the sources and calculation of nutrient loads, and of land use and land management practices from across the study area. Chapter 4 considers the potential load reductions that might be expected by applying BMPs to the sub-catchments of the Lakes. Priority sub-catchments and BMPs that are likely to provide the greatest gain in terms of nutrient reduction are identified, along with indicative costs for applying BMPs.

Priority nutrient reduction activities for the Gippsland Lakes and catchments
Peter Cottingham & Associates
5
2 CATCHMENT NUTRIENT LOADS
The outputs from SedNet modelling (Wilkinson et al. 2006) and results from recent investigations (e.g. Longmore 2006, Hancock et al. 2006) has been compiled by Grayson (2006) and updated to provide the latest and most concise estimate of sediment and nutrient loads entering the Gippsland Lakes. The results estimate the long-term average loads of sediment and nutrients delivered from four separate sources – gullies, streambanks, hillslopes and in the case of nutrients, dissolved form1 from different land uses. The sediment, phosphorus and nitrogen loads exported from the major land uses in each sub-catchment of the Lakes are presented in Appendix 2. In compiling catchment loads, land uses have been grouped into the following categories: • Forest-Reserve • Forest - Production • Forest – Plantation • Grazing/Pasture • Irrigated (largely of pasture) • Horticulture • Residential • Mining • Other (includes lakes, marshes, transport, communications) • Point • Road crossings
The above land uses are similar to those used in SedNet modelling (Figure 2). The data used to compile these figures were used to examine potential load reduction from the application of BMPs discussed in Chapter 4. Aggregated results for all catchments are presented in Figure 3 and Table 1. The results for the Eastern and Western catchments are presented in Figure 4 and Figure 5, respectively. The following is a short summary of the nutrient load information compiled by Grayson (2006): • Bank and gully erosion is estimated to be the main source of sediment (as total
suspended solids - TSS) for all rivers, contributing between 60 and 90% of the load entering the Lakes. Hillslope erosion accounts for a higher proportion of the sediment delivered from the Eastern catchments than for Western catchments, and have also been affected by bushfire in the high-runoff portions (i.e. high elevation regions) of the Mitchell and Tambo river systems.
• Conversely, hillslope and dissolved sources dominate the nutrient loads delivered by all catchments. The contributors of phosphorus to the Gippsland Lakes are hillslope and dissolved runoff (48% of total delivered phosphorus), river bank erosion (28%) and gully / tunnel erosion (5%). For nitrogen, the contributors in descending order are hillslope and dissolved runoff (83%), riverbank erosion (15%) and gully and tunnel erosion (2%).
1 The term “dissolved form” is used in SedNet but does not relate directly to what would be measured
in-stream or is typically thought of as dissolved. It should be considered as the proportion of total nutrient load over that which is attached as a natural part of soil.

Priority nutrient reduction activities for the Gippsland Lakes and catchments
Peter Cottingham & Associates
6
• Overall, irrigation, grazing/pasture and forest production land uses contribute approximately 80% of the phosphorus load delivered to the Lakes, while grazing/pasture, forest production and forest reserve land uses contribute approximately 80% of the nitrogen load delivered to the Lakes.
• Grazing/pasture, irrigation and production forest land uses collectively contribute approximately 80% of the phosphorus load and approximately 65% of the nitrogen load entering the Lakes from the Western catchments. Grazing/pasture, production forest and forest reserves collectively deliver approximately 90% of the phosphorus load and 95% of the nitrogen load entering the Lakes from the Eastern catchments.
• Nutrient loads from point sources such as wastewater treatment plants and industry have been reduced by approximately 50% over the last decade (J. Halliwell, pers. comm.) and now account for approximately 3% of the phosphorus load and a negligible nitrogen load entering the Lakes.
Figure 2: Land use in the Gippsland Lakes catchments (from Wilkinson et al. 2005)

Priority nutrient reduction activities for the Gippsland Lakes and catchments
Peter Cottingham & Associates
7
Table 1: Proportion of phosphorus and nitrogen loads from major land uses (Grayson 2006)
Land use Phosphorus Load Nitrogen Load
Forest - reserve 8% 18%
Forest - production 14% 31%
Forest – plantation 3% 3%
Grazing/pasture 45% 35%
Irrigated 20% 9%
Horticulture 2% 1%
Residential 1%
Mining 1% 1%
Other 3% 2%
Point 3% <1%

Priority nutrient reduction activities for the Gippsland Lakes and catchments
Peter Cottingham & Associates 8
Figure 3: Major sources of TSS, TP and TN entering the Gippsland Lakes (from Grayson 2006).
Overall - TSS (251,000 T/yr total)
10%
16%
2%
50%
11%
3%
1%
2%
4%
0%
1%
Forest-Reserve ( 18.9% of catchment area)
Forest - Prod ( 32.8% of catchment area)
Forest - Plant. ( 3.9% of catchment area)
Grazing/Pasture ( 36.4% of catchment area)
Irrigated ( 2.8% of catchment area)
Hort iculture ( 0.7% of catchment area)
Residential ( 0.4% of catchment area)
Mining ( 1.0% of catchment area)
Other ( 2.9% of catchment area)
Point ( 0.2% of catchment area)
Road crossings
Overall - TP (330 T/yr total)
8%
14%
3%
45%
20%
2%
1%
1%
3% 3% 0% Forest-Reserve ( 18.9% of catchment area)
Forest - Prod ( 32.8% of catchment area)
Forest - Plant. ( 3.9% of catchment area)
Grazing/Pasture ( 36.4% of catchment area)
Irrigated ( 2.8% of catchment area)
Horticulture ( 0.7% of catchment area)
Residential ( 0.4% of catchment area)
Mining ( 1.0% of catchment area)
Other ( 2.9% of catchment area)
Point ( 0.2% of catchment area)
Road crossings
Overall - TN (2,400 T/yr total)
17%
31%
3%
36%
9%1% 1%
2%
0%
0%0%Forest-Reserve ( 18.9% of catchment area)
Forest - Prod ( 32.8% of catchment area)
Forest - Plant. ( 3.9% of catchment area)
Grazing/Pasture ( 36.4% of catchment area)
Irrigated ( 2.8% of catchment area)
Hort iculture ( 0.7% of catchment area)
Residential ( 0.4% of catchment area)
Mining ( 1.0% of catchment area)
Other ( 2.9% of catchment area)
Point ( 0.2% of catchment area)
Road crossings
Overall - TSS sources
83%
17%
Gully and BankSediment
Hillslope Sediment
Overall - TP sources
28%
72%Gully and Bank P
Hillslope andDissolved P
Overall - TN sources
17%
83% Gully and Bank N
Hillslope andDissolved N

Priority nutrient reduction activities for the Gippsland Lakes and catchments
Peter Cottingham & Associates 9
Figure 4: Sources of TSS , TP and TN from Western catchments of the Gippsland Lakes (from Grayson 2006)
Western - TSS (155,000 T/yr total)
7%10%
4%
50%
18%
1%
1%3% 5%
0%
1%
Forest-Reserve ( 17.2% of catchment area)
Forest - Prod ( 28.6% of catchment area)
Forest - Plant. ( 5.2% of catchment area)
Grazing/Pasture ( 38.3% of catchment area)
Irrigated ( 5% of catchment area)
Horticulture ( 0.7% of catchment area)
Residential ( 0.5% of catchment area)
Mining ( 1.7% of catchment area)
Other ( 2.8% of catchment area)
Point ( 0% of catchment area)
Road crossings
Western - TP (204 T/yr total)
4% 7%4%
42%
32%
1%
1%
2%
3% 4% 0% Forest-Reserve ( 17.2% of catchment area)
Forest - Prod ( 28.6% of catchment area)
Forest - Plant. ( 5.2% of catchment area)
Grazing/Pasture ( 38.3% of catchment area)
Irrigated ( 5% of catchment area)
Horticulture ( 0.7% of catchment area)
Residential ( 0.5% of catchment area)
Mining ( 1.7% of catchment area)
Other ( 2.8% of catchment area)
Point ( 0% of catchment area)
Road crossings
Western - TN (1,300 T/yr total)
13%
26%
4%34%
16%
1%
1%
2%
3%
0% 0%
Forest-Reserve ( 17.2% of catchment area)
Forest - Prod ( 28.6% of catchment area)
Forest - Plant. ( 5.2% of catchment area)
Grazing/Pasture ( 38.3% of catchment area)
Irrigated ( 5% of catchment area)
Horticulture ( 0.7% of catchment area)
Residential ( 0.5% of catchment area)
Mining ( 1.7% of catchment area)
Other ( 2.8% of catchment area)
Point ( 0% of catchment area)
Road crossings
W estern - TSS sources
91%
9%
Gully and Bank
Sediment
Hillslope Sediment
Western - TP sources
20%
80% Gully and Bank P
Hillslope andDissolved P
Western - TN sources
15%
85% Gully and Bank N
Hillslope and
Dissolved N

Priority nutrient reduction activities for the Gippsland Lakes and catchments
Peter Cottingham & Associates 10
Figure 5: Sources of TSS, TP and TN loads from the Eastern catchments of the Gippsland Lakes (from Grayson 2006).
Eastern - TSS (94,000 T/yr total)
16%
27%
1%
48%
0%5% 0%
2%
0%
1%
0%
Forest-Reserve ( 20.4% of catchment area)
Forest - Prod ( 45.3% of catchment area)
Forest - Plant. ( 2.3% of catchm ent area)
Grazing/Pasture ( 29.6% of catchm ent area)
Irrigated ( 0.3% of catchment area)
Horticulture ( 0.9% of catchm ent area)
Residential ( 0.1% of catchm ent area)
Mining ( 0.4% of catchm ent area)
Other ( 0.8% of catchm ent area)
Point ( 0% of catchment area)
Road cross ings
Eastern - TP (110 T/yr total)
15%
29%
1%
48%
1% 4%
0%
0%
2%
0%
0%Forest-Reserve ( 20.4% of catchment area)
Forest - Prod ( 45.3% of catchm ent area)
Forest - Plant. ( 2.3% of catchment area)
Grazing/Pasture ( 29.6% of catchment area)
Irrigated ( 0.3% of catchm ent area)
Horticulture ( 0.9% of catchment area)
Residential ( 0.1% of catchment area)
Mining ( 0.4% of catchment area)
Other ( 0.8% of catchment area)
Point ( 0% of catchm ent area)
Road cross ings
Eastern TN (1,000
T/yr total)
23%
40%1%
33%
0%
2%
0%
0%
1%
0%
0%Forest-Reserve ( 20.4% of catchm ent area)
Forest - Prod ( 45.3% of catchment area)
Forest - Plant. ( 2.3% of catchment area)
Grazing/Pasture ( 29.6% of catchment area)
Irrigated ( 0.3% of catchment area)
Horticulture ( 0.9% of catchment area)
Residential ( 0.1% of catchment area)
Mining ( 0.4% of catchment area)
Other ( 0.8% of catchment area)
Point ( 0% of catchment area)
Road crossings
Eastern - TSS sources
29%
71% Gully and Bank
Sediment
Hillslope Sediment
Eastern - TP sources
46%
54%
Gully and Bank P
Hillslope and
Dissolved P
Eastern - TN sources
20%
80% Gully and Bank N
Hillslope and
Dissolved N

Priority nutrient reduction activities for the Gippsland Lakes and catchments
Peter Cottingham & Associates
11
3 NUTRIENT BEST MANAGEMENT PRACTICES
The research projects funded by the Task Force, along with the sediment and nutrient load data compiled for catchments in the study area presented in the previous chapter, are important for advancing our understanding of the processes that contribute to algal blooms in the Lakes. This work will also assist future evaluation of scenarios for managing nutrient inputs and algal blooms in the future. The formation of algal blooms result from a complex interaction between factors such as the availability of nitrogen and phosphorus, internal and external sources (loading) of nutrients, and ambient physical and chemical conditions. The application of BMPs to reduce nutrient loading to receiving waters generally focuses on the limitation of phosphorus (e.g. Donelly et al. 1998, Oliver et al. 1999). Phosphorus is essential for primary production as it is necessary for cell growth and, unlike nitrogen, does not have a gaseous phase. Some cyanobacteria can gain a competitive advantage in nitrogen limited conditions due to their ability to fix atmospheric nitrogen in the absence of other nitrogen sources. For example, Nodularia is a nitrogen-fixing cyanobacterium known to form blooms in the Lakes. While it can have a competitive advantage with small reductions in nitrogen loads (Webster et al. 2001) the reduction of phosphorus load can results in a lower biomass of this and other cyanobacteria. This report makes use of a review of BMPs focusing on reducing phosphorus loads to the Lakes conducted by Ladson and Tilleard (2005, 2006). In order to make use of the best available knowledge, they used an Expert Panel approach to synthesise relevant information and experience of the BMPs best suited to reducing nutrient loads to the Gippsland Lakes. This included a workshop held in October 2005 to reach a consensus on the main sources of phosphorus to the Lakes and to consider a range of potential BMPs and their application to catchments across the study area. At a second workshop in August 2006, participants were asked to use their knowledge to reach consensus on the likely effectiveness and adoption rates of a range of BMPs to apply across the study area. Indicative phosphorus loads (as total phosphorus – TP) were identified based on previous modelling and water quality data (Table 2), prior to the recent update described in the previous chapter2. The potential BMPs that could be applied to reducing these loads3 are listed in Table 3. The ‘most likely’ rates of adoption and effectiveness of BMPs (Table 4, Figure 6) were considered at the August 2006 workshop, which made use of participants’ first-hand experience of land and water management across the study area. This input was captured in spreadsheet-based gaming tool from which absolute and relative loads can be adjusted depending on new information or to explore scenarios and ideas proposed by those present. While there was some debate during the workshop
2 While the loads in Table 1 may vary from the most recent estimates, they are still of a similar order
of magnitude and suitable for considering the potential effectiveness of BMPs. 3 Note that these are loads reaching the Gippsland Lakes and may differ substantially from loads
estimated at the source.

Priority nutrient reduction activities for the Gippsland Lakes and catchments
Peter Cottingham & Associates
12
about the choice of categories in Table 1 and the sizes of the phosphorous contributions, sensitivity analyses during and after the workshop confirmed that the overall conclusions remain robust for the purposes of exploring nutrient inputs and savings in relative terms. Factors affecting the adoption and effectiveness rates of each of the BMP categories are discussed in the following sections. Further detail is provided in Ladson and Tilleard (2006).
Table 2: Source of phosphorus contribution to the Gippsland Lakes (Ladson and Tilleard 2005, 2006)*
Source Percentage of total load to the lakes
Approximate annual load (t/yr)
Irrigated Dairy (MID)** 16% 55
Dryland Agriculture 24% 80
Forest (including roads and road crossings)
24% 80
Stream erosion 22% 75
Point Sources 3% 9
Other 12% 39
Total 100% 338
* The figures in this table were prepared prior to the recent update of sediment and nutrient loads conducted by Wilkinson et al. (2005) and Grayson (2006). While they vary slightly from the updated values, this had little bearing on the relative contributions and potential load reductions that might be expected with BMPs that were considered at the August 2006 workshop. * Macalister Irrigation District (MID)

Priority nutrient reduction activities for the Gippsland Lakes and catchments
Peter Cottingham & Associates
13
Table 3: Classes of BMPs available to reduce phosphorous reaching the Lakes (Ladson and Tilleard 2006)
Source Class of BMP Example of BMP
On-farm BMPs that reduce runoff from farms (and/or P concentrations in farm runoff)
• Whole farm plans • Fertiliser application • Irrigation management • Conversion to spray • Retention/reuse systems • Soil erosion control • Dairy effluent management • Buffer strips
Irrigated Dairy (Macalister Irrigation District)
BMPs for reducing the volume of drainage water and/or its P concentration once the runoff has reached the channels that drain the irrigation area
• Injecting irrigation channels with drainage water
• Irrigation from drains • Modifying drains to increase
vegetation and retention times • Constructed wetlands
General dryland BMPs • Control of soil erosion • Buffer strips • Stock exclusion from w/ways
Dryland Agriculture
BMPs for managing “hot spots” that generate high P loads e.g. Warragul/Moe area
• Control of soil erosion • Fertiliser application • Buffer strips
BMPs for managing road runoff
• Management of road-waterway crossings
• Drainage to streams via grass swales • Management of trucks and truck traffic • Sediment control via improved road
surfacing
Forest (including roads and road crossings)
BMPs for managing forests: “Code of Forest Practice”
• Use of machinery • Cultivation practices • Erosion control • Sediment control • Harvesting practices
Stream erosion BMPs for waterway management
• Riparian revegetation • Bed erosion control • Bank erosion control
Point Sources BMPs for managing industrial discharges and discharges from wastewater treatment plants
• Ocean outfall • Tertiary treatment of wastewater • Land disposal of waste water

Priority nutrient reduction activities for the Gippsland Lakes and catchments
Peter Cottingham & Associates
14
Table 4: Summary of the most likely TP load reduction expected with application of BMPs (from Ladson and Tilleard 2006, as modified at the August 2006 workshop)
Figure 6: Anticipated TP loads, with and without BMPs (from Ladson and Tilleard 2006, as modified at the August 2006 workshop)
MID - irrigated dairy 16% 54.1 20.0 34.1 0.4 8.7
Dryland agriculture 24% 81.1 6.6 74.6 2.1 13.7
Forest 24% 81.1 1.5 79.7 0.9 1.3
Streambank erosion 22% 74.4 5.9 68.4 0.4 2.4
Point Sources 3% 10.1 2.5 7.6 0.4 1.1
Other 11% 37.2 0 37.2 0
Total 100% 338 36.5 301.5 27.2
Cost
$mCost $m/tSource
Load
removed
Remaining
Load (t/yr)
P Load
(t/yr)
P Load
(%)
P load before and after implementing BMPs
0
50
100
150
200
250
300
350
400
Before BMPs After BMPs
P L
oad
(t/
yr)
Other Point Sources Streambank erosion
Forest Dryland agriculture MID - irrigated dairy
Priority nutrient reduction activities for the Gippsland Lakes and catchments
Peter Cottingham & Associates
15
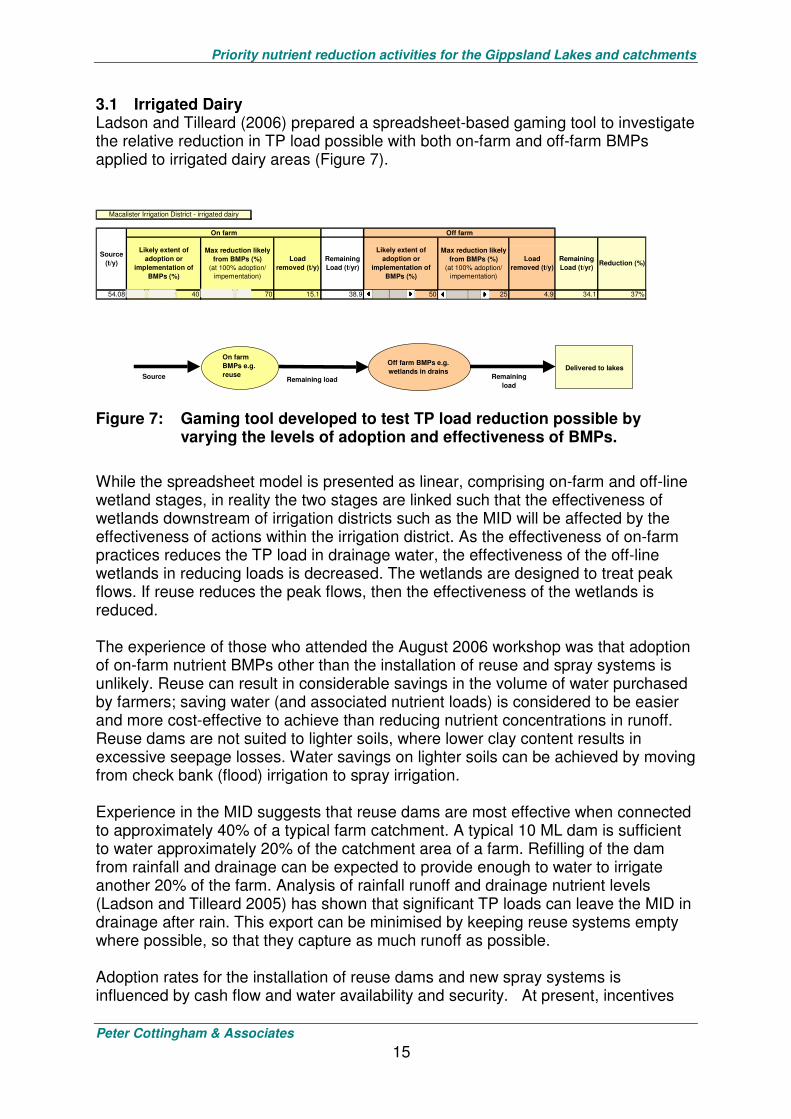
3.1 Irrigated Dairy Ladson and Tilleard (2006) prepared a spreadsheet-based gaming tool to investigate the relative reduction in TP load possible with both on-farm and off-farm BMPs applied to irrigated dairy areas (Figure 7).
Figure 7: Gaming tool developed to test TP load reduction possible by varying the levels of adoption and effectiveness of BMPs.
While the spreadsheet model is presented as linear, comprising on-farm and off-line wetland stages, in reality the two stages are linked such that the effectiveness of wetlands downstream of irrigation districts such as the MID will be affected by the effectiveness of actions within the irrigation district. As the effectiveness of on-farm practices reduces the TP load in drainage water, the effectiveness of the off-line wetlands in reducing loads is decreased. The wetlands are designed to treat peak flows. If reuse reduces the peak flows, then the effectiveness of the wetlands is reduced. The experience of those who attended the August 2006 workshop was that adoption of on-farm nutrient BMPs other than the installation of reuse and spray systems is unlikely. Reuse can result in considerable savings in the volume of water purchased by farmers; saving water (and associated nutrient loads) is considered to be easier and more cost-effective to achieve than reducing nutrient concentrations in runoff. Reuse dams are not suited to lighter soils, where lower clay content results in excessive seepage losses. Water savings on lighter soils can be achieved by moving from check bank (flood) irrigation to spray irrigation. Experience in the MID suggests that reuse dams are most effective when connected to approximately 40% of a typical farm catchment. A typical 10 ML dam is sufficient to water approximately 20% of the catchment area of a farm. Refilling of the dam from rainfall and drainage can be expected to provide enough to water to irrigate another 20% of the farm. Analysis of rainfall runoff and drainage nutrient levels (Ladson and Tilleard 2005) has shown that significant TP loads can leave the MID in drainage after rain. This export can be minimised by keeping reuse systems empty where possible, so that they capture as much runoff as possible. Adoption rates for the installation of reuse dams and new spray systems is influenced by cash flow and water availability and security. At present, incentives
54.08 40 70 15.1 38.9 50 25 4.9 34.1 37%
Reduction (%)
Likely extent of
adoption or
implementation of
BMPs (%)
Max reduction likely
from BMPs (%)
(at 100% adoption/
impementation)
Load
removed (t/y)
Remaining
Load (t/yr)
Macalister Irrigation District - irrigated dairy
Source
(t/y)
On farm Off farm
Likely extent of
adoption or
implementation of
BMPs (%)
Max reduction likely
from BMPs (%)
(at 100% adoption/
impementation)
Load
removed (t/y)
Remaining
Load (t/yr)
Source
On farm
BMPs e.g.
reuse
Off farm BMPs e.g.
wetlands in drainsRemaining
loadRemaining load
Delivered to lakes

Priority nutrient reduction activities for the Gippsland Lakes and catchments
Peter Cottingham & Associates
16
cover approximately 42% and 12% of the costs to install new reuse and sprinkler systems, respectively. Such systems have been expanded over the last 7 years to cover approximately 10% of the MID (4000 ha to reuse, 2000 ha to sprinkler). Adoption rates of 40-45% over 10 years might be expected assuming: • Water availability is normal, • Milk prices and farm outlook remains the same, • Water prices remain the same, • Incentive rates remain the same, • Implementation costs (e.g. infrastructure, electricity) remain the same, • Technology remains the same, • Generational change continues at the same rate. Those attending the August 2006 workshop recognised that dairy effluent contributes to the nutrient loads leaving the MID. However, it was considered that this issue is best dealt with via extension work and EPA regulation and policing.
When applied to the MID the spreadsheet gaming tool suggested that on-farm reuse and conversion to spray systems in combination with downstream wetlands was likely to reduced the TP load entering the Lakes by 5-6%.
3.2 Dryland agriculture (grazing/pasture) The diffuse nature of nutrient export from dryland agricultural land means there are limited opportunities for applying BMPs to obtain large reductions in TP loads with existing technology and management. The main BMPs available are: • Managing dissolved sources (e.g. fertiliser application and timing, stock access to
waterways), • Managing hillslopes in poor condition (e.g. maintenance of ground cover, fencing
off and managing riparian zones, post wild-fire management), and • Managing gully erosion (structural works, stock exclusion, revegetation). Those attending the August 2006 workshop estimated that a 30-40% adoption rate for dryland BMPs, perhaps reaching 60% if there was no cost penalty to the farmer. It was also recognised that continued effort in education is needed to alert farmers to current BMPs; extension activities will be required in addition to BMPs.
Application of typical effectiveness and adoption rates to the spreadsheet gaming tool suggested that dryland agriculture BMPs could reduce TP export from this source by 8% and P load to the Lakes by approximately 2%.
3.3 Forest As for dryland grazing and agriculture, the diffuse nature of nutrient export from forested lands and the fact that much of it is naturally occurring means that there are a limited number of BMPs that can easily achieve large reductions in TP load. The

Priority nutrient reduction activities for the Gippsland Lakes and catchments
Peter Cottingham & Associates
17
main emphasis of BMPs in forested areas is on managing roads, particularly after fires. Because of different soil types, there is a large variability in the erodability of soils across the Gippsland catchments (Sheridan 2003 and Sheridan and Noske 2005). The main focus of BMPs in forest areas is on road-crossings, as these are discrete points that are relatively easy to access. BMP for managing road-crossing involves adding a culvert and drain to divert road runoff to the forest floor. It is estimated that these works can reduce TSS and TP load by up to 80%, assuming there is a 20m buffer between end of the drain and the nearby stream. Cost will be approximately $1500-2000 per crossing.
It was estimated at the August 2006 workshop that treating the worst 10% of crossings could be expected to reduce TP load from this source by up to 50% and reduce TP load to the Lakes by approximately 1.3 t per year. This would result in a reduction of the load from this source by 2%, or 0.4% of the load to the Lakes.
While this is a moderate reduction compared with some other sources, this work can complement other stream rehabilitation works (e.g. stream erosion control), is relatively easy to apply, and should be mandatory for all new road crossings. Management of roads and road-crossings after major bushfires is also important. The practice of giving priority to managing and repairing roads quickly after wildfire should continue.
There is little or no data available on the effectiveness of BMPs on private forest plantations. In the absence of any detailed information, those at the August 2006 workshop estimated that requiring the Forest Code of Practice on private plantations had the potential to achieve small to moderate reductions in TP load of approximately 1 t/yr, which is approximately 0.3% of the load to the Lakes.
Controlled burning may also be considered as a BMP in the future, and requires further investigation. While runoff after controlled burns is likely to increase sediment and nutrient loads delivered to nearby waterways, this is likely to be less than would result after wildfire. BMPs would require maintaining buffer strips, as in Forest Codes of Practice. 3.4 Stream erosion Ladson and Tilleard (2005, 2006) considered stream bed and bank erosion separately from other sources based on land use, as it can be managed discretely from other land uses. The BMPs proposed for stream erosion are similar to that of dryland agriculture, requiring a combination of stock exclusion, riparian revegetation and physical works.
Priority nutrient reduction activities for the Gippsland Lakes and catchments
Peter Cottingham & Associates
18
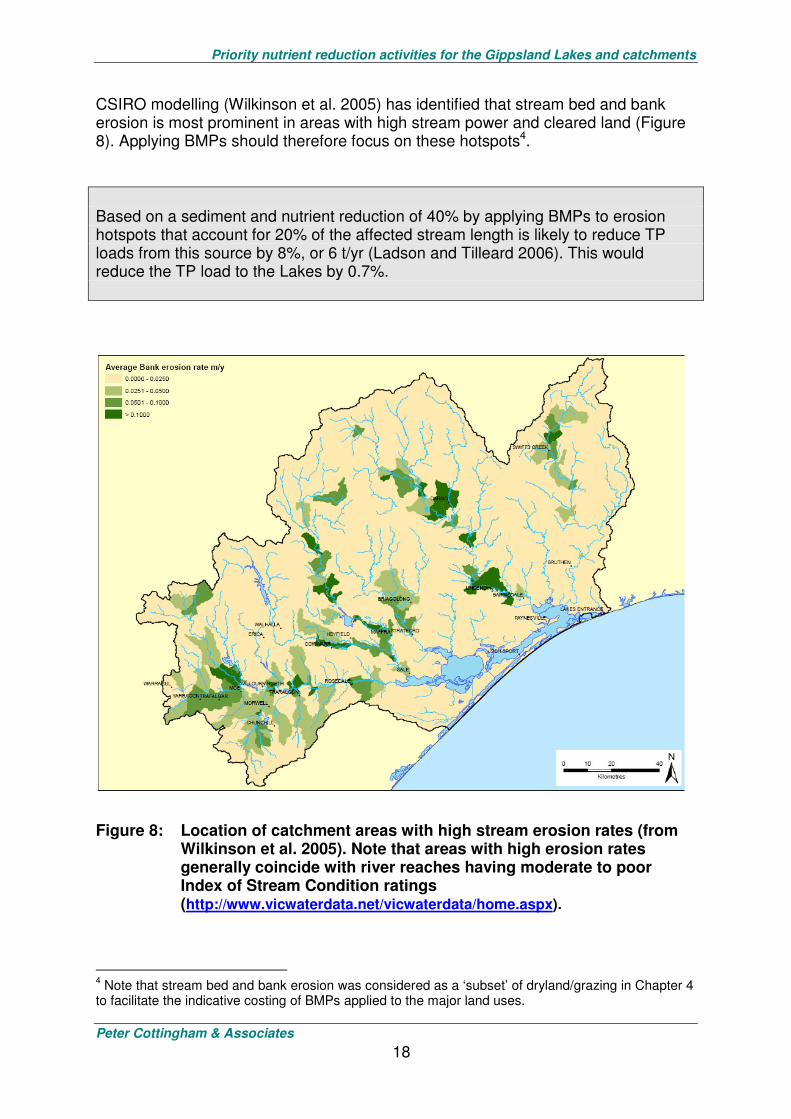
CSIRO modelling (Wilkinson et al. 2005) has identified that stream bed and bank erosion is most prominent in areas with high stream power and cleared land (Figure 8). Applying BMPs should therefore focus on these hotspots4.
Based on a sediment and nutrient reduction of 40% by applying BMPs to erosion hotspots that account for 20% of the affected stream length is likely to reduce TP loads from this source by 8%, or 6 t/yr (Ladson and Tilleard 2006). This would reduce the TP load to the Lakes by 0.7%.
Figure 8: Location of catchment areas with high stream erosion rates (from Wilkinson et al. 2005). Note that areas with high erosion rates generally coincide with river reaches having moderate to poor Index of Stream Condition ratings (http://www.vicwaterdata.net/vicwaterdata/home.aspx).
4 Note that stream bed and bank erosion was considered as a ‘subset’ of dryland/grazing in Chapter 4
to facilitate the indicative costing of BMPs applied to the major land uses.

Priority nutrient reduction activities for the Gippsland Lakes and catchments
Peter Cottingham & Associates
19
3.5 Point sources There has been much attention paid to reducing nutrients discharged from point sources such as sewage treatment plants and industry in the last decade. Those who attended the August 2006 workshop were uncertain about the extent to which remaining point sources can be reduced; this is an area requiring further investigation.
In the absence of further knowledge, a 50% reduction from 50% of remaining sources was considered as a reasonable estimate. This would reduce TP load entering the Lakes by 2.5 t/yr or 0.7% of total load to the Lakes.
3.6 Horticulture Horticulture was not considered in detail at the August 2006 workshop because it was considered to be a relatively minor source of nutrients compared with other land uses. However, there are sub-catchments where horticulture is expected to be a significant local contributor (eg. Lower Mitchell).
Advice from DPI is that BMPs for horticulture are likely to reduce TP load by up to 10%, with 80% adoption rate (8% reduction). This would reduce TP load entering the Lakes by less than 1%.
3.7 Summary of BMP effectiveness in reducing TP loads to the Gippsland
Lakes Use of the gaming tool was very effective in synthesising existing information and expert opinion and then assessing the likely effectiveness of BMPs across the study area. However, as pointed out by Grayson (2006) and Ladson and Tilleard (2006), both nutrient loads and the effectiveness of BMPs are likely to vary in time and space in response to factors such as climatic and economic conditions, river and catchment condition and management practices. While based on best available information at the time, the estimates of average BMP effectiveness (Table 5) are considered indicative only. The results suggest that application of BMPs are likely to reduce the phosphorus load entering the Lakes by approximately 11% (range 8-18%) or 37 t/year (Note that this estimate is before update of the sources as presented in the previous chapter and some refinements presented in the next Chapter.) The findings presented below were used in exploring the most effective BMPs in catchments and sub-catchments from across the study area.

Priority nutrient reduction activities for the Gippsland Lakes and catchments
Peter Cottingham & Associates
20
Table 5: Summary of phosphorus removal with the adoption of BMPs (from Ladson and Tilleard 2006)
P load removed at Lakes
Class of BMP
Average P load to
Lakes (%)
Maximum reduction likely from BMPs at
full adoption or implementation
(%)
Likely extent of adoption
or implementation of BMPs
(%)* (t/y)
% of source
% of load to Lakes
Irrigated Dairy
• On farm 70 40 15.1
• Off farm 25 50 4.9 Total 16 20 37% 6%
Dryland Agriculture • Dissolved P 5 60 1.7
• Hillslope 50 40 4.0
• Gully 50 30 0.9 Total 24 6.6 8% 2%
Forest • Roads 80 10 0.3
• Plantations 10 100 1.2
• Other 0 0 0 Total 24 1.5 2% 0.4%
Streambank 22 40 20 5.9 8% 1.7%
Point Sources 3 50 50 2.5 25% 0.7%
Other 11 0 0 0
TOTAL
36.5
11%
*Further adoption from existing levels

Priority nutrient reduction activities for the Gippsland Lakes and catchments
Peter Cottingham & Associates
21
4 PRIORITY NUTRIENT REDUCTION ACTIVITIES
Application of BMPs described in the previous chapter to the land uses applied to the catchments is likely to reduce the average annual TP load reaching the Gippsland Lakes by approximately 14%, or 49 t/yr. While this is slightly higher than the average reported by Ladson and Tilleard (2006), it is still within the range of 6 -18% reduction they expected given the variability of factors and assumptions that go into such estimates. The higher load reduction reported here is because: • BMPs were applied to all land uses, regardless of the relative size of the nutrient
load reduction (i.e. no matter how small), • More recent studies by Grayson (2006) suggest that the TP load leaving the MID
is significantly higher than the 55 t/yr used by (Ladson and Tilleard (2006). A key finding from the work undertaken and the consensus from the August 2006 workshop was that while sediment and nutrient loads entering the Lakes could be reduced significantly, achieving the 40% reduction in TP load identified in the Actions
Plan was not achievable with current technology and land use. However, this does not eliminate the need to reduce nutrient loading to the Lakes. The Gippsland Lakes Environmental Study (Webster et al. 2001) found that small decreases in nutrient loads may lead to proportional decreases in chlorophyll concentration but disproportionate increases in bottom oxygen due to non-linear feedbacks in the modelled nutrient and carbon cycles. Thus, there are still environmental benefits to the Lakes in reducing catchment sediment and nutrient loads, even if the target 40% reduction is not achieved. Ladson and Tilleard (2006) attempted to arrive at some indicative costs for implementing BMPs by averaging the costs for similar BMPs used by a range of other authors. They concluded that average costs for a BMP were likely to misleading at the scale they were using for their study. They also found that cost effectiveness of BMPs was so variable that it could only be applied meaningfully at a finer level of resolution than their study. The average costs summarised by Ladson and Tilleard are presented in Table 6. It is emphasised that these costs are averages only – averaged across widely disparate cost estimates – and BMP costs are likely to vary significantly across the study area. The costs are assumed to be those required if investments are publicly funded.
Table 6: Indicative costs for applying BMPs across the study area (from Ladson and Tilleard 2006). Note that in the absence of other information, costs for horticulture BMPs were assumed to be the same as other irrigation areas.
Source Cost (Annual $/kg TP)
Irrigation 400
Grazing/agriculture 2100
Forest industries and public land
900
Streambank erosion 400
Point Sources 450
Horticulture 450

Priority nutrient reduction activities for the Gippsland Lakes and catchments
Peter Cottingham & Associates
22
Indicative TP load reductions and associated costs (Table 7) were determined for those BMPs that could reduce TP load from each land use in each sub-catchment by 0.1 t/yr or greater. This breakdown is summarised for the Western and Eastern sub-catchments in Figure 9 and Figure 10. Note that BMP for streambank erosion was considered as a subset of the BMPs for dryland/grazing to facilitate costing based on the major land uses described in Chapter 2. The discrete nature of stream bank erosion means that applying BMPs may be more cost-effective in reducing sediment and nutrient loads than widespread application of BMPs to dryland agriculture. By ignoring minor sources (those reducing TP by less than 0.1 t/yr), BMPs can reduce the average TP load entering the Lakes by approximately 39 t/yr at an indicative cost of $37 million. The ranking in Table 7 suggest that investments in the western catchments and the Lower Mitchell are likely to achieve the greatest return in terms of load reduction to the Lakes. However, to assist the Task Force in considering where it might place its next round of investments, the nutrient load reductions and indicative costs are expanded in the following two figures (Figure 11 and Figure 12). Figure 11 presents the accumulated load reduction and costs associated with implementing the BMPs ranging from the biggest to least reduction in loads from any sub-catchment. Figure 12 presents accumulated TP load reduction and costs with the implementation of the BMPs ranging from the most to least cost-effective in terms of $/kg TP removed. These graphs can be used to consider the likely returns (e.g. t/yr reduced) for any given level of investment.
Table 7: Ranking of sub-catchments in terms of potential load reductions with the application of BMPs.
Catchment Reduction Ranking Load reduction (t/yr) Cost ($ million)
Lower Latrobe 14.1 $ 9.2
Lower Thomson/Macalister 10.6 $ 6.1
Latrobe tributaries 3.3 $ 5.5
Avon/Perry 3.2 $ 2.6
Lower Mitchell 2.2 $ 3.9
Upper Tambo 1.6 $ 3.0
Upper Latrobe and Tanjil 1.4 $ 2.2
Upper Mitchell 1.1 $ 1.8
Proximal to the Lakes 0.9 $ 1.7
Lower Tambo 0.4 $ 0.7
Nicholson 0.1 $ 0.3
Upper Macalister 0.1 $ 0.1
Upper Thomson 0.0 $ 0.0
Total 39.1 $ 37.4

Priority nutrient reduction activities for the Gippsland Lakes and catchments
Peter Cottingham & Associates
23
Figure 9: Major TP load reduction with BMPs in each of the Western sub-catchments.
Upper Latrobe and Tanjil – TP load (t/yr)Grazing/pasture = 12.0 Grazing/pasture with BMPs = 11.0
Point sources = 1.7 Point sources with BMPs = 1.3
Decrease with BMPs = 1.4
Reduction in sub-catchment load = 6%
Indicative cost = $2.22 million
Latrobe tributaries – TP load (t/yr)Grazing/pasture = 30.6 Grazing/pasture with BMPs = 28.1
Point sources = 3.4 Point sources with BMPs = 2.6
Decrease with BMPs = 3.3
Reduction in sub-catchment load = 7%
Indicative cost = $5.55 million
Lower Latrobe and Traralgon – TP load (t/yr)Irrigated = 30.5 Irrigated with BMPs = 19.2
Grazing/pasture = 22.9 Grazing/pasture with BMPs = 21.0
Point sources = 4.0 Point sources with BMPs = 3.0
Decrease with BMPs = 14.1
Reduction in sub-catchment load = 20%
Indicative cost = $9.23 million
Upper Macalister – TP load (t/yr)Grazing/pasture = 0.8 Grazing/pasture with BMPs = 0.8
Decrease with BMPs = <0.1
Reduction in sub-catchment load = 3%
Indicative cost = $0.14 million
Lower Thomson and Macalister - TP load (t/yr)Irrigated = 26.1 Irrigated with BMPs = 16.5
Grazing/pasture = 10.9 Grazing/pasture with BMPs = 10.1
Forest production = 4.0 Forest production with BMPs = 3.9
Decrease with BMPs = 10.6
Reduction in sub-catchment load = 20%
Indicative cost = $6.13 million
Avon and Perry – TP load (t/yr)Irrigated = 6.6 Irrigated with BMPs = 4.2
Grazing/pasture = 9.1 Grazing/pasture with BMPs = 8.4
Decrease with BMPs = 3.2
Reduction in sub-catchment load = 16%
Indicative cost = $2.62 million
Priority nutrient reduction activities for the Gippsland Lakes and catchments
Peter Cottingham & Associates
24
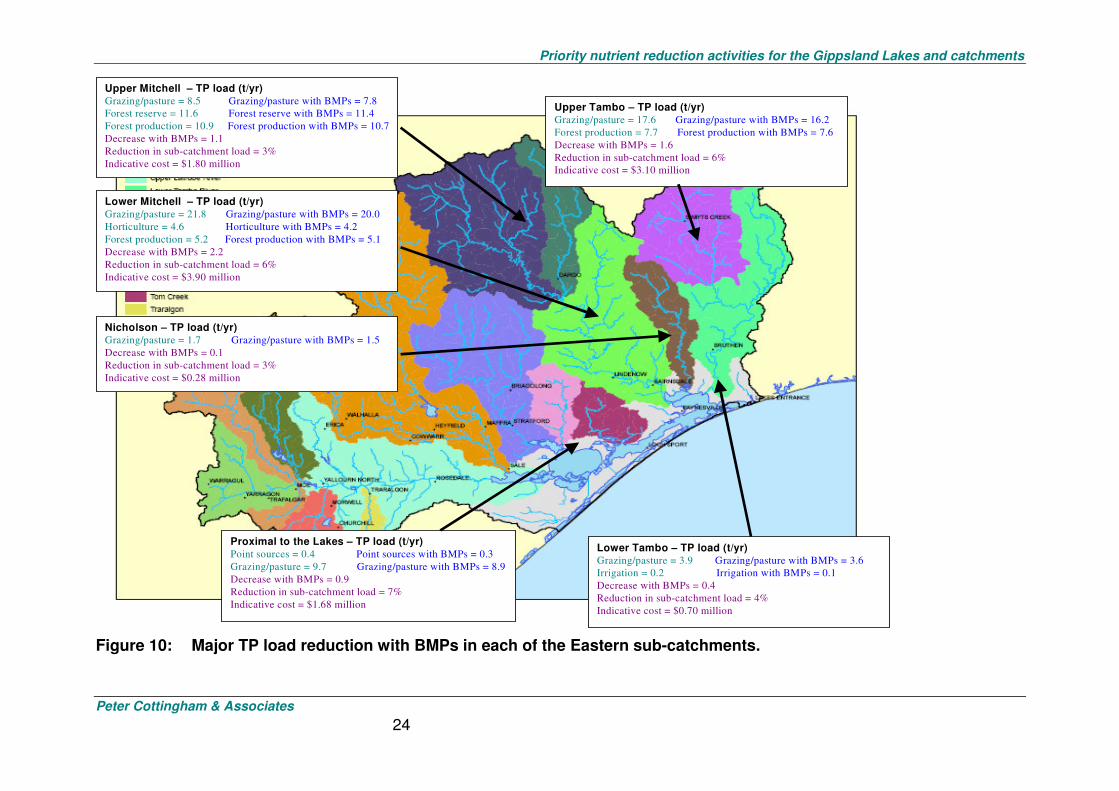
Figure 10: Major TP load reduction with BMPs in each of the Eastern sub-catchments.
Upper Mitchell – TP load (t/yr)Grazing/pasture = 8.5 Grazing/pasture with BMPs = 7.8
Forest reserve = 11.6 Forest reserve with BMPs = 11.4
Forest production = 10.9 Forest production with BMPs = 10.7
Decrease with BMPs = 1.1
Reduction in sub-catchment load = 3%
Indicative cost = $1.80 million
Lower Mitchell – TP load (t/yr)Grazing/pasture = 21.8 Grazing/pasture with BMPs = 20.0
Horticulture = 4.6 Horticulture with BMPs = 4.2
Forest production = 5.2 Forest production with BMPs = 5.1
Decrease with BMPs = 2.2
Reduction in sub-catchment load = 6%
Indicative cost = $3.90 million
Nicholson – TP load (t/yr)Grazing/pasture = 1.7 Grazing/pasture with BMPs = 1.5
Decrease with BMPs = 0.1
Reduction in sub-catchment load = 3%
Indicative cost = $0.28 million
Upper Tambo – TP load (t/yr)Grazing/pasture = 17.6 Grazing/pasture with BMPs = 16.2
Forest production = 7.7 Forest production with BMPs = 7.6
Decrease with BMPs = 1.6
Reduction in sub-catchment load = 6%
Indicative cost = $3.10 million
Lower Tambo – TP load (t/yr)Grazing/pasture = 3.9 Grazing/pasture with BMPs = 3.6
Irrigation = 0.2 Irrigation with BMPs = 0.1
Decrease with BMPs = 0.4
Reduction in sub-catchment load = 4%
Indicative cost = $0.70 million
Proximal to the Lakes – TP load (t/yr)Point sources = 0.4 Point sources with BMPs = 0.3
Grazing/pasture = 9.7 Grazing/pasture with BMPs = 8.9
Decrease with BMPs = 0.9
Reduction in sub-catchment load = 7%
Indicative cost = $1.68 million

Priority nutrient reduction activities for the Gippsland Lakes and catchments
Peter Cottingham & Associates
25
Figure 11: Incremental nutrient load reductions and costs – sub-catchment land uses where BMPs deliver the largest reduction in TP load. I = Irrigated dairy BMPs, P = Point sources BMPs, F = Forest BMPs, D = Dryland agriculture BMPs.
Accumulated TP load reduction and costs when implementing BMPs
0.0
5.0
10.0
15.0
20.0
25.0
30.0
35.0
40.0
45.0
Low
er L
atrobe
- I
Low
er T
hom
son/
Mac
alis
ter -
I
Avo
n/Per
ry -
I
Low
er T
ambo
- I
Low
er M
itche
ll - H
Pxi
mal
to th
e La
kes
-P
Uppe
r Latro
be -
P
Latro
be tr
ibut
arie
s - P
Low
er L
atrobe
- P
Low
er T
hom
son/
Mac
alis
ter -
F
Uppe
r Mitc
hell
- F
Low
er M
itche
ll - F
Uppe
r Tam
bo -
F
Pxi
mal
to th
e La
kes
- D
Uppe
r Latro
be -
D
Latro
be tr
ibut
arie
s - D
Low
er L
atrobe
- D
Uppe
r Mac
alis
ter -
D
Low
er T
hom
son/
Mac
alis
ter -
D
Avo
n/Per
ry -
D
Uppe
r Mitc
hell
- D
Low
er M
itche
ll - D
Nic
hols
on -
D
Uppe
r Tam
bo -
D
Low
er T
ambo
- D
Sub-catchment
TP
lo
ad
(t/
yr)
-
5.0
10.0
15.0
20.0
25.0
30.0
35.0
40.0
45.0
Co
st
($ m
illi
on
)
Accumulated TP load reduction
Accumulated Cost

Priority nutrient reduction activities for the Gippsland Lakes and catchments
Peter Cottingham & Associates
26
Accumulated TP load reduction and costs for implementing BMPs
0.0
5.0
10.0
15.0
20.0
25.0
30.0
35.0
40.0
45.0
Low
er L
atrobe
- I
Low
er T
hom
son/
Mac
alis
ter -
I
Avo
n/Per
ry -
I
Latro
be tr
ibut
arie
s - D
Low
er L
atrobe
- D
Low
er M
itche
ll - D
Uppe
r Tam
bo -
D
Low
er L
atrobe
- P
Uppe
r Latro
be -
D
Low
er T
hom
son/
Mac
alis
ter -
D
Latro
be tr
ibut
arie
s - P
Pxi
mal
to th
e La
kes
- D
Avo
n/Per
ry -
D
Uppe
r Mitc
hell
- D
Uppe
r Latro
be -
P
Uppe
r Mitc
hell
- F
Low
er M
itche
ll - H
Low
er T
ambo
- D
Uppe
r Tam
bo -
F
Nic
hols
on -
D
Low
er M
itche
ll - F
Pxi
mal
to th
e La
kes
- I
Low
er T
ambo
- I
Low
er T
hom
son/
Mac
alis
ter -
F
Uppe
r Mac
alis
ter -
D
Sub-catchment
TP
Lo
ad
(t/
yr)
0.0
5.0
10.0
15.0
20.0
25.0
30.0
35.0
40.0
Co
st
($m
illi
on
)
Accumulated TP load reduction
Accumulated Cost
Figure 12: Incremental nutrient load reductions and costs – ranked in terms of highest to lowest costs-effectiveness ($/kg TP) BMPs. I = Irrigated dairy BMPs, P = Point sources BMPs, F = Forest BMPs, D = Dryland agriculture BMPs.

Priority nutrient reduction activities for the Gippsland Lakes and catchments
Peter Cottingham & Associates
27
4.1 Summary of priorities The preceding discussion highlights that the greatest gains in terms of reducing nutrient loads to the Lakes will be achieved by applying the most cost-effective BMPs to the sub-catchments contributing the greatest proportional load. Highest priority (Figure 13) should therefore go to applying BMPs to: • Irrigation areas in the western catchments that contain the Macalister Irrigation
District (MID), • Point sources in the Western sub-catchments, and then • Streambank erosion hotspots in dryland/ areas in the Western sub-catchments
and in the Lower Mitchell and Upper Tambo. With the exception of point sources in the Latrobe Tributaries and Lower Latrobe, BMPs applied to all the above sources are estimated to reduce TP load to the Lakes by 1.0 t/yr per year or more. Applying BMPs to dryland/grazing areas and forest areas carries the largest cost in terms of $/kg TP removed. To maximise the benefits, priority should be given to applying BMPs to dryland/grazing areas that coincide with areas affected by high rates of stream bank erosion. Identifying areas with the highest stream erosion rates requires further consideration but, along with investigations of new or better-targeted BMPs for dryland areas, will help to identify dryland areas most amenable to management at the lowest possible cost. In general, the relative importance of stream bank erosion is higher for the eastern catchments (e.g. Lower Mitchell) than in the Western catchments where hillslope and dissolved sources dominate. SedNet modelling (Wilkinson et al. 2005) also suggested that erosion rates are relatively high in the Wannangatta and Dargo sub-catchments. Additional ground-truthing is required to confirm the extent of erosion in these areas, and their contribution to sediment and nutrient loads reaching the Lakes. Indicative investments in BMPs are in the tens of millions of dollars, which is likely to be beyond the immediate resources available to the Task Force. It is recommended that the Task Force explore in finer detail the variability in costs associated with applying BMPs at specific locations across the study area. This will be aided by the identification of specific locations that are best suited to the application of BMPs, along with site-specific factors that contribute to the adoption and effectiveness of BMPs. An important consideration for future investments is that of the potential for diminishing returns as BMPs are implemented, as implied by Figure 12. Deploying BMPs to the most cost-effective areas means that remaining applications become increasingly expensive. Further economic evaluation is recommended to identify where the marginal return as the most cost-effective BMPs are deployed declines to that of the next most cost-effective BMP, and so on till our target was reached. In summary, it is recommended that the next round of funding focus on: • Applying existing BMPs to the priority nutrient sources of irrigated land in the
MID, point sources in the Western sub-catchments and hotspots of stream bank erosion in the Western sub-catchments and the Lower Mitchell and Upper Tambo.
Priority nutrient reduction activities for the Gippsland Lakes and catchments
Peter Cottingham & Associates
28
• Review the relative contribution of stream erosion in the Upper Mitchell sub-catchment to sediment and nutrient loads, and their contribution to the Lakes.
• Investigating in greater detail the costs of applying BMPs to specific locations, starting with the priority areas identified above, and factors that may promote or constrain the effectiveness or adoption of BMPs at specific locations.
• Review any emerging technologies that may lead to new BMPs, particularly those that may be applied to diffuse sources such as dryland/grazing and forest land uses.
• An economic study to evaluate marginal returns and the cost-effectiveness of increasing levels of adoption of BMPs.

Priority nutrient reduction activities for the Gippsland Lakes and catchments
Peter Cottingham & Associates
29
Highest Priority
MID that spans the Lower Latrobe,
Lower Thomson/Macalister and
Avon/Perry
High Priority
Point sources in the Latrobe sub-
catchments
High Priority
Stream erosion in the Western
catchments, Lower Mitchell and Upper
Tambo
Figure 13: Location of priority areas for applying BMPs.

Priority nutrient reduction activities for the Gippsland Lakes and catchments
Peter Cottingham & Associates
30
5 REFERENCES
Grayson R. (2006). Prioritising nutrient reduction for the Gippsland Lakes and catchments. Part 1 – Loads and sources. Catchment to Seas Pty Ltd report to the Gippsland Lakes Task Force. Grigg N., Webster I., Parslow P. and Sakov P. (2004). Sensitivity analysis of the CSIRO model for the Gippsland Lakes. CSIRO. Harris G., Batley G., Webster I., Molloy R. and Fox D. (1998). Gippsland Lakes Environmental Audit: review of water quality and status of the aquatic ecosystems of the Gippsland Lakes. CSIRO. Ladson T. and Tilleard J. (2006). BMPs for reducing phosphorus loads to the Gippsland Lakes: working Paper to the Gippsland Lakes Task Force. Monash University and Moroka Pty Ltd. Malcolm D. (2002). The Gippsland Lakes Environmental Study – Showcasing Partnership and Science. Proceedings of the Coast to Coast 2002 conference, pp. 276-280. Oliver R., Hart B., Olley J., Grace M., Rees G. and Caitcheon G. (1999). The Darling River: algal growth and the cycling and sources of nutrients. CRCFE and CSIRO report to the Murray Darling Basin Commission. Webster I., Parslow J., Grayson R., Molloy R., Andrewartha J., Sakov P., Kim S. T., Walker S. and Wallace B. (2001). Gippsland Lakes Environmental Study – Assessing options for improving water quality and ecological function. CSIRO Glen Osmond, South Australia. Wilkinson S., Hancock G., Read A. and Davey, B., (2005). Sources of sediment and nutrients to the Gippsland Lakes: Preliminary modelling results. CSIRO Land and Water Client Report.

Priority nutrient reduction activities for the Gippsland Lakes and catchments
Peter Cottingham & Associates
31
Appendix 1: Attendees at the BMP workshop (29th August 2006) Chris Barry Gippsland Coastal Board Jane Branson URS Pty Ltd Paul Byrnes Southern Rural Water Peter Cottingham Peter Cottingham & Associates Jodie Halliwell East and West Gippsland CMA Barry Hart Monash University Anna Kelliher Rendell McGuckian Tony Ladson Monash University Gavan Lamb DPI, Maffra David Nash DPI, Ellinbank Gary Sheridan University of Melbourne Ken Slee DPI, Maffra John Tilleard Moroka Pty Ltd Scott Wilkinson CSIRO

Priority nutrient reduction activities for the Gippsland Lakes and catchments
Peter Cottingham & Associates
32
Appendix 2: TSS, TP and TN from land uses in each sub-catchment

Priority nutrient reduction activities for the Gippsland Lakes and catchments
Peter Cottingham & Associates
33
Upper Latrobe - TSS (24,800 T/yr total)
5%
21%
1%
59%
6%2%0% 2%0%
0%
4%Forest-Reserve (7.8% of catchment area)
Forest - Prod (56.1% of catchment area)
Forest - Plant. (2% of catchment area)
Grazing/Pasture (28% of catchment area)
Irrigated (1.4% of catchment area)
Horticulture (2% of catchment area)
Residential (0.3% of catchment area)
Mining (0.1% of catchment area)
Other (2.4% of catchment area)
Point (0% of catchment area)
Road crossings
Upper Latrobe - TP (22 T/yr total)
5%
20%
2%
54%
4%
4%
1%
0%
2%
8% 0% Forest-Reserve (7.8% of catchment area)
Forest - Prod (56.1% of catchment area)
Forest - Plant. (2% of catchment area)
Grazing/Pasture (28% of catchment area)
Irrigated (1.4% of catchment area)
Horticulture (2% of catchment area)
Residential (0.3% of catchment area)
Mining (0.1% of catchment area)
Other (2.4% of catchment area)
Point (0% of catchment area)
Road crossings
Upper Latrobe - TN (200 T/yr total)
6%
52%
2%
32%
2% 2%
0%
2%
2%
0%
0%Forest-Reserve (7.8% of catchment area)
Forest - Prod (56.1% of catchment area)
Forest - Plant. (2% of catchment area)
Grazing/Pasture (28% of catchment area)
Irrigated (1.4% of catchment area)
Horticulture (2% of catchment area)
Residential (0.3% of catchment area)
Mining (0.1% of catchment area)
Other (2.4% of catchment area)
Point (0% of catchment area)
Road crossings
Upper Latrobe - TSS sources
88%
12%
Gully and Bank
Sediment
Hillslope Sediment
Upper Latrobe - TP sources
25%
75% Gully and Bank P
Hillslope and
Dissolved P
Upper Latrobe - TN sources
11%
89% Gully and Bank N
Hillslope andDissolved N
Lower Tambo - TSS (6,100 T/yr total)
4%
52%
0%
38%
2%0%0%0% 0% 3%1%
Forest-Reserve (5.5% of catchment area)
Forest - Prod (65.4% of catchment area)
Forest - Plant. (0% of catchment area)
Grazing/Pasture (27.2% of catchment area)
Irrigated (0.9% of catchment area)
Horticulture (0.1% of catchment area)
Residential (0.1% of catchment area)
Mining (0% of catchment area)
Other (0.8% of catchment area)
Point (0% of catchment area)
Road crossings
Lower Tambo - TP (9 T/yr total)
5%
48%
0%
43%
2%
0%
0%
2%
0%
0%0%
Forest-Reserve (5.5% of catchment area)
Forest - Prod (65.4% of catchment area)
Forest - Plant. (0% of catchment area)
Grazing/Pasture (27.2% of catchment area)
Irrigated (0.9% of catchment area)
Horticulture (0.1% of catchment area)
Residential (0.1% of catchment area)
Mining (0% of catchment area)
Other (0.8% of catchment area)
Point (0% of catchment area)
Road crossings
Lower Tambo - TN (110 T/yr total)
5%
62%
0%
31%
1%
0%
0%
0%
0%
0%1%
Forest-Reserve (5.5% of catchment area)
Forest - Prod (65.4% of catchment area)
Forest - Plant. (0% of catchment area)
Grazing/Pasture (27.2% of catchment area)
Irrigated (0.9% of catchment area)
Horticulture (0.1% of catchment area)
Residential (0.1% of catchment area)
Mining (0% of catchment area)
Other (0.8% of catchment area)
Point (0% of catchment area)
Road crossings
Lower Tambo - TSS sources
56%
44%
Gully and Bank
Sediment
Hillslope Sediment
Lower Tambo - TP sources
30%
70%Gully and Bank P
Hillslope andDissolved P
Lower Tambo - TN sources
10%
90% Gully and Bank N
Hillslope andDissolved N

Priority nutrient reduction activities for the Gippsland Lakes and catchments
Peter Cottingham & Associates
34
Moe/Morwell - TSS (16,700 T/yr total)
3% 1% 7%
69%
2%
2%
1%11%
4%
0%
0%
Forest-Reserve (3.2% of catchment area)
Forest - Prod (2.2% of catchment area)
Forest - Plant. (15.1% of catchment area)
Grazing/Pasture (65.5% of catchment area)
Irrigated (1.2% of catchment area)
Horticulture (2% of catchment area)
Residential (1.4% of catchment area)
Mining (4.9% of catchment area)
Other (4.4% of catchment area)
Point (0% of catchment area)
Road crossings
Moe/Morwell - TP (45 T/yr total)
3% 2%8%
68%
1%
2%
1%
3%4%
8% 0% Forest-Reserve (3.2% of catchment area)
Forest - Prod (2.2% of catchment area)
Forest - Plant. (15.1% of catchment area)
Grazing/Pasture (65.5% of catchment area)
Irrigated (1.2% of catchment area)
Horticulture (2% of catchment area)
Residential (1.4% of catchment area)
Mining (4.9% of catchment area)
Other (4.4% of catchment area)
Point (0% of catchment area)
Road crossings
Moe/Morwell - TN (200 T/yr total)
3% 2%12%
69%
1%
2% 2% 5% 4%
0%
0%
Forest-Reserve (3.2% of catchment area)
Forest - Prod (2.2% of catchment area)
Forest - Plant. (15.1% of catchment area)
Grazing/Pasture (65.5% of catchment area)
Irrigated (1.2% of catchment area)
Horticulture (2% of catchment area)
Residential (1.4% of catchment area)
Mining (4.9% of catchment area)
Other (4.4% of catchment area)
Point (0% of catchment area)
Road crossings
Moe/Morwell - TSS sources
79%
21%
Gully and Bank
Sediment
Hillslope Sediment
Moe/Morwell - TP sources
7%
93% Gully and Bank P
Hillslope and
Dissolved P
Moe/Morwell - TN sources
7%
93% Gully and Bank N
Hillslope andDissolved N

Priority nutrient reduction activities for the Gippsland Lakes and catchments
Peter Cottingham & Associates
35
Lower Latrobe - TSS (59,500 T/yr total)
8%7%
6%
57%
10%
0%
2%
5%5%
0%
0%
Forest-Reserve (9.3% of catchment area)
Forest - Prod (12.6% of catchment area)
Forest - Plant. (10.8% of catchment area)
Grazing/Pasture (51.5% of catchment area)
Irrigated (5.8% of catchment area)
Horticulture (0.4% of catchment area)
Residential (1% of catchment area)
Mining (4.5% of catchment area)
Other (4.1% of catchment area)
Point (0% of catchment area)
Road crossings
Lower Latrobe - TP (70 T/yr total)
3% 3%5%
33%
43%
0%
1%
3%
3% 6% 0% Forest-Reserve (9.3% of catchment area)
Forest - Prod (12.6% of catchment area)
Forest - Plant. (10.8% of catchment area)
Grazing/Pasture (51.5% of catchment area)
Irrigated (5.8% of catchment area)
Horticulture (0.4% of catchment area)
Residential (1% of catchment area)
Mining (4.5% of catchment area)
Other (4.1% of catchment area)
Point (0% of catchment area)
Road crossings
Lower Latrobe - TN (267 T/yr total)
7%
12%
8%
40%
25%
0%
1%4% 3%
0%
0%
Forest-Reserve (9.3% of catchment area)
Forest - Prod (12.6% of catchment area)
Forest - Plant. (10.8% of catchment area)
Grazing/Pasture (51.5% of catchment area)
Irrigated (5.8% of catchment area)
Horticulture (0.4% of catchment area)
Residential (1% of catchment area)
Mining (4.5% of catchment area)
Other (4.1% of catchment area)
Point (0% of catchment area)
Road crossings
Lower Latrobe - TSS sources
93%
7%
Gully and Bank
Sediment
Hillslope Sediment
Lower Latrobe - TP sources
21%
79% Gully and Bank P
Hillslope and
Dissolved P
Lower Latrobe - TN sources
22%
78% Gully and Bank N
Hillslope andDissolved N

Priority nutrient reduction activities for the Gippsland Lakes and catchments
Peter Cottingham & Associates
36
Upper Thomson - TSS (44 T/yr total)
5%
86%
0%0%0%0%0%1% 4% 0% 4% Forest-Reserve (8.1% of catchment area)
Forest - Prod (82.9% of catchment area)
Forest - Plant. (0% of catchment area)
Grazing/Pasture (0.1% of catchment area)
Irrigated (0% of catchment area)
Horticulture (0% of catchment area)
Residential (0% of catchment area)
Mining (0.8% of catchment area)
Other (8% of catchment area)
Point (0.3% of catchment area)
Road crossings
Upper Thomson - TP (<1 T/yr total)
9%
82%
0%0%0%0%0%1%8%
0% 0%
Forest-Reserve (8.1% of catchment area)
Forest - Prod (82.9% of catchment area)
Forest - Plant. (0% of catchment area)
Grazing/Pasture (0.1% of catchment area)
Irrigated (0% of catchment area)
Horticulture (0% of catchment area)
Residential (0% of catchment area)
Mining (0.8% of catchment area)
Other (8% of catchment area)
Point (0.3% of catchment area)
Road crossings
Upper Thomson - TN (80 T/yr total)
7%
85%
0%0%0%0%0%1% 6%
1% 0%
Forest-Reserve (8.1% of catchment area)
Forest - Prod (82.9% of catchment area)
Forest - Plant. (0% of catchment area)
Grazing/Pasture (0.1% of catchment area)
Irrigated (0% of catchment area)
Horticulture (0% of catchment area)
Residential (0% of catchment area)
Mining (0.8% of catchment area)
Other (8% of catchment area)
Point (0.3% of catchment area)
Road crossings
Upper Thomson - TSS sources
30%
70%Gully and Bank
Sediment
Hillslope Sediment
Upper Thomson - TP sources
17%
83% Gully and Bank P
Hillslope and
Dissolved P
Upper Thomson - TN sources
0%
100% Gully and Bank N
Hillslope and
Dissolved N

Priority nutrient reduction activities for the Gippsland Lakes and catchments
Peter Cottingham & Associates
37
Upper Macalister - TSS (3,700 T/yr total)
33%
24%0%
41%
0%
0%
0%
0%
0%
1%1%
Forest-Reserve (48.9% of catchment area)
Forest - Prod (25.3% of catchment area)
Forest - Plant. (0.1% of catchment area)
Grazing/Pasture (24.2% of catchment area)
Irrigated (0% of catchment area)
Horticulture (0% of catchment area)
Resident ial (0% of catchment area)
Mining (0% of catchment area)
Other (1.3% of catchment area)
Point (0% of catchment area)
Road crossings
Upper Macalister - TP (2 T/yr total)
33%
25%0%
41%
0%
0%
0%
1%
0%
0%
0%
Forest-Reserve (48.9% of catchment area)
Forest - Prod (25.3% of catchment area)
Forest - Plant. (0.1% of catchment area)
Grazing/Pasture (24.2% of catchment area)
Irrigated (0% of catchment area)
Horticulture (0% of catchment area)
Resident ial (0% of catchment area)
Mining (0% of catchment area)
Other (1.3% of catchment area)
Point (0% of catchment area)
Road crossings
Upper Macalister - TN (165 T/yr total)
58%20%
0%
21%0%0%0%0%
0%
0%
1%
Forest-Reserve (48.9% of catchment area)
Forest - Prod (25.3% of catchment area)
Forest - Plant. (0.1% of catchment area)
Grazing/Pasture (24.2% of catchment area)
Irrigated (0% of catchment area)
Horticulture (0% of catchment area)
Resident ial (0% of catchment area)
Mining (0% of catchment area)
Other (1.3% of catchment area)
Point (0% of catchment area)
Road crossings
Upper Macalister - TSS sources
90%
10%
Gully and Bank
Sediment
Hillslope Sediment
Upper Macalister - TP sources
79%
21%
Gully and Bank P
Hillslope and
Dissolved P
Upper Macalister - TN sources
5%
95% Gully and Bank N
Hillslope andDissolved N

Priority nutrient reduction activities for the Gippsland Lakes and catchments
Peter Cottingham & Associates
38
Lower Thomson/Macalister - TSS (39,900 T/yr total)
3% 8%0%
33%
47%
1%
1%
0%
6%
0%
1%
Forest-Reserve (7% of catchment area)
Forest - Prod (44.9% of catchment area)
Forest - Plant. (0.3% of catchment area)
Grazing/Pasture (26.4% of catchment area)
Irrigated (17.4% of catchment area)
Horticulture (0.3% of catchment area)
Residential (0.5% of catchment area)
Mining (0.4% of catchment area)
Other (2.7% of catchment area)
Point (0% of catchment area)
Road crossings
Lower Thomson/Macalister - TP (45 T/yr total)
3%9%
0%
24%
58%
1%
1%
0%
4%
0%
0%
Forest-Reserve (7% of catchment area)
Forest - Prod (44.9% of catchment area)
Forest - Plant. (0.3% of catchment area)
Grazing/Pasture (26.4% of catchment area)
Irrigated (17.4% of catchment area)
Horticulture (0.3% of catchment area)
Residential (0.5% of catchment area)
Mining (0.4% of catchment area)
Other (2.7% of catchment area)
Point (0% of catchment area)
Road crossings
Lower Thomson/Macalister - TN (249 T/yr total)
4%
27%
0%
18%
48%
0%
0%
0%
3%
0%
0%
Forest-Reserve (7% of catchment area)
Forest - Prod (44.9% of catchment area)
Forest - Plant. (0.3% of catchment area)
Grazing/Pasture (26.4% of catchment area)
Irrigated (17.4% of catchment area)
Horticulture (0.3% of catchment area)
Residential (0.5% of catchment area)
Mining (0.4% of catchment area)
Other (2.7% of catchment area)
Point (0% of catchment area)
Road crossings
Lower Thomson/Macalister - TSS sources
97%
3%
Gully and BankSediment
Hillslope Sediment
Lower Thomson/Macalister - TP sources
25%
75% Gully and Bank P
Hillslope and
Dissolved P
Lower Thomson/Macalister - TN sources
31%
69%Gully and Bank N
Hillslope andDissolved N

Priority nutrient reduction activities for the Gippsland Lakes and catchments
Peter Cottingham & Associates
39
Avon/Perry - TSS (9,900 T/yr total)
9%
11%
1%
53%
14%
1%
3%
0%
4% 0% 4% Forest-Reserve (21.7% of catchment area)
Forest - Prod (24.4% of catchment area)
Forest - Plant. (3.9% of catchment area)
Grazing/Pasture (42.2% of catchment area)
Irrigated (6% of catchment area)
Horticulture (0.5% of catchment area)
Residential (0.1% of catchment area)
Mining (0.1% of catchment area)
Other (1.1% of catchment area)
Point (0% of catchment area)
Road crossings
Avon/Perry - TP (20 T/yr total)
7%8%
3%
45%
33%
1%
1%
0%
2%
0%
0%
Forest-Reserve (21.7% of catchment area)
Forest - Prod (24.4% of catchment area)
Forest - Plant. (3.9% of catchment area)
Grazing/Pasture (42.2% of catchment area)
Irrigated (6% of catchment area)
Horticulture (0.5% of catchment area)
Residential (0.1% of catchment area)
Mining (0.1% of catchment area)
Other (1.1% of catchment area)
Point (0% of catchment area)
Road crossings
Avon/Perry - TN (130 T/yr total)
20%
20%
2%42%
13%
1%
1%
0%
0%
0%1%Forest-Reserve (21.7% of catchment area)
Forest - Prod (24.4% of catchment area)
Forest - Plant. (3.9% of catchment area)
Grazing/Pasture (42.2% of catchment area)
Irrigated (6% of catchment area)
Horticulture (0.5% of catchment area)
Residential (0.1% of catchment area)
Mining (0.1% of catchment area)
Other (1.1% of catchment area)
Point (0% of catchment area)
Road crossings
Avon/Perry - TSS sources
28%
72% Gully and Bank
Sediment
Hillslope Sediment
Avon/Perry - TP sources
18%
82% Gully and Bank P
Hillslope andDissolved P
Avon/Perry - TN sources
12%
88% Gully and Bank N
Hillslope andDissolved N
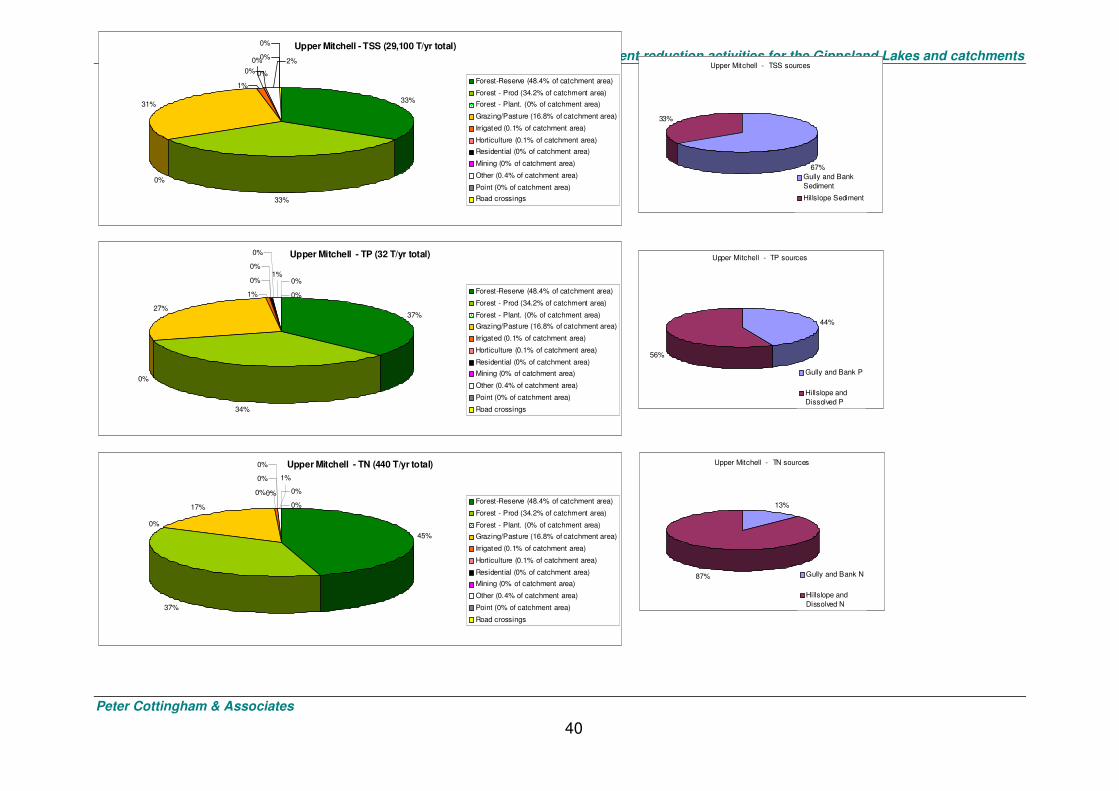
Priority nutrient reduction activities for the Gippsland Lakes and catchments
Peter Cottingham & Associates
40
Upper Mitchell - TSS (29,100 T/yr total)
33%
33%
0%
31%
1%
0%
0%
0%
0%
0% 2%
Forest-Reserve (48.4% of catchment area)
Forest - Prod (34.2% of catchment area)
Forest - Plant. (0% of catchment area)
Grazing/Pasture (16.8% of catchment area)
Irrigated (0.1% of catchment area)
Horticulture (0.1% of catchment area)
Residential (0% of catchment area)
Mining (0% of catchment area)
Other (0.4% of catchment area)
Point (0% of catchment area)
Road crossings
Upper Mitchell - TP (32 T/yr total)
37%
34%
0%
27%
1%
0%
0%
0%
0%
0%
1%
Forest-Reserve (48.4% of catchment area)
Forest - Prod (34.2% of catchment area)
Forest - Plant. (0% of catchment area)
Grazing/Pasture (16.8% of catchment area)
Irrigated (0.1% of catchment area)
Horticulture (0.1% of catchment area)
Residential (0% of catchment area)
Mining (0% of catchment area)
Other (0.4% of catchment area)
Point (0% of catchment area)
Road crossings
Upper Mitchell - TN (440 T/yr total)
45%
37%
0%
17%
0%
0%
0%
0%
0%
0%
1%
Forest-Reserve (48.4% of catchment area)
Forest - Prod (34.2% of catchment area)
Forest - Plant. (0% of catchment area)
Grazing/Pasture (16.8% of catchment area)
Irrigated (0.1% of catchment area)
Horticulture (0.1% of catchment area)
Residential (0% of catchment area)
Mining (0% of catchment area)
Other (0.4% of catchment area)
Point (0% of catchment area)
Road crossings
Upper Mitchell - TSS sources
67%
33%
Gully and Bank
Sediment
Hillslope Sediment
Upper Mitchell - TP sources
44%
56%
Gully and Bank P
Hillslope and
Dissolved P
Upper Mitchell - TN sources
13%
87% Gully and Bank N
Hillslope and
Dissolved N

Priority nutrient reduction activities for the Gippsland Lakes and catchments
Peter Cottingham & Associates
41
Lower Mitchell - TSS (36,400 T/yr total)
11%
15%
0%
54%
0%
14%
1%
0%
4%
0%
1%
Forest-Reserve (7.9% of catchment area)
Forest - Prod (49.1% of catchment area)
Forest - Plant. (0% of catchment area)
Grazing/Pasture (37.9% of catchment area)
Irrigated (0% of catchment area)
Hort iculture (3.3% of catchment area)
Residential (0.4% of catchment area)
Mining (0.1% of catchment area)
Other (1.4% of catchment area)
Point (0% of catchment area)
Road crossings
Lower Mitchell - TP (39 T/yr total)
9%
56%
0%
12%
1%
0%
3%
0%
0%
19%
0%
Forest-Reserve (7.9% of catchment area)
Forest - Prod (49.1% of catchment area)
Forest - Plant. (0% of catchment area)
Grazing/Pasture (37.9% of catchment area)
Irrigated (0% of catchment area)
Horticulture (3.3% of catchment area)
Residential (0.4% of catchment area)
Mining (0.1% of catchment area)
Other (1.4% of catchment area)
Point (0% of catchment area)
Road crossings
Lower Mitchell - TN (240 T/yr total)
9%
34%
0%
47%
0%8%
0%
0%
2%
0%
0%
Forest-Reserve (7.9% of catchment area)
Forest - Prod (49.1% of catchment area)
Forest - Plant. (0% of catchment area)
Grazing/Pasture (37.9% of catchment area)
Irrigated (0% of catchment area)
Hort iculture (3.3% of catchment area)
Residential (0.4% of catchment area)
Mining (0.1% of catchment area)
Other (1.4% of catchment area)
Point (0% of catchment area)
Road crossings
Lower Mitchell - TSS sources
85%
15%
Gully and Bank
Sediment
Hillslope Sediment
Lower Mitchell - TP sources
62%
38%
Gully and Bank P
Hillslope and
Dissolved P
Lower Mitchell - TN sources
40%
60%
Gully and Bank N
Hillslope and
Dissolved N

Priority nutrient reduction activities for the Gippsland Lakes and catchments
Peter Cottingham & Associates
42
Lower Tambo - TSS (6,100 T/yr total)
4%
52%
0%
38%
2%0%0%0% 0% 3%1%
Forest-Reserve (5.5% of catchment area)
Forest - Prod (65.4% of catchment area)
Forest - Plant. (0% of catchment area)
Grazing/Pasture (27.2% of catchment area)
Irrigated (0.9% of catchment area)
Hort iculture (0.1% of catchment area)
Resident ial (0.1% of catchment area)
Mining (0% of catchment area)
Other (0.8% of catchment area)
Point (0% of catchment area)
Road crossings
Lower Tambo - TP (9 T/yr total)
5%
48%
0%
43%
2%
0%
0%
2%
0%
0%0%
Forest-Reserve (5.5% of catchment area)
Forest - Prod (65.4% of catchment area)
Forest - Plant. (0% of catchment area)
Grazing/Pasture (27.2% of catchment area)
Irrigated (0.9% of catchment area)
Hort iculture (0.1% of catchment area)
Resident ial (0.1% of catchment area)
Mining (0% of catchment area)
Other (0.8% of catchment area)
Point (0% of catchment area)
Road crossings
Lower Tambo - TN (110 T/yr total)
5%
62%
0%
31%
1%
0%
0%
0%
0%
0%1%
Forest-Reserve (5.5% of catchment area)
Forest - Prod (65.4% of catchment area)
Forest - Plant. (0% of catchment area)
Grazing/Pasture (27.2% of catchment area)
Irrigated (0.9% of catchment area)
Hort iculture (0.1% of catchment area)
Resident ial (0.1% of catchment area)
Mining (0% of catchment area)
Other (0.8% of catchment area)
Point (0% of catchment area)
Road crossings
Lower Tambo - TSS sources
56%
44%
Gully and Bank
Sediment
Hillslope Sediment
Lower Tambo - TP sources
30%
70%Gully and Bank P
Hillslope andDissolved P
Lower Tambo - TN sources
10%
90% Gully and Bank N
Hillslope andDissolved N

Priority nutrient reduction activities for the Gippsland Lakes and catchments
Peter Cottingham & Associates
43
Proximal to Lakes - TSS (2400 T/yr total)
16%0%
1%
72%
1%
0%
1%
0%
8%
1% 0%Forest-Reserve (21.5% of catchment area)
Forest - Prod ( 0% of catchment area)
Forest - Plant. (3.9% of catchment area)
Grazing/Pasture (57.2% of catchment area)
Irrigated (1.1% of catchment area)
Horticulture (0.1% of catchment area)
Residential (1.1% of catchment area)
Mining (0% of catchment area)
Other (12.8% of catchment area)
Point (2.3% of catchment area)
Road crossings
Proximal to Lakes - TP (13 T/yr total)
12% 0%
2%
74%
2%
0%
1%
0%
6% 3% 0% Forest-Reserve (21.5% of catchment area)
Forest - Prod ( 0% of catchment area)
Forest - Plant. (3.9% of catchment area)
Grazing/Pasture (57.2% of catchment area)
Irrigated (1.1% of catchment area)
Horticulture (0.1% of catchment area)
Residential (1.1% of catchment area)
Mining (0% of catchment area)
Other (12.8% of catchment area)
Point (2.3% of catchment area)
Road crossings
Proximal to Lakes - TN (66 T/yr total)
16%0%
3%
68%
1%
0%
2%
0%
7% 3% 0% Forest-Reserve (21.5% of catchment area)
Forest - Prod ( 0% of catchment area)
Forest - Plant. (3.9% of catchment area)
Grazing/Pasture (57.2% of catchment area)
Irrigated (1.1% of catchment area)
Hort iculture (0.1% of catchment area)
Resident ial (1.1% of catchment area)
Mining (0% of catchment area)
Other (12.8% of catchment area)
Point (2.3% of catchment area)
Road crossings
Proximity to Lakes - TSS sources
31%
69%Gully and Bank
Sediment
Hillslope Sediment
Proximity to Lakes - TP sources
5%
95% Gully and Bank P
Hillslope and
Dissolved P
Proximity to Lakes - TN sources
4%
96% Gully and Bank N
Hillslope and
Dissolved N
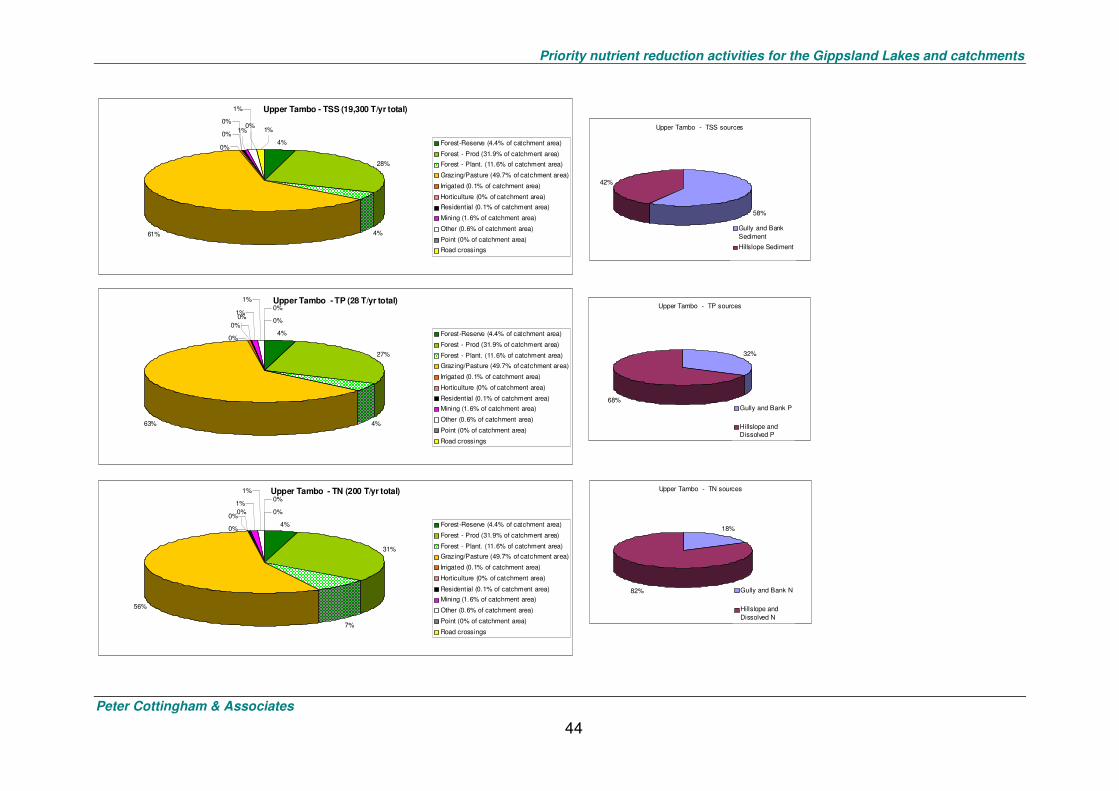
Priority nutrient reduction activities for the Gippsland Lakes and catchments
Peter Cottingham & Associates
44
Upper Tambo - TSS (19,300 T/yr total)
4%
28%
4%61%
0%
0%
0%
1%
0%1%1%
Forest-Reserve (4.4% of catchment area)
Forest - Prod (31.9% of catchment area)
Forest - Plant. (11.6% of catchment area)
Grazing/Pasture (49.7% of catchment area)
Irrigated (0.1% of catchment area)
Horticulture (0% of catchment area)
Residential (0.1% of catchment area)
Mining (1.6% of catchment area)
Other (0.6% of catchment area)
Point (0% of catchment area)
Road crossings
Upper Tambo - TP (28 T/yr total)
4%
27%
4%63%
0%
0%
1%
1%
0%
0%0%
Forest-Reserve (4.4% of catchment area)
Forest - Prod (31.9% of catchment area)
Forest - Plant. (11.6% of catchment area)
Grazing/Pasture (49.7% of catchment area)
Irrigated (0.1% of catchment area)
Horticulture (0% of catchment area)
Residential (0.1% of catchment area)
Mining (1.6% of catchment area)
Other (0.6% of catchment area)
Point (0% of catchment area)
Road crossings
Upper Tambo - TN (200 T/yr total)
4%
31%
7%
56%
0%
0%
1%
1%
0%
0%0%
Forest-Reserve (4.4% of catchment area)
Forest - Prod (31.9% of catchment area)
Forest - Plant. (11.6% of catchment area)
Grazing/Pasture (49.7% of catchment area)
Irrigated (0.1% of catchment area)
Horticulture (0% of catchment area)
Residential (0.1% of catchment area)
Mining (1.6% of catchment area)
Other (0.6% of catchment area)
Point (0% of catchment area)
Road crossings
Upper Tambo - TSS sources
58%
42%
Gully and Bank
Sediment
Hillslope Sediment
Upper Tambo - TP sources
32%
68%Gully and Bank P
Hillslope andDissolved P
Upper Tambo - TN sources
18%
82% Gully and Bank N
Hillslope and
Dissolved N
Priority nutrient reduction activities for the Gippsland Lakes and catchments
Peter Cottingham & Associates
45

Priority nutrient reduction activities for the Gippsland Lakes and catchments
Peter Cottingham & Associates
46
Nicholson - TSS (3,200 T/yr total)
2%
53%
0%
35%
4% 0% 0% 4%
2%0%0%
Forest-Reserve (1.4% of catchment area)
Forest - Prod (81.1% of catchment area)
Forest - Plant. (0% of catchment area)
Grazing/Pasture (14.4% of catchment area)
Irrigated (1.5% of catchment area)
Horticulture (0.1% of catchment area)
Residential (0.1% of catchment area)
Mining (0.4% of catchment area)
Other (1.1% of catchment area)
Point (0% of catchment area)
Road crossings
Nicholson - TP (4 T/yr total)
2%
54%
0%
38%
4%
0%
0%
2%
0%
0%0%
Forest-Reserve (1.4% of catchment area)
Forest - Prod (81.1% of catchment area)
Forest - Plant. (0% of catchment area)
Grazing/Pasture (14.4% of catchment area)
Irrigated (1.5% of catchment area)
Horticulture (0.1% of catchment area)
Residential (0.1% of catchment area)
Mining (0.4% of catchment area)
Other (1.1% of catchment area)
Point (0% of catchment area)
Road crossings
Nicholson - TN (45 T/yr total)
2%
76%
0%
19%
2%
0%
1%0%
0%0%
0%
Forest-Reserve (1.4% of catchment area)
Forest - Prod (81.1% of catchment area)
Forest - Plant. (0% of catchment area)
Grazing/Pasture (14.4% of catchment area)
Irrigated (1.5% of catchment area)
Horticulture (0.1% of catchment area)
Residential (0.1% of catchment area)
Mining (0.4% of catchment area)
Other (1.1% of catchment area)
Point (0% of catchment area)
Road crossings
Nicholson - TSS sources
59%
41%
Gully and Bank
Sediment
Hillslope Sediment
Nicholson - TP sources
35%
65%
Gully and Bank P
Hillslope andDissolved P
Nicholson - TN sources
14%
86% Gully and Bank N
Hillslope and
Dissolved N

Priority nutrient reduction activities for the Gippsland Lakes and catchments
Peter Cottingham & Associates
47