prism economics and analysis - o'grady in continuing professiona… · trends in continuing...
TRANSCRIPT

Engineering and Technology Labour Market Study
Prism Economics and Analysis
Suite 404
160 Eglinton Avenue East
Toronto, ON
M4P 3B5
Tel: (416)-484-6996
Fax: (416)-484-4147
website: www.prismeconomics.com
John O’Grady
Partner, Prism Economics and Analysis
Direct Phone: (416)-652-0456
Direct Fax: (416)-652-3083
Email: [email protected]
website: www.ogrady.on.ca
E c o n o m i c s a n d A n a l y s i s
P R I S M

Trends in Continuing Professional Development
About Engineers Canada
Established in 1936, Engineers Canada is the national organization of the 12 provincial and territorial
associations and ordre that regulate the practice of engineering in Canada and license the country's
more than 160,000 professional engineers. Engineers Canada serves the associations and ordre,
which are its constituent and sole members, by delivering national programs that ensure the highest
standards of engineering education, professional qualifications and professional practice.
About the Canadian Council of Technicians and Technologists
The Canadian Council of Technicians and Technologists (CCTT) establishes and maintains national
competency standards for certifying members with a 'quality seal of approval' in 14 applied science
and engineering technology disciplines: bioscience, industrial, building, instrumentation, chemical,
mechanical, civil, mining, electrical, petroleum, electronics, geomatics, forestry, and information
technology. CCTT's provincial associations are responsible for issuing these highly regarded creden-
tials, which are recognized by provincial statute in many Canadian provinces.

Engineering and Technology Labour Market Study
Engineering and TechnologyLabour Market Study
Trends in Continuing Professional Development
Contents
Executive Summary .................................................................................................................... 1
Trends in Continuing Professional Development ......................................................................... 3
Appendix A: Methodology....................................................................................................... 19
Appendix B: Members of Steering Committee ......................................................................... 24

1 Trends in Continuing Professional Development
Executive Summary
• Continuing professional development is one of the core values associated with the ethic of
professionalism. This view is shared by engineers and engineering technology professionals, as
well as by a significant majority of their employers.
• In Canada, it is increasingly the norm for professional associations in all regulated and certified
fields to have policies that require or expect their members to undertake a minimum amount of
continuing professional development training. Many professional bodies prescribe specific types
of training.
• Throughout the OECD region, professional associations of engineers and technologists have
focused increased attention on continuing professional development, often establishing norms
or requirements.
• In Canada, the majority of engineering licensing bodies have mandatory continuing
development policies. However, licensing authorities in the larger provinces do not have
mandatory policies. At this time, therefore, mandatory policies do not apply to the majority of
professional engineers.
• None of the provincial and territorial associations that certify technologists and technicians has a
mandatory policy for continuing professional development, although three have voluntary
policies, and one association may adopt a mandatory policy.
• Overall, in establishing either requirements or expected norms for continuing professional
development, both the engineering profession and the technology professions, lag somewhat
behind the majority of regulated professions.
• Notwithstanding relatively weaker policies requirements in engineering and technology
professions, participation in continuing professional development is widespread. More than
80% of engineers and engineering technicians and technologists have taken continuing
professional development days over the past three years. Participation in continuing professional
development was evident across all age groups, peaking at approximately age 39 for technologists
and technicians and age 43 for engineers. Non-technical courses were almost as important as
technical courses. The most important non-technical field of study was project management.
• On average, engineers and engineering technicians and technologists reported that they took
about four days of continuing professional development per year. This is less than half the
norm established by those associations that have adopted policies.
• Association policies clearly have an impact on participation in continuing professional
development. In Ontario – where there is no formal policy – engineers reported taking 10.4
days of continuing professional development over the past three years. In provinces where
associations have established requirements for continuing professional development, the
average was 14.1.

Engineering and Technology Labour Market Study 2
• Somewhere between 60% and 75% of engineering and technology employers have policies
that support professional development. Employer support for continuing professional
development is strong in most industries, but weaker than might be expected the
manufacturing sector.
• Participation rates in technical associations are lower than might be expected.
Recommendations:
1. Engineers Canada and the Canadian Council of Technicians and Technologists should update
their past scans of continuing professional development standards for other professions in
Canada and for engineering and technology professions internationally. Based on these updated
scans, the national associations should assess how the Canadian engineering and technology
professions stand in relation to these trends.
2. Engineers Canada and the Canadian Council of Technicians and Technologists should explore
successful models of continuing professional development used by other professions, especially
where those models adopt flexible definitions of eligible continuing professional development
activities. The notion of an individually drafted continuing professional development plan – as
set out by some of the regulatory bodies in the legal profession – may have particular relevance.
In considering the relevance of models used in other professions, the implications of the distinctive
characteristics of engineering and technology career paths should be borne in mind.
3. Engineers Canada and the Canadian Council of Technicians and Technologists should undertake
a systematic examination of employer policies towards continuing professional development.
This study should explore both how association policies should relate to employer policies and
how areas of weakness in employer support for continuing professional development could be
addressed.
4. Efforts should be made to harmonize the continuing professional development norms and
standards of the provincial and territorial associations/ordres.

3 Trends in Continuing Professional Development
Introduction
This report examines trends in Continuing Professional Development for professionals, in general,
and for engineers and for engineering technologists and technicians, in particular.
This study is part of the Engineering and Technology Labour Market Study commissioned by
Engineers Canada and the Canadian Council of Technicians and Technologists, with support from
Human Resources and Skills Development Canada. Additional information on the Engineering and
Technology Labour Market Study is available from the study’s website:
www.engineerscanada.ca/etlms/index.cfm
The findings presented in this study are based on a national survey of engineering and technology
employers (701 respondents), a national survey of engineers, and engineering technicians and tech-
nologists (15,585 respondents), interviews with 41 senior engineering executives, and 5 focus
groups of engineers, and engineering technicians and technologists. A more detailed description of
the methodology is set out in Appendix A.
Continuing Professional Development Trends:
In Canada, it is increasingly common for professional associations in all fields to have policies that
require or expect their members to undertake a minimum amount of continuing professional devel-
opment training throughout their professional careers. Many professional bodies prescribe specific
types of training. The following examples of studies and policies show that policies and standards
for continuing professional development have become the norm in regulated professions:
• A 1999 study of 343 professional regulatory bodies across Canada found that the
majority had continuing professional development policies and that in four out of five of
those professions with policies, continuing professional development is mandatory. The
study also found that 48% of those professions that did not have continuing professional
development policies were planning to introduce such policies.1
• Similar results were reported in a 2002 study for the Ontario College of Teachers. That
study found that a majority of the 37 statutorily regulated professions in the province
had continuing professional development requirements for their members. A 2001 study
of professions in Manitoba concluded that “most professional organizations in the
Province of Manitoba have, or are currently developing, a program of mandatory
professional development.”2
• In Quebec, the legislation providing for the designation and regulation of professions
explicitly confers on regulatory bodies the power to establish requirements and standards
for continuing professional development.
1 Assessment Strategies Inc., Licensure, Certification, and Continuing Competence Practices among Canadian Regulated Professions, March 1999.
2 Report on Trends in Continuing Professional Development, for Manitoba Professional Planners Institute, December 2001.
Trends in Continuing Professional Developement

Engineering and Technology Labour Market Study 4
• The law societies in some provinces expect their members to complete a minimum
number of hours of formal continuing legal education and self-directed study. In B.C.,
these requirements are mandatory. In Alberta and Ontario, the requirements come close
to being mandatory.3
• In all provinces, the institutes/ordres that regulate chartered accountants have formal
requirements for continuing professional development, typically around 120 hours over a
three-year period. Actuaries must undertake 100 hours of continuing professional
development every two years, of which 24 hours must be in structured courses.
• Most of the regulatory bodies for architects have prescribed mandatory requirements for
continuing professional development. These can be as high as 70 hours per year, with a
portion of these hours assigned to specified courses designated and offered through the
regulatory body. In some jurisdictions, mandatory continuing professional development
also applies to architectural technologists. For example, in Ontario, architectural technologists
must complete 35 hours of continuing professional development training per year.
• Virtually every health profession prescribes continuing professional development
requirements to maintain licensure.
Throughout the OECD region, professional associations of engineers and technologists have focused
increased attention on continuing professional development. In both the UK and Japan, for
example, professional associations have established both requirements and standards for continuing
professional development for engineers.4 In the United States, it is common for state registration
boards to make continuing professional development a requirement for maintaining registered status.
In Australia, evidence of participation in continuing professional development is required to maintain
registration as a Chartered Professional Engineer or as a Chartered Engineering Technologist.
In 2004, Engineers Canada adopted a Guideline on Continuing Professional Development and
Continuing Competence for Professional Engineers.5 In that document, Engineers Canada states that:
“Continuing Professional Development encompasses the planned acquisition of
knowledge, experience and skills and the development of personal qualities necessary for
the execution of professional and technical duties throughout an engineer’s professional
life. It encompasses both technical and non-technical skills. CPD is a vital tool for
maintaining and developing the professional competence, innovation and creativity of an
individual engineer.”6
3 The Alberta Law Society requires that members of the bar consider and plan their continuing professional development and evidence this byretaining a copy of their annual plan, making the plan available to the Law Society on request. Members are also required to demonstrate theiradherence to the plan through continuing professional development activities. Non-compliance with this requirement is subject to professionaldiscipline. In Ontario, the ‘expectation’ is 50 hours of self-study and 12 hours (two days) of formally designated Continuing Legal Education.Members of the Law Society of Upper Canada are required to report to the Society on their fulfillment of this expectation.
4 Henri Angelino, “Engineering Education and Professional Development in Germany, France and United Kingdom – Examples for EstablishingContinuing Professional Development of Engineers in Japan,” National Institute of Informatics Journal, No. 6 (2003) pp 81-104.
5 The full document is available at: www.engineerscanada.ca/e/files/guideline_practice_with.pdf
6 Engineers Canada adopted a Guideline on Continuing Professional Development and Continuing Competence for Professional Engineers, p 9.

5 Trends in Continuing Professional Development
At the provincial and territorial level, regulatory bodies for professional engineers and certified
technologists and technicians differ in how they address continuing professional development:
• All associations that regulate engineers and engineering technicians and technologists set
out a general obligation of continuing competence in their codes of professional ethics.
• Most associations/ordres provide continuing professional development training, partner
with colleges and universities to provide this training, or actively bring to their members’
attention opportunities for continuing professional development.
• Some, but not all, of the regulatory bodies have established mandatory continuing
professional development requirements.
Figure Nos. 1a and 1b summarize the current policy situation of the provincial and territorial
regulatory bodies.

Professio
nal
Co
ntin
uin
g Pro
fession
al Develo
pm
ent C
atego
riesC
on
tinu
ing
Develo
pm
ent H
ou
rs Fo
rmal A
ctivity: structu
red co
urses,
Info
rmal A
ctivity: self-directed
stud
y, Pro
vincial/Territo
rialPro
fession
al(PD
Hs)/ C
redits th
at are p
rog
rams o
r semin
ars usu
ally for
jou
rnal read
ing
, semin
ars, con
ferences,
Asso
ciation
Develo
pm
ent
Req
uired
or
credit an
d in
volve an
evaluatio
n
techn
ical field trip
s, trade sh
ow
s, etc.Po
licyR
ecom
men
ded
pro
cess, etc.
Association of Professional Engineers and
Voluntary• A
n average of 30 • M
aximum
claimable: 20 PD
Hs/year
• Maxim
um claim
able: 20 PDH
s/yearG
eoscientists of British Colum
bia (APEG
BC)
PDH
s/year • C
ourses should be at least 4 hours in length.
Association of Professional Engineers,
Mandatory
• 240 PDH
s over 3 years • 1 PD
H/hr and10 PD
Hs/1 C
ontinuing • 1 PD
H/hour
Geologists and G
eophysicists of Alberta
Education Unit.
• Maxim
um claim
able: 30 PDH
s/year(A
PEGG
A)
• Maxim
um claim
able: 30 PDH
s/year
Association of Professional Engineers
Voluntary• N
o minim
um requirem
ents • N
ot specified• N
ot specifiedG
eoscientists of the Province and of M
anitoba (APEG
M)
Association of Professional Engineers and
Mandatory
• 240 PDH
s over 3 years • 1 PD
H/hour and 10 PD
Hs/C
ontinuing• 1 PD
H/2 hours
Geoscientists of N
ew Brunsw
ick (APEG
NB)
Education Unit or 10 PD
Hs/U
niversity• M
aximum
claimable: 30 PD
Hs/year
Credit
•M
aximum
claimable: 30 PD
Hs/year
Association of Professional Engineers and
Mandatory
• 240 credits over 3 years •
1 credit/hour and 10 credits/1 Continuing
• 1 credit/hour G
eoscientists of Saskatchewan (A
PEGS)
• Recomm
ended: 80 Education U
nit.• M
aximum
claimable: 30 credits/ year
PDH
s/year•
Maxim
um claim
able: 30 credits/year
Engineers Nova Scotia
Mandatory
• 240 PDH
s over 3 years•
1 PDH
/1 hour• 1 PD
H/1 hour.
starting 2010• M
inimum
of 60 PDH
s/year•
Maxim
um claim
able: 40 PDH
s/year• M
aximum
claimable: 30 PD
Hs/year
Engineers PEIM
andatory• A
n average of 80 •
1 PDH
/1 hour• 1 PD
H/1hour.
PDH
s/year over 3 years•
Maxim
um claim
able: 30 PDH
s/year• M
aximum
claimable: 30 PD
Hs/year
• Minim
um of 60 PD
Hs/year
Association of Professional Engineers of
Voluntary• 240 PD
Hs over 3 years
•1 PD
H/1 hour
• 1 PDH
/1hour Yukon (A
PEY)
• Recomm
ended: 80 •
Maxim
um claim
able: 30 PDH
s/year• M
aximum
claimable: 30 PD
Hs/year
PDH
s/year
Northw
est Territories and Nunavut G
eoscientists M
andatory• 240 PD
Hs over 3 years
•1 PD
H/hour and 10 PD
H/ 1 C
ontinuing• 1 PD
H/2 hours
Association of Pr ofessional Engineers,
• Recomm
ended: 80 Education U
nit.• M
aximum
claimable: 30 PD
Hs/year
(NA
PEG)
credits/year•
Maxim
um claim
able: 30 PDH
s/ year
Ordre des ingénieurs du Q
uébec (OIQ
)Voluntary
• 30 PDH
s over 2 years• N
ot specified• N
ot specified
Professional Engineers and Geoscientists of
Mandatory
• 240 PDH
s over 3 years• 1 PD
H/1 hour
• 1 PDH
/2 hoursN
ewfoundland and Labrador (PEG
NL)
• Minim
um of 60 PD
Hs/year
• Maxim
um claim
able: 40 PDH
s/year• M
aximum
claimable: 30 PD
Hs/year
Professional Engineers Ontario (PEO
)N
o policy• N
/A• N
/A• N
/A
Engineering and Technology Labour Market Study 6
Figu
re No
. 1aC
ontinuing Professional Developm
ent Policiesof Provincial/Territorial Engineering A
ssociations/Ordres

7 Trends in Continuing Professional Development
Professio
nal
Co
ntin
uin
g Pro
fession
al Develo
pm
ent C
atego
riesC
on
tinu
ing
Develo
pm
ent H
ou
rs Fo
rmal A
ctivity: structu
red co
urses,
Info
rmal A
ctivity: self-directed
stud
y, Pro
vincial/Territo
rialPro
fession
al(PD
Hs)/ C
redits th
at are p
rog
rams o
r semin
ars usu
ally for
jou
rnal read
ing
, semin
ars, con
ferences,
Asso
ciation
Develo
pm
ent
Req
uired
or
credit an
d in
volve an
evaluatio
n
techn
ical field trip
s, trade sh
ow
s, etc.Po
licyR
ecom
men
ded
pro
cess, etc.
The Association for Technology Professionals in
Voluntary• 20 PD
Cs/year
• 10 PDC
s/40 hours or more.
• 2 PDC
s/8 hours or more.
British Colum
bia (ASTTBC
)• 5 PD
Cs for courses less than 40 hours.
• 1 PDC
for less than 8 hours
The Association of Science and Engineering
No policy
N/A
N/A
N/A
Technology Professionals of Alberta (A
SET)
Certified Technicians and Technologists of
No policy
N/A
N/A
N/A
Manitoba (C
TTAM
)
The Ontario A
ssociation of Engineering N
o policyN
/AN
/AN
/ATechnicians and Technologists (O
AC
ETT)
New
Brunswick Society Engineering
Voluntary• 100 PD
Cs/year
• The maxim
um is 30 PD
Cs/year
• The maxim
um is 30 PD
Cs/year
Technicians and Technologists (NBSC
ETT)
TechNova: C
ertified Technology ProfessionalsVoluntary
• 100 PDC
s /year • 1 PD
C/hour. The m
aximum
is 30 PDC
s/year• 1 PD
C/hour. The m
aximum
is 30 PD
Cs/year
Association of C
ertified Engineering Technicians N
o policyA
t the time this report w
as being prepared, AC
ETTPEI, was conducting a m
ember survey to determ
ine interest in developing a and Technologists of Prince Edw
ard Island continuing professional developm
ent assurance program. A
t the date of this report, survey results were running m
ore than 2/3’s (A
CETTPEI)
in favour of a policy that would be sim
ilar to Engineers PEI (see Figure No. 1a).
The Association of Engineering Technicians
No policy
N/A
N/A
N/A
and Technologists New
foundland and Labrador (A
ETTN)
Saskatchewan A
pplied Science Technologists N
o policyN
/AN
/AN
/Aand Technicians (SA
STT)
Ordre des Technologues Professionnels
VoluntaryThere are specific
Bronze level ribbon: write exam
on professional ethics, complete course on technical report w
riting D
u Quebec
requirements for the bronze,
and be a mem
ber of OTPQ
for at least 3 years silver and gold level
Silver level ribbon: hold the bronze ribbon, be a mem
ber of OTPQ
and practicing professional “ribbons”
technologist for at least 6 years, at least 15 hours of pr ofessional development courses
Gold level ribbon: hold the silver ribbon, be a m
ember of O
TPQ and practicing professional
technologist for 10 years, hold a complem
entary recognized credential
Figu
re No
. 1bC
ontinuing Professional Developm
ent Policies of Provincial/Territorial Technologists and Technicians A
ssociations/Ordres

Engineering and Technology Labour Market Study 8
As can be seen from Figure No. 1a, the majority of engineering regulatory associations have manda-
tory continuing development policies, although these associations do not represent a majority of
professional engineers. The norm to which these associations have gravitated is 80 professional
development hours per year, or some variant on this, such as 240 professional development hours
over a period of three years.
None of the associations that certify technologists and technicians has a mandatory policy, although
three have voluntary policies, and one association may adopt a mandatory policy. (See Figure No.
1b). At this time, there does not appear to be any emerging consensus on an appropriate norm for
technologists and technicians.
Quantitative Indicators of Trends in Continuing ProfessionalDevelopment:
Survey and interview evidence provide several indicators of the importance of continuing professional
development to persons in engineering and technology occupations and to engineering and
technology employers:
• The Survey of Engineers and Engineering Technicians and Technologists found that, at the
time of the survey, 17.4% of respondents were currently enrolled in a university or college
course. (See Figure No. 2). Among those in the age group 25-40, the proportion was
24.9%. This represents an extremely high rate of participation in formal, post-secondary
training after completion of the initial undergraduate or college training necessary for
professional qualification.
Figure No. 2Percent of Survey Participants Enrolled in College or University Courses at the Time of the SurveySurvey of Engineers and Engineering Technicians and Technologists
25%
20%
15%
10%
5%
0%
Engineers Technologists Technicians
College Courses
University Courses
9 Trends in Continuing Professional Development
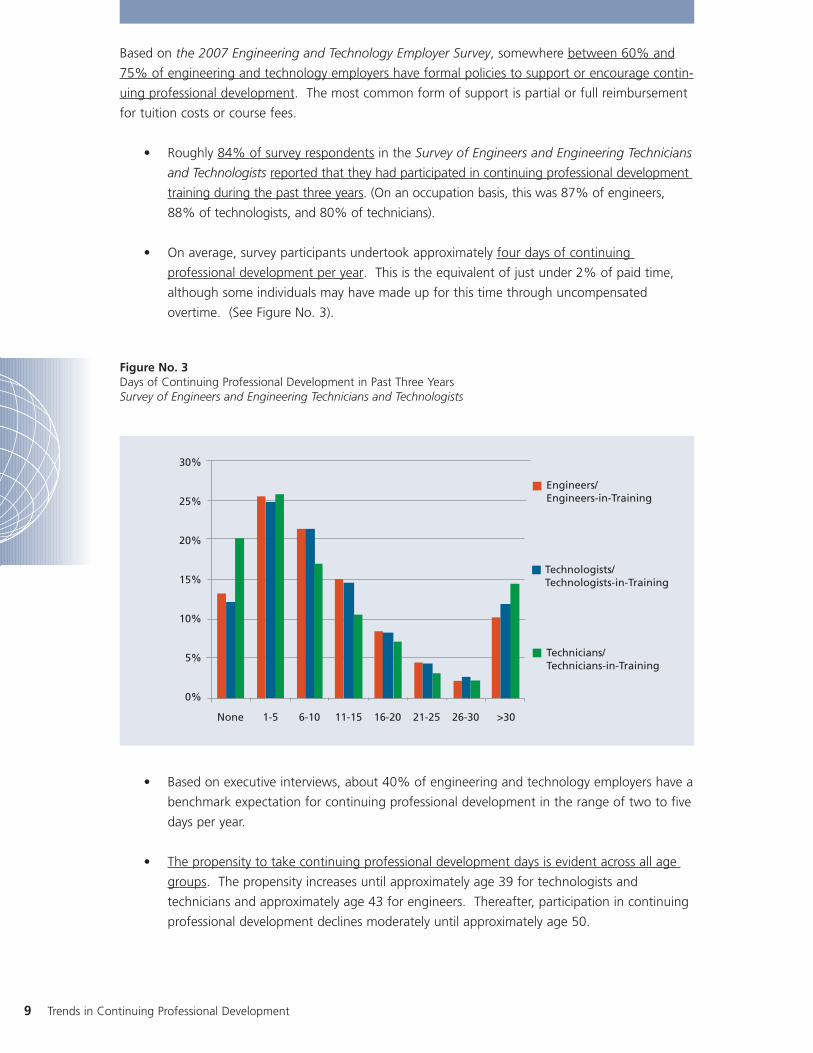
Based on the 2007 Engineering and Technology Employer Survey, somewhere between 60% and
75% of engineering and technology employers have formal policies to support or encourage contin-
uing professional development. The most common form of support is partial or full reimbursement
for tuition costs or course fees.
• Roughly 84% of survey respondents in the Survey of Engineers and Engineering Technicians
and Technologists reported that they had participated in continuing professional development
training during the past three years. (On an occupation basis, this was 87% of engineers,
88% of technologists, and 80% of technicians).
• On average, survey participants undertook approximately four days of continuing
professional development per year. This is the equivalent of just under 2% of paid time,
although some individuals may have made up for this time through uncompensated
overtime. (See Figure No. 3).
Figure No. 3Days of Continuing Professional Development in Past Three YearsSurvey of Engineers and Engineering Technicians and Technologists
• Based on executive interviews, about 40% of engineering and technology employers have a
benchmark expectation for continuing professional development in the range of two to five
days per year.
• The propensity to take continuing professional development days is evident across all age
groups. The propensity increases until approximately age 39 for technologists and
technicians and approximately age 43 for engineers. Thereafter, participation in continuing
professional development declines moderately until approximately age 50.
30%
25%
20%
15%
10%
5%
0%
None 1-5 6-10 11-15 16-20 21-25 26-30 >30
Engineers/Engineers-in-Training
Technologists/Technologists-in-Training
Technicians/Technicians-in-Training

Engineering and Technology Labour Market Study 10
After age 50, the participation rate declines more noticeably, though it remains above an average of
two days per year, even among engineering and technology professionals in their sixties. (See
Figure No. 4).
Figure No. 4Days of Continuing Professional Development in Past Three Years by AgeSurvey of Engineers and Engineering Technicians and Technologists
• Data from the 2007 Engineering and Technology Employer Survey suggest that the median
expenditure per engineering and technology staff member (of those employers that paid for
continuing professional development) was approximately $1,500 per year. However, around
one-fifth of responding employers in the employer survey reported average expenditures of
more than double this amount.
• Interviews with engineering executives suggest that employer expenditures on continuing
professional development – among those employers that support continuing professional
development – are around 1-2% of payroll for engineering and technology staff, although
some companies commit double this amount. Comparing employer costs, it should be
noted, is difficult, since companies differ in how they track the cost of continuing professional
development. Some companies include staff time as a cost, while others track only
disbursements. Some companies provide in-house continuing professional development,
while others rely on third parties. Budgets may be expressed as a percentage of payroll, a
fixed amount per person, or a percentage of revenues.
16.0
14.0
12.0
10.0
8.0
6.0
4.0
2.0
0.0
24 27 30 33 36
39 42 45 48 51 54 57
60 63
Age
Day
s o
f C
on
tin
uin
g P
rofe
ssio
nal
Dev
elo
pm
ent
ove
r Pa
st T
hre
e Y
ears
Normalized Trend

11 Trends in Continuing Professional Development
• One fifth to one third of engineering and technology employers provide structured in-house
training to their engineering and technology staff.
• It was common for participants in our focus groups and executive interviews to identify
continuing professional development as being part of what it means to be a professional.
Continuing professional development is seen by engineering and technology professionals, and also
by their employers, as one of the core values associated with the ethic of professionalism.
The Impact of Professional Associations’ Policies:
Figure No. 5 summarizes the estimated average number of continuing professional development
days taken by engineers, according to their province of residence and groups the provinces in terms
of their policy (or lack thereof) on continuing professional development. The comparison shows
that the estimated number of days of continuing professional development is generally higher in
those provinces that make continuing professional development mandatory.
Figure No. 5Days of Continuing Professional Development in Past Three Years by Province andContinuing Professional Development Policy of Regulatory Body – EngineersSurvey of Engineers and Engineering Technicians and Technologists
Average No. of Days of
Province Continuing Professional
Development Reported
over Past Three Years
No Policy:
• Ontario 10.4
Voluntary:
• Nova Scotia (voluntary until 2010) 12.4
• Quebec 10.2
• Manitoba 13.4
• British Columbia 12.3
Average (Voluntary): 12.1
Mandatory:
• Newfoundland 14.1
• New Brunswick 12.3
• Prince Edward Island 15.2
• Saskatchewan 14.8
• Alberta 14.4
Average (Mandatory): 14.1

Engineering and Technology Labour Market Study 12
While factors, other than association policy, may also be affecting the results shown in Figure No. 5,
the contrast is sufficiently great to support the view that association policy has had an impact on
average participation levels.
Interviews with engineering and technology executives suggest that association policies have an
influence on employers’ policies and practices. In provinces where engineering associations have
established expectations or requirements for continuing professional development, employers who
were interviewed were aware of the professional associations’ policies and had taken steps to ensure
that their own practices were consistent with requirements for maintaining professional licensure.
Public sector employers, without exception (among those interviewed), sought to be compliant with
the requirements set down by regulatory bodies for maintaining professional licensure.
Sample sizes and response rates7 in the 2007 Engineering and Technology Employer Survey allow a
comparison of employer policies between Alberta, where the engineering association has a manda-
tory policy, and Ontario, where the association currently has no formal requirements (See Figure No.
1a for details). As can be seen in Figure No. 6, the impact of association policies appears to be
more evident in fostering employer support for generic continuing professional development, includ-
ing participation in technical associations, than in encouraging employers to financially support
additional college or university training. The impact of association policies on employers’ practices,
while evident, is less marked than the impact on individual engineers.
Figure No. 6Percent of Employers Reporting a Practice of Policy of Supporting Various Types of Continuing Professional Development - Comparison of Ontario and Alberta(Percent of All Employers, including Employers that Declined to Answer)2007 Engineering and Technology Employer Survey
Province Reimbursement for Encourage and support Support additional
approved Continuing membership in Technical college or university
Professional Associations and attendance at training
Development professional development
training offered by those
associations
Ontario (No Formal Policy) 49% 42% 38%
Alberta (Mandatory Policy) 56% 51% 44%
7 In both Alberta and Ontario, approximately two-thirds employers that participated in the survey, answered the survey questions dealing withcontinuing professional development.
13 Trends in Continuing Professional Development
The survey data suggest four broad conclusions about association policies:
First, even in the absence of an association policy, there is still considerable support for
continuing professional development on the part of many engineering and technology
employers and widespread participation in continuing professional development on the
part of engineering and technology professionals.
Second, a mandatory policy on continuing professional development appears to increase
participation in continuing professional development from an average of about 3.5
days per year to 4.7 days. It is not clear, however, whether this increase arises chiefly
from persons being prompted by their association’s policy to take advantage of
existing employer support or whether their association’s policy encourages previously
non-supportive employers to support continuing professional development so as to
ensure that the registration status of their engineering staff remains in good standing.
Third, even in provinces where continuing professional development is mandatory, the
average reported days of continuing professional development (4.7 days per year)
falls short of the associations’ recommended norm of 80 hours per year
(approximately 10 days per year). However, as noted earlier, survey evidence show
that many individuals are taking post-secondary courses on their own time, in
addition to the continuing professional development days that are supported by their
employers. As well, many individuals may undertake self-directed study, outside the
framework of a formal course. Survey data suggest, therefore, that continuing
professional development policies should be flexible in identifying the acceptable
modalities for continuing professional development. A potentially instructive
approach can be found in some law societies which expect their members to have a
continuing professional development plan that may include a significant proportion
of self-directed study.
Fourth, although there are important exceptions, continuing professional development
policies are not as formalized in engineering and technology as they are in many
other professions. This is especially notable in technology professions where, at
present, none of the certifying associations has a formalized policy on continuing
professional development. In the engineering profession, the majority of regulatory
associations have formal policies. However, the three largest associations –
representing more than two-thirds of registered engineers – do not have formal policies.
Technical Associations:
Data from the Survey of Engineers and Engineering Technicians and Technologists suggest that 34%
of engineers and 22% of technologists and technicians are members of technical associations.
Members of technical associations generally reported approximately 1 day more of continuing pro-
fessional development training than non-members.

Engineering and Technology Labour Market Study 14
There are notable differences in the propensity to take-out a membership in technical associations.
Figure No. 7 shows the proportion of survey respondents who are engineers who work in a particu-
lar technical field and belong to a technical association. As can be seen, for engineers, the rate of
membership in technical associations is above average for metallurgy/materials, mining, petroleum,
environmental, civil and other unspecified fields, and below average in electrical/electronics,
mechanical, chemical, manufacturing/ industrial, aerospace, and computer engineering.
Figure No. 7Percent of Engineers working in Particular Engineering Fields Who are Members of Technical AssociationsSurvey of Engineers and Engineering Technicians and Technologists
Figure No. 8 reports the same data for engineering technicians and technologists. It is noteworthy
that the largest number of respondents reported membership in technical associations that were not
identified in the survey. These would include, in particular, associations representing technology
fields in the municipal sector or specific industry organizations. The survey data thus suggest, that
for many engineering technicians and technologists, industry associations may be more relevant
than technical associations.
Metallurgy / Materials
Mining
Petroleum
Environmental
Other
Civil
Electrical / Electronics
Mechanical
Chemical
Manufacturing / Industrial
Aerospace
Computer
0% 10% 20% 30% 40% 50% 60%
49%
48%
42%
42%
39%
30%
29%
28%
24%
23%
22%
41%

15 Trends in Continuing Professional Development
Figure No. 8Percent of Technicians and Technologists working in Particular Technology Fields Who are Members of Technical AssociationsSurvey of Engineers and Engineering Technicians and Technologists
In light of the importance of technical associations as channels for disseminating information on
new technologies, higher rates of membership might have been expected. It is especially notewor-
thy that in information technology and manufacturing, where change is quite rapid, the rate of
membership in technical associations is below average for engineers.
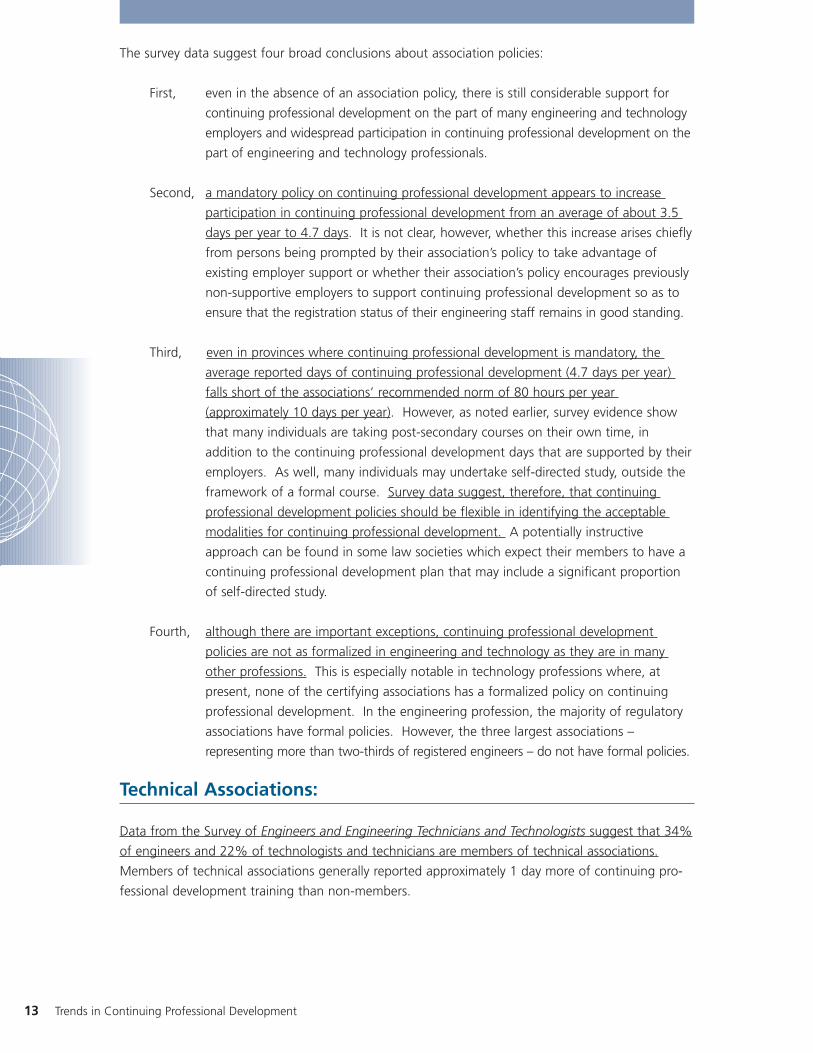
Figure No. 9 shows that there are differences across major sectors of the economy in the likelihood
of employers supporting membership in technical associations and encouraging participation in their
continuing professional development activities. As can be seen in Figure No. 9, the manufacturing
sector lags other sectors in its support for membership in technical associations.
0% 5% 10% 15% 20% 25% 30% 35%
Other
Petroleum
Mechanical
Environmental
Civil
Manufacturing / Industrial
Computer
Aerospace
Electrical / Electronics
Geomatics / Surveying
29%
27%
25%
20%
20%
20%
20%
19%19%
19%
18%
Engineering and Technology Labour Market Study 16
Figure No. 9Percent of Employers in Major Sectors Reporting that they Encourage Membership in Technical Associations and Participation in their Continuing Professional Development Activities2007 Engineering and Technology Employer Survey
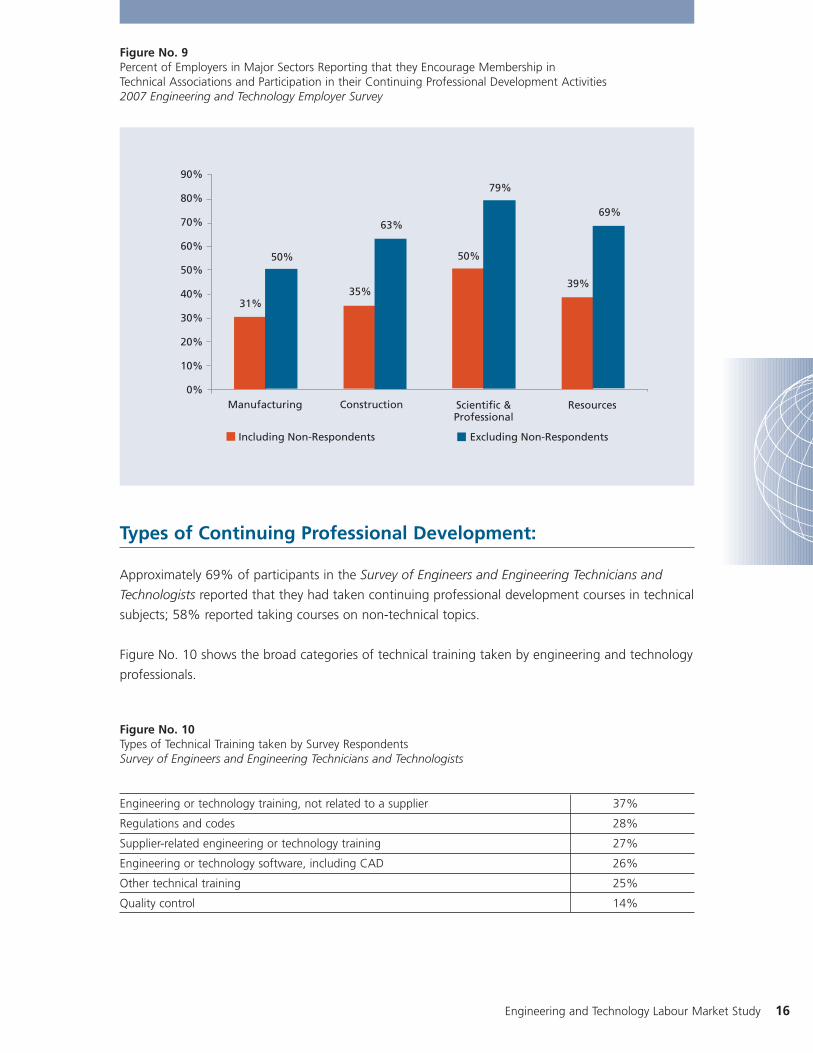
Types of Continuing Professional Development:
Approximately 69% of participants in the Survey of Engineers and Engineering Technicians and
Technologists reported that they had taken continuing professional development courses in technical
subjects; 58% reported taking courses on non-technical topics.
Figure No. 10 shows the broad categories of technical training taken by engineering and technology
professionals.
Figure No. 10Types of Technical Training taken by Survey Respondents Survey of Engineers and Engineering Technicians and Technologists
90%
80%
70%
60%
50%
40%
30%
20%
10%
0%Manufacturing Construction Scientific &
ProfessionalResources
Including Non-Respondents Excluding Non-Respondents
31%
50%
35%
63%
50%
79%
39%
69%
Engineering or technology training, not related to a supplier 37%
Regulations and codes 28%
Supplier-related engineering or technology training 27%
Engineering or technology software, including CAD 26%
Other technical training 25%
Quality control 14%
17 Trends in Continuing Professional Development
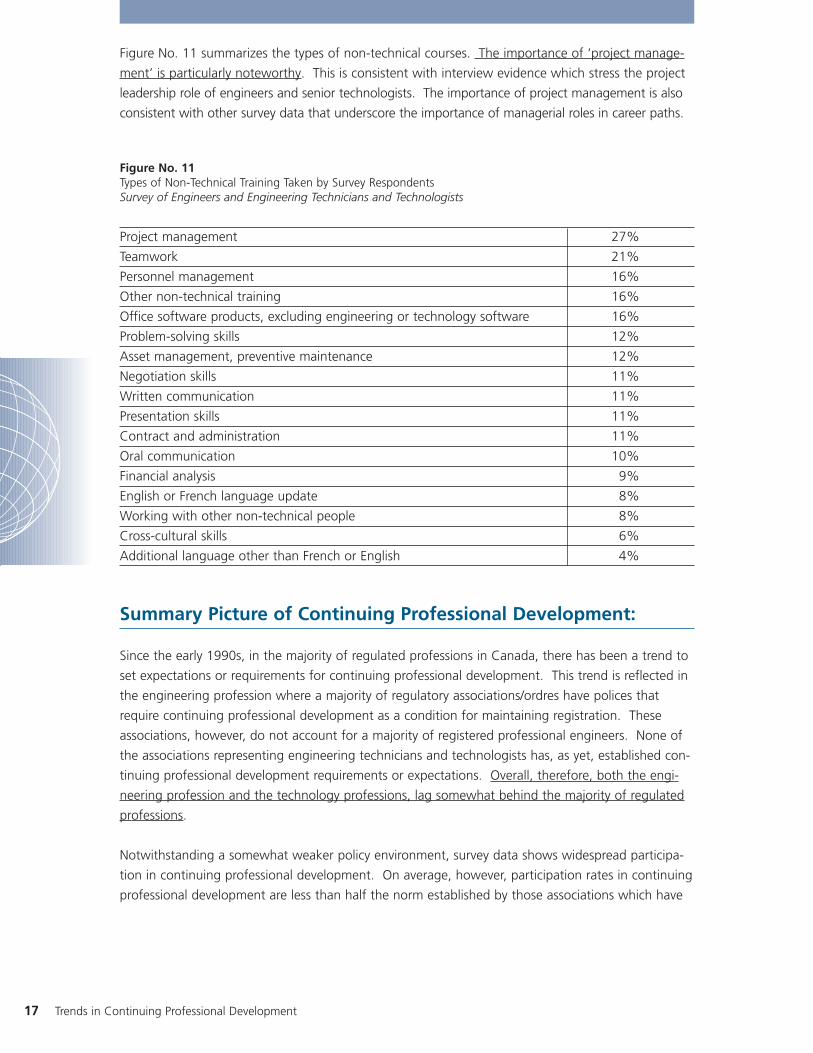
Figure No. 11 summarizes the types of non-technical courses. The importance of ‘project manage-
ment’ is particularly noteworthy. This is consistent with interview evidence which stress the project
leadership role of engineers and senior technologists. The importance of project management is also
consistent with other survey data that underscore the importance of managerial roles in career paths.
Figure No. 11Types of Non-Technical Training Taken by Survey Respondents Survey of Engineers and Engineering Technicians and Technologists
Project management 27%
Teamwork 21%
Personnel management 16%
Other non-technical training 16%
Office software products, excluding engineering or technology software 16%
Problem-solving skills 12%
Asset management, preventive maintenance 12%
Negotiation skills 11%
Written communication 11%
Presentation skills 11%
Contract and administration 11%
Oral communication 10%
Financial analysis 9%
English or French language update 8%
Working with other non-technical people 8%
Cross-cultural skills 6%
Additional language other than French or English 4%
Summary Picture of Continuing Professional Development:
Since the early 1990s, in the majority of regulated professions in Canada, there has been a trend to
set expectations or requirements for continuing professional development. This trend is reflected in
the engineering profession where a majority of regulatory associations/ordres have polices that
require continuing professional development as a condition for maintaining registration. These
associations, however, do not account for a majority of registered professional engineers. None of
the associations representing engineering technicians and technologists has, as yet, established con-
tinuing professional development requirements or expectations. Overall, therefore, both the engi-
neering profession and the technology professions, lag somewhat behind the majority of regulated
professions.
Notwithstanding a somewhat weaker policy environment, survey data shows widespread participa-
tion in continuing professional development. On average, however, participation rates in continuing
professional development are less than half the norm established by those associations which have

Engineering and Technology Labour Market Study 18
instituted mandatory policies. Nevertheless, association policies clearly have an impact.
Participation rates in provinces where there are mandatory policies are notably higher than where
there is no policy. A large majority of engineering and technology employers have formal policies to
support or encourage continuing professional development. Stronger association policies may
encourage greater utilization of the support that these employer policies provide.
Policies on continuing professional development need to take account of the range of options open
to engineering and technology professionals. Rigid definitions risk under-estimating the actual levels
of involvement and promoting types of continuing professional development that may not be
consistent with the career goals of engineering and technology professionals or with the human
resource development goals of their employers.
There are challenges which both the engineering and the technology professions need to address.
Participation rates in continuing professional development appear to fall short of what might be
expected, based on the importance attributed to continuing professional development and trends in
other professions. In some fields, participation rates in technical associations is also lower than
might be expected. Employer support for continuing professional development is strong in some
industries, but weaker than might be expected in others, notably in the manufacturing sector.
Recommendations:
1. Engineers Canada and the Canadian Council of Technicians and Technologists should update
their past scans of continuing professional development standards for other professions in
Canada and for engineering and technology professions internationally. Based on these
updated scans, the national associations should assess how the Canadian engineering and
technology professions stand in relation to these trends.
2. Engineers Canada and the Canadian Council of Technicians and Technologists should explore
successful models of continuing professional development used by other professions,
especially where those models adopt flexible definitions of eligible continuing professional
development activities. The notion of an individually drafted continuing professional
development plan – as set out by some of the regulatory bodies in the legal profession – may
have particular relevance. In considering the relevance of models used in other professions,
the implications of the distinctive characteristics of engineering and technology career paths
should be borne in mind.
3. Engineers Canada and the Canadian Council of Technicians and Technologists should
undertake a systematic examination of employer policies towards continuing professional
development. This study should explore both how association policies should relate to
employer policies and how areas of weakness in employer support for continuing professional
development could be addressed.
4 Efforts should be made to harmonize the continuing professional development norms and
standards of the provincial and territorial associations/ordres.

19 Trends in Continuing Professional Development
Appendix AMethodology
Employer Survey:
The 2007 Engineering and Technology Employer Survey was a web-based survey on engineering
and technology intensive employers. The survey was conducted in 2007 and early 2008. A total of
701 valid responses were received. Of these respondents, 339 (48%) conducted operations in more
than one province, at the time of the survey. In total, the respondents reported that they employed
23,367 engineers, 10,285 technologists, and 8,276 technicians. Based on the 2006 Census, the
respondents to the survey accounted for approximately 11.6% of the total estimated employment
of engineers and 7.1% of technicians and technologists.
More detailed information on the survey sample is available in the report, 2007 Engineering and
Technology Employer Survey, which is available on the Engineering and Technology Labour Market
Study website: http://www.engineerscanada.ca/etlms/index.cfm
Employee Survey:
The Survey of Engineers and Engineering Technicians and Technologists was conducted throughout
2008. A total of 15,585 persons participated in the survey. These comprised 8,700 respondents
with an undergraduate degree in engineering (earned either in Canada or abroad), 5,809 persons
with a Canadian or external college qualification (and no university qualification), 490 persons with
a university science degree (and no other qualification), 547 persons with a graduate degree in
engineering (but who did not report an undergraduate degree8), and 312 persons whose qualifica-
tions could not be determined. Approximately 85% of the survey respondents reported that they
were working in engineering or technology when they completed the survey. The regional, gender
and age distribution of respondents approximates the Census distribution. Among respondents
with an undergraduate degree in engineering, 87.9% were either licensed or registered with their
professional association as engineers-in-training. Among respondents with a college qualification in
technology, 62% held a technologist or technician certification.
More detailed information on the survey sample is available in the report, Survey of Engineers and
Engineering Technicians and Technologists, which is available on the Engineering and Technology
Labour Market Study website: http://www.engineerscanada.ca/etlms/index.cfm
Executive Interviews:
Figure No. 12 summarizes the regional and industry distribution of the executive interviews. Persons
interviewed were generally chief engineers, chief technology officers, CEO’s or directors of human
resources. The interviews were conducted in the spring and summer of 2008.
8 The respondents who reported a graduate qualification in engineering, but no undergraduate degree probably reported only their highest degree.

Employer Survey:
Figure No. 12Regional and Industry Distribution of Executive Interviews
The interview protocol is reproduced at the end of this appendix.
Focus Groups:
A total of 65 engineers, technologists and technicians participated in the five focus groups. The
regional and occupational distribution of these participants is summarized in Figure No. 13. The
focus groups were conducted in the winter and spring of 2008.
Figure No. 13Regional and Occupational Distribution of Focus Group Participants
The focus group protocol is reproduced at the end of this appendix.
Consulting Manufacturing Government Oil & Gas Other Total
Atlantic 2 2 3 7
Quebec 5 2 1 8
Ontario 4 1 2 1 8
Manitoba-Saskatchewan 1 2 3 6
Alberta 2 1 3 1 7
British Columbia 2 1 1 1 5
Total 16 6 10 3 6 41
Engineering and Technology Labour Market Study 20
Engineers Technologists Technicians Total
Toronto (February 21, 2008) 8 3 2 13
Fredericton (February 26, 2008) 7 6 1 14
Vancouver (March 12, 2008) 6 6 0 12
Calgary (March 26, 2008) 9 3 0 12
Montreal (July 3, 2008) 5 9 14
Total 35 27 3 65

21 Trends in Continuing Professional Development
Executive Interview Outline
1. What are your firm’s policies regarding continuing professional development for engineers,
technologists and technicians? Do you have a budget allocation for continuing professional
development? Do you have a benchmark in terms of the number of days allowed for
continuing professional development? Does your company maintain records on the continuing
professional development of its engineering and technology employees? Do requirements by
professional associations for continuing professional development affect your company/
organization’s policies or practices?
2. Do your engineers or technicians/technologists tend to belong to professional associations
(i.e., the provincial and territorial associations that undertake licensure of engineers or
certification of technicians/technologists)? Are there any advantages to you, as an employer,
that you associate with your engineers or technicians/technologists having membership in
professional associations (e.g., differences in professional attitudes, differences in involvement
in continuing professional development, etc.)? Does your company subsidize membership
fees?, sponsor association activities, or subsidize attendance at association conferences,
seminars, etc.?
3. Do your engineers or technologists tend to belong to technical associations? (e.g., Canadian
Society for Civil Engineering, Canadian Society for Chemical Engineering, Institute of Electrical
and Electronics Engineers – IEEE, etc.)? If so, does your company subsidize membership fees,
sponsor association activities, or subsidize attendance at association conferences, seminars, etc.?
4. What channels does your company rely on for continuing professional development for
engineering and technology employees? (e.g., University-based professional development
centres, colleges, private seminars, technical associations, in-house seminars, etc.). Does your
company/organization have a preference for any particular channel?
5. Are there any broad trends that you observe in terms of the strengths or weaknesses of the
skills of recent graduates? - technical skills, non-technical skills?
6. Should participation in continuing professional development be a requirement for renewal of
an engineers professional license? for renewal of a technologist’s or technician’s certification?
(Note: this is a requirement in some provinces.)
7. In terms of supporting the cost of continuing professional development, where do you see
the balance across individual responsibility, employer responsibility, and government support
(through the tax system)?
8. In your experience, have there been any trends in shifting responsibilities between engineers
and technologists? between technologists and technicians? between technologists and
technicians, on the one hand, and tradespersons on the other? If so, what is behind these
changes? (e.g., cost pressures, differences in training, internationally trained professionals
who are educated as technologists, but employed as technicians)

Engineering and Technology Labour Market Study 22
9. Do you see any implications of these shifting responsibilities for the system licensing engineers
or certifying technicians or technologists?
10. What is your company’s policy towards professional licensure for engineers and professional
certification for technologists and technicians? Do you provide financial support for annual
registration or membership fees?
• If policy is to require licensure and certification: what are the main reasons that you
require licensure and certification?
• If policy is to prefer licensure and certification: what are the main reasons that you
encourage licensure and certification? Why do you opt for a policy of encouraging,
rather than requiring?
• If policy is mixed, i.e., require for some employees, but not for all: what factors
determine where you draw the line between requiring licensure or certification vs.
not requiring?
• If policy is non-supportive: why does your company not see value in licensure
or certification?
• Have there been any changes in your company’s policy or attitude towards licensure or
certification? If so, what was behind these changes?

23 Trends in Continuing Professional Development
Focus Group Discussion Outline
1. Introductions
• Background to the study
• Purpose of Focus Group
• Introduction of participants
2. Please describe the types of responsibilities undertaken by engineers, and technologists in work
places with which you are familiar.
3. Do you see any changes in the respective roles of engineers and technologists?
In particular, are there functions or responsibilities that were formerly undertaken, mainly by
engineers, which are now increasingly undertaken by technologists?
Has there been any movement in the opposite direction?
Are these changes more evident in some technical fields or disciplines?
Are these changes more evident in some industries?
4. Do you see any changes in the respective roles of technologists and technicians vis à vis one
another and vis à vis the skilled trades?
Are these differences between technologists and technicians becoming more or less
pronounced, in practice?
Are these changes more evident in some technical fields or disciplines?
Are these changes more evident in some industries?
5. Break
6. What factors are behind the changes in the roles and shifting work boundaries?
• cost pressures?
• business organization models?
• differences in training?
• internationally trained professionals who are educated as engineers, but employed
as technologists?
• technology?
Are these factors more important in some industries or in some technical fields?
7. Do you see any trends in shifting roles and work responsibilities between engineers/
technologists/technicians on the one hand and other science-based professionals, e.g.,
computer science graduates, life sciences graduates, mathematics graduates, etc.

Engineering and Technology Labour Market Study 24
Appendix BMembers of Steering Committee
Kim Allen Professional Engineers Ontario
Jean Luc ArchambaultOrder des Technologues Professionels du Quebec
Michelle BraniganElectricity Sector Council
David ChalcroftAssociation of Professional Engineers, Geologists and Geophysicists of Alberta
Samantha ColasanteEngineers Canada
Manjeet DhimanACCES Employment Services
Brian GeorgeNorthwest Territories and Nunavut Association of Professional Engineers, Geoscientists
Stephen GouldCanadian Council of Technicians and Technologists
Kevin HodginsNorthwest Territories and Nunavut Associationof Professional Engineers, Geoscientists
Cheryl JensenMohawk College
Ellie KhaksarDiversity Integration and Retention Services Inc.
Lise LauzonRéseau des ingénieurs du Québec
Edward LeslieNew Brunswick Society of Certified EngineeringTechnicians and Technologists
Andrew McLeodEngineers and Geoscientists New Brunswick
Perry NelsonThe Association of Science and EngineeringTechnology Professionals of Alberta
Robert OkabeCity of Winnipeg
D’Arcy PhillipsManitoba Aerospace
Pat QuinnProfessional Engineers Ontario
Colette RivetBioTalent Canada
Tom RoemerCamosun College
Kyle RuttanCanadian Federation of Engineering Students
Deborah ShamanHuman Resources and Skills Development Canada
Len ShrimptonAssociation of Professional Engineers, Geologists andGeophysicists of Alberta
Andrew SteevesADI Ltd.
Al StewartRoyal Military College of Canada
Richard TachukElectric Strategies Inc.
Jean-Pierre Trudeau Ordre des ingénieurs du Québec
Gina van den BurgOntario Society of Professional Engineers
Deborah WolfeEngineers Canada
Bruce WornellEngineers Nova Scotia
Yaroslav ZajacCanadian Council of Technicians and Technologists