privacy preserving sensitive data publishing using (k,n,m
TRANSCRIPT

Abstract—Open Science movement has enabled extensive
knowledge sharing by making research publications, software,
data and samples available to the society and researchers. The
demand for data sharing is increasing day by day due to the
tremendous knowledge hidden in the digital data that is
generated by humans and machines. However, data cannot be
published as such due to the information leaks that can occur by
linking the published data with other publically available
datasets or with the help of some background knowledge.
Various anonymization techniques have been proposed by
researchers for privacy preserving sensitive data publishing. This
paper proposes a (k,n,m) anonymity approach for sensitive data
publishing by making use of the traditional k-anonymity
technique. The selection of quasi identifiers is automated in this
approach using graph theoretic algorithms and is further
enhanced by choosing similar quasi identifiers based on the
derived and composite attributes. The usual method of choosing a
single value of ‘k’ is modified in this technique by selecting
different values of ‘k’ for the same dataset based on the risk of
exposure and sensitivity rank of the sensitive attributes. The
proposed anonymity approach can be used for sensitive big data
publishing after applying few extension mechanisms.
Experimental results show that the proposed technique is
practical and can be implemented efficiently on a plethora of
datasets.
Index Terms— anonymization, data publishing, k anonymity,
privacy, quasi identifier.
I. INTRODUCTION
ata sharing benefits research community by deriving value
out of the data; thereby facilitating new findings within the
domain. As the amount of digital data generated rises rapidly,
efficient mechanisms are needed for collecting, processing and
sharing data. Data sharing is identified to be very useful in
almost all the domains including the medical domain [1], as
the data shared across the globe can be used for collaborative
research and free exchange of test reports among doctors,
patients and data publishers. Clinical data sharing is
advantageous in many aspects such as: (i) providing effective
Manuscript received June 15, 2019; revised February 14, 2020. Date of
publication March 20, 2020. Date of current version March 20, 2020. The
associate editor prof. Matko Šarić has been coordinating the review of this
manuscript and approved it for publication.
Authors are with the School of Information Technology and Engineering,
Vellore Institute of Technology, Vellore, Tamil Nadu, India (e-mails:
[email protected], [email protected]).
Digital Object Identifier (DOI): 10.24138/jcomss.v16i1.825
treatment by reviewing similar patient history (ii) finding new
research prospects (iii) avoiding medication errors and (iv)
reducing the need for duplicate testing [2]. However, sharing
data often leads to a variety of challenges including the
privacy concerns that can arise when linking the published
data with other publically available information.
Privacy preserving data publishing deals with developing
methods to publish practically useful data, while preserving
individual’s privacy [3]. Generally, any data item can be
categorized into either (i) Explicit identifiers (ii) Quasi-
identifiers (iii) sensitive attributes or (iv) non-sensitive
attributes. Explicit identifiers and sensitive attributes are
relatively easy to choose based on the type of data that is
published. Choosing quasi-identifiers (QI) is an important
task, as information leakage mainly occurs in published data
by linking quasi-identifiers with some external knowledge.
Yan Y, Wang W, Hao X, and Zhang L. [4] proposed a method
for identification of quasi-identifiers by initially generating an
attribute graph using the publishing data, published data and
external knowledge, and then by making use of the cut vertex
method. This method is further improved in this paper by
identifying new set of quasi-identifiers from the derived and
composite attributes, so as to generate better attribute graphs
with more quasi-identifier values.
A variety of anonymization techniques have been proposed
by various researchers for publishing the data without
questioning individual’s privacy in any manner. k-anonymity
approach was the first step in this direction, where the dataset
was anonymized in such a way that at least ‘k’ records should
have the same value for all the quasi-identifiers. However, a
single value of ‘k’ was chosen for the entire dataset, without
considering the sensitivity levels of the sensitive attribute. For
records with higher sensitivity, a higher value of ‘k’ is
required for satisfying privacy constraints. The use of multiple
values of ‘k’ for a single dataset is addressed in the proposed
anonymity approach in this paper. A sensitivity rank is
therefore assigned to each record by considering the class
labels in the sensitive attribute. These are in turn grouped into
various data splits based on the sensitivity rank. Based on this,
an optimal value of ‘k’ is chosen for the data split by
employing the elbow method.
The paper thus aims in proposing a (k,n,m) anonymity
approach for privacy preserving sensitive data publishing. The
main contributions of the research are listed below:
1. Extending the traditional k-anonymity approach by
including a sensitivity rank for each class in the sensitive
Privacy Preserving Sensitive Data Publishing
using (k,n,m) Anonymity Approach
Nancy Victor and Daphne Lopez
D
46 JOURNAL OF COMMUNICATIONS SOFTWARE AND SYSTEMS, VOL. 16, NO. 1, MARCH 2020
1845-6421/03/825 © 2020 CCIS
Original scientific paper

attribute. This sensitivity rank is used for choosing
different values of ‘k’.
2. Identify the optimum value of ‘k’ for each class by making
use of the sensitivity ranks assigned. Elbow method is
employed here to choose the value of ‘k’.
3. Automated selection of quasi-identifiers using graph
theoretic algorithms and choosing other similar quasi-
identifier attributes with the help of derived and composite
attributes.
The rest of the paper is organized as follows. Section II
gives an overview of the research works related to data
anonymization and publishing and the selection of attributes in
a dataset. Section III discusses about the preliminaries and
section IV elaborates on the proposed (k,n,m) anonymity
approach. Section V shows the experimental results and
section VI concludes the findings in this paper.
II. RELATED WORK
A. Data Anonymization
As the amount of digital data that is generated increases at a
rapid rate, valuable insights can be generated out of it, if the
data is made available for analysis. However, data cannot be
published as such due to the sensitive personal information
that may be associated with it. Data anonymization is the
technique of removing or modifying personally identifiable
information (PII) from data in order to publish the same
without questioning individual’s privacy in any manner. The
synthetic data with similar statistical properties as that of the
original data aids in data analysis, without any sensitive
information from getting disclosed.
However, Brickell and Shmatikov compared privacy gain
with utility gain after data anonymization, and argued that
“even modest privacy gains require almost complete
destruction of the data-mining utility” [5]. The fundamental
characteristics of privacy and utility was studied by Li, T., &
Li, N. [6] and proved that it is inappropriate to directly
compare privacy with utility. One of the major reasons is that
privacy is actually an individual concept, whereas utility is
aggregate. Privacy gain cannot be considered as equal to
utility gain even if the adversary and the researcher learn
exactly the same information. Direct comparison of privacy
and utility was proved to be infeasible by evaluating the trade-
off between privacy and utility. An empirical investigation on
the parameters that could be fine-tuned for achieving
acceptable level of data privacy and utility was studied by
Mivule, K., & Turner, C [7].
Various methods of data anonymization, for structured and
unstructured data have been studied by researchers worldwide. The basic models for privacy preserving relational data
publishing are listed below.
1) k-anonymity: For satisfying k-anonymity, an
equivalence class should contain at least ‘k’ rows.
Equivalence class can be well defined as the set of
records that have identical value for QIs [9].
2) l-diversity: There should be at least ‘l’ well represented
values for each sensitive attribute in a dataset for it to
satisfy l-diversity principle [10].
3) t-closeness: t-closeness suggests that the distance
between the distribution of a sensitive attribute in the
class and the distribution of the attribute in the whole
table is no more than a threshold ‘t’ [11].
4) Differential privacy: Adding mathematical noise to the
original data values [12].
Table I presents the widely used techniques for data
anonymization [8]: TABLE I
TECHNIQUES FOR DATA ANONYMIZATION
Anonymization Technique Description
Attribute Suppression Deletion of an entire attribute or column in a
dataset.
Record Suppression Deletion of an entire record or row in a
dataset.
Character Masking Modifying the characters in a data value,
usually by using symbols.
Pseudonymization Replacing original data with made up data
values. Also known as coding.
Generalization Reducing the precision of data values by
removing a part of the data or by providing
a more general value. Also referred to as
recoding.
Swapping Rearranging the data values in such a way
that even though the individual values are
present in the dataset, it doesn’t correspond
to the original record. Also known as
shuffling or permutation.
Data Perturbation Data values are modified to a slightly
different one.
Synthetic data generation To generate fake or artificial data directly,
instead of modifying the original data values
in the dataset.
Data aggregation Uses summarized values such as total or
average instead of the original data values.
These basic privacy models were further modified by data
publishers and researchers for developing enhanced privacy
models. A personalized anonymity scheme was proposed by
Liu X et al. [13] by dividing the sensitive attributes into
various groups according to its sensitivities and a frequency
threshold was then assigned to each group. The sensitive
values could then be changed with respect to the guardian
node. A scalable k-anonymization (SKA) technique using
MapReduce was proposed by Mehta et al. [14]. KC-Slice
method was proposed by Onashoga, S. A. et al. [15] for
dynamically anonymizing multiple sensitive attributes. A
model for data anonymization that preserves utility was
proposed by Lee, Hyukki et al. [16]. Wang, Zhibo et al. [17]
put forward a distributed agent-based framework for privacy
preservation, the DADP, which uses a novel allocation
mechanism for budget in a distributed manner. An agent-based
dynamic grouping mechanism is also proposed in the paper.
A privacy-preserving framework for social network data
publishing called PrivRank was proposed by Yang, Dingqi et
al. [18]. Generation of synthetic datasets with similar
statistical properties was studied both theoretically and
experimentally by Bindschaedler, Vincent et al. [19]. A
technique for social network sensitive data publishing based
on BIRCH was proposed by Zhang, Jinquan et al. [20].
Maximum Delay Anonymous Clustering Feature (MDACF)
tree data publishing algorithm was studied by the authors. A
scalable k-anonymization scheme using MapReduce was
proposed by Mehta, Brijesh B., and Udai Pratap Rao [21].
Piao, Chunhui et al. [22] proposed a differential privacy based
N. VICTOR et al.: PRIVACY PRESERVING SENSITIVE DATA PUBLISHING USING (K,N,M) ANONYMITY APPROACH 47

framework for governmental data publishing based on fog
computing.
Fung et al. surveyed the various techniques for privacy
preserving relational data publishing; whereas privacy models
for big data has been surveyed by Victor N, Lopez D, and
Abawajy JH [23]. Various challenges with respect to privacy
preserving data publishing also have been studied by Victor. N
and Lopez. D [24]. Google uses the techniques of data
generalization and noise addition for anonymizing the data
[25].
B. Selection of Attributes in the Dataset
One of the primary concerns of any data publisher lies in
the appropriate and efficient classification of attributes in a
dataset as explicit identifier, quasi-identifier, sensitive or non-
sensitive attribute. Explicit or direct identifiers help in
identifying an individual uniquely whereas quasi-identifiers
help in the unique identification of an individual by linking the
same with some external information. Sensitive attributes
contain person specific sensitive information, which is to be
released by the data publisher. Non-sensitive attributes are
those that don’t belong to the other three categories. Explicit
identifiers, sensitive and non-sensitive attributes are relatively
easy to identify in a dataset, but the main problem lies in the
selection of quasi identifier attributes as these are the attributes
which are in turn linked with external information for the
unique identification of the individual.
HIPAA privacy rule provides two standards for health data
de-identification [26]: Expert determination by applying
statistical or scientific principles and Safe harbor de-
identification method by removing 18 different types of
identifiers. Most of the existing methods of de-identification
use empirical understanding in order to choose the quasi
identifiers for privacy protection. However, few studies have
been conducted so far which aims in the automatic
identification of quasi identifiers. A method for quantifying
quasi identifiers using distinct ratio and separation ratio was
presented by Motwani R and Xu Y. [27], but the method just
focused on publishing data and not on the data connection
risks. Yan Y, Wang W, Hao X, and Zhang L. [4] proposed a
method for QI identification by initially generating an attribute
graph using the publishing data, published data and external
knowledge, and then by making use of cut vertex method. This
method can be used for attribute graphs with single and
multiple sensitive attributes. Another method proposed in the
US patent application US20160342636A1 [28] uses an
indexing mechanism for each dataset and an indicator for each
attribute value in each record for identifying a unique record
for the attribute combination.
III. PRELIMINARIES
Definition 1 (Attributes): Let T(A1,…,An) be a table with
‘n’ tuples. The finite set of attributes of T are {A1,…,An}.
Example 1: The finite set of attributes in Table II corresponds
to the hospital number, name, age, gender, job, discharge
status and diagnosis. These attributes are in turn classified as
either explicit identifiers, quasi-identifiers, sensitive attributes
or non-sensitive attributes. Hospital number and name can be
used for identifying an individual explicitly; and these
columns should be removed completely before data release.
As this is a medical dataset, the attribute “diagnosis” is taken
as the sensitive attribute. The selection of quasi-identifiers is
discussed in the following sub section.
TABLE II
ORIGINAL DATASET (SAMPLE)
Sl
No
H.
No Name Age
Ge
nde
r
Job
Dis
Statu
s
Diagnosi
s
1 10 Sarah 23 F Dancer Y Hepatitis
2 11 Jacob 36 M Singer Y Malaria
3 12 Julie 24 F Singer Y Influenza
4 13 Luke 31 M Singer N HIV
5 14 Anna 27 F Dancer Y Malaria
6 15 Isaac 44 M Doctor N H1N1
7 16 Andrew 46 M Lawyer Y Malaria
8 17 Dania 29 F Keyboardist Y Hepatitis
9 18 Mark 33 M Dancer N H1N1
10 19 Samuel 49 M Engineer Y Influenza
11 20 John 38 M Keyboardist Y Hepatitis
12 21 Mathew 41 M Engineer N HIV
Definition 2 (Quasi-identifier): A set of attributes {A1,…An}
in a table T is said to be a quasi- identifier(QI) set if ⱯxiϵT, a
specific individual xi can be re-identified with a high
probability ‘p’ by linking these attribute combination of values
with some external information.
Example 2: Age, gender and job attributes are easy to be
obtained from a census database or voter’s list. If this
publically available information is linked with the data in
Table II, the probability of identifying the person correctly
increases many fold. Background knowledge also plays a
major role in the unique identification of a particular
individual [29]; hence discharge status can also be considered
as a quasi-identifier. Quasi-identifiers are chosen empirically
in most of the cases using the experience of the data publisher
or with certain assumptions. Thus, it becomes a necessity to
choose quasi-identifiers with the help of mathematical
approaches.
Definition 3 (Sensitivity rank): Let {A1…An} be the set of
attributes in a table T, S be the sensitive attribute, where
Sϵ{A1,..An} and {c1…cj} be the different class labels in the
sensitive attribute S. A sensitivity rank miϵ{m1,…mj} refers to
the severity or level of sensitivity of each class ci in the
sensitive attribute S, obtained by referring to an attribute
Akϵ{A1,..An} if there is a dependency from Ak->S, else by
linking with external knowledge.
Example 3: The sensitive attribute in Table II is the attribute
“diagnosis” and it includes five different class labels such as
48 JOURNAL OF COMMUNICATIONS SOFTWARE AND SYSTEMS, VOL. 16, NO. 1, MARCH 2020

Hepatitis, Influenza, Malaria, HIV and H1N1. The severity of
this attribute can be either found out by using the dependency
attribute “discharge status” or by making use of publically
available information. An attribute A is said to be a dependent
attribute of B, if the value of attribute ‘A’ depends on the
attribute ‘B’. Here, the discharge status solely depends on the
diagnosis of the individual. Based on this information, the
severity of the disease can be predicted. Another way of
finding the severity of a disease is by using the mortality rate
associated with a particular disease, and this information can
be obtained from public health centers.
Definition 4 (Risk of re-identification): Let {A1…An} be the
set of attributes in a table T, S be the sensitive attribute, where
Sϵ{A1,..An} and {c1…cj} be the different class labels in the
sensitive attribute S. A value riϵ{r1,…rj}refers to the risk of
exposure of each class ci in the sensitive attribute S, if the data
is published as such.
Example 4: The measures such as journalist risk, prosecutor
risk and marketer risk can be used for evaluating the re-
identification risk. Based on these measures, the probability of
correctly identifying the disease can be found out, if the data is
published as such.
Definition 5 (k-anonymity): Let T(A1,...,An) be a table and QIT
be the quasi-identifier associated with it. T is said to satisfy k-
anonymity if and only if each sequence of values in T[QIT]
appears with at least k occurrences in T[QIT].
Example 5: In order to satisfy the k-anonymity principle
where k = 2, an equivalence class should have at least two
rows. Equivalence class can be defined as the set of rows that
have identical values for quasi identifiers. k-anonymization
technique is applied only after applying generalization
operations. The dataset after applying k-anonymization
technique is given in Table III. The rows 1 and 2 belong to the
same equivalence class as it contains identical value for all the
quasi-identifiers. Likewise, this table contains six equivalence
classes.
IV. PROPOSED (k,n,m) ANONYMITY APPROACH
The goal of this section is to provide a formal description
about the (k,n,m) anonymity model for constructing and
evaluating data publishing systems that release sensitive
information without comprising individual’s privacy in any
manner.
Definition 6 ((k,n,m) anonymity): Let T(A1,…. An) be a table
with n tuples, QIT be the set of quasi identifiers associated
with it, {m1… mi} be the sensitivity rank of each label in the
sensitive attribute, {r1,…ri} be the risk of re-identification of
each label in the sensitive attribute, {k1,…ki} be the number of
tuples to be generalized based on the sensitivity rank. T is said
to satisfy (k,n,m) anonymity if and only if each sequence of
values in T[QIT] with sensitive rank mj appears with at least kj
occurrences in T[QIT].
TABLE III K-ANONYMIZED DATASET WITH K=2
Sl
No.
Age Gender Job Dis
Statu
s
Diagnosis
1 20-25 F Artist Y Hepatitis
2 20-25 F Artist Y Influenza
3 25-30 F Artist Y Malaria
4 25-30 F Artist Y Hepatitis
5 30-35 M Artist N HIV
6 30-35 M Artist N H1N1
7 35-40 M Artist Y Malaria
8 35-40 M Artist Y Hepatitis
9 40-45 M Professional N H1N1
10 40-45 M Professional N HIV
11 45-50 M Professional Y Malaria
12 45-50 M Professional Y Influenza
Example 6: The sensitive attribute in the original table
corresponds to the attribute “diagnosis”, with five different
classes such as Hepatitis, Influenza, Malaria, HIV and H1N1.
Sensitive values m1, m2, m3, m4 and m5 are found out using
the dependent attribute of “diagnosis”, the “discharge status”.
If the discharge status is “Y”, the disease can be considered
less sensitive. But, this alone cannot be considered as a
deciding criterion for setting the sensitivity values of each
class. Hence, publically available information regarding the
severity of disease can be used for setting up the sensitivity
values. Based on the sensitivity rank, a value of ‘k’ for each
class is found out. The number of distinct sensitive values in
each equivalence class should be equal to at least ‘c/2’, where
‘c’ corresponds to the class label of sensitive attribute.
Fig. 1 depicts the series of operations to be applied for
achieving (k,n,m) anonymity principle. Each step is detailed in
the following section.
A. Classification of Attributes
The aim of this step is to classify the attributes in a dataset
into one of the four categories: explicit identifiers, quasi-
identifiers, sensitive attributes and non-sensitive attributes. As
detailed in the related work section of this paper, classification
of attributes into explicit identifiers, sensitive attributes and
non-sensitive attributes is relatively easy with the help of
standards such as HIPAA. Choosing quasi-identifiers (QI) is
an important task, as information leakage mainly occurs in
published data by linking quasi-identifiers with some external
knowledge. Graph theoretic approaches as suggested by Yan
Y, Wang W, Hao X, and Zhang L[4] can be employed for the
optimal selection of quasi-identifiers in a dataset. Attribute
graphs are generated in this approach by making attributes as
the nodes and relationship between them as the edges. Fig. 2
consists of three blocks, where the first, second and third
blocks represent the set of identifier attributes, quasi-
identifiers and sensitive attributes respectively. The set of
quasi-identifiers are determined by finding out cut-vertex on
the paths from identifier attribute to sensitive attribute.
N. VICTOR et al.: PRIVACY PRESERVING SENSITIVE DATA PUBLISHING USING (K,N,M) ANONYMITY APPROACH 49

Fig.1. Flowchart for (k,n,m) anonymity
Fig. 2. Attribute graph
An extension to the proposed approach is done by
categorizing the QI attribute into atomic, derived or composite
attribute as shown in Fig. 3.
Fig. 3. General classification of attributes
Any attribute that can’t be divided further can be termed as
an atomic attribute. A derived attribute can be defined as an
attribute which is derived from other attributes. Even if the
derived attribute is not physically present in the dataset, the
same can be found out easily. For example, if the “date of
birth” attribute is present in a dataset, “age” of the person can
be found out using the current date. Hence, the attribute “age”
can be considered as a derived attribute of “date of birth”. If
the base attribute is a QI, then the derived attribute should also
be considered as a QI. A composite attribute is any attribute
which is composed of more than one simple attribute. The
attribute “address” can be further divided into simple attributes
such as “locality” and “zip code”. If any composite attribute is
a QI, each of its simple attribute is also considered as a QI.
Figures 4. a) and 4. b) depict a derived attribute and composite
attribute respectively.
Fig. 4. (a) derived attribute (b) composite attribute
Consider QI1 in Fig. 2 as a derived attribute and QI2, a
composite attribute. The attribute graphs after replacing the
base attribute with derived attribute and composite attribute
with one of the simple attributes is shown in Fig 5. Each
attribute graph generated using this approach can be further
used for choosing QIs. One drawback of this approach is that
the composite attribute can’t be replaced with all the simple
attributes because doing so will result in the graph being
connected even after applying the cut vertex method.
Find the sensitivity label of each class
Output data No
Yes
50 JOURNAL OF COMMUNICATIONS SOFTWARE AND SYSTEMS, VOL. 16, NO. 1, MARCH 2020
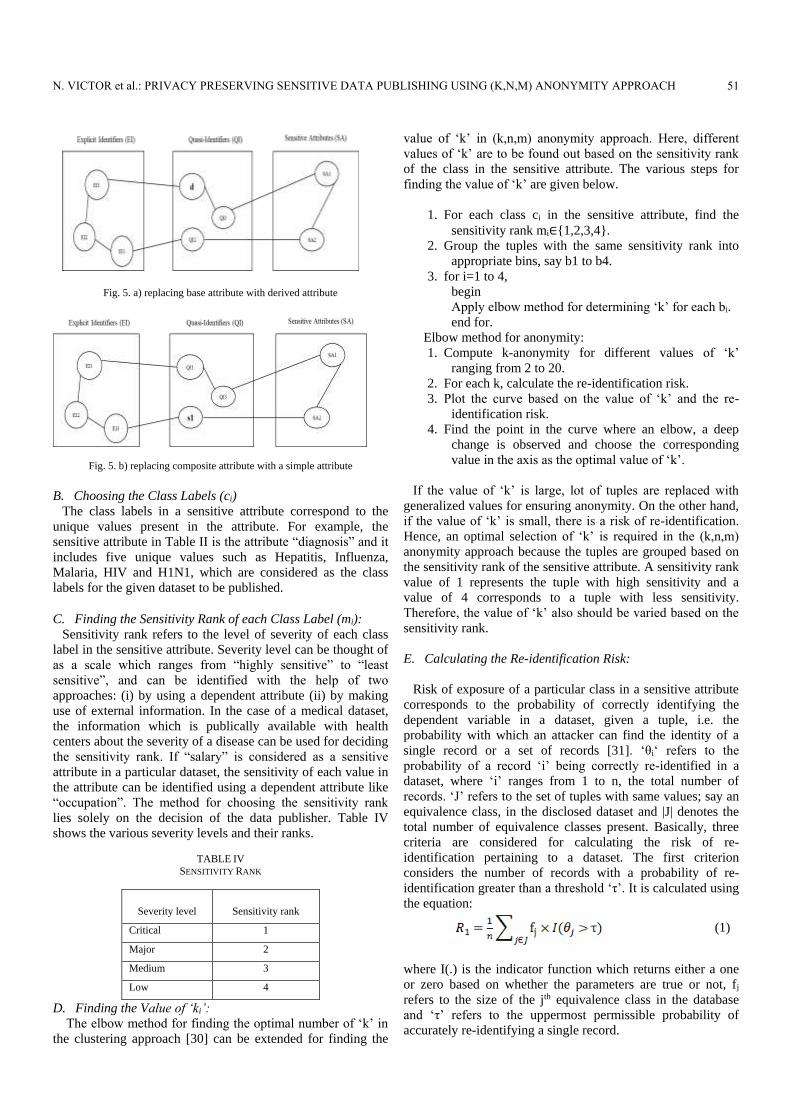
Fig. 5. a) replacing base attribute with derived attribute
Fig. 5. b) replacing composite attribute with a simple attribute
B. Choosing the Class Labels (ci)
The class labels in a sensitive attribute correspond to the
unique values present in the attribute. For example, the
sensitive attribute in Table II is the attribute “diagnosis” and it
includes five unique values such as Hepatitis, Influenza,
Malaria, HIV and H1N1, which are considered as the class
labels for the given dataset to be published.
C. Finding the Sensitivity Rank of each Class Label (mi):
Sensitivity rank refers to the level of severity of each class
label in the sensitive attribute. Severity level can be thought of
as a scale which ranges from “highly sensitive” to “least
sensitive”, and can be identified with the help of two
approaches: (i) by using a dependent attribute (ii) by making
use of external information. In the case of a medical dataset,
the information which is publically available with health
centers about the severity of a disease can be used for deciding
the sensitivity rank. If “salary” is considered as a sensitive
attribute in a particular dataset, the sensitivity of each value in
the attribute can be identified using a dependent attribute like
“occupation”. The method for choosing the sensitivity rank
lies solely on the decision of the data publisher. Table IV
shows the various severity levels and their ranks.
TABLE IV
SENSITIVITY RANK
Severity level Sensitivity rank
Critical 1
Major 2
Medium 3
Low 4
D. Finding the Value of ‘ki’:
The elbow method for finding the optimal number of ‘k’ in
the clustering approach [30] can be extended for finding the
value of ‘k’ in (k,n,m) anonymity approach. Here, different
values of ‘k’ are to be found out based on the sensitivity rank
of the class in the sensitive attribute. The various steps for
finding the value of ‘k’ are given below.
1. For each class ci in the sensitive attribute, find the
sensitivity rank mi∈{1,2,3,4}.
2. Group the tuples with the same sensitivity rank into
appropriate bins, say b1 to b4.
3. for i=1 to 4,
begin
Apply elbow method for determining ‘k’ for each bi.
end for.
Elbow method for anonymity:
1. Compute k-anonymity for different values of ‘k’
ranging from 2 to 20.
2. For each k, calculate the re-identification risk.
3. Plot the curve based on the value of ‘k’ and the re-
identification risk.
4. Find the point in the curve where an elbow, a deep
change is observed and choose the corresponding
value in the axis as the optimal value of ‘k’.
If the value of ‘k’ is large, lot of tuples are replaced with
generalized values for ensuring anonymity. On the other hand,
if the value of ‘k’ is small, there is a risk of re-identification.
Hence, an optimal selection of ‘k’ is required in the (k,n,m)
anonymity approach because the tuples are grouped based on
the sensitivity rank of the sensitive attribute. A sensitivity rank
value of 1 represents the tuple with high sensitivity and a
value of 4 corresponds to a tuple with less sensitivity.
Therefore, the value of ‘k’ also should be varied based on the
sensitivity rank.
E. Calculating the Re-identification Risk:
Risk of exposure of a particular class in a sensitive attribute
corresponds to the probability of correctly identifying the
dependent variable in a dataset, given a tuple, i.e. the
probability with which an attacker can find the identity of a
single record or a set of records [31]. ‘θi‘ refers to the
probability of a record ‘i’ being correctly re-identified in a
dataset, where ‘i’ ranges from 1 to n, the total number of
records. ‘J’ refers to the set of tuples with same values; say an
equivalence class, in the disclosed dataset and |J| denotes the
total number of equivalence classes present. Basically, three
criteria are considered for calculating the risk of re-
identification pertaining to a dataset. The first criterion
considers the number of records with a probability of re-
identification greater than a threshold ‘τ’. It is calculated using
the equation:
(1)
where I(.) is the indicator function which returns either a one
or zero based on whether the parameters are true or not, fj
refers to the size of the jth equivalence class in the database
and ‘τ’ refers to the uppermost permissible probability of
accurately re-identifying a single record.
N. VICTOR et al.: PRIVACY PRESERVING SENSITIVE DATA PUBLISHING USING (K,N,M) ANONYMITY APPROACH 51

Another criterion considers the equivalence class with
uppermost probability of re-identification risk. This represents
the entire dataset and is given by the equation:
(2)
The third criterion considers the average re-identification
probability of all tuples in the dataset, and is represented using
the equation given below:
(3)
Three different metrics have been devised mainly for
assessing the re-identification risks, which consists of the
prosecutor model, journalist model and the marketer model:
Prosecutor model: In this model, it is assumed that the attacker
has prior knowledge that the target is present in the database.
Target refers to the individual that is being re-identified.
Generally, the probability with which the target can be
correctly identified is given by the equation:
(4)
where ‘fj‘ refers to the size of the matching equivalence class
in the de-identified file.
The re-identification risk with respect to the prosecutor
model can be calculated using the three criteria mentioned
above:
(5)
(6)
(7)
Here, ‘p’ denotes the prosecutor risk, 1, 2 and 3 denotes the
three criteria, and fi refers to the size of equivalence class in
the de-identified dataset. If the de-identified file is same like
the population considered, then fj=FJ, where FJ represents the
size of the equivalence class in the population.
Journalist model: No background knowledge regarding the
presence of a particular record in the database is known to the
attacker. The presence of the target in the de-identified file is
not known to the attacker in this scenario, and the attacker
could be a journalist who tries to question a data custodian, as
he knows that all the people in the de-identified file exists in a
public data base. In the journalist scenario, the anonymized
data is a subset of a larger public database. The re-
identification risk is calculated as follows:
(8)
(9)
(10)
Marketer model: This model can be considered as a derived
metric which aims at re-identifying a larger number of
individuals, instead of focusing on a particular individual. In
this scenario, it gives a measure of the average number of
records that would be correctly re-identified when the intruder
tries to match all the records in the de-identified file. The
marketer is less concerned if some of the records are
misidentified. Here the risk pertains to everyone in the dataset,
as the marketer is less concerned about certain records being
wrongly re-identified since the focus is not on any particular
individual. The re-identification risk can be identified based
on whether the identifying dataset has exactly the same set of
records and data subjects as the de-identified file. The
equations are given below:
(11)
(12)
Since the data publisher always try to safeguard the
published data from prosecutor or journalist risks, by default
the data is protected against the marketer risk too. The
relationship between the three risks can be expressed as
follows:
Prosecutor risk ≥ Journalist risk ≥ Marketer risk
V. EVALUATION
The aim of this section is to evaluate the performance of
(k,n,m) anonymity approach for anonymizing sensitive data.
A. Experimental set up
ARX, a health data de-identification tool, is integrated with
our proposed method for evaluating its performance [32].
Extensive experimental evaluation has been done on three
different datasets [33] [34]. Table V presents the various
datasets used and the attributes considered for evaluation. This
gives an overview of the number of quasi-identifier attributes
and the number of levels (class labels) in the sensitive
attribute. TABLE V
DATASETS
Dataset Number of QI
attributes
Number of levels in the
sensitive attribute
Adult dataset 8 2
Toy dataset 4 2
Disease dataset 4 5
The “Adult” dataset consists of 30162 records after pre-
processing. Out of the 14 attributes, 8 have been taken as the
QI attributes. This includes age, gender, race, marital status,
educational qualification, native country, work class and
occupation. The attribute “salary” is taken as the sensitive
attribute. There are two levels in the sensitive attribute, which
52 JOURNAL OF COMMUNICATIONS SOFTWARE AND SYSTEMS, VOL. 16, NO. 1, MARCH 2020

corresponds to <=50K and >50K. Hence, the dataset is split
into two, and appropriate anonymization strategy is
performed. The toy dataset consists of just 7053 records with a
total of 7 attributes. The dataset “disease” consists of
approximately 18000 records with a total of 9 attributes. The
quasi-identifiers and sensitive attributes were chosen
according to the dataset under consideration.
B. Experimental Results
Each attribute should be first categorized as either
identifying, quasi-identifying, sensitive or non-sensitive
attributes. All the identifying attributes will be removed from
the dataset whereas the quasi-identifying attributes will be
transformed. Sensitive attributes will be kept as such, but are
protected using privacy models such as t-closeness. Non-
sensitive attributes won’t be modified and kept as such in the
original dataset. Transformation methods such as
generalization can be used for transforming the quasi-
identifiers, by specifying the minimum and maximum levels in
the generalization hierarchy. As the attribute ‘age’ is common
for all datasets considered for evaluation, it is explained in
detail with respect to the generalization schemes used. Fig. 6.
a) shows the generalization hierarchy for the attribute ‘age’.
Figures 6. b) and 6. c) represent the frequency distribution of
age values in the dataset before and after applying
generalization hierarchy schemes respectively.
Fig. 6. a) Generalization hierarchy of the attribute ‘age’
Fig. 6. b) Distribution of age values in the original dataset
As the generalization technique yielded an unequal
histogram due to the use of equal spaced bins, the technique is
further modified by using a simple equalization technique by
dividing the values into intervals that produce approximately
equal number of samples. The distribution of values after
equalization is presented in Fig. 6. d).
Fig. 6. c) Distribution of age values after applying generalization
Fig. 6. d) Distribution of age values after equalization
Once the generalization scheme is set for all quasi-
identifiers, the next step is to identify the number of sensitivity
ranks and hence the severity levels in the sensitive attribute
based on either the number of distinct values or using publicly
available data repositories. Fig. 7 shows the sensitivity ranks
of the sensitive attribute ‘disease’ used for evaluation [35].
Fig. 7. Sensitivity rank of various diseases
Based on the severity level, the original dataset is divided
into various small datasets, say, data splits, and each one is
treated separately for applying anonymization techniques. An
optimal search strategy is implemented in the proposed
method so that it accurately finds the transformation resulting
in the utmost possible quality of resultant data. Based on the
dataset under consideration, a global or local transformation
mechanism can be used. Figures 8. a) and 8. b) show the
contingency table with respect to the attributes ‘age’ and ‘sex’
before and after applying transformations, which depicts the
N. VICTOR et al.: PRIVACY PRESERVING SENSITIVE DATA PUBLISHING USING (K,N,M) ANONYMITY APPROACH 53

multivariate frequency distribution of the selected attributes.
‘*’ in Fig. 8. b) refers to the generalized gender value. i.e.
without disclosing whether the person is a male or female.
Here, the generalized values before equalization are taken into
account.
Fig. 8. a) Contingency table before applying transformation
Fig. 8. b) Contingency table after applying transformation
The next step is to find the appropriate value of ‘k’ for the
dataset splits by considering the severity level. A higher value
of ‘k’ is recommended for dataset splits with higher severity
levels when compared to the data splits with lesser severity
levels. Fig. 9 represents the risk associated with the original
dataset with different values of ‘k’ for anonymization.
Fig. 9. Risk associated with the dataset
An optimal value of ‘k’ is chosen for each data split based
on the “elbow method” used for the selection of ‘k’ in the
clustering approaches. For anonymization, the value of ‘k’ is
plotted against the risk associated with it and the optimal value
is chosen based on the “bend” in the plot obtained. As an
example, here the adult dataset is considered and different
values of ‘k’ ranging from 2 to 10 is chosen and risk
associated is measured after applying anonymization
techniques.
Table VI presents the different values based on the risk of re-
identification when applying different values of ‘k’.
TABLE VI
RISK OF RE-IDENTIFICATION
VALUE OF ‘K’ RECORDS AT
RISK (%) HIGHEST
RISK (%) SUCCESS
RATE (%)
2 8.61 50 5.95
3 4.29 33.33 3.99
4 1.46 25 2.5
5 0 20 2.18
6 0 16.67 1.97
7 0 14.29 1.78
8 0 12.5 1.6
9 0 11.11 1.51
10 0 10 1.45
Fig. 10 represents the values of risk of exposure such as the
highest risk, records at risk and success rate for different
values of ‘k’ ranging from 2 to 10.
Fig. 10. Choosing optimal value of ‘k’ based on elbow method
The value of ‘k’ for which the bend occurs is chosen as the
optimal value of ‘k’ for the data split. In Fig. 10, there can be
two choices for the bend, where the values of ‘k’ are 4 and 5.
After that the risk of exposure decreases very slowly. A better
option is to choose the value of ‘k’ as 5 as records at risk falls
to 0% after that. Similarly the optimal value of ‘k’ is chosen
for all the data splits and anonymization is applied. Based on
this, the values of ‘k’ and risk measures for each data split is
found out and appropriate anonymization strategy is applied.
Finally, all the data splits are combined to produce the
resultant anonymized dataset, which has different set of
equivalence classes for records with different sensitivity ranks.
The attribute-level quality and data level quality with
different values of ‘k’ for anonymization is shown in Fig. 11.
a), b), c) and d). Attribute level quality refers to the quality
estimates pertaining to the individual QIs, whereas data level
quality refers to the quality estimates pertaining to the entire
set of QIs.
Fig. 11. a) Attribute level quality after applying anonymization with the value
of k=2
54 JOURNAL OF COMMUNICATIONS SOFTWARE AND SYSTEMS, VOL. 16, NO. 1, MARCH 2020

Fig. 11. b) Data level quality after applying anonymization with the value of
k=2
Fig. 11. c) Attribute level quality after applying anonymization with the value
of k=10
Fig. 11.d) Data level quality after applying anonymization with the value of
k=2
VI. CONCLUSION
This paper aims at developing an anonymization technique
named as (k,n,m) anonymity based on the severity levels of
the values in the sensitive attribute, and thereby finding an
optimal value of ‘k’ for different records in the same dataset.
The well-known elbow method used for choosing ‘k’ in the
clustering approach is used for the selection of ‘k’ in (k,n,m)
anonymity technique by comparing the re-identification risk
associated with it. As the dataset is further divided into various
data splits based on the sensitivity ranks, a higher value of ‘k’
can be chosen for records with higher sensitivity ranks when
compared to the records with lesser sensitivity ranks. One of
the major applications of (k,n,m) anonymity lies in the
publishing of sensitive data such as medical records from
different hospitals, as the dataset does not rely on a single
value of ‘k’ for anonymization. The work can be further
extended by choosing ‘k’ based on other approaches and also
by integrating unstructured data into the model.
REFERENCES
[1] Ross, M. K., Wei, W., & Ohno-Machado, L., “Big data” and the electronic
health record. Yearbook of medical informatics, 23(01), 2014, pp. 97-
104. DOI: 10.15265/IY-2014-0003
[2] Stanley Huff M.D, “Open data sharing will improve care, lower costs”,
2017, [online] Available: https://www.athenahealth.com/insight/open-
data-sharing-will-improve-care-lower-costs
[3] Benjamin CM, Fung M, Wang K, Chen R, Yu PS. Privacy-preserving data
publishing: A survey of recent developments. ACM Computing
Surveys., 42(4): pp 1-53, 2010. DOI: 10.1145/1749603.1749605
[4] Yan Y, Wang W, Hao X, Zhang L. Finding Quasi-identifiers for K-
Anonymity Model by the Set of Cut-vertex. Engineering Letters.,
1;26(1), 2018.
[5] Brickell, J., & Shmatikov, V. (2008, August). The cost of privacy:
destruction of data-mining utility in anonymized data publishing.
In Proceedings of the 14th ACM SIGKDD international conference on
Knowledge discovery and data mining (pp. 70-78).
DOI:10.1145/1401890.1401904
[6] Li, T., & Li, N. (2009, June). On the tradeoff between privacy and utility in
data publishing. In Proceedings of the 15th ACM SIGKDD international
conference on Knowledge discovery and data mining (pp. 517-526).
DOI:10.1145/1557019.1557079
[7] Mivule, K., & Turner, C. (2013). A comparative analysis of data
privacy and utility parameter adjustment, using machine learning
classification as a gauge. Procedia computer science, 20, 414-419. DOI:
10.1016/j.procs.2013.09.295
[8] Guide to basic data anonymisation techniques, 2018, [online] Available:
https://www.pdpc.gov.sg/-/media/Files/PDPC/PDF-Files/Other-
Guides/Guide-to-Anonymisation_v1-(250118).pdf
[9] Sweeney, Latanya. "k-anonymity: A model for protecting
privacy." International Journal of Uncertainty, Fuzziness and
Knowledge-Based Systems 10, no. 05, 2002, pp: 557-570. DOI:
10.1142/S0218488502001648
[10] Machanavajjhala A, Gehrke J, Kifer D, Venkitasubramaniam M. “l-
diversity: Privacy beyond k-anonymity”. in 22nd International
Conference on Data Engineering (ICDE'06), IEEE, 2006 Apr 3, pp. 24-
24. DOI: 10.1109/ICDE.2006.1
[11] Li N, Li T, Venkatasubramanian S. t-closeness: Privacy beyond k-
anonymity and l-diversity. in 2007 IEEE 23rd International Conference
on Data Engineering, IEEE, 2007 Apr 15, pp. 106-115. DOI:
10.1109/ICDE.2007.367856
[12] Dwork C. Differential privacy. Encyclopedia of Cryptography and
Security. 2011: pp 338-40. DOI:10.1007/978-1-4419-5906-5_752
[13] Liu, Xiangwen, Qingqing Xie, and Liangmin Wang. "Personalized
extended (α, k)‐anonymity model for privacy‐preserving data
publishing." Concurrency and Computation: Practice and Experience 29,
no. 6 (2017): e3886. DOI: 10.1002/cpe.3886
[14] Mehta, Brijesh B., and Udai Pratap Rao. "Privacy preserving big data
publishing: a scalable k-anonymization approach using MapReduce." Iet
Software 11, no. 5 (2017): 271-276. DOI: 10.1049/iet-sen.2016.0264
[15] Onashoga, S. A., B. A. Bamiro, A. T. Akinwale, and J. A. Oguntuase.
"KC-Slice: A dynamic privacy-preserving data publishing technique for
multisensitive attributes." Information Security Journal: A Global
Perspective 26, no. 3 (2017): 121-135. DOI: 10.1080/19393555.2017.13
19522
[16] Lee, Hyukki, Soohyung Kim, Jong Wook Kim, and Yon Dohn Chung.
"Utility-preserving anonymization for health data publishing." BMC
medical informatics and decision making 17, no. 1 (2017): 104. DOI:
10.1186/s12911-017-0499-0
[17] Wang, Zhibo, Xiaoyi Pang, Yahong Chen, Huajie Shao, Qian Wang,
Libing Wu, Honglong Chen, and Hairong Qi. "Privacy-preserving
crowd-sourced statistical data publishing with an untrusted
server." IEEE Transactions on Mobile Computing 18, no. 6 (2018):
1356-1367. DOI: 10.1109/TMC.2018.2861765
[18] Yang, Dingqi, Bingqing Qu, and Philippe Cudré-Mauroux. "Privacy-
preserving social media data publishing for personalized ranking-based
recommendation." IEEE Transactions on Knowledge and Data
Engineering 31, no. 3 (2018): 507-520. DOI: 10.1109/TKDE.2018.2840
974
[19] Bindschaedler, Vincent, Reza Shokri, and Carl A. Gunter. "Plausible
deniability for privacy-preserving data synthesis." arXiv preprint
arXiv:1708.07975 (2017). DOI: 10.14778/3055540.3055542
[20] Zhang, Jinquan, Bowen Zhao, Guochao Song, Lina Ni, and Jiguo Yu.
"Maximum delay anonymous clustering feature tree based privacy-
N. VICTOR et al.: PRIVACY PRESERVING SENSITIVE DATA PUBLISHING USING (K,N,M) ANONYMITY APPROACH 55
preserving data publishing in social networks." Procedia Computer
Science 147 (2019): 643-646. DOI: 10.1016/j.procs.2019.01.190
[21] Mehta, Brijesh B., and Udai Pratap Rao. "Improved l-Diversity: Scalable
Anonymization Approach for Privacy Preserving Big Data
Publishing." Journal of King Saud University-Computer and Information
Sciences (2019). DOI: 10.1016/j.jksuci.2019.08.006
[22] Piao, Chunhui, Yajuan Shi, Jiaqi Yan, Changyou Zhang, and Liping Liu.
"Privacy-preserving governmental data publishing: A fog-computing-
based differential privacy approach." Future Generation Computer
Systems 90 (2019): 158-174. DOI: 10.1016/j.future.2018.07.038
[23] Victor N, Lopez D, Abawajy JH. Privacy models for big data: a survey.
International Journal of Big Data Intelligence. 3(1), 2016, pp 61-75.
DOI: 10.1504/IJBDI.2016.073904
[24] Victor N, Lopez D. “Privacy Preserving Big Data Publishing:
Challenges, Techniques, and Architectures”. in HCI Challenges and
Privacy Preservation in Big Data Security, IGI Global. 2018, pp. 47-70.
DOI: 10.4018/978-1-5225-2863-0.ch003
[25] How Google anonymizes data, [online]. Available: https://policies.googl
e.com/te chnologies/anonymization?hl=en-US
[26] Office for Civil Rights (OCR). Guidance regarding methods for de-
identification of protected health information in accordance with the
Health Insurance Portability and Accountability Act (HIPAA) Privacy
Rule.
[27] Motwani R, Xu Y. Efficient algorithms for masking and finding quasi-
identifiers. In Proceedings of the Conference on Very Large Data Bases
(VLDB), pp. 83-93, 2007.
[28] Detecting quasi-identifiers in datasets, by International Business
Machines Corporation, Armonk, NY (US), (2015, May 22), Patent
US20160342636A1
[29] Han J, Yu H, Yu J. An improved l-diversity model for numerical
sensitive attributes. in 2008 Third International Conference on
Communications and Networking in China pp. 938-943, 2008. DOI:
10.1109/CHINACOM.2008.4685178
[30] Kodinariya TM, Makwana PR. Review on determining number of
Cluster in K-Means Clustering. International Journal. (6):90-5, 2013.
[31] El Emam K. Guide to the de-identification of personal health
information. Auerbach Publications; 2013.
[32] Prasser, F., & Kohlmayer, F. (2015). Putting statistical disclosure control
into practice: The ARX data anonymization tool. In Medical Data
Privacy Handbook (pp. 111-148). Springer, Cham. DOI: 10.1007/978-3-
319-23633-9_6
[33] Prasser, F., Kohlmayer, F., & Kuhn, K. A. (2014, May). A benchmark of
globally-optimal anonymization methods for biomedical data. In 2014
IEEE 27th International Symposium on Computer-Based Medical
Systems (pp. 66-71). IEEE. DOI: 10.1109/CBMS.2014.85
[34] Ron Kohavi, "Scaling Up the Accuracy of Naive-Bayes Classifiers: a
Decision-Tree Hybrid", Proceedings of the Second International
Conference on Knowledge Discovery and Data Mining, 1996
[35] Leading causes of death and numbers of deaths, by sex, race, and
Hispanic origin: United States, 1980 and 2016 [online]
https://www.cdc.gov/nchs/hus/contents2017.htm#019.
Nancy Victor is currently working as an Assistant
Professor at Vellore Institute of Technology, Vellore,
Tamilnadu India. She received her M.Tech in
Computer and Information Technology from
Manonmaniam Sundaramar University with first rank
and gold medal. She completed her B.Tech from
Kerala University. She is a member of LITD 27,
Bureau of Indian Standards. She is an active
researcher in the field of big data privacy. Her
research interests include privacy preserving data
publishing, data anonymisation, big data privacy, etc.
Daphne Lopez is a Professor in the School of
Information Technology and Engineering, Vellore
Institute of Technology University. Her research
spans the fields of grid and cloud computing, spatial
and temporal data mining and big data. She has a
vast experience in teaching and industry. Prior to
this, she has worked in the software industry as a
consultant in data warehouse and business
intelligence.
56 JOURNAL OF COMMUNICATIONS SOFTWARE AND SYSTEMS, VOL. 16, NO. 1, MARCH 2020