private and social costs of patent trolls
TRANSCRIPT
THE PRIVATE AND SOCIAL COSTS OF PATENT TROLLS
Boston University School of Law Working Paper No. 11-45 (September 19, 2011)
Revision of November 9, 2011
James Bessen Boston University School of Law
Jennifer Ford
Boston University School of Law
Michael J. Meurer Boston University School of Law
This paper can be downloaded without charge at:
http://www.bu.edu/law/faculty/scholarship/workingpapers/2011.html
The Private and Social Costs of Patent Trolls
Version: November 2011
By James Bessen, Jennifer Ford and Michael J. Meurer*
Abstract: In the past, non-practicing entities (NPEs) — firms that license patents withoutproducing goods — have facilitated technology markets and increased rents for small inventors.Is this also true for today’s NPEs? Or are they “patent trolls” who opportunistically litigate oversoftware patents with unpredictable boundaries? Using stock market event studies around patentlawsuit filings, we find that NPE lawsuits are associated with half a trillion dollars of lost wealthto defendants from 1990 through 2010, mostly from technology companies. Moreover, very littleof this loss represents a transfer to small inventors. Instead, it implies reduced innovationincentives and a net loss of social welfare.
Keywords: patent, litigation, litigation cost, non-practicing entities, software patents JEL Classifications: O31, O34, K41
*Boston University School of Law. Thanks to Colleen Chien, Dennis Crouch and Michael Rischfor comments. Thanks to research assistance from Tim Layton, data from Patent Freedom andsome support from the Coalition for Patent Fairness. A version of this working paper will bepublished in Regulation.
Contact: [email protected]
2 – Troll – 10/11
Executive Summary
Firms that license patents without producing goods—“ non-practicing entities” (NPEs)—have historically facilitated technology markets and increased the profits that small inventorsearn from their inventions.
But a self-described new crop of NPEs has emerged that asserts patents and litigates themon an unprecedented scale, involving thousands of defendants every year in hundreds of lawsuits.Do these litigating NPEs improve markets for technology and increase incentives for smallinventors? Or are they “patent trolls” who exploit weaknesses in the patent system?
This paper makes several findings about this litigation. First, by observing what happensto a defendant’s stock price around the filing of a patent lawsuit, we are able to assess the effectof the lawsuit on the firm’s wealth, after taking into account general market trends and randomfactors affecting the individual stock. We find that NPE lawsuits are associated with half atrillion dollars of lost wealth to defendants from 1990 through 2010. During the last four yearsthe lost wealth has averaged over $80 billion per year. These defendants are mostly technologycompanies who invest heavily in R&D. To the extent that this litigation represents anunavoidable business cost to technology developers, it reduces the profits that these firms makeon their technology investments. That is, these lawsuits substantially reduce their incentives toinnovate.
Second, by exploring publicly listed NPEs, we find that very little of this loss of wealthrepresents a transfer to inventors. This suggests that the loss of incentives to the defendant firmsis not matched by an increase in incentives to other inventors.
Third, the characteristics of this litigation are distinctive: it is focused on software andrelated technologies, it targets firms that have already developed technology, and most of theselawsuits involve multiple large companies as defendants. These characteristics suggest that thislitigation exploits weaknesses in the patent system. In our book Patent Failure, we argue thatpatents on software and business methods are litigated much more frequently because they have“fuzzy boundaries.” The scope of these patents is not clear, they are often written in vaguelanguage, and technology companies cannot easily find them and understand what they claim. Itappears that much of the NPE litigation takes advantages of these weaknesses.
We conclude that the loss of billions of dollars of wealth associated with these lawsuitsharms society. While the lawsuits increase incentives to acquire vague, over-reaching patents,they decrease incentives for real innovation overall.
3 – Troll – 10/11
1 Introduction
In 2010, operating companies in the US found themselves in lawsuits initiated by non-
practicing entities (NPEs) more than 2,600 times, over five times more often than in 2004 (Patent
Freedom 2011). Is this a good thing or a bad thing?
NPEs are firms that do not produce goods, rather they acquire patents in order to license
them to others.1 In principle, NPEs can perform the socially valuable function of facilitating
markets for technology. Some inventors lack the resources and expertise needed to successfully
license their technologies or, if necessary, to enforce their patents. NPEs provide a way for these
inventors to earn rents that they might not otherwise realize, thus providing them with greater
incentives to innovate. For example, economic historians find evidence of a robust market for
technology during the nineteenth century that allowed individual inventors to earn returns on
their inventions in the era before the rise of the large R&D laboratories (Lamoreaux and Sokoloff
1999).2 Optimists argue that the current crop of NPEs perform a similar function and should not
be discouraged (Hosie 2008, McDonough 2006, Shrestha 2010, Myhrvold 2010, Morgan 2008).
On the other hand, the recent surge in NPE-related litigation may be more insidious.
Critics, including many technology firms, compare these NPEs to the mythical trolls who hide
under bridges built by other people, unexpectedly popping up to demand payment of tolls (see,
for example, Temple 2011). The critics call these NPEs “patent trolls,” claiming that they buy up
vaguely worded patents that can be construed to cover established technologies and use them
opportunistically to extract licensing fees from the real innovators. Indeed, there has been a
general and dramatic rise in patent litigation that some analysts attribute to rapid growth in the
number of patents with unclear or unpredictable boundaries (Bessen and Meurer 2008, FTC
1A wide variety of non-practicing firms engage in patent markets including patent brokers, consultants, auctioneers,and more (see Yanagisawa and Guellec 2009 for an overview). Our focus is on non-practicing firms that assert andlitigate patents.
2 See also Magliocca (2007) about less socially beneficial activities of nineteenth century NPEs.
4 – Troll – 10/11
2011). To the extent that the recent NPEs opportunistically assert “fuzzy patents” against real
technology firms, they can decrease the incentives for these firms to innovate. Innovators
deciding to invest in new technology have to consider the risk of inadvertent infringement as a
cost of doing business. This risk reduces the rents they can expect to earn on their investment and
hence decreases their willingness to invest..
Using empirical evidence, this paper investigates the effect of the current crop of NPE
litigation on innovation incentives and on social welfare. We begin by estimating the private
losses to publicly listed companies who are defendants in NPE patent litigation by measuring the
reaction of the defendant firm’s share price during the days following the filing of the lawsuit.3
Using a database of patent lawsuits collected by Patent Freedom (2011), we perform 4,114 of
these event studies from 1990 through 2010. In theory, investors respond to the news of a lawsuit
filing by reducing their expectations of future earnings for the defendant firm. This reduction
should reflect all the costs the firm faces from the suit, including lost business, fees paid to settle
the case, etc., depending on how investors expect the suit to be resolved. Investors also consider
the loss or delay of profits from future opportunities. The total change in expected profits is
reflected by a drop in the share price.
Of course, other events also affect the share price on any given day, including events that
affect the market generally and idiosyncratic events that affect the firm being studied. We use
standard methods to control for the effect of the market and we average over a large number of
lawsuits to filter out random idiosyncratic price changes. This allows us to estimate the average
percentage change in the defendant’s stock price for each lawsuit filing and the change in market
capitalization of outstanding common stock. Aggregating the change in market capitalization
over two decades, we find that the aggregate loss of wealth to these firms exceeds half a trillion
dollars. Over the last four years, the loss of wealth exceeds $83 billion per year. It is possible, of
3 In this paper, we use the term “defendant” to refer to the firm against which the NPE is asserting a patent. In somecases, this firm will technically be the plaintiff in a legal action seeking a declaratory judgment.
5 – Troll – 10/11
course, that the stock market initially overreacts to news of a lawsuit filing, possibly making our
estimates overstated. We present evidence below to argue that this does not likely bias our results
significantly.
This private loss might seem surprisingly large, but it does not necessarily mean that this
litigation harms society. The effect on society depends on two considerations. First, there is a
static effect on net social welfare. To the extent that litigation involves socially wasteful activity,
such as a diversion of firm resources from production to litigation support, it reduces social
welfare. Such activity implies a “deadweight” loss. On the other hand, to the extent that the
losses just represent transfers of wealth from one party to another — perhaps from large
defendants to independent inventors — then the static effect on social welfare could be neutral.
Second, there is a dynamic effect: this litigation could increase or decrease innovation
incentives overall, thus affecting future social welfare. The large private losses seem to imply a
disincentive for the defendants, who are largely technology firms after all. But perhaps transfers
to the patent holders constitute a positive incentive to them that more than compensates for the
disincentives imposed on the defendant firms. Then the dynamic effect could be to increase
innovation incentives overall.
Some general evidence leans against such an optimistic evaluation. The literature on
litigation commonly finds that the loss of wealth experienced by defendants is, in fact, largely a
deadweight social loss; little of it flows to the plaintiffs (Bhagat and Romano 2002). Moreover,
the large magnitude of lost wealth in these patent cases seems hard to reconcile with a story of
transfers to independent inventors — in recent years the losses comprise a significant fraction of
total US R&D spending. If these losses were offset by massive transfers to independent
inventors, we think we would have heard or read reports documenting this bonanza and a
corresponding surge in research activities by small inventors. There is little evidence that NPE
litigation has produced massive transfers to independent – or any other sort of – inventor.
6 – Troll – 10/11
Nevertheless it is helpful to look specifically at evidence of the wealth actually
transferred to NPEs and to inventors as a result of NPE litigation. Using the financial statements
of publicly listed NPE firms, we obtain upper bound estimates on these transfers. We find that
relatively little of the wealth lost by defendant firms shows up as a transfer to NPEs and
relatively little of the funds flowing to NPEs is transferred to outside inventors. It appears that
there are a lot of big losers in NPE litigation and few beneficiaries.
These findings allow us to draw some conclusions about the effect of the recent surge in
NPE litigation on markets for technology, how the current crop of NPEs are different from those
in the past, and how this affects innovation incentives.
1.1 Literature Review
Various sorts of NPEs have long played an important role in technology markets (see
Arora et al. 2004). For example, Arora (1997) documents the pivotal role that specialized
engineering firms play in the refining and petrochemical industries by licensing their technology.
Several commentators have argued that today’s NPEs play a similar role in facilitating markets
(McDonough 2006, Hosie 2008, Morgan 2008, Myhrvold 2010). It is crucial to note, however,
that the firms studied by Arora provided valuable technological information as well as patent and
trade secret licenses to licensees. It appears that the current crop of NPEs usually offers naked
patent licenses after the technology in question has already been developed (FTC 2011). Little
empirical evidence has been advanced to show whether today’s NPEs are providing enhanced
incentives to small inventors or whether NPE litigation is inhibiting innovation.
What evidence we have supports the view that today’s NPE are different from the
specialized engineering firms operating in chemical industries. Consider the following distinctive
aspects of current NPE litigation:
1. The scale of litigation. While Ball and Kesan (2008) show that NPEs accounted for
7 – Troll – 10/11
only about 5% of patent litigation in 2000-2002, Chien finds (2009) that NPEs
account for 17% of high tech patent lawsuits. Patent Freedom (2011) finds that NPEs
account for 16% of all patent lawsuits in 2009. This amounts to hundreds of lawsuits
per year.
2. Many of these lawsuits involve multiple defendants (Chien 2009), making the
effective impact greater. The lawsuits involve thousands of defendants per year.
3. Much of this litigation concerns software patents, including business process patents.
Chien finds that 90% of the high tech NPE lawsuits involve software or finance
patents. Allison et al. (2010) study patents litigated multiple times and find that
software patents account for 94% of the lawsuits.
4. These lawsuits tend to happen long after the initial patent application. Allison et al.
(2009) find that the patents in these lawsuits are much more likely to have multiple
continuing applications, allowing for claims to be modified long after the initial
application. Risch (2012) finds that the mean NPE lawsuit occurs 8 years after the
patent was issued.4 Love (2010) finds that NPEs are far more likely to enforce old
patents than practicing entities. The long delays suggest that in many cases these
patents are not asserted until other firms actually develop the technology.
These findings suggest that today’s NPEs are distinct in some ways, however, that does
not really tell us much about their effect on innovation. Shrestha (2010) compares the
characteristics of patents in NPE lawsuits to a sample of other patents (see also Allison et al.
2009, Risch 2012, Fischer and Henkel 2011). Finding, for example, that NPE patents receive
more citations than other patents, Shrestha concludes that many NPEs hold “high value” patents
and are therefore good for innovation.5 Unfortunately, this conclusion does not logically follow.
While it is true that higher value patents tend to receive more citations, this is a rather weak
4 And this underestimates the lag because it only considers lawsuits filed by 2010.
5 Shrestha also looks at non-self citations and indices of originality and generality.
8 – Troll – 10/11
correlation and many factors other than value can influence citations received, including self-
citations (Bessen 2008). This correlation does not imply that NPE litigated patents are more
valuable just because they have more citations.6 Moreover, even if these patents are valuable, it is
important to remember that the ultimate question is whether or not enforcement of these patents
provides a net incentive for innovation.7 This paper looks at the actual transfer of wealth to
inventors from NPE patent litigation.
Shrestha also looks at win rates for those lawsuits that do proceed to a final judgment,
finding that NPEs have similar win rates to other patent plaintiffs. Based on this, Shrestha
concludes that these lawsuits are not “frivolous.” However, this finding is based on a very small
sample and the lawsuits that proceed to final judgment are not necessarily representative of all of
the lawsuits filed. Moreover, Risch (2012) finds much higher rates of invalidation of NPE
patents brought to judgment (54% had no valid claims while an additional 44% had some invalid
claims). Allison et al. (2010) look at win rates for a larger sample of the most-litigated patents
and find that plaintiff win rates are much lower than for other patent litigation. But even so, this
does not directly measure how harmful the litigation is to innovation or to social welfare. Using
extensive event studies, this paper measures the private losses that result from NPE litigation and
relates this to possible social losses.
The event study methodology has been used before to study litigation, beginning with
Cutler and Summers (1988) in the context of litigation over a merger. Several papers have
performed event studies of patent litigation, both the event of the initial filing and the terminating
event (settlement, judgment or verdict), including small sample studies by Bhagat, et al. (1994),
Lerner (1995), Bhagat et al. (1998), Lunney (2004), Haslem (2005), and a large sample study by
6 In effect, Shrestha is arguing: A) Valuable patents receive higher citations, and, B) NPE litigated patents receivehigher citations, therefore, C) NPE litigated patents are valuable patents. This is a classic logical fallacy.
7 Broad patents that can be credibly asserted against valuable technologies might have enormous private value and atthe same time negative social value when they are not disclosed until after the technology was independentlydeveloped, and especially when they face a significant risk of invalidity. Such patents might attract a large number ofcitations, and might also retard innovation.
9 – Troll – 10/11
Bessen and Meurer (2007). None of these studies looked specifically at NPE litigation.
2 Data and Methods
2.1 Data Sources
The data for this research comes from two primary sources. The first source is an
extensive database of NPE lawsuits generously provided by Patent Freedom, an organization
devoted to researching and providing information on NPE behavior and activities. Patent
Freedom defines a non-practicing entities as companies that “do not practice their inventions in
products or service, or otherwise derive a substantial portion of their revenues from the sale of
products and services in the marketplace. Instead, NPEs seek to derive the majority of their
income from the enforcement of patent rights.” Since we study litigation, we only focus on those
NPEs who file lawsuits (“patent assertion entities”).
The second data source is the Center for Research in Security Prices (CRSP) US Stock
Database, a comprehensive collection of security information. Using these sources, a sample
comprised of all instances in which a known NPE sued a publicly traded firm between 1990 and
October 2010 was constructed. This was done by first matching defendant names with a
previously constructed list of public domestic firms and subsidiaries using a software program,
and then manually reviewing the resulting list and updating matches that had been either missed
by or incorrectly assigned by the software. To assess the validity and coverage of the matches, a
random sample of 100 parties was manually checked using corporate websites and CRSP’s
Company Code Lookup tool. For this sample, while 11% of parties that were either public
companies or their subsidiaries were left unmatched, there were no false positives.
This process yielded a sample of 1,630 lawsuits filed by a NPE against one or more
publicly listed defendants. Because many of these lawsuits were filed against multiple
defendants, the total number of events in the sample was substantially higher than the number of
10 – Troll – 10/11
suits, at 4,114 (for the sample using a 5 day window to measure the returns).
Finally, we linked the data in our sample to Compustat and to data from Derwent Litalert
to obtain information on firm characteristics and patents involved in the lawsuits. We also used
financial information on publicly listed NPEs from Compustat.
2.2 Estimating Cumulative Abnormal Returns
To estimate the impact of a lawsuit filing on the value of a firm, we use event study
methodology (see Mackinlay 1997 for a review). In particular, we use the dummy variable
method described by Michael Salinger (1992).8 This assumes that stock returns follow a market
model,
(1) rt � � � � rtm � �t
where rt is the return on a particular stock at time t, rtm
is the compounded return on a market
portfolio, and �t is a stochastic error. If an event, such as a lawsuit filing, occurs on day T, then
there may be an “abnormal return” to the particular stock on that day. This can be captured using
a dummy variable,
(2) rt � � � � rtm � � I t � �t
where It equals 1 if t=T and 0 otherwise. Equation (2) can be estimated using OLS for a single
event. In practice, this equation is estimated over the event period and also over a sufficiently
long pre-event window. In this paper we use a 200 trading-day pre-event window. The
coefficient estimate of δ obtained by this procedure is then an estimate of the abnormal return on
this particular stock. For different stocks, the precision of the estimates of � will vary depending
on how well equation (2) fits the data. The estimated coefficient variance from the regression
8 Salinger shows that this model is mathematically equivalent to the OLS market model described in Brown andWarner (1985) and widely used.
11 – Troll – 10/11
provides a measure of the precision of the estimate of the abnormal return.
We want to obtain a representative estimate of the abnormal returns from lawsuit filings
for multiple stocks, under the assumption that these represent independent events and that they
share the same underlying “true” mean. Previous papers estimating abnormal returns from patent
lawsuits have simply reported unweighted means for the group of firms. Although the
unweighted mean is an unbiased estimator, it is not efficient. Since we are concerned with
obtaining the best estimate to use in policy calculations (and not just testing the sign of the
mean), we use a weighted mean to estimate the “average abnormal return,” where the weight for
each observation is proportional to the inverse of the variance of the estimate of δ for that firm.9
When we test our means against the null hypothesis that the true mean is zero, we report
both the significance of t-tests using the weighted mean and also the significance of the Z
statistic (see Dodd and Warner 1983), a widely used parametric test of significance that
incorporates the variation in precision across events.10 In any case, the significance test results
are closely similar as are those of some non-parametric tests.
Finally, (2) describes the abnormal return for a single day. It is straightforward to design
dummy variables to estimate a “cumulative abnormal return” (CAR) over an event window
consisting of multiple consecutive days. In the following, for instance, if the suit is filed on date
t=T, then we may use a window from day T-1 to T+4.
3 Empirical Findings
3.1 Summary statistics
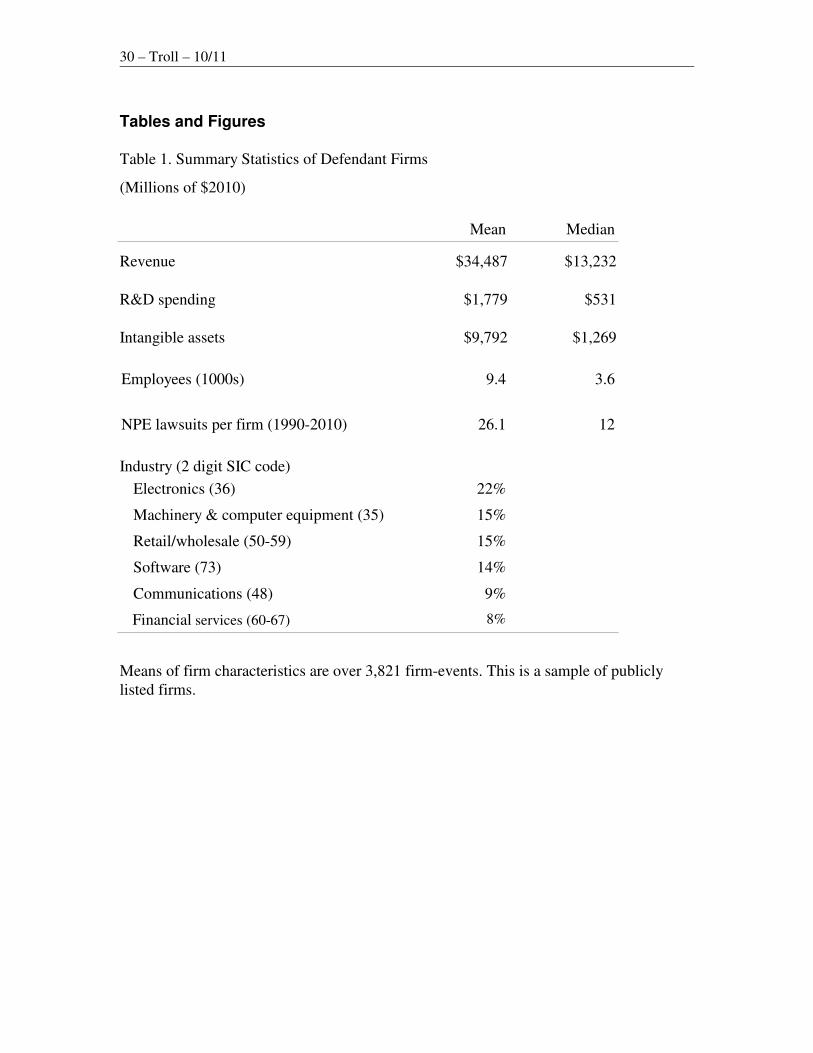
Some characteristics of defendant firms in our sample are reported in Table 1. These are,
on average, large firms. Almost two thirds of the firms are technology firms, including software
9 In any case, we find that for our entire sample, the weighted mean is quite close to the unweighted mean and also tothe median.
10 The Z statistic is a joint test of the individual firm t-tests. We use a robust version described in Kramer (2001).
12 – Troll – 10/11
and communications firms, and these firms, on average, spend a lot on R&D and have very
substantial intangible assets. A significant number of financial, retail and wholesale firms are
also represented. And these firms are typically subject to multiple NPE lawsuits.
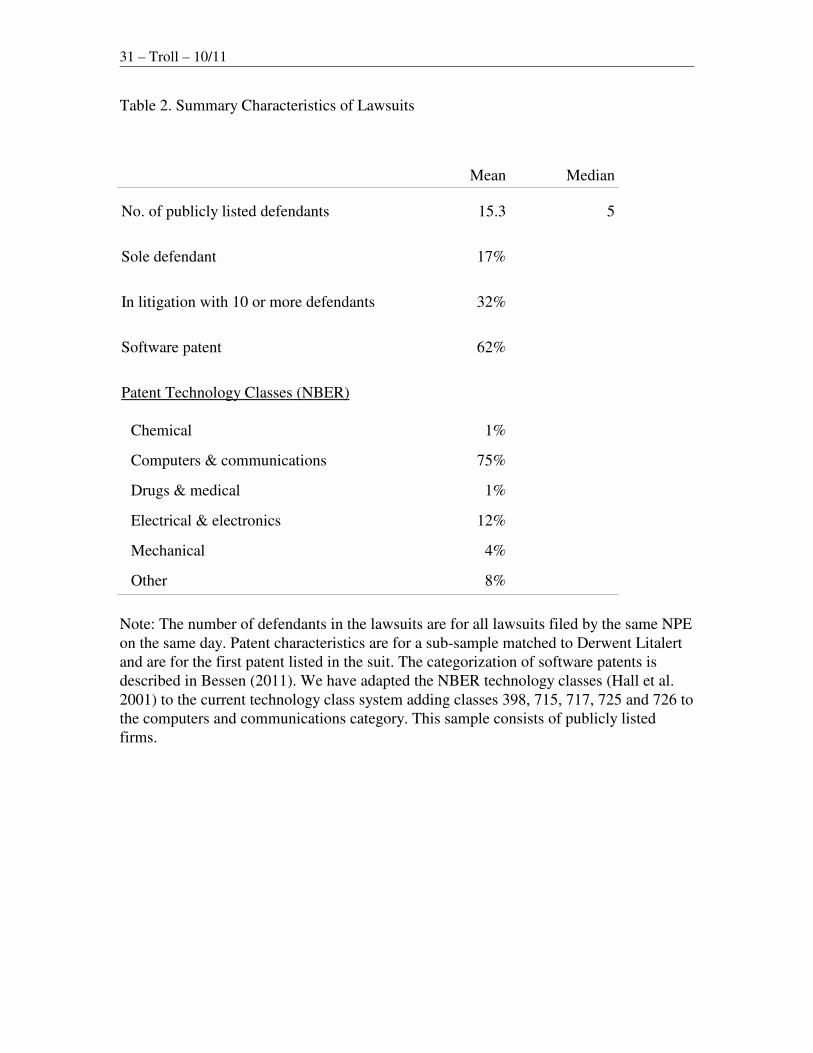
Table 2 shows that most of the NPE disputes involve multiple defendants, either in the
same suits or from multiple suits filed by the NPE on the same day.11 The number of publicly
listed defendants mostly range between two and nine defendants (median of 5). Only 17% of the
defendants were the sole defendant listed. This contrasts sharply with other patent litigation
where 85% of defendants are solo (Bessen and Meurer 2007).
Another difference is the distribution of these patents across technology classes. Looking
at the main patent listed in Derwent, about 62% of the patents are software patents, using the
technology class categorization used in Bessen (2011). Using the NBER categorization (Hall et
al. 2001), 75% of the patents are in computer and communications technology. Thus this sample
shows the same concentration of NPE litigation in software and related technologies as in earlier
studies. Both this technological concentration and the prevalence of multiple defendants are
important for interpreting the nature of the current crop of NPEs.
3.2 Estimates of cumulative abnormal returns
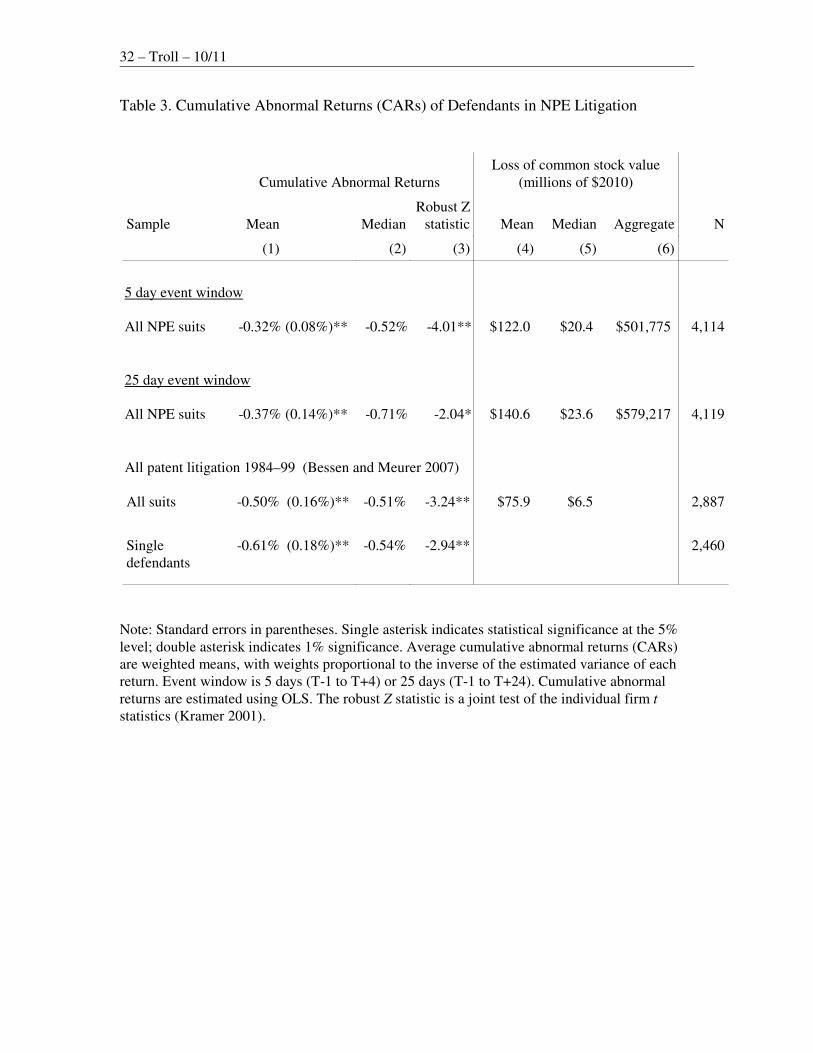
Table 3 reports basic estimates of cumulative abnormal returns (CARs) for the sample of
NPE defendants. Columns 1 and 2 report the weighted mean (with standard error) and median
values. The first row shows the results using a five day event window that starts one day before
the lawsuit filing and continues through the fourth day after. The mean loss is 0.32% and the
median loss is 0.52%.
One concern is that this estimate of lost value might reflect a temporary over-reaction on
the part of investors. Given that there are now hundreds of these troll lawsuits every year, it is
11 The numbers are also high if we restrict the defendants to the same suit filings.
13 – Troll – 10/11
hard to understand why investors would consistently over-react and never learn from their
mistakes. Nevertheless, a persistent over-reaction would be noticed by arbitrageurs who would
then come in, buy the artificially low stock and thus drive the price up to a more accurate level. If
it took some time for arbitrageurs to enter, the price we observe during the five day event
window might be artificially low, making our estimate of losses too high.
One way to check this is to look at a longer event window to see if the stock showed
evidence of recovery over the subsequent month or so. The second row reports results for a
comparable analysis using a 25 day window. If it took some time before wiser investors
arbitraged the stock, then we should see some evidence of a price correction within this longer
window. Instead, the CARs in this row are slightly larger (more negative) than those in the five
day window. This suggests that the initial loss of wealth was not an overreaction by investors
that was subsequently corrected, at least not within 25 days. Because the longer window has
larger standard errors as a result of the measurement technique, we use the sample with the five
day event window for most of the remaining analysis.
Perhaps, instead, the stock price stays artificially low until the lawsuit is resolved. This
might be the case if investors react to the uncertainty of the lawsuit, demanding a higher return
on investment until the uncertainty is resolved. If this were the case, then we should see an
increase in the stock price at the announcement that the suit was settled. However, two event
studies of lawsuit settlements find no such positive correction on average, suggesting that
investors overall appear to anticipate settlement correctly, pricing it in to the share value.12 Thus
this theory, too, seems difficult to reconcile with the evidence. While we accept the idea that
investors do not always act rationally, we have found no explanation consistent with the evidence
for why investors should persistently over-react to lawsuit filings.
The estimated CARs are substantially smaller than those found in the study of all patent
12 Haslem (2005) finds a statistically significant decrease in the stock price on settlement. Bhagat et al. (1998) find aCAR that is not significantly different from zero.
14 – Troll – 10/11
lawsuits involving publicly listed firms from 1984 to 1999 by Bessen and Meurer (2007). The
third row shows the CARs for defendant firms from that study and the fourth row shows the
CARs from solo defendant firms in that study. We parse out the results in the fourth row to
provide the most relevant comparison to the NPE lawsuits in this study. Most NPE lawsuits in
our current study have multiple defendants (83%). Most of the lawsuits in our earlier studied
involved a single defendant (85%); we suspect that almost all of those lawsuits do not involve an
NPE plaintiff. The mean CAR for all single-defendant lawsuits is nearly twice as large as the
mean CAR reported for the five day window in the NPE sample. This difference is also
statistically significant.13
The NPE CARs are also much smaller than those reported in the previous literature on
patent litigation event studies. For example, Bhagat et al. (1998) study 33 defendants of patent
lawsuits announced in the Wall Street Journal. They find a mean CAR of -1.50%, nearly five
times larger than the estimate here. Studying 26 biotech firms, Lerner (1995) found a 2.0%
reduction in the wealth of the defendants and plaintiffs combined.
3.3 Why do NPE lawsuits cause smaller percentage losses?
One clear reason that the NPE lawsuits have lower CARs than in previous studies is that
the sample of defendants in the NPE lawsuits is very different from the samples in the earlier
studies. Some of those studies found much larger losses but used highly select small samples of
lawsuits that had been announced in the Wall Street Journal or Dow Jones News Service. Bessen
and Meurer (2007) show that patent lawsuits announced in the Wall Street Journal tended to
involve companies with greater capital per employee and higher stock market betas. These
factors might be directly related to larger percentage losses on the announcement of a lawsuit.
The large sample of lawsuits involving publicly listed firms in Bessen and Meurer (2007)
13 Using one-tailed t-tests, allowing unequal variances between the sub-groups and calculating the degrees of freedomusing Satterthwaite’s approximation (1946), P = .070.
15 – Troll – 10/11
were not necessarily announced, but these, too, show larger percentage losses than in the current
sample of NPE lawsuits, although not so much larger. The NPE sample of public firms differs
from that sample in two important ways: NPE lawsuits tend to involve larger defendants and
multiple defendants.
Although larger defendants tend to have smaller CARs (Bessen and Meurer 2007), size
related differences cannot directly explain much of the difference in the CARs between the
samples. The difference in the CARs between small and large firms is simply not large enough to
account for the difference in the NPE sample and these small firms only make up 14% of the
NPE sample in any case.14
Nevertheless, the large size of the defendants in the NPE lawsuits and the fact that so
many of these lawsuits involve multiple defendants changes the economics of litigation in an
important way: in these circumstances, litigation might still be credible for plaintiffs who have a
low probability of winning. A lawsuit only poses a credible threat if the plaintiff’s expected gains
from winning exceed the costs from litigating. The expected gains are the ex ante probability of
winning times the conditional benefits of winning. Normally, a lawsuit with a low probability of
winning does not pose a credible threat. However, when a patent has a chance of being
interpreted broadly so that it reads on the business of multiple large companies, the payoff to
winning might be so large that the threat of a lawsuit is credible even if the probability of
winning is low.
This provides another possible explanation for lower percentage losses found in NPE
lawsuits: the plaintiffs in a substantial portion of NPE lawsuits might have low probabilities of
winning at court, hence these lawsuits will cause smaller losses to defendants, all else equal.
Because many of these suits might involve aggressive interpretations of patent scope, allowing
the claims to read on many defendants, they might have lower probabilities of winning, but still
14 In an unreported result from the 2008 study, the mean CAR for solo defendants that had more than 500 employeeswas -.56% (.18%), just slightly smaller than the return listed in the fourth row of Table 3.
16 – Troll – 10/11
provide credible threats because of the multiple defendants. This explanation is supported by
Allison et al. (2011) who find that NPE suits with multiple defendants are more likely to settle
and, when they do go to trial, the plaintiffs are much more likely to lose (but see Shrestha 2010).
This explanation is thus plausible, however, our evidence for it is not conclusive.
3.4 Loss of wealth
Nevertheless, just because the percentage loss of defendant firms is smaller in NPE
lawsuits, this does not imply that the loss of wealth is small. Using the CAR estimates, we can
calculate the loss of wealth that occurs upon a lawsuit filing. Columns 4 and 5 of Table 3 show
the mean and median loss of wealth calculated by multiplying the mean CAR by each firm’s
capitalization.15 The mean wealth lost per lawsuit is $122 million in 2010 dollars and the median
loss is $20.4 million. These figures are substantially higher than the previous estimates for patent
lawsuits of all types found by Bessen and Meurer (2007), shown in row 3. These estimates are,
of course, much larger than the direct costs of legal fees. They also include the costs of lost
business, management distraction and diversion of productive resources that might result from
the lawsuit, possible payments needed to settle the suit, and the reduction in expectations of
profits from future opportunities that are forestalled or foreclosed because of the suit.
Investors’ expectation of future profits are notoriously volatile. To the extent that one
might want to gauge the effect of the lawsuits on current profits while excluding expectations
about future profits, it is possible to make some crude adjustments to the above figures. One
method is to divide the estimated loss of wealth by the ratio of the market capitalization of the
15 We could, alternatively, calculate the average by summing the estimated loss from each suit, however, that
procedure would provide a less efficient estimate. This alternative estimator is
1
N��i�1
N
�r� ei��xi
where N is thenumber of firms, r is the true CAR, e is the error in measuring the ith firm’s CAR, and x is the ith firm’s market
capitalization. The estimator we use is
1
N��
�r�
�i�1N ei
N
�
���i�1
N
xi
. It is straightforward to show that both are unbiasedbut that the latter has smaller variance assuming that e and x are uncorrelated.
17 – Troll – 10/11
firm’s common stock divided by the value of the firm’s capital assets.16 This reduces the mean
wealth lost to $112 million in 2010 dollars. Alternatively, the loss can be divided by the ratio of
the total market value of the firm to the value of the firm’s capital assets, reducing the mean loss
to $64 million in 2010 dollars. These figures are also quite substantial and, although investors’
expectations of future profits might occasionally be “exuberant,” our basic estimate nevertheless
captures the actual loss of wealth related to the lawsuit.
Thus although the NPE CARs are lower than the CARs for other lawsuits, the mean loss
per lawsuit is larger because the market capitalization of the NPE defendants is that much larger.
This, combined with the tendency of NPE lawsuits to involve multiple defendants means that
these suits have an outsized impact on firm wealth. Aggregating over the sample (column 6),
shows that NPE lawsuits from 1990 through October 2010 are responsible for over half a trillion
dollars in lost wealth (in 2010 dollars). From 2007 through October 2010, the losses average over
$83 billion per year in 2010 dollars, over a quarter of US industrial R&D spending per annum.
Moreover, because this total is only for publicly listed firms, it likely understates the true loss of
wealth resulting from NPE lawsuits.
Whatever the theoretical and historical role of NPEs might be in facilitating markets for
technology, it is clear that the current crop of NPE litigation is responsible for an unprecedented
loss of wealth. The next section looks at whether this private loss of wealth to the defendants is
also a loss to society or not.
3.5 Transfers
As discussed in the Introduction, these private losses might or might not correspond to social
losses. Litigation incurs static social losses when it involves socially wasteful activity. Aside
16 For the capital assets, we use the inflation-adjusted value of the aggregate sum of accounting assets and R&D. Fordetails on the computation of these quantities, see Bessen (2009). This adjustment implicitly gives the amount ofinvestment that would be needed to restore the firm to its value before the lawsuit. The alternative calculation assumesthat the lawsuit does not reduce the market value of the firm aside from the firm’s common stock.
18 – Troll – 10/11
from direct legal fees, litigation often involves a diversion of management resources away from
productive activity. It may also involve a loss of consumer welfare. For example, preliminary
injunctions can shut down production and sales while the litigation pends. Even without a
preliminary injunction, customers may stop buying a product. And the threat of final injunction
might require the defendant to drastically rework its product or even abandon it. Frequently,
products require customers to make complementary investments; they may not be willing to
make these investments if a lawsuit poses some risk that the product will be withdrawn from the
market. Furthermore, patent owners can threaten customers and suppliers with patent lawsuits
because patent infringement extends to every party who makes, uses, or sells a patented
technology without permission, and sometimes to those who participate indirectly in the
infringement.
These social losses might be offset if NPE litigation acts like an investment in a
reputation for toughness that deters future piracy. We doubt this is the case. There is simply no
evidence that a significant number of defendants in NPE suits are pirates; later we discuss
evidence showing that they are mostly inadvertent infringers. Furthermore, NPE litigation is
rising over time, not declining as it should if the reputational story were true.
A more important consideration is the extent to which private losses arise from transfers
of wealth to other parties that do not incur a static loss of social welfare. When defendants make
payments to NPEs to settle lawsuits or subsequent to legal judgments, the private loss to the
defendant is not socially wasteful. To what extent do the half trillion dollars in private losses
correspond to such expected transfers?
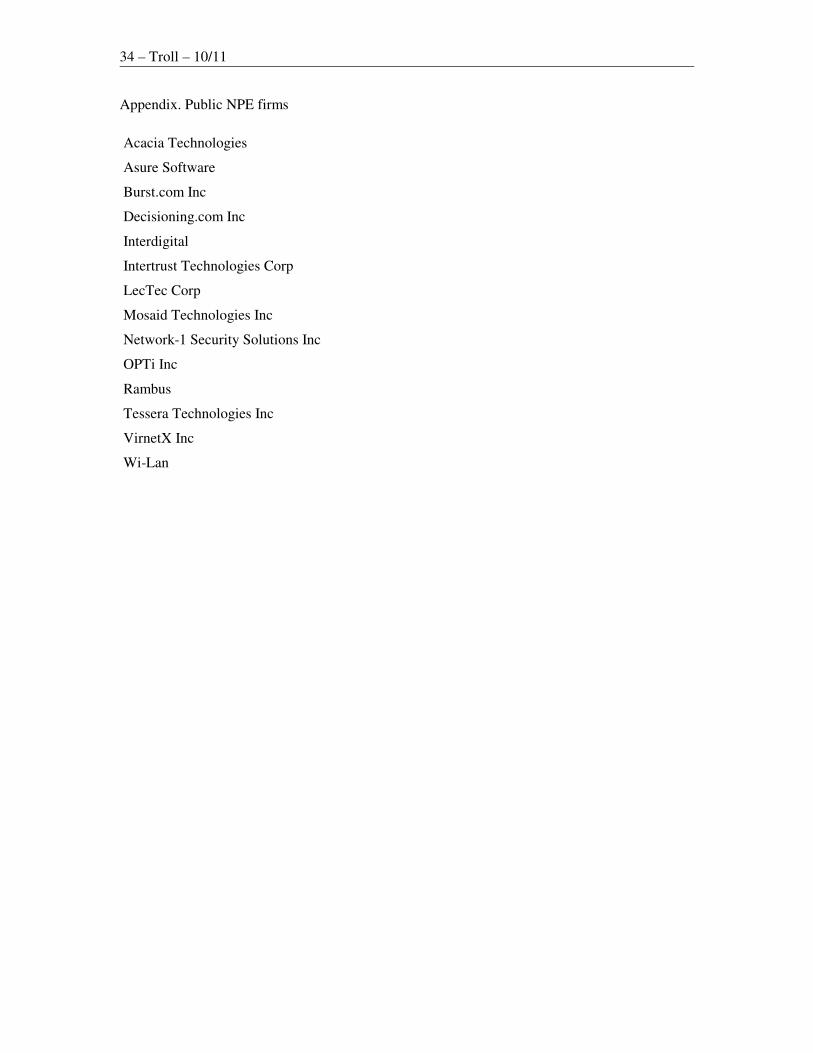
To explore transfers to NPEs and, in turn, transfers from NPEs to independent inventors,
we assembled a list of NPE firms in our database that are publicly listed. We identified 14 firms
(see list in the Appendix). These firms account for 574 litigation events in our data, about 14% of
the total. The aggregate losses to the defendants in these lawsuits from 2000 through October
19 – Troll – 10/11
2010 total $87.6 billion in 2010 dollars, about 17% of the total in our database.
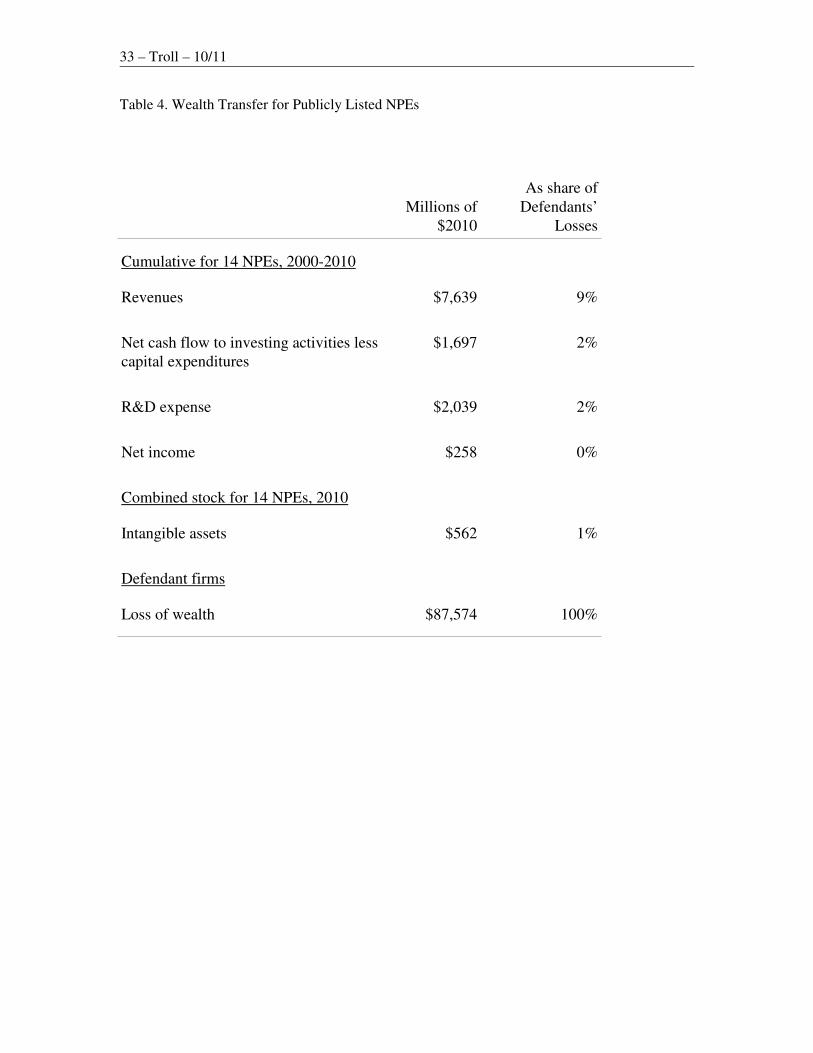
How much of this loss represents a transfer to the NPEs? Table 4 shows the cumulative
flow of several financial variables over this same time period. Total revenues over these years
come to $7.6 billion, about 9% of the total loss to defendants. Revenues necessarily overstate any
transfers from the defendants to the NPEs because they also include revenues from firms that are
not involved in litigation and from private firms. Nevertheless, it is quite clear that most of the
defendants’ private loss is not a transfer to NPEs.
Another possible transfer occurs to the defendant’s competitors. To the extent that patent
litigation causes customers to select a rival product or service, some of the lost business captured
in the above calculations represents a transfer to rival firms. Of course, because the NPEs sue
multiple parties, it happens frequently that a firm and its rivals are sued at the same time, so that
no such transfer would occur. This provides us a simple test of the magnitude of potential
transfers to rivals: if such transfers are substantial, we should see smaller CARs when a firm and
its rival are sued than in cases where rivals are not sued. We identified 1,914 events (47% of the
events) where a firm was sued along with another firm in the same SIC 3-digit industry.
However, the CARs for these events were slightly higher than in those cases where a rival firm
was not also sued.17 Thus this test is inconsistent with substantial transfers to rivals.
Another transfer occurs to the lawyers, expert witnesses, etc. involved in lawsuits.
Estimates of legal costs from Bessen and Meurer (2007) suggest that these transfers cannot be
more than a few percent of the loss.
We also conducted event studies of the NPE stocks around the lawsuit filings. The NPE
stocks also lost wealth around the lawsuit filings.18 Although other factors might cause a drop in
the plaintiffs’ market capitalizations (Bessen and Meurer 2007), this evidence is not consistent
17 The difference was 0.02% with a standard error of 0.17%.
18 The mean CAR was -5.2% with a standard error of 3.1%, significantly different from zero at P = .064. A loss toplaintiffs is frequently observed in the litigation literature.
20 – Troll – 10/11
with large transfers of wealth to the NPEs.
In summary, while there are some limited transfers to NPEs and to rivals and lawyers,
most of the private losses incurred by defendants in NPE litigation do not appear to be transfers
to other parties; presumably, most of the losses correspond to static losses of social welfare.
Of course, NPE litigation might also produce dynamic gains in social welfare if transfers
to independent inventors increase innovation incentives. How much of the transfer to NPEs is
subsequently transferred to inventors outside of the NPEs? The investment that NPEs make in
acquiring patents is included in the accounting category “net cash flow to investing activities.”
This figure less capital expenditures is shown in Table 4. Although this figure includes other
investments in addition to payments to outside inventors, it is small compared to the defendants’
losses: $1.7 billion, or about 2% of the defendants’ losses. The investments made in patents are
also included in the NPE’s intangible assets, although these quantities are amortized. The table
also reports intangible assets for fiscal 2010. It is less than $600 million, about 1% of the
defendants’ losses. Note again that both the intangible assets and the net cash flow to investing
activities generate revenues from sources other than our defendants, so these figures might
overstate transfers to independent inventors. In any case, we can state that less than 2% of the
defendants’ losses could represent a transfer to independent inventors and quite possibly the true
figure is much smaller than 2%.19
Some of the NPEs also conduct their own R&D. Indeed, capitalized R&D investments
are included in the intangible assets of the firm. The R&D expense flows are also not large,
around 2% of the loss.
It is likely that the R&D investments and acquisitions from outside inventors will yield
value to the NPE firms beyond 2010. To the extent that this is true, all of these figures overstate
the extent to which these investments are tied to the defendant losses occurring through 2010.
19 Risch (2012) also finds evidence that NPE litigation does not help inventors raise funds from venture capitalistseither.
21 – Troll – 10/11
That is, some portion of these investments is related to defendant losses that will be incurred
after 2010, so only a portion of the investment can be attributed to a transfer of wealth from the
pre-2011 defendants.
Although the transfer to inventors are small, it is still positive. Does this mean that NPE
litigation nevertheless increases innovation incentives? There are three reasons to conclude that
it does not. First and foremost, the losses to technology firms who are defendants in this
litigation are two orders of magnitude larger. These losses imply a very large disincentive to
innovation for these firms, firms that spend heavily on R&D. Studies show that the more a firm
spends on R&D, the more likely it is to be sued for patent infringement (Bessen and Meurer
2005). Moreover, very rarely are the defendants in these lawsuits found to have actually copied
the patented technology (Bessen and Meurer 2008, p. 126, Cotropia and Lemley 2009). Instead,
they are inadvertent infringers, if infringers at all. This means that they have to anticipate the risk
of future lawsuit-related losses as part of their cost of developing new technology and products.
This risk is a disincentive to invest in innovation, and our results find that it is a very large
disincentive, much larger than any possible incentives provided by transfers to independent
inventors via NPEs. Even if incentives to small inventors were much more fertile than incentives
provided to large technology firms—producing two, three or even ten times as many innovations
—the incentives flowing to small inventors would not offset the very much larger disincentives
imposed on the technology firms.
Second, to the extent that independent inventors benefit by licensing or selling their
inventions to large firms, this risk of inadvertent infringement reduces their innovation incentives
as well. Because their prospective licensees have to anticipate the risk of an NPE lawsuit, this
risk decreases the amount licensees are willing to pay. Thus the very large losses incurred by
defendants tend to reduce the market for technology for independent inventors.
Finally, the incentives provided to patent holders by the current crop of NPEs may be the
22 – Troll – 10/11
wrong kind of incentives. NPE activity may skew the research agenda of small firms away from
disruptive technologies and toward mainstream technology and associated patents that can be
asserted against big incumbents. Even worse, small firms are encouraged to divert investment
from genuine invention toward simply obtaining broad and vague patents that might one day lead
to a credible, if weak, lawsuit.
To summarize, there are a lot of big losers from NPE litigation, while hardly anyone
benefits much. The defendant firms and their customers lose while patent holders gain very little
by comparison. Even the investors in NPE firms have gained little—these firms barely break
even based on their cumulative net income in Table 4. Apparently, the only real beneficiaries are
the lawyers and perhaps the principals of the NPE firms.
4 The New Business Model
These findings should be interpreted cautiously. While there are large losses from NPE litigation,
not all NPEs today are opportunistic litigators. Nor does this imply that NPEs have not played a
more positive role in the past. It is important to understand what is uniquely different about the
NPEs who are behind today’s litigation surge.
Indeed, today’s NPEs tell us they are different. Proponents tell us they are a new breed of
company, a new business model, that is misunderstood (McDonough 2006, Myhrvold 2010).
They tell us that NPEs are, in fact, good for society because they are creating “a capital market
for invention” by buying patents and selling licenses. This helps “turbocharge technological
progress” “by realigning market participant incentives, making patents more liquid, and clearing
the patent market.”
What, exactly, is new about this business model and what does it mean for innovation?
Markets for technology have been around at least since the nineteenth century and studies have
documented some of the benefits of these markets (for example, Arora et al. 2004): they allow
23 – Troll – 10/11
inventors a way of getting money for their inventions, thus providing them with stronger
incentives to invent, and they help spread new technologies to the companies who can
commercialize them the best. But most of this literature concerns markets for technology, not
markets for patents. There is no evidence the transactions occurring around NPE litigation
involve the transfer of technology—news reports and judicial opinions indicate the defendants
are already using the technology. Instead, these transactions involve just the transfer of patent
rights (and money).
Even so, some advocates hold that NPEs are socially beneficial because they reduce the
costs of patent transactions (McDonough 2006). To the extent that NPEs facilitate the clearance
of patent rights before firms invest in technology this is a clear benefit. The patent brokers and
auctions facilitate transactions, but that is not obviously true for those NPEs who are primarily
involved in asserting and litigating patents. Moreover, to the extent that these NPE transactions
occur only after firms invest in technology, any savings in transaction costs has to be offset by
the associated dispute costs. We have shown that the litigation losses amount to over half a
trillion dollars, so these dispute costs are substantial. No reasonable estimate of the transaction
costs of licensing these patents could approach the magnitude of these litigation losses.
The pattern of NPE patent litigation casts further doubt on the view that NPE patent
enforcement has any connection to technology transfer. Is it possible that large numbers of
innovative firms in case after case are pirating the technology disclosed in NPE patents? Why are
the numbers so large? Perhaps the firms have colluded to jointly pirate the technology, or
perhaps all of these firms have independently decided to pirate the same technology. Not likely.
We think the plausible explanation is that the many firms who end up as defendants in these
cases have independently created the invention or derived the claimed technology from some
source other than the NPE patent.
Multiple inadvertent infringements are especially likely for a general purpose technology
24 – Troll – 10/11
like software. As noted above, NPE lawsuits are concentrated in one technology area, namely,
software and software-related patents including business methods. Consequently, this litigation
has a disproportionately large effect on firms working with these technologies. A thumbnail
calculation suggests that NPEs account for about 41% of patent litigation involving software
patents.20 So NPE litigation is quite significant for this technology.
Thus the new business model for NPEs is not about licensing patents in general; it is
mainly about licensing software patents, including patents on business and financial processes.
This is significant because we have argued elsewhere that software patent litigation has risen
dramatically because of eroding patent notice and that software patents have been an important
contributor to this trend (Bessen and Meurer 2008). That is, software patents have “fuzzy
boundaries”: they have unpredictable claim interpretation and unclear scope, lax enablement and
obviousness standards make the validity of many of these patents questionable, and the huge
number of software patents granted makes thorough search to clear rights infeasible, especially
when the patent applicants hide claims for many years by filing continuations. This gives rise to
many situations where technology firms inadvertently infringe. And this means that there is a
business opportunity based on acquiring patents that can be arguably read to cover existing
technologies and asserting those patents, litigating if necessary in order to obtain a licensing
agreement. Models by Reitzig et al. (2007) and Turner (2011) show that the patent troll business
model only makes economic sense when there is such inadvertent infringement. And the rise in
NPE litigation has closely mirrored the rise in software patent litigation (Bessen 2011).
Moreover, fuzzy boundaries can explain why so many NPE lawsuits have multiple defendants:
many firms may have reasonably concluded that they did not infringe or the patents were invalid
or they may have been unable to find these patents while conducting a clearance search. Later,
20 From Bessen (2011), about 26% of patent lawsuits involve software patents. If 17% of lawsuits involve NPEs and if62% of NPE lawsuits involve software patents (Table 2) then .17 x .62 / .26 = 41% of software patent lawsuits are filedby NPEs.
25 – Troll – 10/11
they encounter an NPE who sues over an aggressively broad interpretation of the patent’s scope
and validity.
Thus “fuzzy boundaries” for software and business method patents enable the rise of this
new business model. Large numbers of hidden patents or patents with unpredictable boundaries
provide an opportunity to extract rents from technology firms. Further, because NPEs have no
operating business, technology firms cannot retaliate with countersuits. Combine this with capital
markets to fund the acquisition of patents and to conduct litigation and you get a viable business
model. But this is a very different business from the business pursued by those patent brokers,
consultants and auctioneers who facilitate markets for technology.
5 Conclusion
Firms that buy and license technologies can improve the market for technology and thus improve
the innovation incentives for independent inventors. Patent agents and markets for technology
have been an important part of the US innovation system since the nineteenth century.
But the role of the current NPEs who assert and litigate patents is something altogether
different: it is focused on software and related technologies, it targets firms that have already
developed technology, and it is very much about litigation, especially litigation in the special
circumstances where multiple large parties can be sued at once. Whatever the general benefits of
technology markets, this does not obscure the fact that this particular manifestation involves
large amounts of costly litigation. It is hard to believe that markets can be somehow improved by
having thousands of lawsuits that incur hundreds of billions of dollars in losses.
We have shown that defendants have lost over half a trillion dollars in wealth—over $83
billion per year during recent years—and this has not improved incentives to innovate. While the
lawsuits might increase incentives to acquire vague, over-reaching patents, they do not increase
incentives for real innovation. The defendants in these lawsuits are firms that already invest a lot

26 – Troll – 10/11
in innovation. Their losses make it more expensive for them to continue to do so and it also
makes them less willing to license new technologies from small inventors. Meanwhile,
independent inventors benefit very little from what the large companies lose.
27 – Troll – 10/11
6 References
Allison, John R., Mark A. Lemley and Joshua Walker, 2009. “Extreme Value or Trolls on Top?Evidence From the Most-Litigated Patents,” Univeristy of Pennsylvania Law Review,158, pp. 101-37.
Allison, John R., Mark A. Lemley and Joshua Walker. 2010. “Patent Quality and SettlementAmong Repeat Patent Litigants,” Georgetown Law Journal, 99, pp. 677-712.
Arora, Ashish, 1997. “Patents, licensing, and market structure in the chemical industry,”Research Policy 26, pp. 391-403.
Arora, Ashish, Andrea Fosfuri, and Alfonso Gambardella, 2004. Markets for Technology: TheEconomics of Innovation and Corporate Strategy, Cambridge, Ma.: MIT Press.
Ball, Gwendolyn G. & Jay P. Kesan, 2009. “Transaction Costs and Trolls: Strategic Behavior byIndividual Inventors, Small Firms and Entrepreneurs in Patent Litigation,” Ill. Law &Econ. Papers Series, Research Papers Series No. LE09-005.
Bessen, James, 2008. “The value of U.S. patents by owner and patent characteristics,” ResearchPolicy, 37, pp. 932-45.
Bessen, James, 2009. “Estimates of Patent Rents from Firm Market Value,” Research Policy 38,pp. 1604-16.
Bessen, James, 2011. “A Generation of Software Patents,” Boston Univ. School of Law, Lawand Economics Research Paper No. 11-31.
Bessen, James and Michael J. Meurer. 2005. “The Patent Litigation Explosion,” B.U.S. L. Lawand Economics Working Paper Series, No. 05-18.
Bessen, James and Michael J. Meurer (2006), “Patent Litigation with Endogenous Disputes,”American Economic Review, 96, no. 2, pp. 77-81.
Bessen, James and Michael J. Meurer (2007), “The Private Costs of Patent Litigation,” BostonUniv. School of Law Working Paper No. 07-08.
Bessen, James and Michael J. Meurer (2008), Patent Failure: How judges, bureaucrats andlawyers put innovators at risk, Princeton, NJ: Princeton University Press.
Bhagat, Sanjai, John M. Bizjak, and Jeffrey L. Coles, 1998. “The shareholder wealthimplications of corporate lawsuits,” Financial Management 27, pp. 5–27.
Bhagat, Sanjai, James A. Brickley, & Jeffrey L. Coles. 1994. “The Costs of InefficientBargaining and Financial Distress: Evidence from Corporate Lawsuits,” Journal ofFinancial Economics, v. 35, p. 221.
Bhagat, Sanjai and Roberta Romano, 2002. “Event Studies and the Law: Part I: Technique andCorporate Litigation,” American Law and Economics Review, 4, pp. 141-167.
28 – Troll – 10/11
Brown, Stephen J. and Jerold B. Warner. 1985. “Using Daily Stock Returns: The case of eventstudies,” Journal of Financial Economics, v. 14, pp. 3-31.
Chien, Colleen, 2009. “Of Trolls, Davids, Goliaths, and Kings: Narratives and Evidence in theLitigation of High – Tech Patents,” North Carolina Law Review, 87, pp. 1571-1615
Cotropia, Christopher Anthony and Mark A. Lemley, 2009, “Copying in Patent Law,” NorthCarolina Law Review, 87, p. 1421.
Cutler, David and Lawrence Summers. 1988. “The costs of conflict resolution and financialdistress: Evidence from the Texaco-Pennzoil Litigation,” RAND Journal of Economics,19, pp. 157-72.
Dodd, Peter and Jerold B. Warner. 1983. “On Corporate Governance: A study of proxycontests,” Journal of Financial Economics, v. 11, pp. 401-38.
Federal Trade Commission, 2011. “The Evolving IP Marketplace: Aligning patent notice andremedies with competition.”
Fischer, Timo and Joachim Henkel. 2011. “Patent Trolls on Markets for Technology: AnEmpirical Analysis of Trolls’ Patent Acquisitions” working paper.
Hall, Bronwyn H., Adam B. Jaffe, Manuel Trajtenberg, 2001. “The NBER Patent Citation DataFile: Lessons, Insights and Methodological Tools,” NBER Working Paper No. 8498.
Haslem, Bruce. 2005. “Managerial Opportunism during Corporate Litigation,” Journal ofFinance, 60, no. 4, pp. 2013-41.
Hosie, Spencer, 2008. “Patent Trolls and the New Tort Reform: A Practitioner's Perspective,” AJournal of Law & Policy for the Information Society, 4, pp. 75-87.
Kesan, Jay P. and Gwendolyn G. Ball. 2005. “How Are Patent Cases Resolved? An EmpiricalExamination of the Adjudication and Settlement of Patent Disputes,” U. Illinois Law &Economics Research Paper No. LE05-027.
Kramer, Lisa A. 2001. “Alternative Methods for Robust Analysis in Event Study Applications,”in Lee, C. F., ed., Advances in Investment Analysis and Portfolio Management, v. 8, pp.109-32.
Lamoreaux, Naomi R., and Kenneth L. Sokoloff, 1999. “Inventors, Firms, and the Market forTechnology in the Late Nineteenth and Early Twentieth Centuries.” In Naomi R.Lamroeaux, Daniel M. G. Raff, and Peter Temin, eds., Learning by Doing in Markets,Firms, and Countries. Chicago: University of Chicago Press, 19–60.
Lerner, Josh. 1995. “Patenting in the Shadow of Competitors,” Journal of Law and Economics,38, no. 2, pp. 463-95.
Love, Brian J., 2010. “An Empirical Study of Patent Litigation Timing: Could a Patent TermReduction Decimate Trolls Without Harming Innovators?,” Working paper.
Lunney, Glynn S. Jr. 2004. “Patent Law, the Federal Circuit, and the Supreme Court: A Quiet
29 – Troll – 10/11
Revolution,” Supreme Court Economic Review, 11, pg. 1.
Mackinlay, A. Craig. 1997. “Event Studies in Economics and Finance,” Journal of EconomicLiterature, 35(1), pp. 13-39.
Magliocca, Gerard N. 2007. “Blackberries and Barnyards: Patent Trolls and the Perils ofInnovation,” Notre Dame Law Review, 82(5), 1809-1838.
McDonough, James F. III, 2006. “The Myth of the Patent Troll: An Alternative View of theFunction of Patent Dealers in an Idea Economy,” Emory Law Journal 56, pp189-211.
Meurer, Michael J. 1989. “The Settlement of Patent Litigation,” RAND Journal of Economics,Spring 1989, v. 20, iss. 1, pp. 77-91.
Morgan, Marc, 2008. “Stop Looking Under the Bridge for Imaginary Creatures: A CommentExamining Who Really Deserves The Title Patent Troll,” Federal Circuit Bar Journal,17, pp. 165-80.
Myhrvold, Nathan, 2010. “The Big Idea,” Harvard Business Review, March 2010, pp. 40-50.
Patent Freedom, 2011. “Litigations over Time,” https://www.patentfreedom.com/research-lot.html, accessed August 2011.
Reitzig, Markus, Joachim Henkel and Christopher Heath, 2007. “On sharks, trolls, and theirpatent prey—Unrealistic damage awards and firms’ strategies of ‘being infringed’,”Research Policy 36, pp. 134–154.
Risch, Michael, 2012 forthcoming. “Patent Troll Myths,” Seton Hall Law Review, 42.
Salinger, Michael. 1992. “Standard Errors in Event Studies,” The Journal of Financial andQuantitative Analysis 27(1), pp. 39-53.
Satterthwaite, F. E. 1946. “An approximate distribution of estimates of variance components,”Biometrics Bulletin, 2. pp. 110-14.
Shrestha, Sannu K. 2011. “Trolls or Market-makers? An empirical analysis of nonpracticingentities,” Columbia Law Review, 110, pp. 114-60.
Temple, James, 2011. “Tech-patent lawsuits discourage innovation,” San Francisco Chronicle,7/31/2011.
Turner, John L., 2011. “Patent Thickets, Trolls and Unproductive Entrepreneurship,” workingpaper.
Yanagisawa, Tomoya and Dominique Guellec, 2009. “The Emerging Patent Marketplace,”OECD STI Working Paper.
30 – Troll – 10/11
Tables and Figures
Table 1. Summary Statistics of Defendant Firms
(Millions of $2010)
Mean Median
Revenue $34,487 $13,232
R&D spending $1,779 $531
Intangible assets $9,792 $1,269
Employees (1000s) 9.4 3.6
NPE lawsuits per firm (1990-2010) 26.1 12
Industry (2 digit SIC code) Electronics (36) 22%
Machinery & computer equipment (35) 15%
Retail/wholesale (50-59) 15%
Software (73) 14%
Communications (48) 9%
Financial services (60-67) 8%
Means of firm characteristics are over 3,821 firm-events. This is a sample of publiclylisted firms.
31 – Troll – 10/11
Table 2. Summary Characteristics of Lawsuits
Mean Median
No. of publicly listed defendants 15.3 5
Sole defendant 17%
In litigation with 10 or more defendants 32%
Software patent 62%
Patent Technology Classes (NBER)
Chemical 1%
Computers & communications 75%
Drugs & medical 1%
Electrical & electronics 12%
Mechanical 4%
Other 8%
Note: The number of defendants in the lawsuits are for all lawsuits filed by the same NPEon the same day. Patent characteristics are for a sub-sample matched to Derwent Litalertand are for the first patent listed in the suit. The categorization of software patents isdescribed in Bessen (2011). We have adapted the NBER technology classes (Hall et al.2001) to the current technology class system adding classes 398, 715, 717, 725 and 726 tothe computers and communications category. This sample consists of publicly listedfirms.
32 – Troll – 10/11
Table 3. Cumulative Abnormal Returns (CARs) of Defendants in NPE Litigation
Cumulative Abnormal ReturnsLoss of common stock value
(millions of $2010)
Sample Mean MedianRobust Z
statistic Mean Median Aggregate N
(1) (2) (3) (4) (5) (6)
5 day event window
All NPE suits -0.32% (0.08%)** -0.52% -4.01** $122.0 $20.4 $501,775 4,114
25 day event window
All NPE suits -0.37% (0.14%)** -0.71% -2.04* $140.6 $23.6 $579,217 4,119
All patent litigation 1984–99 (Bessen and Meurer 2007)
All suits -0.50% (0.16%)** -0.51% -3.24** $75.9 $6.5 2,887
Singledefendants
-0.61% (0.18%)** -0.54% -2.94** 2,460
Note: Standard errors in parentheses. Single asterisk indicates statistical significance at the 5%level; double asterisk indicates 1% significance. Average cumulative abnormal returns (CARs)are weighted means, with weights proportional to the inverse of the estimated variance of eachreturn. Event window is 5 days (T-1 to T+4) or 25 days (T-1 to T+24). Cumulative abnormalreturns are estimated using OLS. The robust Z statistic is a joint test of the individual firm tstatistics (Kramer 2001).
33 – Troll – 10/11
Table 4. Wealth Transfer for Publicly Listed NPEs
Millions of$2010
As share ofDefendants’
Losses
Cumulative for 14 NPEs, 2000-2010
Revenues $7,639 9%
Net cash flow to investing activities lesscapital expenditures
$1,697 2%
R&D expense $2,039 2%
Net income $258 0%
Combined stock for 14 NPEs, 2010
Intangible assets $562 1%
Defendant firms
Loss of wealth $87,574 100%
34 – Troll – 10/11
Appendix. Public NPE firms
Acacia Technologies
Asure Software
Burst.com Inc
Decisioning.com Inc
Interdigital
Intertrust Technologies Corp
LecTec Corp
Mosaid Technologies Inc
Network-1 Security Solutions Inc
OPTi Inc
Rambus
Tessera Technologies Inc
VirnetX Inc
Wi-Lan