private and social values of wetlands research reports - crawford
TRANSCRIPT
ISSN 1441-2136
PRIVATE AND SOCIAL VALUESOF WETLANDS
RESEARCH REPORTS
WETLAND ECOSYSTEMS AND LANDUSE IN THEMURRUMBIDGEE CATCHMENT – WAGGA WAGGA TO
HAY AND INCLUDING MIRROOL CREEK
By S.M. Whitten and J.W. Bennett
Research Report No. 4 September 1999
About the authors
Stuart Whitten is a Research Officer and PhD student in the School of Economicsand Management, University College, The University of New South Wales.
Jeff Bennett is Associate Professor in the School of Economics and Management,University College, The University of New South Wales.

ii
Private and Social Values of Wetlands Research Reports are published by the School of Economics andManagement, University College, The University of New South Wales, Canberra 2600 Australia.
These reports represent the provisional findings of the research project ‘Private and Social Values ofWetlands’.
The project is funded under the National Wetland Research and Development Program by the Land &Water Resources Research and Development Corporation and Environment Australia.
The views and interpretations in these reports are those of the author(s) and should not be attributed tothe organisations associated with the project.
Because these reports present the results of work in progress, they should not be reproduced in part or inwhole without the written authorisation of the Research Project Leader, Associate Professor Jeff Bennett.
Any comments will be gratefully received and should be directed to Associate Professor Jeff Bennett,School of Economics and Management, University College, The University of New South Wales,Canberra ACT 2600, Australia.Telephone (02) 6268 8833.Email: [email protected]
Acknowledgments
Comments on an earlier draft of this report were provided by Dr Jane Roberts (CSIRO Land and Water), MrJames Maguire (Department of Land and Water Conservation), Mr Michael Schultz (Fivebough-TuckerbilWetlands Management Committee), Mrs Lillian Parker and Mr Mark Neeson (Murrumbidgee Irrigation). Anyerrors remain the responsibility of the authors.

iii
TABLE OF CONTENTS
ABSTRACT VI
1 INTRODUCTION 1
2 RESOURCE BASE 3
2.1 Study area boundaries 3
2.2 Climate 3
2.3 Regional landscape 6Topography 6Soils 6Surface water 7Irrigation and surface water 8Groundwater 10Salinity 11Water quality 11
2.4 Ecological features 12
3 VALUES OF WETLANDS – ACTUAL AND POTENTIAL 13
3.1 Property rights and wetland values 13
3.2 Non-consumptive wetland values 14Birds 14Mammals 15Fish, crayfish and mussels 15Reptiles and Amphibians 16Other taxa 16Wetland vegetation 16Flood mitigation 17Aquifer impacts 18Water quality impacts 18Aboriginal heritage values 18Concluding comments – ecosystem values 18
3.3 Developed or modified wetland values 19Socio-economic context and infrastructure 19Farm description and performance indicators 20Agricultural land use – history 22Agricultural values – grazing 23Agricultural values – dryland cropping 24Agricultural values – irrigated cropping 24River pumping licences 26
iv
Agro-forestry and related production systems 26Aquaculture 28Hunting 28Tourism 28Other use values 29Other potential values 29
4 LAND MANAGEMENT AND WETLAND INTERACTIONS 30
4.1 Surface water management 30Reduced flooding of floodplain wetlands 30Other irrigation impacts 31
4.2 Groundwater impacts and management 31Soil salinity impacts 31Hydrological impacts 31Management 32
4.3 Rehabilitation of wetland habitat 32
4.4 Vegetation management strategies 33Red gum and other Murrumbidgee floodplain wetlands 33Irrigation area wetlands 33Other wetlands 33
4.5 Management and agricultural values 33
4.6 Fencing as a management tool 34Wetland grazing strategies 34
4.7 Property right structures as management levers 35
4.8 Hunting interactions 35
4.9 Tourism interactions 36
5 DISCUSSION AND CONCLUSIONS 36
REFERENCES 38
v
LIST OF MAPS, TABLES AND FIGURES
Map1: Location of Murrumbidgee River within Murray-Darling Basin and south eastAustralia. 4
Map 2: Murrumbidgee River catchment and study area boundaries 5
Figure 1: Rainfall and temperature for Griffith 6Figure 2: Extraction of surface and groundwater in the mid and lower Murrumbidgee
catchment 9Figure 3: Wagga Wagga current summer and winter flows 9Figure 4: Balranald current summer and winter flows compared to natural flow conditions 10Figure 5: Distribution of broadacre irrigation farms by water use 22
Table 1: Mean and median rainfall in the MLMC 6Table 2: Selected Mean farm physical and financial statistics for Murrumbidgee Catchment
including Mirrool Creek 21Table 3: Gross margins of major livestock enterprises 23Table 4: Gross margins of main dryland crops 24Table 5: Gross margins of main irrigated Annual crops 25Table 6: Irrigation water charges 26

vi
Abstract
Wetlands in the mid to lower Murrumbidgee area of New South Wales have been altered by humaninfluence both directly and indirectly. Direct influences include grazing, cropping and forestry.Indirect influences result from hydrological changes related to irrigation water supply and use. Thewetlands continue to supply both private and social values. The private values arise from agriculturalproduction, tourism and private recreation/nature conservation benefits. Social values are drawn fromwetland flora and fauna (especially waterbirds), flood mitigation, fish nurseries and other ecosystemvalues. The management actions of external agencies alter the structure of values able to be drawnfrom wetlands. Management actions of private wetland owners and managers further change the mixof private and social values generated by wetlands. Some management actions trade-off social valuesagainst private values. Other management strategies can enhance both types of values concurrently.The interrelationships between wetland management decisions and the range of private and socialvalues they produce are explored in this paper.

1
1 Introduction
Society faces a range of choices about how it uses wetland resources. Few areas demonstrate the fullrange of potential choices better than wetlands in the mid to lower Murrumbidgee catchment (MLMC).Production uses include grazing, forestry, water storage, irrigated cropping and drainage disposal whilenon-production uses include bird breeding, flood mitigation and biodiversity conservation. These usesdemonstrate the range of values available from wetlands, both in their natural state and when convertedto alternative uses. As wetlands are converted to alternative uses, natural wetland systems becomescarce. Increasing wetland scarcity resulting from the progressive conversion of wetlands to alternativeuses has increased the values attached to natural wetland systems.
Wetland managers choose between alternative wetland uses based on their goals and constraints.These alternative wetland management strategies have implications for wetland habitat. In particular,the goal of maximising farm profitability may conflict with other wetland management goals held byfarmers and the wider community. Hence choosing between alternative wetland uses can beproblematic. Trade-offs between competing goals are frequently involved and the basis for informeddecisions is often lacking. One way of providing a basis for informed decisions is to identify the set ofwetland attributes available from current wetland use. This set can then be compared against the setsarising from alternative potential management strategies. These sets comprise the range of potentialchoices faced by society in the MLMC that are addressed in this paper.
Box 1: Some definitionsWetlands can be broadly defined as areas featuring permanent or temporary shallow open water. Thisincludes billabongs, marshes, swamps, lakes, mud flats, mangrove forests, virtually any land which isregularly or intermittently inundated with water that is static or flowing, fresh, brackish, or salt, includingareas of marine water which does not exceed a depth six metres at low tide (National Wetlands ProgramInformation Sheet 7).Wetland managers make decisions regarding the use of a wetland. Separate decision-makers haveresponsibility for different aspects of a wetland. A landowner may make long-term decisions aboutwetland uses which may be enacted by themselves or an employee (or proxy) making decisions on a day today basis. The landowner and the proxy are constrained by legal rules or limits to their authority. That is,the Government restricts or requires some actions by law.
Over 47,000 hectares of wetlands are located on the Murrumbidgee River floodplain between WaggaWagga and Hay Weir in New South Wales (Thornton and Briggs 1994). Additional wetlands areconnected with Frying Pan Creek, other watercourses and natural depressions and Mirrool Creekfloodplain that are included in the study area. The wetlands of the MLMC are important for wildlifehabitat and breeding (Murrumbidgee Catchment Management Committee (MCMC) 1998). MLMCwetlands are also important assets to graziers providing reserve sources of fodder (MCMC 1998) andtimber production. Despite the conservation importance of wetlands within the MLMC only a fewformal reserves include wetland areas (eg Narrandera Nature Reserve) although a number of crownreserves exist along the Murrumbidgee River and Fivebough Swamp (near Leeton) is essentially beingmanaged according to conservation goals.
The aim in this research report is to provide a regional landscape perspective of the implications ofalternative wetland management strategies. This is conducted at the regional, local and farmmanagement levels for wetlands and associated ecosystems in the MLMC. The task has two broadactivities:
1. The gathering and presentation of social and ecological information required for decisionmaking regarding alternative wetland management options.
2. The exploration of relationships between wetland management alternatives and the resultingvalues.
The first of these activities is presented in Section 2 and the second in Sections 3 and 4.

2
Box 2: ValuesValue is loosely defined as the worth of something to an individual or the community.Direct-use values ‘are based on the conscious use of environmental resources in production and/orconsumption’ of goods and services (Wills 1997, p. 147). Examples of direct-use wetland values in theMLMC are grazing, tourism, recreation, education and research.Indirect-use values ‘are based on the contribution of natural resources to human life support’ (Wills1997, p. 147). Examples of indirect-use wetland values in the MLMC are flood mitigation, carbonfixation and nutrient removal and storage. Wetlands also provide important functions necessary forriver health including fish breeding/ nurseries and nutrient cycling.Non-use values ‘involve no tangible current interaction between the environmental asset and thosewho benefit (value) it’ (Wills 1997, p. 147). Examples of non-use wetland values in the MLMC arebiodiversity, river health and the knowledge they continue to exist.Private value is the worth of something as perceived by its owner and the purchaser of goods andservices derived. It includes values from all categories above. For example, private owners may valuewetland biodiversity but may also be able to enjoy the benefits derived from grazing and recreation intheir wetlands.Social value is the total worth of something as perceived by the community. Social value includesprivate values as defined but also includes the value enjoyed by people who are not the owners.Extracting private values may result in a reduction in values available to the wider community. Forexample, a property owner may choose to clear and drain a wetland. The impact on social valuesdepends on whether the private values obtained are higher or lower than the impact on the naturalresource values available to both the owner and the community.
The Murrumbidgee case study is the second case study within a larger research effort to analyse theecological and economic trade-offs that occur between alternative management strategies for wetlandson private land. The first of these studies was carried out in the Upper South East region of SouthAustralia and is reported in Whitten and Bennett (1998). The MLMC study focuses on theidentification of values associated with alternative wetland management strategies in the mid to lowerMurrumbidgee catchment. The ecological framework defined in this study together with the socialinformation will form the basis upon which an economic examination of resource allocation will beundertaken as the next step of the case study. A brief discussion of this approach concludes the report.
The work in this report draws upon several key resources that have been prepared to assist resourcemanagement in the Murrumbidgee catchment including:
• Murrumbidgee Catchment Action Plan (MCAP) for integrated natural resources management(MCMC 1998);
• Murrumbidgee Irrigation Area and Districts Community Land and Water Management Plan(Murrumbidgee Irrigation Area and Districts Land and Water Management Plan Working Group(MIADLWMPWG) 1998); and,
• Draft Murrumbidgee Valley Strategic Water Management Plan (Department of Land and WaterConservation (DLWC) 1996).
Associate with these documents are a number of community land and water management plans andspecialised background or evaluation reports. None of these documents focuses specifically onwetlands within the region, however, they assist in providing a framework within which wetlandimpacts can be analysed.

3
2 Resource base
2.1 Study area boundaries
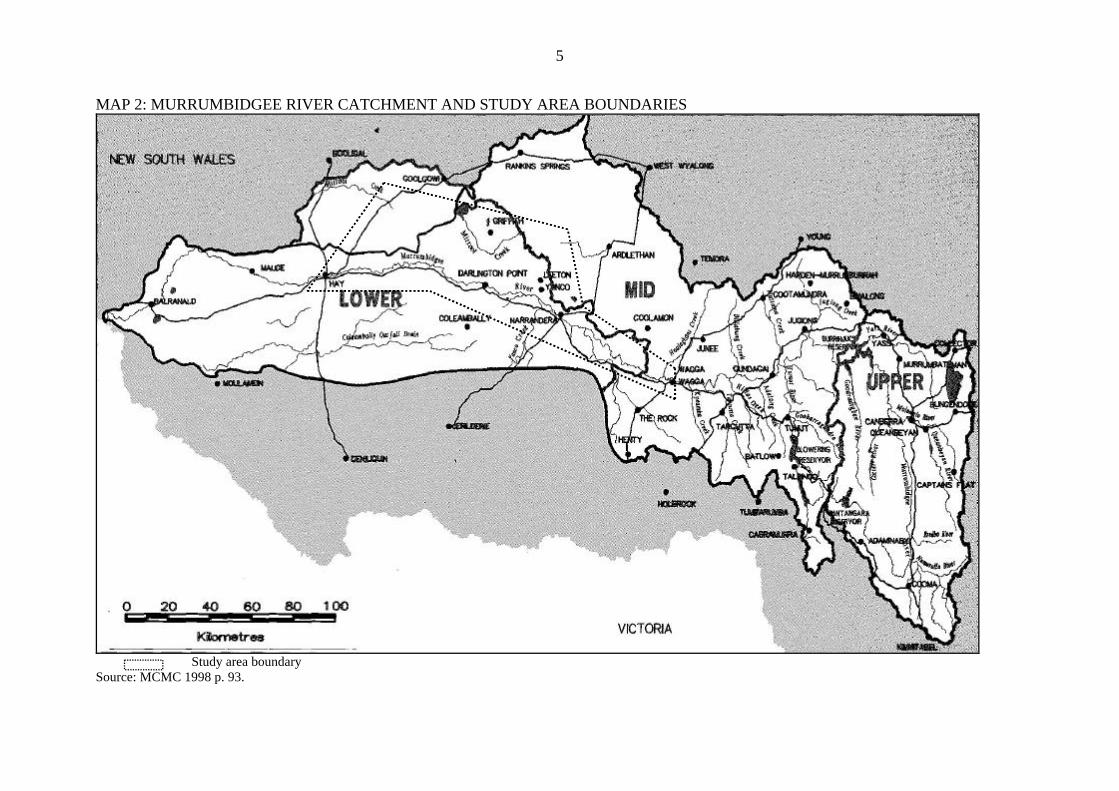
The Murrumbidgee River catchment is part of the Murray-Darling Basin. Map 1 shows the location ofthe Murrumbidgee River, Hay and Wagga Wagga within the Murray-Darling Basin and south easternAustralia. Map 2 shows the Murrumbidgee catchment, MCAP boundaries and the location of the studyarea. The study area comprises the Murrumbidgee floodplain between Wagga Wagga and Hay Weir,1
the Mirrool Creek Floodplain below Barellan, the terminal swamps of Frying Pan Creek and localdepressions within this area. The region lies between 380 and 600 kilometres west and slightly southof Sydney and between 370 and 420 kilometres north of Melbourne. The altitude of the study area isbetween 180 metres (at Wagga Wagga) and 80 metres (at Hay).
The study area was chosen because it includes wetlands subject to a range of human interferences,including irrigation, grazing and cropping. The region was also chosen to reflect a similarity in thehuman threats to wetlands rather than as an ecological unit.
The topography of the MLMC region is characterised by relatively low relief with few hills or ranges.Important topographical features within the study area are the Murrumbidgee and Mirrool creekfloodplains, the Bogolong Hills, the Wumbulgal Hills, the Narrandera Ranges, Brobenah Hills andMcPhersons Range.
Prior streams, ancestral rivers and current watercourses dissect the Murrumbidgee River and MirroolCreek floodplains (MCMC 1998). Wetlands in the region are formed within minor riverinedepressions, prior streams and lakebeds. Wetlands are associated with present or past drainage linesand may be filled following either prolonged local rain or when the watercourses are in flood.
2.2 Climate
Mean and median monthly rainfall and mean monthly maximum and minimum temperature for Griffith(in the centre of the study area) are shown in Figure 1. Table 1 shows mean and median annual rainfallfor three principal towns in the study area.
The region exhibits a Mediterranean climate with a winter-spring rainfall maximum and hot drysummers. Summer rainfall is often in the form of thunderstorms. Rainfall increases from west to easttowards the Great Dividing Range and east coast of Australia. Rainfall averages between 366 mm(median 362 mm) for Hay and 562 mm (median 536 mm) for Wagga Wagga. Sixty percent of annualrainfall falls between May and October (MCAP 1998). Evaporation ranges from 1600 to 2000 mmbeing higher towards Hay and lower towards Wagga Wagga (MCAP 1998). Prior to construction ofirrigation dams the winter rainfall maximum, together with snow melt, led to floodplain wetlandsystems in the Murrumbidgee system experiencing a small or moderate flood in most years. Once in10 to 12 years a major flood would cover the entire floodplain (MCAP 1998). Similarly winter andspring rains led to a small or moderate flood in the mid Mirrool Creek in most years with a major floodfilling the lower Mirrool Creek wetlands once in 15 or more years. Hence the hydrology of wetlandsvaried from being filled in most years to as rarely as once in 10 to 15 years.
1 Defined as those flooded by the 1974 flood (see Thornton and Briggs 1994).

4
MAP1: LOCATION OF MURRUMBIDGEE RIVER WITHIN MURRAY-DARLING BASIN AND SOUTH EAST AUSTRALIA.
Source: Murray-Darling Basin Commission (1996) Natural Resources Management StrategyCompendium, MDBC, Canberra, back cover.
5
MAP 2: MURRUMBIDGEE RIVER CATCHMENT AND STUDY AREA BOUNDARIES
Study area boundarySource: MCMC 1998 p. 93.

6
FIGURE 1: RAINFALL AND TEMPERATURE FOR GRIFFITH
0
5
10
15
20
25
30
35
JAN FEB MAR APR MAY JUN JUL AUG SEP OCT NOV DEC
Tem
per
atu
re (
c)
0
5
10
15
20
25
30
35
40
45
Rai
nfa
ll (m
m)
Average max. temp.
Median rainfall
Average rainfall
Average min. temp.
Source: Commonwealth Bureau of Meteorology Data for Griffith
TABLE 1: MEAN AND MEDIAN RAINFALL IN THE MLMCLocation Mean rainfall Median rainfallWagga Wagga 562 536Griffith 406 391Hay 366 362
2.3 Regional landscape
Topography
The wetland systems within the region are characterised by low relief. The Murrumbidgee Riverdominates the topography of the study area. The river falls just 100 metres over a linear distance of240 kilometres, or one metre over a linear distance of 24 kilometres. Due to the numerous meandersthe true rate of fall is even lower. Mirrool Creek, like the Murrumbidgee, exhibits a very low rate offall.
The Wumbulgul Hills, Narranderra Ranges and Brobenah Hills separate the Murrumbidgee River fromthe Mirrool Creek rising to between 300 and 400 metres before allowing the Mirrool Creek to passthrough near Griffith. Mirrool Creek flows between the end of these hills and McPhersons Range atGriffith. The Bogolong Hills prevent Frying Pan Creek from reaching the Murrumbidgee Floodplain.West of Griffith the only relief is low aeolian sand hills associated with prior streams.
Soils
The Murrumbidgee River and Mirrool Creek floodplains generally consist of grey (predominantly),brown and red clays. Off the floodplain areas, soils are grey silty loams that are associated withancestral streams and floodplains (MCAP 1998) often with sand and gravel layers at 1 to 10 metres(MIADLWMPWG 1998). Non-floodplain or prior stream soils are generally red-brown earths or self-mulching clays. These soil types are generally suitable for irrigation although self-mulching clays or

7
colluvial soils that have better physical characteristics are required for annual horticulture(MIADLWMPWG 1998).
Red earths are associated with the hills dividing the Mirrool Creek and Murrumbidgee River. Thesesoils also extend onto the mid Mirrool Creek floodplain. These soils are derived from the sandstoneand quartzite forming their parent material. The organic matter content of these soils is generally lowleading to lower soil fertility (MIADLWMPWG 1998).
Surface water
The main surface water features in the study area are the Murrumbidgee River and Mirrool Creek. TheMurrumbidgee River rises in the Great Dividing Range and Australian Alps to the east of the studyarea and drains a total area of approximately 84,000 square kilometres (DLWC 1996). The range offlows in the Murrumbidgee River is highly variable but less so than inland river systems in the north ofthe state. Murrumbidgee River flows at Wagga Wagga range from four percent to 637 percent of theannual average flow and below the study area at Balranald, from 29 percent to 359 percent of theannual average flow (DLWC 1996).
Flow variability in the Murrumbidgee River has been altered substantially by construction ofBurrinjuck Dam (completed in 1913) and Blowering Dam (completed 1968) and increased diversionsfor irrigation. In addition, construction of the Snowy Mountains Scheme has facilitated the diversionof an average of 550 gigalitres from the upper Snowy River to the Murrumbidgee via the Tumut River(Buchan 1995a). Close (1990) indicates storages affect flows in three main ways:1. Redistribution of flows within the year;2. Reduction in floods and increase in drought flows; and,3. By redistributing flows they facilitate larger total diversions from rivers.
‘The impact of the dams on the flow regime is most marked in the mid-catchment of the Murrumbidgeewhere the degree of stream flow variations has been substantially reduced’ compared to natural flowconditions DLWC (1996). The seasonality of flows in these reaches has also been changedsignificantly. Upstream of the major irrigation diversions at Gogeldrie and Berembed Weirs, totalflows have increased in the Tumut River and Murrumbidgee River below the junction (due to SnowyRiver diversions). Downstream of these weirs total flows have been reduced. The weirs raise thewater level and permanently flood some wetlands immediately upstream. Yanco, Hay, Maude,Redbank and Balranald Weirs also permanently inundate ephemeral wetlands. Drought flows from theMurrumbidgee to the Murray now occur in over 50 percent of years compared to five percenthistorically (Murray-Darling Basin Ministerial Council (MDBMC) 1995).
Burrinjuck and Blowering dams provide control over approximately 70 percent of the catchment abovethe Murrumbidgee-Tumut junction. Of 32 separate flood events at Burrinjuck Dam betweenSeptember 1970 and July 1991, three were eliminated and the remaining 29 were reduced by anaverage 51 percent (Buchan 1995a). Burrinjuck Dam is not able to mitigate large floods (one in five ormore years) to the same extent as small floods. Hence minor to moderate floods (one in a half to threeyears) that previously filled wetlands on the Murrumbidgee flood plain in the study area are nowdiverted or mitigated by Burrinjuck and Blowering dams (Buchan 1995a). When dams are used tomitigate floods the peak is delayed and the duration lengthened (Close 1990).
The effects of storages and irrigation diversions on wetlands differ depending on the relationshipbetween the wetland and the river and the point of extraction. Where total and average flows haveincreased (Wagga Wagga to Gogeldrie Weir in the study area) wetlands that are closely associated withthe Murrumbidgee River are likely to have been flooded more often and in different seasons. Otherwetlands in this section of the Murrumbidgee River that were historically flooded by minor to moderatefloods and wetlands below Gogeldrie weir are likely to be flooded less often. Levees and drains alsoalter the water regime of many floodplain wetlands.
Mirrool Creek is an ephemeral creek with headwaters near Temora to the east of the study area.Mirrool Creek flows through the Murrumbidgee Irrigation Area (MIA), and during extreme floodevents, on to the Lachlan River. Mirrool Creek catchment lies between the Lachlan and MurrumbidgeeRivers and contains a total area of approximately 11,000 square kilometres (Water Resources

8
Commission). Less than half the floods in the Mirrool Creek at Barellan reach the MIA due to thebroad floodplain (Water Resources Commission). Mirrool Creek is included in the MCAP. Thehydrological conditions in Mirrool Creek are divided into three main sections for the purposes of thisstudy: above the MIA (upper), within the MIA (mid) and below Barren Box Swamp (lower).
Upper Mirrool Creek drains approximately 5,000 square kilometres (MIADLWMPC 1998). Prior toentering the MIA, Mirrool Creek flows across a floodplain with no defined channel but with numeroussmall shallow wetlands. Upon entering the MIA, Mirrool Creek becomes integrated into the MIAsupply and drainage system. Mirrool Creek again has a well-defined floodplain downstream of BarrenBox Swamp.
No large dams have been constructed on Mirrool Creek. Levees in the upper Mirrool Creek havealtered wetland flooding. Within the MIA, construction of channels and levees has altered natural flowpaths and Mirrool Creek is now used as the main drainage and resupply canal (Grose and Holics 1994).Wetlands within this region are affected by both ground and surface water impacts of irrigation. Belowthe MIA, Mirrool Creek has been subject to increased flooding as a result of water dumping, releasesand escapes relating to irrigation in the region (Roberts and Brickhill 1992, Grose and Makewita 1997).Escape water from irrigation channels has converted a section of Berangerine Swamp from ephemeralto permanent.2
Frying Pan Creek, which drains into Lake Coolah and Mejum Swamp, is an ephemeral creek withheadwaters approximately 50 kilometres north east of Narrandera. The hydrology of the catchment isrelatively unchanged compared to pre-agricultural development. Other wetlands within the study areaare flooded by local run-off (for example Tuckerbil Swamp). Irrigation drainage has altered thesurface water hydrology of some wetland systems, whilst other small wetlands have been obliterated bylaser levelling.
Floodplain wetland systems within the region tend to flood during late winter or spring when peakflows naturally occurred in the Murrumbidgee and Mirrool Creeks. Wetlands in lower Mirrool Creekprobably would have only flooded during extreme rainfall events, approximately once in 10-20 years(Roberts and Brickhill 1992). Other wetland systems in the study area only flood following sufficientrainfall to generate local run-off (Frying Pan Creek and local depressions).
Irrigation and surface water
Murrumbidgee River flows have been substantially altered by the construction of Burrinjuck andBlowering Dams (completed in 1913 and 1968 respectively) to supply water for irrigation. Weirsconstructed in the river to facilitate diversion of irrigation water have created an in-stream ‘wetland’with a near permanent water regime on the river. Barren Box Swamp, Tombullen Storage, LakeWyangan and many farm depressions are used to store water and hence have been converted fromephemeral to permanent wetlands (MCAP 1998).
On average 2506 gigalitres of water is diverted from the entire Murrumbidgee River per year forirrigation, town water and other purposes (Buchan 1995a, MDBMC 1995). The MIA alone diverts1080 GL/year (MIADLWMPWG). Figure 2 shows the annual groundwater and surface waterextraction for the entire Murrumbidgee catchment, including the MIA, between 1983/84 and 1998/99.
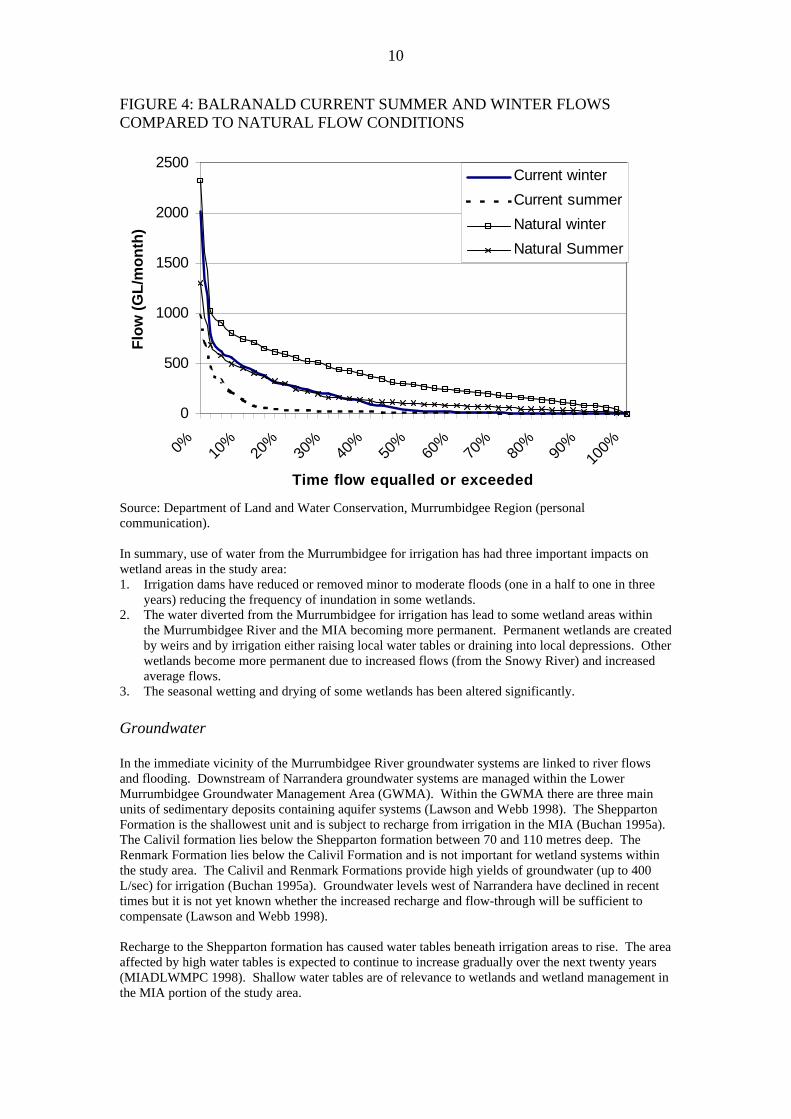
Irrigation flows in the Murrumbidgee River have inverted the natural flow regime. Winter and springflows are naturally high while late summer flows are low. Irrigation storage and flows have reversedthis pattern (MCAP 1998). This affects the floodplain wetlands that are interlinked with riverinesystems. Figure 3 shows the flow inversion at Wagga Wagga before the majority of irrigation water isextracted from the Murrumbidgee. Historically winter flows would have exceeded summer flows, butnow summer flows exceed winter flows more than 50 percent of the time. Figure 4 shows current andhistorical flows at Balranald after nearly all water used for irrigation has been extracted. Summer andwinter flows at Balranald are currently much lower than historically.
2 Murrumbidgee Irrigation is attempting to return the floodway to more natural flow conditions.

9
FIGURE 2: EXTRACTION OF SURFACE AND GROUNDWATER IN THE MIDAND LOWER MURRUMBIDGEE CATCHMENT
0
500
1000
1500
2000
2500
3000
3500
4000
1984 1985 1986 1987 1988 1989 1990 1991 1992 1993 1994 1995 1996 1997 1998
Year
Vo
lum
e in
GL
Groundwater MIA
Coleambally Lowbidgee
River pumpers
Source: NSW Department of Land and Water Conservation, Murrumbidgee Region (personalcommunications).
FIGURE 3: WAGGA WAGGA CURRENT SUMMER AND WINTER FLOWS
0
500
1000
1500
2000
2500
3000
3500
0% 10%
20%
30%
40%
50%
60%
70%
80%
90%
100%
Time flow equalled or exceeded
Flo
w (
GL
/mo
nth
)
Current summer
Current winter
Source: Department of Land and Water Conservation, Murrumbidgee Region (personalcommunication).
10
FIGURE 4: BALRANALD CURRENT SUMMER AND WINTER FLOWSCOMPARED TO NATURAL FLOW CONDITIONS
0
500
1000
1500
2000
2500
0% 10%
20%
30%
40%
50%
60%
70%
80%
90%
100%
Time flow equalled or exceeded
Flo
w (
GL
/mo
nth
)
Current winter
Current summer
Natural winter
Natural Summer
Source: Department of Land and Water Conservation, Murrumbidgee Region (personalcommunication).
In summary, use of water from the Murrumbidgee for irrigation has had three important impacts onwetland areas in the study area:1. Irrigation dams have reduced or removed minor to moderate floods (one in a half to one in three
years) reducing the frequency of inundation in some wetlands.2. The water diverted from the Murrumbidgee for irrigation has lead to some wetland areas within
the Murrumbidgee River and the MIA becoming more permanent. Permanent wetlands are createdby weirs and by irrigation either raising local water tables or draining into local depressions. Otherwetlands become more permanent due to increased flows (from the Snowy River) and increasedaverage flows.
3. The seasonal wetting and drying of some wetlands has been altered significantly.
Groundwater
In the immediate vicinity of the Murrumbidgee River groundwater systems are linked to river flowsand flooding. Downstream of Narrandera groundwater systems are managed within the LowerMurrumbidgee Groundwater Management Area (GWMA). Within the GWMA there are three mainunits of sedimentary deposits containing aquifer systems (Lawson and Webb 1998). The SheppartonFormation is the shallowest unit and is subject to recharge from irrigation in the MIA (Buchan 1995a).The Calivil formation lies below the Shepparton formation between 70 and 110 metres deep. TheRenmark Formation lies below the Calivil Formation and is not important for wetland systems withinthe study area. The Calivil and Renmark Formations provide high yields of groundwater (up to 400L/sec) for irrigation (Buchan 1995a). Groundwater levels west of Narrandera have declined in recenttimes but it is not yet known whether the increased recharge and flow-through will be sufficient tocompensate (Lawson and Webb 1998).
Recharge to the Shepparton formation has caused water tables beneath irrigation areas to rise. The areaaffected by high water tables is expected to continue to increase gradually over the next twenty years(MIADLWMPC 1998). Shallow water tables are of relevance to wetlands and wetland management inthe MIA portion of the study area.

11
Wetlands are located in the more depressed areas of the landscape. This is where discharge byevaporation may exceed recharge. Consequently there are two major problems for wetlands andagricultural systems:1. The rising water table waterlogs the root zone of plants eventually killing deep-rooted species. For
example groundwater related waterlogging has killed the Black Box trees surrounding TuckerbilSwamp; and,
2. Wetlands that are located in discharge areas may develop high concentrations of salt.The timeframe of these problems may be very long. Within the study area rising water tables directlyaffect the relatively small number of remaining wetlands in irrigation areas. Rising water tables andirrigation salinity has affected a large number of wetlands in the irrigation areas of the Murray DarlingBasin.
Salinity
Of the three forms of salinity; dryland, irrigation and riverine, only one – irrigation salinity is a currentproblem for wetlands within irrigated portions of the study area. Irrigation salinity arises whereirrigation causes groundwater tables to rise within the capillary zone leading to concentration of salts.This salt can affect wetlands either directly or indirectly. Direct impacts occur where the water tablerises under ephemeral wetlands causing a concentration of salts within wetlands. Two indirect impactsoccur:1. The salt concentrated via irrigation salinity is exported downstream to wetlands (eg Barren Box
Swamp).2. Irrigation drainage water evaporates and so concentrates the salts (eg Berangerine Swamp).Both impacts occur within the study area, direct impacts affect wetlands such as Lake Wyangan andTuckerbil Swamp while indirect impacts can eventually affect downstream wetlands within the MirroolCreek floodway and Murrumbidgee floodplain.
Water quality
There are four water quality components of importance to wetlands in the study area: salinity, nutrients,turbidity and agricultural chemicals.
Riverine salinity is rising in the Murrumbidgee River (Buchan 1995). However, the main source ofsalinity is during low flows when groundwater contributes to base flows. As floodplain wetlands arefilled with high level flows, riverine salinity is not a problem for most wetlands in the study area. Withincreasing incidence of dryland salinity in the upper catchment outside of the study area, riverinesalinity may become a problem in the long term – particularly in areas such as Mirrool Creek, a systemwith no base flows but is not regarded as currently having an ecological impact.
High levels of nutrients can cause detrimental algal blooms in wetland areas. Buchan (1995a p. 24)indicates it is ‘likely that at least half of the [flooded] billabongs west of Wagga Wagga have minorblooms at some time each summer.’ Concentration of nutrients also occurs in wetland areas due tolocal drainage and less frequent inundation by floods. Extreme concentrations of phosphorus havebeen reported for the Mirrool Creek Floodway (Buchan 1995a).
High levels of turbidity are unsightly and can cause problems for aquatic organisms (Buchan 1995a).Rivers can be naturally turbid due to clay soils in their catchments. Base flow components of theMurrumbidgee are generally of low turbidity however flood flows of both the Murrumbidgee andMirrool Creek have very high levels of turbidity. The high turbidity of flood flows is attributed toerosion resulting from land clearing, cropping and urban development in the mid and upper catchmentand the exotic fish; carp (DLWC 1996).
Agricultural chemicals associated with irrigated cropping such as rice production and intensivehorticulture could significantly affect wetlands within the study area. This threat has been identified inthe MIADCLWMP (1998) and monitoring programs and management strategies are in place to reducethe threat to wetlands.

12
2.4 Ecological features
The Murrumbidgee River floodplain encompasses 174,700 hectares between Wagga Wagga and HayWeir (Thornton and Briggs 1994). The Murrumbidgee River is fringed by river red gum forestthroughout the study area, sometimes extending across the floodplain. The floodplain contains some2005 hectares of open water wetlands and 45,075 hectares of river red gums (Thornton and Briggs1994). An unknown additional area of river red gum wetlands has been cleared for grazing purposes.Of the 45,075 hectares of river red gum wetlands, 570 hectares have been killed by increasedinundation. Overall 62 percent of these wetlands have been affected by hydrological changes such asweirs, banks (both to dam and to block flows), pumping, drainage or irrigation drainage (Thornton andBriggs 1994). The wetlands of the Murrumbidgee River from Narrandera to Carathool are listed in ‘ADirectory of Important Wetlands in Australia’ (Australian Nature Conservation Agency (ANCA) 1997)as are Fivebough and Tuckerbil Swamps.
Wetland systems differ substantially away from the Murrumbidgee floodplain and are subject todiffering threats in different parts of the study area. Upper Mirrool Creek wetlands are shallowdepressions within cropped land. The native vegetation has been removed from almost all thesewetland areas with exception of roadside verges and, in parts, a narrow floodway (which is insufficientto contain the floodwaters). Natural vegetation consists of box trees with an understorey of lignum andgrasses. Despite the degraded nature of many of these wetland areas the relatively rapid recovery oflignum in area no longer cropped creates potential for restoration.3
Within the MIA the main threats to wetland areas are rising groundwater and irrigation drainage. Mostwetlands in this area show signs of degradation including dead or stressed vegetation (commonlyincluding black box (Eucalyptus largiflorens) and a change in the vegetation understorey from lignumor canegrass to cumbungi due to permanent waterlogging (Grose and Holics 1994).
Downstream of the MIA, the wetland areas on Mirrool Creek floodplain are also listed in ‘A Directoryof Important Wetlands in Australia’ (ANCA 1997). The ecological changes to these wetlands havebeen described as a ‘microcosm for south-western New South Wales’ by Roberts and Brickhill (1992).They consist of depressions often fringed by black box and covered by canegrass or lignum. Similar towetlands within the MIA, the water regime of wetlands on the Lower Mirrool Creek floodway havebeen altered indirectly due to irrigation, as well as via levees and banks, irrigation, clearing for irrigatedcropping and grazing. Changes have resulted in dead or dying black box trees in wetter areas,establishment of invasive species (cumbungi) and extensive salinised patches at Berangerine Swamp.
Remaining wetland areas within the study areas (Lake Coolah, Mejum Swamp, Thompson’s Swampand depressions) are mainly affected by grazing, clearing and alterations to their catchment.Hydrological changes are expected to be relatively small, however, a significant increase in turbidity isexpected.
The conservation importance of wetlands within the study area has not been formally assessed. The45,075 hectares of red gum wetlands is nearly as large as the Barmah-Millewa forest (59,000 hectares)(Briggs, Thornton and Lawler 1997). Briggs, Thornton and Lawler indicate that the breeding value ofthese wetlands is ‘similar to, or exceeds the value of other wetlands in the region, such as theLowbidgee and Barmah-Millewa forest’ (1997 p. 40). Briggs, Thornton and Lawler conclude thataltering river red gum wetland hydrology alters the range of water birds breeding in these wetlands.The large-scale hydrological changes along the Murrumbidgee floodplain will alter the types ofwetland species undertaking breeding. Grose and Holics (1994) indicate that the Murrumbidgee Riverfloodplain red gum wetlands have high conservation significance.
Other wetlands within the study area, especially lignum, are important breeding and feeding areas for anumber of water birds. Tuckerbil and Fivebough Swamps are rich in waterbird species and nationallyand internationally significant counts of two species have been made at these sites. The remaininglignum wetlands within the region are increasing in importance as large areas of lignum are cleared inother areas of the state. For example 40 percent of the lignum in the Lowbidgee area had been cleared
3 Discussions with a local farmer indicate that areas left uncropped begin to develop lignum within
three to five years.

13
before 1991 and additional clearing has occurred since then (Department of Water Resources (DWR)1994).
3 Values of wetlands – actual and potential
3.1 Property rights and wetland values
Wetland owners and managers are able to obtain differing benefits from wetlands according to theproperty rights held (see box 3). The benefits secured by property right owners are referred to asprivate values (see box 2 for a definition). For example, in New South Wales, owners are able tosecure income from grazing or eco-tourism in wetlands but are generally not able to secure incomefrom hunting in wetland areas. The structure of property rights determines what uses wetlands can beput to and the range (and type) of benefits available to wetland owners and managers.
Wetland owners will also draw some private benefits from public goods produced by wetlands (such asviewing breeding events) but the benefits to the wider community would be expected to be muchlarger. Economic theory indicates that wetland owners and managers will act to maximise their totalbenefits. Hence wetland owners will only take into account the private benefits to themselves fromboth production of private goods (such as livestock) and from production of public goods (such asnutrient removal by wetlands). They do not take into account the benefits to the wider community ofproducing public goods. Hence a potential conflict exists between wetland owner’s and manager’sgoals and community goals.
Box 3: Property Rights and internalisation or capture of benefitsProperty rights are both informal and formal legal rules. The rules specify who can do what with particularassets. Assets include physical goods or objects (such as a house) as well as less recognised assets (such asthe use of a company car). The rules are defined and enforced either by the state or within the community(Wills 1997) and may change over time. In the Murrumbidgee wetland owners have property rights whichallow them to graze wetlands but not to hunt waterbirds on wetlands. A landowner may apply for the rightto hunt particular pest species (via an occupier’s licence). The property right to graze wetlands has beenexchanged for a monetary payment by some managers (for example state forests grazing leases), but otherrights such as to harvest timber have been retained. That is, different owners may hold property rights overdifferent facets of an asset. For example, under a grazing lease the State owns the right to timber and theleaseholder the right to graze.Internalisation or capture of benefits occurs where the owner of a property right is able to exploit theirproperty rights to increase their well being. For example, the owner of the property right to graze wetlandscan internalise the benefits of this right by using the wetland to fatten his livestock for sale. Where awetland owner has sold or leased the right to graze they may be able to internalise other benefits from hisremaining property rights by charging hunters to shoot, or earning income from guided tours.Rival values are values which, once enjoyed by one individual, cannot be enjoyed by another (such asconsumption of fodder by stock).Excludable values are those benefits which owners are able to cost effectively exclude others fromenjoying (such as grazing or some forms of recreation on wetlands).
The benefits and costs4 (values) to both wetland owners and managers and the wider community needto be identified in order to examine the potential conflict between the goals of wetland managers andthe wider community. It is also important to identify inter-relationships between values and valuechanges arising from alternative management strategies. Opportunities that facilitate achievement ofboth community and owner/manager goals need to be identified. These opportunities may includealternative property rights regimes, joint production of private and public goods or other incentives. Inthis Section the constituents of values are identified while in Section 4 the inter-relationships betweenvalues are examined.
4 Benefits are regarded as facets of the wetland that increase the well being of the owner or community.Costs are regarded as facets of the wetland that reduce the well being of the owner or the community.Whether a particular facet is regarded as a benefit or cost may differ from the owner and thecommunity. For example the owner might regard attraction of birds as a cost (if for example theydamage crops) but the community as a whole might regard this as a benefit.

14
3.2 Non-consumptive wetland values
An exploratory survey of Murrumbidgee wetland stakeholders5 conducted by Druce and Faulks in 1992concluded that the most important non-consumptive attributes are wildlife habitat (including birds),ecological and existence values. Consumptive-use attributes that rated highly included waterstorage/retention, tourism and recreation, grazing and forestry. Other attributes that were rated lesshighly were flood mitigation, biodiversity, aboriginal and cultural heritage and as nutrientsinks/recycling. As more is learnt about wetlands and relative values change the relative importance ofthese attributes is likely to change over time. Furthermore these values and their ranking are the resultof stakeholder perceptions and hence reflect the knowledge base of participants rather than theimportance of wetlands within ecosystems. The list of wetland values is likely to include ‘indicatorattributes’. That is, some attributes suggest other values are also present. For example healthy wetlandvegetation suggests the presence of wildlife.
Box 4: Attributes and threshold valueAttributes are the building blocks of the costs and benefits of a wetland. They are the factors that drivepeople’s values. Examples of attributes include size and depth of wetland, type of understorey and use asforage, size and form of trees (for timber), number and type of bird species present, number and type ofbird species breeding, frequency of bird breeding events, vegetation type and health.Indicator attributes may be of two types. The first are by and of themselves drivers of values. However,they also indicate the likely presence of other values. For example a wetland vegetation attribute may be ofvalue in itself but may also suggest the likelihood of bird species and bird breeding events. The secondtype of indicator attribute may have little or no value alone, but attest that other attributes of value arelikely to be present. For example, the level of disturbance to a wetland environment, whilst in itself may beirrelevant to values, may signal the demise of endangered species and a reduction in biodiversity.Threshold value is an economic concept used to explain large jumps in value once a certain level ofattributes occurs. For example the protection of a complete range of wetland types, or a complete chain ofswamps, may lead to a large increase in their conservation value.
In this section the range of values attributable to wetlands in the Murrumbidgee are described.Discussion focuses on wetland values generated without consumptive uses occurring. The range ofwetland attributes discussed includes use values, indirect use values and non-use values. For example,individuals could value waterbirds for their existence and as a tourism drawcard. Hence the valuesdiscussed are both private values and social (community) values. Eco-tourism, for example, cancapture some private values while others such as flood mitigation or existence values are essentiallysocial values.
Birds
The wetlands of the Murrumbidgee River floodplain between Wagga Wagga and Hay are equal to, orexceed the Barmah-Millewa forest in terms of breeding significance for waterbirds (Briggs, Thorntonand Lawler 1997). ‘Most waterbirds of the Murray-Darling Basin breed following flooding’, whileothers breed seasonally and in some cases both (Briggs 1990). Seasonal breeding in the study area isnormally in early spring.
The altered hydrological regime of many wetlands within the study area alters the mix of species ableto breed. Conversion of wetlands to a near-permanent and stable water regime has reduced breedinghabitat value for some species, but has improved or maintained breeding areas for others such asDarters, Great Cormorants and Pacific Herons (Briggs, Thornton and Lawler 1997). Other birds havebenefited from irrigation practices and increased cumbungi area, such as Great Egrets (Grose andHolics 1994). Reduced flooding of ephemeral wetlands has disadvantaged species including LittleBlack Cormorants, Little Pied Cormorants, White-faced Herons and Yellow-billed Spoonbills, mostduck species and many wader species (Briggs, Thornton and Lawler 1997).
5 Wetland stakeholders were selected as those with ‘the greatest involvement or knowledge of the[Murrumbidgee] valley’s wetlands’ (Druce and Faulks 1992).
15
The importance of the wetlands in the study area for waterbirds is indicated by the 116 species (18threatened) officially recorded for Fivebough Swamp alone (ANCA 1997). Threatened speciesrecorded in the study area include Freckled Duck, Blue-billed Duck, Brolga, Painted Snipe, MagpieGeese and Australian Bittern and Black-tailed Godwit. Freckled Duck, Magpie Geese and Brolga havebeen recorded breeding (Maher, P. 1988, Mills 1998, Grose and Holics 1994, Grose and Makewita1997). At least nineteen species of waterbird breed on the Lower Mirrool Creek (ANCA 1997, Mills1998). While Briggs, Thornton and Lawler (1997) recorded 22 species breeding in MurrumbidgeeRiver floodplain wetlands. Additional ‘vulnerable’ and ‘endangered’ species use wetland vegetation forat least part of their life cycle (for example the Bush Thick-knee use black box woodland and theSuperb Parrot use river red gums) (Grose and Holics 1994, Grose and Makewita 1997). Some birdspecies are regarded as pests (for example ducks during the establishment of rice crops) and can be shotunder occupier’s licences.
Mammals
Many mammal species use wetlands for food, shelter or water, particularly bats and possums, but onlywater rats and platypus are completely dependent on wetland environments (Grose and Holics 1994,Grose and Makewita 1997). Eighteen species of native mammals occur within the study area and afurther four may occur. Three mammal species are listed as ‘vulnerable’: Koala, Greater Long EaredBat and Spotted-tailed Quoll (Grose and Makewita 1997). Both Koala and Spotted-tailed Quoll usewetland habitat (Grose and Holics 1994). Nine other species are regarded as rare within the MIA,Tabbita and Benerembah irrigation districts or the Wah Wah irrigation district (Grose and Holics 1994,Grose and Makewita 1997).
Eight introduced feral species have been recorded in the study area: rabbits, hares, foxes, cats, goats,pigs, rats and mice. Feral pigs, cats and foxes are a direct threat to both mammal and some waterbirdspecies via predation. Rabbits have historically been extremely destructive to vegetation within theregion and continue to threaten vegetation-surrounding wetlands.
Fish, crayfish and mussels
Eighteen species of native fish, two shrimp species, two crayfish species and two (possibly three) formsof mussel have been recorded within the study area (Grose and Makewita 1997, Cadwallader andLawrence 1990). Of these two species are regarded as ‘restricted’, Murray Galaxias and Purple-spottedGudgeon, while Silver Perch are ‘potentially threatened’ (Grose and Makewita 1997). Eight speciesare regarded as rare within the study area. The decline in abundance of native fish species is wellknown (see Brown 1994 for example). Additional species are likely to become rare or threatened inthe future.
Many fish species require major flooding to facilitate breeding. In addition several species undertakemajor migrations prior to spawning (Cadwallader and Lawrence 1990). Most native fish spawn inspring/summer – when flooding historically occurred in the Murrumbidgee. Cadwallader andLawrence (1990) indicate the main management changes affecting fish are:
• reduced flows;
• altered seasonality of flows;
• reduced frequency of flood flows;
• altered river levels; and,
• increased rate of fall of river levels.Fewer minor and moderate floods reduce the spawning opportunity. Weirs and dams alter river flows,heights and temperature in addition to breaking up migratory pathways. Irrigation alters seasonal flowsand river levels.
Two forms of both mussels and crayfish occur in the Murrumbidgee. One group is dependent onflowing water (River mussels and Murray crayfish) and the other on still water (Floodplain mussels andto a lesser extent Yabbies) (Geddes 1990, Walker 1990). Floodplain mussels and Yabbies are likely tohave benefited by the creation of weir pools and less fluctuation in river heights. River mussels andMurray crayfish have declined in abundance. Yabbies are abundant in irrigation channels and cause

16
some damage via burrowing (Grose and Makewita 1997). Both shrimp species are abundant inirrigation channels within the study area (Grose and Makewita 1997).
Four species of introduced fish have been recorded in the study area including common carp. Carp arenow the dominant species across the study area (Signor 1999, Harris 1995). Carp are less common inthe ephemeral swamps of the lower Mirrool floodway as drying out removes a permanent population.Carp are not present in isolated hydrological systems such as Lake Coolah or Mejum Swamp.
There is a public perception that carp have had a major influence on rivers and wetlands. Carp areattributed with increasing turbidity, destroying aquatic plant beds, liberating nutrients from sediment,promoting algal blooms, damaging artificial wetlands built for water quality control and underminingthe banks of streams and irrigation channels (Harris 1995). However, because so little is known aboutnative fish and due to the major habitat changes induced by dams, weirs and irrigation little can beregarded as hard evidence (Cadwallader and Lawrence 1990). Recent research indicates that Carp areimplicated in many of these changes but that major habitat changes and soil/sediment type may be asimportant or more so (Recknagel, Marsh, Matthews and Schiller 1998, Robertson, Healey and King1997, King, Robertson and Healey 1997, Roberts, Chick, Oswald and Thompson 1995). Focusing oncarp, however, avoids addressing the root cause of these problems (see for example Roberts 1998).Introduced species also carry diseases that have been implicated in the decline of native fish species(Cadwallader and Lawrence 1990).
Reptiles and Amphibians
Thirteen amphibian species have been recorded in the study area. Only one species is regarded as‘endangered’, the Green Swamp Frog (Litoria raniformis). Three turtle species have been recordedhistorically but two are now rarely found. A further 26 reptile species are known to occur in the regionsome of which are associated with wetlands (for example eastern brown snakes, eastern tiger snake andred-bellied black snakes) (Grose and Holics 1994). A number of reptile species are rare within theMIA, Tabbita and Benerembah Irrigation Districts or the Wah Wah Irrigation district including, twelvereptile species and three amphibian species. Clearing of vegetation has reduced habitat for manyamphibian species that shelter in remnant vegetation when away from water (Grose and Makewita1997). There is generally inadequate knowledge of the requirements of amphibian and reptile speciesin the study area.
Other taxa
The riverine plains are rich in aquatic invertebrates. A five-year study by Bennison and Suter (1990)found 439 different macro-invertebrate taxa in the Murray River. A similar number of taxa would beexpected in the Murrumbidgee. Following inundation the production of invertebrates in ephemeralwetlands and billabongs is extremely high. It is these high levels of production that allow fish and birdbreeding to successfully occur. Despite their importance in ecosystems, invertebrates tend to be valuedas part of an ecosystem rather than as individual species. Focus group research suggests no separatevalues are held for invertebrates outside of ecosystem and habitat values (Bennett, Blamey andMorrison 1997, Morrison, Bennett and Blamey 1997). Many individual wetland species are yet to becategorised within Australia (Bennison and Suter 1990).
Wetland vegetation
Wetland vegetation varies according to the frequency and duration of inundation and soil type. Acrossthe study area wetland inundation duration varies from less than one month to near permanent,inundation frequency from annual to rare and wetlands are located on several soil types. Somewaterbirds require a variety of wetland habitats for different stages in their life cycle (Maher 1986).The following six wetland vegetation types, loosely based on Porteners (1993) are typical of the studyarea:
• River red gum wetlands (Eucalyptus camaldulensis): river red gums fringe the MurrumbidgeeRiver throughout the study area sometimes spreading across the floodplain up to two kilometresfrom the river. Red gum wetlands are extremely important bird and arboreal mammal habitats dueto their large size and numerous hollows formed within single veteran trees. Some waterbirds also

17
use sticks for nest construction. Red gums require periodic flooding for seedling germination andgrowth. River red gum wetlands within the study area also contain sites of aboriginal significance.River red gum wetlands are regarded as ‘vulnerable’ and ‘inadequately conserved’ (Benson 1988,Pressey 1988, Clark 1988, Somerville 1988).
• Black box wetlands (E. largiflorens): Black box wetlands occur on higher floodplain levels of theMurrumbidgee as well as in less frequently flooded areas such as the lower Mirrool floodway anddepressions filled by local rainfall. Black box is often associated with Lignum and Nitre goosefootwetlands. Black box also provide shelter and nest sites for a broad variety of wetland speciesincluding waterbirds, mammals, reptiles and amphibians. Black box communities are regarded asan ‘insignificant area conserved’ (Pressey 1988).
• Lignum (Muehlenbeckia florulenta)/Nitre goosefoot (Chenopodium nitrariaceum) wetlands: Thesewetlands are important feeding and breeding habitat for waterbirds as the Lignum can form denseimpenetrable stands in some areas and provides emergent nest sites. Lignum/nitre goosefootwetlands are filled infrequently to rarely but retain water for a prolonged period.
• Cane grass (Eragrostis australasica) wetlands: Cane grass is adapted to relatively frequent butshort duration flooding. Hence cane grass often grows in small drier areas of larger lignum/blackbox wetlands and along drainage lines.
• Tall reeds/rush swamps: Tall reed and rush swamps generally consist of Phragmites australis andTypha spp. (Cumbungi). Cumbungi wetlands can provide important feeding, breeding and shelterareas for waterbirds. Tall reed swamps require semi-permanent inundation. Tall reed andespecially cumbungi have been increasing in area within the study area due to the impacts ofirrigation.
• Open water: These wetlands exist in a variety of forms within the study area. Many riverinewetlands consist of open water surrounded by river red gums while some depressions such asFivebough Swamp consist of large areas of shallow open water with little or no fringingvegetation. Open water wetlands may or may not contain submerged aquatic vegetation. Thesewetlands provide feeding grounds for several wetland species. Some species also use mudgathered from such areas for nest building.
The wetland types discussed above are often contiguous rather than distinct. For example, river redgums often occur in association with black box, or fringing open water while black box is oftenassociated with lignum or cane grass. Clearing of native vegetation within the study area means thatremaining vegetation almost always has a high value (Grose and Holics 1994). All native vegetation inthe study area falls under the Native Vegetation Conservation Act 1997 and cannot be removed withoutpermission from the relevant Vegetation Management Committee.
Flood mitigation
Wetlands are able to store significant volumes of water. Redistribution of water through timesignificantly changes flood patterns. In the United States, these benefits have been valued very highlyin certain cases (see for example Corps of Engineers 1976). Both the Murrumbidgee River and theMirrool Creek floodplain mitigate floods to some extent. Less than half of the floods in the MirroolCreek at Barellan reach the MIA (Water Resources Commission). Only very rarely does floodwater inMirrool Creek reach the Lachlan river (five times this century (Mills 1998)).
Potential flood mitigation benefits rely on using wetlands to either redistribute flood peaks or storesignificant quantities of water. The broad, flat nature of much of the flood plain allows for significantredistribution of flood peaks. However, some farmers regard floods on at least part of their propertiesas a negative impact. For example levees have been constructed to prevent flooding over large areas ofthe upper Mirrool Creek floodplain causing redistribution of flood patterns.6 In these cases farmersperceive the cost of flooding exceeds their benefits from flood mitigation.
6 Water Resources Commission, discussions with Lilian Parker of Murrumbidgee Irrigation and a localfarmer.

18
Aquifer impacts
Some wetlands within the study area are/maybe recharge sites for regional aquifers. However, theimpacts of irrigation recharge dominate wetland recharge at present. There is some concern thatchanged flooding patterns in the Lower Mirrool Creek floodway is leading to rising groundwater andpotentially salinity within the region (MIADLWMPWG 1998).
Water quality impacts
Agricultural activities, especially intensive production such as rice, row crops and horticulture, canreduce water quality due to inputs of nutrients, agricultural chemicals, turbidity and other pollutants.Wetlands are able to trap and sequester many of these pollutants thus reducing the private andcommunity costs of pollution such as algal blooms. This function may be especially valuable withinthe Murray Darling Basin system supplying water to a large population from a high value ecosystem.However use of wetlands to treat water will change the wetland and may downgrade other values tosociety.
Aboriginal heritage values
Aboriginal people, mainly of the Narinari and Wiradjuri tribes, have inhabited the study area for anestimated 40,000 years (MCMC 1998). Campsites and shell middens are found along theMurrumbidgee River and lower Mirrool Creek (MCMC 1998, Grose and Makewita 1997). Canoe andshield trees are found in many locations along the Murrumbidgee River in addition to rarer, high valuesites, such as ‘birthing trees’ and ceremonial grounds. Sand-hills or lunettes were often used as burialgrounds and may occur in the study area but are mainly recorded in the Lower Murrumbidgee belowthe study area (MCMC 1998).
Concluding comments – ecosystem values
The preceding discussion of wetland attributes has been greatly simplified and does not address thecomplexity and number of interrelationships within wetland systems and between wetland and riverinesystems. Management impacts may act immediately and directly on only one or a few attributes butindirectly or over a longer term on other attributes. Hence it is important to consider the holistic andlong-term impacts where management changes are considered, especially where changes areirreversible.7
Individuals value wetlands for the benefits they derive from them. Some of these benefits are non-usein nature. Individuals are likely to value the natural, self-sustaining function of wetlands apart fromany other values derived. Furthermore, the existence of a natural system indicates that other values arelikely to be present. These additional values may include, for example, bird breeding events and floraand fauna habitat. Maintaining these specific, valued attributes (such as bird breeding events) within arelatively self contained and self perpetuating ecosystem is likely to cost the community less thanattempting to manage each attribute separately (for example constructing and managing a wetlandspecifically to encourage a bird breeding event).
A complete range of wetland habitats is likely to increase the value to the community in two ways:1. Different wetland types provide different values to the community; and,2. As some species require more than one wetland type for their lifecycle a greater range of species
will be conserved.In addition to conserving a range of wetland areas, the linkages between wetland areas need to beconsidered. Conservation of ‘islands’ of wetlands is not likely to be effective in the long term as manywetlands are connected to floodplains and riverine systems.
7 Despite the work undertaken to rehabilitate disturbed wetland sites (see Streat 1998 for example) andthe range of values able to be generated within a relatively short time period, the complete range offlora and fauna values existing prior to disturbance often cannot physically be restored. Hence somebiodiversity values, and potentially other values, can be destroyed irreversibly.

19
3.3 Developed or modified wetland values
Wetland uses are not restricted to non-consumptive uses but also include uses that transform or modifythe wetland in some way. These uses are general based on ‘unpacking’ wetland resources for use inagricultural production systems such as irrigation, grazing, cropping or agro-forestry (Bennett 1998).For example water can be pumped from and into wetland systems for use in irrigation, wetlandvegetation can be grazed or logged. Some indirect or non-use values also exist for modified ordeveloped wetlands. For example, one potential non-use (and/or use) value is the maintenance of anagricultural landscape. The generation of values from agricultural production requires generation of aproducer or consumer surplus. The concept of an economic surplus is essentially an excess of benefitsover costs of either producing the output (producer surplus) or purchasing the output (consumersurplus).
Box 5: Producer and consumer surplusProducer surplus is the excess of revenue received by a supplier of a product over the minimum amountthey would be willing to accept to maintain the same level of supply (Bannock, Baxter and Davis 1987).The minimum amount includes the producer’s monetary costs and the value placed on non-monetary costssuch as the farmer’s own labour.Consumer surplus is the excess of the maximum price an individual would be willing to pay over what isactually paid for a good (Bannock et.al. 1987).
Socio-economic context and infrastructure
The study area lies within seven local government areas (Wagga Wagga, Narrandera, Leeton, Griffith,Murrumbidgee, Carrathool and Hay). The entire study area lies within a single administrative regionfor the Department of Land and Water Conservation, National Parks and Wildlife, State Forests,Department of Agriculture and NSW Fisheries while it is part of two Environment Protection Agencyregions. Despite the overlap in relevant State government administrative regions, coordination remainssomewhat fragmented. Department of Land and Water Conservation officers are located in Leeton(wetlands) and Wagga Wagga (catchment management), National Parks and Wildlife officers arelocated in Queanbeyan (water), Dubbo (vegetation) and Griffith while State Forests and Fisheriesofficers are located in Narrandera. The main coordinating and community representative body is theMCMC based at Wagga Wagga.
The MCMC has developed the Murrumbidgee Catchment Action Plan (MCAP) (MCMC 1998) withthe vision of ‘a productive Murrumbidgee Catchment with healthy ecological processes and enhancedbiodiversity’. The MCMC is constituted under the NSW Catchment Management Act (1989). Whilethe MCAP is not legally binding it is the principal advisory and coordination document for naturalresource management within the region. Under the MCAP (MCMC 1998) wetland management isgiven the highest priority rating. The Murrumbidgee Wetland Working Group has primaryresponsibility for developing a Murrumbidgee Wetland Management Strategy. The MurrumbidgeeRiver Management Committee (MRMC) is charged with setting river flow rules and hence has animportant role in management of floodplain wetlands on the Murrumbidgee. The Landcare movementis also active within the study area with 17 Landcare groups active in the shires contained in the studyarea.8 Other non-government groups are also active in the study area including Greening Australia andother conservation/environmental organisations.
Transport within the region and to major markets is well developed with a number of major highwayscrossing the region north/south (Mid Western and Newell Highways) and east/west (Sturt Highway,Kidman Way). The highways facilitate rapid transport of the horticultural produce to domestic marketsin Melbourne and Sydney and internationally. There is also a network of sealed minor roads but majorflood events can close or disrupt transport within and from the region for months.
The study area contains four main towns, Griffith (population 22,161), Narrandera (population 7,165),Leeton (population 11,428) and Hay (population 3,828). Wagga Wagga (population 56,080) is in the
8 Helen Reynolds, Executive Officer, Murrumbidgee Landcare (personal communication).

20
eastern tip of the study area (McLennan 1998). In the MIA portion of the study area approximately 65percent of the population live in towns (MIADLWMPWG 1998). Composite data for the six localgovernment areas (LGAs) that contain most of the study area indicates the population grew by 1.75percent between 1991 and 1996.9 Total population for these shires was 49,464 in 1996 (McLennan1998). These LGAs have a higher proportion of young people (24.8 versus 21.6 percent and a lowerpercentage of older people (11.9 versus 12.1 percent) than Australia as a whole (McLennan 1998).10
The proportion of people with higher education in the six LGAs is nearly half that of the Australianaverage (5.3 versus 10.4 percent) (McLennan 1998). Labour force participation in these LGAs isslightly higher than the Australian average (62.9 versus 61.9 percent) and unemployment significantlylower (6.1 versus 9.2 percent in 1996) (McLennan 1998). However under-employment is not indicatedby these figures. Per capita gross household income is lower within the six LGAs than the Australianaverage ($14,011 versus $16,175) (McLennan 1998).
Farm description and performance indicators
Agriculture within the study area is either irrigated or non-irrigated (dryland). Non-irrigated farmingstrategies range from mixed cropping and grazing in the east of the study area to low intensity grazingin the west. Lakebed cropping is not widespread within the study area but several wetland areas havebeen cleared and used for irrigated and dryland cropping. Small, ill-defined wetland depressions on theupper Mirrool Creek floodplain are ploughed and cropped as part of broadacre farming practices. Non-irrigated property size increases from east to west and away from the Murrumbidgee River floodplain.Mixed cropping (except in the western portion), grazing of sheep for wool and to a lesser extent meatand increasingly cattle are the major dryland farming enterprises in the study area. Several largefeedlots also operate within the study area.
Irrigated cropping is practised over much of the study area where water supplies are available fromeither the Murrumbidgee River or groundwater supplies. Rice, wheat, citrus, wine grapes, vegetables,prime lambs and wool are the major irrigation enterprises in the study area. There are 1041 irrigatedbroadacre farm businesses and approximately 1000 small area horticultural farm businesses within theMIA and districts comprising 482,000 hectares plus a small number of additional irrigated farmbusinesses pumping directly from the Murrumbidgee River or groundwater sources (Samaranayaka,Topp and McClintock 1997, MAIDLWMPWG 1998). Samaranayaka, Topp and McClintock (1997)further divide broadacre irrigated farms in the MIA into cropping specialists and others. Croppingspecialists irrigate 45 percent of an average farm size of 388 hectares with 81 percent of total receiptsfrom cropping. ‘Other’ farms were on average 4,084 hectares with only 8 percent irrigated and 45percent of total receipts from livestock. Removal of size restrictions on irrigated holdings in the MIAin 1997 is expected to lead to an increase in farm business size and a reduction in the number of farmbusinesses over the longer term.
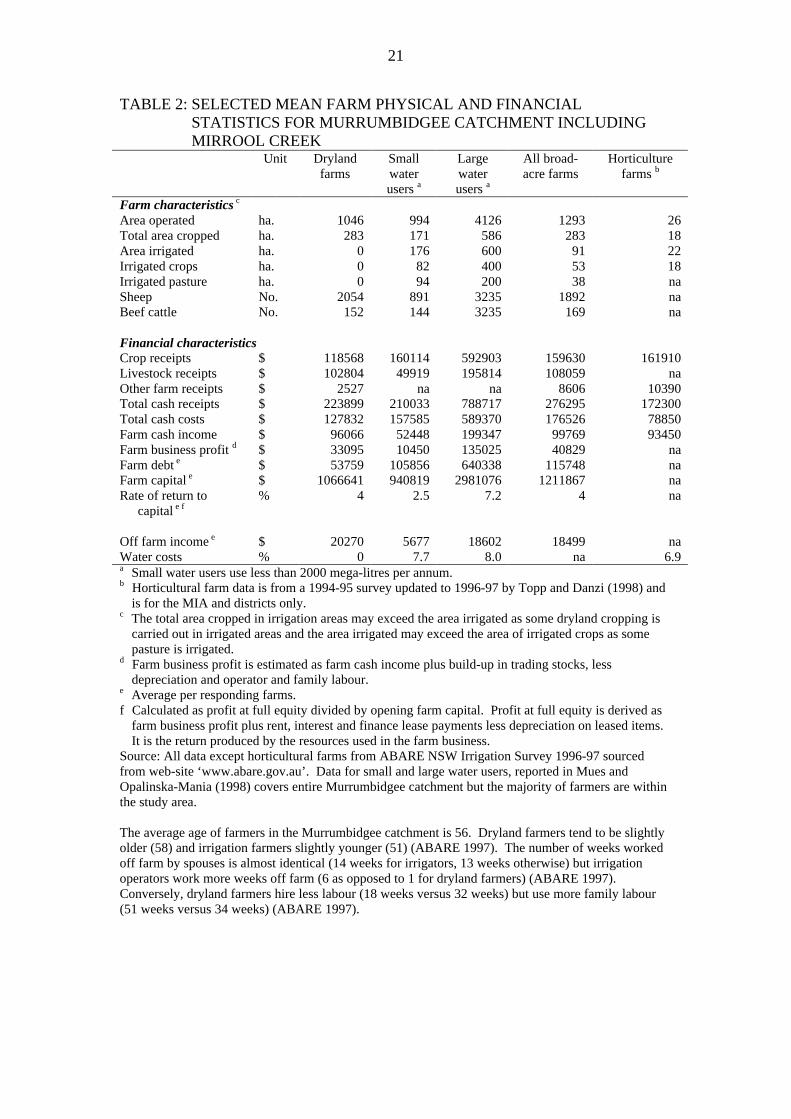
Selected physical descriptive measures of farms in the entire Murrumbidgee catchment are provided inTable 2 (these data are not available for smaller portions of the catchment). All data are for thefinancial year 1996-97 and point in time statistics (such as sheep and cattle numbers) are as at June 30th
1997. Selected financial characteristics for farms are also reported in Table 2. The majority ofbroadacre irrigation farms are located within the study area however dryland farm data arerepresentative of the Murrumbidgee catchment as a whole rather than the study area. The data indicatea significant divergence between large water users and other farming categories on most physical andfinancial characteristics. Large water users recorded the highest return on capital at 7.2 percentfollowed by small irrigators and dryland farming. Figure 5 shows the distribution of broadacreirrigation water users in the Murrumbidgee catchment.
9 Composite statistics include the LGAs of Narrandera, Carrathool, Griffith, Hay, Leeton and
Murrumbidgee but exclude Wagga Wagga. Wagga Wagga is excluded as its large, non-rural basedpopulation may distort data. The area of the LGAs is substantially larger than the study areacovering additional areas to the west and south and a small area to the north, however farmingsystems are similar (with exception of no fewer floodplain wetlands) allowing broad conclusions tobe drawn. All composite statistics relate to data from the 1996 census (McLennan 1998).
10 Young people are aged 0-14 years and older people 65 years and over.
21
TABLE 2: SELECTED MEAN FARM PHYSICAL AND FINANCIALSTATISTICS FOR MURRUMBIDGEE CATCHMENT INCLUDINGMIRROOL CREEK
Unit Drylandfarms
Smallwaterusers a
Largewaterusers a
All broad-acre farms
Horticulturefarms b
Farm characteristics c
Area operated ha. 1046 994 4126 1293 26Total area cropped ha. 283 171 586 283 18Area irrigated ha. 0 176 600 91 22Irrigated crops ha. 0 82 400 53 18Irrigated pasture ha. 0 94 200 38 naSheep No. 2054 891 3235 1892 naBeef cattle No. 152 144 3235 169 na
Financial characteristicsCrop receipts $ 118568 160114 592903 159630 161910Livestock receipts $ 102804 49919 195814 108059 naOther farm receipts $ 2527 na na 8606 10390Total cash receipts $ 223899 210033 788717 276295 172300Total cash costs $ 127832 157585 589370 176526 78850Farm cash income $ 96066 52448 199347 99769 93450Farm business profit d $ 33095 10450 135025 40829 naFarm debt e $ 53759 105856 640338 115748 naFarm capital e $ 1066641 940819 2981076 1211867 naRate of return to
capital e f% 4 2.5 7.2 4 na
Off farm income e $ 20270 5677 18602 18499 naWater costs % 0 7.7 8.0 na 6.9a Small water users use less than 2000 mega-litres per annum.b Horticultural farm data is from a 1994-95 survey updated to 1996-97 by Topp and Danzi (1998) and
is for the MIA and districts only.c The total area cropped in irrigation areas may exceed the area irrigated as some dryland cropping is
carried out in irrigated areas and the area irrigated may exceed the area of irrigated crops as somepasture is irrigated.
d Farm business profit is estimated as farm cash income plus build-up in trading stocks, lessdepreciation and operator and family labour.
e Average per responding farms.f Calculated as profit at full equity divided by opening farm capital. Profit at full equity is derived as
farm business profit plus rent, interest and finance lease payments less depreciation on leased items.It is the return produced by the resources used in the farm business.
Source: All data except horticultural farms from ABARE NSW Irrigation Survey 1996-97 sourcedfrom web-site ‘www.abare.gov.au’. Data for small and large water users, reported in Mues andOpalinska-Mania (1998) covers entire Murrumbidgee catchment but the majority of farmers are withinthe study area.
The average age of farmers in the Murrumbidgee catchment is 56. Dryland farmers tend to be slightlyolder (58) and irrigation farmers slightly younger (51) (ABARE 1997). The number of weeks workedoff farm by spouses is almost identical (14 weeks for irrigators, 13 weeks otherwise) but irrigationoperators work more weeks off farm (6 as opposed to 1 for dryland farmers) (ABARE 1997).Conversely, dryland farmers hire less labour (18 weeks versus 32 weeks) but use more family labour(51 weeks versus 34 weeks) (ABARE 1997).

22
FIGURE 5: DISTRIBUTION OF BROADACRE IRRIGATION FARMS BYWATER USE
0%
10%
20%
30%
40%
0-500 501-1000 1001-2000 2001-3000 >3001
Volume of water use (Ml)
Source: Mues and Opalinska-Mania (1998), p. 30.
Agricultural land use – history
The Murrumbidgee River valley was one of the earliest settled regions in inland Australia once thebarrier of the Blue Mountains had been overcome. Settlement commenced in the east with pastoralistsarriving in the Wagga Wagga area by 1832 (Buxton 1967) and along the river as far as Hay by 1839(Porteners 1993).
Pastoralists had no legal tenure initially. Tenure was upgraded for squatters as an annual licence tograze Crown Lands. In 1847 (but not made official until 1852) property rights were upgraded to 14-year leases over property sizes ranging from 20,000 to 200,000 acres. Title could be purchased overregistered runs for a minimum of one pound an acre to safeguard improvements (Buxton 1967). Theincreased security of pastoral property in conjunction with high profits from supplying meat to the goldrushes led to increased investment in fencing and other capital improvements. Leases did not includethe right to cultivate land beyond that required for home supply (Buxton 1967). The right to cultivateland became available via selection after 1860 and became operative in the Riverina in 1866 with theending of the initial 14-year leases. Land tenure again changed in 1884 requiring squatters to surrenderhalf of the leased area in return for greater security of tender on the remaining leasehold land (Buxton1967). The surrendered land was to be sold to selectors.
Steamboat transport enjoyed a short period of importance between 1860 and 1885 before Railwaytransport reached Wagga Wagga in 1880 and Hay in 1882 leading to a massive increase in crop acreage(Gammage 1986, Buxton 1967). Rabbits began to appear in the area at around the same time.Between 1880 and 1900 the combined impact of clearing for cultivation, ringbarking and destruction ofnative vegetation by plague populations of rabbits was the first critical event in changing the landscapeof the study area with the exception of irrigation. The destruction of native vegetation by rabbits,drought and overgrazing led to increasing use of exotic pasture species. Towards the west of the studyarea annual grasses typically dominate pastures with increased use of perennial species such as lucerne,clover and medic towards the east. Porteners (1993) indicates the stocking rate on the Hay plainsdeclined from 2.5 dry sheep equivalents11 (dse) in 1893-95 to 0.4-0.8 dse in 1993.
Irrigation was the second critical event to change the regional landscape. Large-scale irrigationcommenced in the study area with the opening of the main supply canal in 1912. Yanco was the firstarea allotted followed by Mirrool and Yenda.
11 A dry sheep equivalent (dse) is a measure of the carrying capacity of pastures or land. One drysheep equivalent is defined as a wether eating sufficient feed to maintain 50 kilograms live-weight.Other animals are rated in dse according to the relative amount they eat.

23
Agricultural values – grazing
Historically, Riverina grazing industries have been based on wool production with a minor exceptionduring the Victorian gold rushes. A shift towards cattle grazing across much of the region has occurredin recent times due to low wool prices, however sheep generally remain dominant (MCAP 1998).
The fertile riverine floodplains within the study area provide a valuable source of fodder for grazingenterprises. However, grazing is a major threat to wetland ecosystems and values (Buchan 1995b).Degradation of these wetlands and a reduction in natural wetland values due to grazing follows threerelated forms:1. Direct impacts of grazing animals on wetlands via consumption of wetland vegetation and
trampling leading to disturbance of sediment and resulting higher turbidity, higher watertemperature and reduced shelter among others (Robertson 1997).
2. The hydrology of wetland areas may be altered either by redesign in order to hold water over alonger period (for example by constructing a levee or dam) or to facilitate more rapid drainage andhence pasture production (see for example Briggs and Thornton 1994).
3. Many wetlands in the study area are either forested or fringed by forest. In many cases trees wereringbarked to facilitate increased fodder production from grazing (Buxton 1967).
River red gums have been logged, either selectively or cleared completely, along much of thefloodplain of the Murrumbidgee River (see the section relating to agro-forestry). Grazing, particularlyby sheep, has greatly reduced river red gum recruitment within these areas. In areas flooded lessregularly, grazing has entirely eliminated black box recruitment over most of the study area and it isonly in very wet years that recruitment occurs. Regular flooding of areas currently or previouslyforested with river red gums essentially restricts agricultural options to grazing or forestry.Construction of levees to prevent flooding is illegal on designated floodplains such as theMurrumbidgee. However, the Mirrool Creek is not a designated floodplain and construction of leveeson the upper Mirrool Creek floodplain has prevented some wetland areas from receiving floods.
Within the local government areas of Narrandera, Griffith, Carrathool, Leeton, Murrumbidgee and Haythere were 2.51 million sheep in 1996/97 according to Australian Bureau of Statistics (ABS) data (ABS1998). This was more than in 1995/96 (2.28 million) and slightly less than in 1994/95 (2.52 million).Cattle numbers rose from 198,000 in 1994/95 to 237,000 in 1995/96 before declining to 221,000 in1996/97.12 A small number of emus (3500 in 1996/97) and deer (2500 in 1996/97) are also farmed inthe region. A comparison of livestock gross margins13 is presented in Table 3.
TABLE 3: GROSS MARGINS OF MAJOR LIVESTOCK ENTERPRISESLivestock enterprise Gross margin
$/dseCattleInland Weaners 13.43Growing out steers (200-440 kg in 12 months) 20.09Yearlings 9.85Young cattle (0-2 teeth) to heavy feeder steers 13.22Young cattle 15-20 months (moderate growth) 13.25Sheep1st cross lambs 19.632nd cross lambs 18.9723 micron ewes 12.9623 micron wethers 8.80GoatsGoats (meat) 6.33Source: NSW Agriculture web site: www.agric.nsw.gov.au
12 Cattle numbers include several major feedlots that total over 60,000 cattle.13 Gross Margin is defined as the gross income from an income less the variable costs incurred in
achieving it. Variable costs are those costs that vary according to the level of production such aslabour, vaccine etc.

24
Agricultural values – dryland cropping
Traditional broadacre crop production can only take place where the existing natural resource valueshave been removed via clearing and replacement with exotic species. Despite the substitution of floraspecies some natural values for wetlands can remain, albeit severely depleted, where drainage is unableto prevent inundation. Other, less traditional, forms of cropping, such as farm forestry, and to someextent cropping of dry wetland basins, offer some potential for retaining or restoring a level of naturalresource values.
Dryland cropping is practised across much of the study area except where climate prevents, particularlyin the north west portion of the study area. The main crops grown within the study area are wheat,barley, oats and canola. Relatively regular flooding has restricted cropping on the majority of theMurrumbidgee River floodplain. However some shallow wetlands that are only flooded by very largefloods have been cleared, levelled and cultivated to provide irrigated pasture or hay production. Forexample parts of Buckingbong Depression are used to produce lucerne hay while others are used toproduce pasture from rushes.
Cropping is widespread across the upper Mirrool Creek floodplain. Wetlands in this part of the studyarea are relatively small and shallow and flooding rarely persists beyond two to three months. Smallwetlands are randomly present across the floodplain but are cultivated and cropped as part of largeragricultural units.
Dryland lakebed cropping is not generally practised within the study area. Some potential for lakebedcropping does exist, particularly in lower Mirrool Creek. However clearing of vegetation (cane grass,lignum and black box) would significantly reduce the natural resource values available from wetlandareas. In addition clearing of lakebed vegetation to facilitate cropping reduces stock shelter and pastureavailable during normal seasons.
The area of crops sown in the six main shires containing the study area has increased from 350,000hectares in 1994/95 to 540,000 hectares in 1996/97 (ABS 1998). In 1996/97 just over half the totalarea cropped was dryland (290,000 hectares), the remainder being irrigated along with 83,000 hectaresof pasture. The gross margins from the main cropping options are reported in Table 4.
TABLE 4: GROSS MARGINS OF MAIN DRYLAND CROPSCrop description Gross margin
$/hectareWheat: long fallow 143.25Wheat: short fallow 74.47Barley: short fallow 58.17Oats – grain: short fallow 35.93Oats – grazing and grain 115.40Canola: long fallow 202.57Chickpeas: after cereal 125.01Field peas: after cereal 70.26Lupins: after cereal 43.26Source: Winter crop budgets Southern Zone 1998, Elton (1998)
Agricultural values – irrigated cropping
Wetlands are subject to two main threats from irrigated agriculture:
• Broad, flat, rarely inundated wetland systems are suitable for clearing, levelling and croppingusing irrigation systems. Irrigation cropping is undertaken on areas adjacent to both theMurrumbidgee floodplain and the Mirrool Creek floodplain. In some cases, these wetlands arealso separated from the floodplain by levees. Examples of wetlands cropped include part ofBuckingbong Depression on the Murrumbidgee River floodplain and Dry Lake on the lowerMirrool Creek Floodway. Dry Lake is also separated from the Floodway by a levee.
• As wetlands are the lowest points within irrigated landscapes they often receive drainage orexcess irrigation water altering the hydrology and wetland values. Excess irrigation can also lead

25
to raised groundwater levels and irrigation salinity affecting wetlands. Finally extraction ofwater, or storage of water, for irrigation can alter wetland hydrology. Examples of wetlandsaffected by irrigation in the study area include Fivebough Swamp, Tuckerbil Swamp, Turkey Flat(drainage and/or rising groundwater levels), Coonancoocabil Lagoon (water storage andextraction) and Berangerine Swamp (excess water and drainage).
Over half a million hectares of irrigable land is contained within the study area, of whichapproximately 185,00014 hectares were irrigated at least once in 1996/97. In 1998/99, 1898 Gigalitresof water was diverted from the Murrumbidgee River to supply this area (including losses and townwater supply). The water was used to supply the water requirements of irrigated crops including rice,wheat, barley, maize, soybeans, citrus, wine grapes and vegetables. Water is also used to irrigate asignificant area of pasture (ABS 1998). The total revenue from output of the MIA and districts portionof the study area is over $400 million with processing adding a additional $350 to $400 million(personal communication Murrumbidgee Irrigation). In 1996, the MIA produced 303,000 tonnes ofrice, 118,000 tonnes of citrus and 117,000 tonnes of table and wine grapes (MCAP 1998). Table 5indicates the gross margins for a range of commonly grown irrigated and dryland crops.
TABLE 5: GROSS MARGINS OF MAIN IRRIGATED ANNUAL CROPSCrop description Gross margin
$/hectareGross margin
$/MLIrrigated winter cropsWheat - biscuit: flood irrigated – conv. sown, border check 196.09 54.47Wheat – ASW/APW/AH: flood irrigated – conv. sown, border
check203.23 56.45
Wheat – ASW/APW/AH: flood irrigated – conv. sown, landformedcontour bays
180.80 62.35
Wheat – biscuit: flood irrigated – landformed contour bays, sodsown
170.99 170.99
Wheat – biscuit: flood irrigated – beds 285.93 102.12Barley – feed: flood irrigated – conv. sown, border check -1.19 -0.41Oats – grain only: flood irrigated – conv. sown, contour bay 28.82 9.94Canola: flood irrigated, beds 372.03 128.29Lucerne – establishment (hay): flood irrigated, border check 145.44 18.18Lucerne – maintenance (hay): flood irrigated, border check 834.00 69.50Irrigated summer cropsRice – medium grain: flood irrigated, aerial sown 1006.48 71.89Rice – medium grain: flood irrigated, sod sown 1213.19 86.66Rice – long grain: flood irrigated, aerial sown 1071.00 82.38Maize – grit: rows/beds 579.31 68.15Sorghum: flood irrigated, border check 254.29 31.79Soybeans: permanent beds 400.12 50.01Soybeans: rows/beds 296.84 32.98Sunflowers: rows/beds 333.46 41.68Lucerne – establishment (hay): flood irrigated, border check 62.74 7.84Lucerne – maintenance (hay): flood irrigated, border check 538.45 53.85Source: Winter crop budgets Southern Zone Irrigated 1999, Faour and Davies (1999)
Summer crop budgets Southern Zone Irrigated 1999, Faour (1998)
Rising groundwater and increasing irrigation salinity has led to installation of tile drains acrossapproximately ten percent of the MIA to manage groundwater under permanent horticulture. Irrigationdrainage, including tile and surface drainage water is partly re-used via either Barren Box Swamp orBray’s Dam. However a relatively small amount drains into the Murrumbidgee (approximately 24gigalitres per year or about 10 percent of total drainage). The ‘MIA and Districts Community Landand Water Management Plan’ (MIADLWMPC 1998) aims to reduce the recharge of the groundwater
14 The 185,000 hectares of irrigated land (including some pasture) is the total area irrigated within thelocal government areas of Narrandera, Griffith, Leeton, Carrathool, Murrumbidgee and Hay (ABS1998) less the area irrigated within the Coleambally Irrigation Area (personal communication). Asmall area downstream of Hay remains included in the estimate but not within the study area.

26
systems and surface drainage volumes. Management of drainage systems is also being undertaken tominimise the impact of drainage on wetland systems. For example, projects are planned or under wayfor Fivebough Swamp, Turkey Flat, Coonancoocabil Lagoon and Berangerine Swamp.
The tenure attached to water via irrigation licences varies considerably. Licences can be genericallydivided between high security, ordinary security, high flow licences (including stock and domestic) andgroundwater licences. Many licences also have additional conditions attached relating to land use. Forexample, high flow licenses cannot be used to irrigate rice, orchards or vines. All high security waterlicenses are guaranteed supply in all but the most severe drought. Each season high security and otherfixed commitments are allocated before the normal security is determined. Normal security allocationsare fixed in July for each season and reviewed monthly (or following major inflows). Groundwaterlicences have no security of supply attached. High security, normal and groundwater licences are allvolumetric. High flow licences allow unlimited extraction of river water when river heights exceedcertain levels.
Within the study area, the MIA and Districts are supplied via a corporate licence held byMurrumbidgee Irrigation Limited. In addition to the corporate licence, there are 260 other licences toextract water from the river between Wagga Wagga and Hay for a total of 220 gigalitres (excludingColeambally Irrigation Area and Yanco creek) (P. Killen, DLWC pers. communication).Approximately 85 percent of the licensed volume is normal security, and approximately 25 licences arefor surplus flows. Normal security licences can currently be converted to high security licences at anexchange rate of 0.5. Water licences (required prior to water usage occurs) are currently trading forbetween $450/Ml (high security) and $400/Ml (normal security) in the study area.15 Once a waterlicense has been purchased the annual charges to use water within the study area apply, as indicated inTable 6. Within the Murrumbidgee Groundwater Management Zone (covering the geological zonefrom Narrandera to Hay) there are 319 groundwater licences held for a total extraction of 494 gigalitres(Lawson and Webb 1998).
TABLE 6: IRRIGATION WATER CHARGESCharging entity1998/99
Allocation type Allocation charge a
($/ML)Usage charge a
($/ML)River pumping licences Normal security 2.76 0.72
High security 2.90 0.72MIA and districts irrigators b
DLWC Bulk Water Charge Normal security 2.01 0.72High security 2.12 0.72
Murrumbidgee Irrigation Large area 3.13 11.09Ltd Charges Horticulture 7.88 23.37
a The allocation charge is an annual licence charge that must be paid whether the allocation is drawn ornot. The usage charge is only for that season.
b The DLWC Bulk Water Charge covers the costs of operating and maintaining the dams and river,including asset refurbishment and environmental charges. The Murrumbidgee Irrigation Ltd Chargescover that business’ costs including operation and maintenance of the water delivery system, assetrefurbishment and environmental charges.
Source: Personal communications with DLWC and Murrumbidgee Irrigation Ltd.
Agro-forestry and related production systems
Historically, forests within the study area have provided timber and fuel. River red gum forests existedin frequently flooded areas converging to black box in less frequently flooded area. Cypress (Callitrisspp.) dominated woodlands were associated with prior streams, and sandy rises. Further east in thestudy area forest resources included grey box, yellow box and bimble box. Away from the riverinecorridor the majority of woodlands have been cleared with the exception of NSW State Forestsmanaged land. Along the Murrumbidgee River floodplain significant areas of river red gum forestshave been either thinned or cleared.
15 Discussions with P. Killen, Department of Land and Water Conservation, Murrumbidgee Region,Water Access and Licensing.

27
Much of the remaining area of river red gum forest is managed with the multiple objectives of timberproduction, grazing production, and in some cases, nature conservation. Selective logging of river redgum forests has produced a younger age class within forests over much of their range. In extremecases forests are almost entirely comprised of a single age class.
Landholders plant trees for differing reasons depending on farming practices (for example drylandcropping, grazing, irrigation and floodplain). However landholders are likely to take into account thefollowing reasons when considering tree planting schemes:1. Impacts on current production systems such as shelterbelt or wind break benefits. Windbreaks are
able to reduce evaporation across areas up to ten times their height while root zone losses areconfined to their height. It is likely that irrigation cropping in particular could benefit fromwindbreaks. However use of aerial spraying practices significantly increases the cost ofwindbreaks. Shelterbelts are also important for stock, particularly where little shelter exists inmany paddocks. Alley farming, where crops or pasture is grown in spaced alleys between rows oftrees and/or shrubs, is a potential option. Alley farming can also involve the use of fodder shrubssuch as tagasaste. Alley farming is only likely to be suitable toward the east of the study areawhere higher rainfall is present or potentially as part of irrigated cropping systems.
2. Production of timber, bush foods or other products. Higher density timber produced in lowerrainfall regions is preferred for some products. High growth river red gum forests are alsoimportant on floodplain areas. At present forestry within the study area is restricted to river redgums on the flood plains and cypress pine away from wetland areas. Murrumbidgee FarmForestry has identified flooded gum (Eucalyptus grandis), spotted gum (E. maculata), sydney bluegum (E. saligna) and potentially river red gum (E. camaldulensis) as potential farm forestryoptions in irrigation areas. Outside of irrigation areas farm forestry is not currently viable exceptin floodplain areas where regular flooding facilitates river red gum recruitment and growth.
3. External impacts and non-consumptive uses. Dryland and irrigation salinity management,revegetation, wetland restoration, aesthetic values and habitat maintenance are all additionalreasons why landholders may plant trees. For example, an avenue of trees marks the entrance tomany properties. A tree-planting campaign is being conducted within the MIA and districts underthe community land and water management plan (MIADLWMPC 1988). Greening Australia isconducting a more widespread revegetation campaign across the Riverina including incentives tofence and restore remaining areas of native vegetation. ABS (1998) data indicate approximately100 km of fencing was constructed to protect remnants and riparian vegetation in 1996/97 and afurther 180 km to protect new seedlings in the six LGAs that contain the study area.16
Landholders will most likely consider a combination of the values discussed above when makingdecisions about tree planting. High priority areas for revegetation and farm forestry in the study area(ie. those with maximum cost effectiveness and/or impact) include:
• protection of remnants including roadsides and natural regeneration;
• vegetation to assist in irrigation salinity control; and,
• wind-breaks and shelter belts, particularly using local native species.
Values of trees on farms to landholders and the wider community that are not associated withagriculture can be divided into three rough groups:1. Local indigenous species have significant habitat and landscape benefits in addition to use benefits
including timber and shelter. Vegetation containing an understorey and especially remnantvegetation with an intact understorey has a higher biodiversity benefit. Important remnantvegetation species include Acacia, Geijera, Myoporum, Santalum and Capparis spp. Some treespecies in the region are:• Eucalyptus spp. such as river red gum (E. camaldulensis), black box (E. largiflorens), yellow
box (E. melliodora) and bimble box (E. populnea);• White cyprus pine (Callitris glaucophylla);• Acacia spp. such as myall or boree wattle (A. pendula) and cooba wattle (A. salicina);• Bull oak (Allocasuarina luehmannii);• Needlewoods (Hakea leucopteral/ Hakea tephrosperma);• Wilga (Geijera parviflora);
16 ABS data for Narrandera, Carrathool, Leeton, Murrumbidgee, Hay and Griffith LGAs.

28
• Sugarwood (Myoporum platycarpum);• Santalum spp. such as Sandalwood (S. lanceolatum) and Quandong (S. acuminatum); and,• Kurrajong (Brachychiton populneus subsp trilobus).Some local shrub species include grey wattle (A. brachybotrya), western black wattle (A.hakeoides), native blackthorn (Bursaria spinosa), old man saltbush (Atriplex nummularia) andbladder saltbush (A. vesicaria) (Driver and Porteners 1993).
2. Other Australian species not indigenous to the study area possess landscape benefits in addition touse benefits, but may also be potential weeds. Sugar gum (Eucalyptus cladacalyx) is a potentialdual-purpose dryland species along with specialty timber species.
3. Exotic species are likely to provide fewer landscape benefits, may become weeds and are morelikely to possess external impacts (such as soil acidification via pine needles).
Aquaculture
The ephemeral nature of wetland systems, together with the interconnection of deep, relativelypermanent wetlands with the Murrumbidgee River during floods detracts from potential wetlandaquaculture. Furthermore potential disease and pollution preclude locating fish farms on floodplains.
Floodplain wetlands are important fish nurseries and biological sources for the Murrumbidgee River.However carp are by far the dominant fish both within the river system and the irrigation canaldistribution system. Carp are currently harvested for fertiliser production and shipment to Sydney andMelbourne markets. A tender for a carp bounty of 25 c/kg has recently been awarded in NSW.
Hunting
Hunting relies on the presence of suitable exotic or native target species. High success rates and asmaller likelihood of meeting other hunters improve hunting experiences (Gan and Luzar 1993,Adomowicz, Swait, Boxall, Louviere and Williams 1997). Relatively undisturbed natural surroundingsmay also contribute to the hunting experience.
Hunting impacts on wetlands via the direct impact of hunters on the environment both physically andvia reduction in target species population. Where the target species is not indigenous, the target specieswill also impact on the wetland environment. Hunting in wetlands within the Murrumbidgee casestudy area can be divided between native waterfowl species and hunting of feral species. Waterbirdhunting is unlikely to have a direct impact on the population of declared pest species populations whereconducted by competent hunters. Competent hunters are those able to accurately identify bird speciesprior to shooting. However, the benefits enjoyed by individuals opposed to hunting will be reduced bythe presence of hunting in wetland areas. That is, a trade-off between hunting and maintenance ofnatural resource values exists for this group of individuals.
Hunting of waterfowl in NSW is currently banned with the exception of pest control purposes.Landholders may apply for an ‘occupier’s licence’ that specifies species and numbers that can becontrolled. There are approximately 3800 shooters (90% are Victorian residents) licensed to controlpests over approximately 1100 crops (almost entirely rice) each year. In 1998 92,000 ducks were shotin NSW under ‘occupiers licences’ (M. Schultz personal communication). The number of licensedhunters is similar to hunter numbers when both open season and pest control operated.
Tourism
Tourism values depend on a combination of products and markets. Eco-tourism17 in the study area canbe based on natural ecosystem attributes including bushwalking, bird watching or simply experiencinga scenic vista. An alternative, and more realistic, option in the study area is farm stay tourism based ona combination of agricultural and natural resource features. The main tourism values currently utilisedin the region make use of the Murrumbidgee River and lakes for outdoor recreation including camping,
17 Eco-tourism is distinguished from standard tourism by focusing on nature-based tourism thatinvolves education and interpretation of the natural environment and is managed to be ecologicallysustainable.

29
swimming and fishing. Other tourism values are based on wine and food. Potential tourism values areassociated with wetlands, riverine forests and appropriate aboriginal sites. Tourism currently generates$259 million of revenue per year across the Riverina region including the majority of the study area(MCAP 1998).
The mid to lower Murrumbidgee region possesses a substantial infrastructure base for tourismdevelopment. Accommodation is available in towns across the study area including Wagga Wagga,Narrandera, Leeton, Griffith, Darlington Point and Hay. While farm stay accommodation is notcurrently widespread, many farms within the region possess suitable amenities and hence the potentialfor a rapid growth in farm stays. However, a major handicap for the region is the large distance fromkey markets (Sydney and Melbourne) and the relatively undeveloped eco-tourism market within theregion. Cocopara National Park and Narrandera Nature Reserve together with numerous publicreserves along the Murrumbidgee River provide the main out-door recreational opportunities. Privatelyowned land with similar features could add to this resource.
Tourism development within the region could be targeted towards a number of aspects of the potentialmarket. The potential market is limited by product inconsistency (the wetlands are largely ephemeral)and distance to target markets. However, the complementary opportunities of the permanentMurrumbidgee River does provide a fall back option in times of drought. A number of aspects of thetourism/eco-tourism market could be accessed by the region including:
• Development of a high quality, consistent product for relatively small groups. Such a product islikely to be attractive as a stop off on a larger eco-tourism tour to western NSW.
• Development of low cost, lower input, farm stay accommodation which would augment currentfarm income on an opportunistic basis. Farm stay tourism is not as dependent on consistentproduct or supplying a regular cash flow. The basic infrastructure for such a market already existsin the study area with a large number of rarely used shearers quarters. Some farms in the area arealready receiving income from farm stay or are considering farm stay options.
• Scope for development of self guided eco-tourist trails in the region. Trails could cover bothwetland vegetation and dryland vegetation in state-forests and Cocopara National Park in the studyarea.
Tourism based income generation is limited by maximum potential market size and competition fromalternative eco-tourism providers. Use of wetlands either as a farm stay tourist attraction or a basis forbroader promotion could increase the incentive for improved wetland management within the region.
Other use values
Research is a current (but limited) use of wetland areas. Research is likely to increasethe non-use values of wetlands as more information about their functions andecosystems becomes available. Appropriate research is likely to contribute to wetlandconservation indirectly via better management practices.
Other potential values
Existing wetland habitats have the potential to provide for resource extraction such as native faunaharvesting or research while modified wetlands may provide for specialty products.
Sustainable harvesting and/or farming of native fauna has been widely discussed within Australia (seefor example Wilson 1995, 1998, Senate Rural and Regional Affairs and Transport ReferencesCommittee 1998). Wilson describes two forms of commercial production, captive breeding of livespecimens and ranching of wild specimens for production of captive juveniles. A third form ofproduction is specialised harvesting of game species (adult waterfowl for example) for restaurants.Ranching and/or game meat production could encourage landholders to protect and manage suitablehabitat in order to produce a viable product and to assist in off reserve conservation of species.
The diverse range of bird and reptile species in the Murrumbidgee study area provides potential forranching of native fauna, particularly of wetland birds. Providing property owners with appropriate
30
property rights, safeguards and creating a market, may encourage conservation oriented managementpractices. Wilson (1995, 1998) reports indicative domestic and world prices but no indication is givenof net returns to landholders. However, a positive return on fauna could encourage wetlandconservation. The market for these species is likely to be relatively small and is not well developed.
Production of larger native mammals, in particular kangaroos, for production of captive juveniles isless likely to succeed. Production of kangaroos for meat and skin products is a potential future optionin the study area. Sattler (1994) indicates kangaroo ranching requires a return of at least $10 perkangaroo to be a viable substitute for sheep production. The Senate Rural and Regional Affairs andTransport References Committee (1998) indicates that at present, and for the foreseeable futurekangaroo ranching is not a viable alternative enterprise.
Production of emu and ostrich meat in Australia is undertaken on a commercial basis. Commerciallyviable production is usually undertaken in a relatively intensive manner rather than via ranching.While intensive emu production is possible in the Murrumbidgee, only production via ranching islikely to deliver both use and non-use values from wetlands via sale of meat and retention of habitat.
4 Land management and wetland interactions
Grazing and irrigation development within the catchment and study area have dramatically altered theoriginal self-adjusting ecological balance in wetlands in the mid to lower Murrumbidgee. Landmanagement interactions have altered the flora of wetlands and surrounding areas. Irrigation hasaltered the groundwater balance in parts of the study areas leading to increasing irrigation salinity andmodified hydrology. Widespread adoption of alternative land management practices has the potentialto alter regional ecosystems and the values these generate. In this section, the relationships betweenalternative land management practices and the values generated by wetlands are explored. Someconjecture is involved in attempting to explore potentially relevant management practices. Therelationships discussed below will be investigated in greater depth in the next phase of the study.
4.1 Surface water management
River regulation and irrigated agriculture have directly or indirectly altered the hydrological balance ofthe majority of wetlands within the study area. Recapping the major points, development of majordams on the Murrumbidgee and Tumut Rivers has reduced the incidence of small to moderate floodson the Murrumbidgee River floodplain. Construction of weirs to divert irrigation water re-regulate hasstabilised water levels in the Murrumbidgee River and resulted in riverine wetlands with a permanentwater regime. Current irrigated land management practices have led to rising groundwater andirrigation salinity in other wetlands as well as altered flood regimes in the lower Mirrool Creekfloodway. The hydrology of the remaining wetlands within the study area is relatively unchanged.However, the altered mix of vegetation due to grazing and cropping has imposed some changes toflooding and water quality regimes.
Reduced flooding of floodplain wetlands
The Murrumbidgee River floodplain wetlands were historically inundated in spring following the snowmelting in the Australian Alps. Construction of Burrinjuck and Blowering dams has reduced theincidence of minor to moderate floods. These dams are not large enough to mitigate major floodevents. An environmental contingency allowance of 25 Gigalitres (in 1998) is maintained inBurrinjuck Dam. River management rules are currently being redesigned to improve environmentalmanagement. For example, in 1998 a minor flood event was allowed to move through Burrinjuck Damand down the Murrumbidgee.
More flexible management of environmental flow contingencies or restriction on when water can beharvested from the river could improve wetland conditions. In particular increasing flows from lateautumn to early spring are likely to improve environmental conditions. However, maintenance of alarge-scale irrigation system precludes a return to near similar hydrological conditions. The impacts ofirrigation on wetlands are not uniformly bad. Some large floodplain wetlands that are used to storewinter flows for irrigation that are gradually drawn down over summer are maintained in a relatively

31
natural condition (for example Yarradda Lagoon). Natural conditions are not possible for smallwetlands that are rapidly filled and drawn down.
Progress to improve management of riverine wetland areas is being made. In some cases, regulatorsare being constructed to allow permanently flooded wetland areas to be dried out and restored. In othercases, landholders are being encouraged to pump water directly from the river rather than frombillabong wetlands. The relatively rapid water level changes in these systems are then removedallowing more natural ecosystems to re-establish.
Other irrigation impacts
Irrigation essentially displaces water through time and space. Where irrigation water is applied inexcess of the balance between transpiration and evaporation, the excess either adds to groundwaterrecharge or leaves the irrigated area as surface flows. The impacts of groundwater rise are discussed inthe next section. Excess drainage water has historically either drained into or been collected bywetlands (such as Barren Box Swamp). The water collected is then reused in other areas.
An increased awareness of the importance and values of wetlands has resulted in improvedhydrological management of some individual wetlands. Management of Fivebough Swamp andwetlands in the lower Mirrool Creek floodway is now actively maintaining a more natural waterregime. Other wetland sites within the irrigation area are also receiving increased attention. Forexample the mid Mirrool Creek revegetation project undertaken by the Lower MurrumbidgeeCatchment Landcare Network.
4.2 Groundwater impacts and management
Additional recharge has caused groundwater levels to rise in many irrigation areas. Water tables arewithin two metres of the soil surface (approximately the capillary zone) over more than 70 percent ofthe MIA (MIADLWMPC 1998). Raised groundwater levels have two main impacts on wetlandecosystems: increased soil and water salt levels; and, altered hydrology.
Soil salinity impacts
Irrigation in excess of crop requirements leads to recharge of groundwater systems. Where theincreased recharge, in combination with rainfall recharge, exceeds the assimilative capacity ofgroundwater systems (via extraction and outflows) groundwater levels rise. Once groundwater levelsrise within the soil, capillary action and evaporation lead to a concentration of salts in the upper soilprofile – commonly termed soil salinisation. Over 12 percent of total irrigation water is estimated toseep into groundwater (MIADLWMPC 1998).
This process can be exacerbated where previously immobile salts are dissolved by the risinggroundwater and concentrated in the upper soil horizon. Run-off and drainage water can transportthese increased salt levels which may be concentrated in wetlands compounding the saline impacts.Hart, Bailey, Edwards, Hortle, James, McMahon, Merideth and Swadling (1991) and Halse (1987)indicate the degrading impact of increasing salinity on waterbird habitat and food chains.
Hydrological impacts
Raised groundwater levels also alter wetland vegetation during both wet and dry phases. Wetlands canbecome groundwater lenses where raised groundwater is sufficiently high. These lenses may lie abovewetland bases for much of the year. Hence, ephemeral wetlands become semi-permanent and semi-permanent wetlands become permanent. As a result of this habitat shift, some plants and animals maybecome eliminated. In many irrigation areas black box trees associated with ephemeral wetlanddepressions have died as a result of waterlogging due to raised water tables and cumbungi hasestablished. Food chains within wetlands are altered, culminating in visible impacts on waterbirds andother fauna.

32
The changes in vegetation and fauna, especially waterbirds, change the private and social valuesassociated with wetland systems. Large areas of dead and dying vegetation, especially trees, reduceprivate and social values of wetlands. Altered hydrological conditions and food chains alter waterbirdbreeding. In particular increased inundation reduces waterbird breeding (see for example Crome 1986,1988, Maher 1984).
Management
A main objective of the MIA and Districts Community Land and Water Management Plan is ‘tominimise groundwater impacts from the irrigation areas’ (MIADLWMP 1998, p. 112). The planconcluded that the associated soil salinity targets could not be economically met (p. 152). Soil salinityis projected to affect 22 percent of the landscape in the MIA and Districts by 2028 (MIADLWMPC1998). The economic assessment conducted within the plan did not incorporate environmental costsand benefits of alternative options. The areas affected by salinity are expected to be concentrated inlow-lying areas in or adjacent to wetlands. Hence the environmental costs to wetlands are expected tobe significant.
The Land and Water Management Plan suggests a number of options to reduce major seepage sources:
• A leak detection and increased refurbishment program to reduce seepage from 2,500 kilometresof unlined earthen channels and canals. Use of trees and shrubs to reduce the effects of channelseepage.
• Reduction in groundwater recharge due to over-watering by education, development ofincentives and adoption of best management practices, development of property managementplans and increased automation and scheduling.
• Adoption of specific rice crop management strategies to reduce seepage from rice crops includingrestricting soil types that rice can be grown on.
• Offset seepage by: retaining native vegetation; increasing deep rooted and/or perennial pastures;identify recharge areas and plant with deep rooted perennials; use of deep bore pumps forirrigation water; grow sod-seeded winter cereals following rice to use remaining soil moisture;and, promote saltbush as a shrub component of windbreaks.
Adoption of these measures alone will not be sufficient to halt the increase in soil salinity. Additionalmeasures would be required to protect and rehabilitate wetland areas subject to rising water tables as aresult of irrigation.
4.3 Rehabilitation of wetland habitat
Wetland rehabilitation requires restitution of an appropriate hydrological regime (wetting and dryingcycle) in wetlands in conjunction with appropriate vegetation management. The hydrology of severalwetland systems in the study area is being restored to a more natural pattern. Management of waterreleases into the lower Mirrool Creek floodway emphasises the importance of maintaining a naturalwetting and drying regime. Drainage channels around Five Bough Swamp have been integrated toreduce the hydrological impact of irrigation. Drainage into, and pumping irrigation water from, severalMurrumbidgee floodplain wetlands will also be prevented (Streat 1998).
Rehabilitation of wetlands elsewhere in Australia has led to relatively rapid generation of naturalwetland values (see for example White 1995). The long-term impact of increasing soil salinity due toraised water tables (from irrigation) on the viability of wetland systems within irrigation areas isunknown. Hence the viability (and value) of restoring wetlands within irrigation systems without firstresolving the likely future groundwater management and impacts is dubious. Restoration ofMurrumbidgee River floodplain wetlands may include red gum regeneration. Since mature red gumwetlands require in excess of 200 years to grow, the generation of complete arrays of natural wetlandvalues cannot be achieved within a shorter time period for this wetland type. A differing set of wetlandvalues is generated in the interim that may be sufficient for wetland restoration to be viable.

33
4.4 Vegetation management strategies
Vegetation management strategies are crucial to maintaining both private and social wetland values.However, appropriate management strategies to maximise private values may differ significantly fromstrategies designed to maximise social values. For example, management of river red gum wetlands tomaximise returns from timber production and grazing employs a relatively uniform age structure andgenerally a relatively constant stocking rate. By contrast management strategies designed to maximisenatural resources values need a diverse red gum age structure, maintenance of shrub layers and riparianvegetation. In addition, vegetation management strategies differ significantly between river red gumwetlands, irrigation area wetlands and other wetlands. For example in the lower Mirrool Creek grazingmanagement is important to maintaining suitable fodder species in addition to providing suitablehabitat for native fauna including nesting waterbirds.
Red gum and other Murrumbidgee floodplain wetlands
Multiple objective management of river red gum forests aims to supply timber, fuel, grazing and natureconservation (that is, both private and social values). Briggs and Thornton (1995) suggest fiveguidelines for managing river red gums for waterbird nesting:• Don’t drown by continuous flooding;• Don’t remove river red gums in which waterbirds nest - thses can be marked following nesting to
prevent removal in the future;• Don’t clear forest or woodland behind or adjacent to nest trees – these provide a buffer area;• Retain some short squat trees near current nest trees and adjacent to open water, as they mature
these will replace current river red gums as they die; and,• Retain some young river red gums near current nest sites and adjacent to open water – they will
become good nest trees in the future.Nature conservation values are served by encouraging a diverse red gum age structure giving particularconsideration to maintaining mature red gums. Continued provision of timber from river red gumsrequires recruitment. Heavy grazing damages young trees and dramatically slows growth. Cattle grazemore selectively than sheep and leave a less uniform vegetation structure. Grazing is also often used toreduce fire risk in red gum wetland and surrounds. Management for a single goal, for example grazing,severely reduces or removes forestry and nature conservation values. Since red gum wetlands requirerelatively frequent flooding for recruitment and growth, management strategies that do not inhibitwater movement into and through wetland areas are appropriate.
Irrigation area wetlands
The main threat to irrigation area wetlands is from rising groundwater levels and surface water inflows.Without appropriate management of groundwater recharge and surface water drainage these sitesvegetation management will be ineffective. Grazing and physical management activities need to bestructured to maintain indigenous tree and shrub species such as black box, bull oak and grey box.
Other wetlands
The remaining wetlands within the study area are subject to minimal hydrological change (eithersurface or groundwater) but dramatically altered vegetation management. These wetlands areephemeral and may fill as rarely as 1 in 10 to 15 years but may be flooded much more frequently inpart. Wetlands have been cleared and cropped in some cases. In most cases wetland vegetation hasbeen removed via overgrazing or clearing for grazing. The main management objective to maximiseboth grazing and wetland values is to maintain appropriate vegetation cover such that when refillingoccurs, bird breeding events are maintained.
4.5 Management and agricultural values
The appearance of an agricultural landscape provides private and social values different from the set ofvalues provided by a nature conservation landscape. Agricultural land management is the key linkagebetween the provision of private and social values from the landscape. Alternative agricultural

34
management strategies alter the appearance of the landscape altering both the mix and the quantity ofprivate and social values drawn from the landscape. Within the study area three general managementstrategies that affect the mix of private and social values drawn from wetlands can be identified,namely: irrigation; forestry; and, grazing.
Irrigation completely transforms the array of values provided by the agricultural landscape. Existingvegetation is removed and replaced with exotic species designed to increase the private values drawnfrom agricultural land. Where irrigation takes place in or around wetland areas the social (and private)values associated with natural landscapes are likely to diminish. However the landscape created byirrigation will provide differing social values such as those provided by the sight of fruit laden trees orripening crops.
Use of wetland vegetation to provide private values from timber sales also alters the social valuesderived from wetlands. The mix of private and social values is altered in a more subtle way than viairrigation. Selective removal of trees may not visibly alter the agricultural landscape and hence anyprivate and social landscape values based on perceived tree density are unaffected. Maximisation ofprivate forestry values requires removal of mature river red gums that are the key trees for mammal andwaterbird habitat and hence nature conservation values.
Grazing also alters the mix of private and social values able to be drawn from wetlands. Use ofwetlands for grazing purposes provides private values via livestock sales. Grazing of wetlands mayalso change private and social values by reducing fire risk. Grazing of wetlands essentiallyincorporates wetlands into the agricultural landscape rather than providing a separate wetlandlandscape. Many wetland species rely on wetland and/or buffer or fringe vegetation for shelter andhabitat. Many areas in the study area have been significantly degraded via overgrazing, hence reducingprivate values associated with production of livestock. The overall and historical impact of grazing onwetland areas is degradation of the social values associated with nature conservation. Maintenance ofthese social values from wetlands requires maintenance of appropriate wetland vegetation for waterbirdbreeding events and fauna habitat. For example overgrazing of lignum reduces the shelter required bywaterbirds for breeding to take place.
4.6 Fencing as a management tool
Fencing facilitates adoption of specific, alternative management strategies by separating land intoseparate management units. Continuous stock grazing prevents vegetation recruitment and graduallydestroys wetland and fringing vegetation and remnant native vegetation. Stock (particularly cattle)compact and destroy soil structure, increase turbidity and nutrients in wetlands. Stock grazing altersplant populations in and around wetlands. In many cases the private values from grazing wetlands andremnant vegetation are relatively low compared to non-wetland areas. Conversely the private costs offencing are high. The major benefits from fencing are mainly in terms of biodiversity and wetlandvalues that may be either private or social. The social benefits of fencing may be enhanced by theinclusion of riparian and remnant vegetation within wetland areas. Additional vegetation preserved byfencing increases the range of native flora and fauna species present. Benefits from fencing aredependent on the presence of a viable seed bank.
Wetland grazing strategies
Grazing in some wetland types, parts or at certain times of the year may be beneficial to private valuesand in some cases social values as well. Low intensity grazing of wetland basins, once completely dry,may not significantly alter waterbird communities or wetland characteristics when refilled. Grazingstrategies can be used to help maintain wetland values associated with shallow open water or agenerally more open landscape where fringing vegetation is interspersed with areas of grass orshrubland increasing total benefits of wetlands.
Where stock grazing causes some damage to wetland areas, the net benefit to society may still bepositive. Specifically grazing should be undertaken where the private values resulting from increasedproduction of livestock outweigh the grazing costs to private and social values. Opportunities exist forcareful grazing management to minimise damage to natural resource values and therefore costs toprivate and social values. Potential strategies include:

35
• Only graze when wetlands are dry to avoid physical damage such as trampling and formation ofholes by cattle;
• Only graze once waterbird breeding events are complete; and,
• Do not overgraze but rather aim to maintain natural vegetation organic matter.Unfortunately little is known about the complex interrelationships between grazing and wetlandsbeyond the obvious detrimental impacts of intensive grazing practices (see for example Roberston1997, 1998). Long term grazing trials are recommended to gain more information on the impact oflivestock on different wetland types.
4.7 Property right structures as management levers
Many of the threats to wetlands in the Murrumbidgee region arise as a result of external factors. Thatis, the threats to wetlands largely arise as a result of management decisions made by individuals otherthan wetland owners. For example decisions made by irrigation landholders have resulted in a raisedgroundwater table and the resulting damage to wetlands. When making decisions about irrigation,these landholders, in general, do not take into account the impact on the groundwater table.18 That is,the costs of the water are not fully reflected by the prices charged. Likewise decisions to store waterfor irrigation alter the private and social values available from Murrumbidgee floodplain wetlands.
In these cases the cost of a decision is imposed beyond the borders of the decision-maker. In somecases mechanisms can be developed that provide for the costs of some external decisions to beincorporated within land management decisions. For example decision-makers could be taxedaccording to assessed seepage to the water table. Opportunities for alternative property right structuresthat encourage incorporation of external costs into decision-making structures will be investigatedduring the course of the study.
4.8 Hunting interactions
Hunters search for hunting environments such as wetlands. The search for wetlands reveals a demandfor wetland provision as discussed in Section 3.3. That is, hunters are willing to pay for provision of ahunting environment. Willingness to pay for a hunting environment can take a variety of formsincluding:
• Cash payments from individual hunters for wetland access;
• Cash payments from groups of hunters for limited exclusive access;
• Exclusive rental arrangements incorporating exclusive hunting rights; or,
• Rights swaps such as labour-hunting swaps. Under this type of arrangement hunting groupsreceive exclusive hunting rights in return for wetland management /maintenance actions (forexample weed control and revegetation).
Willingness to pay includes travelling expenses incurred in reaching the hunting site. The demand fora hunting environment can extend beyond wetlands where suitable species are available (for exampleferal pigs or goats). Biodiversity and natural resource costs of hunting are generally limited by lawsrestricting bag size and species hunted. Society can also impose other restrictions such as managementplan requirements in exchange for hunting rights.
Hunters directly alter their hunting environment via physical impacts including killing waterbirds,trampling vegetation and hide construction. Hunting also focuses on wetlands that are not necessarilyimportant for breeding and hence may not be beneficial to waterbird conservation as a whole. Wherethe benefits of hunting (willingness to pay for a hunting environment) exceeds these social costs (tonatural resource values such as biodiversity and private values of those opposed to hunting), huntingprovides a net benefit to society. A portion of the net benefit may be internalised by property rightowners extracting willingness to pay for hunting rights.
Where exotic species are hunted the benefit or cost to society depends on:
18 Rice growers must take into consideration the total water application as applications in excess ofguidelines may result in a reduced allocation the following season.
36
• The specific exotic species being hunted (goats are more destructive than deer);
• The stocking rate;
• The hunting environment (for example restored wetland, regenerating rangeland or as a pestcontrol measure); and,
• Whether more cost effective means of control are available and the benefits exceed the benefitsresulting from hunting.
Less fragile environments and areas with lower biodiversity values (eg restored wetlands andregenerating rangeland) are more likely to provide a net benefit from hunting.
4.9 Tourism interactions
Tourism, like hunting, facilitates provision of social benefits with a private good. Tourism serviceprovision allows private benefits to be drawn from wetland areas. Farm stay tourism providesincentives for pro-wetland management in conjunction with generation of agricultural values. Tourbased tourism generates private values from high value sites such as relatively pristine wetlands andpoints of aboriginal cultural interest. Private values drawn from such wetlands are likely to becorrespondingly higher.
Generation of private values from wetlands via tourism may impose additional private or social costs.Pro-wetland management within agricultural production systems may impose additional costs onfarmers (for example via weed control) or indirect costs (for example via management constraints).Construction of access to wetlands may increase the risk of degradation and reduce social valuesthrough ‘overuse’ by tourists such as trampling and disturbance of breeding sites.
5 Discussion and conclusions
Human influence has significantly altered wetlands within the mid to lower Murrumbidgee. Humaninfluence has been both direct (via grazing and land clearance) and indirect (via hydrological changes).Human influence has been both foreseen (for example increased pasture due to clearing) andunforeseen (rising groundwater levels due to irrigation). Some interactions can take many years toreach a new equilibrium (groundwater systems) while others remain permanently in a state of flux(ephemeral wetland systems). In addition human influences continue to change over time asmanagement strategies and priorities change.
The wetlands of the mid to lower Murrumbidgee generate values enjoyed by individual wetlandlandholders and the wider community. Individual landholders manage their wetlands to maximise theirprivate values. Generation of private values is via income raising from grazing, forestry and in somecases cropping and eco-tourism while non-monetary values arise from recreation and landscapebenefits (see for example Whitten and Bennett 1998b). The generation of private values from wetlandsdepends on the existence of property rights and cost effective capture of wetland benefits. Socialvalues are generated where capture is not cost effective or property rights do not exist. For example,wetland owners are able capture benefits from grazing but not hunting in NSW. In some cases, socialvalues can be generated or maintained by producing private values (for example by management foreco-tourism).
The main threat to wetland natural resource values, primarily social values, differs significantlybetween Murrumbidgee River floodplain wetlands, irrigation area wetlands and other wetlands withinthe study area. The most important threat to Murrumbidgee River floodplain wetlands is alteredhydrology. The most important threat to wetlands within irrigation areas is due to raised groundwaterlevels, surface water drainage and the resulting soil salinity and changes to hydrology. Overgrazingand clearing for improved pasture or cropping are the main threats to the remaining wetland areas.
In this paper, the nature of the private and social values arising from wetland areas on theMurrumbidgee River floodplain between Wagga Wagga and Hay including the MIA and MirroolCreek have been identified. Decisions about wetland management are based on the nature of thebenefits and costs (both monetary and non-monetary) landholders receive from their wetlands. In Part4 of this paper the impact of decisions made by wetland landholders on the social values generated by
37
wetlands was explored. Some management strategies generate higher levels of social values inconjunction with private values (such as farm stay tourism using wetland attractions). The impacts ofalternative management strategies may be reduced with little or no cost to total private values (forexample better forest or grazing management). In addition, management actions distant from wetlandsites can also provide significant private and/or social benefits (for example hydrological managementof floods). In some cases, the social benefits may be sufficiently large to provide incentives tolandholders to alter management to increase social benefits and for society to remain better off.
The next stage of the study within the Murrumbidgee region is the quantification of effects arising fromchanges in management both within the region and with external effects on wetlands within the region.The management interactions identified in Part 4 of this paper will then be quantified in terms of theirlikely impacts on private and social values arising from wetlands within the study area. Specificallythe costs and benefits of changes in management affecting wetlands will be examined. Analysis will beconcentrated on the Murrumbidgee floodplain wetlands and, to a lesser degree, irrigation areawetlands. Future investigations will be concentrated on opportunities and incentive structures thatincrease the total values arising from wetlands at minimum cost to private wetland owners andmanagers and the community as a whole so improving the net well-being.

38
References
ABARE (1997) NSW Irrigation survey 1996-97, www.abare.gov.au, ABARE, Canberra.
Adomowicz, W., Swait, J., Boxall, P., Louviere, J. and Williams, M. (1997) ‘Perceptions versusobjective measures of environmental quality in revealed and stated preference models of environmentalvaluation’, Journal of Environmental Economics and Management, 32, pp. 65-84.
Australian Bureau of Statistics (1998) AgStats on CD Rom, ABS, Canberra.
Bannock, G., Baxter, R.E. and Davis, E. (1987) The Penguin Dictionary of Economics (4th Edn.),Penguin Books, London.
Beckman, R. (1988) ‘Dry swamps and duck-breeding’, Ecos, Vol. 55 (Autumn), pp. 28-30.
Bennett, J., Blamey, R. and Morrison, M. (1997) Valuing damage to South Australian wetlands usingthe contingent valuation method, Occasional Paper No. 13/97, National Dryland Salinity R,D & EProgram, Land and Water Resources Research and Development Corporation, Canberra.
Bennett, J.W. (1998) ‘Incentives for the protection of wetlands on private land’, Paper presented to theNSW Wetlands Action Group, 8 December 1998.
Bennison, G. and Suter, P. (1990) ‘Macroinvertebrates’, in Mackay, N. and Eastburn, D. (Eds), TheMurray, Murray Darling Basin Commission, Canberra.
Benson, J. (1988) ‘Conservation of Flora in Western New South Wales’, National Parks Journal, Vol.32(3), pp. 16-22.
Briggs, S.V. (1990) ‘Waterbirds’, in Mackay, N. and Eastburn, D. (Eds), The Murray, Murray DarlingBasin Commission, Canberra.
Briggs, S.V. and Lawler, W.G. (1991) ‘Management of Murray-Darling wetlands for waterbirds’, inDendy, T. and Coombe, M. (Eds.), Conservation in Management of the River Murray System – MakingConservation Count, Third Fenner Conference on the Environment, South Australian Department ofEnvironment and Planning for Australian Academy of Science, Adelaide.
Briggs, S.V., Hodgson, P.F. and Ewin, P. (1994) ‘Changes in populations of waterbirds on a wetlandfollowing water storage’, Wetlands (Australia), Vol. 13, pp. 36-48.
Briggs, S.V. and Thornton, S.A. (1995) ‘Management of River Red Gums for Waterbird Nesting’,Corella, Vol 19(4), pp. 132-138.
Briggs, S.V., Thornton, S.A. and Lawler, W.G. (1997) ‘Relationships Between Hydrological Control ofRiver Red Gum Wetlands and Waterbird Breeding’, Emu, Vol. 97, pp. 31-42.
Brown, P. (1994) ‘The Murrumbidgee River fishery, A historical perspective’, in Roberts, J. andOliver, R. (Eds.), The Murrumbidgee past and present, CSIRO Division of Water Resources, Griffith.
Buchan, A. (1995a) State of the Rivers Report – Murrumbidgee Catchment 1994-1995 Volume 1,Department of Land and Water Conservation, Wagga Wagga.
Buchan, A. (1995b) State of the Rivers Report – Murrumbidgee Catchment 1994-1995 Volume 2,Department of Land and Water Conservation, Wagga Wagga.
Buxton, G.L. (1967) The Riverina 1861-1891, An Australian Regional Study, Melbourne UniversityPress, Melbourne.
Cadwallader, P. and Lawrence, B. (1990) ‘Fish’, in Mackay, N. and Eastburn, D. (Eds), The Murray,Murray Darling Basin Commission, Canberra.
Clarke, K. (1988) ‘River Red Gum Forests’, National Parks Journal, Vol. 32(4), pp. 29-31.
Close, A. (1990) ‘The impact of man on the natural flow regime’ in Mackay, N. and Eastburn, D.(Eds), The Murray, Murray Darling Basin Commission, Canberra.
Corps of Engineers, Department of the Army, New England Division (1976) Natural Valley StorageProject Design Memorandum No. 2, Waltham, MA: New England Division of Corps of Engineers.
Crabb, P. (1997) Murray-Darling Basin Resources, The Murray Darling Basin Commission, Canberra.

39
Crome, F.J.H. (1986) ‘Australian Waterfowl do not Necessarily Breed on a Rising Water Level’,Australian Wildlife Research, Vol. 13, pp. 461-80.
Crome, F.H.J. (1988) ‘To Drain or Not to Drain? – Intermittent Swamp Drainage and WaterbirdBreeding’, Emu, Vol. 88, pp. 243-248.
Department of Land and Water Conservation (1996) Murrumbidgee Valley Strategic WaterManagement Plan (Draft), DLWC Technical Report No. 95/22, DLWC, Leeton.
Department of Water Resources (1994) Lowbidgee Management Plan Stage Two: Land and WaterManagement 1992-97, DWR, Murrumbidgee Region.
Driver, M. and Porteners, M. (1993) The Use of Locally-Native Trees & Shrubs in the SouthernRiverina, Royal Botanic Gardens Sydney, Sydney.
Druce, M. and Faulks, J. (1992) A Survey of Values and Issues for the Management of the Wetlands ofthe Murrumbidgee Valley, DLWC.
Elton, K. (1998) Farm Budget Handbook 1998, Southern NSW – Winter Crops, NSW Agriculture,Yanco.
Environment Australia (1997) A Directory of Important Wetlands in Australia (2nd Edn.), EnvironmentAustralia, Canberra.
Faour, K. (1998) Farm Budget Handbook 1998, Southern NSW – Irrigated Summer Crops, NSWAgriculture, Yanco.
Faour, K. and Davies, L. (1999) Farm Budget Handbook 1999, Southern NSW – Irrigated WinterCrops, NSW Agriculture, Yanco.
Gammage, B. (1986) Narrandera Shire, Narrandera Shire Council, Narrandera.
Gan, C. and Luzar, E.J. (1993) ‘A Conjoint Analysis of Waterfowl Hunting in Louisiana’, Journal ofAgricultural and Applied Economics, Vol. 25(2), pp. 36-45.
Geddes, M. (1990) ‘Crayfish’, in Mackay, N. and Eastburn, D. (Eds), The Murray, Murray DarlingBasin Commission, Canberra.
Grose, J. and Holics, M. (1994) Natural Resources of the Murrumbidgee Irrigation Area, Tabbita andBenerembah Irrigation Districts, NSW Department of Water Resources, Parramatta.
Grose, J. and Makewita, W. (1997) Natural Resources of the Wah Wah Irrigation District, Stock andDomestic District, NSW Department of Land and Water Conservation, Sydney.
Halse, S.A. (1987) Probable Effect if Increased Salinity on the Waterbirds of Lake Toolibin, TechnicalReport No. 15, March 1987, Department of Conservation and Land Management, Western Australia.
Harris, J.H. (1995) ‘Carp: The Prospects for Control’, Water, May/June, pp. 25-28.
Hart, B.T., Bailey, P., Edwards, R., Hortle, K., James, K., McMahon, A., Merideth, C. and Swadling,K. (1990) ‘Effects of Salinity on River, Stream and Wetland Ecosystems in Victoria, Australia’, WaterResearch, Vol. 24(9), pp. 1103-1117.
Hyde, K. (Ed.) (1998), The New Rural Industries: A Handbook for Farmers and Investors, RIRDC,Canberra.
King, A.J., Robertson, A.I. and Healey, M.R. (1997) ‘Experimental manipulations of the biomass ofintroduced carp (Cyprinus carpio) in billabongs. I. Impacts on water column properties’, Marine andFreshwater Research, Vol. 48, pp. 435-43.
Lawson, S. and Webb, E. (1998) Review of Groundwater Use and Groundwater Level Behaviour in theLower Murrumbidgee Valley, Groundwater Status Report No. 5, DLWC Technical Report No. 98/05,NSW Department of Land and Water Conservation, Murrumbidgee Region, Leeton.
Lim, L. (1988) ‘The Conservation of Fauna in Western New South Wales’, National Parkes Journal,Vol. 32(4), pp. 5-10.
Mackay, N. and Eastburn, D. (Eds) (1990) The Murray, Murray Darling Basin Commission, Canberra.
Maher, M. (1984) ‘Benthic Studies of Waterfowl Breeding Habitat in South-western New SouthWales’, Australian Journal of Marine and Freshwater Research, Vol. 35. Pp. 85-96.

40
Maher, M. (1986) ‘Wetlands and waterbirds in the arid Australian inlands – some principles for theirconservation’, in Gilligan, B., Maddock, M. and McDonald, K., Proceedings from the InternationalSymposium on Wetlands, Shortlands Wetlands Centre, Newcastle.
Maher, M. (1988) ‘Wetlands and Waterbirds in the Arid Australian Inlands – Some Principles for theirConservation’, in Gilligan, B., Maddock, M. and McDonald, K. (Eds.), Proceedings of InternationalSymposium on Wetlands, 1986 Shortlands Wetlands Centre, Newcastle.
Maher, M.T. and Braithwaite, L.W. (1992) ‘Patterns of Waterbird Use in Wetlands of the Paroo, ARiver System of Inland Australia’, Rangelands Journal, Vol. 14(2), pp. 128-42.
Maher, P. (1988) ‘Threatened Avifauna of Western New South Wales’, National Parks Journal, Vol.32(4), pp. 11-16.
McLennan, W. (1998) Australia in Profile, A Regional Analysis 1996, Australian Bureau of Statistics,Canberra.
MIA and Districts Land and Water Management Plan Working Group (1998) MIA and DistrictsCommunity Land and Water Management Plan, MIADLWMPWG, Leeton.
Mills, J. (1998) Proposed Management Plan for the Wetlands Associated with the Lower MirroolCreek, Report for Lilian Parker, Environmental Services Manager, Murrumbidgee Irrigation, Griffith.
Morrison, M.D., Bennett, J.W. and Blamey, R.K. (1997) Designing Choice Modelling Surveys UsingFocus Groups: Results from the Macquarie Marshes and Gwydir wetlands case studies, ChoiceModelling Research Report No. 5, The University of New South Wales, Canberra.
Mues, C. and Opalinska-Mania, M. (1998) ‘Irrigated agriculture, A socioeconomic profile of theMurray Darling Basin’, Australian Farm Surveys Report 1998, ABARE, Canberra.
Murray-Darling Basin Ministerial Council (1995) An Audit of Water Use in the Murray-Darling Basin,MDBMC, Canberra.
Murrumbidgee Catchment Management Committee (1998) Murrumbidgee Catchment Action Plan forintegrated natural resources management, MCMC, Wagga Wagga.
Porteners, M.F. (1993) ‘The natural vegetation of the Hay Plain: Booligal-Hay and Deniliquin-Bendigo1:250 000 maps’, Cunninghamia, Vol. 3(1), pp. 1-87.
Pressey, R.L. (1988) ‘Wetlands of Western New South Wales: Characteristics, Conservation andManagement’, National Parks Journal, Vol. 32(3), pp. 23-30.
Recknagel, F., Marsh, F., Matthews, S. and Schiller, N. (1998) ‘Common Carp in Natural Wetlands:impacts and management’, in Williams, W.D. (Ed.) Wetlands in a Dry Land: Understanding forManagement, Workshop Proceedings (Albury 1997), Environment Australia, Canberra.
Roberts, J. (1998) ‘Carp: sifting through the issues’, in Williams, W.D. (Ed.) Wetlands in a Dry Land:Understanding for Management, Workshop Proceedings (Albury 1997), Environment Australia,Canberra.
Roberts, J. and Brickhill, J. (1992) The fate of wetlands on the Mirrool Creek Floodplain – Amicrocosm for South-western New South Wales?, A paper to accompany a poster presented at: MurrayDarling Floodplain Wetlands Management Workshop.
Roberts, J., Chick, A., Oswald, L. and Thompson, P. (1995) ‘Effect of Carp, Cyprinus carpio L., anExotic Benthivorous Fish, on Aquatic Plants and Water Quality in Experimental Ponds’, Marine andFreshwater Research, Vol. 46, pp. 1171-80.
Robertson, A.I. (1998) ‘The effect of livestock on wetlands’, in Williams, W.D. (Ed.) Wetlands in aDry Land: Understanding for Management, Workshop Proceedings (Albury 1997), EnvironmentAustralia, Canberra.
Robertson, A.I. (1997) ‘Land-water linkages in floodplain river systems: the influence of domesticstock’, in N.Klomp and I. Lunt (Eds), Frontiers in Ecology: Building the links, Elsevier Science Ltd,Oxford.
Robertson, A.I., Healey, M.R. and King, A.J. (1997) ‘Experimental manipulations of the biomass ofintroduced carp (Cyprinus carpio) in billabongs. II. Impacts on benthic properties and processes’,Marine and Freshwater Research, Vol. 48, pp. 445-54.

41
Samaranayaka, D., Topp, V. and McClintock, A. (1997) ‘Water Market Reforms: Impact on irrigatedbroadacre farms’, Australian Commodities, Vol. 4(4), pp. 490-502.
Sattler, P. (1994) ‘The greater conservation gain from a “new” kangaroo industry for the mulga lands:ecologically sustainable management’, in Grigg, G., Hales, P. and Lunney, D. (Eds), ConservationThrough Sustainable Use of Wildlife, Centre for Conservation Biology, The University of Queensland,Brisbane.
Senate Rural and Regional Affairs and Transport References Committee (1998) CommercialUtilisation of Australian Native Wildlife, Report of the Senate Rural and Regional Affairs andTransport References Committee, Senate Printing Unit, Canberra.
Signor, L. (1999) Assessment of the health of the Mid Mirrool Creek catchment, Report for LilianParker, Environmental Services Manager, Murrumbidgee Irrigation, Griffith.
Somerville, J. (1988) ‘Conservation of River Red Gums in NSW’, National Parks Journal, Vol. 32(3),pp. 31-33.
Streat, J. (1998) The rehabilitation of Turkey Flats and Coonancoocabil, Euwarderry, and GooragoolLagoons: Options Paper A: Exploration of available alternatives for activites to facilitate therehabilitation of a flooded area of the Turkey Flats, Eucalyptus camaldulensis, forestlands andCoonancoocabil Lagoon, Murrumbidgee Wetlands Working Group, Narranderra.
Thornton, S.A. and Briggs, S.V. (1994) ‘A Survey of Hydrological Changes to Wetlands of theMurrumbidgee River’, Wetlands (Australia), Vol. 13, pp. 1-13.
Topp, V. and Danzi, E. (1998) ‘Irrigated horticulture in the southern Murray Darling Basin’, AustralianCommodities, Vol. 5(2), pp. 221-30.
Upper South East Dryland Salinity and Flood Management Plan Steering Committee (USEDSFMPSC)(1993) Upper South East Dryland Salinity and Flood Management Plan Draft Environmental ImpactStatement - for Public Comment, Natural Resources Council of South Australia, Adelaide.
Walker, K. (1990) ‘Mussels’, in Mackay, N. and Eastburn, D. (Eds), The Murray, Murray DarlingBasin Commission, Canberra.
Water Resources Commission (?) Guidelines for flood plain development – Mirrool Creek, WaterResources Commission of NSW.
White, J. (1995) ‘Description , history and water chemistry of the recently restored WatervalleyWetlands in the southeast of South Australia’, Wetlands, Vol. 15(3), pp. 247-57.
Whitten, S.M. and Bennett, J.W. (1998a) Wetland Ecosystems and Landuse in the Upper South East ofSouth Australia, Private and Social Values of Wetlands Research Report No. 1, The University of NewSouth Wales, Canberra.
Whitten, S.M. and Bennett, J.W. (1998b) Farmer perceptions of wetlands and wetland management inthe Upper South East of South Australia, Private and Social Values of Wetlands Research Report No.2, The University of New South Wales, Canberra.
Wills, I. (1997) Economics and the Environment, A signalling and incentives approach, Allen andUnwin, St Leonards, Sydney.
Wilson, G.R. (1995) Sustainable economic use of native Australian birds and reptiles – can controlledtrade improve conservation of species?, A report to the Rural Industries Research and DevelopmentCorporation, ACiL Economics and Policy, Canberra.
Wilson, G.R. (1998) ‘Native birds and reptiles’ in, Hyde, K. (Ed.), The New Rural Industries: AHandbook for Farmers and Investors, RIRDC, Canberra.

42
Previous Research Reports in the Series
Whitten, S.M. & Bennett, J.W. (1998). Wetland Eco Systems and Landuse in the Upper South East ofSouth Australia, Private and Social Values of Wetlands Research Report No. 1, University College,The University of New South Wales, Canberra.
Whitten, S.M. & Bennett, J.W. (1998), Farmer Perceptions of Wetlands and Wetland Management inthe Upper South East of South Australia, Private and Social Values of Wetlands Research Report No.2, University College, The University of New South Wales, Canberra.
Whitten, S.M. & Bennett, J.W. (1999), Potential Upper South East Regional Wetland ManagementStrategies, Private and Social Values of Wetlands Research Report No. 3, University College, TheUniversity of New South Wales, Canberra.