private equity and real estate - eastnine abbusiness • kestutis sasnauskas founding partner, head...
TRANSCRIPT

Kestutis Sasnauskas, Partner and Head of Private Equity and Real Estate, East Capital
Private Equity and Real Estate

Private Equity

Gert Tiivas Head of Baltic Private Equity
Tallinn
• Estonian national • Chairman of Starman and Trev-2 • Previously CEO of East Capital
Explorer, Head of Growth Markets at NASDAQ OMX, and CEO of Tallinn Stock Exchange
• Bentley College, George Washington University
Julianna Sosnovska Senior Analyst
Stockholm
• Latvian national • Board member of FIA Bank • Previously at SEB • Fluent in English, Swedish,
Russian and Latvian • Stockholm University School of
Business
Kestutis Sasnauskas Founding Partner, Head of Private Equity and Real Estate
Stockholm
• Lithuanian national • Chairman of MFG and member of
several board of directors • Previously at Enskilda Securities • Fluent in Russian, Lithuanian,
English and Swedish • Stockholm School of Economics,
University of Vilnius
Margot Jacobs Senior Advisor
Stockholm
• American national • Board member of KBS, Macedonia • Previously at Charlemagne Capital
and United Financial Group • Fluent in English, Russian and
Swedish and Serbo-Croatian • Dartmouth College, George
Washington University
Hanna Loikkanen Senior Advisor
Moscow
• Finnish national • Member of several board of
directors in Russia • Previously at FIM Group in Russia
and Nordea across Eastern Europe • Fluent in English, Russian and
Finnish • Aalto University
Ekaterina Vasenina Senior Legal Counsel Moscow
• Russian national • Member of Board of Georgian
company • Previously at Interpipe Group,
Ukraine • Fluent in English and Russian • Moscow State University (Russia),
School of Law • Fordham University (USA), School
of Law 3
Lilia Kouzmina Senior Analyst
Stockholm
• Russian national • Previously within East Capital’s
public equity team, at Accenture and SITE
• Fluent in Russian, English and Swedish
• Stockholm School of Economics, Central European University
Stefano Grace Senior Legal Counsel
Tallinn
• American national • Board member of Siera Nams and
Real Estate investment vehicles • Previously General Counsel of East
Capital Explorer, Senior Associate at Sorainen, in-house Nasdaq OMX
• Fluent in English, conversational Estonian and Swedish
• University of Virginia, Florida State University
Private Equity Investment Team

4
Baltic Private Equity market on solid grounds
Supportive
investment climate
• Well-run public finances • Competitive tax regime • High level of transparency • Flexible labour market • Strong rule of law • Low political risk
Balanced economies
• Resilient economies • Quick recovery from crisis
driven by exports and domestic demand
• Highest GDP growth in EU • Increasing consumer
purchasing power • Inflation under control
Limited sources of financing
• Low competition for deals • Companies de-leveraging • Banks ready to finance only the
strongest companies and sponsors • Alternative financing limited
Opportunities

Melon Fashion Group

6
Exposure to fast growing market with vast potential through domestic market leaders with superior growth track record
The Melon Fashion Group investment case
• Exposure to the Russian consumer market
– Real disposable income growth drives consumer spending
– Fast developing but still non-saturated retail market allowing listed food retailers like X5, Magnit, Okey to grow at 30% per annum
• Exposure to attractive fast-growing retail segment
– Russian apparel market set to become one of the largest in Europe by 2017-2018
– Consolidation potential remains as top 10 retailers constitute only 12% of total market vs 49% in UK
– Russians spend more on apparel as % of income
• Exposure to one of largest domestic apparel retailers
– 2008-2014 selling space CAGR of 28%
– Focusing on regional expansion
– Supported by strong board and management team

Why we like apparel retail in Russia

8
Real disposable income growth fuels consumption
Low savings rate and consumer credit penetration contributes further to consumption growth
Source: Euromonitor
Consumption drivers in place
Growing disposable income growth boosting spending
0%
5%
10%
15%
20%
25%
30%
35%
40%
0
50 000
100 000
150 000
200 000
250 000
300 000
350 000
400 000
450 000
Annual disposable income per capita, RUB Annual disposable income growth in %
Estimated by Euromonitor

9
Despite current slowdown Russia’s EUR 40bln (2012) apparel retail market set to grow long-term on rising disposable income and high fashion spend
Growing apparel retail segment
Clothing Retail Sales 2012 (USDbn)
0102030405060708090
100
Clothing Retail Sales per Capita 2012 (USD)
0%
1%
2%
3%
4%
5%
6%
7%
0
200
400
600
800
1000
1200
Clothing retail sales per capita, USD Spending on clothes as a% of income
Source: Euromonitor

10
By some forecasts Russian apparel market set to become second largest in Europe by 2017
On a way to become largest European market…
Russian apparel retail market size vs Europe total
Germany; 79; 20%
Italy; 66; 16%
UK; 59; 15%
Russia; 55; 14%
France; 50; 12%
Rest of Europe ; 90; 23%
2012 Apparel Market Europe, EUR bn
Total size EUR 309bn
Germany; 84; 15%
Russia; 81; 15%
Italy; 69; 13%
UK; 69; 12%
France; 53; 10%
Rest of Europe ; 196; 35%
2017E Apparel Retail Europe, EURbn
Total size EUR 355bn
CAGR 8.0%
Source: Market Line. *Apparel retail includes menswear, womenswear adn childrenwear
CAGR 2.8%

11
Shift from outdoor markets to shopping centers and online retailers with retail chains and online getting market share from unorganized retail
Consolidation still ahead
Market share by top 10 retailers still low by developed markets tandards
6%
Russia 2010
12%
Russia 2013
49%
UK 2013
Market formalization under way
28% 20%
17% 12%
54% 66%
2%
5% 8%
17%
Russia2010
Russia2012
Russia2013
China2012
UK2012
Other
Online Retailers
Chains/DepartmentStoresIndependent Retailers
Outdoor Markets

12
Untapped regional demand to be unlocked as shopping malls construction penetrates the regions
Shopping mall construction to facilitate further growth
Regional Breakdown of Shopping Mall Space, 2012
Moscow 24%
St. Petersburg 14%
4% 4%
4% 3% 3%
3% 3%
2%
Other 36%
MoscowSt. PetersburgKrasnodarEkaterinburgSamaraMoscow regionNizhny NovgorodOmskKazanRostov-on-DonOther
0
100
200
300
400
500
600
700
Norway Sweden Lithuania EU-27average
Poland Germany Russia Ukraine
Shopping Mall Space per 1,000 Inhabitants (sq m)

Why Melon Fashion Group?
13

14
One of the largest store networks in Russia
All brands among top 10 by number of stores
One of the largest and fastest growing players in Russian apparel retail…
One of the largest store networks in Russia as of Aug 2014
618
606
516
384
300
250
214
179
154
128
Gloria Jeans
O'STIN
Sela
Incity
Tvoe
befree
Zarina
Love Republic
Henderson
Mango
656 stores as of Sep 30 643

15
• Store Size: 100-470 sq m
• Concept: Teenagers’ brand
• Key Values: Happiness, youth, fashion, ease, price, colour
• Awareness: 70%
• Number of Stores: 259
• Number of Cities: 119
• Geographical Presence: Russia, Ukraine, Kazakhstan, Belarus
befree
• Store Size: 90-270 sq m
• Concept: ‘Real lady’ brand
• Key Values: Dignity, quality, service
• Awareness: 71%
• Number of Stores: 215
• Number of Cities: 99
• Geographical Presence: Russia
ZARINA
• Store Size: 100-370 sq m
• Concept: Fashion and style brand
• Key Values: Life, Personality, Sensuality, Femininity
• Awareness: 53%
• Number of Stores: 179
• Number of Cities: 76
• Geographical Presence: Russia, Ukraine, Kazakhstan
LOVE REPUBLIC
…with diverse brand portfolio

16
19
• 1926-1990
• In 1926 in Leningrad, a handicraft school for girls, opened in 1880, was converted into a manufacturer of women's clothing
• 1991-2001
• In 1991, the company was privatized and bought by its own employees, resulting in 400-500 shareholders
• Focus on outsourced production and wholesale of its own ZARINA collection
• In a few years, it opens Zarina stores in St Peterberg and thus starts a retail chain
• In 1996, the first foreign investment is made by the Swedish Kellerman family, engaged in apparel retail
• 2002-2007
• In 2002, East Capital buys a stake in the company
• In 2005, Melon Fashion Group is created and a young, ambitious team is put in place
• Shift from wholesale to retail, completed in 2009
• 2008-2011
• In 2008, East Capital Explorer makes its first investments
• A the beginning of the financial crisis, MFG’s strong financial position allows it to take advantage of the situation and expand, both organically and through two acquisitions
• 2012-
• Divestment of franchise brands and decision to focus on its own brands; befree, ZARINA and LOVE REPUBLIC
• MFG continues to pursue an aggressive organic expansion across Russia, and enter new CIS markets through franchise stores
“Early Days” Privatization Wholesale to Retail Expansion Focused Growth
… long and exciting history
17
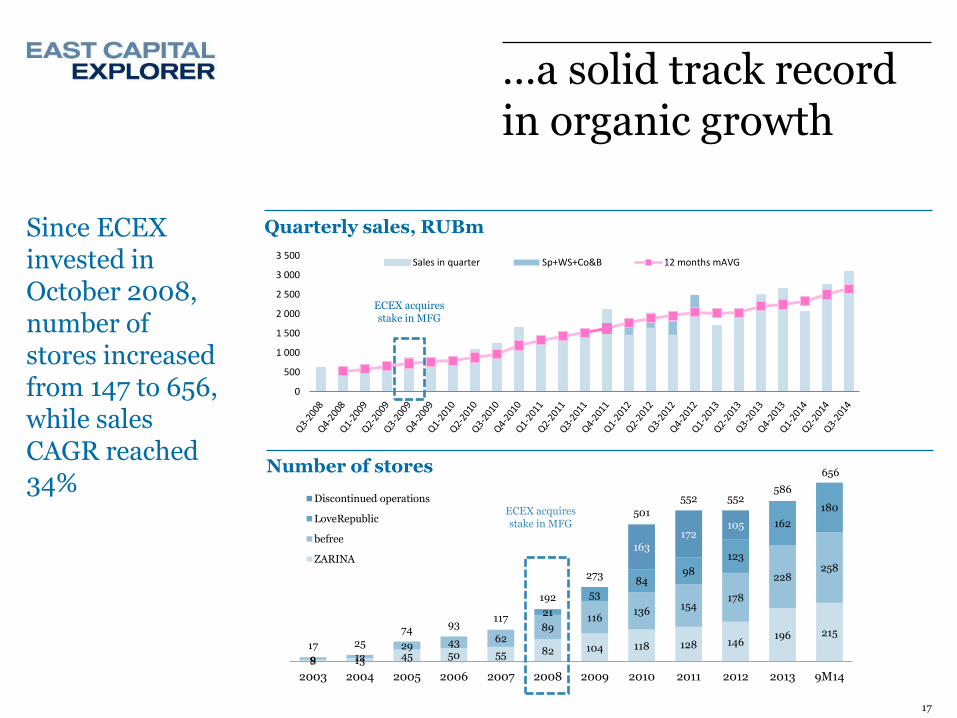
Since ECEX invested in October 2008, number of stores increased from 147 to 656, while sales CAGR reached 34%
…a solid track record in organic growth
Quarterly sales, RUBm
0
500
1 000
1 500
2 000
2 500
3 000
3 500Sales in quarter Sp+WS+Co&B 12 months mAVG
ECEX acquires stake in MFG
8 13 45 50 55 82 104 118 128 146 196 215
9 12 29 43 62
89 116
136 154
178
228 258
21
53
84 98
123
162
180
163 172
105
17 25
74 93
117
192
273
501
552 552 586
656
2003 2004 2005 2006 2007 2008 2009 2010 2011 2012 2013 9M14
Discontinued operations
LoveRepublic
befree
ZARINA
ECEX acquires stake in MFG
Number of stores

…resulting in large geographic footprint from Ukraine to Far East
Number of stores as of 9M 2014
Own Retail Stores
Franchise Stores
Moscow Region
Kazakhstan
126 5
9
Center
105 46 Siberia
110 31
Far East
8
Belarus
2
Ukraine
22
South
68 10
North-West
92 19
MFG operates 656 stores in more than 110 cities in Russia and in Ukraine, Kazakhstan and Belarus
Own Retail Stores
Franchise Stores

19
Own retail space expanded at CAGR of 27% since 2008
Regional focus dominates recent years expansion
…and continuously expanding regional reach
Added stores by region, 9M 2014
Own Retail Stores, Net of Closed Stores
11
1
7
11
6
18
7 10
20
10
19 19 21
30
15 12
1 3
16 19
MoscowRegion
South North-West Siberia Center
2011
2012
2013
9M14
CAGR 2008-14
27%
37%
20%
29%
22 229 31 694
41 735 47 377
54 943
77 235
93 490
42,6%
31,7%
13,5% 16,0%
40,6% 38,0%
0%
10%
20%
30%
40%
50%
60%
70%
80%
0
20000
40000
60000
80000
100000
2008 2009 2010 2011 2012 2013 9M2014befree ZARINA LOVE REPUBLIC Space Growth (%), yoy
Own Retail Selling Space (sq m)

20
• David Kellerman, Chairman
– Entrepreneur and shareholder in MFG
• Kestutis Sasnauskas
– CEO, East Capital partner
• Lennart Dahlgren
– Independent retail consultant, Former CEO of IKEA Russia
• Claes Heurlin
– Independent consultant with 20 years experience from fashion industry including H&M and R&B
• Christel Kinning
– Chairman of the Board of Directors of Zoundindustries International AB, Board member in Stadium, Hemtex, Reima, Hope
• Mathias Pedersen
– CFO East Capital AB
• Mikhail Urzhumtsev
– Former CEO of the group
Broad retail competence and industry experience
…supported by strong Board of Directors
Board of Directors
21
• Responsible purchasing programme launched in 2013, including:
– Updated Code of Conduct that all current suppliers and new suppliers must sign and adhere to
– Factory audits aimed at both technical and social aspects (own audit person in China and India). Target to cover Bangladesh and Vietnam by end of 2015.
– Fabric testing started 2013 and target is to reach full scale fabric testing by 2018.
– Choosing factory (not just supplier) when placing orders. To be completed for all products by end of 2018.
• Code of Conduct for MFG employees implemented in 2013
EC actively involved in initiating and monitoring company’s progress with respect to ESG issues
ESG initiatives
Sustainable sourcing approach

22
…but external environment puts pressure even on strongest players….
Massive RUB devaluation since beginning of 2014
20
25
30
35
40
45
50
55
60
65
70
Ja
n-0
3
Ju
n-0
3
No
v-0
3
Ap
r-0
4
Sep
-04
Feb
-05
Ju
l-0
5
De
c-0
5
Ma
y-0
6
Oct
-06
Ma
r-0
7
Au
g-0
7
Ja
n-0
8
Ju
n-0
8
No
v-0
8
Ap
r-0
9
Sep
-09
Feb
-10
Ju
l-10
De
c-10
Ma
y-1
1
Oct
-11
Ma
r-12
Au
g-1
2
Ja
n-1
3
Ju
n-1
3
No
v-1
3
Ap
r-14
Sep
-14
RUB USD RUB EUR

23
Real disposable income dipped to 2009 lows in 1Q14 taking a hit from accelerating inflation and FX effects
…but external environment puts pressure even on strongest players, cont.
Real disposable income growth, %
-10,0
-5,0
0,0
5,0
10,0
15,0
20,0
%
-10,0
0,0
10,0
20,0
30,0
40,0real wage growth, yoy nominal wage growth
Nominal and real wage growth, %
%

24
Nevertheless consumer confidence is not anywhere near 2009 levels indicating still relatively healthy consumer
Non-food retail sales growth slowed as weak RUB and accelerating inflation makes consumers cautious
…resulting in temporal consumer weakness
-15,0
-10,0
-5,0
0,0
5,0
10,0
15,0
20,0
25,0
%
Non-food retail sales growth, %
Consumer confidence index
-40
-35
-30
-25
-20
-15
-10
-5
0
5
Source: Rosstat

RUR million 2011 2012 2013 9M2014 Sales 5 103 7 061 8 966 7923 EBITDA 260 1 023 902 (231) Net Profit 50 687 630 (427)
Sales Growth (%) 27.9% 38.3% 27.0% 26.0% Gross Margin (%) 59.7% 60.9% 58.8% 53% EBITDA Margin (%) 5.1% 14.5% 10.1% (3%) Net Margin (%) 1.0% 9.7% 7.0% (5%)
Incl. discontinued operations
Cash Flow From Operations (92) 753 351 (270) Free Cash Flow (277) 564 (101) (392) Net Interest-bearing Debt 187 (387) (258) 395
25
Profitability plunged on RUB devaluation and high expansion cost leverage
…profitability suffered when macro weakened
MFG income statement
EBITDA by brand and space growth (RUBm)
-400
-200
0
200
400
600
800
1 000
1 200
2008 2009 2010 2011 2012 2013 9M2014
Discontinuedoperations
LOVE REPUBLIC
ZARINA
befree
space growth
42,6%
31,7%
13,5% 16,0%
40,6% 38,0%
0%
10%
20%
30%
40%
50%
60%
70%
80%
0
0
0
0
0
1
1
1
1
1
1

26
• Operations
– Renegotiation of rental agreements
– Implementation of comprehensive “store profitability” project
– Implementation of flexible working schedule
– Implementation of new remuneration structure with profitability driven KPIs
• Product
– Higher flexibility in purchasing budget planning to achieve lower reduction rate
– Assortment consolidation to decrease fashion risk
– Reinforcement of product team with new competence to drive product improvement
Internal initiatives to drive cost efficiencies and ensure product improvement
Core drivers remain in place despite short-term weakness
How to deal with market weakness?
Focus on driving internal efficiencies and tight budgeting
27
Main Risks
• Macro / political risks
– The continuing Crimea /Ukraine crisis may lead to escalation of sanctions from both sides effecting economic activity and leading to deepening geopolitical instability. In the long term, increasing political instability and geopolitical tensions may lead to increasing isolation of the country hampering economic growth and effecting growth of real disposable income and individual consumption.
– Further drop in oil price resulting in recessionary trends instigated by budgetary pressures resulting in decrease in real disposable income
• Market & Industry -specific risks
– Delays in planned shopping center openings may adversely effect MFG’s expansion plans
– Weakening RUB may further adversely impact profitability due to USD/EUR denominated sourcing costs.
– Weakening profitability may put constraints on bank borrowing and FX hedging
– Increasing competition from new entrants and current local players may lead to market share loss
• Company-specific risks
– High fashion content implies high risk in terms of company’s ability to be able to offer attractive collections at all times. Failed collections lead to higher reduction rates and decrease in profitability

28
Devaluation of ruble may raise demand for cheaper clothes by domestic producers
Competition for attractive locations may ease in the short-term
Media reports on River Island, Esprit, Seppälä closing stores in Russia
Source: Rosstat
…and not to forget about opportunities
Clothes import growth yoy, %
-40%
-20%
0%
20%
40%
60%
80%
100%
120%
140%
mar
-06
jul-
06
no
v-0
6
mar
-07
jul-
07
no
v-0
7
mar
-08
jul-
08
no
v-0
8
mar
-09
jul-
09
no
v-0
9
mar
-10
jul-
10
no
v-1
0
mar
-11
jul-
11
no
v-1
1
mar
-12
jul-
12
no
v-1
2
mar
-13
jul-
13
no
v-1
3
mar
-14
jul-
14

Baltic Real Estate - Stable cash flow and strong outlook
30
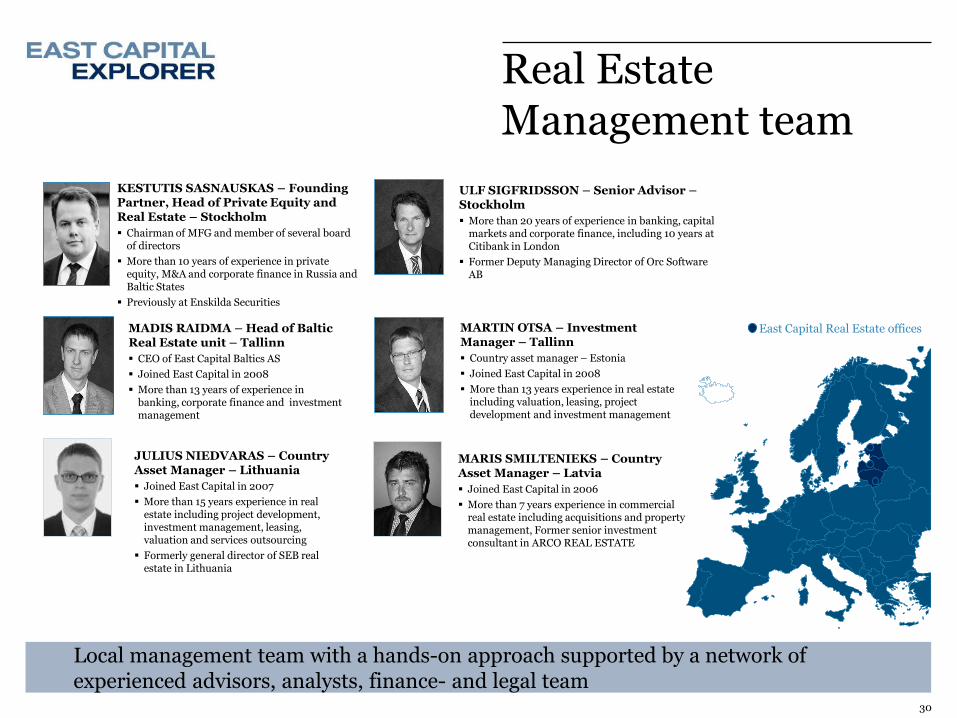
MADIS RAIDMA – Head of Baltic Real Estate unit – Tallinn
CEO of East Capital Baltics AS
Joined East Capital in 2008
More than 13 years of experience in banking, corporate finance and investment management
ULF SIGFRIDSSON – Senior Advisor – Stockholm
More than 20 years of experience in banking, capital markets and corporate finance, including 10 years at Citibank in London
Former Deputy Managing Director of Orc Software AB
MARTIN OTSA – Investment Manager – Tallinn
Country asset manager – Estonia
Joined East Capital in 2008
More than 13 years experience in real estate including valuation, leasing, project development and investment management
Real Estate Management team
Local management team with a hands-on approach supported by a network of experienced advisors, analysts, finance- and legal team
East Capital Real Estate offices
JULIUS NIEDVARAS – Country Asset Manager – Lithuania
Joined East Capital in 2007
More than 15 years experience in real estate including project development, investment management, leasing, valuation and services outsourcing
Formerly general director of SEB real estate in Lithuania
MARIS SMILTENIEKS – Country Asset Manager – Latvia
Joined East Capital in 2006
More than 7 years experience in commercial real estate including acquisitions and property management, Former senior investment consultant in ARCO REAL ESTATE
KESTUTIS SASNAUSKAS – Founding Partner, Head of Private Equity and Real Estate – Stockholm
Chairman of MFG and member of several board of directors
More than 10 years of experience in private equity, M&A and corporate finance in Russia and Baltic States
Previously at Enskilda Securities

31
Domestic consumption drives Baltic growth
Source: Colliers, Eurostat
-2%
0%
2%
4%
6%
8%
10%
12%GDP growth
Estonia
Latvia
Lithuania
EU28
-1%0%1%2%3%4%5%6%
Harmonized Consumer Price Index
Estonia
Latvia
Lithuania
EU28
0%
5%
10%
15%
20%Unemployment rate
Estonia
Latvia
Lithuania
EU28
Wage growth drives domestic consumption
Modest inflation
Unemployment still high but decreasing

32
Latvia’s GDP growth was the fastest in the EU in 2013
Q2 y-o-y growth ranged between 2.4% and 3.3% for the Baltic countries
Average growth in the Baltics 2014-2018 expected to be in line with or better than Advanced economies and the Euro zone
GDP growth in the EU in 2013
Baltics among the fastest growing EU economies
Source: Eurostat / IMF
-6,0
-5,0
-4,0
-3,0
-2,0
-1,0
0,0
1,0
2,0
3,0
4,0
La
tvia
Ro
ma
nia
Lit
hu
an
ia
Ma
lta
Lu
xe
mb
ou
rg
Un
ite
d K
ing
do
m
Po
lan
d
Sw
ed
en
Hu
ng
ary
Bu
lga
ria
Slo
va
kia
Est
on
ia
De
nm
ark
Ge
rma
ny
Bel
giu
m
Fra
nce
EU
28
Irel
an
d
Eu
ro a
rea
Net
he
rla
nd
s
Cze
ch R
epu
bli
c
Cro
ati
a
Slo
ven
ia
Sp
ain
Fin
lan
d
Po
rtu
ga
l
Ita
ly
Gre
ece
Cy
pru
s
%

33
Yields in the Baltics have a premium of 200-300 bps vs the Nordic region in all segments
Source: Newsec
Prime yields still high compared to Nordic capitals

Capital growth index
34
Nordic property segments are 20-50% higher since pre-crisis levels
Baltic property segments are just back to same level (retail & logistics) or slightly below (office)
Source: Newsec
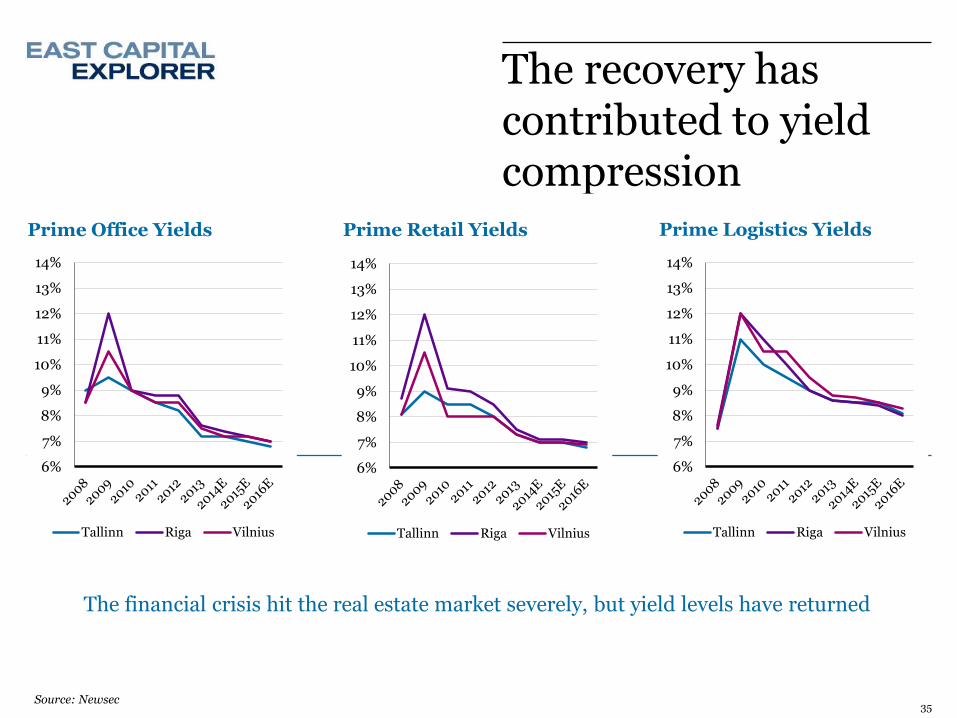
The recovery has contributed to yield compression
Source: Newsec
Prime Office Yields Prime Logistics Yields Prime Retail Yields
6%
7%
8%
9%
10%
11%
12%
13%
14%
Tallinn Riga Vilnius
6%
7%
8%
9%
10%
11%
12%
13%
14%
Tallinn Riga Vilnius
6%
7%
8%
9%
10%
11%
12%
13%
14%
Tallinn Riga Vilnius
The financial crisis hit the real estate market severely, but yield levels have returned
35

Decreasing vacancies and increasing rents provides attractive prospects
Source: Colliers, Newsec
Vacancy Offices Class A Vacancy Shopping Centers
Prime Office Rents (€ / sqm / year)
0
100
200
300
400
500
600
700
StockholmTallinnVilnius
0%
5%
10%
15%
20%
Estonia (Tallinn)
Latvia (Riga)
Lithuania(Vilnius)0%
2%
4%
6%
8%
10%
12%
Estonia (Tallinn)
Latvia (Riga)
Lithuania (Vilnius)
Rent levels still low compared to rest of Europe
36

37
Active investment market
Source: Colliers, DTZ
Asset managers, AUM in the Baltics Transaction volumes
0
50
100
150
200
250
300
Ea
st C
ap
ita
l
Eft
en
Ca
pit
al
No
rth
ern
Ho
rizo
nC
ap
ita
l (B
PT
)
Ca
pit
al
Mil
l
Lo
rds
LB
Ge
neb
a(H
om
bu
rg)
Ka
we
gro
up
EUR m
0
200
400
600
800
1000
1200
2006 2007 2008 2009 2010 2011 2012 2013 2014IHY
EUR m
Lithuania
Latvia
Estonia

Our Real Estate Portfolio

39
High quality commercial properties in the Baltic capitals
ESTONIA
LATVIA
LITHUANIA
Tallinn Tänassilma Logistics (BPFII) Rimi Logistics (BPFII) Metro Plaza (BPFII)
Vilnius Vilnius Business Harbour (DI) GO 9 Shopping Center (BPFII)
Riga Deglava Prisma (BPFII)

Strong cash flow and solid performance
NAV BPF II +26% since launch
90,0
100,0
110,0
120,0
130,0
•Yield levels 7-9%
Yields
•60-70%
Gearing
•Around or below 3%
Interest rates
•ROE target 15-20% (currently 16.5%)
Return on Equity
Real Estate portfolio’s key characteristics
40