private equity & venture capitalspotlight -...
TRANSCRIPT
PRIVATE EQUITY & VENTURE CAPITAL
SPOTLIGHTVOLUME 13, ISSUE 8 ■ NOVEMBER 2017
alternative assets. intelligent data.
www.preqin.com/contact [email protected]|
Alt Credit Intelligence European and US Fund Services Awards: Best Data and Information Provider | Africa Global Funds Awards 2016: Best Research and Data Provider | The Queen’s
Award for Enterprise: International Trade | HedgeWeek Global Awards: Best Global Hedge Fund Research Provider | CAIA Corporate Recognition Award
COMPENSATION AND EMPLOYMENT
78%of surveyed private capital firms increased the average firm-wide base salary in 2016/2017, and another 68% project a further increase in 2017/2018.
Find out more on page 8
RECENTLY RELEASED: THE 2018 PREQIN PRIVATE CAPITAL COMPENSATION AND EMPLOYMENT REVIEW
Order Your Copy Download Sample Pages
FEATURE Women in Venture Capital
3
FEATURE Compensation and Employment
8
INDUSTRY NEWS 10
THE FACTS■ Japan-Based Private
Equity Investors■ Venture Capital Fund
Performance■ Raising Private Equity
Funds of Funds■ India-Based Deals and
Exits
12
13
14
15
CONFERENCES 16
IN THIS ISSUE
THE 2018PREQIN PRIVATE CAPITAL COMPENSATION AND EMPLOYMENT REVIEW
alternative assets. intelligent data.
In association with:
WOMEN IN VENTURE CAPITAL
21%of all venture capital employees are female. We focus on women-led venture capital fundraising and deal activity, and highlight recent developments in the industry, including Reid Hoffman’s #DecencyPledge movement amid recent sexual misconduct allegations.
Find out more on page 3
SIGN UP
Sign up to Spotlight, our free monthly newsletter, providing insights into performance, investors, deals and
fundraising, powered by Preqin data:
All data in this newsletter can be downloaded to Excel for free

Platte River Equity
Global private equity fundraisingCapstone Partners (www.csplp.com) is a leading independent placement agent focused on raising capital for private equity, credit, real assets and infrastructure firms. The Capstone team includes 35 experienced professionals in North America, Europe and Asia.
www.csplp.com
Americas — Europe — Middle East — Asia Pacific
Securities placed through CSP Securities, LPMember FINRA/SIPCAuthorised by FINMA
We congratulate the Platte River Equity team on the first and final closing of Platte River Equity IV, L.P. at its hard cap.

© Preqin Ltd. 2017 / www.preqin.com3 Private Equity & Venture Capital Spotlight | November 2017
WOMEN IN VENTURE CAPITAL
WOMEN IN VENTURE CAPITALExpanding on data featured in Preqin’s recently released Women in Alternative Assets report, we focus on women-owned venture capital firm activity and look at the recent developments and reactions regarding initiatives to improve the gender imbalance and misconduct allegations.
Following recent allegations of discrimination within the venture
capital industry, the issue of gender balance has received renewed attention. Women represent a mere 21% of all venture capital employees, with the largest proportion (36%) of women in venture capital in junior-level positions, followed by 29% in mid-level positions and 11% in senior-level positions. The proportions of female board members are even smaller: just 6% of all venture capital board representatives are women. Geographically, the ratio of total women employees in the industry lingers at around a fifth across all regions, although North America has a greater percentage (13%) of women in senior positions compared to Europe (9%). In this feature, we look at the members of the industry working to raise industry standards of conduct, the impact of women deal-makers, the relationships of institutional investors with women-owned firms and women-led fundraising activity.
DECENCY PLEDGEIn the wake of recent sexual misconduct allegations, many prominent venture
capitalists have sounded a call for action. Reid Hoffman, LinkedIn co-founder and partner at Greylock Partners, suggested that those in the industry adopt a set of moral guidelines, which he has dubbed the “decency pledge”. While many firms quickly adopted the pledge, such as Sequoia Capital, Norwest Venture Partners,
First Round Capital and General Catalyst Partners, some in the industry argued that moral decency should not have to be pledged, and others argued that the pledge alone is not enough to motivate change in the industry.
Fig. 2: Largest Women-Owned Venture Capital Funds in Market (As at October 2017)
Fund Firm Vintage Type Primary Geographic Focus
Fund Status
Target Size ($mn)
Baidu Capital Baidu Capital 2017 Expansion/Late Stage Asia First Close 2,950
AMBI Film Fund AMBI Pictures 2017 Venture Capital (All Stages) US Raising 200
Arbor Ventures Fund II Arbor Ventures 2017 Early Stage: Start-up Asia First Close 200
Ariadne Ecosystem Economics Fund Ariadne Capital 2017 Venture Capital (All Stages) Europe Raising 195
Aspect Ventures Fund II Aspect Ventures 2017 Early Stage US Raising 175
Glasswing Ventures Glasswing Ventures 2017 Early Stage US First Close 150
Hummer Winblad Venture Partners VII HWVP 2017 Venture Capital (All Stages) US Raising 125
iBionext Growth Fund iBionext 2016 Early Stage: Start-up Europe First Close 111
Agent Capital Fund I Agent Capital 2017 Venture Capital (All Stages) US Raising 100
iGlobe Platinum Fund II iGlobe Partners 2015 Early Stage Asia First Close 100
Imaginary Venture Capital Partners I Imaginary Ventures 2017 Early Stage Europe Raising 100
Nautilus Venture Partners Fund I Nautilus Venture Partners 2015 Venture Capital (All Stages) US First Close 100
Venture City Fund I Venture City 2017 Early Stage: Start-up US Raising 100
Source: Preqin Venture Capital Online
Fig. 1: Annual Venture Capital Fundraising by Women-Owned Firms, 2007 - 2017 YTD (As at October 2017)
7 8 9 9
12
15
12
18
24 25
13
0.7 0.6
0.3
1.5
0.6
1.00.8
1.0
2.11.8
2.4
0
1
2
3
0
5
10
15
20
25
30
2007 2008 2009 2010 2011 2012 2013 2014 2015 2016 2017YTD
No. of Funds Closed Aggregate Capital Raised ($bn)
Source: Preqin Venture Capital Online
Aggregate Capital Raised ($bn)
Year of Final Close
No.
of F
unds
Clo
sed

© Preqin Ltd. 2017 / www.preqin.com4 Private Equity & Venture Capital Spotlight | November 2017
WOMEN IN VENTURE CAPITAL
6.4%6.9% 7.1%
6.1%6.7%
7.2%
9.0%
0%
1%
2%
3%
4%
5%
6%
7%
8%
9%
10%
2010 2011 2012 2014 2015 2016 2017 YTD
Source: Preqin Venture Capital Online
Fig. 4: Proportion of Venture Capital Deals Led by Female Partners, 2010 - 2017 YTD (As at October 2017)
Prop
ortio
n of
Dea
ls
The pledge states that when venture capitalists are engaging with entrepreneurs, they have the same moral position to them as a manager to an employee or a college professor to a student. Moreover, once potential business relationships are underway, the pursuit of any romantic or sexual relationship must be forfeited. The pledge also maintains that industry peers have a duty to report behaviour that is not up to standard and that gender discrimination should be treated with zero tolerance; that fellow venture capitalists should not do business with peers who engage in discriminatory or predatory behaviour; and that institutional investors should not invest with those particular individuals or firms,
and entrepreneurs should not consider their funding offers.
One example of this pledge in action can be found in Y Combinator’s (YC)long-standing tracking of investors with a history of poor conduct within the YC network, known by some as the “Silicon Valley Blacklist,” and its more recent anonymous submission system for YC network founders to report any misconduct they have experienced personally, observed themselves or been told as a confidant of a victim.
WOMEN DRIVING CHANGEBy incorporating gender diversity values into their business models, firms are paving
the way to a more inclusive and diverse industry. XFactor Ventures, a pre-seed and seed stage fund, was created to help make a difference for the next generation of female-led businesses. The firm has eight female founders and nine female investment partners, and has raised $3mn to make pre-seed and seed investments in 30 female-led companies over the next couple of years. XFactor Ventures is one of the few firms in the industry that strives to have female representation on both the investment and founder side.
BBG Ventures is another example of a firm founded on the principles of driving and developing female talent in the industry. Founded by Susan Lyne, the early
Fig. 3: Most Active Female Board Representatives at Venture Capital-Backed Portfolio Companies, 2017 YTD
Name Firm(s) No. of Board Seats
Cindy Padnos Illuminate Ventures 11
Vani Kola Kalaari Capital 10
Hilary Gosher Insight Venture Partners 10
Tracy Saxton SV Health Investors, Roche Venture Fund, Pivotal BioVenture Partners 9
Wende Hutton Canaan Partners 9
Jenny Lee GGV Capital 8
Elaine Jones Pfizer Venture Investments 8
Dana Settle Greycroft Partners 7
Nilanjana Bhowmik Longworth Venture Partners 7
Stacey Bishop Scale Venture Partners 7
Source: Preqin Venture Capital Online
177
249
286 276
176190
224
307
2.0
4.43.7
2.9 2.9 2.92.9
5.1
0
1
2
3
4
5
6
0
50
100
150
200
250
300
350
2010 2011 2012 2013 2014 2015 2016 2017YTD
No. of Deals Aggregate Deal Size ($bn)
Source: Preqin Venture Capital Online
Fig. 5: Venture Capital Deals Led by Female Partners,2010 - 2017 YTD (As at October 2017)
No.
of D
eals
Aggregate Deal Value ($bn)
366
4376
25
4.6
0.7 0.9
0.20
0.5
1
1.5
2
2.5
3
3.5
4
4.5
5
0
50
100
150
200
250
300
350
400
North America Europe Asia Rest of World
No. of Deals Aggregate Deal Value ($bn)
Source: Preqin Venture Capital Online
Fig. 6: Women-Owned Venture Capital Firms: Deals by Portfolio Company Location (As at October 2017)
Aggregate Deal Value ($bn)
No.
of D
eals
Location
© Preqin Ltd. 2017 / www.preqin.com5 Private Equity & Venture Capital Spotlight | November 2017
WOMEN IN VENTURE CAPITAL
74%
20%
5%1%
North America
Europe
Asia
Rest of World
Source: Preqin Venture Capital Online
Fig. 9: Proportion of Investor Commitments to Women-Owned Venture Capital Firms by Investor Location, 2000 - 2017 YTD(As at October 2017)
29%
22%
15%13%
5% 5%
11%
0%
5%
10%
15%
20%
25%
30%
35%
Fund
of
Fund
s
Publ
icPe
nsio
n Fu
nd
Foun
datio
n
Priv
ate
Sect
orPe
nsio
n Fu
nd
Endo
wm
ent
Plan
Insu
ranc
eCo
mpa
ny
Oth
er
Source: Preqin Venture Capital Online
Prop
ortio
n of
Com
mitm
ents
Fig. 8: Proportion of Investor Commitments to Women-Owned Venture Capital Firms by Investor Type, 2000 - 2017 YTD(As at October 2017)
stage fund is focused on investments in technology companies with at least one female founder. The firm is backed by AOL as a part of its #BuiltByGirls initiative; started by BBG Ventures’ partner Nisha Dua, it challenges young women to take part in the tech-enabled economy through a series of offline and online programs, to teach girls the fundamentals of venture capital and prepare them for a career in technology. The BBG Ventures portfolio currently holds over 30 investments in women-led firms.
WOMEN DEAL-MAKERSSince 2010, there has been steady growth in both the number of women in lead partner positions and the aggregate size of venture capital deals led by women. Compared to 2016, this year so far has seen over 83 more deals with women acting as lead partners, with over $2.0bn more in deal value (Fig. 5).
North America is the most active region for venture capital deals completed by women-owned firms in 2017 YTD by both number and aggregate value: there have been 366 investments in the region totalling over $4.6bn, more than 2.5x more than all other regions combined (Fig. 6). Asia is the second most active region for women-owned firms in terms of the number of deals (76). Nonetheless, Europe is not far behind, with 43 venture capital
financings by women-owned firms in 2017 valued at $0.7bn.
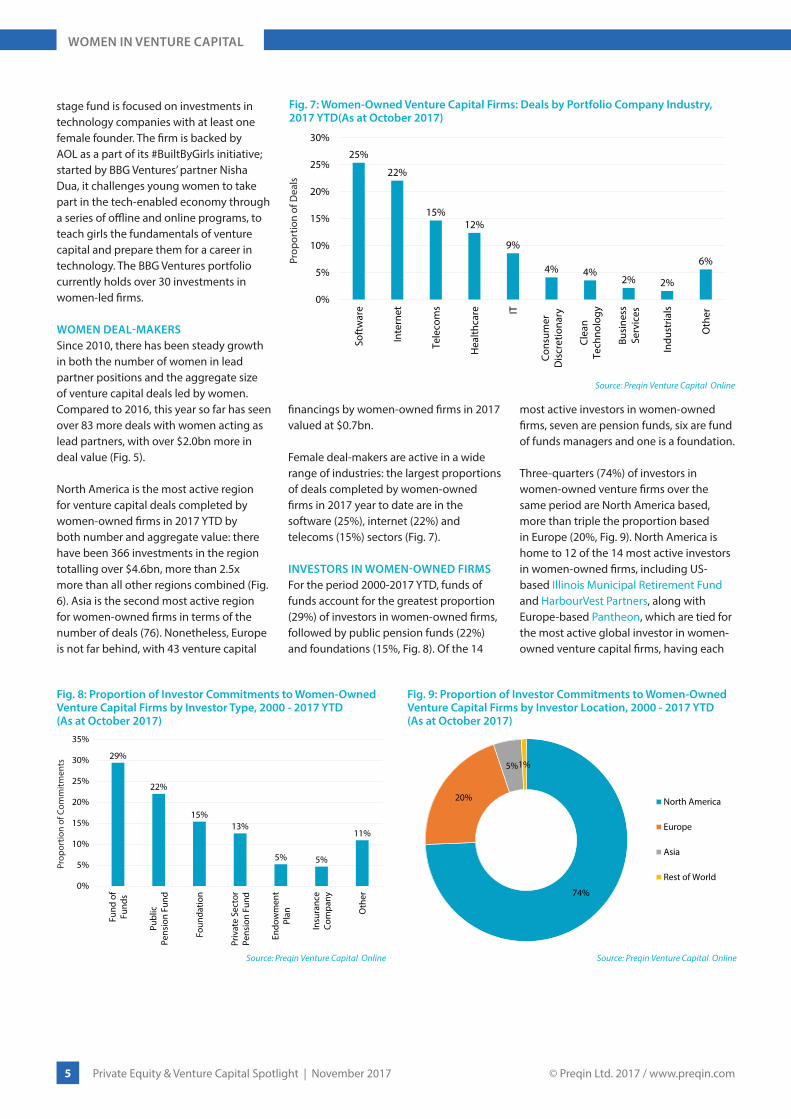
Female deal-makers are active in a wide range of industries: the largest proportions of deals completed by women-owned firms in 2017 year to date are in the software (25%), internet (22%) and telecoms (15%) sectors (Fig. 7).
INVESTORS IN WOMEN-OWNED FIRMSFor the period 2000-2017 YTD, funds of funds account for the greatest proportion (29%) of investors in women-owned firms, followed by public pension funds (22%) and foundations (15%, Fig. 8). Of the 14
most active investors in women-owned firms, seven are pension funds, six are fund of funds managers and one is a foundation.
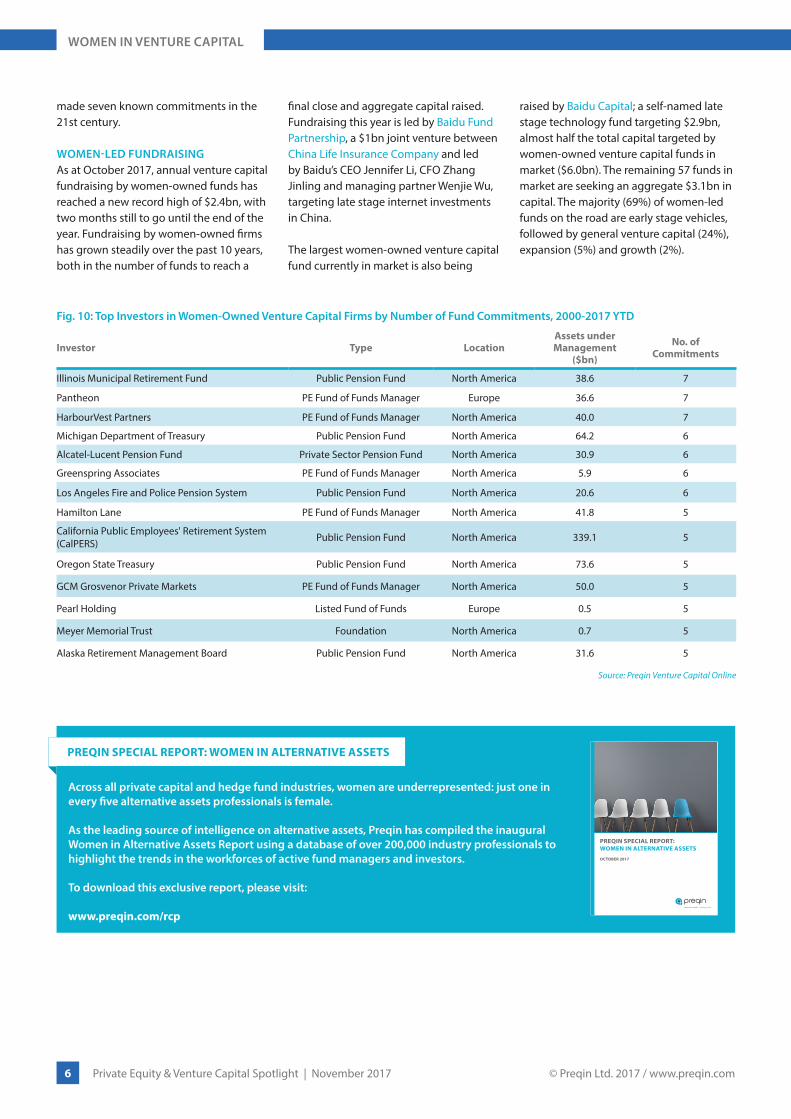
Three-quarters (74%) of investors in women-owned venture firms over the same period are North America based, more than triple the proportion based in Europe (20%, Fig. 9). North America is home to 12 of the 14 most active investors in women-owned firms, including US-based Illinois Municipal Retirement Fund and HarbourVest Partners, along with Europe-based Pantheon, which are tied for the most active global investor in women-owned venture capital firms, having each
25%
22%
15%12%
9%
4% 4%2% 2%
6%
0%
5%
10%
15%
20%
25%
30%
Soft
war
e
Inte
rnet
Tele
com
s
Hea
lthca
re IT
Cons
umer
Dis
cret
iona
ry
Clea
nTe
chno
logy
Busi
ness
Serv
ices
Indu
stria
ls
Oth
er
Source: Preqin Venture Capital Online
Fig. 7: Women-Owned Venture Capital Firms: Deals by Portfolio Company Industry, 2017 YTD(As at October 2017)
Prop
ortio
n of
Dea
ls
© Preqin Ltd. 2017 / www.preqin.com6 Private Equity & Venture Capital Spotlight | November 2017
WOMEN IN VENTURE CAPITAL
made seven known commitments in the 21st century.
WOMEN-LED FUNDRAISINGAs at October 2017, annual venture capital fundraising by women-owned funds has reached a new record high of $2.4bn, with two months still to go until the end of the year. Fundraising by women-owned firms has grown steadily over the past 10 years, both in the number of funds to reach a
final close and aggregate capital raised. Fundraising this year is led by Baidu Fund Partnership, a $1bn joint venture between China Life Insurance Company and led by Baidu’s CEO Jennifer Li, CFO Zhang Jinling and managing partner Wenjie Wu, targeting late stage internet investments in China.
The largest women-owned venture capital fund currently in market is also being
raised by Baidu Capital; a self-named late stage technology fund targeting $2.9bn, almost half the total capital targeted by women-owned venture capital funds in market ($6.0bn). The remaining 57 funds in market are seeking an aggregate $3.1bn in capital. The majority (69%) of women-led funds on the road are early stage vehicles, followed by general venture capital (24%), expansion (5%) and growth (2%).
Fig. 10: Top Investors in Women-Owned Venture Capital Firms by Number of Fund Commitments, 2000-2017 YTD
Investor Type LocationAssets under Management
($bn)
No. of Commitments
Illinois Municipal Retirement Fund Public Pension Fund North America 38.6 7
Pantheon PE Fund of Funds Manager Europe 36.6 7
HarbourVest Partners PE Fund of Funds Manager North America 40.0 7
Michigan Department of Treasury Public Pension Fund North America 64.2 6
Alcatel-Lucent Pension Fund Private Sector Pension Fund North America 30.9 6
Greenspring Associates PE Fund of Funds Manager North America 5.9 6
Los Angeles Fire and Police Pension System Public Pension Fund North America 20.6 6
Hamilton Lane PE Fund of Funds Manager North America 41.8 5
California Public Employees' Retirement System (CalPERS) Public Pension Fund North America 339.1 5
Oregon State Treasury Public Pension Fund North America 73.6 5
GCM Grosvenor Private Markets PE Fund of Funds Manager North America 50.0 5
Pearl Holding Listed Fund of Funds Europe 0.5 5
Meyer Memorial Trust Foundation North America 0.7 5
Alaska Retirement Management Board Public Pension Fund North America 31.6 5
Source: Preqin Venture Capital Online
PREQIN SPECIAL REPORT: WOMEN IN ALTERNATIVE ASSETS
Across all private capital and hedge fund industries, women are underrepresented: just one in every five alternative assets professionals is female.
As the leading source of intelligence on alternative assets, Preqin has compiled the inaugural Women in Alternative Assets Report using a database of over 200,000 industry professionals to highlight the trends in the workforces of active fund managers and investors.
To download this exclusive report, please visit:
www.preqin.com/rcp
PREQIN SPECIAL REPORT:WOMEN IN ALTERNATIVE ASSETS
OCTOBER 2017
alternative assets. intelligent data.
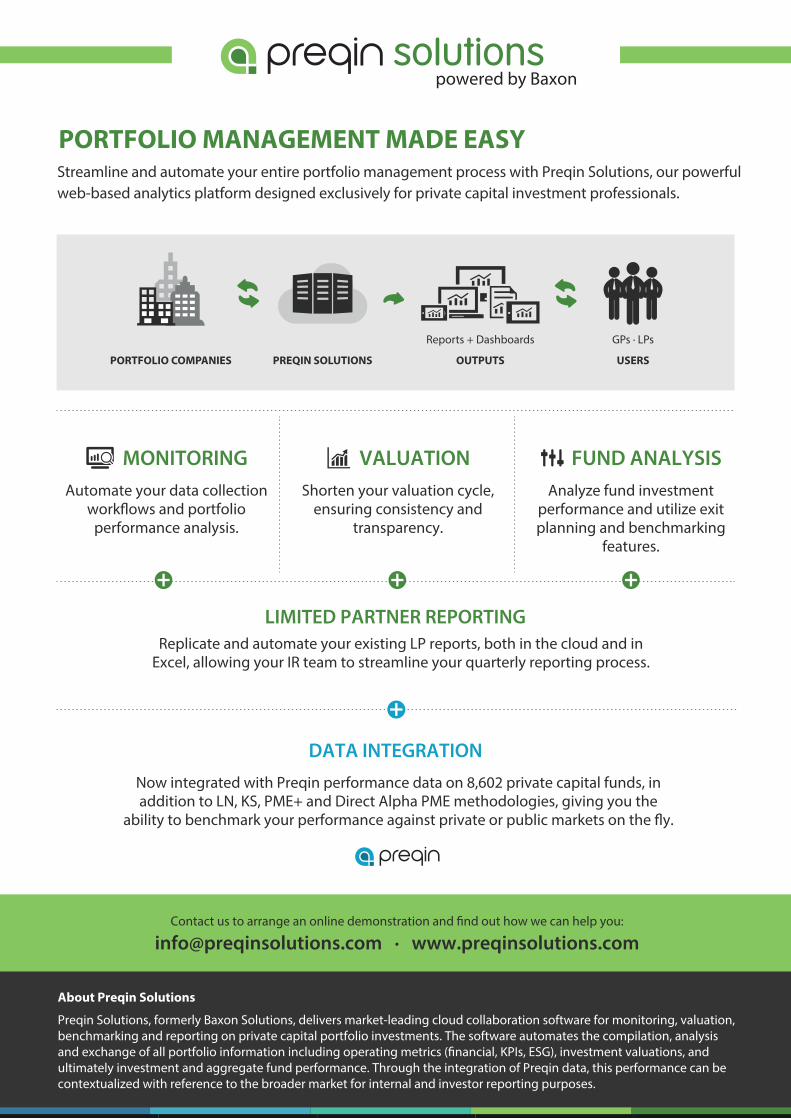
Streamline and automate your entire portfolio management process with Preqin Solutions, our powerful web-based analytics platform designed exclusively for private capital investment professionals.
DATA INTEGRATION
LIMITED PARTNER REPORTING
Automate your data collection work�ows and portfolio
performance analysis.
Shorten your valuation cycle, ensuring consistency and
transparency.
Analyze fund investment performance and utilize exit planning and benchmarking
features.
Replicate and automate your existing LP reports, both in the cloud and in Excel, allowing your IR team to streamline your quarterly reporting process.
Contact us to arrange an online demonstration and �nd out how we can help you:
[email protected] · www.preqinsolutions.com
About Preqin Solutions
Preqin Solutions, formerly Baxon Solutions, delivers market-leading cloud collaboration software for monitoring, valuation, benchmarking and reporting on private capital portfolio investments. The software automates the compilation, analysis and exchange of all portfolio information including operating metrics (�nancial, KPIs, ESG), investment valuations, and ultimately investment and aggregate fund performance. Through the integration of Preqin data, this performance can be contextualized with reference to the broader market for internal and investor reporting purposes.
Now integrated with Preqin performance data on 8,602 private capital funds, in addition to LN, KS, PME+ and Direct Alpha PME methodologies, giving you the
ability to benchmark your performance against private or public markets on the �y.
PORTFOLIO MANAGEMENT MADE EASY
PORTFOLIO COMPANIES PREQIN SOLUTIONS USERS
GPs · LPsReports + Dashboards
OUTPUTS
Preqin Solutions One Page Ad v7.pdf 1 16-Jan-17 2:25:12 PM
© Preqin Ltd. 2017 / www.preqin.com8 Private Equity & Venture Capital Spotlight | November 2017
COMPENSATION AND EMPLOYMENT
COMPENSATION AND EMPLOYMENTWith the release of The 2018 Preqin Private Capital Compensation and Employment Review conducted in partnership with FPL Associates, this extract provides insight into the compensation and employment practices of private capital firms worldwide.
0
1,000
2,000
3,000
4,000
5,000
6,000
7,000
8,000
1980
1982
1984
1986
1988
1990
1992
1994
1996
1998
2000
2002
2004
2006
2008
2010
2012
2014
2016
New
Existing
Source: The 2018 Preqin Private Capital Compensation & Employment Review
Fig. 2: Number of Active Private Capital Firms over Time (By Vintage of First Fund Raised)
No.
of A
ctiv
e Fi
rms
Strong fundraising and healthy fund performance have contributed to the
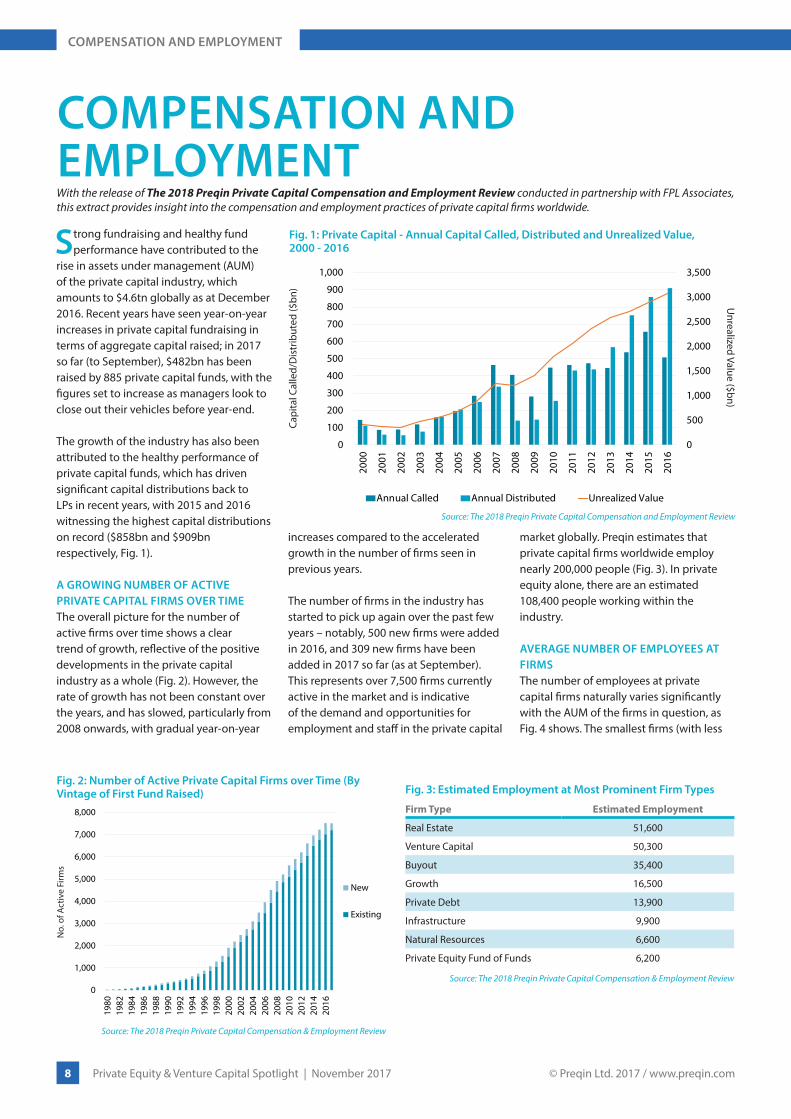
rise in assets under management (AUM) of the private capital industry, which amounts to $4.6tn globally as at December 2016. Recent years have seen year-on-year increases in private capital fundraising in terms of aggregate capital raised; in 2017 so far (to September), $482bn has been raised by 885 private capital funds, with the figures set to increase as managers look to close out their vehicles before year-end.
The growth of the industry has also been attributed to the healthy performance of private capital funds, which has driven significant capital distributions back to LPs in recent years, with 2015 and 2016 witnessing the highest capital distributions on record ($858bn and $909bn respectively, Fig. 1).
A GROWING NUMBER OF ACTIVE PRIVATE CAPITAL FIRMS OVER TIMEThe overall picture for the number of active firms over time shows a clear trend of growth, reflective of the positive developments in the private capital industry as a whole (Fig. 2). However, the rate of growth has not been constant over the years, and has slowed, particularly from 2008 onwards, with gradual year-on-year
increases compared to the accelerated growth in the number of firms seen in previous years.
The number of firms in the industry has started to pick up again over the past few years – notably, 500 new firms were added in 2016, and 309 new firms have been added in 2017 so far (as at September). This represents over 7,500 firms currently active in the market and is indicative of the demand and opportunities for employment and staff in the private capital
market globally. Preqin estimates that private capital firms worldwide employ nearly 200,000 people (Fig. 3). In private equity alone, there are an estimated 108,400 people working within the industry.
AVERAGE NUMBER OF EMPLOYEES AT FIRMS The number of employees at private capital firms naturally varies significantly with the AUM of the firms in question, as Fig. 4 shows. The smallest firms (with less
0
500
1,000
1,500
2,000
2,500
3,000
3,500
0
100
200
300
400
500
600
700
800
900
1,000
2000
2001
2002
2003
2004
2005
2006
2007
2008
2009
2010
2011
2012
2013
2014
2015
2016
Annual Called Annual Distributed Unrealized Value
Source: The 2018 Preqin Private Capital Compensation and Employment Review
Capi
tal C
alle
d/D
istr
ibut
ed ($
bn)
Fig. 1: Private Capital - Annual Capital Called, Distributed and Unrealized Value,2000 - 2016
Fig. 3: Estimated Employment at Most Prominent Firm Types
Firm Type Estimated Employment
Real Estate 51,600
Venture Capital 50,300
Buyout 35,400
Growth 16,500
Private Debt 13,900
Infrastructure 9,900
Natural Resources 6,600
Private Equity Fund of Funds 6,200
Source: The 2018 Preqin Private Capital Compensation & Employment Review
Unrealized Value ($bn)
© Preqin Ltd. 2017 / www.preqin.com9 Private Equity & Venture Capital Spotlight | November 2017
COMPENSATION AND EMPLOYMENT
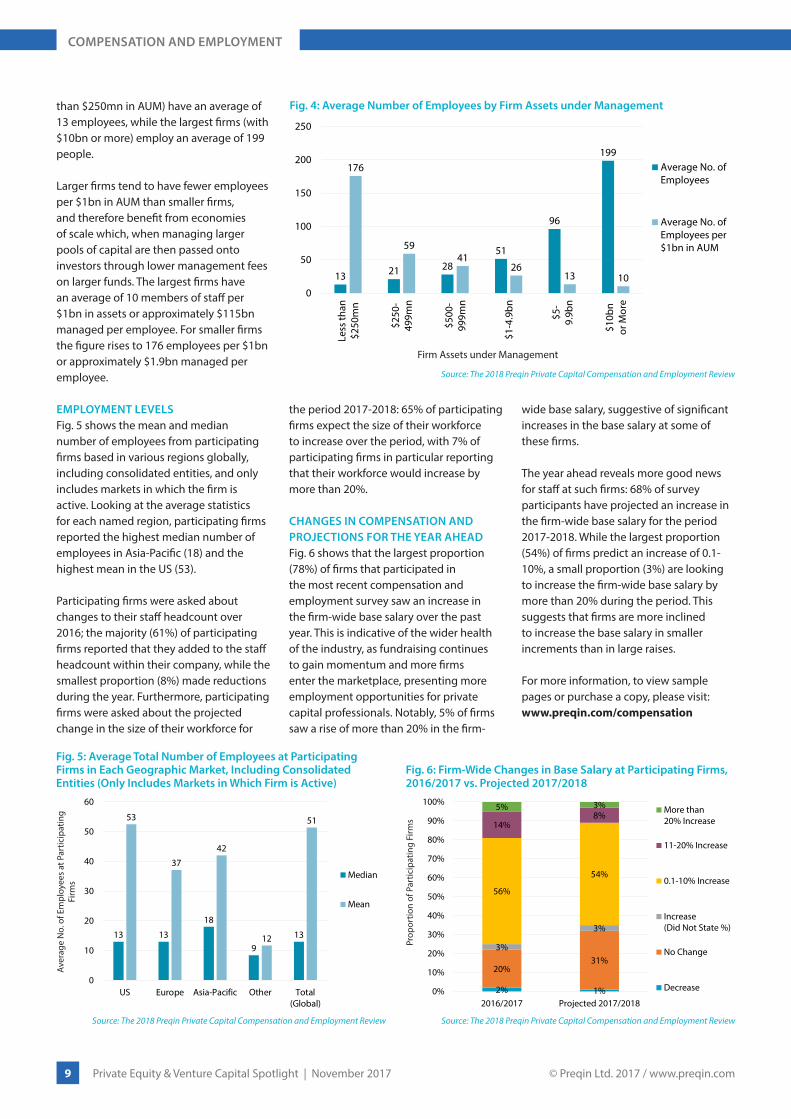
than $250mn in AUM) have an average of 13 employees, while the largest firms (with $10bn or more) employ an average of 199 people.
Larger firms tend to have fewer employees per $1bn in AUM than smaller firms, and therefore benefit from economies of scale which, when managing larger pools of capital are then passed onto investors through lower management fees on larger funds. The largest firms have an average of 10 members of staff per $1bn in assets or approximately $115bn managed per employee. For smaller firms the figure rises to 176 employees per $1bn or approximately $1.9bn managed per employee.
EMPLOYMENT LEVELSFig. 5 shows the mean and median number of employees from participating firms based in various regions globally, including consolidated entities, and only includes markets in which the firm is active. Looking at the average statistics for each named region, participating firms reported the highest median number of employees in Asia-Pacific (18) and the highest mean in the US (53).
Participating firms were asked about changes to their staff headcount over 2016; the majority (61%) of participating firms reported that they added to the staff headcount within their company, while the smallest proportion (8%) made reductions during the year. Furthermore, participating firms were asked about the projected change in the size of their workforce for
the period 2017-2018: 65% of participating firms expect the size of their workforce to increase over the period, with 7% of participating firms in particular reporting that their workforce would increase by more than 20%.
CHANGES IN COMPENSATION AND PROJECTIONS FOR THE YEAR AHEADFig. 6 shows that the largest proportion (78%) of firms that participated in the most recent compensation and employment survey saw an increase in the firm-wide base salary over the past year. This is indicative of the wider health of the industry, as fundraising continues to gain momentum and more firms enter the marketplace, presenting more employment opportunities for private capital professionals. Notably, 5% of firms saw a rise of more than 20% in the firm-
wide base salary, suggestive of significant increases in the base salary at some of these firms.
The year ahead reveals more good news for staff at such firms: 68% of survey participants have projected an increase in the firm-wide base salary for the period 2017-2018. While the largest proportion (54%) of firms predict an increase of 0.1-10%, a small proportion (3%) are looking to increase the firm-wide base salary by more than 20% during the period. This suggests that firms are more inclined to increase the base salary in smaller increments than in large raises.
For more information, to view sample pages or purchase a copy, please visit:www.preqin.com/compensation
13 13
18
913
53
37
42
12
51
0
10
20
30
40
50
60
US Europe Asia-Pacific Other Total(Global)
Median
Mean
Source: The 2018 Preqin Private Capital Compensation and Employment Review
Aver
age
No.
of E
mpl
oyee
s at
Par
ticip
atin
g Fi
rms
Fig. 5: Average Total Number of Employees at Participating Firms in Each Geographic Market, Including Consolidated Entities (Only Includes Markets in Which Firm is Active)
2% 1%
20%31%
3%
3%
56%
54%
14%8%
5% 3%
0%
10%
20%
30%
40%
50%
60%
70%
80%
90%
100%
2016/2017 Projected 2017/2018
More than20% Increase
11-20% Increase
0.1-10% Increase
Increase(Did Not State %)
No Change
Decrease
Source: The 2018 Preqin Private Capital Compensation and Employment Review
Prop
ortio
n of
Par
ticip
atin
g Fi
rms
Fig. 6: Firm-Wide Changes in Base Salary at Participating Firms, 2016/2017 vs. Projected 2017/2018
Return - Median Net IRR
13 21 2851
96
199176
5941
2613 10
0
50
100
150
200
250
Less
than
$250
mn
$250
-49
9mn
$500
-99
9mn
$1-4
.9bn
$5-
9.9b
n
$10b
nor
Mor
e
Average No. ofEmployees
Average No. ofEmployees per$1bn in AUM
Source: The 2018 Preqin Private Capital Compensation and Employment Review
Firm Assets under Management
Fig. 4: Average Number of Employees by Firm Assets under Management
© Preqin Ltd. 2017 / www.preqin.com10 Private Equity & Venture Capital Spotlight | November 2017
INDUSTRY NEWS
Do you have any news you would like to share with the readers of Spotlight? Perhaps you are about to launch a new fund, have implemented a new investment strategy, or are considering investments beyond your usual geographic focus?
Send your updates to [email protected] and we will endeavour to publish them in the next issue.
SHARE YOUR NEWS
INVESTOR MANDATES
According to Preqin’s H2 2017 Investor Outlook, 85% of investors are looking to increase or maintain their venture capital allocations in the next 12 months. Below is a selection of recent investor profile updates on Venture Capital Online, where Preqin provides exclusive information from investors across the globe regarding their investment plans:
■ AgDevCo, a social impact investor based in the UK, will look to invest in social venture capital projects to aid in the development of agribusiness in low-income nations in Africa over the next year. They will focus on early-stage and growth fund types, and invest $2-3mn per fund.
■ Active Investments Capital, a Hong Kong-based family office, will make new commitments to venture capital and growth vehicles in the coming year. The family office focuses on the technology sector and will invest in first-time managers and spin-offs.
■ Woori Bank, with KRW 297tn in AUM, will invest $100mn across 10 venture vehicles targeting its domestic market, South Korea.
■ Andina Family Offices, located in California, is considering investing more capital with existing managers in the next 12 months. The family office has previously shown a preference for early stage investments in North America.
VENTURE CAPITAL DEALS
Q3 2017 saw aggregate deal value rise to record highs of more than $49bn; yet, the total number of deals fell for the fourth consecutive quarter. North America accounted for 44% of venture capital deal value, followed by 29% for Asia and 19% for Europe.
The two largest deals in Q3 each reached $2bn: Grab Holdings and Toutiao both secured funding for an unspecified round. Grab Holdings, based in Singapore, operates a mobile application that enables users to find and book cabs, private cars and motorbikes. The company has received a total of $4bn in known funding. Toutiao, an online news platform, has acquired $3.1bn in total funding since 2012.
WeWork Companies Inc., a provider of shared working spaces, was involved in the largest deal made in Q3 involving a US-based company: it received $1.9bn in venture funding from returning investors Softbank Capital and SB Investment Advisers in an unspecified round.
ASEAN FUNDRAISING
So far in 2017, a total of 24 ASEAN-focused venture capital vehicles have reached a final close. The funds secured an aggregate $5.4bn in capital, surpassing the total capital raised in all of 2016 by 25%. Three ASEAN-focused funds have reached a final close in October and all are managed by Singapore-based firms. The largest of these funds is Vickers Venture Fund V, which surpassed its target by $20mn, reaching a final close on $250mn.
Vertex SEA & India Fund III targets early stage opportunities within ASEAN. The fund reached a final close on $210mn and invests in portfolio companies operating in the e-commerce, fintech and enterprise industries.
Wavemaker SEA Fund II, the smallest of the three funds, raised $66mn to make seed and Series A investments in Southeast Asia, with a preference for opportunities in Indonesia, the Philippines, Thailand and Malaysia.
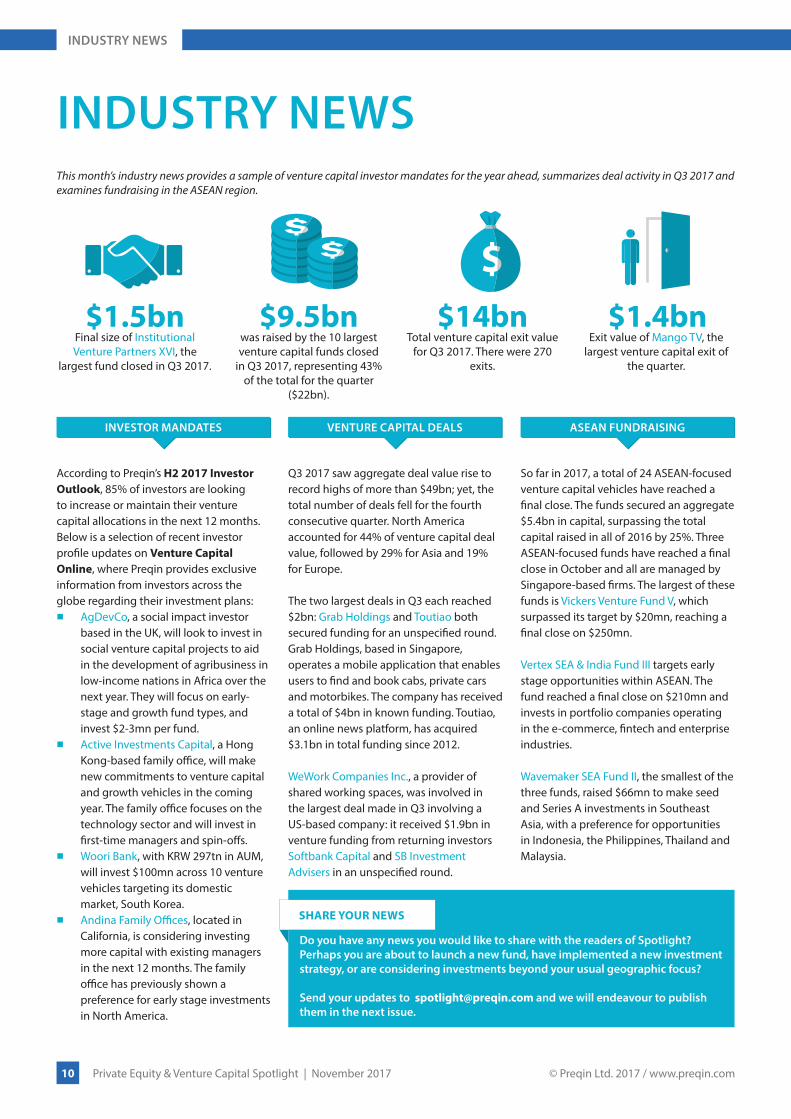
INDUSTRY NEWSThis month’s industry news provides a sample of venture capital investor mandates for the year ahead, summarizes deal activity in Q3 2017 and examines fundraising in the ASEAN region.
$1.5bnFinal size of InstitutionalVenture Partners XVI, the
largest fund closed in Q3 2017.
$9.5bnwas raised by the 10 largest venture capital funds closed
in Q3 2017, representing 43% of the total for the quarter
($22bn).
$14bnTotal venture capital exit value
for Q3 2017. There were 270 exits.
$1.4bnExit value of Mango TV, the
largest venture capital exit of the quarter.
3rd edition
3 day
s Insidethe world ofPrivateEquity
www.ipem-market.com [email protected]
JOIN US
Register & Save 20%*!Thanks to Preqin
http://bit.ly/2heUdpN
IPEM IS THE ONLY GLOBAL PRIVATE EQUITY & VENTURE CAPITAL FUNDRAISING AND DEAL FLOW EVENT TO GATHER THE ECOSYSTEM OF THE INDUSTRY
IPEM offers an innovative format with private spaces and lounges to conduct appointments and facilitate productive meetings, along with a program of of conferences, workshops and networking events designed to engender the exchange of ideas, experiences and viewpoints.
Exhibit and benefit from hospitality suits with confidential private meeting rooms
Mingle with the entire ecosystem at exclusive networking events
Access a high-caliber program of speakers and learn about new trends in the market
1,400+Participants
250+LPs
40Countries
150+Entrepreneurs
24, 25, 26 JANUARY 2018PALAIS DES FESTIVALS - CANNES - FRANCE
*un
til D
ece
mb
er
15, 2
017
© Preqin Ltd. 2017 / www.preqin.com12 Private Equity & Venture Capital Spotlight | November 2017
THE FACTS
4%
44%
21%
52%
18%15%
83%86%
19%
48%
14%5%
33%
0%
10%
20%
30%
40%
50%
60%
70%
80%
90%
Bala
nced
Buyo
ut
Fund
of
Fund
s
Gro
wth
Seco
ndar
ies
Turn
arou
nd
Vent
ure
Capi
tal
GeneralPreference
Fund SearchesIssued in 2017
Source: Preqin Private Equity Online
Fig. 2: Japan-Based Private Equity Investors by Fund Type Preference and Fund Searches Issued in 2017
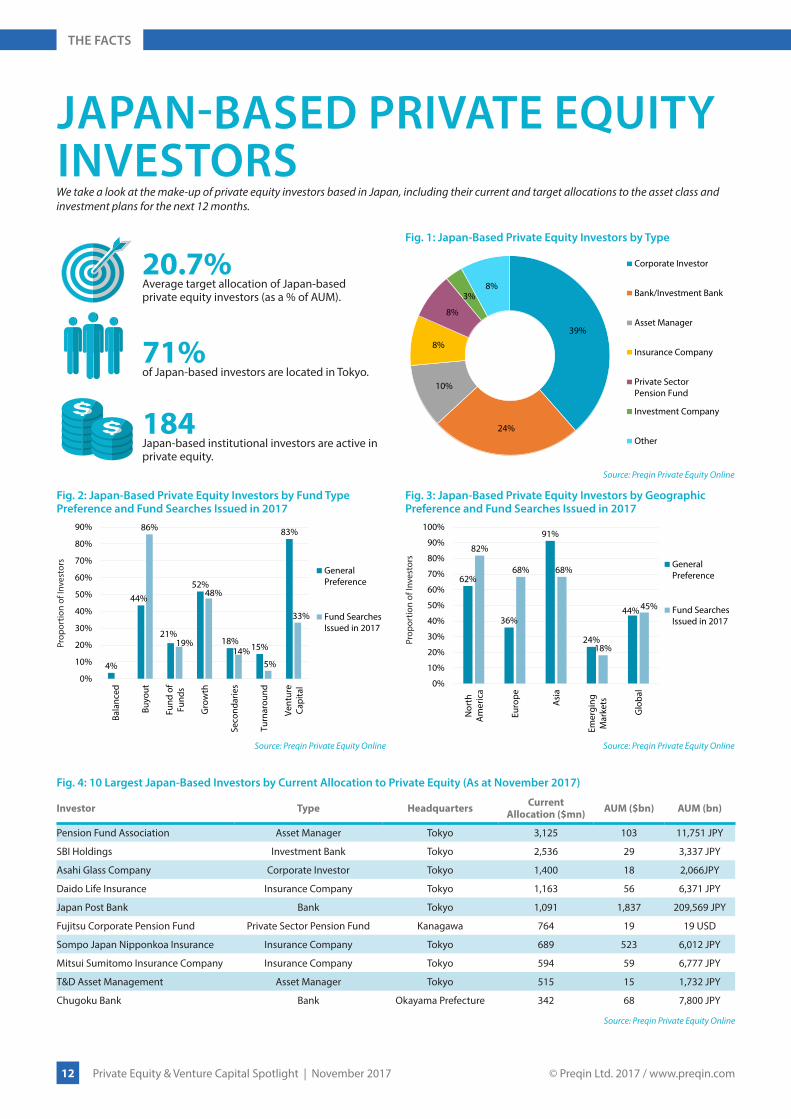
39%
24%
10%
8%
8%
3%8%
Corporate Investor
Bank/Investment Bank
Asset Manager
Insurance Company
Private SectorPension Fund
Investment Company
Other
Source: Preqin Private Equity Online
Fig. 1: Japan-Based Private Equity Investors by Type
62%
36%
91%
24%
44%
82%
68% 68%
18%
45%
0%
10%
20%
30%
40%
50%
60%
70%
80%
90%
100%
Nor
thA
mer
ica
Euro
pe
Asi
a
Emer
ging
Mar
kets
Glo
bal
GeneralPreference
Fund SearchesIssued in 2017
Source: Preqin Private Equity Online
Fig. 3: Japan-Based Private Equity Investors by Geographic Preference and Fund Searches Issued in 2017
JAPAN-BASED PRIVATE EQUITY INVESTORSWe take a look at the make-up of private equity investors based in Japan, including their current and target allocations to the asset class and investment plans for the next 12 months.
Fig. 4: 10 Largest Japan-Based Investors by Current Allocation to Private Equity (As at November 2017)
Investor Type Headquarters Current Allocation ($mn) AUM ($bn) AUM (bn)
Pension Fund Association Asset Manager Tokyo 3,125 103 11,751 JPY
SBI Holdings Investment Bank Tokyo 2,536 29 3,337 JPY
Asahi Glass Company Corporate Investor Tokyo 1,400 18 2,066JPY
Daido Life Insurance Insurance Company Tokyo 1,163 56 6,371 JPY
Japan Post Bank Bank Tokyo 1,091 1,837 209,569 JPY
Fujitsu Corporate Pension Fund Private Sector Pension Fund Kanagawa 764 19 19 USD
Sompo Japan Nipponkoa Insurance Insurance Company Tokyo 689 523 6,012 JPY
Mitsui Sumitomo Insurance Company Insurance Company Tokyo 594 59 6,777 JPY
T&D Asset Management Asset Manager Tokyo 515 15 1,732 JPY
Chugoku Bank Bank Okayama Prefecture 342 68 7,800 JPY
Source: Preqin Private Equity Online
Prop
ortio
n of
Inve
stor
s
Prop
ortio
n of
Inve
stor
s
20.7%Average target allocation of Japan-based private equity investors (as a % of AUM).
71%of Japan-based investors are located in Tokyo.
184Japan-based institutional investors are active in private equity.
© Preqin Ltd. 2017 / www.preqin.com13 Private Equity & Venture Capital Spotlight | November 2017
THE FACTS
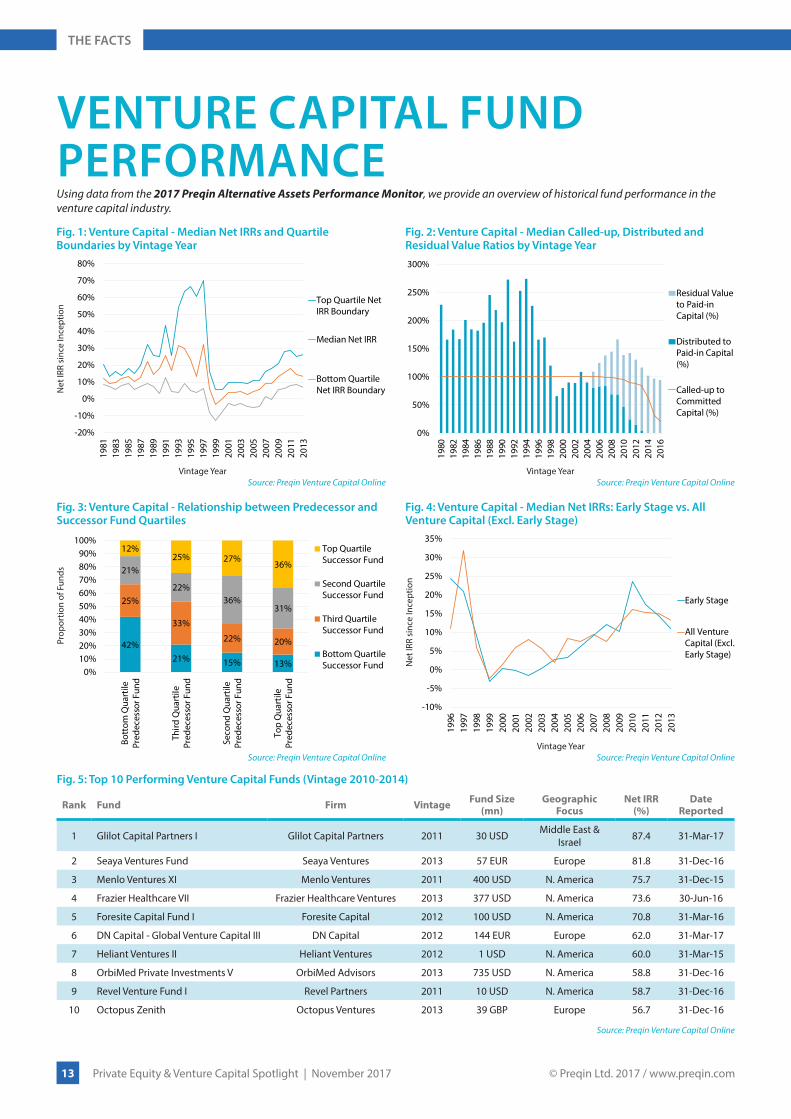
VENTURE CAPITAL FUND PERFORMANCE
-20%
-10%
0%
10%
20%
30%
40%
50%
60%
70%
80%
1981
1983
1985
1987
1989
1991
1993
1995
1997
1999
2001
2003
2005
2007
2009
2011
2013
Top Quartile NetIRR Boundary
Median Net IRR
Bottom QuartileNet IRR Boundary
Source: Preqin Venture Capital Online
Net
IRR
sinc
e In
cept
ion
Vintage Year
Fig. 1: Venture Capital - Median Net IRRs and Quartile Boundaries by Vintage Year
0%
50%
100%
150%
200%
250%
300%
1980
1982
1984
1986
1988
1990
1992
1994
1996
1998
2000
2002
2004
2006
2008
2010
2012
2014
2016
Residual Valueto Paid-inCapital (%)
Distributed toPaid-in Capital(%)
Called-up toCommittedCapital (%)
Source: Preqin Venture Capital OnlineVintage Year
Fig. 2: Venture Capital - Median Called-up, Distributed and Residual Value Ratios by Vintage Year
-10%
-5%
0%
5%
10%
15%
20%
25%
30%
35%
1996
1997
1998
1999
2000
2001
2002
2003
2004
2005
2006
2007
2008
2009
2010
2011
2012
2013
Early Stage
All VentureCapital (Excl.Early Stage)
Source: Preqin Venture Capital Online
Net
IRR
sinc
e In
cept
ion
Vintage Year
Fig. 4: Venture Capital - Median Net IRRs: Early Stage vs. All Venture Capital (Excl. Early Stage)
Using data from the 2017 Preqin Alternative Assets Performance Monitor, we provide an overview of historical fund performance in the venture capital industry.
Fig. 5: Top 10 Performing Venture Capital Funds (Vintage 2010-2014)
Rank Fund Firm Vintage Fund Size (mn)
Geographic Focus
Net IRR (%)
Date Reported
1 Glilot Capital Partners I Glilot Capital Partners 2011 30 USD Middle East & Israel 87.4 31-Mar-17
2 Seaya Ventures Fund Seaya Ventures 2013 57 EUR Europe 81.8 31-Dec-16
3 Menlo Ventures XI Menlo Ventures 2011 400 USD N. America 75.7 31-Dec-15
4 Frazier Healthcare VII Frazier Healthcare Ventures 2013 377 USD N. America 73.6 30-Jun-16
5 Foresite Capital Fund I Foresite Capital 2012 100 USD N. America 70.8 31-Mar-16
6 DN Capital - Global Venture Capital III DN Capital 2012 144 EUR Europe 62.0 31-Mar-17
7 Heliant Ventures II Heliant Ventures 2012 1 USD N. America 60.0 31-Mar-15
8 OrbiMed Private Investments V OrbiMed Advisors 2013 735 USD N. America 58.8 31-Dec-16
9 Revel Venture Fund I Revel Partners 2011 10 USD N. America 58.7 31-Dec-16
10 Octopus Zenith Octopus Ventures 2013 39 GBP Europe 56.7 31-Dec-16
Source: Preqin Venture Capital Online
42%21% 15% 13%
25%
33%
22% 20%
21%
22%36%
31%
12%25% 27%
36%
0%10%20%30%40%50%60%70%80%90%
100%
Bott
om Q
uart
ilePr
edec
esso
r Fun
d
Third
Qua
rtile
Pred
eces
sor F
und
Seco
nd Q
uart
ilePr
edec
esso
r Fun
d
Top
Qua
rtile
Pred
eces
sor F
und
Top QuartileSuccessor Fund
Second QuartileSuccessor Fund
Third QuartileSuccessor Fund
Bottom QuartileSuccessor Fund
Source: Preqin Venture Capital Online
Prop
ortio
n of
Fun
ds
Fig. 3: Venture Capital - Relationship between Predecessor and Successor Fund Quartiles

© Preqin Ltd. 2017 / www.preqin.com14 Private Equity & Venture Capital Spotlight | November 2017
THE FACTS
RAISING PRIVATE EQUITY FUNDS OF FUNDSThis collation of data from the recently published Preqin Special Report: Private Equity Funds of Funds examines the current fundraising climate for these vehicles, noting their historical successes dating back to 2000.
68 72 67
43
73
104
126
160 155
109
7688
10294 99
88 84
42
2012 13 8
1931 34
55 50
2516 18 21 17 17 21 26
10
0
20
40
60
80
100
120
140
160
180
2000
2001
2002
2003
2004
2005
2006
2007
2008
2009
2010
2011
2012
2013
2014
2015
2016
2017
YTD
No. of Funds Closed Aggregate Capital Raised ($bn)
Source: Preqin Private Equity Online
Year of Final Close
Fig. 1: Annual Private Equity Fund of Funds Fundraising, 2000 - 2017 YTD (As at September 2017)
32%49%
74% 75% 69%53% 57%
37%47% 42% 36%
14%
4%
12% 7%8%
14%18%
10%6%
3% 18%
54% 47%
14% 18% 22%33%
25%
53% 47%55%
45%
0%
10%
20%
30%
40%
50%
60%
70%
80%
90%
100%
2007
2008
2009
2010
2011
2012
2013
2014
2015
2016
2017
YTD
Above Target
At Target
Below Target
Source: Preqin Private Equity Online
Prop
ortio
n of
Fun
ds
Year of Final Close
Fig. 2: Fundraising Success of Private Equity Funds of Funds, 2007 - 2017 YTD (As at September 2017)
Fig. 3: 10 Largest Private Equity Funds of Funds Closed, 2009 - 2017 YTD (As at September 2017)
Fund Firm Headquarters Geographic Focus Fund Size (mn)
Final Close Date
ATP Private Equity Partners IV ATP Private Equity Partners
Copenhagen, Denmark
North America, Europe, Emerging Markets 1,375 EUR Dec-10
HarbourVest International VII Partnership HarbourVest Partners Boston, MA, US Europe, Asia, Emerging Markets 1,542 USD Apr-16
Horsley Bridge International V Horsley Bridge Partners San Francisco, CA, US North America, Europe, Asia 1,540 USD May-09
Crown Premium V LGT Capital Partners Pfäffikon, Switzerland Europe, US 900 EUR Nov-13
Portfolio Advisors Private Equity Fund VIII Portfolio Advisors Darien, CT, US Global 1,239 USD Dec-15
Horsley Bridge XI Venture Horsley Bridge Partners San Francisco, CA, US US 1,153 USD Apr-15
Axiom Asia III Axiom Asia Private Capital
Singapore Asia 1,150 USD Mar-12
SwanCap Opportunities Fund SwanCap Partners Munich, Germany Europe, North America 840 EUR Jan-14
Portfolio Advisors Private Equity Fund VI Portfolio Advisors Darien, CT, US North America, Europe, Asia 1,103 USD Mar-11
Portfolio Advisors Private Equity Fund VII Portfolio Advisors Darien, CT, US North America, Europe, Asia 1,090 USD Mar-13
Source: Preqin Private Equity Online
$26bnAmount secured by private
equity funds of funds closed in 2016, a post-crisis high.
17private equity funds of funds
are currently in market, targeting an aggregate
$80bn
$357mnThe average size of private
equity funds of funds closed in 2016.
$381bnThe size of the private equity
fund of funds industry.
© Preqin Ltd. 2017 / www.preqin.com15 Private Equity & Venture Capital Spotlight | November 2017
THE FACTS
35%
73%
50%
3%3%
15%22%
0%
10%
20%
30%
40%
50%
60%
70%
80%
90%
100%
Buyout Venture Capital
Sale to GP
Restructuring
IPO & Follow-on
Trade Sale
Source: Preqin Private Equity Online
Prop
ortio
n of
Exi
ts
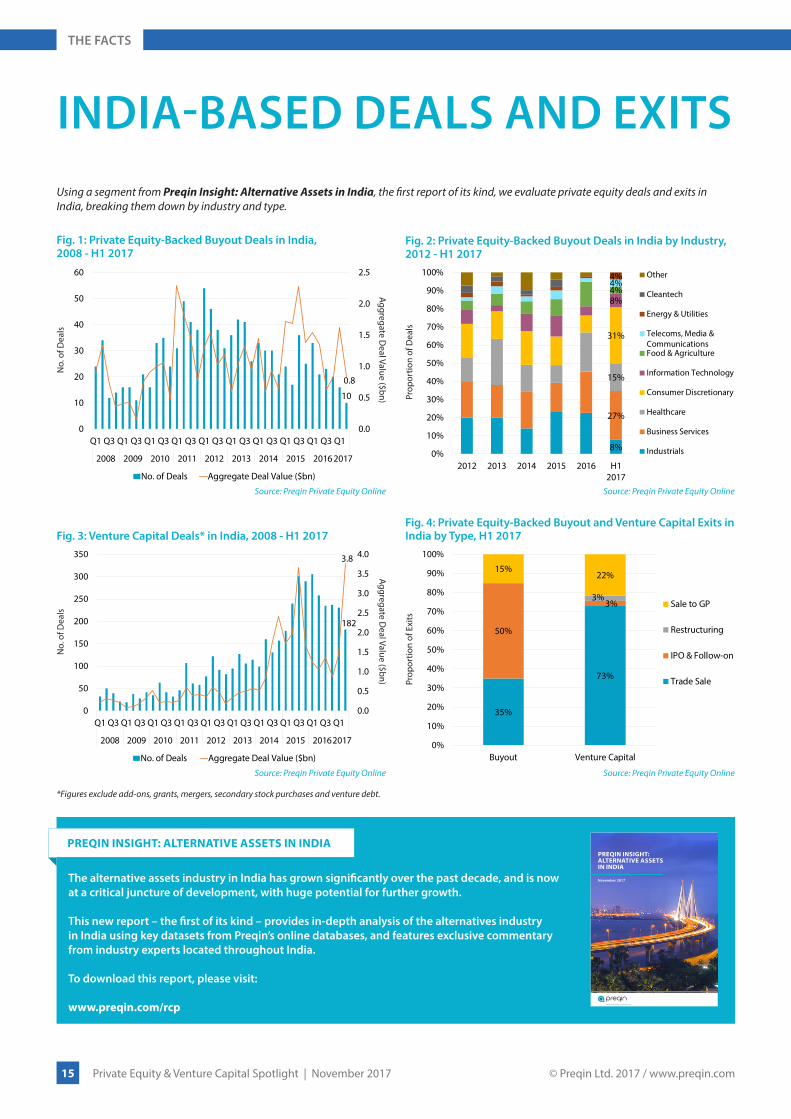
Fig. 4: Private Equity-Backed Buyout and Venture Capital Exits in India by Type, H1 2017
*Figures exclude add-ons, grants, mergers, secondary stock purchases and venture debt.
8%
27%
15%
31%
8%4%4%4%
0%
10%
20%
30%
40%
50%
60%
70%
80%
90%
100%
2012 2013 2014 2015 2016 H12017
Other
Cleantech
Energy & Utilities
Telecoms, Media &CommunicationsFood & Agriculture
Information Technology
Consumer Discretionary
Healthcare
Business Services
Industrials
Source: Preqin Private Equity Online
Prop
ortio
n of
Dea
ls
Fig. 2: Private Equity-Backed Buyout Deals in India by Industry, 2012 - H1 2017
10
0.8
0.0
0.5
1.0
1.5
2.0
2.5
0
10
20
30
40
50
60
Q1 Q3 Q1 Q3 Q1 Q3 Q1 Q3 Q1 Q3 Q1 Q3 Q1 Q3 Q1 Q3 Q1 Q3 Q1
2008 2009 2010 2011 2012 2013 2014 2015 2016 2017
No. of Deals Aggregate Deal Value ($bn)
Source: Preqin Private Equity Online
No.
of D
eals
Fig. 1: Private Equity-Backed Buyout Deals in India, 2008 - H1 2017
Aggregate Deal Value ($bn)
182
3.8
0.0
0.5
1.0
1.5
2.0
2.5
3.0
3.5
4.0
0
50
100
150
200
250
300
350
Q1 Q3 Q1 Q3 Q1 Q3 Q1 Q3 Q1 Q3 Q1 Q3 Q1 Q3 Q1 Q3 Q1 Q3 Q1
2008 2009 2010 2011 2012 2013 2014 2015 20162017
No. of Deals Aggregate Deal Value ($bn)
Source: Preqin Private Equity Online
No.
of D
eals
Fig. 3: Venture Capital Deals* in India, 2008 - H1 2017
Aggregate Deal Value ($bn)
INDIA-BASED DEALS AND EXITSUsing a segment from Preqin Insight: Alternative Assets in India, the first report of its kind, we evaluate private equity deals and exits in India, breaking them down by industry and type.
PREQIN INSIGHT: ALTERNATIVE ASSETS IN INDIA
The alternative assets industry in India has grown significantly over the past decade, and is now at a critical juncture of development, with huge potential for further growth.
This new report – the first of its kind – provides in-depth analysis of the alternatives industry in India using key datasets from Preqin’s online databases, and features exclusive commentary from industry experts located throughout India.
To download this report, please visit:
www.preqin.com/rcp
alternative assets. intelligent data.
November 2017
PREQIN INSIGHT:ALTERNATIVE ASSETS IN INDIA

© Preqin Ltd. 2017 / www.preqin.com16 Private Equity & Venture Capital Spotlight | November 2017
CONFERENCES
CONFERENCESNOVEMBER 2017
Conference Dates Location Organizer Preqin Speaker Discount Code
SuperInvestor 14 - 17 November 2017 Amsterdam KNect365 Mark O'HareTom Carr
10% Discount - FKR2444PRQW
30th Annual AVCJ Private Equity & Venture Forum 14 - 16 November 2017 Hong Kong AVCJ Chris Elvin -
IP Dealmakers Forum 16 - 17 November 2017 New York The IP Investment Institute - $200 Discount -
PR_Offer17
German Private Equity Conference 16 November 2017 Munich Private Equity Insights - 20% Discount -
GPEC_Preqin
ChrysCapital LP Summit 17 November 2017 Hong Kong ChrysCapital Ee Fai Kam
7th Private Equity Forum 2017 Conference 21 November 2017 London Private Equity Forum Mark O'Hare 15% Discount -
Preqin2017
Private Equity: is the market at a top? 21 November 2017 London London Business School (LBS) Mark O'Hare -
Global Ventures Summit 22 - 24 November 2017 Dubai Parkpine Capital Felice Egidio -
BVCA Nordic Forum 24 November 2017 London BVCA Elias Latsis -
World Wealth Creation Conference 28 - 30 November 2017 Singapore Etalon Conference Ltd. - 15% Discount -
preqin
DECEMBER 2017
Conference Dates Location Organizer Preqin Speaker Discount Code
Private Wealth Management Summit 2017 3 - 5 December 2017 Las Vegas marcus evans Summits - -
Marketplace Lending & Alternative Financing Summit 3 - 5 December 2017 Dana Point, CA Opal Financial
Group - -
CLO Summit 3 - 5 December 2017 Dana Point, CA Opal Financial Group -
Alternative Investing Summit 3 - 5 December 2017 Dana Point, CA Opal Financial Group - -
JANUARY 2018
Conference Dates Location Organizer Preqin Speaker Discount Code
French Private Equity Conference 18 January 2018 Paris Private Equity Insights - -
IPEM 2018 24 - 26 January 2018 Cannes Europexpo TBC -

© Preqin Ltd. 2017 / www.preqin.com17 Private Equity & Venture Capital Spotlight | November 2017
CONFERENCES
DATE: 3 - 5 December 2017
INFORMATION: http://events.marcusevans-events.com/private-wealth-summit-2017-preqin/
LOCATION: The Venetian, Las Vegas, NV
ORGANIZER: marcus evans
This Summit has become our flagship investment event in Latin America, and continues to grow substantially since we first launched it. This Summit brings leaders from Latin America’s leading single and multi-family offices and qualified service providers together and offers them an intimate environment for a focused discussion of key new drivers shaping the future of the industry in the region.
Senior investment executives responsible for fund management and asset allocation decisions of the Family Office include: Presidents, Founders, CEOs, Managing Directors, CIOs. The attending providers are leaders in the provision of investment products, services, technology and information to the Family Office executives. They will provide cutting edge solutions to forward-thinking investors, interested in staying ahead of the market.
PRIVATE WEALTH MANAGEMENT SUMMIT
DATE: 2 December 2017
INFORMATION: http://forum.bpea.net.cn/2017/english/
LOCATION: Shangri-la Hotel, Beijing
ORGANIZER: China Association of Private Equity (CAPE)Beijing Municipal Bureau of Financial WorkThe People’s Government of Haidian District, Beijing MunicipalBeijing Private Equity Association (BPEA)
The 9th Global Pe Beijing Forum is the flagship event of Chinese private equity industry. This year, we will focus on ‘Development, contribution and innovation‘, and will includes the latest topics including: “GP Panel” ” LP Panel” “buyout fund panel” and so on.
9TH GLOBAL PE BEIJING FORUM
DATE: 22 February 2018
INFORMATION: http://pe-conference.org/polish/
LOCATION: Warsaw
ORGANIZER: Private Equity Insights
The Polish & CEE Private Equity Conference provides unrivalled networking opportunities in the CEE private equity market. On 22nd February 2018, meet over 60 LPs, 80 GPs and 40 CxOs at the InterContinental Hotel in Warsaw.
POLISH & CEE PRIVATE EQUITY CONFERENCE
DATE: 24 - 26 January 2018
INFORMATION: www.ipem-market.com
LOCATION: Palais des Festivals, Cannes, France
ORGANIZER: EUROPEXPO
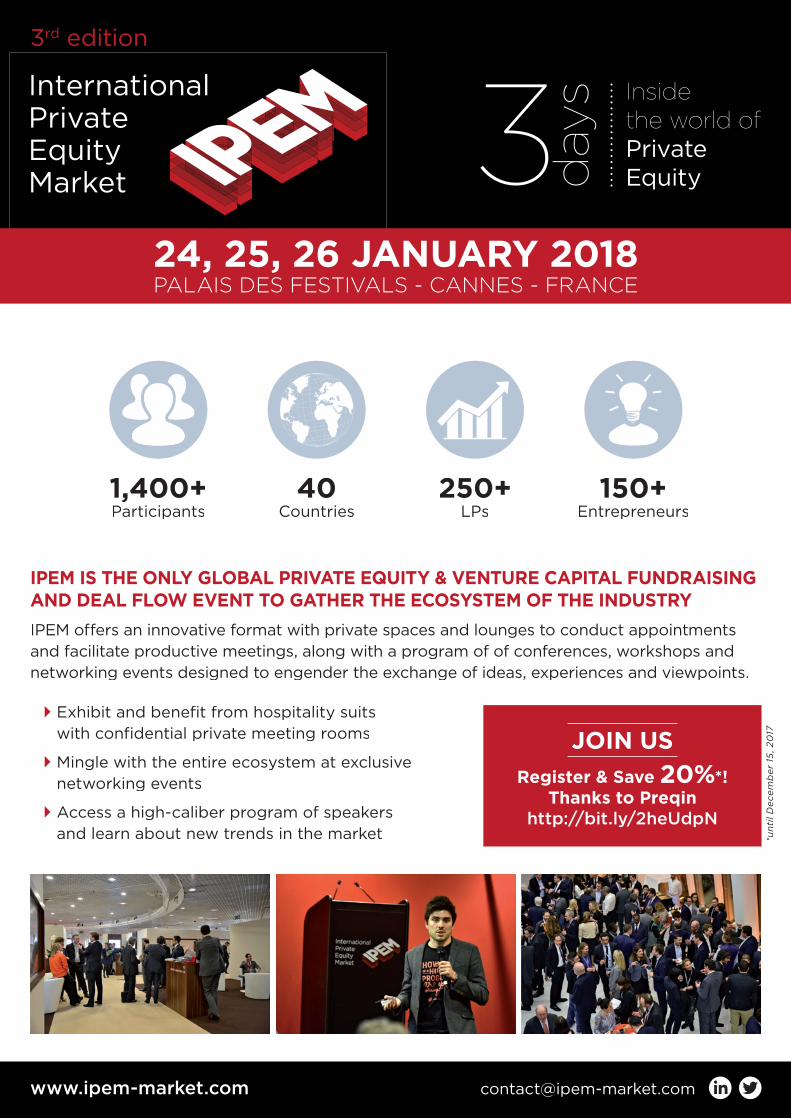
Join 1,400 private equity leaders at IPEM 2018. IPEM is the only international event to provide the Private Equity & Venture Capital industry with a marketplace to foster business opportunities between private and institutional investors, investment funds, service providers, and business owners seeking to support their company’s development. Benefit from a special fee thanks to Preqin.
IPEM 2018

22ND FEBRUARY 2018 | WARSAW
Contact us [email protected]+351 211 335 966
or visit us atpe-conference.org/polish/
Register now and get 30% Discount!
90+LPs
250+ Attendees
120+ GPs
50+ Speakers
70+ CxOS
December 3-5, 2017 | The Venetian | Las Vegas NV
• Chairperson: Ryan Ponsford, Principal, Akili Capital• Karim Ahamed, Partner, HPM Enterprises LLC • Bill Cafero, Founder and Principal, RCL Advisors • Susan R. Schoenfeld, CEO and Founder, Wealth Legacy
Advisors LLC • John M. Simms, Jr, PhD, CFA, Chief Investment Officer,
Piedmont Trust • Casey Wamsley, Director, Collins Capital LLC
PRIVATE WEALTH MANAGEMENT SUMMIT
The Private Wealth Management Summit is the premium forum bringing leaders from America’s leading single and multi-family offices and service providers together. As an invitation-only event, the summit offers service providers and high-level executives from single and multi-family offices an intimate environment for a focused discussion of key new drivers shaping the future of the industry. The Summit will allow attendees to benefit from visionary keynote presentations, real-life case studies and interactive sessions! You will also have the chance to network during coffee breaks, lunch hours and cocktails, all this in a five star resort!• Pre-schedule one on one business meetings with qualified buyers • Engage in dynamic benchmarking sessions and interact with nationally
recognized leaders• Grow sales faster through a time efficient format• Network with high level executives in a luxurious and stimulating environment
FOR MORE INFORMATION, PLEASE CONTACT DEBORAH SACAL:[email protected] or visit: http://events.marcusevans-events.com/private-wealth-summit/
NETWORK WITH INDUSTRY EXPERTS LIKE:
• Managing Trustee Risk Effectively • Tax Reform – How it Will Impact Family Offices• Family Governance, Communication and Trust• Taking Family Communication to the next level • Asset Allocation – From a Traditional to an Innovative Approach• How Family Offices are Making Right Long-Term Investment Decisions
KEY TOPICS TO BE DISCUSSED INCLUDE:
Great things in business are never done by one person. They’re done by a team of people.Steve Jobs