private schooling in the u.s.: expenditures, supply, and …€¦ · ·...
TRANSCRIPT

Private Schooling in the U.S.: Expenditures, Supply,
and Policy Implications
Bruce D. Baker
Rutgers University
July 2009
Education Policy Research Unit Division of Educational Leadership and Policy Studies
College of Education, Arizona State University P.O. Box 872411, Tempe, AZ 85287-2411
Telephone: (480) 965-1886 Fax: (480) 965-0303 E-mail: [email protected] http://edpolicylab.org
Education and the Public Interest Center School of Education, University of Colorado Boulder, CO 80309-0249 Telephone: (303) 447-EPIC
Fax: (303) 492-7090 Email: [email protected]
http://epicpolicy.org
● Suggested Citation: Baker, B. (2009). Private schooling in the U.S.: Expenditures, supply, and policy implications.
Boulder and Tempe: Education and the Public Interest Center & Education Policy Research Unit. Retrieved [date] from http://epicpolicy.org/publication/private-schooling-US

Kevin Welner: Editor
Patricia H. Hinchey: Academic Editor
Erik Gunn: Managing Editor
One of a series of Policy Briefs made possible in part by funding
from the Great Lakes Center for Education Research and Practice.
EPIC/EPRU policy briefs are peer reviewed by members of the
Editorial Review Board. For information on the board and its
members, visit: http://epicpolicy.org/editorial-board

http://epicpolicy.org/publication/private-schooling-us Page 1 of 51
Private Schooling in the U.S.: Expenditures, Supply, and Policy Implications
Bruce D. Baker
Rutgers University
Executive Summary
This report provides a first-of-its-kind descriptive summary of private school expenditures. It includes comparisons of expenditures among different types and affiliations of private schools, and it also compares those expenditures with public school expenditures for districts in the same state and labor market. Results indicate that (1) the less-regulated private school sector is more varied in many key features (teacher attributes, pay and school expenditures) than the more highly regulated public schooling sector; (2) these private school variations align and are largely explained by affiliation—primarily religious affiliation—alone; and (3) a ranking of school sectors by average spending correlates well with a ranking of those sectors by average standardized test scores. Public schools spend, in dollars adjusted for both region and inflation, more than Christian Association Schools (CAS) and Catholic schools, but less than Hebrew or independent day schools: nearly $15,000 per pupil for independent schools, over $12,000 for Hebrew schools, $7,743 for Catholic schools, and approximately $5,727 for CAS. For public schools, the comparable average spending figure was $8,402. These spending variations were associated with not just test scores; they also reflected differences in salaries, pupil-to-teacher ratios and teacher undergraduate preparation. The variations also have clear implications for voucher programs, since current voucher policies are funded at amounts that cover costs at only a select subset of private schools. They essentially push students into Christian Association and Catholic schools, pricing out independent (non-religious) schools and Hebrew schools. The report is based largely on annual IRS filings as reported in Guidestar—a national database and information service on non-profit organizations. Schools included in the analysis serve nearly 33% of all children attending Christian Association Schools in the 24 states studied, and 75% of children attending independent day schools in those states. Total per-pupil spending was compared with total per-pupil spending for public school districts in the same labor market and same city, with an adjustment for regional variation in wages. The analyses focused on approximately 1,500 private schools, examining IRS tax returns as well as data from the 2003-04 National Center for Education Statistics’
http://epicpolicy.org/publication/private-schooling-us Page 2 of 51
School and Staffing Survey, which allowed for analyses of private schools’ salary structure, teacher attributes, class sizes and tuition rates by affiliation and region. Specific factors include teacher age, teacher undergraduate institution competitiveness, teacher salary, pupil to teacher ratio, tuition rates, location and institutional affiliation. Recommendations
• While there may be lessons that public schools can learn from private schools, those lessons are most likely learned from exploring specific subsets of the private school sector rather than attempting to aggregate that sector into a single or limited set of alternatives. Past studies have done a disservice in this regard. Regarding spending in particular, policy makers should understand that spending varies widely across private schools, especially by the affiliation of those schools. As this report shows, those spending differences show a positive association with differences in pupil-to-teacher ratios and teacher salaries, and with substantive differences in the measurable qualities of teachers. In most cases, those spending differences are also positively associated with differences in outcomes reported in other studies. Private schools are substantially less regulated than public schools, so it is not surprising that their spending, class sizes and teacher qualifications vary more than public schools.
• Policy makers should also be sure to consider differences between actual private school spending and the tuition they charge, since various other sources of revenue make the former often much greater than the latter. Policy makers should make every attempt to better understand the spending behavior of private schools in relation to the spending behavior of public schools, rather than making inappropriate comparisons between private school tuition and public school spending.
• Policy makers who pursue voucher policies should better understand the spending behavior of private schools, in order to set voucher levels that will encourage greater participation among private providers. Currently, many potential private providers would have to scramble to raise additional contributions to offset voucher shortfalls. Although this recommendation would likely add considerable public cost to voucher programs, private schools can no more escape detrimental effects of underfunded voucher programs than public schools can escape such effects from comparable underfunding.
• On a related note, this report shows that spending levels among private schools vary widely, with this variation associated strongly with the schools’ religious affiliation. Accordingly, policymakers should attempt to set voucher levels that will encourage comparable rates of participation among private non-religious schools as private religious schools. In some regions such as the south, private independent day schools are among the largest providers of private education. But bringing these schools into voucher programs without requiring them to seek a substantial additional private subsidy may require voucher levels as high as twice the spending in nearby public schools.
http://epicpolicy.org/publication/private-schooling-us Page 3 of 51
• With regard to the legal requirement that voucher programs be neutral with regard to religion, courts should also consider the relationship between voucher levels and the distribution of per-pupil spending among potential private providers. That is, courts should consider whether voucher levels are set in ways that effectively exclude some or all potential non-religious providers?
• Finally, regarding future data collection, the National Center for Education Statistics should consider the option of linking its biennial collection of student enrollment and basic institutional characteristics (Private School Universe Survey) with data on revenues, expenditures and executive compensation provided through Guidestar or some other source for aggregating IRS filings from private schools. Regular updating of the information presented in this report is required in order to provide relevant ongoing support for policy deliberations involving private schools. A problem with current references to data on private schools is that they are often outdated, referring to ballpark estimates from ten years back. The availability of electronically compiled annual tax returns through vehicles like Guidestar, coupled with the availability of the NCES Private School Survey, makes relatively frequent updating feasible.
http://epicpolicy.org/publication/private-schooling-us Page 4 of 51
Private Schooling in the U.S.: Expenditures, Supply, and Policy Implications
Bruce D. Baker
Rutgers University
Introduction
Based on a recent survey, Howell and West noted in 2008 that “Americans have a very poor understanding of public school spending and teacher salaries.” Survey respondents invariably underestimated current spending levels in those areas, and on average they also believed that their public schools spent $4,231 per pupil when in fact they spent $10,353.1 Public understanding remains limited despite increased accountability and annual reporting of financial statistics and student outcomes in public schools.
Yet even less is known or understood regarding expenditures or costs of private schools. While access to financial data on public schools is available from such commonly used web-based data sources as School Data Direct, there are no similar public financial data sources for private schools. The National Center for Education Statistics (NCES) does biennially compile information on enrollments, grade levels and locations of private schools, but the data do not include expenditures or salaries.
One implication of this information gap on private school spending is that it allows political pundits and popular media to offer deceptively simple statements to the effect that private schools perform better at lower cost than public schools. To some extent, this assertion is contradicted by Lubienski and Lubienski (2006) and other studies that have more carefully explored performance comparisons across public and private schools, suggesting that the performance advantage disappears once the researchers control for student characteristics.2 But there is even more to the story. Research conducted for this report turned up no thorough evaluations of private school costs, outside of surveys of private school tuition levels in select cities conducted by advocacy-oriented think tanks.3 Further, there exist no evaluations of mis-estimation by the public and media of private school costs, comparable to that on public school spending by Howell and West.4 Moreover, with only half of the cost/effectiveness ratio defined, no true comparison of public and private school cost can be made.
Goals of this Report
The primary objective of this report is to provide a first-of-its-kind descriptive summary of private school expenditures, to compare those expenditures with public school expenditures for public school districts in the same state and labor market, and to determine the extent to which private school expenditures vary by private school type or affiliation. The report’s secondary

http://epicpolicy.org/publication/private-schooling-us Page 5 of 51
objective is to explore underlying differences in staffing salaries, administrative expenses, and pupil to teacher ratios that may explain differences in total expenditures per pupil. The intent was to compile a universe of private school financial data based on annual IRS filings as reported in Guidestar (www.guidestar.org)—a national database and information service on non-profit organizations.
Using multiple data sources, this report begins by providing a statistical sketch of private schooling in the U.S., describing the numbers of children in private schools and the various types of private schools across states, regions, and specific metropolitan areas. It then explores the total expenditures per pupil of private schools by their affiliations and locations.
A brief note on terminology may be helpful here. Many studies and reports speak of “costs” of private versus public schooling. Usually, those studies then point to “tuition” as a measure of cost. In fact, tuition is a measure of “price” of the product of given quality, to consumers, where that price is subsidized (lower due to some other source covering a portion of production cost)—much like the price of many agricultural goods in the U.S. Cost is the total cost of producing a given level of student outcomes, or the total amount of resources expended in order to produce a given level of outcomes. If we measure only spending and not the outcome achieved with that spending, we are not technically measuring costs, but rather measuring spending alone. That is essentially what is being done in this report. This is a report on expenditures, whereas previous reports on private schools have most often addressed price (tuition), where price is less than expenditures due to subsidy.
This statistical outline is based on two major data sources. The first is the U.S. Census Bureau’s American Community Surveys of 2005 to 2007, from which the report derives summaries of overall enrollments in private schools over time. This information is useful in clarifying the magnitude of private schooling as a general public policy concern. The second is the NCES Private School Universe Survey, which provides detail on the supply of private schools by region, affiliation, total enrollments, and enrollment shares. This detail clarifies the extent to which the financial data used in later sections are representative of private schooling by affiliation and region.
One major shortcoming of much private school research is the tendency to aggregate significantly different institutions into oversimplified classification schemes. Private schools are often placed into a Catholic / Other Religious / Non-Sectarian typology, or perhaps Catholic / Conservative Christian / Other Religious / Non-sectarian.5 However, such reports rarely attempt to clarify which students and how many students are actually represented by each classification or how some school types may be rendered invisible by them. For example, one very substantial group of private schools that loses its identity in most research on private schools is formally self-identified as “Independent Schools.” While aggregate classifications allow researchers to achieve sufficient sample sizes, they can also obscure important differences. One goal of this study is to reveal, to the extent possible, the differences among private schools by more fine-grained classifications.
http://epicpolicy.org/publication/private-schooling-us Page 6 of 51
Accordingly, the heart of this report is an analysis of the 2006-07 annual operating expenditures, based on the Internal Revenue Service Form 990 (IRS 990) filings of over 1,500 private schools across 24 states. Supplemental data for this analysis include information on teacher salaries and reported tuition levels from the 2003-04 private-school component of the NCES Schools and Staffing Survey.
Related Literature Questions regarding the relative cost and effectiveness of private and
public schooling have garnered substantial attention in research literature for decades. Ballpark figures and urban legends, however, have generally substituted for rigorous analysis of private school costs and expenditures, which remains sparse to non-existent. What is known about cost is summarized in the first segment below, presented in the context of an abbreviated summary of recent evidence on private versus public school performance, often as part of voucher research. This is included due to the attention frequently paid to the relationship between resources and performance outcomes.
Further, too little attention has thus far been focused on teacher characteristics and pay in public and private schools, outside of a handful of analyses using data from the NCES Schools and Staffing Survey.6 The final section of this literature review presents a brief discussion of recent work concerning differences in characteristics of teachers in public, charter and private schools.
Private School Spending, Tuition, and Vouchers
Most often, private school “costs” are addressed in popular media and think tank reports in the context of policy debates over tuition tax credit and voucher proposals. The typical argument is that providing private school tuition to move students out of public schools is less expensive than paying the cost per pupil in public schools—and that students will get a better education in private schools as well. In the best of cases, authors of such reports provide reasonable, publicly reported estimates of public school expenditures—because such data are readily available—and then choose estimates of private school “costs” (see discussion below of this cost issue) from a handful of sources. Or they may simply propose a rough estimate.
In one recent example, Podgursky, Brodsky and Hauke explain how Missouri might use a tuition tax credit program to provide opportunities for children in failing urban public schools to attend private schools.7 The authors explain that public school spending in the urban core districts is on the order of $10,000 to $12,000 per pupil and that tuition tax credits could be used to raise funds to provide vouchers to urban public school students at a per-pupil level of $5,000, yielding a 50% savings rate for each child who opts out of the public schools and takes the voucher. (Any such savings would, of course, be offset by the cost of each student who uses the voucher and would have attended private

http://epicpolicy.org/publication/private-schooling-us Page 7 of 51
school even in its absence.) To support their argument that the $5,000 voucher is sufficient to pay for private schooling, Podgursky and colleagues note: “we assume that average private school tuition is $4,000 per year, in line with estimates of the national average.”8 The authors footnote this assertion as follows:
For example, the U.S. Department of Education’s National Center for Education Statistics reports in Table 59 of the 2005 Digest of Education Statistics that the average national cost of elementary/secondary private school tuition is $4,689 per year. In addition, a well-cited 2003 Cato Institute study found that the average elementary tuition cost was less than $3,500 per year by looking at private schools in several major U.S. metropolitan areas. See Salisbury, David F. “What Does a Voucher Buy? A Closer Look at the Cost of Private Schools,” The Cato Institute, Policy Analysis, No. 486, August 2003. [Emphasis added]. That is, the authors posit that the 2008 average private school tuition in
Missouri major metropolitan areas is somewhat less than the average impartially (NCES) reported average national tuition in 2004, and similar to the average elementary-level tuition reported in a Cato Institute survey of 2002-03 tuition levels in select cities nationally.
Indeed there are no easily accessible estimates of actual private school costs in St. Louis or Kansas City, Missouri. That said, the choice to recognize a voucher level of $4,000 to $5,000 as sufficient subsidy based on the cited information is problematic at best. The use in a 2008 policy brief in Missouri of the $3,500 (Cato, 2002-03) and $4,000 (NCES, 2005) figures assumes these figures to be both (a) timeless, not subject to inflation and (b) and spaceless, insensitive to regional price variation, if these figures were accurate to begin with. As explained below, these are two deeply flawed assumptions.
The only reference to a national average tuition of $3,500 in the Cato report comes from the report’s abstract, which cites NCES data from 1999-00 rather than the report’s own survey findings from 2002-03: “Government figures indicate that the average private elementary school tuition in the United States is less than $3,500 and the average private secondary school tuition is $6,052” 9 (emphasis added). Yet this $3,500 average national tuition figure (at the elementary level) has taken on almost mythical status in political and media circles and think tank reports; notably, the higher secondary tuition level is rarely mentioned.
At the time of the Podgursky brief, even if the $3,500 Cato figure had been representative of Missouri urban private school tuition, that figure was already nine years old. Between 1997 and 2005 (the last year currently available), the National Center for Education Statistics Education Comparable Wage Index shows 37.6% growth in competitive wages for the state of Missouri. If competitive wages grew similarly from 2005 to 2007, this would lead to an average tuition of over $4,800 by 2007, within the ballpark estimate of $4,000 to $5,000. But beyond inflation, the NCES Education Comparable Wage Index
http://epicpolicy.org/publication/private-schooling-us Page 8 of 51
reflects that both the Kansas City and St. Louis labor markets have higher than national average labor costs, which can also be expected to affect private school tuition. No attempt is made to correct for regional variation or identify tuition levels in Missouri urban private schools. In simple terms, dollar values are neither spaceless nor timeless.
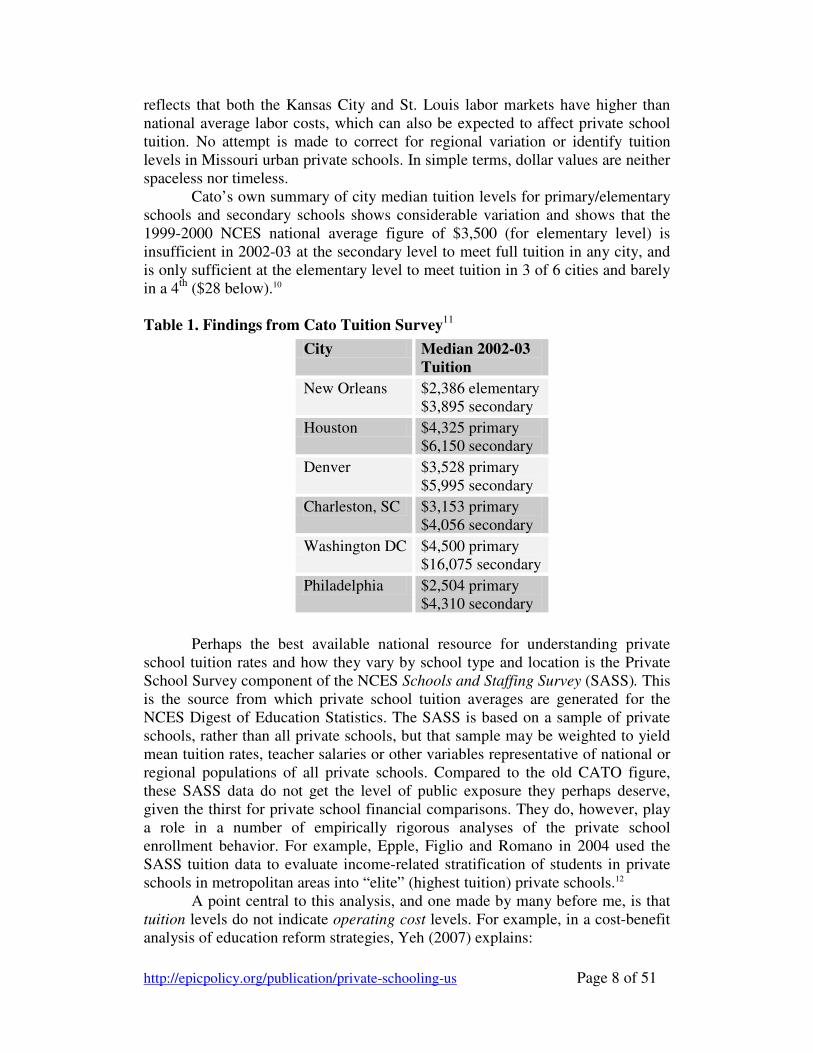
Cato’s own summary of city median tuition levels for primary/elementary schools and secondary schools shows considerable variation and shows that the 1999-2000 NCES national average figure of $3,500 (for elementary level) is insufficient in 2002-03 at the secondary level to meet full tuition in any city, and is only sufficient at the elementary level to meet tuition in 3 of 6 cities and barely in a 4th ($28 below).10
Table 1. Findings from Cato Tuition Survey11
City Median 2002-03 Tuition
New Orleans $2,386 elementary $3,895 secondary
Houston $4,325 primary $6,150 secondary
Denver $3,528 primary $5,995 secondary
Charleston, SC $3,153 primary $4,056 secondary
Washington DC $4,500 primary $16,075 secondary
Philadelphia $2,504 primary $4,310 secondary
Perhaps the best available national resource for understanding private school tuition rates and how they vary by school type and location is the Private School Survey component of the NCES Schools and Staffing Survey (SASS). This is the source from which private school tuition averages are generated for the NCES Digest of Education Statistics. The SASS is based on a sample of private schools, rather than all private schools, but that sample may be weighted to yield mean tuition rates, teacher salaries or other variables representative of national or regional populations of all private schools. Compared to the old CATO figure, these SASS data do not get the level of public exposure they perhaps deserve, given the thirst for private school financial comparisons. They do, however, play a role in a number of empirically rigorous analyses of the private school enrollment behavior. For example, Epple, Figlio and Romano in 2004 used the SASS tuition data to evaluate income-related stratification of students in private schools in metropolitan areas into “elite” (highest tuition) private schools.12
A point central to this analysis, and one made by many before me, is that tuition levels do not indicate operating cost levels. For example, in a cost-benefit analysis of education reform strategies, Yeh (2007) explains:

http://epicpolicy.org/publication/private-schooling-us Page 9 of 51
The real social cost of educating large numbers of students in private schools (who are currently educated in public schools) is difficult to estimate for several reasons: Private school tuition figures exclude costs that are offset by corporate and noncorporate subsidies (U.S. General Accounting Office, 2001), as well as the cost of services that would be required by many students (and, by law, are currently provided by public schools, but not private schools), including transportation, free and reduced-price meals, special education, vocational education, and services for students with disabilities and limited English proficiency (Belfield, 2006; Levin, 1998; Levin & Driver, 1997).13 Similarly, in an analysis of the effects of private and charter school
competition on the teaching profession, Hoxby (2002)—while providing no citation for the ballpark figures she chooses—notes:
For instance, in some metropolitan areas, up to 15 percent of the elementary student population is enrolled in private schools where tuition is about two-thirds of the schools’ per-pupil expenditure. (Typical amounts for schools with religious affiliation would be tuition of about $1,600 and expenditure of about $2,300 dollars).14 Cohen-Zada and Justman (2002) embed the assumption of high rates of
subsidy into models of demand for religious and non-religious private schooling, noting:
Empirical evidence suggests that tuition at parochial schools may be subsidized by as much as 50%, through private donations, institutional support from the church and reduced salaries paid to teachers in religious orders, though this may be partially offset if parents are expected to supplement tuition with contributions of money or time that raise the cost of schooling. (p. 25)15 Yet others stand stubbornly in denial that there exists any problem in using
tuition data to represent operating costs for private schooling. Wenders (2005) says, for example,
One can also get some additional insight on the comparative costs of private and public schools by looking at the quoted tuition charged by private schools. For obvious reasons, quoted private school tuitions necessarily have a somewhat loose connection with costs. They are usually supplemented by endowments, contributions, fundraising events, in-kind contributions by parents, and below-cost wages for religious teachers and other staff. Yet, clearly these do not account for much of the observed difference
http://epicpolicy.org/publication/private-schooling-us Page 10 of 51
between private tuition and public school costs.16 [Emphasis added.] The last claim, while unfounded, is not easily refuted by existing data. It makes a significant difference whether tuition reasonably represents
costs, or whether the size of margin between tuition and costs is 1% or 20%. For example, a group of church-subsidized private schools might charge $3,500 per child in tuition but actually operate at a cost of $7,000 per pupil. When students come from the church community, parents pay tuition per child and likely also offer a tithing, along with non-parent parishioners, in amounts that we can presume are cumulatively equal to or greater than the difference between tuition and cost.
However, if policymakers wanted to send 100 additional children from the public system to the church schools on vouchers matched to the full tuition of $3,500, and if actual operating costs were $7,000 per pupil, then someone would have to contribute an additional $350,000 to cover the tuition shortfall. (Of course, taxpayers already help to pay this amount, in the form of income tax deductions for contributions to religious organizations,) If the incoming students from the public voucher system were both poor and non-parishioners, it is unlikely that their families would provide the additional resources. The larger the desired voucher system and the more students participating, the larger the required additional philanthropy.
To its credit, the 2003 Cato report is one of the only existing attempts to compile information on private school tuition rates for a multitude of schools in specific metropolitan areas (including New Orleans; Houston; Denver; Charleston, S.C.; Washington, D.C.; and Philadelphia). Cato surveyed several hundred religious private schools, primarily Catholic, and gathered 2002-03 tuition data. Researchers concluded that a voucher level of $5,000 would give students access to (inferring a healthy subsidy nearing, at or exceeding full tuition) most private schools in the cities surveyed and that “Since average per-pupil spending for public schools is now $8,830, most states could offer a voucher amount even greater than $5,000 and still realize substantial savings.”17
The Cato report, however, suffers from the central problem of asserting that private schools can take on additional students at then-existing tuition levels and subsidize the difference via philanthropy. As set forth in greater detail below, a comparison of 2006 private school per-pupil spending (based on a selective review of IRS 990 financial statements) and private school tuition levels (based on a list in the Cato report appendix) reveals the following:
• Riverside Academy (New Orleans) reported tuition of $2,385 to $2,790 to Cato; in 2006, it spent $3,857,985 on 528 students, or $7,307 per pupil.
• Northland Christian (Houston) reported tuition of $8,300, but per-pupil spending of $8,467. Here, tuition is closer to spending, but it is relatively high on the Cato list for the city.
• Galloway (Houston) reported tuition of $5,960, but spending of $8,431.
• Westbury Christian (Houston) reported $4,450 tuition, but spending of $7,059.

http://epicpolicy.org/publication/private-schooling-us Page 11 of 51
• Friends Select (Philadelphia) reported tuition ranging from $14,255 to $16,070, but spending of $20,161.
• City Center Academy (Philadelphia) reported tuition of $3,800 but spending of over $10,000; it serves only about 75 students.
The above examples raise some serious red flags, but they may be non-
randomly selected and tell an insufficient and potentially biased story. Hence the need for large-scale analysis as presented herein.
Private school vouchers are commonly recommended or applied at levels ranging from under $3,000 to just over $6,000; rarely higher. Podgursky (2008) and Aud (2007) mention programs such as the following: Arizona tuition tax credit programs, offering $4,200 to $5,000 vouchers; Florida’s A+ vouchers, averaging $4,063 in 2005-06; Cleveland’s voucher program, offering $2,686 vouchers in 2004-05; and the Milwaukee voucher program, offering $6,351 vouchers in 2005-06. Pro-voucher pundits argue that these voucher levels are sufficient, based on the well-accepted, though wildly inaccurate, belief that private school tuition is approximately $3,500 to $4,000 per child.18
Problems with undersubsidized vouchers are illustrated by a 2008 policy brief on saving Catholic schooling in urban America:
In Milwaukee, the city with the nation’s largest publicly funded school voucher program, enrollment is still declining in many inner-city Catholic schools. In Washington, D.C., despite federally funded vouchers for the tuition of poor, mostly non-Catholic inner city children, the Church is turning seven schools into public charters—which will be well funded, but non-religious.19 Recall that the voucher level in Milwaukee is actually much higher than
other existing publicly financed voucher policies ($6,351). Yet even at this level, the voucher is insufficient for propping up the urban Catholic schools.
Other research suggests that even this higher level of funding provided under the Milwaukee voucher program (relative to other voucher programs) is inadequate to financially sustain many private providers.20
Recognizing the shortfall between voucher value and actual cost, Hamilton, Finn and Petrilli (2008) suggest that the primary strategy for saving urban Catholic schools—short of converting them to charter schools—should be to dramatically scale up philanthropy among church parishioners and to refocus Catholic schooling on children of parishioners. Where subsidies fail to cover costs, philanthropy must fill the gap, since costs cannot realistically be reduced sufficiently to match the voucher subsidy.21
The bottom line is that when vouchers cover only tuition rates or portions of tuition rates, someone must dig deep to ensure that service providers can survive. Alternatively, to reduce the additional philanthropy requirement, policymakers must first have more accurate information on the actual costs of providing private schooling rather than dated information on average tuition rates.

http://epicpolicy.org/publication/private-schooling-us Page 12 of 51
Then, they must find public support to generate sufficient tax revenues to meet actual costs rather than partial or full tuition.
Private School Outcomes
While little attention has been paid to estimating the relative costs of providing private education, a substantial amount of attention has been paid to evaluating the relative outcomes of children attending private and public schools. Historically, studies of outcomes have been largely motivated by the interest in using private schools as a vehicle for serving the public good.
Patrick McEwan (2000) provides one of the more comprehensive reviews and critiques of literature on experimental and non-experimental comparisons of student performance in public and private schools, including studies of students using vouchers. McEwan concludes:
Based on recent experimental evidence … Catholic elementary schools have modest [positive] effects on the mathematics achievement of poor, minority students in grades 2-5 (but not in grades 6-8 or among non-black students). The evidence on elementary reading achievement does not show consistent effects on achievement. The evidence on attainment is strikingly consistent, indicating that Catholic schools increase the probability of high school completion and college attendance, particularly for minorities in urban areas.22
A 2001 research brief from the RAND Corporation titled “What Do We Know about Vouchers and Charter Schools? Separating the Rhetoric from the Reality,”23 also based on a review of existing literature, similarly concluded that:
Small experimental, privately funded voucher programs suggest that African-American students may receive a modest achievement benefit after one or two years in the programs. The exact reasons for this benefit, however, remain unknown. Children of other racial groups in voucher schools have shown no consistent evidence of academic benefit or harm. Thus, research does suggest some benefits, for one subgroup of children,
for private school attendance. But that same research shows any such benefits to be very modest.
Choice advocates also frequently assume a benefit not only for the students who choose private or charter schools, but also for the students who remain in conventional public schools, via competitive pressures. In a review of 41 separate studies of the effects of competition on educational outcomes, Levin and Belfield find: “A sizable majority of these studies report beneficial effects of competition across all outcomes, with many reporting statistically significant correlations.”24 Belfield and Levin ultimately conclude: “the effects of competition on educational outcomes appear to be substantially modest.”25 In

http://epicpolicy.org/publication/private-schooling-us Page 13 of 51
addition, through a series of general equilibrium model simulations, Thomas Nechyba (2003) finds that modest levels of school vouchers may increase overall school quality and reduce variance in quality.26 There is, then, some evidence that competition does foster school improvement. Other evidence, however, suggests that competitive pressures lead to unintended and sometimes negative consequences.27
Other recent studies have explored differences in student achievement on the National Assessment of Educational Progress (NAEP) between public and private schools generally, and among specific private school types. Lubienski and Lubienski find:
• Public schools significantly out-scored Catholic schools (by over 7 points in fourth grade, and almost 4 points in grade 8).
• Of all private school types studied, Lutheran schools performed the best. Fourth-grade scores in Lutheran schools were roughly 4 points lower than in comparable public schools, but were (a statistically insignificant) 1 point higher at the eighth grade.
• The fastest growing segment of the private school sector, conservative Christian schools, were also the lowest performing, trailing public schools by more than 10 points at grades 4 and 8.28
These findings are important because they provide insights into specific
performance differences by students in schools of more precise affiliation classifications.29 That is, the Lubienski and Lubienski analyses provide the most direct comparisons by religious affiliation of the “benefit” side of the cost-benefit issues discussed here.
Exploring other outcomes, there is some evidence that children in Catholic schools may outperform their public school peers on civic participation.30 And while there appears to be some evidence that for otherwise comparable economically disadvantaged students, urban Catholic schools may increase educational attainment,31 more mixed and negative results appear in national assessments between a sampling of a broad range of Catholic school students and public school students.
Teachers in Private Schools
Limited evidence is available, primarily from the NCES Schools and Staffing Surveys, on teacher characteristics in private schools. The Schools and Staffing Surveys are also the source of reported tuition levels of private schools. On roughly five-year cycles, NCES has conducted extensive surveys of public, charter and private schools and their teachers. Using that information, Baker and Dickerson (2006) have summarized the characteristics of public, charter and private school teachers (see Table 2).32
That table suggests interesting connections to the 2006 findings of Lubienski and Lubienski.33 Teachers in Catholic schools are most similar to teachers in traditional public schools, having attended similar colleges (by

http://epicpolicy.org/publication/private-schooling-us Page 14 of 51
undergraduate competitiveness rating) and having the highest rates of certification in their main teaching fields. Teachers in CAS, which performed poorly in the Lubienski analyses, are most likely to have attended the least competitive colleges, are least likely to have attended the most competitive colleges and are relatively unlikely to be certified in their main field. (Teachers in private independent schools are most different from public school teachers in all these categories, but those schools were not disaggregated in the Lubienski performance comparisons).34 Table 2. Percentage of teachers who attended the highest and lowest categories of undergraduate colleges (competitiveness), and percent certified in main teaching field35
AFFILIATION Sample Size
Percent Bottom Two Categories
Percent Top Two Categories
Percent Certified in Main Field
Independent (NAIS/NIPSA) 495 4.81 34.72 40.62
Lutheran 696 12.04 3.84 64.42
Catholic 2,072 23.08 7.43 74.01
Conservative Christian 603 24.54 3.91 56.25
Conventional Public 36,000 23.71 8.00 94.73
Source: Schools and Staffing Survey of 1999
For a thorough discussion of personnel policy differences between charter,
public and private schools, see Podgursky (2004), who uses the Schools and Staffing Survey of 1999 to compare hiring, salary, and dismissal practices. Although more private than public schools said they reward teaching excellence through salaries, fewer private schools said they pay premiums for hard-to-staff positions; additionally, 66% of private schools rely on a salary schedule, a significantly smaller percentage than the public sector, where 96% use salary schedules.36
Discussion
In this report, I make no attempt to resolve the general question of whether private schools are more or less effective than public schools, an issue where research may rely on a variety of outcome measures and may involve a variety of student populations. Rather, I deal exclusively with the other half of the cost/effectiveness ratio: costs. If private schools do in fact spend much less than public schools in the same labor market, it may be reasonable to assert that private schools on average are more cost-effective, assuming comparable students and outcomes. However, it is also possible that private schools may spend more for the same outcomes, more for higher outcomes, or less for lower outcomes.
More likely, different types of private schools spend very different amounts, with spending differences relating to other differences: in student outcomes, as Lubienski and Lubienski (2006) found, and in teacher characteristics, as Baker and Dickerson (2006) found. The following analyses follow the lead of the Lubienskis and disaggregate various types of private schools whenever possible, also identifying the relative balance of private school
http://epicpolicy.org/publication/private-schooling-us Page 15 of 51
types by location. Private schools vary widely, probably more widely than public schools simply because they are less regulated.
This report is a first attempt at a large-scale descriptive analysis of what private schools actually spend per enrolled student, and of how those expenditures vary by private school type, presenting distinctions among types based on the characteristics of institutional affiliation, school size, grade range and location. Further, this report attempts to make direct comparisons between private school expenditures, by institutional type and location, and public school expenditures in the same locations. The information presented here should help move discussions away from the continued use of the now mythical and timeless national average tuition figures of some $3,500 or $4,000, figures that have long misguided national and local debates.
Private Schools and Private School Enrollments In order to clarify the import of the following expenditure analyses, this
section provides an overview of private schools and private school enrollments in the United States. Data came from two major sources: (a) the U.S. Census Bureau’s Census 1980, 1990 and 2000, sample (1% of all children) of children between the ages of 6 and 17, and the U.S. Census Bureau’s American Community Surveys of 2005 to 2007; and (b) the NCES Private School Survey (2005-06). The first subsection summarizes private school enrollments over time and across locations in the U.S., using the various census data sources. The second summarizes the current supply and distribution of school types and enrollments among private schools using data from the 2005-06 NCES Private School Survey (PSS).
Evidence from the American Community Surveys 2005 to 2007
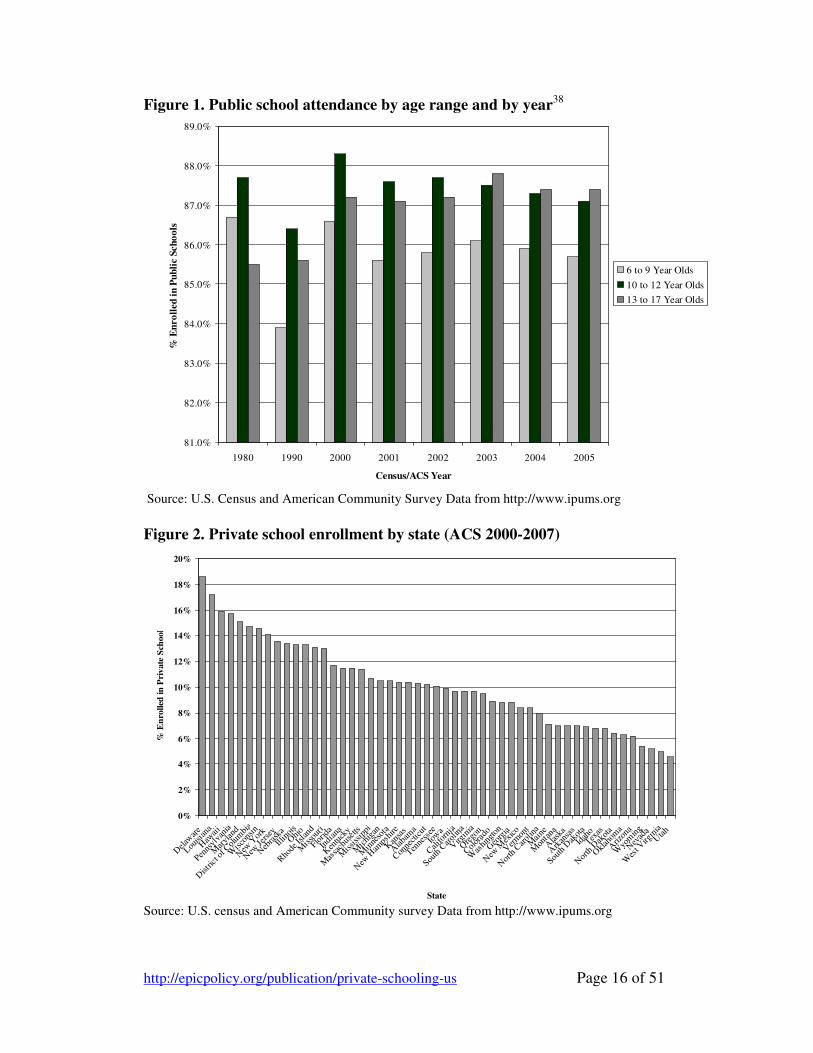
Figure 1 displays U.S. Census data on public school enrollments nationally by student age, where the remaining children are split between private schooling (the dominant portion) and home schooling. The 1990 data appear inconsistent with other years. Since 2000, public school enrollments of 10- to 12- year-olds appear to be declining slightly, while public school enrollments of 6- to 9-year-olds and 13- to 17-year-olds increased slightly, then declined. Over time, public school enrollments among 10- to 17-year-olds have held relatively constant, between 87% and 88% of all children. Even the 1990 census dip brought those levels only to 85% to 86%.37 Accordingly, the share of children in private schooling and home schooling in the aggregate has also remained relatively constant.
http://epicpolicy.org/publication/private-schooling-us Page 16 of 51
Figure 1. Public school attendance by age range and by year38
81.0%
82.0%
83.0%
84.0%
85.0%
86.0%
87.0%
88.0%
89.0%
1980 1990 2000 2001 2002 2003 2004 2005
Census/ACS Year
% E
nro
lled
in
Pu
bli
c S
cho
ols
6 to 9 Year Olds
10 to 12 Year Olds
13 to 17 Year Olds
Data Source: U.S. Census and American Community Survey Data from www.ipums.org
Source: U.S. Census and American Community Survey Data from http://www.ipums.org
Figure 2. Private school enrollment by state (ACS 2000-2007)
0%
2%
4%
6%
8%
10%
12%
14%
16%
18%
20%
Delaw
are
Louisi
ana
Haw
aii
Penns
ylva
nia
Mar
ylan
d
Dist
rict o
f Col
umbi
a
Wisco
nsin
New
Yor
k
New
Jer
sey
Neb
rask
a
Illin
ois
Ohi
o
Rho
de Is
land
Misso
uri
Florid
a
Indi
ana
Ken
tuck
y
Mas
sach
uset
ts
Mississ
ippi
Mic
higa
n
Min
neso
ta
New
Ham
pshi
re
Kan
sas
Alaba
ma
Con
nectic
ut
Tenne
ssee
Iow
a
Califo
rnia
South
Car
olin
a
Virg
inia
Ore
gon
Col
orad
o
Was
hing
ton
Geo
rgia
New
Mex
ico
Ver
mon
t
Nor
th C
arol
ina
Mai
ne
Mon
tana
Alask
a
Ark
ansa
s
South
Dak
ota
Idah
o
Texas
Nor
th D
akot
a
Okl
ahom
a
Ariz
ona
Wyo
min
g
Nev
ada
Wes
t Virg
inia
Utah
State
% E
nro
lled
in
Pri
vate
Sch
ool
Source: U.S. census and American Community survey Data from http://www.ipums.org

http://epicpolicy.org/publication/private-schooling-us Page 17 of 51
Yet, while the share of all children attending public schools has remained relatively constant over the past few decades, there exists significant state by state variation in the rate of children enrolled in private schools. Figure 2 (preceding) shows that based on Census and ACS data from 2000 to 2007, Delaware tops the list for private school enrollment at over 18% of 6- to 17-year-olds, while Utah is at the bottom of the list at under 5%.
As Figure 3 shows, among largest major metropolitan areas in 2000-2007, the Philadelphia area topped the list for rates of private school enrollment at over 20%, while Phoenix had the lowest rate, at just over 6%. This finding is somewhat intriguing given Arizona’s relatively generous tuition tax credit voucher policies.39
Figure 3. Private school enrollment by metro area—largest metro areas (ACS 2000 to 2007)
0%
5%
10%
15%
20%
25%
Ph
ilad
elp
hia
, P
A/N
J
New
Yo
rk-
No
rth
eas
tern
Ch
icag
o-G
ary
-Lak
e,
IL
Was
hin
gto
n,
DC
/MD
/VA
Bo
sto
n, M
A
Min
nea
po
lis-
St.
Pau
l,
Lo
s A
ng
eles
-Lo
ng
Bea
c
Det
roit
, MI
Ora
ng
e C
ou
nty
, CA
Atl
anta
, GA
Dal
las-
Fo
rt W
ort
h,
TX
Ho
ust
on
-Bra
zo
ria,
TX
Riv
ersi
de-S
an
Ber
nad
i
Ph
oen
ix, A
Z
Metro Area
% E
nro
lled
in
Pri
va
te S
ch
oo
l
Source: U.S. census and American Community survey Data from http://www.ipums.org
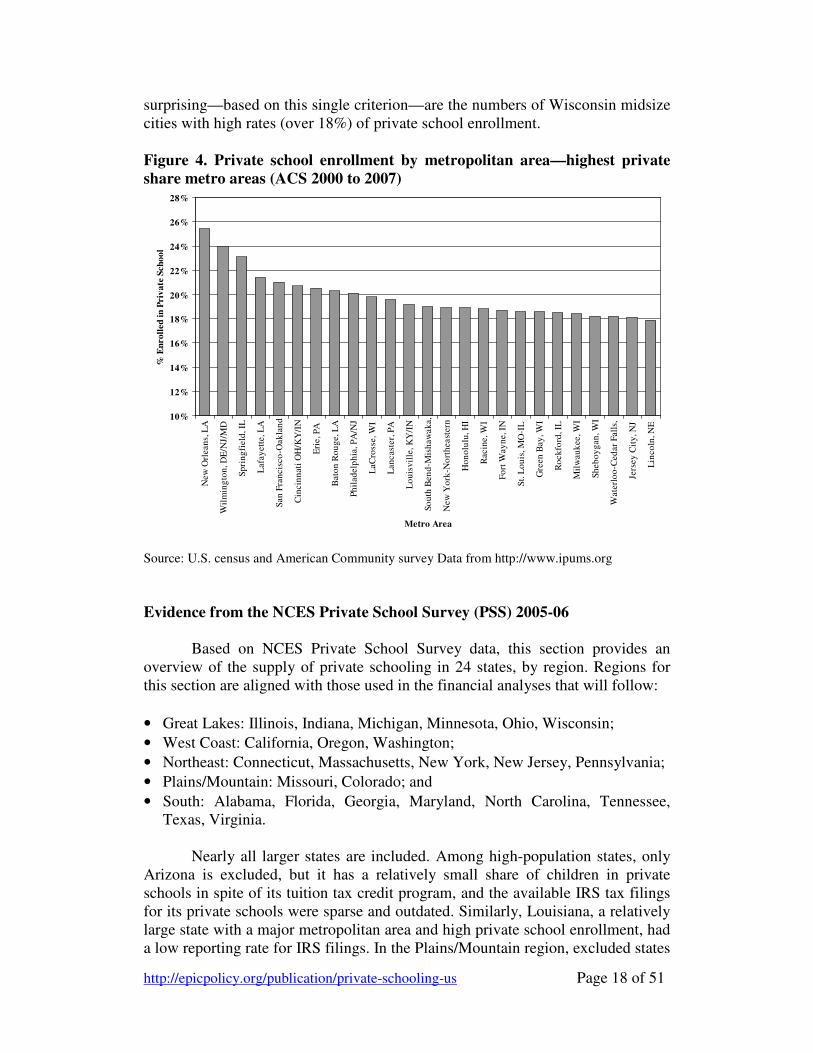
Figure 4 (following) lists private school enrollment rates for the 25
metropolitan areas with the highest rates. New Orleans and Wilmington, Del., topped the list. Forthcoming work by Baker (in press) finds that Delaware and Louisiana have among the lowest fiscal effort (lower percent of gross state product allocated to K-12 public schooling) and lowest spending (Louisiana in particular) for public schooling nationally. This may be partly explained by the states’ relatively high rate of opting out of the public system, or vice-versa: that is, it may lead to the undersupply of and reduced quality of public schooling inducing higher private school enrollments.40 Other expected findings in Figure 4, given the state level findings, are the relatively high levels of private school enrollment in regions of Pennsylvania and New Jersey and in Honolulu. More
http://epicpolicy.org/publication/private-schooling-us Page 18 of 51
surprising—based on this single criterion—are the numbers of Wisconsin midsize cities with high rates (over 18%) of private school enrollment.
Figure 4. Private school enrollment by metropolitan area—highest private share metro areas (ACS 2000 to 2007)
10%
12%
14%
16%
18%
20%
22%
24%
26%
28%N
ew O
rlea
ns,
LA
Wil
min
gto
n, D
E/N
J/M
D
Sp
rin
gfi
eld
, IL
Laf
ayet
te, L
A
San
Fra
nci
sco
-Oak
lan
d
Cin
cin
nat
i O
H/K
Y/I
N
Eri
e, P
A
Bat
on
Ro
ug
e, L
A
Ph
ilad
elp
hia
, PA
/NJ
LaC
ross
e, W
I
Lan
cas
ter,
PA
Lo
uis
vil
le, K
Y/I
N
So
uth
Ben
d-M
ish
awak
a,
New
Yo
rk-N
ort
hea
ster
n
Ho
no
lulu
, HI
Rac
ine,
WI
Fo
rt W
ayn
e, I
N
St.
Lo
uis
, M
O-I
L
Gre
en B
ay, W
I
Ro
ck
ford
, IL
Mil
wau
kee
, WI
Sh
ebo
yg
an, W
I
Wat
erlo
o-C
edar
Fal
ls,
Jers
ey C
ity
, NJ
Lin
coln
, NE
Metro Area
% E
nro
lled
in
Pri
va
te S
cho
ol
Source: U.S. census and American Community survey Data from http://www.ipums.org
Evidence from the NCES Private School Survey (PSS) 2005-06
Based on NCES Private School Survey data, this section provides an overview of the supply of private schooling in 24 states, by region. Regions for this section are aligned with those used in the financial analyses that will follow:
• Great Lakes: Illinois, Indiana, Michigan, Minnesota, Ohio, Wisconsin;
• West Coast: California, Oregon, Washington;
• Northeast: Connecticut, Massachusetts, New York, New Jersey, Pennsylvania;
• Plains/Mountain: Missouri, Colorado; and
• South: Alabama, Florida, Georgia, Maryland, North Carolina, Tennessee, Texas, Virginia.
Nearly all larger states are included. Among high-population states, only
Arizona is excluded, but it has a relatively small share of children in private schools in spite of its tuition tax credit program, and the available IRS tax filings for its private schools were sparse and outdated. Similarly, Louisiana, a relatively large state with a major metropolitan area and high private school enrollment, had a low reporting rate for IRS filings. In the Plains/Mountain region, excluded states

http://epicpolicy.org/publication/private-schooling-us Page 19 of 51
(Kansas, Utah, the Dakotas and Nebraska) have very few private schools. Only Missouri and Colorado in this region had significant numbers of schools reporting enrollment data to NCES and financial data available from Guidestar, the primary source for this study.
As noted earlier, private school research tends to aggregate unlike institutions into oversimplified classification schemes. This study specifically seeks to avoid that shortcoming by employing more finely grained classifications. Figure 5 introduces the classification scheme for the affiliation of private schools, based on each school’s primary affiliation in the NCES Private School Survey.
Figure 5. Total number of private schools by region and affiliation
0
200
400
600
800
1,000
1,200
1,400
1,600
1,800
Great Lakes North East Corridor Central South West Coast
Region
Nu
mb
er o
f S
chools
Other
Catholic
CAS
Independent
Other Religious
Montessori
Seventh Day
Episcopal
Lutheran
Hebrew/Jewish
Source: National Center for Education Statistics, Private School Universe Survey 2005-06
Note that there is some fuzziness to these categories because many schools
have multiple affiliations; only the primary affiliation is reflected here. Further, a school listed here as independent is a member of the National Association of Independent Schools (NAIS), the National Independent Private School Association (NIPSA) or a state independent private school association. Some are also members of private religious school associations, however, and some “independent schools” not formally affiliated with a church or religious organization are governed by religious boards of directors and maintain a religious mission. In short, identifying a secular and fiscally independent school versus a religious school is not as straightforward as it may seem.41 Generally, however, the independent schools in the database are non-sectarian, have no formal financial ties to a church, and report (by obligation) financial data to the IRS somewhat regularly.
http://epicpolicy.org/publication/private-schooling-us Page 20 of 51
Similar murkiness occurs with “Christian” schools, a classification used in recent NAEP studies. Here, “Christian” schools primarily are members of the Association of Christian Schools International and the American Association of Christian Schools (ACSI & AACS). Many Christian schools do not have direct financial ties to a specific church or religious organization, and (comparable to independent schools) report financial data to the IRS fairly regularly.
Although Catholic schools seem well defined and usually belong to the National Catholic Education Association (NCEA), there is some conflation in that category as well. Most Catholic elementary (K-8) schools are formally church-affiliated, but Catholic high schools are organized into two categories: diocesan high schools, which serve a particular region, and independent high schools, some of which may also be formally affiliated with an independent school organization. Financial data are generally unavailable for church-affiliated elementary and diocesan secondary schools. Therefore, the Catholic schools analyzed for this report—a relatively small sampling—are not necessarily representative of Catholic schools nation wide.
Despite such blurred boundaries, the analyses presented here offer considerable insight into the overall picture of private schools. In some categories, such as CAS and independent schools, a substantial share of schools did report financial data. Moreover, analyses of these categories indicate that schools reporting financial data had comparable class sizes to others in the category not reporting such information. General findings are therefore likely to be good approximations for all schools sharing an affiliation.
To avoid aggregations of unlike schools, only certain groups of schools are reported here for certain analyses. For example, when sample sizes are sufficient across a region, means are reported for fine-grained affiliations, including Montessori, Waldorf, Episcopal and Lutheran schools. However, some regions simply lack sufficient numbers of Hebrew/Jewish day schools,42 or Lutheran schools, to allow for confident estimates. As a result, one potential shortcoming of this report is that all affiliations are not accounted for in all analyses of all regions. Another gap is that lack of data made it impossible to adequately capture Catholic schooling spending. Findings do present a thorough expenditure analysis for two sizeable private school sectors, however: The CAS schools evaluated, which serve nearly 33% of children in CAS schools, and independent schools evaluated, which serve 75% of children in independent schools.
As noted, Figure 5 summarized the total number of schools, by affiliation and region, whether or not financial data were available for those schools. This is the “universe” of private schools from which financial filings were gathered. In the Great Lakes and Northeast regions, Catholic schools are the dominant providers of private education in terms of total number of schools, regardless of enrollment. Similarly, in terms of total numbers of schools, CAS (as narrowly defined for this analysis) are significant in the South and West. Unfortunately, clouding this analysis, one of the largest categories across the country is what I have labeled herein as “other”—a truly non-descript conglomeration of many
http://epicpolicy.org/publication/private-schooling-us Page 21 of 51
widely varied types of institutions, consisting primarily of institutions identifying themselves as “unaffiliated” or “other” in the NCES private school survey.43
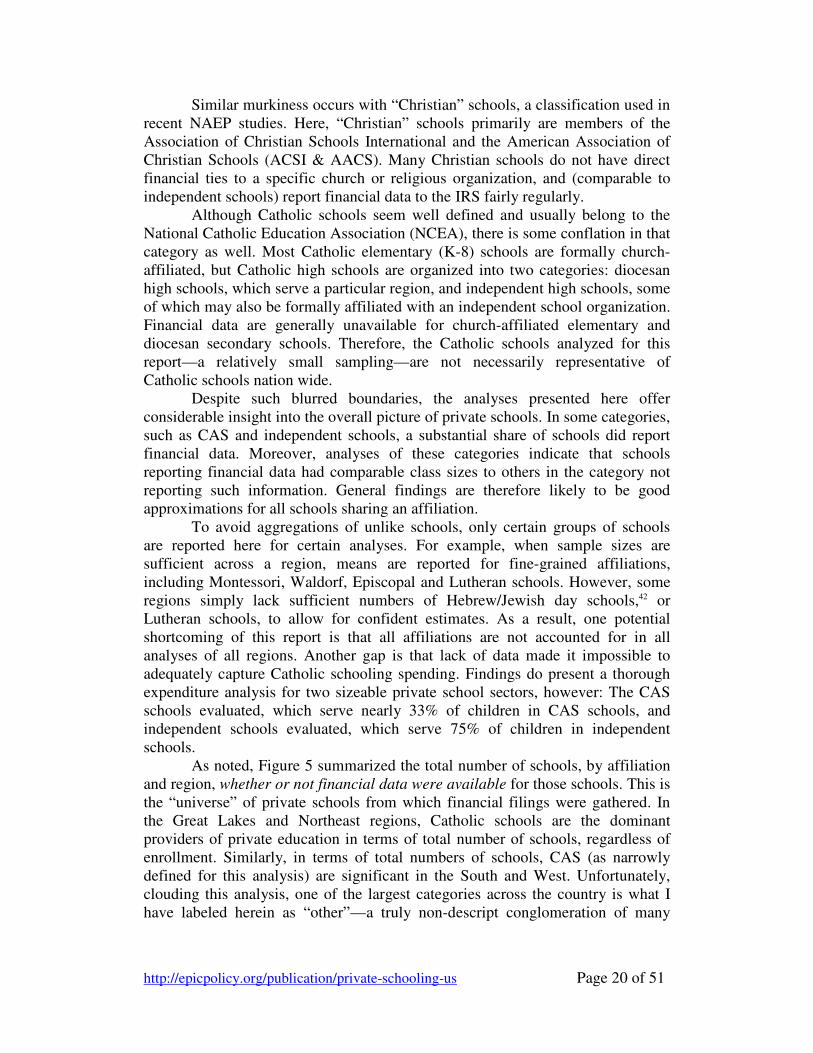
Figure 6 summarizes the average enrollment size of schools by affiliation and region, across mixed grade ranges. Catholic schools tend to be relatively large schools in comparison to other school types. Independent schools are large in the South, as are Episcopal schools in the West, but the average is skewed by a few dominant schools. Many Christian Association Schools, especially numerous in the South, tend to be relatively small. This is important because it places into context the supply of private schooling in terms of availability to students. Previous reports, such as the Cato tuition survey discussed earlier, list schools without regard to size or potential for slots for student seats. For southern states or cities, those school-level lists, which include numerous low-tuition Christian schools, give the impression that numerous low-tuition slots are available for students. But, while figure 5 shows many such schools, figure 6 shows that they tend to be very small. Figure 6. Average school enrollment size by region and affiliation
0
50
100
150
200
250
300
350
400
Catholic Episcopal Hebrew/Jewish Independent CAS
Affiliation
En
rollm
ent
Great Lakes
North East Corridor
Central
South
West Coast
Source: National Center for Education Statistics, Private School Universe Survey 2005-06
Figure 7 addresses the percentage of White students in school enrollments by affiliation and region. Hebrew/Jewish day schools are nearly entirely white regardless of region. Catholic schools vary more significantly by region, with lower White concentrations in western states (offset by increased Hispanic attendance), and the northeast (offset somewhat by attendance of urban Blacks). Interestingly, Waldorf (Rudolf Steiner) schools also appear to be predominantly

http://epicpolicy.org/publication/private-schooling-us Page 22 of 51
White regardless of geographic region, with Montessori schools fluctuating more widely. Figure 7. Percent of enrollment that is white by region and affiliation
0
10
20
30
40
50
60
70
80
90
100
Great Lakes North East Corridor Central South West Coast
Region
% W
hit
e E
nro
llm
ent
Hebrew/Jewish
Waldorf
Episcopal
Lutheran
Independent
CAS
Catholic
Montessori
Source: National Center for Education Statistics, Private School Universe Survey 2005-06
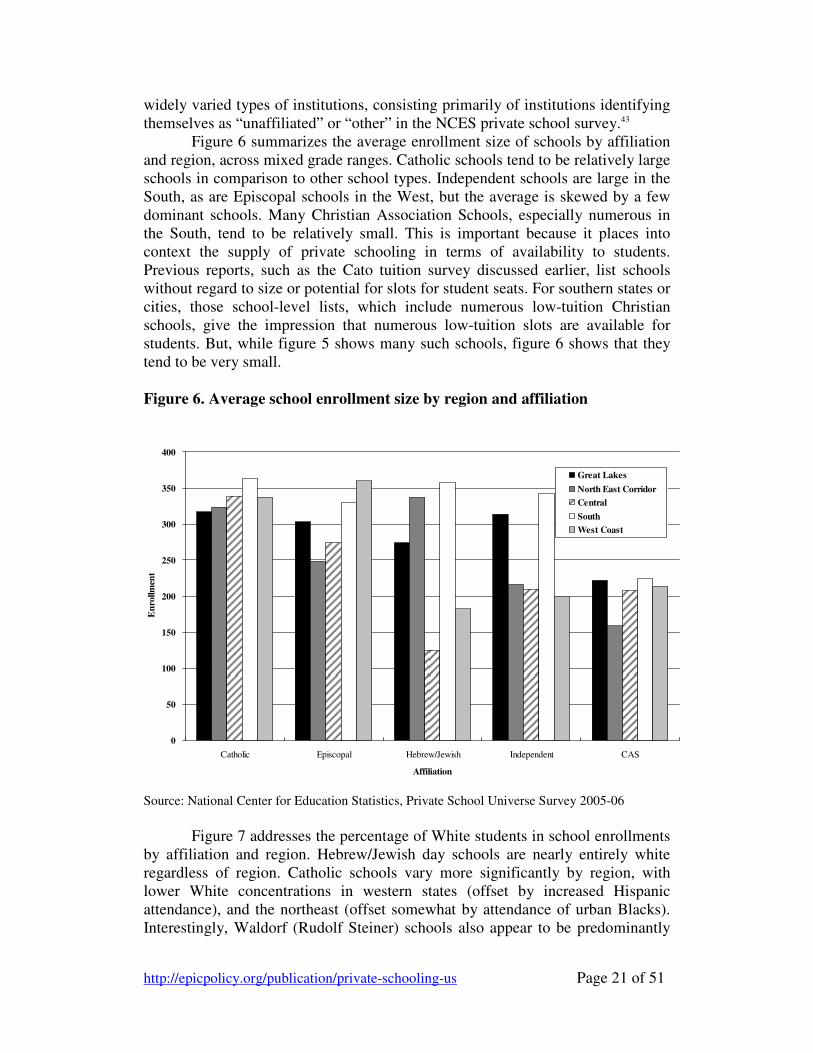
Finally, Figure 8 (following) outlines the percentages of total private
school populations that various types of private schools serve in each region. Two groups of schools are highlighted (bolded outline and diagonal pattern) on the bars in Figure 8—Independent Schools and Christian Association Schools—because financial data were particularly accessible for them. In the Great Lakes region, Catholic schools are dominant, serving over 50% of private school students, while about 20% are served in Christian and independent private day schools. In the Northeast, Catholic schools also have the largest share, but it is smaller, less than 50%; the sum of Christian and independent schools is also smaller—less than 20%—because CAS play a much smaller role in the region. Independent schools serve some 10% of students share in the Northeast, a larger share than in some other regions.
In the Central and West Coast regions, Christian or independent day schools enroll more than 20% private school students. In the South, the role of Catholic schools is much smaller, and Christian and independent schools serve about 40% of the private school population. Overall, the role of Christian and independent day schools is not trivial, despite the relative dominance of Catholic private schools in some regions.
http://epicpolicy.org/publication/private-schooling-us Page 23 of 51
Figure 8. Percent of students by affiliation enrolled in private schools by region
0%
10%
20%
30%
40%
50%
60%
70%
80%
90%
100%
Great Lakes North East Corridor Central South West Coast
Region
% o
f E
nro
llm
ent
International
Islamic
Waldorf
Quaker
Lutheran
Seventh Day
Hebrew/Jewish
Episcopal
Montessori
special
Other Religious
Independent
CAS
Other
Catholic
Source: National Center for Education Statistics, Private School Universe Survey 2005-06
Private School Expenditures
Using a uniquely constructed data set representing over 1,500 private
schools, this section explores private schools’ operating expenditures by affiliation and region. The data set includes enrollments, grade ranges, affiliations and school locations. As already noted, data were drawn from the NCES Private School Survey and from 2006-07 IRS 990 tax filings accessed through Guidestar, a non-profit information service. Data were also linked with the NCES Education Comparable Wage Index, allowing adjustments for geographic variations in wages across labor markets.44 Each private school was identified as being in one of the specific labor markets defined in the Taylor & Fowler NCES Comparable Wage Index.45
The first subsection below describes the IRS documents used and identifies shortcomings in the resulting data. The second summarizes the financial data from IRS filings and makes comparisons to public school expenditures by labor market. The third provides a brief summary of tuition rates reported in the 2003-04 Schools and Staffing Survey, using an affiliation and region classification scheme to match the financial and enrollment data.
http://epicpolicy.org/publication/private-schooling-us Page 24 of 51
Private School Financial Data
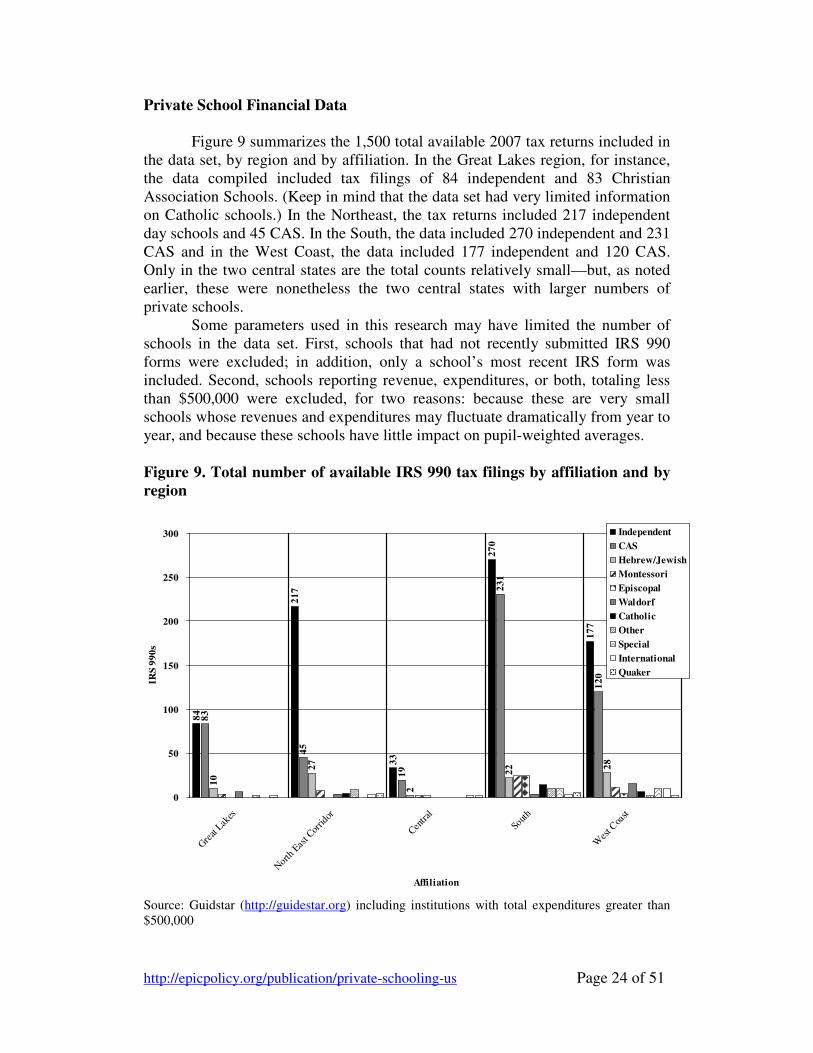
Figure 9 summarizes the 1,500 total available 2007 tax returns included in the data set, by region and by affiliation. In the Great Lakes region, for instance, the data compiled included tax filings of 84 independent and 83 Christian Association Schools. (Keep in mind that the data set had very limited information on Catholic schools.) In the Northeast, the tax returns included 217 independent day schools and 45 CAS. In the South, the data included 270 independent and 231 CAS and in the West Coast, the data included 177 independent and 120 CAS. Only in the two central states are the total counts relatively small—but, as noted earlier, these were nonetheless the two central states with larger numbers of private schools.
Some parameters used in this research may have limited the number of schools in the data set. First, schools that had not recently submitted IRS 990 forms were excluded; in addition, only a school’s most recent IRS form was included. Second, schools reporting revenue, expenditures, or both, totaling less than $500,000 were excluded, for two reasons: because these are very small schools whose revenues and expenditures may fluctuate dramatically from year to year, and because these schools have little impact on pupil-weighted averages.
Figure 9. Total number of available IRS 990 tax filings by affiliation and by region
84
21
7
33
27
0
17
7
83
45
19
23
1
12
0
10
27
2
22 2
8
0
50
100
150
200
250
300
Gre
at L
akes
Nor
th E
ast C
orrid
or
Centra
l
Sout
h
Wes
t Coa
st
Affiliation
IRS
99
0s
Independent
CAS
Hebrew/Jewish
Montessori
Episcopal
Waldorf
Catholic
Other
Special
International
Quaker
Data Source: Guidestar (www.guidestar.org) including institutions with total expenditures greater than $500,000
Source: Guidstar (http://guidestar.org) including institutions with total expenditures greater than $500,000

http://epicpolicy.org/publication/private-schooling-us Page 25 of 51
Figure 10 compares the enrollments of the school types for which financial data were available to the enrollments of all schools in the geographic areas being studied. The most complete listings were available for independent day schools; the schools for which tax filings were available enrolled 74% of children attending such schools in that category. In comparison, the second largest group, Christian Association Schools, included tax filings for schools that enrolled only 28% of all children attending such schools. While several other types of schools, as compared to CAS, had higher percentages included in the data set, those schools in other categories represent a relatively small share of national or regional private school enrollment. Also, as noted above, Catholic schools are largely excluded because data were unavailable, meaning that the overall percentage of private schools analyzed here is low, about 15%. For this reason, findings are most useful for making comparisons within categories where substantive financial data were available and where those data offer a more reliable and sharply focused picture than aggregate comparisons.
Figure 10. Percentage of student enrollment represented by financial data available for analysis
74
.20
%
53
.90
%
53
.60
%
33
.50
%
27
.80
%
27
.00
%
18
.70
%
14
.90
%
8.5
0%
0.5
0%
0%
10%
20%
30%
40%
50%
60%
70%
80%
90%
100%
Inde
pende
nt
Heb
rew/Je
wish
Waldo
rf
Isla
mic
CAS
Quak
er
Episc
opal
Total
Mon
tess
ori
Catho
lic
Affiliation
% o
f T
ota
l E
nro
llm
en
t
Source: Guidstar (http://guidestar.org) including institutions with total expenditures greater than $500,000
The representativeness of the sample analyzed here can be roughly
considered by comparing the pupil-teacher ratios to known national averages. For CAS and independent schools, the pupil-teacher ratio is similar between sample and national (see Figure 21, later in this report). Hebrew/Jewish day schools for
http://epicpolicy.org/publication/private-schooling-us Page 26 of 51
which financial data were available had somewhat smaller ratios (suggesting smaller class sizes) than all Hebrew/Jewish day schools, indicating that the mean estimated expenditures for this group might be high. The differential, in the same direction, was even larger for the small group of Catholic schools for which financial data were available. For Montessori schools, however, ratios in the schools for which financial data were available were higher than for the group as a whole, suggesting that estimated mean expenditures might be low. Private School Expenditures
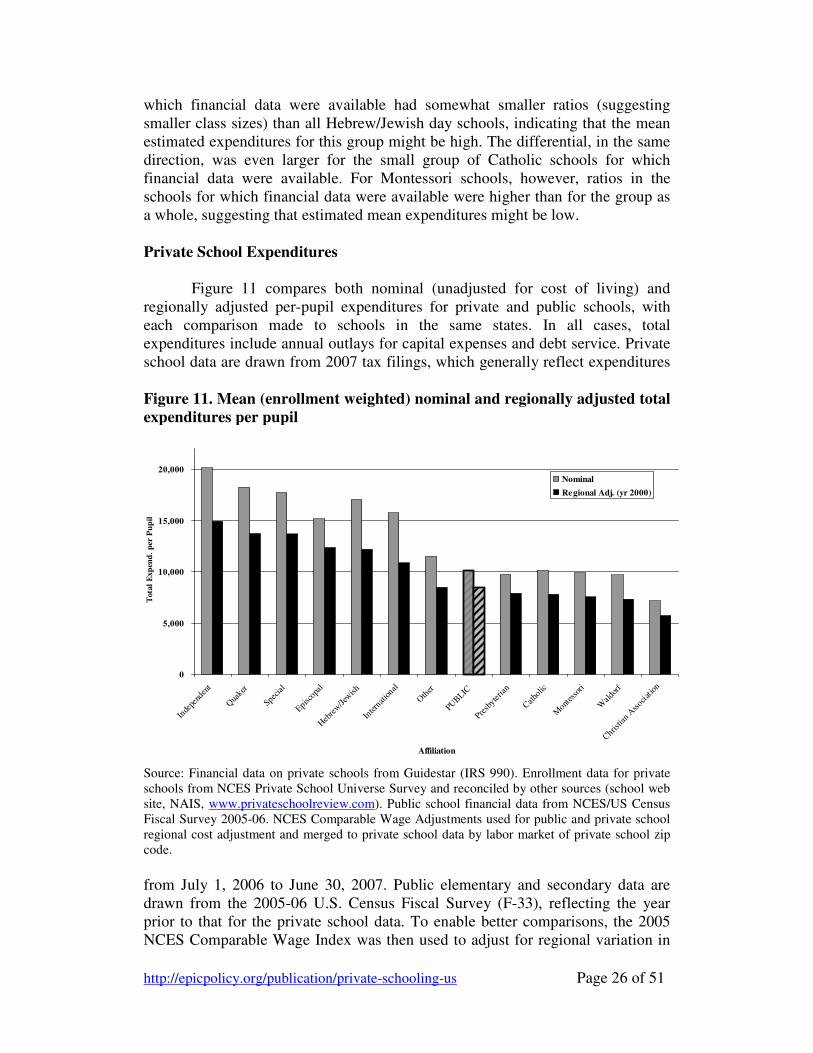
Figure 11 compares both nominal (unadjusted for cost of living) and regionally adjusted per-pupil expenditures for private and public schools, with each comparison made to schools in the same states. In all cases, total expenditures include annual outlays for capital expenses and debt service. Private school data are drawn from 2007 tax filings, which generally reflect expenditures Figure 11. Mean (enrollment weighted) nominal and regionally adjusted total expenditures per pupil
0
5,000
10,000
15,000
20,000
Inde
pend
ent
Qua
ker
Specia
l
Episcopa
l
Heb
rew
/Jew
ish
Inter
natio
nal
Oth
er
PUBLIC
Presb
yteria
n
Catho
lic
Mont
esso
ri
Wal
dorf
Christia
n A
ssoci
atio
n
Affiliation
Tota
l E
xp
end
. p
er P
up
il
Nominal
Regional Adj. (yr 2000)
Source: Financial data on private schools from Guidestar (IRS 990). Enrollment data for private schools from NCES Private School Universe Survey and reconciled by other sources (school web site, NAIS, www.privateschoolreview.com). Public school financial data from NCES/US Census Fiscal Survey 2005-06. NCES Comparable Wage Adjustments used for public and private school regional cost adjustment and merged to private school data by labor market of private school zip code.
from July 1, 2006 to June 30, 2007. Public elementary and secondary data are drawn from the 2005-06 U.S. Census Fiscal Survey (F-33), reflecting the year prior to that for the private school data. To enable better comparisons, the 2005 NCES Comparable Wage Index was then used to adjust for regional variation in
http://epicpolicy.org/publication/private-schooling-us Page 27 of 51
wages and to align all figures at year 2000 levels (which resulted in a decrease in dollar values).
Figure 11 shows that nationally, before or after applying regional competitive wage adjustment, most types of private schools substantially outspend public schools. Several types, including Catholic, Montessori and Waldorf schools, spend roughly the same as public schools. Only CAS spend significantly less.
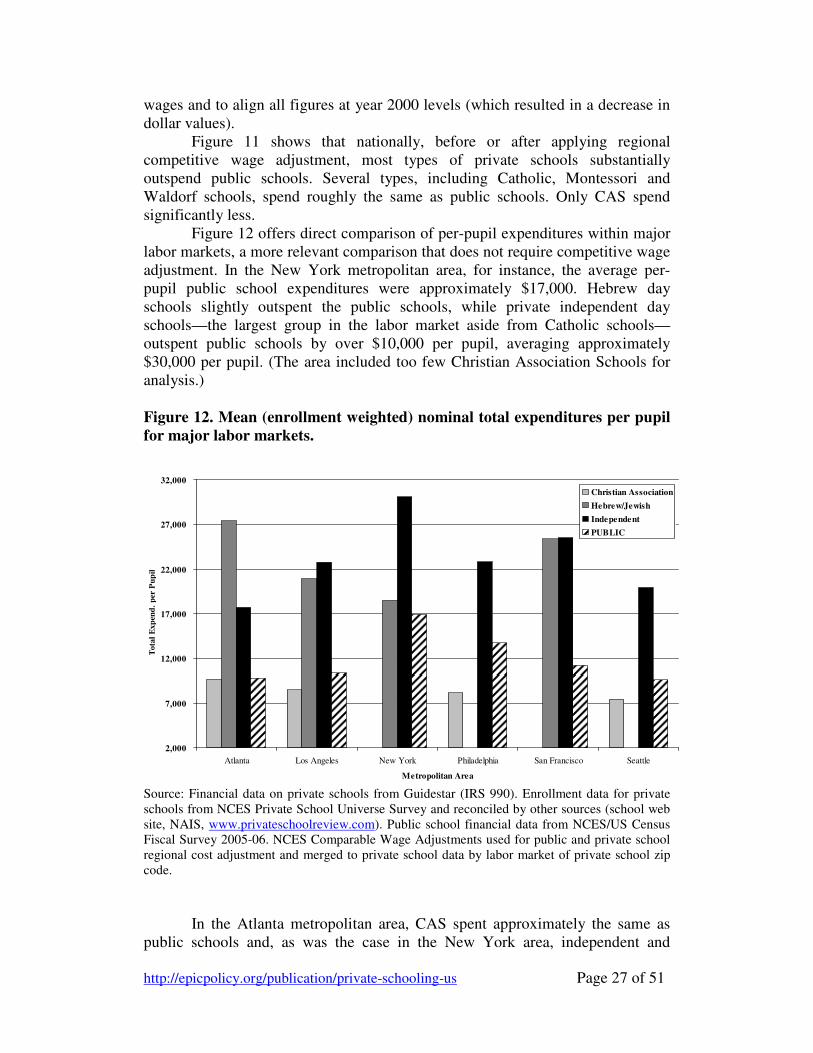
Figure 12 offers direct comparison of per-pupil expenditures within major labor markets, a more relevant comparison that does not require competitive wage adjustment. In the New York metropolitan area, for instance, the average per-pupil public school expenditures were approximately $17,000. Hebrew day schools slightly outspent the public schools, while private independent day schools—the largest group in the labor market aside from Catholic schools—outspent public schools by over $10,000 per pupil, averaging approximately $30,000 per pupil. (The area included too few Christian Association Schools for analysis.)
Figure 12. Mean (enrollment weighted) nominal total expenditures per pupil for major labor markets.
2,000
7,000
12,000
17,000
22,000
27,000
32,000
Atlanta Los Angeles New York Philadelphia San Francisco Seattle
Metropolitan Area
To
tal
Ex
pen
d.
per
Pu
pil
Christian Association
Hebrew/Jewish
Independent
PUBLIC
Source: Financial data on private schools from Guidestar (IRS 990). Enrollment data for private schools from NCES Private School Universe Survey and reconciled by other sources (school web site, NAIS, www.privateschoolreview.com). Public school financial data from NCES/US Census Fiscal Survey 2005-06. NCES Comparable Wage Adjustments used for public and private school regional cost adjustment and merged to private school data by labor market of private school zip code.
In the Atlanta metropolitan area, CAS spent approximately the same as public schools and, as was the case in the New York area, independent and

http://epicpolicy.org/publication/private-schooling-us Page 28 of 51
Hebrew schools spent far more than public schools. In the Atlanta region, Christian and independent schools are more dominant suppliers of private schooling than Catholic schools. In Philadelphia, Seattle and Los Angeles, CAS spent less on average than public schools, but again, other private schools spent much more.
Figure 13. Mean (enrollment weighted) regionally adjusted total expenditures per pupil by affiliation and region.
2,000
4,000
6,000
8,000
10,000
12,000
14,000
16,000
18,000
20,000
Great Lakes North East Central South West Coast
Region
To
tal
Ex
pen
d.
per
Pu
pil
Independent
Hebrew/Jewish
PUBLIC
Catholic
Montessori
Christian Association
Source: Financial data on private schools from Guidestar (IRS 990). Enrollment data for private schools from NCES Private School Universe Survey and reconciled by other sources (school web site, NAIS, www.privateschoolreview.com). Public school financial data from NCES/US Census Fiscal Survey 2005-06. NCES Comparable Wage Adjustments used for public and private school regional cost adjustment and merged to private school data by labor market of private school zip code.
Figure 13 summarizes regional comparisons for an expanded set of
schools (adding Montessori and Catholic). Across regions, independent and Hebrew day schools consistently outspend public schools. The Catholic schools in the data set (which, due to the small number, may not be representative of those schools nationally) spend slightly less than public schools in the South and more than public schools in the West. Montessori schools spend more than a thousand dollars per pupil more than public schools in the Northeast, but only slightly more than public schools in the West. It should be noted, however, that Montessori schools are invariably lower grade schools, which tend to spend less than upper grade schools (see Figure 14, below).
Only Christian Association Schools spend consistently less than public schools. As already noted, these are generally the same schools that Lubienski and Lubienski (2006) found to perform less well on NAEP and that Baker and

http://epicpolicy.org/publication/private-schooling-us Page 29 of 51
Dickerson (2006) found to have the academically weakest pool of teachers.46 Therefore, it is not surprising that CAS expenditures are lower and out of alignment with nearly every other category analyzed here. (Relevant expense factors, including tuition, salaries and pupil-to-teacher ratios, are analyzed by affiliation later in this report.) Figure 14. Mean (enrollment weighted) regionally adjusted total expenditures per pupil by affiliation and grade level.
$2,000
$4,000
$6,000
$8,000
$10,000
$12,000
$14,000
$16,000
$18,000
$20,000
$22,000
Christian Association Hebrew/Jewish Independent
Affiliation
To
tal
Ex
pen
d.
per
Pu
pil
Comprehensive (K-12)
Elementary
Secondary
Source: Financial data on private schools from Guidestar (IRS 990). Enrollment data for private schools from NCES Private School Universe Survey and reconciled by other sources (school web site, NAIS, www.privateschoolreview.com). Public school financial data from NCES/US Census Fiscal Survey 2005-06. NCES Comparable Wage Adjustments used for public and private school regional cost adjustment and merged to private school data by labor market of private school zip code.
Figure 14 offers a comparison of aggregated and regionally adjusted private school spending by grade level and affiliation. As expected, per-pupil spending is highest for secondary schools and lowest for elementary schools in every category; comprehensive (k-12) school spending falls in between. Notably, however, Christian secondary schools spend far less than even the elementary schools in the Hebrew or independent categories.
Table 3 characterizes more precisely the differences in private school spending. As indicated in the left column, figures are adjusted for location, variation in local wages, grade level, enrollment, and affiliation—the factors most strongly associated with differences in spending levels. This table also includes, in the far right column, a comparable model of public school expenditures in the same states for 2005-06. Notably, region, regional variations in wages, grade

http://epicpolicy.org/publication/private-schooling-us Page 30 of 51
levels and enrollment account for less than 40% of variation in spending across private (and public) school types. Table 3. Regression models of factors associated with variation in private school spending per pupil
*p<.05, **p<.10
Coef. Std. Err. P>t Coef. Std. Err. P>t Coef. Std. Err. P>t Coef. Std. Err. P>t Coef. Std. Err. P>t
Region
Great Lakes (BASELINE)
North East $6,187 $787 * $6,396 $773 * $6,754 $759 * $4,989 $578 * $3,052 $88 *
Central $2,420 $1,179 * $2,313 $1,161 * $2,176 $1,139 ** $1,062 $852 -$901 $124 *
South $1,557 $654 * $1,913 $645 * $1,409 $637 * $234 $481 -$1,043 $70 *
West Coast $886 $748 $1,433 $746 ** $1,429 $731 ** $1,651 $549 * -$1,290 $77 *
Regional Wage Adj. $28,439 $1,552 * $28,911 $1,527 * $26,953 $1,520 * $18,438 $1,192 * $5,600 $207 *
Grade Level
Comprehensive (BASELINE)
Elementary -$2,237 $495 * -$450 $547 -$1,975 $420 * -$569 $114 *
Secondary $3,606 $812 * $4,063 $801 * $3,983 $616 * $2,391 $236 *
Other $3,941 $1,081 * $4,413 $1,062 * $1,620 $803 *
Enrollment (ln) -$3,855 $3,340 -$2,723 $2,524 -$1,873 $140 *
Enrollment (ln) squared $493 $273 ** $324 $206 $102 $7 *
Alternative -$4,129 $6,403
Catholic -$10,630 $1,234 *
CAS -$10,242 $331 *
Episcopal -$876 $952
Hebrew -$4,107 $790 *
Independent (BASELINE)
International -$4,706 $1,530 *
Islamic -$18,230 $2,135 *
Mennonite -$19,106 $2,628 *
Montessori -$6,863 $1,279 *
Other -$7,392 $1,543 *
Presbytarian -$6,182 $1,814 *
Quaker -$2,057 $1,821
Special $1,933 $2,147
Waldorf -$7,960 $1,484 *
Constant -$24,211 $2,018 * -$25,026 $1,979 * -$18,170 $10,328 ** -$2,057 $7,841 $12,294 $669 *
R-squared 0.329 0.358 0.384 0.662 0.375
DV = Total Expend per
Pupil
Public School ModelModel 1 Model 2 Model 3 Model 4
Most striking is the finding that when affiliation is included in the
adjustment, the percentage of variance accounted for in the model jumps from 38% to 66%. Further, spending differences among affiliations are huge. On average, controlling for all four factors, Christian Association Schools spend over $10,000 less per pupil less than independent schools. The same is true for the limited set of Catholic schools in the data set.
Interestingly, the influence of location on spending differed for public and private schools. Both types of schools in the Northeast spent significantly more than their counterparts in the Great Lakes area, although the variance is much smaller for public schools than for private schools. However, the Great Lakes public schools spent more than their counterparts in all other regions, while Great Lakes private schools spent less than their counterparts in all other regions. Notably, the private school presence is relatively weak in the Great Lakes region. Thinking ahead to the discussion of vouchers later in this report, these rough comparisons arguably suggest that the Great Lakes states provide ripe territory for testing viability of vouchers and expanding voucher programs, due to high public spending and lower private spending. Alternatively, they suggest that tests of vouchers in Great Lakes states may not produce transferable findings for other regions.
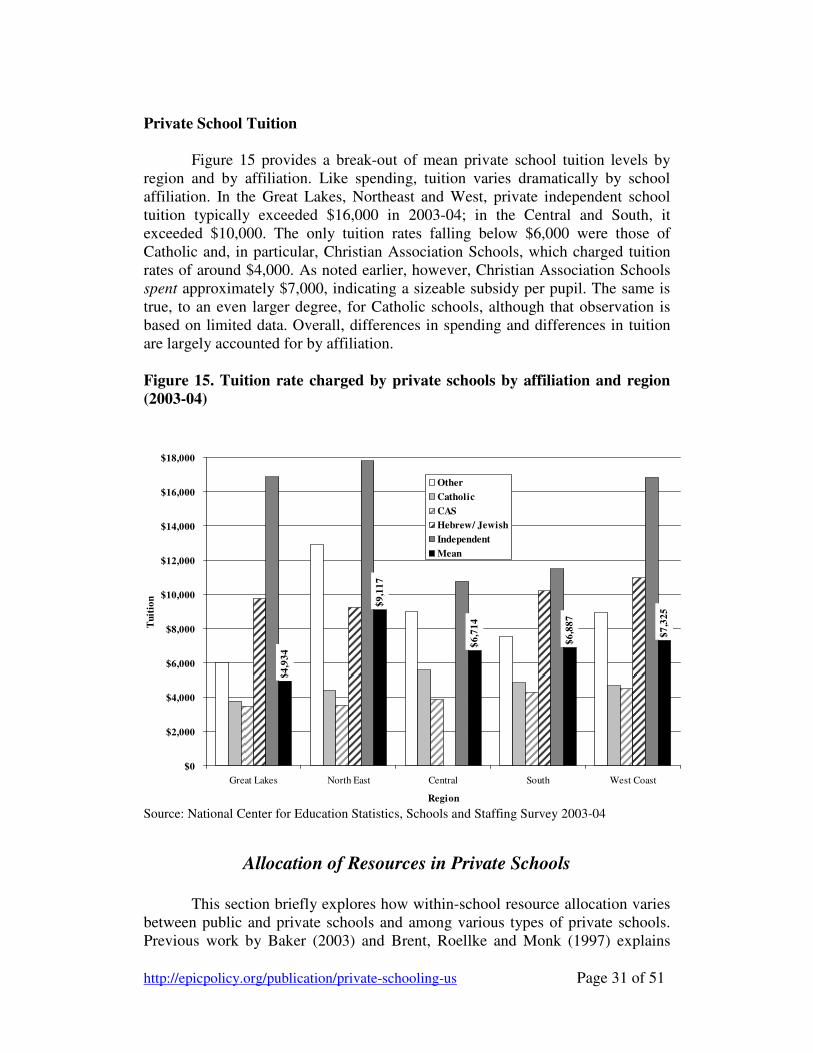
http://epicpolicy.org/publication/private-schooling-us Page 31 of 51
Private School Tuition
Figure 15 provides a break-out of mean private school tuition levels by region and by affiliation. Like spending, tuition varies dramatically by school affiliation. In the Great Lakes, Northeast and West, private independent school tuition typically exceeded $16,000 in 2003-04; in the Central and South, it exceeded $10,000. The only tuition rates falling below $6,000 were those of Catholic and, in particular, Christian Association Schools, which charged tuition rates of around $4,000. As noted earlier, however, Christian Association Schools spent approximately $7,000, indicating a sizeable subsidy per pupil. The same is true, to an even larger degree, for Catholic schools, although that observation is based on limited data. Overall, differences in spending and differences in tuition are largely accounted for by affiliation.
Figure 15. Tuition rate charged by private schools by affiliation and region (2003-04)
$4
,93
4
$9
,11
7
$6
,71
4
$6
,88
7
$7
,32
5
$0
$2,000
$4,000
$6,000
$8,000
$10,000
$12,000
$14,000
$16,000
$18,000
Great Lakes North East Central South West Coast
Region
Tu
itio
n
Other
Catholic
CAS
Hebrew/ Jewish
Independent
Mean
Data Source: National Center for Education Statistics, Schools and Staffing Survey 2003-04
Source: National Center for Education Statistics, Schools and Staffing Survey 2003-04
Allocation of Resources in Private Schools
This section briefly explores how within-school resource allocation varies between public and private schools and among various types of private schools. Previous work by Baker (2003) and Brent, Roellke and Monk (1997) explains
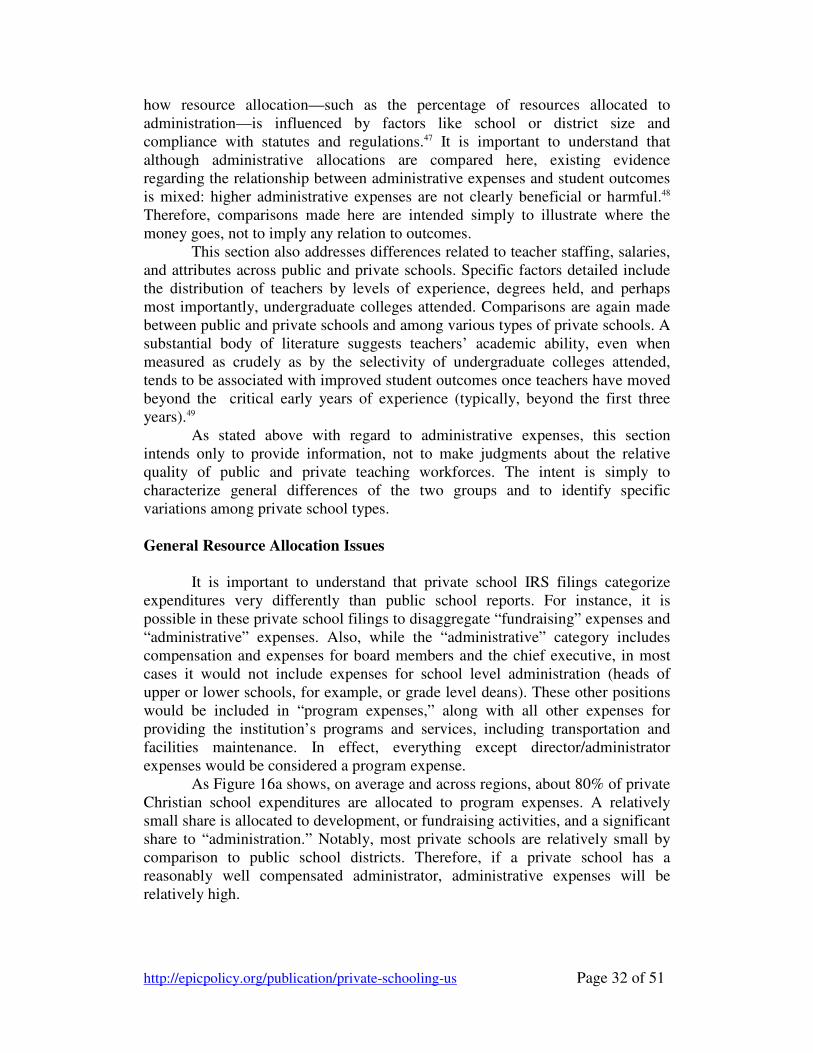
http://epicpolicy.org/publication/private-schooling-us Page 32 of 51
how resource allocation—such as the percentage of resources allocated to administration—is influenced by factors like school or district size and compliance with statutes and regulations.47 It is important to understand that although administrative allocations are compared here, existing evidence regarding the relationship between administrative expenses and student outcomes is mixed: higher administrative expenses are not clearly beneficial or harmful.48 Therefore, comparisons made here are intended simply to illustrate where the money goes, not to imply any relation to outcomes.
This section also addresses differences related to teacher staffing, salaries, and attributes across public and private schools. Specific factors detailed include the distribution of teachers by levels of experience, degrees held, and perhaps most importantly, undergraduate colleges attended. Comparisons are again made between public and private schools and among various types of private schools. A substantial body of literature suggests teachers’ academic ability, even when measured as crudely as by the selectivity of undergraduate colleges attended, tends to be associated with improved student outcomes once teachers have moved beyond the critical early years of experience (typically, beyond the first three years).49
As stated above with regard to administrative expenses, this section intends only to provide information, not to make judgments about the relative quality of public and private teaching workforces. The intent is simply to characterize general differences of the two groups and to identify specific variations among private school types.
General Resource Allocation Issues
It is important to understand that private school IRS filings categorize expenditures very differently than public school reports. For instance, it is possible in these private school filings to disaggregate “fundraising” expenses and “administrative” expenses. Also, while the “administrative” category includes compensation and expenses for board members and the chief executive, in most cases it would not include expenses for school level administration (heads of upper or lower schools, for example, or grade level deans). These other positions would be included in “program expenses,” along with all other expenses for providing the institution’s programs and services, including transportation and facilities maintenance. In effect, everything except director/administrator expenses would be considered a program expense.
As Figure 16a shows, on average and across regions, about 80% of private Christian school expenditures are allocated to program expenses. A relatively small share is allocated to development, or fundraising activities, and a significant share to “administration.” Notably, most private schools are relatively small by comparison to public school districts. Therefore, if a private school has a reasonably well compensated administrator, administrative expenses will be relatively high.

http://epicpolicy.org/publication/private-schooling-us Page 33 of 51
Figure 16a. Administrative expenses in CAS schools
0%
10%
20%
30%
40%
50%
60%
70%
80%
90%
100%
Gre
at L
akes
Nor
th E
ast
Centra
l
South
Wes
t Coas
t
Total
Region
Ex
pen
dit
ure
Sh
are
Fundraising
Admin
Program
Data Source: www.guidestar.org, IRS 990 database
Christian Association Schools
Figure 16b. Administrative expenses in independent schools
0%
10%
20%
30%
40%
50%
60%
70%
80%
90%
100%
Gre
at L
akes
Nor
th E
ast
Cen
tral
South
Wes
t Coa
st All
Region
Ex
pen
dit
ure
Sh
are
Fundraising
Admin
Program
Data Source: www.guidestar.org, IRS 990 database
Independent Schools
As Figure 16b shows, independent schools also spend approximately 80% on program services, although they significantly outspend Christian schools on the whole (and allocate a slightly larger percentage to fundraising).
Finally, Figure 16c illustrates public school allocations. On average, combined school administration and district administrative costs in public schools are less than 10%, or less than half of comparable expenses in private schools,
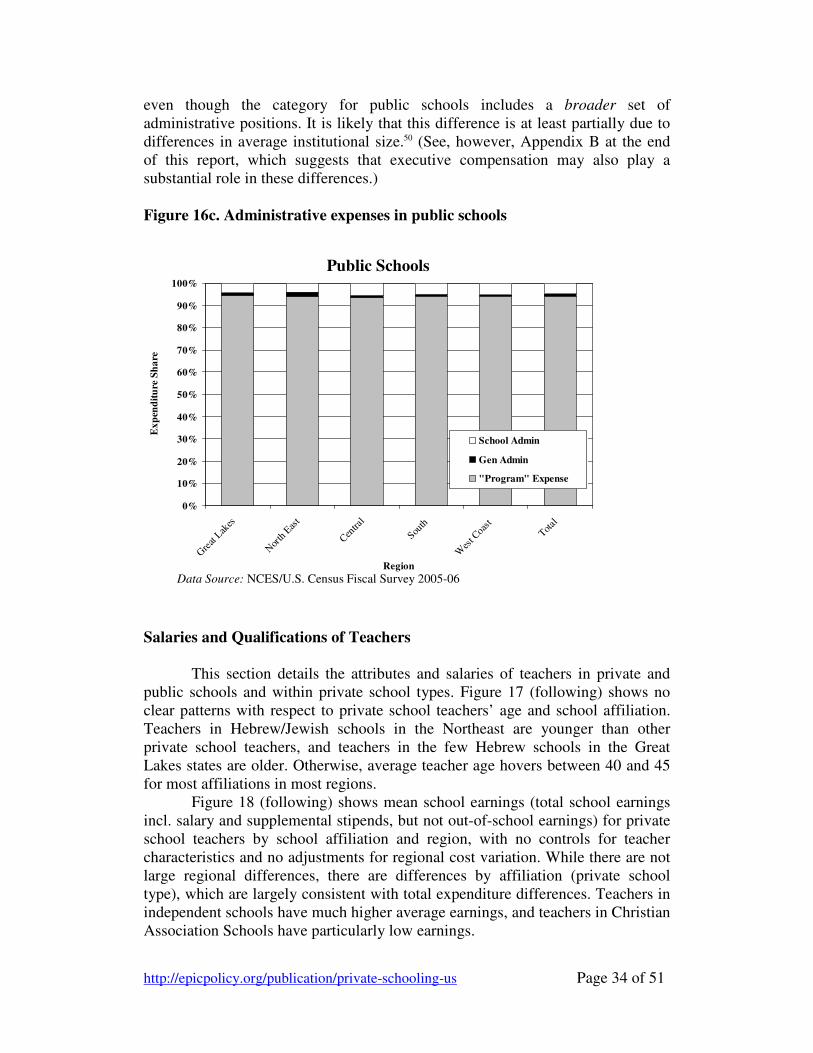
http://epicpolicy.org/publication/private-schooling-us Page 34 of 51
even though the category for public schools includes a broader set of administrative positions. It is likely that this difference is at least partially due to differences in average institutional size.50 (See, however, Appendix B at the end of this report, which suggests that executive compensation may also play a substantial role in these differences.)
Figure 16c. Administrative expenses in public schools
0%
10%
20%
30%
40%
50%
60%
70%
80%
90%
100%
Gre
at L
akes
Nor
th E
ast
Cen
tral
South
Wes
t Coa
st
Total
Region
Ex
pen
dit
ure
Sh
are
School Admin
Gen Admin
"Program" Expense
Data Source: NCES/U.S. Census Fiscal Survey 2005-06
Public Schools
Salaries and Qualifications of Teachers
This section details the attributes and salaries of teachers in private and public schools and within private school types. Figure 17 (following) shows no clear patterns with respect to private school teachers’ age and school affiliation. Teachers in Hebrew/Jewish schools in the Northeast are younger than other private school teachers, and teachers in the few Hebrew schools in the Great Lakes states are older. Otherwise, average teacher age hovers between 40 and 45 for most affiliations in most regions.
Figure 18 (following) shows mean school earnings (total school earnings incl. salary and supplemental stipends, but not out-of-school earnings) for private school teachers by school affiliation and region, with no controls for teacher characteristics and no adjustments for regional cost variation. While there are not large regional differences, there are differences by affiliation (private school type), which are largely consistent with total expenditure differences. Teachers in independent schools have much higher average earnings, and teachers in Christian Association Schools have particularly low earnings.
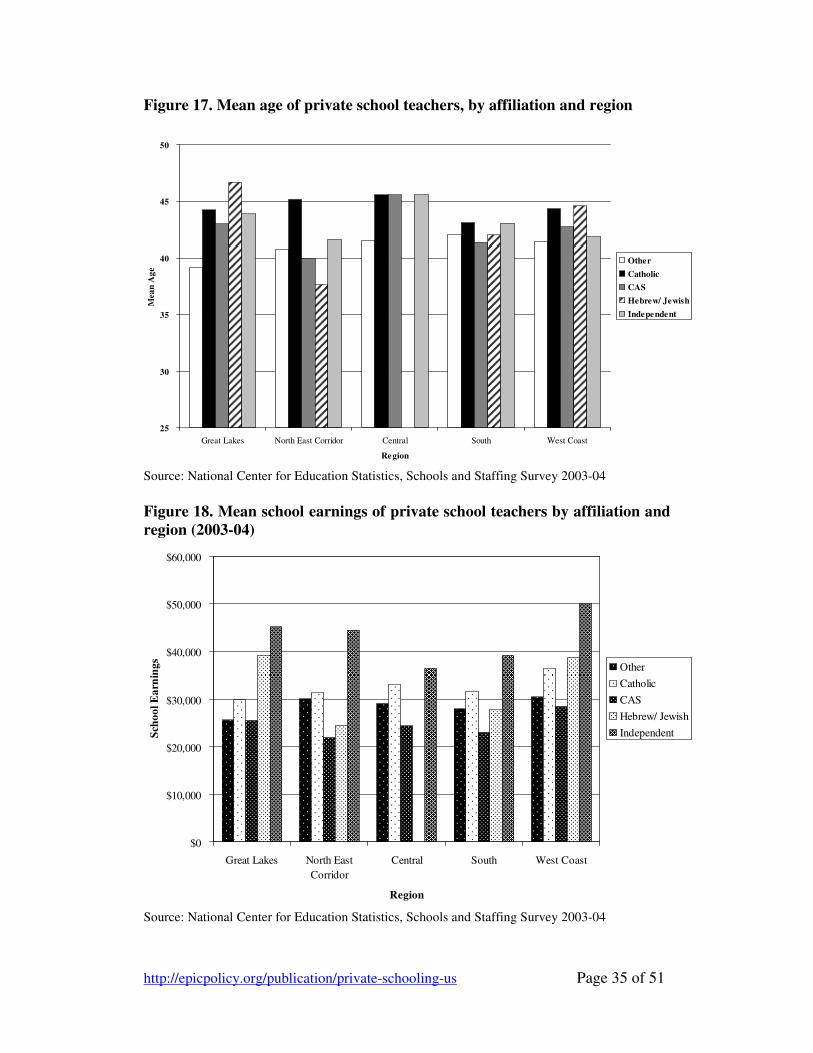
http://epicpolicy.org/publication/private-schooling-us Page 35 of 51
Figure 17. Mean age of private school teachers, by affiliation and region
25
30
35
40
45
50
Great Lakes North East Corridor Central South West Coast
Region
Mea
n A
ge
Other
Catholic
CAS
Hebrew/ Jewish
Independent
Source: National Center for Education Statistics, Schools and Staffing Survey 2003-04
Figure 18. Mean school earnings of private school teachers by affiliation and region (2003-04)
$0
$10,000
$20,000
$30,000
$40,000
$50,000
$60,000
Great Lakes North East
Corridor
Central South West Coast
Region
Sch
oo
l E
arn
ing
s
Other
Catholic
CAS
Hebrew/ Jewish
Independent
Source: National Center for Education Statistics, Schools and Staffing Survey 2003-04

http://epicpolicy.org/publication/private-schooling-us Page 36 of 51
Figure 19 indicates the distribution of teachers who attended more or less selective undergraduate institutions among various private school types and for public schools. (Relative selectivity is based on Barrons’ institutional ratings.) Independent schools have by far the largest share of teachers who attended highly or very competitive colleges, whereas Christian Association Schools had relatively low shares of such teachers and relatively large shares of teachers who attended colleges identified as “special” or “other” (many of which are religious colleges). Independent schools had particularly small shares of teachers who attended less competitive and non-competitive colleges.
Figure 19. Distribution of private school teachers’ undergraduate institution competitiveness by affiliation of school (2003-04)
0%
10%
20%
30%
40%
50%
60%
70%
80%
90%
100%
Other Catholic CAS Hebrew/Jewish Independent PUBLIC
Affiliation
% o
f T
each
ers
Special/ Other
Most Competitive
Highly Competitive
Very Competitive
Competitive
Less Competitive
Non-Competitive
Source: National Center for Education Statistics, Schools and Staffing Survey 2003-04
Table 4 presents wage regression models for private school teachers, for
public school teachers, and for both combined. The wage models characterize salary differences associated with various factors, and they reflect data on only full-time teachers. In this case, a relatively limited set of personal teacher attributes are assumed to affect salary, including gender, age, experience and academic preparation. The table also reflects the influence of limited school-level factors and regional variations. Covariates are limited mainly because of the limited numbers of teachers within private schools of specific affiliations within regions in the Schools and Staffing Survey.51 While other factors—the teacher’s race, for example, or specifics of a teaching assignment—are marginally associated with wage differences, including such additional factors has negligible

http://epicpolicy.org/publication/private-schooling-us Page 37 of 51
influence on wage differentials among private school types, the main concern of this analysis.
Table 4. Regression models of factors associated with public and private school wage variation (2003-04)
*p<.05, **p<.10
DV = School Earnings Coef. Std. Err. P>t Coef. Std. Err. P>t Coef. Std. Err. P>t
Teacher Attributes
Age $111 $11 * $79 $19 * $118 $12 *
Male (to Female) $1,274 $204 * $2,625 $474 * $1,087 $219 *
Total Experience $592 $14 * $357 $26 * $619 $15 *
Has Masters (to BA) $6,263 $188 * $5,776 $410 * $6,039 $202 *
Highly/Most Selective College $969 $334 * $2,333 $549 * $652 $375 **
Competitive to Very Competitive (Baseline)
Less/Non-Competitive College $115 $230 $1,704 $471 * $4 $245
School Level
Elementary (BASELINE)
Secondary $1,674 $190 * $4,975 $526 * $1,434 $198 *
Combined Grades -$1,572 $318 * $1,329 $462 * -$3,243 $397 *
Region
Great Lakes (BASELINE)
North East $5,398 $299 * -$192 $476 $6,196 $330 *
Central -$5,555 $328 * $34 $851 -$6,148 $345 *
South -$4,256 $225 * -$171 $463 -$4,764 $243 *
West Coast $7,246 $312 * $6,211 $591 * $7,366 $342 *
Affiliation
Public (Baseline)
Catholic -$14,400 $273 * -$8,452 $677 *
CAS -$14,652 $390 * -$12,360 $705 *
Hebrew/Jewish -$9,162 $1,710 * -$3,701 $1,560 *
Independent (Baseline in pvt.) -$2,942 $640 *
Other -$11,083 $432 * -$8,786 $712 *
Constant $31,146 $377 * $29,177 $947 * $30,893 $421 *
R-squared 0.548 0.388 0.529
Global Model Private Schools Public Schools
Source: National Center for Education Statistics, Schools and Staffing Survey 2003-04
The combined model indicates that at comparable age, degree, experience
and college background, teachers in every private school category earn less than public school teachers; independent school teachers, however, earn salaries most comparable to those of public school teachers.
When the Great Lakes region is considered a baseline, a comparison of public and private wages indicates less regional variation for private school teachers, with only West Coast teachers earning substantially more. In addition, private secondary teachers earn higher salaries than private elementary teachers. More similar elementary and secondary salaries in public schools are likely a function of the single salary schedules used in most public school districts. Returns for experience are somewhat greater in public than in private schools, while the returns for a master’s degree appear comparable. There appears to be a significantly larger return to having attended a highly or most competitive college for private school teachers compared to a baseline group of teachers who attended competitive to very competitive colleges (dominant group), but there is also an
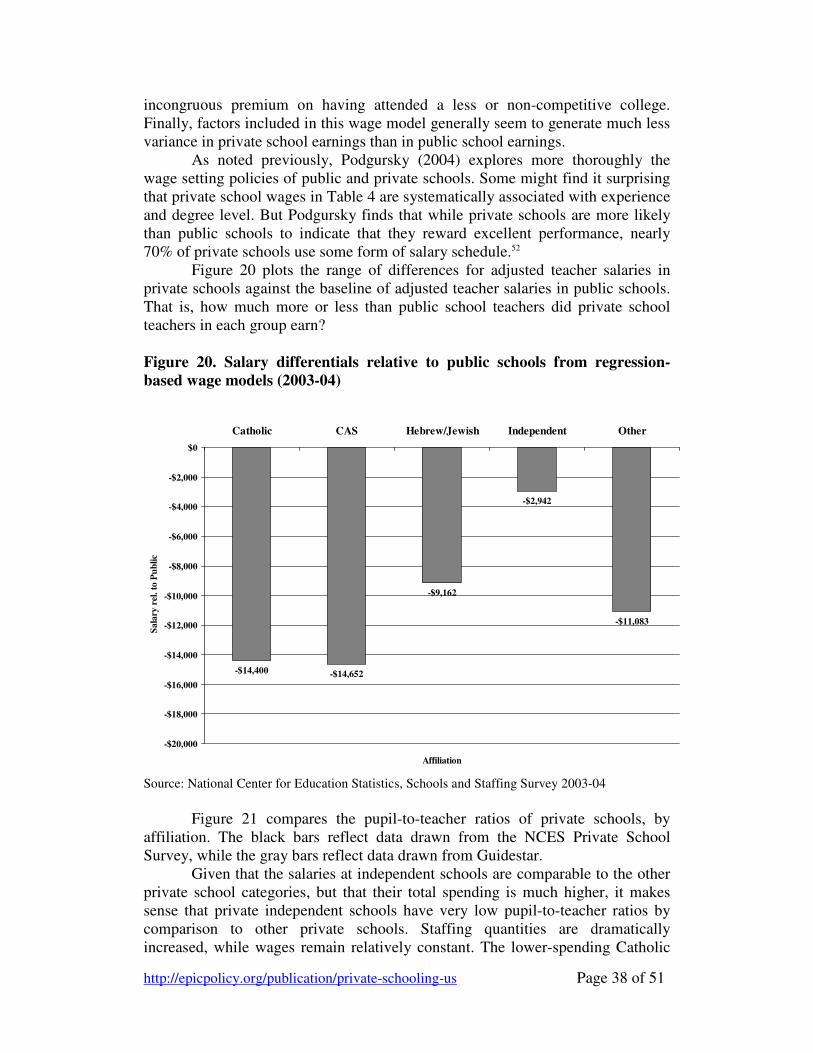
http://epicpolicy.org/publication/private-schooling-us Page 38 of 51
incongruous premium on having attended a less or non-competitive college. Finally, factors included in this wage model generally seem to generate much less variance in private school earnings than in public school earnings.
As noted previously, Podgursky (2004) explores more thoroughly the wage setting policies of public and private schools. Some might find it surprising that private school wages in Table 4 are systematically associated with experience and degree level. But Podgursky finds that while private schools are more likely than public schools to indicate that they reward excellent performance, nearly 70% of private schools use some form of salary schedule.52
Figure 20 plots the range of differences for adjusted teacher salaries in private schools against the baseline of adjusted teacher salaries in public schools. That is, how much more or less than public school teachers did private school teachers in each group earn?
Figure 20. Salary differentials relative to public schools from regression-based wage models (2003-04)
-$14,400 -$14,652
-$9,162
-$2,942
-$11,083
-$20,000
-$18,000
-$16,000
-$14,000
-$12,000
-$10,000
-$8,000
-$6,000
-$4,000
-$2,000
$0
Catholic CAS Hebrew/Jewish Independent Other
Affiliation
Sala
ry r
el.
to P
ub
lic
Source: National Center for Education Statistics, Schools and Staffing Survey 2003-04
Figure 21 compares the pupil-to-teacher ratios of private schools, by
affiliation. The black bars reflect data drawn from the NCES Private School Survey, while the gray bars reflect data drawn from Guidestar.
Given that the salaries at independent schools are comparable to the other private school categories, but that their total spending is much higher, it makes sense that private independent schools have very low pupil-to-teacher ratios by comparison to other private schools. Staffing quantities are dramatically increased, while wages remain relatively constant. The lower-spending Catholic

http://epicpolicy.org/publication/private-schooling-us Page 39 of 51
and CAS have a combination of relatively low salaries and relatively high pupil-to-teacher ratios, leading to the much lower total spending figures. Notably, the Catholic schools that submitted financial data reported spending at about the same level as public schools, but they had somewhat lower pupil-to-teacher ratios than other Catholic schools not reporting their finances. This suggests that spending at other Catholic schools may be lower than set forth here. Figure 21. Pupil to teacher ratios by affiliation for all private schools and for sample (IRS 990) schools
13.5
2
13.3
0
10.2
7
8.52
9.02
12.2
8
10.3
8
16.5
9
13.5
3
9.59
10.1
4
9.87
10.7
3
9.55
16.8
3
0
2
4
6
8
10
12
14
16
18
Cat
holic
CA
S
Epi
scop
al
Heb
rew
Indep
ende
nt
Mon
tess
ori
Wal
dorf
Public
Affiliation
Pu
pil t
o T
each
er R
ati
o
Pupil to Teacher (sample)
Pupil to Teacher (all)
Source: National Center for Education Statistics, Schools and Staffing Survey 2005—06 and NCES Common Core (Public) 2006-2007
Conclusions and Implications for Voucher Policies
At the most basic level, these analyses show that the less-regulated private school sector is more varied than the more highly regulated public schooling system. On average, the private schools studied spend more than public schools in the same metropolitan areas (and nationally), although some spend much less. Some private schools have lower pupil-to-teacher ratios than public schools, while others have comparable ratios. Some have comparable teacher salaries, and some pay their teachers much less. And, some have teachers with stronger academic qualifications than public school teachers, while others have teachers with weaker academic qualifications. Most striking is that patterns in such
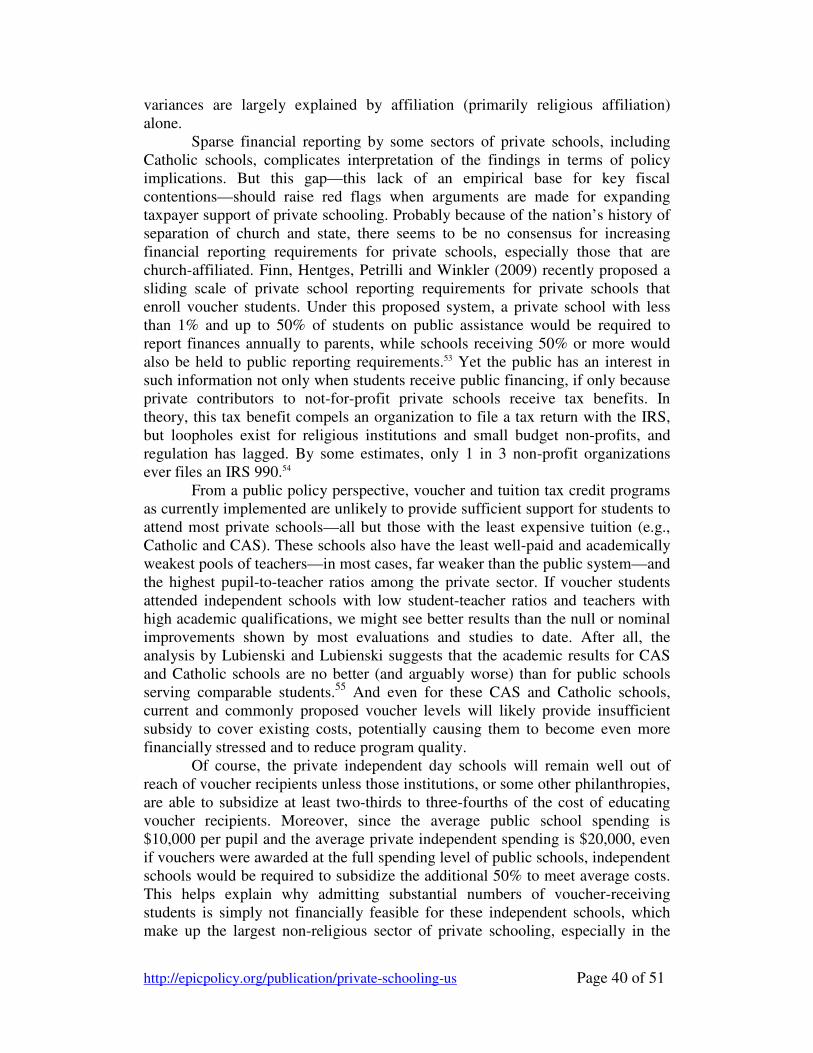
http://epicpolicy.org/publication/private-schooling-us Page 40 of 51
variances are largely explained by affiliation (primarily religious affiliation) alone.
Sparse financial reporting by some sectors of private schools, including Catholic schools, complicates interpretation of the findings in terms of policy implications. But this gap—this lack of an empirical base for key fiscal contentions—should raise red flags when arguments are made for expanding taxpayer support of private schooling. Probably because of the nation’s history of separation of church and state, there seems to be no consensus for increasing financial reporting requirements for private schools, especially those that are church-affiliated. Finn, Hentges, Petrilli and Winkler (2009) recently proposed a sliding scale of private school reporting requirements for private schools that enroll voucher students. Under this proposed system, a private school with less than 1% and up to 50% of students on public assistance would be required to report finances annually to parents, while schools receiving 50% or more would also be held to public reporting requirements.53 Yet the public has an interest in such information not only when students receive public financing, if only because private contributors to not-for-profit private schools receive tax benefits. In theory, this tax benefit compels an organization to file a tax return with the IRS, but loopholes exist for religious institutions and small budget non-profits, and regulation has lagged. By some estimates, only 1 in 3 non-profit organizations ever files an IRS 990.54
From a public policy perspective, voucher and tuition tax credit programs as currently implemented are unlikely to provide sufficient support for students to attend most private schools—all but those with the least expensive tuition (e.g., Catholic and CAS). These schools also have the least well-paid and academically weakest pools of teachers—in most cases, far weaker than the public system—and the highest pupil-to-teacher ratios among the private sector. If voucher students attended independent schools with low student-teacher ratios and teachers with high academic qualifications, we might see better results than the null or nominal improvements shown by most evaluations and studies to date. After all, the analysis by Lubienski and Lubienski suggests that the academic results for CAS and Catholic schools are no better (and arguably worse) than for public schools serving comparable students.55 And even for these CAS and Catholic schools, current and commonly proposed voucher levels will likely provide insufficient subsidy to cover existing costs, potentially causing them to become even more financially stressed and to reduce program quality.
Of course, the private independent day schools will remain well out of reach of voucher recipients unless those institutions, or some other philanthropies, are able to subsidize at least two-thirds to three-fourths of the cost of educating voucher recipients. Moreover, since the average public school spending is $10,000 per pupil and the average private independent spending is $20,000, even if vouchers were awarded at the full spending level of public schools, independent schools would be required to subsidize the additional 50% to meet average costs. This helps explain why admitting substantial numbers of voucher-receiving students is simply not financially feasible for these independent schools, which make up the largest non-religious sector of private schooling, especially in the

http://epicpolicy.org/publication/private-schooling-us Page 41 of 51
South. Awarding vouchers at levels well below 50% of a school’s cost is patently unlikely to create a supply of high quality, financially viable private providers sufficient to have a sizeable impact on large, poor urban school districts.
The U.S. Supreme Court noted in its 2002 decision upholding the constitutionality of the Cleveland voucher program that 96% of the voucher recipients enrolled in religiously affiliated schools.56 The above analyses show why this is so. A primary effect of any “insufficient” voucher—even as high as $5,000 to $7,500—will likely be to channel students into schools whose operating costs are closest to the voucher level. Such schools are not only primarily, but in many locations exclusively, Catholic and CAS. For example, in the spring of 2009, Georgia legislators debated providing a $5,000 voucher to all children in the state, selecting the $5,000 figure as roughly the average state aid to local public school districts. At present, Christian Association Schools are the largest providers of private education in Georgia, and their mean spending was nearly $8,000 per pupil, with a select subset spending less than $5,000 per pupil. Independent schools are the second largest providers in Georgia. The lowest spending of 43 independent schools in Georgia evaluated in this report spent approximately $10,000 per pupil.
The second year evaluation of the Washington D.C. voucher program, which offers a $7,500 voucher, found that only 11% of voucher recipients attended schools with tuition exceeding $7,500.57 By the third year, 22% attended schools with tuition above the voucher level, and still a larger share (25%) who were offered vouchers did not use the vouchers at all. Wolf and colleagues note that while 56% of participating schools were faith-based, 82% of participants attended such religious schools.58
IRS filings of D.C. private schools for 2007 and 2008 show expenses ranging from a low of $7,500 per pupil59 to more than $40,000 per pupil. Expenses at the second lowest CAS school were $17,000, and expenses at the lowest spending non-religious school were $24,000. In short, an additional subsidy to meet current operating costs at non-Catholic schools would be necessary for nearly every voucher-receiving child in Washington, D.C., and those subsidies would be on the order of 70% for private non-religious schools.
Voucher programs as currently implemented in select locations are unlikely to ever achieve significant scale to have either a positive or a negative impact on the lives of large numbers of children currently attending urban public schools. They are instead likely only to continue shifting relatively modest numbers of children to low-spending, relatively small-enrollment religious private schools staffed by teachers who are generally less well paid and are educated in less selective institutions than are public school teachers. Private independent schools will remain far out of reach. While many of these more elite schools do provide significant financial aid, they are unlikely ever to have the capacity to provide 60% to 70% aid to large numbers of urban public school students.
It is, of course, conceivable that children from poor urban communities might benefit greatly from the opportunity to attend private independent day schools, assuming findings of the literature on peer group effects and the academic quality of teachers remain credible.60 This same literature supports
http://epicpolicy.org/publication/private-schooling-us Page 42 of 51
policies that lessen racial and class segregation. This rationale could conceivably be used to make the case for a new wave of voucher programs and tuition tax credits sufficient to place larger numbers of low-income students into high-quality independent day schools. However, this is an expensive proposition—far more expensive on a per-pupil basis than most, if not all, existing state public school systems, even before considering increased transportation and information dissemination costs.61 For example, if Washington D.C. vouchers were allocated at the minimum per-pupil cost of non-religious, independent schools rather than the minimum for religious schools, the voucher would have to increase from $7,500 to $24,000 ($10,000 more than the city’s public schools in the same year).
Some urban areas, it should be noted, do have public spending levels that approach those of private independent schools. Most notably, figures are closer to break-even spending in New Jersey, where a handful of the larger, poor urban public school districts in the state spend over $20,000 per pupil (including capital and transportation spending), and where the mean independent private school per-pupil expenditure is $22,600 (2006-07). Any potential benefit still comes at a very high expenditure, however: marginally higher, not lower, than current spending, and certainly not a windfall of savings. Moreover, the extent of the potential benefit is unknown because no one has yet provided sufficient numbers of low-income children access to high-quality independent schools.
Overall, the analyses presented in this report address a substantial void in the literature, providing some more reasonable benchmarks for understanding actual private school spending and how it varies by school type. The issue is complex. It does not allow for simple summaries defining the average “cost of private schooling” to use in setting voucher levels or calculating simple cost-benefit ratios for private and public school comparisons. Just as outcomes vary widely by institutional affiliation, so too does spending, and so too do the salary structures and credentials of teachers. On average, private schools that reported financial information to the IRS spent more than nearby public schools. More importantly, however, spending varies dramatically, with variations depending overwhelmingly on the private school’s affiliation, which is correlated with differences in family preferences and economic backgrounds. This finding deserves much further exploration, in part to determine the extent to which preferences drive capacity—or capacity drives preferences.
Recommendations
• While there may be lessons that public schools can learn from private schools, those lessons are most likely learned from exploring specific subsets of the private school sector rather than attempting to aggregate that sector into a single or limited set of alternatives. Past studies have done a disservice in this regard. Regarding spending in particular, policy makers should understand that spending varies widely across private schools, especially by the affiliation of those schools. As this report shows, those spending differences show a positive association with differences in pupil-to-teacher ratios and teacher salaries, and with substantive differences in the measurable qualities of teachers. In most

http://epicpolicy.org/publication/private-schooling-us Page 43 of 51
cases, those spending differences are also positively associated with differences in outcomes reported in other studies. Private schools are substantially less regulated than public schools, so it is not surprising that their spending, class sizes and teacher qualifications vary more than public schools.
• Policy makers should also be sure to consider differences between actual private school spending and the tuition they charge, since various other sources of revenue make the former often much greater than the latter. Policy makers should make every attempt to better understand the spending behavior of private schools in relation to the spending behavior of public schools, rather than making inappropriate comparisons between private school tuition and public school spending.
• Policy makers who pursue voucher policies should better understand the spending behavior of private schools, in order to set voucher levels that will encourage greater participation among private providers. Currently, many potential private providers would have to scramble to raise additional contributions to offset voucher shortfalls. Although this recommendation would likely add considerable public cost to voucher programs, private schools can no more escape detrimental effects of underfunded voucher programs than public schools can escape such effects from comparable underfunding.
• On a related note, this report shows that spending levels among private schools vary widely, with this variation associated strongly with the schools’ religious affiliation. Accordingly, policymakers should attempt to set voucher levels that will encourage comparable rates of participation among private non-religious schools as private religious schools. In some regions such as the south, private independent day schools are among the largest providers of private education. But bringing these schools into voucher programs without requiring them to seek a substantial additional private subsidy may require voucher levels as high as twice the spending in nearby public schools.
• With regard to the legal requirement that voucher programs be neutral with regard to religion, courts should also consider the relationship between voucher levels and the distribution of per-pupil spending among potential private providers. That is, courts should consider whether voucher levels are set in ways that effectively exclude some or all potential non-religious providers?
• Finally, regarding future data collection, the National Center for Education Statistics should consider the option of linking its biennial collection of student enrollment and basic institutional characteristics (Private School Universe Survey) with data on revenues, expenditures and executive compensation provided through Guidestar or some other source for aggregating IRS filings from private schools. Regular updating of the information presented in this report is required in order to provide relevant ongoing support for policy deliberations involving private schools. A problem with current references to data on private schools is that they are often outdated, referring to ballpark estimates from ten years back. The availability of electronically compiled annual tax returns through vehicles like Guidestar, coupled with the availability of the NCES Private School Survey, makes relatively frequent updating feasible.
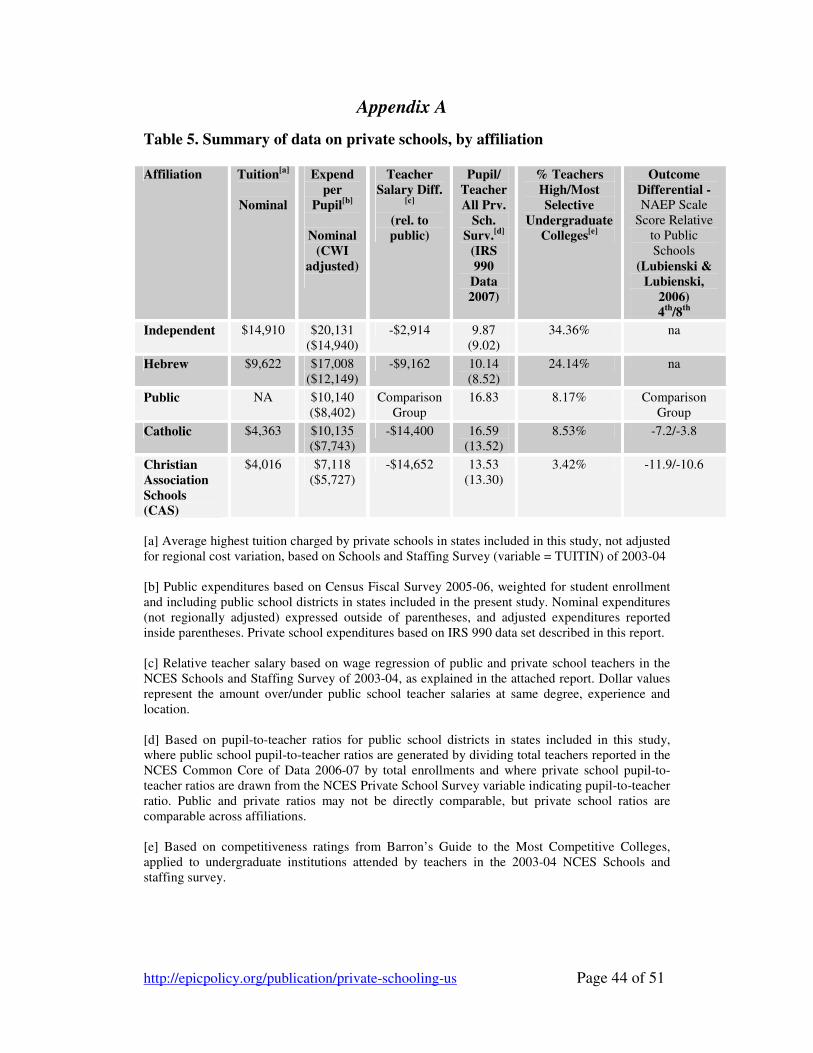
http://epicpolicy.org/publication/private-schooling-us Page 44 of 51
Appendix A
Table 5. Summary of data on private schools, by affiliation Affiliation Tuition[a]
Nominal
Expend per
Pupil[b]
Nominal (CWI
adjusted)
Teacher Salary Diff.
[c] (rel. to public)
Pupil/ Teacher All Prv.
Sch. Surv.[d]
(IRS 990
Data 2007)
% Teachers High/Most Selective
Undergraduate Colleges[e]
Outcome Differential - NAEP Scale
Score Relative to Public Schools
(Lubienski & Lubienski,
2006) 4th/8th
Independent $14,910 $20,131 ($14,940)
-$2,914 9.87 (9.02)
34.36% na
Hebrew $9,622 $17,008 ($12,149)
-$9,162 10.14 (8.52)
24.14% na
Public NA $10,140 ($8,402)
Comparison Group
16.83 8.17% Comparison Group
Catholic $4,363 $10,135 ($7,743)
-$14,400 16.59 (13.52)
8.53% -7.2/-3.8
Christian Association Schools (CAS)
$4,016 $7,118 ($5,727)
-$14,652 13.53 (13.30)
3.42% -11.9/-10.6
[a] Average highest tuition charged by private schools in states included in this study, not adjusted for regional cost variation, based on Schools and Staffing Survey (variable = TUITIN) of 2003-04 [b] Public expenditures based on Census Fiscal Survey 2005-06, weighted for student enrollment and including public school districts in states included in the present study. Nominal expenditures (not regionally adjusted) expressed outside of parentheses, and adjusted expenditures reported inside parentheses. Private school expenditures based on IRS 990 data set described in this report. [c] Relative teacher salary based on wage regression of public and private school teachers in the NCES Schools and Staffing Survey of 2003-04, as explained in the attached report. Dollar values represent the amount over/under public school teacher salaries at same degree, experience and location. [d] Based on pupil-to-teacher ratios for public school districts in states included in this study, where public school pupil-to-teacher ratios are generated by dividing total teachers reported in the NCES Common Core of Data 2006-07 by total enrollments and where private school pupil-to-teacher ratios are drawn from the NCES Private School Survey variable indicating pupil-to-teacher ratio. Public and private ratios may not be directly comparable, but private school ratios are comparable across affiliations. [e] Based on competitiveness ratings from Barron’s Guide to the Most Competitive Colleges, applied to undergraduate institutions attended by teachers in the 2003-04 NCES Schools and staffing survey.

http://epicpolicy.org/publication/private-schooling-us Page 45 of 51
Appendix B
Compensation of Administrators: A New Jersey Snapshot
This appendix takes a brief look at executive (headmaster) compensation in a set of private independent schools in New Jersey and compares this to the salaries to public school superintendents. On the surface, it may seem more logical to compare private school headmasters to principal salaries, assuming headmasters to be building, or school level leaders. However, I choose to compare headmaster salaries to superintendents because both are the chief executives of their institutions. Further, in larger private schools and school systems that include lower and upper schools, typically each school has the equivalent its own principal (head of upper, head of lower school) and the headmaster’s role is more analogous to that of the superintendent of a very small school district. The headmaster is a paid officer of the institution appointed by the board of directors and his/her compensation is typically reported as such on IRS filings of private independent schools. By contrast, division heads are reported as employees and alongside that of business/finance directors. Their compensation is often listed among the required reporting of compensation of the highest paid five employees of the organization.
As set forth in the main report, administrative expenses in private schools appear relatively high when compared with public schools, some of which is attributable to differences in scale of operations. But salary data suggest that more than just scale is at work. Figure 26 compares private independent school headmaster salaries, in gray bars, with the salaries of the superintendents of schools for the district where the private school is located, in black bars. For example, furthest to the left, the bars compare the salary of the headmaster of the Dwight-Englewood School to the superintendent of schools in Englewood, NJ. The next set of bars compares the salary of the headmaster at Far Hills Country Day School (FHCDS, a pk-8 school) to the superintendent of Somerset Hills Regional School District (an affluent suburban district of about 2,000 students). In most cases, the private school headmaster salary is much higher than the public school superintendent salary. Moreover, while most of the host public districts are relatively small and affluent suburban districts (enrolling far fewer than 10,000 students), the private independent schools are much smaller, with most enrolling fewer than 1,000 students.
Figure 22 also includes a bar for the average salary of the state’s big city superintendents, who are in charge of poor urban districts enrolling over 20,000 students each. While these big-city superintendents earn, on average, slightly more than the superintendents of the public school districts used for the private school headmaster comparisons, their salaries are still lower than those of the private school headmasters. Perhaps the most stark way of presenting this comparison is to consider that a $200,000 salary for a superintendent in a 40,000 student district amounts to $5 per pupil, compared to $286 per pupil in a private school of 700 students.
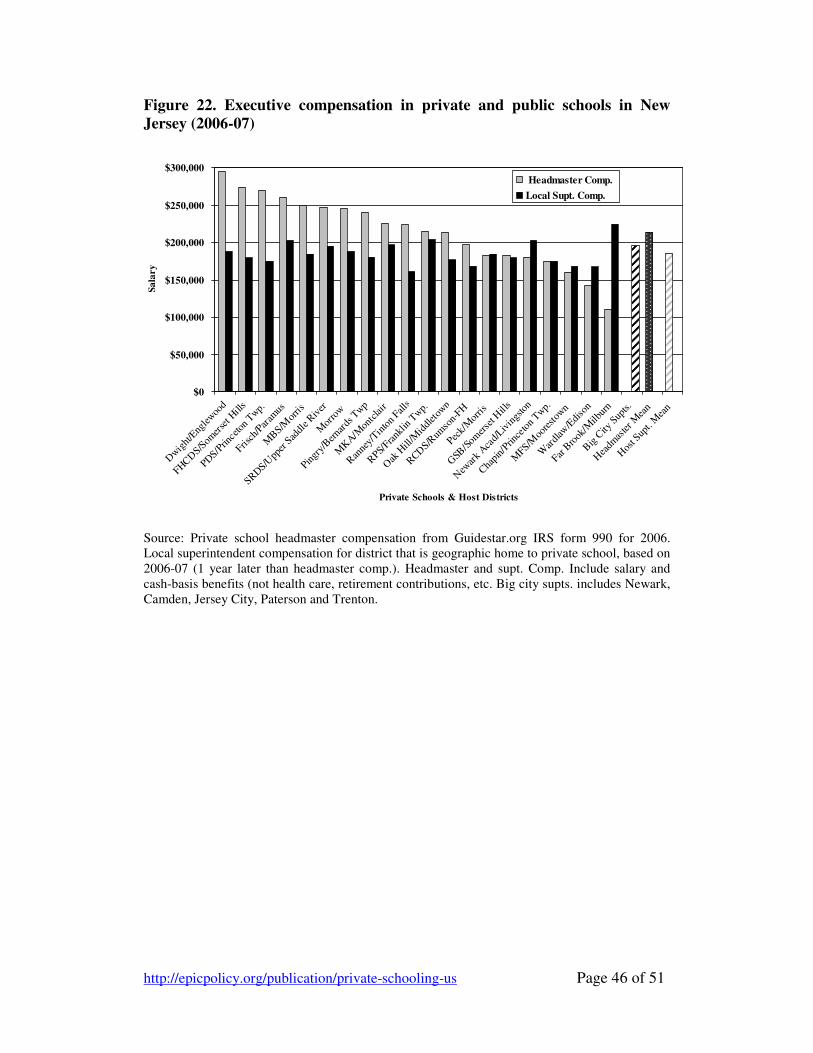
http://epicpolicy.org/publication/private-schooling-us Page 46 of 51
Figure 22. Executive compensation in private and public schools in New Jersey (2006-07)
$0
$50,000
$100,000
$150,000
$200,000
$250,000
$300,000
Dwig
ht/E
ngle
woo
d
FHCD
S/Som
erse
t Hill
s
PDS/P
rince
ton
Twp.
Frisch
/Par
amus
MBS/M
orris
SRDS/U
pper
Sad
dle Riv
er
Mor
row
Pingr
y/Ber
nard
s Twp
MK
A/M
ontc
lair
Ran
ney/
Tinto
n Fal
ls
RPS/
Frank
lin T
wp.
Oak
Hill
/Mid
dlet
own
RCD
S/Rum
son-
FH
Peck/
Mor
ris
GSB
/Som
erse
t Hill
s
New
ark
Aca
d/Liv
ings
ton
Cha
pin/
Prince
ton
Twp.
MFS/M
oore
stow
n
War
dlaw
/Edi
son
Far B
rook
/Milb
urn
Big
City
Sup
ts.
Hea
dmas
ter M
ean
Hos
t Sup
t. M
ean
Private Schools & Host Districts
Sa
lary
Headmaster Comp.
Local Supt. Comp.
Source: Private school headmaster compensation from Guidestar.org IRS form 990 for 2006. Local superintendent compensation for district that is geographic home to private school, based on 2006-07 (1 year later than headmaster comp.). Headmaster and supt. Comp. Include salary and cash-basis benefits (not health care, retirement contributions, etc. Big city supts. includes Newark, Camden, Jersey City, Paterson and Trenton.

http://epicpolicy.org/publication/private-schooling-us Page 47 of 51
Notes and References
1 Howell, W.G., & West, M.R. (2008). Is the Price Right? Education Next. Summer 2008.
2 Lubienski, S. T., & Lubienski, C. (2006). School sector and academic achievement: A multi-level analysis of NAEP mathematics data. American Educational Research Journal, 43(4), 651-698.
3 See Salisbury, D.F. (2003). What Does a Voucher Buy? A Closer Look at the Cost of Private Schools. Policy Analysis. Cato Institute. August 2003.
4 Howell, W.G., & West, M.R. (2008). Is the Price Right? Education Next. Summer 2008.
5 See for example, Cannata, M. (2008). Teacher Qualifications and Work Environments Across School Types. Boulder and Tempe: Education and the Public Interest Center & Education Policy Research Unit. Retrieved June 12, 2009, from http://epicpolicy.org/files/CHOICE-06-Cannata2.pdf
6 Ballou, D. (1996). Do Public Schools Hire the Best Applicants? The Quarterly Journal of Economics, 111(1), 97-133.
Baker, B.D., & Dickerson, J. (2006). Charter Schools, Teacher Labor Market Regulation and Teacher Quality: Evidence from the Schools and Staffing Survey. Educational Policy, 20(5), 752-779.
7 Podgursky, M., Brodsky, S., Hauke, J.P. (2008) The Fiscal Effects of A Tuition Tax Credit Program in Missouri. Show-Me Institute. Policy Study 12 (January 14, 2008).
8 Podgursky, M., Brodsky, S., Hauke, J.P. (2008) The Fiscal Effects of A Tuition Tax Credit Program in Missouri. Show-Me Institute. Policy Study 12 (January 14, 2008).
9 Salisbury, D.F. (2003). What Does a Voucher Buy? A Closer Look at the Cost of Private Schools. Policy Analysis. Cato Institute. August 2003. p. 1.
10 The use of “median” is an interesting twist that deflates reported tuition rates for a number of reasons, and poorly represents the supply of private schooling at specific cost points. First, there are several high tuition schools in each of these markets which bring up the mean tuition to a level higher than the median. Second, the higher tuition schools are the larger schools as will be shown in this report, so a pupil weighted mean tuition is then even higher than the mean tuition across schools.
11 Salisbury, D.F. (2003). What Does a Voucher Buy? A Closer Look at the Cost of Private Schools. Policy Analysis. Cato Institute. August 2003. p. 5.
12 Epple, Figlio and Romano (2004) also had access to a data set provided by Dun and Bradstreet which they claim includes tuition data on a near universe of private schools. Other proprietary data sets also exist, but our goal herein is not to evaluate tuition- but rather costs. Further analyses will explore in greater depth, the gap between tuition and costs.
Epple, D., Figlio, D.N., & Romano, R. (2002). Competition Between Public and Private Schools: Testing Stratification and Pricing Predictions. Working Paper. Department of Economics. University of Florida.
13 In Yeh, S.S. (2007). The Cost-Effectiveness of Five Policies for Improving Student Achievement. American Journal of Evaluation 28 (4) 416-436.
14 Hoxby, C.M. (2002). Would School Choice Change the Teaching Profession? The Journal of Human Resources, 37(4), 846-891. p. 861.
15 Cohen-Zada, D., & Justman, M. (2002). The Religious Factor in Private Education. Occasional Paper #53. National Center for the Study of Privatization in Education. Teachers College, Columbia U.
16 Wenders, J.T. (2005) The Extent and Nature of Waste and Rent Dissipation in U.S. Public Education. Cato Journal, Vol. 25, No. 2 (Spring/Summer 2005).p. 223. Oddly, Wenders, to partially support his argument, cites a 1995 study by Garet, Chan and Sherman which attempted to gather data on finances from national private school organizations in order to calculate a per-pupil cost figure for the National Center for
http://epicpolicy.org/publication/private-schooling-us Page 48 of 51
Education Statistics – but this working paper concluded “NCES cannot obtain precise estimates of private school expenditures by relying solely on data provided by private school associations.”
Garet, M.; Chan, T. H.; and Sherman, J. D. (1995) “Estimates of Expenditures for Private K-12 Schools.” National Center for Education Statistics Working Paper No. 95–17 (May) P. 15.
17 Salisbury, D.F. (2003) What Does a Voucher Buy? A Closer Look at the Cost of Private Schools. Policy Anlaysis. Cato Institute. August 2003. p. 1.
18 Aud, S. (2007). School Choice by the Numbers: The Fiscal Effect of School Choice Programs 1990 – 2006. The Milton & Rose D. Friedman Foundation.
Podgursky, M., Brodsky, S., Hauke, J.P. (2008) The Fiscal Effects of A Tuition Tax Credit Program in Missouri. Show-Me Institute. Policy Study 12 (January 14, 2008).
19 Hamilton, S.W., Finn, C.E., & Petrilli, M. (2008) Who Will Save America’s Urban Catholic Schools. Thomas B. Fordham Institute. p. 6
20 Belfield, Levin and Schwartz (2006) elaborate on the sufficiency of voucher levels in Milwaukee, noting that by 2001 40% of voucher-receiving schools had more than 80% of their students on vouchers, and that the number of providers had increased since voucher implementation. However, the authors note that the increase in providers cannot be explained by the relationship between voucher revenue and costs because “Many schools report costs above the value of the voucher, and costs only weakly converge to the voucher amount” (p. 1).
21 The authors point to recent efforts in Wichita, Kansas as a model:
“Catholic schooling would be free to all parishioners. To make the financials work, the bishop asked all Church members to tithe a significant portion of their salaries, which largely went into the school operations fund. Parishioners responded enthusiastically. Today, all Wichita Catholics can send their children to parochial school. Tuition is no barrier (p. 9)” (emphasis added).
The authors point out, however, that church members are often reluctant to take on the additional public service mission of funding the non-Catholic poor:
“Catholic parishioners have been willing to help to a point, but our survey shows that about six in ten Catholics now view ‘working with economically disadvantaged students’ as the domain of public schools” (p. 8).
“The Church should heed Wichita’s example and embark on a serious campaign to make Catholic education affordable—even free—for all Catholics. Such an effort will be particularly significant for America’s recent Hispanic immigrants, many of whom live near urban Catholic schools with a rich history of educating children new to our shores. This means asking parishioners to dig deep. It also means being aggressive about revitalizing rundown, ill-managed parish schools with an eye to making the system as a whole as efficient and effective as possible” (p. 11) (emphasis added).
22 McEwan, P. J. (2000), Comparing the Effectiveness of Public and Private Schools: A Review of Evidence and Interpretations. Occasional Paper #3. New York: National Center for the Study of Privatization, Teachers College, Columbia University, p. 1.
23 Retrieved June 17, 2009, from http://www.rand.org/publications/RB/RB8018
24 Levin, H.J., & Belfield, C. (2002) The Effects of Competition on Educational Outcomes: A review of U.S. Evidence. Working Paper. National Center for the Study of Privatization in Education. www.ncspe.org
25 Belfield, C.R., & Levin, H.M. (2002). The effects of competition on educational outcomes: A review of the U.S. evidence. Review of Educational Research, 72(2), 279-341, p. 297.
26 Nechyba, T. (2003) Introducing School Choice into Multi-District Public School Systems.” In Caroline Hoxby (ed.) 145-194. The Economics of School Choice. (Chicago: University of Chicago Press).
http://epicpolicy.org/publication/private-schooling-us Page 49 of 51
27 Arsen, D. & Ni, Y. (2008). The Competitive Effect of School Choice Policies on Performance in Traditional
Public Schools. Boulder and Tempe: Education and the Public Interest Center & Education Policy Research Unit, p. 15. Retrieved June 8, 2009, from http://epicpolicy.org/files/CHOICE-09-Arsen2.pdf.
28 Lubienski, S. T., & Lubienski, C. (2006). School sector and academic achievement: A multi-level analysis of NAEP mathematics data. American Educational Research Journal, 43(4), 651-698.
29 For additional analysis of similar data, see: National Center for Education Statistics. The Nation’s Report Card: Student Achievement in Private Schools. Results from NAEP 2000 – 2005. Retrieved June 30, 2009, from http://nces.ed.gov/nationsreportcard/pdf/studies/2006459.pdf (p. 1).
30 Dee, T. (2005). The Effects of Catholic Schooling on Civic Participation. International Tax and Public Finance 12, 605–625. See also Belfield, C. (2003). Democratic Education Across School Types: Evidence from NHES 1999. Working Paper # OP73. National Center for the Study of Privatization in Education. http://www.ncspe.org/publications_files/OP73.pdf
31 McEwan (2000) notes: “In contrast, the evidence on attainment is strikingly consistent, indicating that Catholic schools increase the probability of high school completion and college attendance, particularly for minorities in urban areas.” (p. 1). McEwan, P. (2000). Comparing Effectiveness of Public and Private Schools: A review of evidence and interpretations. Working Paper # 99 OP03. National Center for the Study of Privatization in Education. Retrieved June 8, 2009, from http://www.ncspe.org/publications_files/990_OP03.pdf
32 Baker, B.D., & Dickerson, J. (2006). Charter Schools, Teacher Labor Market Regulation and Teacher Quality: Evidence from the Schools and Staffing Survey. Educational Policy, 20(5), 752-779.
33 Lubienski, S. T., & Lubienski, C. (2006). School sector and academic achievement: A multi-level analysis of NAEP mathematics data. American Educational Research Journal, 43(4), 651-698.
34 A comprehensive comparison of teacher qualifications in public and private schools can be found in Cannata, M. (2008). Teacher Qualifications and Work Environments Across School Types. Boulder and Tempe: Education and the Public Interest Center & Education Policy Research Unit. Retrieved June 12, 2009, from http://epicpolicy.org/files/CHOICE-06-Cannata2.pdf
35 Rated very competitive or higher according to Barrons’ Profiles of American Colleges. Rankings include Non-Competitive, Less Competitive, Competitive, Very Competitive, Highly Competitive and Most Competitive. Factors included in determining the category for each college included: median entrance exam scores for the 2001 – 2002 freshman class (the SAT 1 score used was derived by averaging the median verbal reasoning and the median mathematics reasoning scores; the ACT score used was the median composite score); percentages of 2001 – 2002 freshman scoring 500 and above and 600 and above on both the verbal reasoning and mathematics reasoning sections of the SAT I; percentages of 2001 – 2002 freshman scoring 21 and above and 27 and above on the ACT; percentage of 2001 – 2002 freshman who ranked in the upper fifth and upper two-fifths of their high school graduating classes; minimum class rank and grade point average required for admission (if any); and percentage of applicants to the 2001 – 2002 freshman class who were accepted.
36 Podgursky, M. (2004). Teams Versus Bureaucracies: Personnel Policy, Wage-Setting and Teacher Quality in Traditional Public, Charter and Private Schools. Dept. of Economics. University of Missouri.
37 About two years ago, I was called by a reporter from the Kansas City Star and asked to reflect on the dramatic rise in private school enrollments over the past few decades. My response was to download some data and check that assumption and then call her back. My answer to her was, “what dramatic rise?” The story didn’t make the paper.
38 Data in Figures 1-4 are derived from
Ruggles, S., Sobek, M., Alexander, T., Fitch, C.A., Goeken, R., Hall, P.K., King, M. & Ronnander, C. (2009) . Integrated Public Use Microdata Series: Version 4.0 [Machine-readable database]. Minneapolis, MN: Minnesota Population Center [producer and distributor].

http://epicpolicy.org/publication/private-schooling-us Page 50 of 51
39 See Welner, K. (2008). NeoVouchers: The emergence of tuition tax credits for private schooling. Lanham, MD:
Rowman & Littlefield.
40 This finding is from a forthcoming report on indicators for comparing state school finance systems. The effort indicator referred to hear is similar to other state effort indicators which compare state and local expenditures on public education to a measure of gross state product.
41 For example, the major independent day school for the Orlando Florida area, Lake Highland Preparatory School holds affiliations only with independent school associations including NAIS. It is not a member of any Christian schools association, but includes in its mission statement “instilling Christian values.” Lake Highland is included as an “independent school” for our purposes.
42 These type descriptors (Hebrew and Jewish) are combined in this report to address possible self-categorization differences among the schools.
43 Among the 3,400 private schools in the NCES Private School Universe Survey that were placed in the “other” category in this figure, 2,700 listed no membership association. Another 500 expressly listed “other” school association. Other smaller categories of schools (20 or so schools each) included Military and Bilingual schools. That is, I expanded the NCES “other” category to include those listing no affiliation, those listing “other” and those listing affiliations with organizations that had few members.
44 Taylor, L.L., & Fowler, W. (2005). A Comparable Wage Approach to a Geographic Cost Adjustment in Education NCES 2005–862. Washington, D.C.: National Center for Education Statistics.
45 Initial match was established by matching private school zip codes to public school zip codes in the NCES Common Core of Data. Several private schools then required matching by hand where no public school existed in the same zip code as the private school. This is the case, for example, for the zip codes of Far Hills Country Day School and Gill St. Bernards School in the Far Hills, Peapack-Gladstone area of central New Jersey where public schools in each of these towns were closed and consolidated with a nearby district in the late 1980s and early 1990s.
46 Lubienski, S. T., & Lubienski, C. (2006). School sector and academic achievement: A multi-level analysis of NAEP mathematics data. American Educational Research Journal, 43(4), 651-698
Baker, B.D., & Dickerson, J. (2006). Charter Schools, Teacher Labor Market Regulation and Teacher Quality: Evidence from the Schools and Staffing Survey. Educational Policy, 20(5), 752-779.
47 Brent, B.O., Roellke, C., Monk, D.H. (1997). Understanding Teacher Resource Allocation in New York State Secondary Schools: A Case Study Approach.” Journal of Education Finance, 23(1997), 207-233.
Baker, B.D. (2003). State policy influences on the internal allocation of school district resources: Evidence from the Common Core of Data. Journal of Education Finance 29(1), 1-24.
48 Baker, B.D. (2009). Evaluating Marginal Costs with School Level Data: Implications for the Design of Weighted Student Allocation Formulas. Education Policy Analysis Archives, 17(3).
49 Ehrenberg, R.G. & Brewer, D.J. (1994). Do School and Teacher Characteristics Matter? Evidence from High School and Beyond. Economics of Education Review 13(1), 1-17. Ferguson, R.F. (1991). Paying for public education: New evidence on how and why money matters. Harvard Journal of Legislation 28, 465-498.
50 Baker, B.D. (2003). State policy influences on the internal allocation of school district resources: Evidence from the Common Core of Data. Journal of Education Finance, 29(1), 1-24.
51 As per protocol for estimating models using data of complex stratified sampling design like Schools and Staffing Survey, balanced repeated replication weighting is used for correcting standard errors.
52 Podgursky, M. (2004) Teams Versus Bureaucracies: Personnel Policy, Wage-Setting and Teacher Quality in Traditional Public, Charter and Private Schools. Dept. of Economics. University of Missouri.
53 Finn, C.E., Hentges, C.M., Petrilli, M.J., & Winkler, A.M. (2009). When Private Schools Take Public Dollars: What’s the place of accountability in school voucher programs? Thomas B. Fordham Institute.
54 Bowman, W., & Bies, A. (2005). Nonprofit Quarterly. http://64.81.227.74/woods/pdf/cancharitableregulate.pdf
http://epicpolicy.org/publication/private-schooling-us Page 51 of 51
55 Lubienski, S. T., & Lubienski, C. (2006). School sector and academic achievement: A multi-level analysis of
NAEP mathematics data. American Educational Research Journal, 43(4), 651-698.
56 Zelman v. Simmons-Harris, 536 U.S. 639 (2002).
57 Wolf, P., Gutmann, B., Puma, M., Kisida, B., Rizzo, L., & Eissa, N. (2009). Evaluation of the DC Opportunity Scholarship Program. Impact after 3 years. U.S. Dept. of Education. National Center for Educational Evaluation. NCEE 2009-4051. Wolf, P., Gutmann, B., Puma, M., Kisida, B., Rizzo, L., Eissa, N. (2008). Evaluation of the DC Opportunity Scholarship Program. Impact after 2 years. U.S. Dept. of Education. National Center for Educational Evaluation. NCEE 2008-4023.
58 Wolf, P., Gutmann, B., Puma, M., Kisida, B., Rizzo, L., & Eissa, N. (2009). Evaluation of the DC Opportunity Scholarship Program. Impact after 3 years. U.S. Dept. of Education. National Center for Educational Evaluation. NCEE 2009-4051. Wolf, P., Gutmann, B., Puma, M., Kisida, B., Rizzo, L., Eissa, N. (2008). Evaluation of the DC Opportunity Scholarship Program. Impact after 2 years. U.S. Dept. of Education. National Center for Educational Evaluation. NCEE 2008-4023.
59 Keep in mind that this does not include a review of the Catholic schools in D.C., which many, and probably most, of the voucher students enrolled.
60 Hanushek, E., & Rivken, S. (2007). School Quality and the Black-White Achievement Gap. Education Working Paper Archive. University of Arkansas, Department of Education Reform.
61 Levin, H. M. (2002). A comprehensive framework for evaluating educational vouchers. Educational Evaluation and Policy Analysis, 24, 159-174.