private sector participation in the water and wastewater ... · pdf filethe water and...
TRANSCRIPT

PRIVATE SECTOR PARTICIPATION INTHE WATER AND WASTEWATER
SERVICES INDUSTRY
No. ID-08
OFFICE OF INDUSTRIES WORKING PAPERU.S. International Trade Commission
Jennifer BaumertLaura Bloodgood
Office of IndustriesU.S. International Trade Commission
April 2004
Office of Industries working papers are the result of the ongoing professional research ofUSITC Staff and solely represent the opinions and professional research of the individualauthors. These papers do not necessarily represent the views of the U.S. International TradeCommission or any of its individual Commissioners. Working papers are circulated topromote the active exchange of ideas between USITC Staff and recognized experts outsidethe USITC, and to promote professional development of Office staff by encouraging outsideprofessional critique of staff research.
ADDRESS CORRESPONDENCE TO:OFFICE OF INDUSTRIES
U.S. INTERNATIONAL TRADE COMMISSIONWASHINGTON, DC 20436 USA

PRIVATE SECTOR PARTICIPATION IN THE WATER AND WASTEWATERSERVICES INDUSTRY
Jennifer BaumertLaura Bloodgood
Office of IndustriesU.S. International Trade Commission
ABSTRACT: Countries introduce private sector participation into the water and wastewater utilities sector for anumber of reasons. The introduction of a profit motive may increase efficiency as compared to publicmanagement of the water system, and private firms have been noted for customer service improvements. Financial considerations, including revenues from the sale of assets and reductions in the direct cost of providingwater services, may also motivate governments to introduce private sector participation in this industry. However, because water is a basic human necessity, the introduction of private participation in this industrysector may raise social, economic, and national security concerns. Private participation in the global water andwastewater industry can take a number of forms– including privatization, greenfield projects, concessions, leases,operation and management contracts, and outsourcing– and most countries employ a mix of methods. A handfulof European firms dominate trade and investment in the global water and wastewater utilities market.
This paper examines the nature of private participation and competition in the global water and wastewaterservices market, reviews various methods of market management, identifies major participants in the water andwastewater services sector, and discusses trade and investment trends in this industry.
Keywords: Water, wastewater, environmental services, private sector participation

Contents
PageIntroduction . . . . . . . . . . . . . . . . . . . . . . . . . . . . . . . . . . . . . . . . . . . . . . . . . . . . . . . . . . . . . . 1The Water and Wastewater Management Market . . . . . . . . . . . . . . . . . . . . . . . . . . . . . . . . . 1The Nature of Competition in the Water and Wastewater Utilities Sector . . . . . . . . . . . . . . 3Incentives for Private Sector Participation . . . . . . . . . . . . . . . . . . . . . . . . . . . . . . . . . . . . . . . 8Forms of Private Participation . . . . . . . . . . . . . . . . . . . . . . . . . . . . . . . . . . . . . . . . . . . . . . . . 13
Privatization . . . . . . . . . . . . . . . . . . . . . . . . . . . . . . . . . . . . . . . . . . . . . . . . . . . . . . . . . . . 13Greenfield projects . . . . . . . . . . . . . . . . . . . . . . . . . . . . . . . . . . . . . . . . . . . . . . . . . . . . . 15Concessions, Leases, Operation and Management Contracts, and Outsourcing . . . . . . . 21
Concession . . . . . . . . . . . . . . . . . . . . . . . . . . . . . . . . . . . . . . . . . . . . . . . . . . . . . . . . 22Leases . . . . . . . . . . . . . . . . . . . . . . . . . . . . . . . . . . . . . . . . . . . . . . . . . . . . . . . . . . . . 23Operation and management contracts . . . . . . . . . . . . . . . . . . . . . . . . . . . . . . . . . . . . 23Outsourcing . . . . . . . . . . . . . . . . . . . . . . . . . . . . . . . . . . . . . . . . . . . . . . . . . . . . . . . . 25
Mixed approaches to private participation . . . . . . . . . . . . . . . . . . . . . . . . . . . . . . . . . . . 26Price Effects of Introducing Private Participation . . . . . . . . . . . . . . . . . . . . . . . . . . . . . . . . . 27The Regulation of Water and Wastewater Utilities . . . . . . . . . . . . . . . . . . . . . . . . . . . . . . . . 28Trade and Investment in Water and Wastewater Services . . . . . . . . . . . . . . . . . . . . . . . . . . . 29Leading Global Water Service Companies . . . . . . . . . . . . . . . . . . . . . . . . . . . . . . . . . . . . . . 32Other Participants in the Water and Wastewater Services Industry . . . . . . . . . . . . . . . . . . . . 34
Boxes
1. Water Rights . . . . . . . . . . . . . . . . . . . . . . . . . . . . . . . . . . . . . . . . . . . . . . . . . . . . . . . . . . 52. Water Prices and Subsides . . . . . . . . . . . . . . . . . . . . . . . . . . . . . . . . . . . . . . . . . . . . . . . . 30
Figures
1. Global water utilities and water treatment market, 2000 . . . . . . . . . . . . . . . . . . . . . . . . . 22. Access to water supply and sanitation, by region, 2000 . . . . . . . . . . . . . . . . . . . . . . . . . 33. Characteristics of selected methods of waster sector privatization . . . . . . . . . . . . . . . . . 144. Advantages to the public sector of selected methods of water sector privatization . . . . 145. Desalination capacity, by region, 1999 . . . . . . . . . . . . . . . . . . . . . . . . . . . . . . . . . . . . . . 196. Form of private participation in water and sewerage projects in developing
countries, 1990-2001 . . . . . . . . . . . . . . . . . . . . . . . . . . . . . . . . . . . . . . . . . . . . . . . . . . . . 227. Trade in the wastewater treatment and water utilities industry, 1994-2000 . . . . . . . . . . 32
Tables
1. Motives for introducing private sector participation in water andwastewater services . . . . . . . . . . . . . . . . . . . . . . . . . . . . . . . . . . . . . . . . . . . . . . . . . . . . . 9
2. Desalination capacity by country, 1996 and 1999 . . . . . . . . . . . . . . . . . . . . . . . . . . . . . . 20

1 The wastewater treatment category, as defined by Environmental Business International, Inc. (EBI) comprisesthe removal and treatment of wastewater from commercial and industrial establishments and residences, while thewater utilities category comprises the sale of water to municipalities, industries, and other consumers. EBI compilesmuch of the trade and market data available for the environmental services industry. 2 Environmental Business International (EBI), “The Global Environmental Market by Region, 2000" spreadsheetreceived via e-mail, July 31, 2003.
1
Introduction
The water and wastewater services industry comprises those activities related to the provision of
water and wastewater management to residential customers and industry. These activities include the
transportation, purification, and distribution of potable water; the removal, treatment, and disposal of
wastewater; and incidental services such as metering and billing, construction, design, maintenance and
repair, testing, consulting, and facilities management. Although water and wastewater services typically
are provided by state-owned monopolies, opportunities for private sector firms have increased
significantly in recent years, as privatization, concession agreements, and operation and management
contracts have become increasingly common.
This paper examines the nature of, and recent trends in, the global water and wastewater services
market. Specifically, the study examines the nature of private participation and competition in these
markets, reviews various methods of market management, identifies major participants in the water and
wastewater services sector, and discusses trade and investment trends in this industry.
The Water and Wastewater Management Market
The global market for water utilities and wastewater treatment1 increased at an average annual
rate of 3 percent during 1996-2001, reaching $160.8 billion. Developed countries account for the vast
majority of this market (figure 1) as such countries have the financial means to construct expensive water
and wastewater infrastructure. In 2000, Australia, Canada, Japan, New Zealand, the United States, and
the countries of Western Europe together accounted for 87 percent of the global market for wastewater
treatment and water utilities.2 Because most residents of developed countries already have access to

3 EBI, The U.S. Environmental Industry and Global Market, Sept. 2002, exhibits 1-11 and 1-76. 4 EBI, Environmental Business Journal, vol. VIII, No. 8, Aug. 1995, p. 2; EBI, Environmental Business Journal,vol. IX, No. 4, Apr. 1996, p. 7; EBI, Environmental Business Journal, vol. X, No. 4, , p. 11; EBI, EnvironmentalBusiness Journal, vol. XI, No. 7, 1998, p. 7; EBI, Environmental Business Journal, vol. XII, No. 9/10, 1999, p. 3;U.S. Department of Commerce (USDOC), “1999 U.S. Environmental Trade Balance,” found at Internet addresshttp://www.web.ita.gov/, retrieved Feb. 19, 2004; EBI, “2000 U.S. Environmental Trade Balance,” spreadsheetreceived via e-mail, Nov. 1, 2001; EBI, “U.S. Environmental Trade Balance, 2001,” spreadsheet received via e-mail,July 31, 2003; and EBI, “2002 U.S. Environmental Trade Balance,” spreadsheet received via e-mail, Jan. 22, 2004. 5 EBI, Environmental Business Journal, vol. XVI, No. 5/6, 2003, p. 5.
2
Africa 1%'Western Europe 30% —
šJapan 14%
— United States 39%
— Middle East 1%( Australia/New Zealand 2%
( Latin America 3%
( Canada 3%
( Eastern Europe 2%
( Asia 6%
Figure 1Global water utilities and water treatment market, 2000
Total = $159.4 billion
Source: Environmental Business International (EBI), “The Global Environmental Market by Region,2000,” spreadsheet received via email, July 31, 2003.
water and wastewater infrastructure (figure 2), growth in the water utilities and wastewater treatment
market likely will be low. In developing countries, however, there is a large unmet demand for such
services. Thus, water and wastewater markets in such countries may experience relatively rapid growth if
funding for water and wastewater infrastructure becomes available.
The United States accounts for a larger share of the global market for water utilities and
wastewater treatment (37 percent in 2001) than any other single country.3 During 1994-2002, revenues
earned by the U.S. wastewater treatment and water utilities industry increased at an average annual rate of
3 percent to $61.2 billion in 2002.4 Overall, the U.S. industry comprised 87,000 firms5 and

6 EBI, “Jobs in the U.S. Environmental Industry 1989-2002,” spreadsheet received via e-mail, Jan. 22, 2004. 7 For example, see EPA, Drinking Water Infrastructure Needs Survey, Second Report to Congress, Feb. 2001,found at Internet address http://www.epa.gov/safewater/needs.html. 8 Other “network industries,” which rely on an infrastructure network in place to provide delivery of services,include telecommunications, electric power, and natural gas distribution. For more information on competition in theelectricity and natural gas industries, see USITC, Electric Power Services: Recent Reforms in Selected ForeignMarkets, (USITC publication 3370), Nov. 2000; and USITC, Natural Gas Services, (USITC publication 3458), Oct.2001.
3
100
80
60
40
20
0Per
cent
of p
opul
atio
n w
ith a
cces
s to
wat
er s
uppl
y/sa
nita
tion
Figure 2Access to water supply and sanitation, by region, 2000
Asia Oceania North America Africa Latin Amer. & Caribbean Europe
Source: Pacific Institute for Studies in Development, Environment, and Security, The World’s Water 2002-2003: The Biennial Report on Freshwater Resources, pp. 271-272.
employed 255,400 workers in 2002.6 Some reports indicate that the U.S. water/wastewater industry will
require a great deal of infrastructure spending in the coming years,7 largely to replace or upgrade older
facilities.
The Nature of Competition in the Water and Wastewater Utilities Sector
Several network industries8 have achieved a certain level of private-sector competition in the
production segments of their industries. In such systems, telecommunications companies or electricity
generators can send their signals or their electric power over shared transmission lines, by paying

9 “Economic Regulation of Water companies,” p.6. 10 “Economic Regulation of Water Companies,” pp. 10-11; and Michael Klein and Timothy Irwin, “RegulatingWater Companies,” The World Bank Group, Public Policy for the Private Sector, Note No. 77, May 1996.
4
regulated fees to the owners of the transmission network. However, introducing competition in
production-related segments is more difficult in the water industry for several reasons. First, there are
clear limits on the location of water collection and treatment facilities. Water availability is sharply
limited by environmental constraints and characterized by scarcity in many parts of the world. In
addition, water supplies are often subject to national laws regarding water rights and to international
considerations in the case of important transboundary lakes and rivers (box 1). Quality issues also make it
difficult to introduce competition in production-related water industry segments. Because water treatment
standards and abilities may differ substantially between firms, a shared network of transmission pipes
means that one water utility might apply high standards of treatment to its water, but its customers might
not receive the same high quality product. Finally, the cost structure of water systems makes it difficult
to introduce market competition. The largest component of the final cost of water is the cost of its
transportation through the network. Since the water pipe infrastructure forms the network, to be jointly
used by all market entrants, the highest-value section of the process is the one that is least amenable to
cost savings through competition.9 Despite the difficulty in introducing competition into the water and
wastewater management industry, some indirect and direct competition occurs in these markets. Two
indirect forms of competition– competitive bidding and yardstick competition– may introduce some
market discipline into the water and wastewater industry. Competitive bidding is a form of market-based
price discovery, in which firms submit bids for the rights to own or manage a water utility, or to provide
related services. Bidders offer to charge consumers the lowest water price that is consistent with the
performance requirements specified in the contract. In most cases, the competition ends once the contract
begins, and the winner becomes the monopoly service provider. The bidding process forces firms to
commit to the lowest cost, most efficient operation for which they can ensure a reasonable rate of return.10

5
Box 1Water Rights
Within each country, and often in different regions within a single country, rights to water are distributed usingwidely varying systems. One distinguishing characteristic is whether the government or the private sectorholds water rights. In countries where water technically belongs to the government, it is often the case thatprivate interests may access the water, or lease rights for various purposes. In Mexico, for example, waterrights belong to the government, but can be converted into long-term concessions, typically for 30 years.These concessions may not be traded, and may be forfeited following three years of non-use or inefficientuse.1 In South Africa, water is deemed a public good, and the state has the power to control it and license itsuse. Brazil retains government ownership of water rights, but permits private entities to use the water withauthorization.2 In Argentina, water rights are held by the government, and tied to land ownership, and watermust be used on the land to which the rights are designated. Provincial laws govern the distribution of therights, and the provincial governments generally distribute water rights to the private sector through water useconcessions.3
In countries where water rights reside with the private sector, there are variations in the ability of water rightsholders to transfer or sell those rights. In Chile, water rights have traditionally been private and tradable.4 Inthe United States, state governments typically oversee the allocation of water rights, and different regimespredominate in the eastern and western parts of the country. In the east, landowners are generally entitledto use waters adjacent to their property in a “reasonable” manner. These landowners retain their water rightsregardless of whether or not the rights are used. In the west, water rights largely depend on a “priorappropriation” system, whereby the first user of a water source has priority, as long as that individual or entitycontinues to use those waters.5
In some countries, water rights ownership is mixed. In Japan, national laws define surface water (lakes andrivers) as public property, but all rights to groundwater lie with the landowner. In principle these rights may betransferred or sold, but there is no active market in place to do so. Transfers of water rights stemming fromsurface water must be approved by the government.6 In Spain, ownership of water rests with the state, butregional water authorities may grant water use rights, or water titles, by concession. These water titles aregenerally connected with land ownership. An active market exists for both temporary and permanent watertitles, which are traded among agricultural users and urban water supply utilities.7
1 Mateen Thobani, “Formal Water Markets: Why, When, and How to Introduce Tradeable WaterRights,” The World Bank Research Observer, vol. 12, No. 2, Aug. 1997, pp. 167-168.
2 R. Maria Saleth and Ariel Dinar, “Water Challenge and Institutional Response: A Cross-CountryPerspective,” Feb. 5, 1999, found at Internet address http://www.worldbank.org/, pp. 9-10.
3 World Bank, Argentina, Water Resources Management: Policy Elements for Sustainable Developmentin the XXI Century, p. 7 and Annex A, pp. 7, 10-12.
4 Mary M. Shirley et. al., “Reforming the Urban Water System in Santiago, Chile,” World Bank, PolicyResearch Working Paper No. 2294, Mar. 2000, found at Internet address http://www.wto.org/, retrievedDec. 4, 2001.
5 Betsy A. Cody, “Western Water Resource Issues,” Congressional Research Services Issue Brief, May3, 2001, found at Internet address http://www.cnie.org/, retrieved September 5, 2001.
6 Masahiro Nakashima, “Water Allocation Methods and Water Rights in Japan,” in “Water Allocation,Rights, and Pricing: Examples from Japan and the United States,” World Bank Technical Paper No. 198,Feb. 1993, found at Internet address http://www.wto.org/, retrieved Dec. 4, 2001.
7 Manuel Mariño and Karin E. Kemper, “Institutional Frameworks in Successful Water Markets,” WorldBank Technical Paper No. 427, Feb. 1999, found at Internet address http://www.worldbank.org/, retrievedSept. 18, 2002.
In a water utilities system characterized by yardstick competition, firms compete in terms of
efficiency, with a regulator determining a rate schedule comparing the costs of monopoly providers, and
devising a formula for service rates under which the most efficient water utilities maximize profits. The
system provides a competitive method of determining prices so long as the different water companies face

11 See “Economic Regulation of Water Companies,” p. 12, for a discussion of yardstick competition. 12 Office of Water Services, The OFWAT Periodic Review 1999. Final Determinations: Future Water andSewerage Charges 2000-05, Nov. 1999, found at Internet address http://www.ofwat.gov.uk/pubslist/pr1999.htm,retrieved Jan. 10, 2002. 13 Daniel Rivera, Private Sector Participation in the Water Supply and Wastewater Sector (Washington, DC:World Bank, 1996), pp. 16-17.
6
similar market circumstances, or the regulator takes inherent cost differences into account when setting
prices.11 In the United Kingdom, for example, the water industry regulator calculates the efficiency and
circumstances of each water utility, and sets rates for each company based on these calculations. The
calculations include general assumptions regarding overall market conditions, such as the cost of capital
and environmental regulations. All water companies are assumed to be able to address such conditions
with similar levels of efficiency.12 In Australia, water utilities are owned by the local governments, but
they operate on a commercial basis (without subsidies, so revenues must match or exceed costs).
Regulators encourage each utility to match the fee structure of the most efficient firm, pressuring all of
them to increase their operating efficiency. In Chile, water service providers must reduce costs below
“yardstick levels” set by regulators, which are based on the presumed efficiency of a “model enterprise.”
Rates are reviewed every five years, factoring in capital costs, service standards, investment plans, and
other factors pertaining to each service provider.13
To date, the United Kingdom is the only country which permits common carriage competition in
its water market, allowing a water service provider to use facilities such as the pipe network or water
treatment plant of another provider, as in the electric power and telecommunication industries. The
Competition Act of 1998 required all British water companies to develop a code under which they will
permit other companies to access their infrastructure, for the purposes of allowing competition. In July,
2002, U.K. water firms established revised codes based on guidelines published by OFWAT, the U.K.
water sector regulator, in March 2002. In addition, U.K. water firms enhanced market transparency in

14 Office of Water Services (OFWAT), “Market Competition in the Water and Sewerage Industry;” InformationNote No. 10, April 1992; “The Current State of Market Competition,” July 2000, found at Internet addresshttp://www.ofwat.gov.uk/, retrieved Aug. 12, 2002; OFWAT, “The Economic Regulator for the Water and SewerageIndustry in England and Wales,” May 2002, found at Internet address http://www.ofwat.gov.uk/, retrieved June 4,2003; and OFWAT, Annual Report 2002-03 of the Director General of Water Services, May 22, 2003, found atInternet address http://www.ofwat.gov.uk/, retrieved June 4, 2003. 15 Such “cross-border competition” is permitted in the United Kingdom under certain circumstances. Office ofWater Services (OFWAT), “Market Competition in the Water and Sewerage Industry,” May 2002, found at Internetaddress http://www.ofwat.gov.uk/, retrieved Aug. 29, 2002; and Simon Cowan, “The Water Industry,” inCompetition in Regulated Industries (Oxford: Oxford University Press, 1998), pp. 168-174. 16 OECD, “Global Trends in Urban Water Supply and Waste Water Financing Management: Changing Roles forthe Public and Private Sectors,” Nov. 2000, p. 20. 17 OECD, “Global Trends in Urban Water Supply and Waste Water Financing Management,” p. 32.
7
May 2002 by publishing the prices they intended to charge for access to their facilities. As of May 2002,
however, the actual extent of common carriage competition remained limited.14
Although it is difficult to institute, some direct competition between private sector water firms
does occur. For example, some measure of direct competition may occur when consumers have the
opportunity to choose between proximate water or wastewater service networks.15 The most prominent
form of direct competition is seen among the small-scale water vendors that deliver bulk water supplies to
areas without piped water systems. In communities without access to piped water service through a
utility, a large share of water is often supplied through independent, private-sector actors selling water
from trucks or buckets. Sellers may have access to private water supplies, illegal connections to the local
water utility’s pipes, or legitimate connections to the local water utility from which they buy in bulk and
then resell to users without pipe access.16 According to some studies, such water providers service over
half of the urban population in many developing countries. These providers range from very small
businesses to large enterprises. They are almost exclusively private and unregulated, although there are
examples of community-based water and/or sanitation associations.17 In general, such water supply
markets are very competitive in terms of both price and water quality. By its nature, this type of service
is limited to water supply services, and does not generally include water treatment services, although
customers may have the choice of several providers, and may be able to include water quality
characteristics in their purchase decisions.

18 Tova Maria Solo, “Competition in Water and Sanitation,” World Bank, Public Policy for the Private Sector,Note No. 165, Dec. 1998. 19 Daniel Rivera, Private Sector Participation in the Water Supply and Wastewater Sector (Washington, DC:World Bank, 1996), p. 40.
8
While it is generally assumed that the customers of such water suppliers would prefer access to
piped water, and small-scale water vendors tend to be displaced as countries install piped water networks
and implement other water sector reforms, that is not always the case. In one instance, a large private-
sector consortium charged with extending water service in parts of Buenos Aires found that customers
were unwilling to hook up to the new piped service, as they were able to obtain water at better prices from
neighborhood truck vendors. In that case, customer refusal to connect to the new water services led to the
renegotiation of the concession contract. In other cases, however, private water service providers are
granted exclusive rights of supply over their service areas, making private water vendors illegal, thus
limiting the potential for competition.18
Incentives for Private Sector Participation
Countries introduce private sector participation into their water and wastewater utilities sectors
for a number of reasons (table 1). The introduction of a profit motive may increase efficiency as
compared to public management of the water system. Private sector firms have increased the productivity
of water and wastewater utilities by improving their planning and control systems, their accounting
procedures, and their procurement systems. Private firms also have been noted for customer service
improvements.19 In addition, many countries introduce private sector participation in order to build out
infrastructure. This motive is particularly important for developing countries with limited funds for
infrastructure development, but can also be an important incentive for countries wishing to limit the use
of tax revenues for the purpose of building or improving water and wastewater systems.
The goals of increased efficiency and infrastructure development often go hand in hand. In many
situations where public operation of the water system has not achieved the desired objectives, a private
firm is brought in to address the situation. Contracts providing for private operation of municipal water

20 See Daniel Rivera, Private Sector Participation in the Water Supply and Wastewater Sector, pp. 3, 11-12, 21-22. Following Argentina’s extended economic crisis, Aguas Argentinas defaulted on $700 million in mostly foreigndebts in April 2002, but did not expect the default to affect water and sewage service to its 7.7 million customers inthe Buenos Aires area. U.S. Department of State telegram, “Argentina: Economic Daily April 10, 2002,” messagereference No. 01226, prepared by U.S. Embassy, Buenos Aires, Apr. 10, 2002.
9
Table 1Motives for introducing private sector participation in water and wastewater services
Goal Method of achieving goal
Increase efficiency of water/wastewaterservice operations
Introduction of a profit motive often leads to lower costs, lower prices,and water conservation
Increase stock of water infrastructure Invite private investment to increase available capital without raisingtaxes to unsustainable levels.
Raise revenue for government Privatize water sector by selling off existing, government-owned waterassets.
Reduce government responsibilities Transfer ownership or management of the water services industry tothe private sector.
Source: Compiled by the U.S. International Trade Commission.
supply and treatment systems tend to tie contractor revenues to the most efficient operation of the system,
and to require the contracting firm to construct or repair a given number of water pipes or meters, to
establish new water connections for a set number of households, or in other ways contribute to the
extension or maintenance of the existing water infrastructure. For example, two and a half years after
Aguas Argentinas (a consortium of private firms) took over management of the Buenos Aires water
system, water coverage had increased by 9 percent, sewerage coverage by 7 percent, and water production
capacity by 26 percent, due to increased efficiency and investment in infrastructure. In addition, Aguas
Argentinas improved the drinking water quality, increased water pressure, reduced leakage, and improved
both the billing system and average repair times.20 In Guinea, a joint venture (SEEG, owned 51 percent
by two French water companies and 49 percent by the Guinean Government) won a 10-year lease contract
to operate and maintain Guinea’s urban water supply facilities, and to handle the billing and collection
functions. Through infrastructure development and improved management, SEEG increased water
production capacity by 283 percent, to 28.7 million cubic meters annually, resulting in a 24-percent

21 Daniel Rivera, Private Sector Participation in the Water Supply and Wastewater Sector, pp. 15-16, 24-25, 37-38; and Penelope J. Brook Cowen, “Lessons from the Guinea Water Lease,” World Bank, Public Policy for thePrivate Sector, Note No. 78, Apr. 1999. 22 Penelope J. Brook and Alain Locussol, “Easing Tariff Increases: Financing the Transition to Cost-CoveringWater Tariffs in Guinea,” in Penelope Brook and Suzanne M. Smith, Contracting for Public Services: Output-BasedAid and its Applications (Washington, DC: World Bank, 2001). 23 OECD, “Global Trends in Urban Water Supply and Waste Water Financing and Management,” Nov. 2000, p.18.
10
increase in the share of the population with access to safe water, and a 92-percent increase in the number
of water connections between 1989 and 1996. The firm also increased the percentage of customers
covered by water meters from 5 percent to 98 percent. However, private sector participation in the
system coincided with a steady increase in water prices during 1989-1997, from a below-cost rate of
$0.12 per cubic meter to an above-cost rate of $0.83 per cubic meter. The resulting increase in private
water bills led to non-payment rates of almost 60 percent by 1996, and many water connections were
turned off for non-payment.21 Due to these problems, SEEG’s lease term was not renewed when it
expired in 1999, and the French companies left Guinea in early 2001. The Government of Guinea is
preparing a new competitive bid, but it is unclear whether it will be able to attract another private water
company to the country.22
Financial considerations, including revenues from the sale of assets and reductions in the direct
cost of providing water services, also may motivate governments to introduce private sector participation
in this industry. Under privatization, concessions, and certain other types of contracts, private water
companies assume the costs of water services provision (which are typically covered by direct user
charges), with government confining its role to regulation. For example, most water and wastewater
utilities in the United States have been publicly owned since the nineteenth century, and more than 85
percent of water utility companies in the United States remained publicly owned in 1999. However, cost
increases and reduced federal funding for infrastructure have encouraged U.S. municipalities to
reconsider private sector participation in the water and wastewater industry. In addition, legal changes at
the federal level have opened up new possibilities for private sector participation in the U.S. water and
wastewater services market.23 Specifically, until 1997, a water or wastewater facility financed through

24 Water Science and Technology Board (WSTB), Privatization of Water Services in the United States: AnAssessment of Issues and Experience (The National Academies Press, 2002), pp. 44-45, found at Internet addresshttp://books.nap.edu/, retrieved Aug. 12, 2003; and Robert L. Vitale, “Water-Related Projects: Catching the Wave,”1999, found at Internet address http://corporate.findlaw.com/, retrieved Aug. 13, 2003. 25 See Stilpon Nestor and Ladan Mahboobi, “Privatisation of Public Utilities: The OECD Experience,” Apr. 1999,pp. 1-3, found at Internet address http://www.ipanet.org/, retrieved Jan. 4, 2001. 26 Most Chilean water companies are state-owned, but operate as commercial firms. Economic Commission forLatin America and the Caribbean (ECLAC), “Progress in the Privatization of Water-Related Public Services: ACountry-by-Country Review for South America,” Jan. 2, 1997, found at Internet address http://www.cepis.ops-oms.org/muwww/fulltext/, retrieved Sept. 6, 2001.
11
tax-exempt federal bonds could endanger the tax-exempt status of such bonds if a private firm operated
that facility under a contract lasting more than five years. IRS Revenue Procedure 97-13 permits entities
to establish contracts that last as long as 20 years, while maintaining the tax-exempt status of their federal
bonds.24
Many countries face public opposition to introducing private participation in their water and
wastewater industries due to social, economic, and national security concerns.25 Since water is a basic
human necessity, many governments attempt to provide universal access to water service for all citizens, a
goal which may conflict with efforts to introduce market-based disciplines to the industry. For instance,
low-income residents may not be able to afford fair market rates for treated water, and some customers
may inhabit remote locations where it is not economically practical to supply water through pipe
networks. Private sector participation in the industry may raise the price of water to final consumers, as
certain government water subsidies are eliminated. However, it may be possible to structure contracts
with private water utilities in such a way as to take these goals into account. For example, contracts
might include requirements to install water pipes to provide universal service within an agreed area, or the
government might provide subsidies directly to low income residents, to ensure that all users are able to
pay for water services. In Chile, for example, the Government raised water and sewerage tariffs to market
rates over a 4-year transition period beginning in 1989, while providing direct subsidies to low-income
households.26
Private sector participation in the water/wastewater industry may be an effective way to promote
infrastructure investment, but it is precisely the least developed countries, with the greatest investment

27 Penelope J. Brook Cowen, “Getting the Private Sector Involved in Water - What to Do in the Poorest ofCountries?” World Bank, Public Policy for the Private Sector, Note No. 102, Jan. 1997. 28 For more information on these types of non-profit projects, see p. 34 of this report. 29 Organization for Economic Cooperation and Development (OECD), Global Trends in Urban Water Supply andWaste Water Financing and Management: Changing Roles for the Public and Private Sectors, Nov. 17, 2000, pp.43-46, found at Internet address http://www.oecd.org/, retrieved Oct. 19, 2001. 30 OECD, “Global Trends in Urban Water Supply and Waste Water Financing and Management: Changing Rolesfor the Public and Private Sectors,” Nov. 16, 2000, p. 17.
12
needs, that are the least attractive to private firms. These countries are often characterized by small
markets, generally inadequate infrastructure, little regulatory capacity, and political or economic
instability– all of which deter private firms from making investments that often take many years to yield a
profit.27 The World Bank, other development banks, and a few non-governmental organizations have
worked to alleviate this problem by directly financing a number of water-sector infrastructure projects in
developing countries that have not attracted private sector interest, or by working with the private sector
to structure contracts in ways to mitigate some of these concerns.28
The sensitivity of political leaders to issues that concern domestic water and wastewater also
creates additional uncertainty and potential risk for private investors that the latter do not confront in
other sectors.29 Particularly since the events of September 11, 2001, the U.S. Government has been
conscious of the dangers of disruption in water service, and concerned about security. Security
considerations must address threats to the physical infrastructure of pipe networks and water treatment
facilities, as well as concerns about overall water quality and health threats due to water contamination.
One final consideration is the firefighting system, which in most developed countries depends on
water service to a network of fire hydrants. These fire hydrants need to operate at a high level of water
pressure to be effective. It has been noted in some cases that splitting a municipal water supply network
into several sub-parts in order to create a competitive environment may reduce the water pressure below
the effective level, creating another hindrance to the introduction of competition into the system.30

31 These include Build-Operate-Transfer (BOT) and Build-Own-Operate (BOO) contracts, discussed in greaterdetail below. 32 “Completion of Manila Water Privatization,” International Finance Corporation Press Release No. 98/12, Aug.1, 1997, found at Internet address http://www.worldbank.org/ifc/pressroom/Archive/1997/, retrieved Aug. 6, 1999.
13
Forms of Private Participation
Private participation in the global water and wastewater industry can take a number of forms,
including privatization, greenfield projects,31 concessions, leases, operation and management contracts,
and outsourcing. The type of private sector participation chosen for local water markets depends on
social, economic, and regulatory objectives. In each case, the method of private sector entry into the water
industry is an effort to address a specific issue. Most countries employ a mix of methods. Figure 3
illustrates the primary attributes of each method of water sector privatization discussed herein. Figure 4
characterizes the advantages accruing to the public sector from employing each of those methods.
Governments may impose performance requirements on private sector participants, such as the
construction of a certain amount of new infrastructure, or the repair of old infrastructure. Performance
targets might specify a percentage of water pipes to be replaced, or a certain length of pipe. Other
requirements related to performance might include increasing service coverage, increasing the percentage
of wastewater treated, reducing waste in the system due to leakage and theft, or lowering water fees for
consumers. In the Philippines, for example, the two concessionaires that won contracts to manage
Manila’s water system are required to increase access to water supply services, fix leaky pipes, and
increase wastewater treatment coverage. The necessary repairs are expected to cost up to $7 billion over
the 25-year life of the contracts.32
Privatization
Direct privatization involves the sale of assets, such as water supply and distribution systems and
wastewater treatment plants, to a private sector firm. Privatization permits a government to raise money
from the sale of assets, and to improve the efficiency of local water service markets by introducing a

14
Figure 3Characteristics of selected methods of water sector privatization
Privatization BOO/BOT Concession Lease O/M Contract Outsourcing
Duration š——Indefinite———š š——————20-30 years————–——–š š——5-15 years——š š——3-7 years—–—š š———1-2 years—–—š
Ownership of assets š—————Private—————š š———————————————————Public———————————–——————————š
Source of capital investment š—————————————Private——–—————————š š——————————————Public——–——————–——–š
Scope of private sectorresponsibilities š——Entire system—š
Parts ofsystem š—————————————Entire system—————–————————š š—–Parts of system—š
Source: The World Bank Group, Urban Water & Sanitation, “Options for Private Sector Participation in Infrastructure,” found at Internet addresshttp://www.worldbank.org, retrieved Aug. 23, 2002; Jan G. Janssens, “The Provision of Water Services on the International Market: Building Public-PrivatePartnerships for Effective and Equitable WSS,” presented at GLOBE 2002, Vancouver, Canada, Mar. 13-15, 2002; and OECD, “Global Trends in Urban WaterSupply and Waste Water Financing Management: Changing Roles for the Public and Private Sectors,” Nov. 2000, p. 20.
Figure 4Advantages to the public sector of selected methods of water sector privatization
Privatization BOO/BOT Concession Lease O/M Contract Outsourcing
Revenue from salesof assets—————š
Private sector financing and/or expertise in expanding infrastructure——————————š
Transfer responsibility/costs of managing the system————————————————————————————————š
Private sector efficiency/expertise in performing all/some activities——————————————————————————————————————š
Source: The World Bank Group, Urban Water & Sanitation, “Options for Private Sector Participation in Infrastructure,” found at Internet addresshttp://www.worldbank.org, retrieved Aug. 23, 2002; and Jan G. Janssens, “The Provision of Water Services on the International Market: Building Public-PrivatePartnerships for Effective and Equitable WSS,” presented at GLOBE 2002, Vancouver, Canada, Mar. 13-15, 2002.

33 Privatisation International database, found at Internet address http://www.privatisationintle.com/, retrievedSept. 20, 2001. 34 Trade Partners UK, “Water Industries Market in Chile,” found at Internet addresshttp://www.tradepartners.gov.uk/, retrieved Aug. 20, 2003; Gabriel A. Bitran and Eduardo P. Valenzuela, “WaterServices in Chile,” World Bank, Public Policy for the Private Sector, Note No. 255, Mar. 2003; and World bank,Multilateral Investment Guarantee Agency (MIGA), “1988-1999 Privatization Transaction Data,” found at Internetaddress http://www.ipanet.net/, retrieved Aug, 24, 2001. 35 See Gisele Silva, Nicola Tynan, and Yesi Yilmaz, “Private Participation in the Water and Sewerage Sector -Recent Trends,” World Bank, Note No. 147, Aug. 1998, pp. 5-7.
15
profit motive, with the aims of reducing prices and providing customers with better service. Privatization
is most prevalent among industrial countries. Since 1989, there have been at least 29 instances worldwide
in which the ownership of water and wastewater treatment utilities has been formally transferred from the
public sector to private sector investors. The United Kingdom was the first country to privatize its water
industry, selling 100 percent of the equity in its 10 water utilities in November 1989, and remains the only
country to have privatized 100 percent of its water/wastewater utilities industry.33 Other countries that
have privatized water utilities have sold equity stakes of 20 to 70 percent to private investors. Germany
elected to retain just over 50 percent of the shares in public hands in two privatizations (in 1997 and
1999), as did Italy in 1996. Chile privatized five regional water utilities during 1998-2001, selling off
equity shares of up to 51 percent. As a result, private water firms provided services to over 75 percent of
Chilean households by 2001.34 Few countries have been willing to directly privatize the sector, however,
due to concerns over control, universal access to services, and political opposition.
Greenfield Projects
Countries in need of infrastructure, particularly developing countries without funds to invest in
large new projects, have turned to the private sector to construct and operate facilities. Such greenfield
projects generally follow a variant of the Build-Operate-Transfer (BOT) or Build-Own-Operate (BOO)
model.35 Private firms arrange financing and undertake the construction and operation of the project, and
in return, charge fees for water services throughout the life of the contract. These types of greenfield
projects typically involve 25- to 30-year contracts to ensure that the winning bidder has ample time to
recoup its investment. In many cases, the contract includes “take-or-pay” provisions, in which the

36 See Gisele Silva et. al., “Private Participation in the Water and Sewerage Sector - Recent Trends,” pp. 5-7.
16
government guarantees to purchase a minimum amount of output (water, water treatment, or wastewater
services) over the term of the contract, minimizing the risk to bidder. Private firms entering into BOT or
BOO contracts generally obtain private financing secured by the expected future income stream of each
project, requiring that lenders also be satisfied with the financial viability of the project. In some cases,
international development banks may provide direct financing or financial guarantees to induce private
firms to undertake investment in countries with small or uncertain water markets.
The private firms participating in such projects are generally large multinational firms, based in
either the construction and engineering industry or the water services industry. Often, firms representing
both industries will form a joint venture to fulfill a particular contract, which may or may not also include
local firms. As is the case with concessions and operation and management contracts (discussed below),
greenfield contracts are typically awarded on the basis of competitive bidding. Contracts can be designed
so that the private service provider sells water directly to final consumers, or on a bulk basis to a
municipally owned water utility, which then handles final distribution services and customer billing
operations.
The emerging economies of Asia have frequently utilized greenfield projects such as BOTs and
BOOs as a means of extending their water infrastructure networks to meet rapidly growing needs in this
area.36 China, Thailand, Malaysia, and the Philippines have all awarded a number of BOT concessions as
a way to build much-needed water and wastewater infrastructure without increasing government
expenditures. In China, where only 24 percent of the population has access to sanitation services, private
funding of wastewater treatment infrastructure will likely become more important in the future. However,
private funding is deterred by a 1995 ruling from the Chinese Ministry of Foreign Trade and Economic
Cooperation (MOFTEC) that proscribes foreign investors, or Chinese-foreign joint ventures, from owning
or operating water distribution networks. Foreign firms are thus required to sell treated water in bulk to
municipal governments, increasing costs and lengthening the total supply chain to the final consumer.
Examples of BOT projects in China include a 1998 contract for a water treatment plant in Chengdu,

37 On April 8, 2003, French firm Vivendi Environment announced its intention to change its name to VeoliaEnvironment. This name change was approved at a shareholders meeting on April 30, 2003. Veolia Environment,press releases, Apr. 8 2003 and Apr. 30 2003, found at Internet address http://www.vivendienvironnement.com/,retrieved June 5, 2003. 38 USDOC, ITA, “Market Research: Environmental Technologies Industries,” found at Internet addresshttp://web.ita.doc.gov/ete/, retrieved Sept. 5, 2001; and USDOC, ITA, “Water and Wastewater Treatment,” IndustrySector Analysis Report, July 1, 2000. 39 “BOT Mode Used for Building Sewage Treatment Plant in Beijing,” Xinhua News Agency, found at WaterOnline, Internet address http://www.wateronline.com/, retrieved Sept. 10, 2001. 40 World Resources Institute, World Resources 2000-2001 (Washington, DC: WRI, 2000), Table HD.3, found atInternet address http://www.wri.org/ retrieved Dec. 6, 2001. 41 U.S. Dept. of State telegram, “IMI: Southeast Asia Regional Water Supply Market,” prepared by U.S. EmbassyManila, message reference No. 02496, Apr. 13, 2000. 42 U.S. Dept. of State telegram, “IMI: Southeast Asia Regional Water Supply Market,” prepared by U.S. EmbassyManila, message reference No. 02496, Apr. 13, 2000.
17
Sichuan with a capacity of 400,000 tons per day. The contract was awarded to French-based Veolia
Environment,37 in cooperation with Marubeni Corp. of Japan. The foreign firms planned to invest $106.5
million. Contract terms are 15 years plus 30 months of construction time, after which ownership of the
water treatment facility is to be returned to the city of Chengdu.38 In September 2000, U.S. Golden State
Holding Group Corp. won a $24-million contract to build a sewage treatment plant in Beijing, capable of
treating 100,000 tons of sewage per day.39 In Vietnam, where only 43 percent of the population has
access to safe drinking water and only 21 percent receive sanitation services,40 the government estimates
that $150 million in new investment will be needed annually to meet water industry targets during 1999-
2020, with government investment totaling only $21 million in 1999. Additional funding is expected to
come from a combination of aid and private sector investment, with the Vietnamese government
embarking on a program of BOT projects, concentrating initially on water supply projects.41
Countries with moderate or large stocks of infrastructure may also find BOT projects useful in
specific circumstances. In Thailand, for example, there were five separate BOO or BOT projects under
development during 2000 by the water authority responsible for the provinces outside of Bangkok, with
more expected to be announced. Even though more than 80 percent of Bangkok’s population has access
to water and sanitation services, only 40 percent of the areas outside of metropolitan Bangkok are
provided with such services.42 In Chile, water supply infrastructure covers most of the population but
wastewater treatment facilities are very limited, so several BOT deals have been concluded in the
43 Economic Commission for Latin America and the Caribbean (ECLAC), “Progress in the Privatization ofWater-Related Public Services: A Country-by-Country Review for South America,” Jan. 2, 1997, found at Internetaddress http://www.cepis.ops-oms.org/muwww/fulltext/, retrieved Sept. 6, 2001. 44 Data on desalination capacity reflect the combined capacity of those facilities that can produce at least 500cubic meters of desalinated water per day. Desalination capacity data for 1999 is the latest available. 45 The World’s Water 2000-2001, Table 19, p. 288.
18
wastewater area.43 BOT and similar types of contracts have not generally been used in industrialized
countries which already possess a large stock of water and wastewater infrastructure.
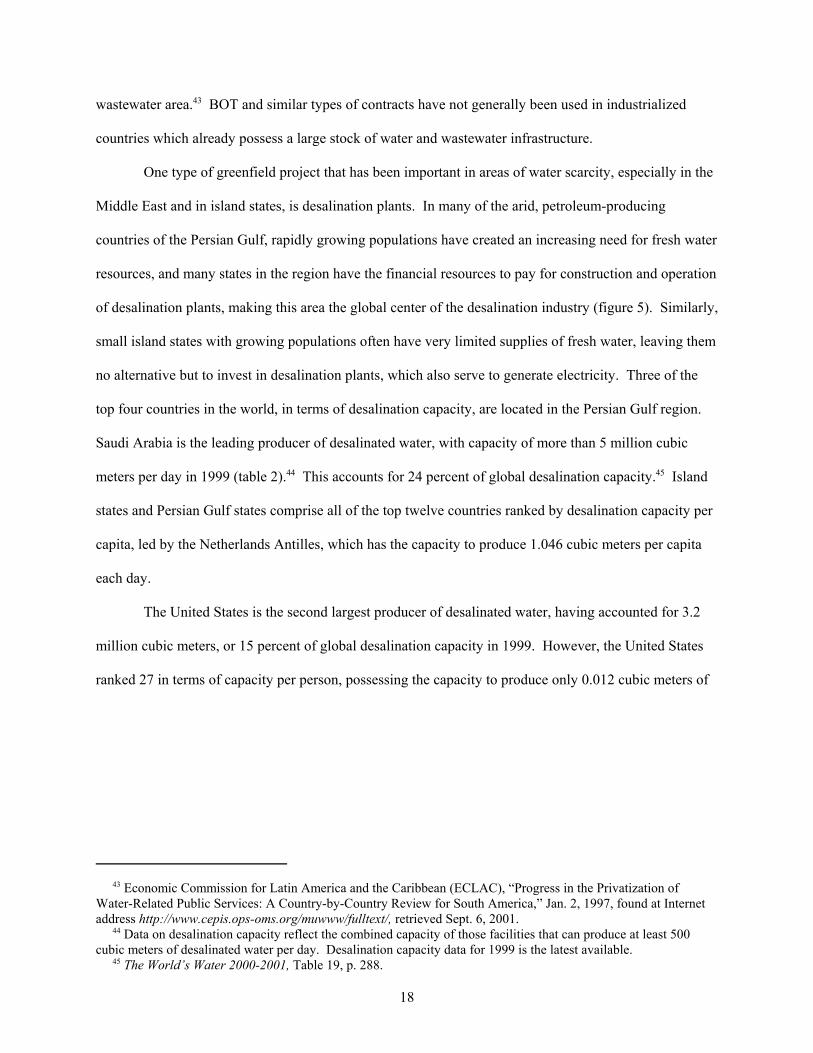
One type of greenfield project that has been important in areas of water scarcity, especially in the
Middle East and in island states, is desalination plants. In many of the arid, petroleum-producing
countries of the Persian Gulf, rapidly growing populations have created an increasing need for fresh water
resources, and many states in the region have the financial resources to pay for construction and operation
of desalination plants, making this area the global center of the desalination industry (figure 5). Similarly,
small island states with growing populations often have very limited supplies of fresh water, leaving them
no alternative but to invest in desalination plants, which also serve to generate electricity. Three of the
top four countries in the world, in terms of desalination capacity, are located in the Persian Gulf region.
Saudi Arabia is the leading producer of desalinated water, with capacity of more than 5 million cubic
meters per day in 1999 (table 2).44 This accounts for 24 percent of global desalination capacity.45 Island
states and Persian Gulf states comprise all of the top twelve countries ranked by desalination capacity per
capita, led by the Netherlands Antilles, which has the capacity to produce 1.046 cubic meters per capita
each day.
The United States is the second largest producer of desalinated water, having accounted for 3.2
million cubic meters, or 15 percent of global desalination capacity in 1999. However, the United States
ranked 27 in terms of capacity per person, possessing the capacity to produce only 0.012 cubic meters of

46 Brackish water is a combination of saltwater and freshwater, having a relatively low salinity level. Oceanlink,Interactive Glossary, found at Internet address http://www.jbpub.com/, retrieved Aug. 14, 2003. 47 Andrea Beebe, “Largest U.S. Seawater Desalination Plant Coming to Tampa Bay,” Water Engineering &Management, Jan. 2000, p. 8; and William Suratt, Mark Maimone, and Thomas Missimer, “Soothing Water Woeswith Desalination,” American City & County, Jan. 2000, p. 62; and Tampa Bay Water, “Tampa Bay SeawaterDesalination Plant Providing Drinking Water to the Region,” news release, Mar. 28, 2003, found at Internet addresshttp://www.tampabaywater.org/, retrieved Aug. 14, 2003.
19
Middle East 51%'
! Canada 0%
Other 0%'
( South and Central America 1%( Other Western Hemisphere 1%
( Africa 6%
( Asia and Pacific 11%
*Europe 14%
'United States 15%
Figure 5Desalination capacity,1 by region, 1999
Total capacity = 21.1 million cubic meters per day
1 Data on desalination capacity reflect the combined capacity of those facilities that canproduce at least 500 cubic meters of desalinated water per day.
Source: The World’s Water 2000-2001, pp. 287-288.
desalinated water per capita each day. The majority of U.S. plants treat brackish water,46 while only three
U.S. plants treat seawater. The largest of these seawater desalination plants is located in Tampa Bay, FL,
and began operation in March of 2003.47
Much of the construction and operation of desalination facilities is performed by firms based in
the United States and Europe. In November 2000, for example, U.S.-based AES Corporation secured a
contract to build a $450 million power/desalination plant in Oman, along with a 15-year contract under
which the plant will sell the electric power and water produced by the plant to the

20
Table 2Desalination capacity by country, 1996 and 1999
Country 1996 19991999,
per capita
———Cubic meters per day——Cubic meters/day
per person
Top twelve countries in terms of desalination capacity, 1999Saudi Arabia . . . . . . . . . . . . 5,006,194 5,106,742 0.253United States . . . . . . . . . . . . 2,799,000 3,234,042 0.012United Arab Emirates . . . . . 2,134,233 2,184,968 0.775Kuwait . . . . . . . . . . . . . . . . . 1,284,327 1,285,527 0.670Spain . . . . . . . . . . . . . . . . . . 492,824 797,511 0.020Japan . . . . . . . . . . . . . . . . . 637,900 777,838 0.006Libya . . . . . . . . . . . . . . . . . . 638,377 703,027 0.130Qatar . . . . . . . . . . . . . . . . . . 560,764 567,414 0.995Italy . . . . . . . . . . . . . . . . . . . 483,668 521,298 0.009Iran . . . . . . . . . . . . . . . . . . . 423,427 437,771 0.007Bahrain . . . . . . . . . . . . . . . . 282,955 419,155 0.626India . . . . . . . . . . . . . . . . . . 115,509 342,219 0.000
Top twelve countries in terms of per capita desalination capacity, 1999Netherlands Antilles . . . . . . 210,905 230,273 1.047Qatar . . . . . . . . . . . . . . . . . . 560,764 567,414 0.995United Arab Emirates . . . . . 2,134,233 2,184,968 0.775Kuwait . . . . . . . . . . . . . . . . . 1,284,327 1,285,527 0.670Bahrain . . . . . . . . . . . . . . . . 282,955 419,155 0.626Cayman Islands . . . . . . . . . . 16,986 20,621 0.516Antigua and Barbuda . . . . . . 28,533 28,533 0.408Malta . . . . . . . . . . . . . . . . . . 145,031 146,331 0.385Saudi Arabia . . . . . . . . . . . . 5,006,194 5,106,742 0.253Bermuda . . . . . . . . . . . . . . . 13,171 13,171 0.220Bahamas . . . . . . . . . . . . . . . 37,474 53,800 0.179Libya . . . . . . . . . . . . . . . . . . 638,377 703,027 0.130
Source: Peter J. Gleick, The World’s Water 2000-2001, 2000 (Island Press: Washington,DC), table 19, p. 288; and Pacific Institute, “Table 16. Desalination Capacity by Country,January 1, 1996,” Apr. 21, 1999, found at Internet addresshttp://www.worldwater.org/table16.html, retrieved June 5, 2003.

48 U.S. Dept. of State telegrams, “Omani Government Signs Agreement with AES for Barka Power/ DesalinationPlant,” prepared by U.S. Embassy, Muscat, message reference No. 05626, Nov. 26, 2000; “Advocacy Achievementsin Oman,” message reference No. 00463, prepared by U.S. Embassy, Muscat, Jan. 31, 2001; and AES Corporationwebsite, “Barka,” found at Internet address http://www.aes.com/businesses/businesscfm?projectID=667, retrievedJan. 8, 2002. 49 U.S. Dept. of State telegrams, “Shaykh Diyab fin Zayed on UAE’s Shuweihat Independent Water and PowerProject,” message reference No. 01061, prepared by U.S. Embassy Abu Dhabi, Feb. 21, 2001; and “U.S. Firm WinsBillion Dollar Deal,” message reference No. 04678, prepared by U.S. Embassy, Abu Dhabi, Aug. 14, 2001.
21
Omani Government.48 In August 2001, the Government of the United Arab Emirates awarded a $1.6
billion BOO contract to U.S.-based CMS Energy and U.K.-based International Power, for construction
and operation of a desalination and power plant project. The firms will take a 40-percent stake in this
project, which will eventually reach a total capacity of 300 million gallons per day of desalination and
5000 megawatts of electric power.49
Desalination projects differ from many other water sector projects in a few important ways. First,
desalination plants do not rely on an extensive distribution network, and thus, they are not natural
monopolies. It is possible for a number of independently operating desalination plants to build individual
connections to a country’s distribution network, or to supply bulk water by truckload, and thus compete
on terms of price and/or quality. Second, many BOT and similar contracts for the construction and
operation of desalination facilities are offered by relatively wealthy states, such as certain Middle Eastern
countries. Thus, countries may invite private participation in such projects not only to attract financing
for the construction of new assets, but to attract necessary technical expertise and engineering skills that
may not be locally abundant.
Concessions, Leases, Operation and Management Contracts, and Outsourcing
Concessions, operation and management contracts, and leases are common methods of private sector
entry into the water and wastewater services industry. The World Bank publishes data for water sector
projects initiated in developing countries during 1990-2001. Of 203 private-sector contracts included in
the database, concessions accounted for 90 of the total number of contracts (figure 6), and 69 percent of

50 World Bank, Private Participation in Infrastructure: Trends in Developing Countries in 1990-2001, pp. 144,149, found at Internet address http://rru.worldbank.org/ppibook/, retrieved Aug. 19, 2003.
22
Concession 44%'
— Privatization 8%
( Management contracts and leases 20%
'Greenfield 28%
Figure 6Form of private participation in water and sewerage projects in developingcountries, 1990-2001
Total = 203 projects
Source: The World Bank, Private Participation in Infrastructure: Trends in DevelopingCountries in 1990-2001, p. 149, found at http://rru.worldbank.org/ppibook/, retrieved Aug. 19,2003.
total investment in private sector water and wastewater projects. Management contracts and leases
together accounted for 41 of the total number of contracts.50
Concessions
One way for a country to inject greater efficiency into its water services market without actually
transferring ownership of publicly-owned assets to the private sector is to grant a concessions to a private
firm. The firm does not assume ownership of the asset, such as a water utility firm or a wastewater
treatment plant, but does assume control of its operation and management, as well as financial
responsibility for necessary investment in the expansion and maintenance of the water and/or wastewater
system infrastructure. These firms generally collect fees directly from their customers, with profits

51 Economic Commission for Latin America and the Caribbean (ECLAC), “Progress in the Privatization ofWater-Related Public Services: A Country-by-Country Review for South America,” Jan. 2, 1997, found at Internetaddress http://www.cepis.ops-oms.org/muwww/fulltext/, retrieved Sept. 6, 2001. 52 Pierre Guislain and Michel Kerf, “Concessions - The Way to Privatize Infrastructure Sector Monopolies,”World Bank, Note No. 59, Oct. 1995; and OECD, “Global Trends in Urban Water Supply and Waste WaterFinancing and Management,” Nov. 2000, p. 25. 53 World Bank, “Options for Private Sector Participation in Infrastructure,” found at Internet addresshttp://www.lnweb18.worldbank.org/essd/essdext.nsf/18ByDocName/WaterResourcesManagament, retrieved Aug.23, 2002. 54 Kate Bayliss, “Water Privatization in Africa: Lessons from Three Case Studies,” Nov. 15, 2001, found atInternet address http://attac.org/fra/toil/doc/psiru03.htm, retrieved Aug. 21, 2002. 55 Ibid. 56 Penelope Brook Cohen and Tyler Cohen, “Deregulated Private Water Supply: A Policy Option for DevelopingCountries,” Cato Journal, vol. 18, No. 1, p. 28.
23
dependent on the efficiency of their operations.51 Concession contracts are typically for terms of 20 years
or longer, in order to allow the firm sufficient time to profit from its investments.52 Concession contracts
are generally subject to competitive bidding, which forces companies to propose the most efficient
contract terms under which they can achieve an acceptable return on investment.
Leases
Leases are very similar to concession contracts; however, these arrangements differ in terms of
which entity bears financial responsibility for infrastructure improvements. Under a concession, the
private-sector concessionaire is responsible for both financing and carrying out infrastructure
investments, whereas under a lease, the private-sector participant executes infrastructure improvements
while the owner of the infrastructure finances such improvements. In addition, the duration of leases,
typically 8 to 15 years, tends to be shorter than that of concession contracts.53 Because leases do not
involve large-scale private-sector investment and require less government regulation than concessions,
leasing arrangements are considered easier to establish than concession contracts.54 In 1989, a consortium
which included French firms Veolia Environment and SAUR won a lease for the water systems in
seventeen Guinean cities.55 Other countries in which lease arrangements have been established include
the Czech Republic, France, Italy, Poland, Senegal, and Spain.56

57 Lee and Jouravlev, p. 36; and OECD, “Global Trends in Urban Water Supply and Waste Water FinancingManagement: Changing Roles for the Public and Private Sectors,” Nov. 2000, p. 21. 58 The World Bank indicates that management contracts typically last three to five years, while the OECD reportsthat management contracts, among other types of contracts, frequently have a duration of five to seven years. OECD, “Global Trends in Urban Water Supply and Waste Water Financing Management: Changing Roles for thePublic and Private Sectors,” Nov. 2000, p. 20; and World Bank, Urban Water and Sanitation, “Options for PrivateSector Participation in Infrastructure,” found at Internet address http://www.worldbank.org/, retrieved Aug. 23, 2002. 59 OECD, “Global Trends in Urban Water Supply and Waste Water Financing Management: Changing Roles forthe Public and Private Sectors,” Nov. 2000, p. 20. 60 Lee and Jouravlev, p. 50; and Pierre Guislain and Michel Kerf, “Concessions - The Way to PrivatizeInfrastructure Sector Monopolies,” World Bank, Note No. 59, Oct. 1995. 61 Gisele Silva, Nicola Tynan, and Yesi Yilmaz, “Private Participation in the Water and Sewerage Sector - RecentTrends,” World Bank, Public Policy for the Private Sector, Note No. 147, Aug. 1998, p. 6. 62 In 1999, U.S. Filter was acquired by French firm Veolia Environment. For more information on VeoliaEnvironment, see footnote 35.
24
Operation and Management Contracts
Under a management contract, a private firm assumes full day-to-day operational control of a
water company, but ownership remains with the government. Unlike a concession contract investment in
infrastructure and other capital expenses remain with the public sector.57 Contracts are generally shorter
than is typical of greenfield projects (such as BOT deals) or concession agreements, averaging 3-7
years,58 because the private firm does not need a long time period to recoup its investment. While the
short time between competitive bids introduces an element of competition,59 management contracts
provide fewer incentives to increase efficiency than do privatizations, concessions, or BOT-type
greenfield projects, since firms frequently receive a flat fee for their services. However, fees to private
firms under contract can be based on performance, encouraging firms to introduce greater management
efficiency into the system.60
Management contracts may be attractive to the private sector in countries where investment risk
is perceived to be high, as under such contracts, investment risk rests solely with the government. Many
developing countries turn to the World Bank or one of the regional development banks for investment
funding, sharing the risk with those institutions while taking advantage of private sector management
expertise.61 Several U.S. cities have also chosen to introduce private sector participation in their water
systems through such management contracts. For example, U.S. Filter62 has held contracts to operate and
manage wastewater treatment facilities in Oklahoma City since 1984. Oklahoma City most recently

63 Water Partnership council, “Oklahoma/lU.S. Filet, “ found at Internet addresshttp://www.waterpartnership.org/, retrieved Sept. 8, 2003; and U.S. Filter, “Oklahoma city Awards ContractRenewal for Wastewater Services to U.S. Filter Operating Services, “ news release, Dec. 16, 2002, found at Internetaddress http://www.usfilter.com., retrieved Sept. 8, 2003. 64 “Severn Trent to Operate Delaware Wastewater Treatment Plant,” WaterWorld, Feb. 27, 2002, found atInternet address http://ww.pennnet.com/, retrieved Aug. 23, 2002. 65 World Bank, “Options for Private Sector Participation in Infrastructure,” found at Internet addresshttp://www.lnweb18.worldbank.org/essd/essdext.nsf/18ByDocName/WaterResourcesManagement, retrieved Aug.23, 2002. 66 Terence R. Lee and Andrei Jouravlev, “Private Participation in the Provision of Water Services,” found atInternet address http://www.thewaterpage.com/, retrieved Sept. 6, 2001, p. 33. 67 USDOC, Brazil - Water and Wastewater Concession Opps.
25
extended this relationship in December 2002, by granting U.S. Filter a contract to operate the city’s
wastewater treatment facilities for an additional five years.63 Also, in 2002, Severn Trent Services, Inc.,
a U.S. affiliate of British-firm Severn Trent Plc, won a contract to operate a wastewater treatment facility
in Lewes, Delaware.64 Other locations in which private sector firms participate in the water and/or
wastewater sector under operation and management contracts include Gaza, Amman, Bethlehem/Hebron,
and Trinidad and Tobago.65
Outsourcing
In some cases, private firms are not responsible for the operation of an entire water utility, but are
paid a set fee to provide a particular service. Examples include continuous or recurrent services such as
meter reading, billing, and equipment maintenance, and one-time services such as environmental impact
statements, staff training, and design services for expansion projects. Contracting out such services to
private firms allows the water utility to increase its efficiency by concentrating its energies on the core
tasks of water supply, water treatment, and wastewater treatment. Such outsourcing arrangements may
also provide access to technology, equipment, and expertise not resident in the water utility.66
Outsourcing of incidental services is used in many countries. In Brazil, responsibility for water
supply and treatment rests with the municipalities, many of which contract with state-owned sanitation
companies (known as Companhias de Saneamento Básico or CESBs) to provide these services for terms
of 25 to 50 years.67 The CESBs frequently outsource particular services, such as metering and billing, to

68 Many of the existing municipal contracts with Brazil’s CESBs are due to expire by 2005, so it is possible thatsome of these contracts could go to the private sector after that date. USDOC, Brazil - Water and WastewaterConcession Opps. 69 Chilean state-owned water companies have also awarded long-term contracts to private sector firms for theconstruction, operation, and maintenance of water supply or wastewater systems. Economic Commission for LatinAmerica and the Caribbean (ECLAC), “Progress in the Privatization of Water-Related Public Services: A Country-by-Country Review for South America,” June 1998, pp. 29-31; and USDOC, Brazil Environmental Export MarketPlan; and USDOC, Brazil - Water and Wastewater Concession Opps. 70 Penelope J. Brook Cowen, “Getting the Private Sector Involved in Water - What to Do in the Poorest ofCountries?” World Bank, Note No. 102, Jan. 1997. 71 Helen Nankani, “Testing the Waters - A Phased Approach to a Water Concession in Trinidad and Tobago,”World Bank, Note No. 103, Jan. 1997.
26
the private sector.68 In Chile, 13 publicly-owned, regional water companies provide water supply and
sewerage services to 90 percent of the population. These companies outsource many functions from
smaller companies, including meter reading, billing and collection, system maintenance, and construction
of new water assets.69
Mixed approaches to private participation
Some developing countries have used a step-by-step approach to attract private firms to the water
sector, introducing short-term private management while gradually raising water prices, developing
regulatory capacity, or making other changes designed to mitigate market risk in the water sector, with a
view to eventually privatizing or offering a long-term concession.70 In Trinidad and Tobago, for example,
the government introduced private sector involvement in the water industry through a two-phase
approach. In the first phase, which took effect in April 1996, a 5-year management contract was awarded
for operation of the water system, after which the incumbent would have first rights of negotiation on a
long-term concession agreement. If negotiations on the long-term agreement were unsuccessful, the
concession would be awarded through competitive bidding.71 In Mexico City, the Federal District Water
Commission split the operations of its water system into four areas in 1993, and awarded 10-year
contracts to four private sector firms to operate and improve the system. The Water Commission retains
ownership of the infrastructure and maintains regulatory oversight over the contracts. The contracts are
split into three phases, with the initial two phases structured as fee-for-service contracts. The first phase

72 USITC staff interview, Mexican National Water Commission, Mexico City, Oct. 25, 2001; Lee and Jouravlev,pp. 37-38; and OECD, “Global Trends in Urban Water Supply and Waste Water Financing Management: ChangingRoles for the Public and Private Sectors,” Nov. 2000, p. 22. 73 Organization for Economic Cooperation and Development (OECD), Global Trends in Urban Water Supply andWaste Water Financing and Management: Changing Roles for the Public and Private Sectors, Nov. 17, 2000, p. 8. Found at Internet address http://www.oecd.org, retrieved Oct. 19, 2001. 74 Ibid. Inefficiencies in the design and operation of publicly provided water infrastructure services often includesporadic maintenance allowing infrastructure to fall into disrepair.
27
involves the replacement of leaky water pipes and the implementation of a more efficient billing system.
In the second phase, contractors will conduct a census of water users and install new water meters. In a
planned third phase of the new system, contractors were to assume responsibility for water distribution,
system maintenance, and bill collection, along with the associated commercial risk of such activities. As
of October 2001, however, there were no plans to implement the final phase.72
Price Effects of Introducing Private Participation
When water and wastewater services are supplied by the public sector, it is common for the
government to keep consumer prices artificially low, either for political or social reasons. A common
social objective is to assure that water is available to those unable to pay the full cost of the service.
Typically the government covers the gap between water revenues and the true cost of providing such
services through a direct subsidy to the incumbent water utility, which comes from general tax revenues.
When private sector provision of water and wastewater services is introduced, the service contract
generally requires the private service provider to operate on a commercial basis, covering the cost of its
operations through its revenues. For this reason, consumers’ water prices often rise with the introduction
of private sector participation.73 Prices also may rise with private sector involvement because concessions
and other contracts frequently require the private sector provider to make improvements to existing water
and wastewater infrastructure, or to extend infrastructure to new customers. The cost of these service
improvements is then reflected in consumer prices.74 For example, following the privatization of British
water facilities in 1989, OFWAT– the British water regulator– permitted the newly-privatized firms to
raise prices due to the substantial investment backlog inherited by those new firms. Specifically,

75 “Private Passions,” The Economist, July 19, 2003, found at Internet address http://web1.epnet.com/, retrievedAug. 20, 2003; Ofwat, “Water Prices to Fall by 14% Now– and Stay Down,” news release, July 27, 2003, found atInternet address http://www.gnn.gov.uk/, retrieved Aug. 20, 2003; and Ofwat, “Review Brings Cut in Prices andMajor Programme of Spending on Environmental Improvements,” news release, Nov. 25, 1999, found at Internetaddress http://www.gnn.gov.uk/, retrieved Aug. 20, 2003. 76 Michael Klein and Timothy Irwin, “Regulating Water Companies,” Public Policy for the Private Sector, NoteNo. 77, World Bank, May 1996. See also: Simon Cowan, “The Water Industry,” Competition in RegulatedIndustries, Dieter Helm and Tim Jenkinson (eds.), (Oxford University Press: Oxford, 1998). 77 Michael Klein, Economic Regulation of Water Companies, Policy Research Working Paper 1649, World Bank,Sept. 1996, found at Internet address http://www.worldbank.org/, retrieved Dec. 10, 2001. See also: Michael Kleinand Timothy Irwin, “Regulating Water Companies,” Public Policy for the Private Sector, Note No. 77, World Bank,May 1996.
28
compliance with European directives on water quality required significant capital investment. However,
efficiency gains and the accomplishment of most investment goals led OFWAT to lower prices in 1999.75
The Regulation of Water and Wastewater Utilities
As noted above, the cost of installing competing water and/or wastewater infrastructure can be
prohibitively expensive, and thus, water and wastewater utilities generally are natural monopolies.76
Since the water sector typically is not governed by market disciplines, effective regulators are required to
perform several functions. Regulators are needed to ensure that providers do not abuse their monopoly
power by charging unfair prices for water and wastewater services. Regulators may also require suppliers
to provide services of a certain quality. Examples include setting water quality standards, and service
response times for repairs or customer complaints.77 Many governments require water supply utilities to
provide universal access to all customers within their catchment areas, an obligation which can greatly
increase the cost and difficulty of providing water services. In areas of water scarcity, regulators may
also impose limits on water extracted from underground aquifers or surface water sources such as lakes
and rivers in order to conserve water supplies and to ensure adequate water for the ecosystem. Successful
regulation also requires a certain level of political independence. Without freedom from market
interference by elected officials, regulators may support political objectives rather than economically
sound market decisions.
Quality and performance standards are among the most common responsibilities of water sector

78 Estimates of regulatory coverage compiled by the Commission. See: World Bank, International Directory ofUtility Regulatory Institutions, found at Internet address http://www.worldbank.org/, retrieved Sept. 4, 2002. Seealso: Michael Klein, Economic Regulation of Water Companies, Policy Research Working Paper 1649, World Bank,Sept. 1996, found at Internet address http://www.worldbank.org/, retrieved Dec. 10, 2001. 79 Michael Klein, Economic Regulation of Water Companies. 80 Vivendi Environment, 2002 Reference Document Summary, pp. 17-18, found at Internet addresshttp://www.veoliaenvironnement-finance.com/, retrieved June 5, 2003; Suez, Annual Report 2002, found at Internetaddress http://www.suez.com/, retrieved June 5, 2003; and Thames Water, “Where We Operate,” found at Internetaddress http://www.thames-water.com/, retrieved June 5, 2003.
29
regulators.78 In addition, regulators frequently have authority over questions of private sector contract
design and administration, and price regulation. These regulatory responsibilities also may include
establishing incentives for consumers and suppliers, in support of objectives such as conserving water or
improving service performance without raising prices. It appears that regulators less frequently address
matters of consumer subsidies and transfers, and consumer protection directly (box 2).79
Trade and Investment in Water and Wastewater Services
Due to data limitations, it is not possible to determine the extent of global trade or investment in
the water and wastewater utilities industry. However, anecdotal evidence suggests that France, Germany,
and the United Kingdom dominate such transactions. For example, French firm Veolia Environment
provides water services to more than 110 million persons and operates in about 100 countries, French
firm Suez supplies water services to about 125 million persons on five continents, and German firm RWE
provides water services to about 70 million persons in 46 different countries.80 British firms such as
Kelda Group and AWG also serve customers outside of their home market. The vast majority of global

30
Box 2 Water Prices and Subsidies
Water prices typically consist of flat-rate service tariffs, under which all customers are charged a uniform price,volume-based tariffs that determine fees according to the volume of water used, or a combination of the two.Flat-rate tariffs ensure that all customers can afford water services, but discourage water conservation, anissue of increasing concern in many parts of the world. Canada uses flat rates due, in part, to its abundanceof water resources. Flat rates also continue to be used in parts of Great Britain, due to fears that water sectorreforms may deprive low-income households of water services.1
Volumetric tariffs require metering of individual consumers, an unaffordable investment in many countries.This type of tariff is often designed in such a way that each “block” of water consumed is progressively moreexpensive, providing an incentive for conservation. By contrast, some countries use decreasing block rates,which offer discounts to users of greater amounts of water, but discourages water conservation. Decreasingblock rates were formerly used in France, until a recent switch to increasing block rates. In Taiwan, bothincreasing and decreasing block rates are used: increasing block rates for the first four volumetric blocks anddecreasing block rates for the following three blocks. Austria, the Czech Republic, Hungary, and Poland usevolumetric pricing exclusively.2 Countries often use a combination of flat rate and volumetric tariffs. Certainservices, such as initial connection to the network, are priced on a flat-rate basis, while water distribution ispriced on a volumetric basis. In some cases, a basic level of water is priced at a flat rate, but once ahousehold exceeds that level, additional water is priced at volumetric rates.
Water prices are generally set or approved by the public sector, which has an interest in ensuring that allresidents have access to water services, regardless of their ability to pay.3 As a result, most countriessubsidize water services either directly or indirectly.4 In the more common case of indirect subsidies, totalwater service fees paid by consumers do not cover the utility’s costs. The difference is covered by publicsector payments to the utility, which ultimately derive from general tax revenues. In some cases, revenue fromlow-cost customers, such as consumers in high-density neighborhoods, may subsidize the provision of serviceto high-cost customers, such as those located at high elevations, or at considerable distances from others.
There are also countries in which consumers receive direct subsidies for water. In Chile, for example, aneconomic means test is applied to determine whether poor customers may receive “water stamps” to covera portion of their periodic water bills.5 Direct subsidies have the virtue of clarifying the economic costs of waterservice provision, and allowing the political system to decide which customers should receive subsidies.
1 Michael Klein, Economic Regulation of Water Companies, Policy Research Working Paper 1649,World Bank, Sept. 1996, p. 15, found at Internet address http://www.worldbank.org/, retrieved Dec. 10,2001; World Bank, Water Pricing Experiences: An International Perspective, Technical Paper 386, Oct.1997, p. 4 and p. 37; OECD, The Price of Water: Trends in OECD Countries, 1999, p. 47, found atInternet address http://www.sourceoecd.org/, retrieved Sept. 4, 2001; and Peter Gleick ed., The World’sWater 2002-2003, (Washington, DC: Island Press, 2002), p. 72.
2 OECD, The Price of Water: Trends in OECD Countries, 1999, p. 59; and World Bank, Water PricingExperiences: An International Perspective, p. 4.
3 OECD, The Price of Water: Trends in OECD Countries, 1999, p. 158.4 Ibid., p. 115 and p. 158.5 OECD, Global Trends in Urban Water Supply and Waste Water Financing and Management:
Changing Roles for the Public and Private Sectors, Nov. 17, 2000, p. 54, found at Internet addresshttp://www.oecd.org/, retrieved Oct. 19, 2001.

81 Nations trade services through two principal channels. The first channel, cross-border trade, entails sendingindividuals, information, or money across national borders. The second channel, affiliate transactions, entails sellingservices through affiliated firms established or acquired by multinational companies in foreign markets. For furtherinformation, see USITC, Recent Trends in U.S. Services Trade 2002, Pub. No. 3514, May 2002. 82 Environmental Business International (EBI), “2002 U.S. Environmental Trade Balance,” spreadsheet receivedvia e-mail, Jan. 22, 2004. 83 U.S. imports in this sector increased steadily from $1.4 billion in 1994 to $5.8 billion in 2001, but decreased to$5.5 billion in 2002. 84 The U.S. trade deficit in this sector increased steadily from $1.1 billion in 1994 to $5.57 billion in 2001, butdecreased to $5.26 billion in 2002. 85 EBI, Environmental Business Journal, vol. VIII, No. 8, Aug. 1995, p. 2; EBI, Environmental BusinessJournal, vol. IX, No. 4, Apr. 1996, p. 7; EBI, Environmental Business Journal, vol. X, No. 4, , p. 11; EBI,Environmental Business Journal, vol. XI, No. 7, 1998, p. 7; EBI, Environmental Business Journal, vol. XII, No.9/10, 1999, p. 3; U.S. Department of Commerce (USDOC), “1999 U.S. Environmental Trade Balance,” found atInternet address http://www.web.ita.gov/, retrieved Feb. 19, 2004; EBI, “2000 U.S. Environmental Trade Balance,”spreadsheet received via e-mail, Nov. 1, 2001; EBI, “U.S. Environmental Trade Balance, 2001,” spreadsheetreceived via e-mail, July 31, 2003; and EBI, “2002 U.S. Environmental Trade Balance,” spreadsheet received via e-mail, Jan. 22, 2004. 86 With regard to the subject time period, U.S.-based water and wastewater affiliates of RWE would not includeAmerican Water Works, whose acquisition by RWE will likely not be completed until mid-2003, but would includeE’Town Water, a New Jersey-based water utility that was acquired by Thames Water in November 1999. ThamesWater, in turn, merged with RWE in November 2000 and currently serves as the management company for RWE’sinternational water and wastewater operations. Thames Water, “About Us,” found at Internet addresshttp://www.thames-water.com/, retrieved July 30, 2002; and RWE, “Water and Wastewater,” found at Internetaddress http://www.rwe.com/, retrieved July 30, 2002.
31
trade in the water and wastewater utilities industry likely occurs through sales by foreign affiliates, as it is
often infeasible to carry out such activities across borders.81
Data reflecting U.S. trade in the water utilities and wastewater treatment industry encompass both
cross-border trade and affiliate sales but do not distinguish between the two modes of delivery. These data
indicate that the U.S. water utilities and wastewater treatment industry registered exports totaling $0.24
billion and imports totaling $5.5 billion in 2002, resulting in a trade deficit of $5.26 billion (figure 7).82
Exports remained relatively stable during 1994-2002, fluctuating slightly between $0.2 billion and $0.37
billion. By contrast, imports increased at an average annual rate of 19 percent, from $1.4 billion in 1994
to $5.5 billion in 2002.83 Consequently, the trade deficit registered by the U.S. water utilities and
wastewater treatment industry increased at an average annual rate of 22 percent84 during 1994-2002.85
The United States’ growing trade deficit is likely a result of increased purchases from U.S.-based
affiliates of European firms such as Veolia Environment, Suez, RWE,86 and British firm Kelda Group,
each of which acquired U.S. water and wastewater affiliates during the subject time period. On a

87 Data reflecting water utilities and wastewater treatment trade by state is available only for 1999 exports. 88 U.S. Department of Commerce (USDOC), International Trade Administration (ITA), Environmental IndustryOverview: Revenues and Employment by Environmental Industry Segment (1999), found at Internet addresshttp://environment.ita.doc.gov/, retrieved Aug. 21, 2003. 89 David Hall, “Water Privatisation – Global Domination by a Few,” Corporate Watch, Autumn 2000, found atInternet address http://www.corporatewatch.org.uk/, retrieved Sept. 17, 2001.
32
Exports Imports Trade balance
Billion dollars6
4
2
0
-2
-4
-6
1994 1995 1996 1997 1998 1999 2000 2001 2002
Figure 7Trade in the wastewater treatment and water utilities industry, 1994-2000
Source: Compiled by the Commission
state-by-state basis,87 California accounted for $41.6 million, or 15 percent, of total U.S. exports by the
water utilities and wastewater treatment industry in 1999. Other states that accounted for a significant
share of such exports include New York (7 percent), Texas (7 percent), and Florida (6 percent).88
Leading Global Water Service Companies
A handful of European firms dominate the international water and wastewater utilities market.
These firms, which are largely based in France, Germany, and the United Kingdom, have expanded
overseas to compensate for a lack of new opportunities in their domestic water and wastewater markets.
Foremost among them are two French firms, Veolia Environment and Suez.89 Together, these firms won
over half of the largest private sector water contracts awarded between 1993 and 1997, worth $12.6

90 David Owen, Samer Iskandar, and Andrew Taylor, “Making a Big Splash,” The Financial Times, found atInternet address http://www.ft.com/, retrieved Sept. 12, 2001. 91 Ibid. 92 Organization for Economic Cooperation and Development (OECD), Global Trends in Urban Water Supply andWaste Water Financing and Management: Changing Roles for the Public and Private Sectors, Nov. 17, 2000, p. 20,found at Internet address http://www.oecd.org/, retrieved Oct. 19, 2001. 93 The merger is expected to be completed by the middle of 2003. RWE, Annual Report 2001, TruncatedFinancial Year July-Dec., found at Internet address http://www.rwe.com/, retrieved July 29, 2002. 94 Dimitri Nikas, “U.S. Water Utility Industry Still Fragmented, Opportunities Abound,” found at Internet addresshttp://www.standardandpoors.com/, retrieved Jan. 28, 2002.
33
billion.90 These firms benefit from long and varied experience in the water and wastewater services
industry, including experience with concessions, leases, and management contracts, which are common in
the French water sector. Both Veolia Environment and Suez, through their predecessors, are more than
100 years old and have water operations around the world. Veolia’s predecessor, Generale des Eaux, first
won a contract to operate a municipal water system in France in 1853.91 Other leading water and
wastewater companies include French firm SAUR, German firm RWE, and British firms AWG and
United Utilities.92
U.S. firms do not rank among the world’s leading water and wastewater utilities companies due
to result of recent mergers and acquisitions, including RWE’s acquisition of the largest U.S.
water/wastewater services firm, American Water Works, Inc.,93 and due to the fragmented and localized
nature of the U.S. market. Of the 54,000 water systems in the United States, 85 percent are municipally
owned.94 These relatively small firms do not possess sufficient financial resources to compete in
international markets with the large European water services firms. In addition, municipal firms within
the United States offer attractive opportunities for U.S. other firms interested in either growth or
diversification, reducing potential interest in foreign markets. The leading European firms also find U.S.
water and wastewater services firms attractive acquisition targets as they seek to enter the U.S. market.
Firms which do not specialize in water and wastewater services also play a role in the industry.
Engineering and construction firms, such as U.S. firm Bechtel or German firm Bilfinger+Berger, compete
for BOT contracts in the water sector. While non-specialist firms may engage a subcontractor to execute
parts of the BOT contract, some non-specialist firms have the capability of completing such projects using

95 “Global Market Rides Economic Recovery,” Environmental Business Journal, volume XII, No. 9/10, p. 20. See also: “MWH Pulls Out All the Stops on Risky U.K. Job,” Engineering News-Record, Jul. 23, 2001, p. 30. 96 World Bank/International Bank for Reconstruction and Development, Water Supply & Sanitation Blue Pages2000: The World Bank Sector Guide 2000. Found at Internet address http://www.worldbank.org, retrieved Dec. 3,2001. 97 Found at Internet address http://www.worldbank.org/html/fpd/water/projectlending.html, retrieved Aug. 13,2002.
34
in-house expertise. For example, in 1999, U.S. firm Montgomery Watson secured a five-year, $3.3
billion water/wastewater services project in the United Kingdom to provide all planning, design,
construction, management, and commissioning services.95
Other Participants in the Water and Wastewater Services Industry
Access to modern water and wastewater treatment services is vital to economic development. In
many developing countries, and in some areas within developed countries, water and wastewater services
markets are too small to attract private investment. As a result, it is common for development banks or
aid agencies to contribute resources to a new project, in order to induce private sector firms to undertake
new water infrastructure projects in developing countries. These organizations may provide funding and
expertise directly, as part of a project finance arrangement, or they may simply act as facilitators
attracting private funding to areas underserved by water and wastewater services.
The World Bank, for instance, engages in water and wastewater projects around the world as part
of its mission to eradicate poverty and foster sustainable economic development. Some of these projects
are managed wholly by the World Bank and its affiliated organizations, while others are managed
locally.96 As of April 2002, the World Bank was supervising 100 water and sanitation projects around the
world, valued at an estimated $5.3 billion or 22 percent of the World Bank’s infrastructure investments.97
In the Philippines, for example, the World Bank is funding a broad-based water supply and sanitation
project for 250 municipalities, budgeted at $183 million. The project will emphasize

98 U.S. Dept. of State telegram, “IMI: Southeast Asia Regional Water Supply Market,” prepared by U.S. EmbassyManila, message reference No. 02496, Apr. 13, 2000. 99 Industry representative, telephone interview by USITC staff on Dec. 10, 2001. For specific information abouttheir involvement in the water and wastewater utilities, see the website of each of the groups mentioned. 100 U.S. Dept. of State telegram, “IMI: Southeast Asia Regional Water Supply Market.” 101 U.S. Dept. of State telegram, “Jordan Tender: Ministry of Water and Irrigation - Wastewater TreatmentFacilities at As-Samra,” message reference No. 00988, prepared by U.S. Embassy, Amman, Feb. 24, 2000.
35
building water and wastewater services capacity at the municipal level, while promoting the principles of
full cost recovery and private sector management and operation.98
Other organizations involved in providing sustainable water and wastewater services include the
Asian Development Bank, USAID, the Water Supply and Sanitation Collaborative Council, WaterAid,
and the WaterLife Foundation.99 The Asian Development Bank, for example, has funded several water
industry projects in the Philippines.100 In Jordan, USAID provided a grant of 50 percent of the total
construction costs for the design, construction, operation, and maintenance of a wastewater treatment
plant.101