privatization and stock market creation: evidence from
TRANSCRIPT

CERGE
Center for Economics Research and Graduate Education
Charles University Prague
Privatization and Stock Market Creation:
Evidence from Transition Economies
Zuzana Fungáčová
Dissertation
Prague, June 2009

Zuzana Fungáčová
Privatization and Stock Market Creation:
Evidence from Transition Economies
Dissertation
Prague, June 2009


Dissertation committee
Jan Hanousek (CERGE-EI, Prague)
Randall Filer (Hunter College, CUNY)
Evžen Kočenda (CERGE-EI, Prague)
Jan Švejnar (University of Michigan)
Referees
Jarko Fidrmuc (Ludwig-Maximilians Universität, München)
Iftekhar Hasan (Lally School of Management & Technology, New York)


Acknowledgements
I would like to thank all the people who helped me complete this work. Many thanks go
to the members of my dissertation committee, Jan Hanousek, Randall Filer, Evžen
Kočenda and Jan Švejnar for their helpful comments and fruitful discussions. I would
also like to express my gratitude to all the scholars, with whom I had the opportunity to
discuss my work. I am particularly grateful to my main advisor, Jan Hanousek, first for
giving me the opportunity to pursue a PhD and especially for his patience, support, and
encouragement during the whole process. I am also thankful to CERGE-EI for providing
a pleasant place to work and the financial support. This research greatly benefited from
my stay as a visiting researcher and later working as economist at the Bank of Finland
Institute for Economies in Transition. I would like to thank the Bank of Finland for
providing such a stimulating research environment and all my colleagues for their
support.
My deepest personal thanks go to my family for their invaluable trust, support and
patience.


Table of Contents
INTRODUCTION .................................................................................................................................... 1 BUILDING A CASTLE ON SAND: THE EFFECTS OF MASS PRIVATIZATION ON
STOCK MARKET CREATION IN TRANSITION ECONOMIES ........................................ 4 1.1 Introduction ........................................................................................................................................ 4 1.2 Importance of a functioning stock market ....................................................................................... 7 1.4 Stock markets in transition economies ............................................................................................ 14
1.4.1 Factors determining the emergence of stock markets .................................................................. 15 1.4.2 Development at the emerging stock markets ............................................................................... 17
1.5 Mass privatization and stock market development ....................................................................... 20 1.6 Methodology and data ...................................................................................................................... 23
1.6.1 Data ............................................................................................................................................. 25 1.6.2 Measures of stock market development ....................................................................................... 27
1.7 Estimation results ............................................................................................................................. 30 1.7.1 Robustness check ......................................................................................................................... 33
1.8 Conclusion ......................................................................................................................................... 34 APPENDIX 1 ........................................................................................................................................... 40
CAN A WRONG ADMINISTRATIVE DECISION BE FIXED AGAIN? MASSIVE
DELISTING ON THE PRAGUE STOCK EXCHANGE........................................................ 49 2.1 Introduction ...................................................................................................................................... 49 2.2 Privatization and stock market development in the Czech Republic ........................................... 52
2.2.1 Delisting process.......................................................................................................................... 55 2.3 Determinants of delisting ................................................................................................................. 59 2.5 Data description ................................................................................................................................ 66
2.5.1 Descriptive statistics .................................................................................................................... 67 2.6 Estimation and results ...................................................................................................................... 70
2.6.1 Reasons for delisting.................................................................................................................... 74 2.6.2 Robustness check ......................................................................................................................... 77
2.7 Conclusion ......................................................................................................................................... 77 APPENDIX 2 ........................................................................................................................................... 83
DELISTING IN THE SLOVAK AND CZECH REPUBLIC: GRADUAL VERSUS BIG
BANG APPROACH .................................................................................................................... 91 3.1 Introduction ...................................................................................................................................... 91 3.2 Privatization and the development of the Slovak stock market .................................................... 92
3.2.1 Delisting process in the Slovak Republic .................................................................................... 96 3.3 Methodology ..................................................................................................................................... 99 3.4 Data .................................................................................................................................................. 101
3.4.1 Data description ......................................................................................................................... 102 3.5 Estimation results ........................................................................................................................... 104 3.6 Czech and Slovak connection: tale of separated twins ................................................................ 108 3.7 Conclusion ....................................................................................................................................... 110 APPENDIX 3 ......................................................................................................................................... 113

List of Figures
Figure A1.1: Development of stock market indices in some transition economies
Figure A2.1: Securities delisted from the PSE (1993 – 2004) – monthly data
Figure A2.2: Companies listed on the Prague Stock Exchange by size
Figure A2.3: Average price for delisted and non-delisted companies
Figure 3.1: Fulfilling information obligation by companies
Figure A3.1: Stock market capitalization in OECD countries (% of GDP in 2000)
Figure A3.2: Share issues listed on the Bratislava and Prague Stock Exchange


List of Tables
Table 1.1: Sources of stock market origins
Table 1.2: Estimations of the main model for market capitalization to GDP
Table 1.3: Estimations of the main model for growth in stocks traded
Table 1.4: Estimations of the main model for turnover ratio as dependent variable
Table 1.5: Estimations of the main model for new capital raised as dependent variable
Table A1.1: Primary and secondary priv. method implemented in transition countries
Table A1.2: Taxonomy of mass privatization
Table A1.3: Models of mass privatization
Table A1.4: EBRD indicators of financial system reform for groups of transition countries
Table A1.5: Stock market development indicators of transition countries and their comparison
with developed economies
Table A1.6: Definitions and data sources of the variables included in the analysis
Table A1.7: The main descriptive statistics of stock market indicators used
Table 2.1: Delisting criteria set by the Prague Stock Exchange
Table 2.2: Reasons for delisting firms from the Prague Stock Exchange in 1993 – 2006
Table 2.3: Linear probability model for delisting (y=1 for delisting)
Table 2.4: Multinomial logit model based on different reasons for delisting
Table A2.1: Companies listed and traded on the Warsaw and Budapest Stock Exchange
Table A2.2: The main stock market indicators from the PSE
Table A2.3: Pre-privatization descriptive statistics of size
Table A2.4: Pre-privatization descriptive statistics – financial variables
Table A2.5: Descriptive statistics of privatization variables: average price according to
privatization waves
Table A2.6: Descriptive statistics of privatization variables: average price
Table A2.7: Descriptive statistics of privatization variables: investment privatization funds
Table A2.8: Proportions of missing observations in subgroups of companies delisted due to
different reasons
Table A2.9: Definitions and data sources of the variables included in the analysis
Table A2.10: Results of the McNemar-type test (observed frequencies and 2)
Table 3.1: Share issues delisted from the BSSE and PSE by years
Table 3.2: Number of delisted companies by reasons (1994 – 2006)
Table 3.3: Logit model for delisting (y=1 for delisting)
Table 3.4: Logit model for the Czech and Slovak Republics (y=1 for delisting)
Table A3.1: The main stock market indicators from the BSSE
Table A3.2: Pre-privatization descriptive statistics of size
Table A3.3: Pre-privatization descriptive characteristics – financial variables
Table A3.4: Descriptive characteristics of privatization variables I
Table A3.5: Descriptive characteristics of privatization variables II
Table A3.6: Descriptive characteristics of post-privatization variables
Table A3.7: Definitions and data sources of the variables included in the analysis
Table A3.8: Results of the McNemar-type test (observed frequencies and 2)


1
INTRODUCTION
The importance of finance for growth has already been confirmed in numerous studies.
This relationship is especially crucial for the transition economies where financial
systems had to be built from the scratch after the collapse of central planning. This work
investigates stock markets that constitute an important part of the developed financial
system. Functioning stock markets are found to be necessary even if the country‟s
financial system is bank-based. In fact, in the transition countries stock markets are a
relatively new phenomenon. Even though in comparison to the developed countries these
markets remain still underdeveloped, they have been evolving as an important
complement to the banks in the course of the transition process (EBRD Transition Report
2006). Stock markets emerged to help with the transformation of the state-owned assets
to private hands and afterwards also with the rearrangement of ownership structures.
They were also expected to assist companies in raising capital; however, the low number
of initial public offerings in transition countries confirms that they have not succeeded in
doing so. In addition to these functions connected to the transition process, stock markets
in emerging countries are necessary in terms of performing the standard roles of financial
market that include providing information about possible investment and improvement of
resource allocation, monitoring investments and exerting corporate governance, risk
diversification and mobilization of savings (Levine, 2005).
Even before the stock markets were established, privatization process was
initiated in transition countries. Its main goal was ownership transformation that would
create suitable conditions for restructuring and development of the economy. As it is
discussed at the beginning of the first chapter, privatization methods differed by
countries. Some of them did not have any connection to the stock market, some only
indirect one. Mass privatization, however, was pushed forward by stressing that in
addition to equal distribution of wealth, it would also contribute to establishing a
functioning stock market. Since mass privatization was in different forms implemented in
the majority of transition countries, it stands out as an important factor influencing stock
market emergence and development. The literature that investigates determinants of stock
market development in general considers various institutional and macroeconomic

2
factors, the role of privatization in this process has however not been sufficiently
discussed so far.
The first chapter of this dissertation investigates the relationship between mass
privatization and stock market development in transition economies. The link is
investigated empirically using a panel of data that includes transition countries for which
corresponding data is available. The results confirm the hypothesis that mass privatization
exerted a negative influence on stock market functioning in the short and medium term.
Further, it appears that stock markets in countries with mass privatization were initially
perceived as mere byproducts of the privatization process. Such stock markets typically
not only failed in their core mission of providing capital for the corporate sector, but
generated negative investor sentiment and did little to catalyze economic growth.
The second chapter studies stock market emergence and development in the
Czech Republic, one of the first countries where mass privatization was implemented.
This economy later also served as a model for other transition countries. Czech
privatization can be regarded as an experiment which allows us to conclude under what
circumstances a viable market for shares could arise. Unlike the first chapter, where
aggregate country data is used, in this study we employ micro level data on firms that
participated in the mass privatization. We estimate the determinants of shares delisting
e.g. exclusion from public trading on the Prague Stock Exchange (PSE) during the period
1993 – 2004. Unlike its counterparts in Poland or Hungary, exceptionally large amounts
of shares were delisted from the PSE. Using the data on listed and delisted companies it
is showed that it was possible to prevent massive delisting if certain pre-privatization and
privatization characteristics of the companies had been taken into account when deciding
which companies to place on the stock exchange for public trading following the mass
privatization.
The third chapter deals with the analysis of delisting in the Slovak Republic,
where in comparison to the Czech Republic, delisting took place five years later. We
utilize a special relationship between the Czech and Slovak economy to investigate the
role of delisting in the process of stock market emergence. A close connection between
the Czech and Slovak market and a very similar unfavorable development on both

3
markets in the second half of 1990s, despite different institutional changes, emphasize the
importance of mass privatization implemented in these countries. Benefiting from the
results of our investigation in chapter two, we compare the development in Czech and
Slovak economies and analyze the role of delisting in the process of market emergence
and also reasons for delisting in both countries. Different delisting strategies and
subsequent development on these markets suggest that decisions of the stock exchange
authorities are crucial for further functioning of the market.

1.1 Introduction
4
CHAPTER 1
BUILDING A CASTLE ON SAND: THE EFFECTS OF MASS
PRIVATIZATION ON STOCK MARKET CREATION IN
TRANSITION ECONOMIES1
1.1 Introduction
Privatization, which enabled the transfer of state-owned enterprises to private hands, has
been considered one of the keystones of the transition process in all post-communist
economies and it became one of the first objectives of the newly formed governments.
The emphasis was put on fast transfer of ownership via privatization and market was
believed to ensure better and more efficient performance of the economy (Roland, 2001).
In fact, efficiency was the most important argument for privatization as the transfer of
ownership rights is crucial for the efficient allocation of resources in the economy. This
way, the argument went, economic growth should be initiated. However, to achieve these
objectives privatization itself is not sufficient since the functioning of a market economy
requires not only private ownership but also a certain institutional framework to support
the whole system. Roland (2001) in this respect stresses that the “policies of
liberalization, stabilization and privatization that are not grounded in adequate institutions
may not deliver successful outcomes” (p.30). More specifically, Zinnes et al. (2001)
argue that “privatization involving change-of-title alone is not enough to generate
economic performance improvements” (p.147). Therefore, what they call “deep”
privatization, including institutional and “agency”-related reforms, is necessary.
Unfortunately, taking into account the experience of the majority of transition
countries, privatization can hardly be considered “deep”. The first reason is the fact that
the state tends to use certain instruments (e.g. golden shares) to maintain control over
some enterprises. Thus there exists a contradiction in the way the state behaves, insofar as
1 For valuable comments I am indebted to Randall Filer, Jan Hanousek, Jan Kmenta, Evžen Kočenda, Filip
Palda and Jan Švejnar. The paper benefited from various presentations at CERGE-EI as well as VIIIth
International Conference Countries in Transition in Sofia (2005).

Chapter 1
5
it initiates and supports the privatization process while at the same time exercising certain
power over some companies2. This kind of discrepancy significantly slows down the
transition process and may result in incomplete privatization. Secondly, the necessity for
an institutional and legal framework was in many countries recognized only after the
privatization process itself had begun, which led to the creation of some institutions
within a very short period of time3. Given these problems, privatization as actually
conducted cannot be considered “deep” privatization in the sense defined above. An
important implication is the understanding that deep privatization not only enables private
ownership but at the same time influences the development of institutions (incurring
“hidden” costs) and through this channel the functioning of the whole economy.
Privatization also profoundly affects the financial sector. Financial systems, which
have no real function in the planned economy, must be developed from scratch during the
transition process. As Bonin and Wachtel (2002) note, financial sectors in all transition
countries continue to be relatively underdeveloped compared to the overall level of
development of their economies. The capital needed for restructuring of transition
economies (World Bank, 1996) has been far greater than initially weak, undercapitalized
domestic banks could provide. The possibilities of firms to finance their investment
activities was further limited by the inability of most to generate sufficient profits to
finance the restructuring through retained earnings, a situation that suggests a great deal
of reliance on equity financing. Thus, functioning stock markets became a necessity for
firms in transition economies seeking capital. Development and regulation of these
markets belong among the key issues that indicate the progress of reforms4.
Besides their traditional role in raising capital, stock markets in transition
economies have assisted in the transformation of state ownership and the rearrangement
of ownership structures. Despite the importance of stock markets in these economies, the
2 See Kočenda (1999); Kočenda and Valachy (2002) for calculations and more details.
3This problem was also pointed out by the World Bank Operations Evaluation Department (2004) when
evaluating Economies in Transition. The OED claims that one of the two reasons why “the initial emphasis
on rapid privatization to promote private sector development did not always achieve its intended effect was
the lack of a supporting legal and institutional framework” (p.1). 4 Development and regulation of stock markets are now tracked as key indicators of progress in reform. The
EBRD has constructed indicators reflecting progress of the financial system reform in transition countries.
For more details see EBRD Transition Reports 1995–2003.
1.1 Introduction
6
connection between privatization and stock market development has received little
attention. In a study on the impact of the privatization process on the development of
local stock markets, Perotti and Oijen (2001) argue that the resolution of political risk
through sustained privatization is an important source of growth in the emerging stock
markets. They show this on a sample of emerging markets where privatization using
stock markets took place in the 1980s. Stock markets in these countries were working
before the actual privatization and the privatization method was dependent on the
functioning stock market. This connection between privatization and stock markets,
unfortunately, cannot be directly applied to the transition economies where privatization
methods varied widely across countries and stock markets were not in place before
privatization measures were introduced. The focus of this strand of research in transition
countries has so far been on the positive effect of privatization on growth5, while the
relation between privatization methods and newly established stock markets has received
little discussion.
Due to the large variety of privatization methods implemented (Brada, 1996), their
relation to emerging stock markets also varies considerably. It is thus essential to consider
advantages and disadvantages of different methods ex ante, i.e. from the perspective of
decision-makers at the beginning of transition.
While privatizing state assets through the stock market contributes positively to its
functioning, direct sales of state assets in fact do not affect stock markets, at least not at
the time of sale6. On the other hand, by the administrative decision of putting shares of all
privatized companies on the market, mass privatization programs tended to ignore the
standard listing requirements and suppressed the traditional concept of stock market
development. It was incorrectly assumed that more publicly traded companies would
generate a more liquid market. Such an artificial approach led to problems with stock
market development, and the affected markets fell behind those, which had evolved
gradually, in a more standard way. Hence, the functioning of stock markets in mass
privatization countries would seem to lag the development of other transition economies,
5 For more details see e.g. Bennett et al. (2004).
6 Later on, when the privatized companies grow, they can use stock market as one of the sources of capital
(through IPOs) and this way fuel their operations.
Chapter 1
7
which we consider to be the price for establishing stock markets only as a kind of “by-
product” of mass privatization.
The primary objective of this research, therefore, is to empirically investigate the
connection between the privatization method implemented and the consequent capital
market development. Considering the entire transition process with an emphasis on the
country‟s institutional setting and legal framework reveal the costs implied by mass
privatization with respect to stock market creation. Our aim is both to describe the
situation in transition countries and by utilizing the available data determine the influence
of privatization method on the emerging stock market.
Our results provide empirical evidence confirming that mass privatization
influenced stock market development and exerted a negative impact on stock market
functioning in transition countries. We confirm this relationship using different indicators
of stock market development in the short and medium run.
The following section provides motivation for our work. Section 1.3 discusses the
privatization process in transition countries, section 1.4 provides an overview of stock
market development in these countries and section 1.5 examines mass privatization in
connection to stock market emergence and development. In sections 1.6 and 1.7 we
discuss the data used, specifications of estimated equations, results and their
interpretation. Section 1.8 concludes.
1.2 Importance of a functioning stock market
Investigation of the relationship between privatization method and stock market
emergence is important not only in the context of the economics of transition but also for
the long-term development prospects of these countries7. Stock markets in general
provide an important source of financing viable investment projects and thus indirectly
initiate further economic growth. Empirical studies of King and Levine (1993), Levine
and Zervos (1998), Rousseau and Wachtel (2000), Beck and Levine (2004) provide
evidence of a positive correlation between stock market development and economic
7 The importance of economic growth for transition economies and the problems connected to it are
discussed in e.g. Campos and Coricelli (2002).

1.2 Importance of a functioning stock market
8
growth. Levine and Zervos (1998) use data on 47 countries (1976 – 1993) to show that
stock market liquidity and banking development are positively correlated with
contemporaneous and future rates of economic growth, capital accumulation, and
productivity growth. Rousseau and Wachtel (2000), by employing panel techniques, find
that deep and liquid equity markets have had a significant and persistent impact on
economic performance. They indicate that stock markets promote economic development
by providing investors with a potential exit mechanism, offering liquidity to investors that
encourages diversification, supplying firms with access to permanent capital and
generating information about the quality of potential investments. Beck and Levine
(2004) apply generalized-method-of-moments techniques developed for dynamic panels.
They show that stock markets and banks positively influence economic growth and that
these findings are not due to potential biases induced by simultaneity, omitted variables
or unobserved country-specific effects. Positive influence of stock markets on growth
holds true even for bank-driven financial systems prevailing in transition countries. As
Korhonen et al. (2000) argue, stock markets in both market-based as well as bank-driven
systems provide economic agents with valuable information about prices in the economy
and offer a means of reallocating risks. Therefore, their importance within the financial
system should not be neglected by policy makers in transition countries.
In the context of stock market development another important stream of empirical
literature examines the institutional framework, including the legal system, as a major
determinant of financial development (La Porta et al. 1997, 1998, 2000; Demirguc-Kunt
and Maksimovic, 1998). These studies emphasize the importance of the rights of minority
shareholders as well as creditors. Better legal systems in this respect ensure a safer
environment for investors, meaning that the financial sector can develop much faster.
However, good legal systems are necessary but not sufficient, because as Pistor et al.
(2000) stress, a persistent obstacle towards greater financial development is the lack of
enforcement of existing laws.
An important role that well-developed securities markets play concerns the
possibility to prevent crisis in the banking system if a credit crunch occurs. In such a case
securities markets can help fill the ensuing funding gap and thus the “existence of

Chapter 1
9
multiple avenues of financial intermediation” can be important in preventing financial
crises from causing sustained knock-on effects on the real economy (Wagner and Iakova,
2001). In this respect Davis (2001) finds empirical evidence that the existence of active
securities markets alongside banks is beneficial for the stability of corporate financing.
However, in this case it is also necessary to take into account the other side of the coin,
which is the possibility of securities markets contributing to financial crisis, especially if
they become too liberalized and vulnerable to global shocks.
All in all, a country‟s financial development is closely related to its institutional
and legal framework and, it is also one of the factors fostering economic growth. This
area of research points out crucial role policies play in supporting the development of
financial intermediaries and markets. Nevertheless, we need to be careful in applying
these considerations to transition countries, since all of the above-indicated standard and
well established relationships may not hold as strongly and straightforwardly as in the
developed economies. This view is supported by Berglof and Bolton (2003), who
examine the experience of financial transition based on the ratio of domestic credit to
GDP being a measure of financial development. They argue that the link between
financial development and economic growth does not appear to be very strong during the
first decade of transition. Nevertheless, the findings of Bennett et al. (2004) which
investigates the impact of differences in privatization and in private sector and stock
market development on economic growth in transition economies during the time period
from 1991 to 2001 confirm a significant positive impact of stock market development on
growth.
Although in the context of transition the aforementioned relationships are at
present not all that persuasive, the real functioning of stock markets is of vital importance
for all transition economies. In the course of the transition process these markets facilitate
allocation of property rights either after the initial distribution of vouchers in a mass
privatization or in the case of the sale of state assets through direct share offerings (World
Bank, 1996). Furthermore, despite strong internationalization pressures and the
possibility of listing securities abroad, these markets are expected to serve as a source of
capital for the expanding medium-sized companies (Bakker and Gross, 2004) that are

1.2 Importance of a functioning stock market
10
crucial for economic growth. However, Bakker and Gross further emphasize that they do
not expect small stock exchanges in transition countries to survive on their own but rather
to enter into strategic partnerships with other exchanges8. On the other hand, larger
companies have an advantage because of the possibility to enter markets abroad, in
comparison to smaller enterprises that suffer from various constraints (Lizal and Švejnar,
2001) and therefore have to rely on the functioning local stock markets. The need for
efficient stock markets in transition economies is thus essential and should be considered
one of the main policy priorities in these countries.
1.3 Privatization process in transition economies
A majority of studies concerning transition countries indicates that the overall impact of
privatization on the functioning of these economies was positive (Djankov and Murrell,
2002; Estin et al., 2009)9. Yet, even though various impact channels are examined in
these studies, care needs to be taken when interpreting their results. As Stiglitz (1999)
points out, means and ends are often mixed together here. The main objective of
privatization is to attain efficiency in the economy and to initiate sustainable economic
growth. Hence privatization serves as a mean to these ends. However, in a broader sense
even the creation of a market economy can be a means to sustainable development. If this
kind of interpretation is considered, Stiglitz argues that the success of market-oriented
reform is more mixed. On the other hand, private property is undoubtedly one of the key
inputs in the standard model of a market economy and thus privatization, despite certain
doubts and controversies concerning the whole process, is necessary.
The privatization process itself depends on several crucial factors that are of
importance for this study as well. In general, the chosen privatization method plays a key
role (World Bank, 1996). Even the sequencing of the whole process becomes very
important (Gupta, Ham and Švejnar, 2000). In the context of transition countries, at every
phase of the privatization process, crucial decisions were taken by the state authorities;
8 This process has already started e.g. Vienna Stock Exchange acquired shares in Budapest as well as
Prague Stock Exchanges. All the stock exchanges in Baltic countries are part of the OMX group. 9 The results showing mostly positive impact of privatization on transition economies have been challenged
by Hanousek, Kočenda, and Švejnar (2007).

Chapter 1
11
privatization is therefore considered to be exogenous10
. The decisions of these authorities
differed and thus, as Table A1.1 in the appendix indicates, the privatization process has
exhibited a large degree of variability as each transition economy has pursued its
individual strategy (World Bank, 2002). The table also illustrates the importance of the
voucher method as primary as well as secondary method of privatization. Nevertheless,
differences among countries do not concern only the methods implemented. Variability is
caused by the different initial conditions, political backgrounds, and other country
specific factors, as well as the speed, sequencing, and timing of the privatization in the
context of the whole transition process.
10
Exogenous here means the decision about privatization and its timing with respect to the stock market.
Clearly, the privatization decision is not a function of the stock market.
The World Bank report assessing the first ten years of transition (2002), stresses
that the ideal privatization strategy leading to the best after-privatization performance of
companies would have been to transfer assets as rapidly as possible to individual
investors or concentrated groups of strategic investors through open, fair and transparent
methods. Unfortunately, such a procedure was not possible to implement in many
countries given certain country specific characteristics, especially those of a political
nature (Biais and Perotti, 2002). In this respect, the argument of equal distribution was
very strong especially in the countries where voucher privatization played a significant
role. Besides these characteristics, the gains in economic efficiency or necessary
government revenues from privatization were crucial (Gupta, Ham and Švejnar, 2000).
Accordingly, the designers of privatization mainly considered the speed of the ownership
transfer together with economic and political issues important at that time, but did not
accurately estimate or even take into account the possible future consequences of
employing a certain privatization method.
In general, privatization was one of the first reform steps undertaken in the
transition process and different privatization methods tended to affect the development of
emerging stock markets in different ways.
SMALL SCALE PRIVATIZATION concerned small and medium enterprises
privatized by implementing particularly simple auctions at the beginning of the transition

1.3 Privatization process in transition economies
12
process. In this respect, small-scale privatization is considered to be one of what the
EBRD transition report (2003) considers initial phase reforms, which are more
straightforward and relatively easier to implement11
. And true enough, this level of
privatization has been for the most part successful, and the majority of transition
countries have managed to conclude it relatively quickly. Yet from our point of view it is
important to note that the small-scale privatization neither initiated nor had an effect on
the stock market development, since most of these firms were and stayed not large
enough to become publicly traded.
THE SALE OF STATE PROPERTY (case-by-case privatization) concerns primarily
large and strategic enterprises, and has not yet been completed. Case-by-case privatization
can take the form of direct sales or share issue privatization, similar to initial public
offerings in the private sector (Brada, 1996). State property is sold directly to the new
owner, who can be domestic as well as foreign. According to EBRD (2003), this
privatization method belongs to the category of so-called second phase reforms, which
are more complex and take longer to implement as they require the development of
market-based structures and institutions, including a stock market. In this respect, case-
by-case privatization influenced stock market greatly. However, in this case stock markets
tend to emerge gradually and originate through voluntary IPOs, which themselves are
either initiated by share issue privatization or by firms already acquired by new owners
who are searching for additional capital resources, since the supply of capital for
restructuring from other sources is limited12
. Conditions in the economy thus require the
existence of a stock market, and allow it to develop in a standard way.
MASS PRIVATIZATION was considered an appropriate privatization method
especially with respect to the conditions that prevailed in transition countries at the
beginning of the transition process13
. Further, its social and political acceptability
11
The World Bank (1996) also stresses that small assets are easier to privatize than larger enterprises and
that positive outcome in the former category are relatively assured. 12
In this respect the role of banks in the economy is important. Whereas in the Czech Republic companies
were able to obtain loans from a bank relatively easily (soft budget constraint), in Hungary it was quite
difficult to obtain resources from a bank and therefore the stock market development was initiated from the
inside. 13
This basically concerns undercapitalization and the lack of foreign investors‟ interest to invest in these
economies. This issue has already been discussed in the introduction.

Chapter 1
13
followed from the equal distribution of shares as well as from the fact that citizens
incorrectly perceived income from privatization to be net profit for them. The Barro-
Ricardian equivalence was hence not valid, which gave the authorities a chance to “bribe”
people and gain their support for mass privatization (Hanousek and Tůma, 2002).
All in all mass privatization was, in different forms and modifications, included as
a part of the privatization program in 21 out of 27 transition economies. Still, the
proportion of formerly state owned assets privatized using this method differed
considerably among them. Table A1.2 in the appendix illustrates the different variations
of mass privatization that were implemented14
. The first countries to implement mass
privatization already at the beginning of the 1990s were Russia and the former
Czechoslovakia. They later served as a model for other countries (e.g. Bulgaria‟s first
wave of mass privatization followed the Czech model: for more details see Table A1.3 in
the appendix). The relatively high number of mass privatization models that are presented
in the table also suggests that the diversity of ways in which privatization was
implemented has also had a further impact on the outcomes of the whole transition
process. Nevertheless, the way voucher privatization was conducted led to only a formal
change of ownership from the state to a large number of uninformed shareholders who
had no experience managing these kinds of assets. In essence, this means that the
ineffectiveness connected to the state as an owner was in fact just transferred to a group
of new owners who could be considered “quasi-owners,” and who did not think
strategically and whose planning horizon was relatively short. As the World Bank (1996)
report points out, these owners were survival-oriented, focused only on sustaining current
cash flow. Since the immediate liquidation value of such companies was often higher
than the net present value of future investments (Lízal and Švejnar, 2001) it was more
profitable for these “quasi-owners” to “tunnel” the company and use its assets to make
themselves better off.
Given the way it was conducted, then, mass privatization cannot be considered
“deep” privatization in the sense defined above. It brought about serious problems that
14
Some countries provided equal access to all citizens while in others there were significant concessions
provided to insiders: Russia, Moldova, Georgia, Armenia (for more details see EBRD Transition Report
1997). This fact has also influenced trading with shares after the privatization.

1.3 Privatization process in transition economies
14
were either dismissed as only temporary (and were believed capable of being solved by
the power of the market15
) or that were not accounted for when privatization was
undertaken. Mass privatization failed to generate the new capital necessary to restructure
companies strategically, or to concentrate ownership. Its implementation is thus still
subject to debate. Nevertheless, it is important to note that mass privatization would not
necessarily have been unwise or inappropriate, if its natural continuation had been
recognized and implemented. The World Bank report assessing the first ten years of
transition (2002), for instance, points out that mass voucher privatization in the former
Czechoslovakia would have had a better chance of producing more restructuring and less
corruption if the legal framework governing companies, investment funds, and capital
market activities had been enforced from the very beginning. The fact that other transition
countries where mass privatization was a dominant privatization method suffered from
similar weaknesses in the way this procedure was implemented would indicate that the
success of mass privatization required a transparent and appropriately regulated stock
market with minority shareholders‟ protection and active corporate governance
(Hanousek and Kočenda, 2003). If these conditions had been set up properly in the
immediate aftermath of mass privatization, the results of the overall privatization process
would have been far more satisfactory. The failure to set up these conditions and even
more to the point the failure to recognize the impact of privatization on the stock market,
naturally precluded a more satisfactory outcome to the privatization process.
1.4 Stock markets in transition economies
Before investigating the role of privatization in stock market development, we first briefly
examine the phenomenon of stock market emergence in transition economies. This issue
is of particular importance because stock markets are, even today, not yet properly
functioning and in comparison to their western counterparts relatively unimportant for the
15
Mutual privatization funds were expected to contribute to active corporate governance after the shares of
formerly state enterprises were distributed in mass privatization.
Chapter 1
15
domestic economies in the great majority of countries16
. Therefore, it is useful for policy
makers to know which forces make stock market operate.
1.4.1 Factors determining the emergence of stock markets
Whether a stock market in a certain country exists is determined by a large variety of
factors, many of them having a connection to economic growth; in the context of
transition economies privatization, macroeconomic stabilization, and the regulatory
environment are of particular importance (EBRD 1998).
Initial conditions prevailing at the beginning of the transition process concern a lot
of aspects and therefore it is difficult to measure them succinctly. They affect the
economic performance in transition countries (De Melo et al., 1997; Berg et al., 1999;
Fischer and Sahay, 2000; Falcetti et al., 2001) and can to certain extent influence stock
market emergence as well. The process of stock market creation is relatively easier for
countries that already have a certain tradition and experience with its functioning: that is,
it had existed in that country before communism17
.
Nevertheless, as has already been discussed earlier, the privatization process plays
a role in this process. Based on the EBRD Transition Report 1995 the development of the
securities markets in transition countries “has so far been largely shaped by the nature of
privatization programs” (p.164). Not only do certain privatization methods require the
immediate existence of a stock market but they also determine the post-privatization
ownership structure. Based on this structure further trading evolves, and in this way
privatization method becomes a mechanism that predetermines the functioning of an
emerging stock market (Czech Republic: Capital Market Review, 1999).
16
For more details see Wagner and Iakova (2001), Bonin and Wachtel (2002), Köke and Schröder (2002),
EBRD Transition Report 2003 as well as law-oriented literature e.g. Ahdieh (2003). 17
EBRD Transition Report 1995 also notes that the formation of securities markets began in 1990-91with
the reestablishment of exchanges in Bulgaria, Croatia, Hungary, Poland and Slovenia. Then in 1993 the
Prague Stock Exchange was reopened.
Related studies concerning stock market development (King and Levine, 1993; La
Porta et al., 1997; Henry, 2000; Yartey, 2008) provide evidence that the most crucial
factors influencing stock markets include the macroeconomic environment and
institutional arrangements in the economy. With increasing income per capita individuals

1.4 Stock markets in transition economies
16
tend to have more resources available to invest on the stock market and this contributes to
its development. As Garcia and Giorgio (2003) note, there is a tendency for the share of
equity markets to increase relative to banking markets as per capita income increases.
Another related variable is the level of public debt in the economy, since the higher level
of debt can to a certain extent cause crowding out of the private sector from the stock
market. Moreover, the empirical evidence shows that inflation negatively influences stock
market.
The role of institutions and appropriate legal environment in the transition process
has already been pointed out as well. According to Ahdieh (2003), law scholars have
identified, at most, an indirect role for law in the market transition process. This role
basically concerns creating a framework within which securities markets will
spontaneously emerge. It includes clear property rights, provision of reliable contract
enforcement and more recently the protection of minority investors. Pistor (2000) argues
that these are necessary but not sufficient conditions for healthy stock market
development because what seems to matter most in transition economies is the actual
enforcement of law.
The development of stock markets may be slowed down if there are other strong
financial intermediaries in the economy, namely banks providing enterprises with
sufficient credit. Yet empirical evidence (King and Levine, 1993; Levine and Zevros;
1995) shows that the effect of banks and the effect of the stock market do not eliminate
each other, and that both do contribute to economic growth. Thus, if both of these
financial intermediaries function well, raising capital for investments is more efficient
and this naturally stimulates economic growth. Nevertheless, banks may continue to be
favoured due to tradition and also because stock markets generally require more
sophisticated investors making decisions about their portfolios. In spite of their preferred
position, however, banks depend on progress made in the financial system and in banking
reform, both of which are inseparable parts of the transition process. And as Table A1.4
in the appendix indicates, financial system reform has not progressed far enough in all the
transition economies.

Chapter 1
17
The influence of these factors on developing stock markets has already been
discussed in the relevant literature. The exception seems to be the privatization method
and its implementation which, we conjecture, has played a key role in stock market
formation. This conjecture has not been sufficiently addressed in the literature so far.
1.4.2 Development at the emerging stock markets
Given the above-suggested connection between privatization and stock markets, the
success of transition reforms18
is questionable also with respect to the functioning of
stock markets. This is partly the result of insufficient reforms and partly due to the fact
that even though certain laws and regulations have been enacted, it takes time to
implement and enforce them and to observe any positive results connected to the changes
in legislation. Therefore, as EBRD Transition Report 2003 reports, even though
improvements in the legal and regulatory framework for pension funds, growing
transparency, and efficiency and sophistication of the securities market have been
observed (especially in Russia, Serbia and Montenegro and Slovakia), the financial sector
in the transition economies is still considered underdeveloped. Despite financial sector‟s
overall growth, nonbank sector has been growing only in recent years (EBRD Transition
Report 2006).
As to the development of the financial sector, stock markets have followed
different patterns in transition countries. In comparison to other structures of the market
economy, their creation is more complicated because there is a need to support the
institutional infrastructure and regulatory mechanisms as well (Bonin and Wachtel,
2002). However, this need was not sufficiently taken into account in some countries19
.
Stock market development mainly started from scratch despite the fact that some
of these markets were actually reestablished after several decades. Depending on the
country stock markets emerged at different stages of the transition process. Some of them
18
It should be noted that the privatization of some strategic enterprises as well as other aspects of the
transition process have yet to be completed. EBRD Transition report (2003) notes that even in the most
advanced countries of Central Eastern Europe and the Baltics (CEB) that became members of the EU,
reforms have to continue. This mainly concerns the breadth and depth of these countries‟ financial markets
and the restructuring of strategic sectors such as energy, heavy industry and agriculture. 19
A good example in this respect would be the creation of SEC in the Czech Republic only in 1998, five
years after trading at the Prague Stock Exchange started.
1.4 Stock markets in transition economies
18
officially started in the early 1990s. This first group includes countries where mass
privatization was not implemented as a primary method: Slovenia (1990), Hungary
(1990) and Poland (1991). Then, in 1993 stock exchanges in the Czech Republic,
Slovakia and Lithuania followed, all of them connected to the mass privatization
program. Other stock exchanges were established later on in the mid-1990s (Romania,
Latvia, Estonia, Russia) but there are still several transition countries where stock markets
in fact do not exist20
. Yet another distinct feature in transition stock market development
is the impetus for their creation. While in some countries their formation was an
inseparable part of the transformation strategy and was, together with the framework for
security trading, planned well in advance (this concerns the first group of countries
mentioned above), there are other instances where this was not the case and stock markets
emerged only because they were necessary to supplement other reforms, most often mass
privatization. This has consequences for the way these markets developed. The “planned”
ones, despite their volatility, grew gradually with a clear upward sloping trend. The others
experienced a kind of overheating during the first years of their existence, then
encountered significant problems and in fact had to start over again at the end of the
1990s (see Figure A1.1 in the appendix).
The emerging stock markets of transition countries hence still do not perform their
primary economic function and are rarely used as a source of finance for the corporate
sector (Wagner and Iakova, 2001). These markets are in general characterized by low
liquidity because only a few securities of the most important companies are usually traded
frequently enough on each market (Wagner and Iakova, 2001; Bonin and Wachtel, 2002;
Bakker and Gross, 2004). Such a situation naturally results in more expensive financing
possibilities for companies and thus this source of finance is seldom used.
Yet another indicator describing stock market functioning is market capitalization
relative to GDP, which is despite its high levels following mass privatization relatively
low21
in transition economies. As Table A1.5 in the appendix illustrates, even though the
two best performing countries (Estonia: 27.5%, Czech Republic: 20.8%) reach the values
20
Here we refer to de facto existence, not de jure. This concerns Albania, Turkmenistan, Tajikistan. 21
Table A1.7 in the appendix shows that based on our data set its average stands at 9 %.

Chapter 1
19
characteristic for other emerging markets (e.g. Argentina: 27.7%, Brazil: 25.65%,
Mexico: 27.12%), they are still significantly falling behind the market capitalization to
GDP figures for the developed markets (e.g. United Kingdom: 131.69%, United States:
105.9%, or EMU markets: 44.56%).22
Moreover, as the ECB report concerning financial
sectors of EU accession countries (2002) observes, given the relatively low levels of GDP
per capita, market capitalization in absolute terms is particularly low.
The indicators of stock market liquidity give nearly the same picture. When
considering the value of stocks traded (as % of GDP), the best performing transition
economies (Hungary: 10.7% and Estonia: 10%) are comparable with other emerging
markets (Brazil: 11.59% and Mexico: 9.16%), however they are far behind the developed
economies (United States: 124.1%, United Kingdom: 70.42%). Turnover ratio indicator
values are somewhat better, especially for the best performing transition economies as
they are already close to some of the developed markets (EMU: 103.16%, United
Kingdom: 64.16%).
Further general characteristics of transition stock markets include insufficient
regulation, institutional fragility or weak minority shareholder protection. All of these
problems are connected to the legal and institutional framework, which in most cases did
not exist when stock markets were established (EBRD 1998; Bonin and Wachtel, 2002)
and which is still not sufficiently developed nor functioning well. The problem in this
respect is twofold: not only is a certain time needed to make such a framework
operational but the simple copying of institutions that are functioning successfully in
developed economies is not sufficient to guarantee success. Hanousek and Filer (1997) in
this respect stress that lack of experience combined with legal and regulatory uncertainty
can result in institutions failing to perform their roles efficiently. On the other hand,
especially in those countries accessing the EU, the necessary legislation has already been
enacted and thus the legal environment is expected to improve. However, the
enforcement of these new rules also requires a certain period of time, and the positive
impact of this legislation is still not clearly visible.
22
All figures in this table are averages for individual countries corresponding to available data for the
period 1989 – 2003.

1.4 Stock markets in transition economies
20
Even though stock market development in the transition countries has not been
too favorable so far, and even though markets tend to be inefficient, illiquid and
unreliable, there are still possibilities to improve the situation, especially thanks to the
pension system reforms that have been gradually implemented or are under consideration
in most of the transition economies. Institutional investors are expected to play a
significant role in the new pension systems and thus contribute to greater liquidity and
turnover on the stock exchanges (Wagner and Iakova, 2001). Moreover, pension reform
is also supposed to spur the demand for domestic securities: but in this respect the lack of
securities in which investors would be willing to invest creates a significant obstacle
(most of the emerging markets have only a few such securities). Yet another means of
boosting the performance of transition capital markets is the option that most
governments in these countries still possess – to privatize residual state ownership in
strategic companies through the stock market and to attract potential investors in this
way.
Despite all of the above-mentioned problems, trading has become more lively,
especially in those countries that have accessed EU and thus are more attractive for
foreign investors. Additionally, a trend towards integration among stock exchanges23
contributes to the simplification of trading and at the same time offers a larger portfolio
of products for potential investors.
1.5 Mass privatization and stock market development
Privatization methods in transition countries were rarely driven by the objective of
developing a modern stock market (EBRD Transition Report, 1997). Yet despite this fact,
stock market development per se in transition countries indicates a possible connection
between the privatization method employed and the consequent stock market functioning,
something which has not been considered in the recent literature dealing with the
emergence and development of stock markets in transition economies. One important
study that at least recognizes the importance of institutions and law is that by Claessens et
23
Estonian, Latvian and Lithuanian stock exchanges are already part of the OMX group together with the
Stockholm, Helsinki and Copenhagen stock exchanges.

Chapter 1
21
al. (2000)24
. Examining 20 transition economies, they distinguish three sources of stock
market origins: mandatory listing following mass privatization, voluntary initial public
offerings (IPOs), and mandatory listing of minority packages (Table 1.1).
Table 1.1: Sources of stock market origins
Mandatory listing
after mass
privatization
Voluntary
initial
public
offerings
Mandatory listing of
minority
packages during
privatization
Bulgaria
Czech Republic
FYR Macedonia
Lithuania
Moldova
Romania
Slovakia
Croatia
Estonia
Hungary
Latvia
Poland
Slovenia
Armenia
Azerbaijan
Kazakhstan
Kyrgyz Republic
Poland
Russia
Ukraine
Uzbekistan
Source: Claessens S., Djankov S., Klingebiel D. (2000): “Stock Markets in
Transition Economies,” Financial Sector Discussion Paper No.5,
The World Bank.
The authors further assess the development of stock markets using different indicators
and conclude that these markets are underdeveloped in comparison to those in industrial
countries, and that the basic financial sector infrastructure is often missing. An empirical
analysis based on a regression model highlights the importance of mild inflation, good
shareholder protection, and institutional investor assets for the development of stock
markets in transition economies. However, the influence of privatization is not taken into
account.
If one considers mandatory listing of minority packages a special case of
mandatory listing, even the above-mentioned classification can fit the general pattern of
two basic approaches through which capital markets can be created: so-called top-down
(government-led) and bottom-up (market-led) (Simoneti, 1997). In the top-down
approach the government takes the initiative (World Bank, 1996) and the necessary laws
and regulations are prepared before the actual trading starts. Development begins at the
high end of the market with only a small number of high quality stocks initially traded.
24
It was followed by several papers (Pajuste, 2002; Bonin and Wachtel, 2002; Claessens et al., 2003;
Berglof and Bolton, 2003) which strongly relied on its findings and extended them in different directions
concerning financial system architecture, corporate governance, or European integration.

1.5 Mass privatization and stock market development
22
These securities are offered in traditional voluntary IPOs on the stock exchange, and
trading with them tends to be fairly liquid. Later, when the market develops, the number
of stocks traded also grows. This kind of stock market creation dominated in both
countries where there was no mandatory listing of securities in the aftermath of
privatization (e.g. Hungary) and where stock markets were created well before the actual
mass privatization began (Poland). In fact, stock markets without mandatory listing
typically develop because economic conditions require it, as the supply of capital for
restructuring from other sources is limited25
. Nonetheless, this approach also has its
shortcomings in that there is a risk of overregulation; in this way the market‟s true needs
might not be accounted for, as is the case in Albania (World Bank, 1996) where the stock
market de facto has not worked so far.
On the other hand, under the bottom-up approach, supply and demand form the
rules that govern the market since there are no, or only minimal, regulations set up before
trading on these market commences. More effective rules and institutions tend to develop
this way (World Bank, 1996) but the disadvantage is the existence of the unregulated
market before the actual rules are set. This situation is typical for economies where stocks
were mandatory listed following mass privatization, which was implemented in various
modifications (see Tables A1.2 and A1.3 in the appendix). The natural outcome of such a
privatization is a large number of stocks that are listed on the stock exchange governed by
minimal regulations. Such markets were required to facilitate quick ownership
transformation and thus the development of a stock market is nearly spontaneous, being
only a response to the trading needs generated by privatization (Fine and Karlova, 1998).
Taking this statement to extremes, it is possible to consider stock markets a kind of by-
product of mass privatization.
Simoneti (1997) distinguishes two bottom-up scenarios. Under the first one,
stocks of all companies are traded on the public market. In order to enable this, minimal
regulatory standards are set (Czech Republic, Slovakia). Gradually, as regulation
25
In this respect the role of banks in the economy is important. Whereas in the Czech Republic companies
were able to obtain loan from a bank relatively easily (soft budget constraint), in Hungary it was quite
difficult to obtain capital from a bank and therefore the stock market development was pushed from the
inside.

Chapter 1
23
strengthens, some companies can no longer manage to meet these requirements and have
to leave the public market. The second scenario materializes when a certain limited
number of securities is traded publicly and are subject to strict regulation, while the rest
remain “quasi-public” and are subject to relatively weak regulation (e.g. Slovenia). This
so-called dual approach enables the stock market to develop simultaneously at the high
and low end of the market.
The two main approaches to stock market creation relate to the privatization
method implemented in certain countries (Table A1.1 in the appendix). However, as there
are different modifications of privatization methods, stock market creation can also be
difficult to classify into one of the above-mentioned categories. In more general terms,
Fine and Karlova (1998) ascribe the distinct path of stock market development in
transition countries to the following factors: the design of the privatization program in
individual countries, the degree of stock market development at the beginning of the
program, and different approaches to stock market regulation. Moreover, the availability
of other sources of capital in addition to the stock market also plays an important role.
All in all, the role of finance in fostering economic growth is especially important
in transition countries. The emerging stock markets and their development differ a lot in
these economies. Our previous discussion suggests that the important role the
privatization has played in the process of stock market formation has not been researched
sufficiently so far. This is the phenomenon that we further examine empirically.
1.6 Methodology and data
To investigate the influence of mass privatization on the emerging stock markets we
consider the starting hypothesis that mass privatization in the transition countries did not
affect the development of their stock markets. The alternative claims that mass
privatization has influenced stock market development. Based on the above discussion we
expect that it has exhibited a negative influence on their functioning, especially in the
short and medium run. The formal model specification accounts for the effect of
privatization together with the country effect in the following way:

1.6 Methodology and data
24
)1.1(,_ ,,2,1, tititiiti privtrprivcountryindmarket
where the relevant groups of variables are defined as follows:
market_ind stands for an indicator of stock market development (market
capitalization, turnover ratio, value traded, new capital raised) in country i at time t;
country stands for country effect concerning country i;
priv is a dummy variable that equals 1 starting from the year mass privatization was
implemented in country i and 0 otherwise;
tr stands for linear trend that is added to the privatization dummy variable.
Since the privatization method of our primary concern is mass privatization, the estimated
specification includes a dummy variable for mass privatization. As, based on our
conjecture, this privatization method exhibits a special impact on the emerging stock
market, we only distinguish between mass privatization on one hand and other
privatization methods on the other. Mass privatization dummy variable is considered
exogenous and we include it with as well as without linear trend. The dummy variable
without trend is meant to uncover the average effect of mass privatization on the stock
market. The second dummy variable which accounts for linear trend is included because
we anticipate the impact of privatization to evolve during the transition period due to the
consolidation of ownership structure of privatized companies following the actual
privatization. This process took several years and, in the majority of cases, was
intermediated by the stock market. Consequently, most trades that took place on the stock
exchanges depended heavily on the privatization method and its progress. By considering
both dummy variables, we intend to investigate the interaction of the initial effect of
privatization and its evolution over time as well.
It has already been noted that the implementation of mass privatization usually
took several years and thus its impact on stock markets could not be observed in the same
year the privatization started. We take this into account by estimating the above-described
specification first as contemporaneous effect and then with one and two years lags.
All the estimations are done using country specific fixed effects. We estimate the
effect of privatization on stock market development by considering the privatization and
Chapter 1
25
country effects together (equation 1.1). We control only for privatization and country
effects at this stage, as our primary objective is to uncover if the effect of privatization is
present in the data, that is, if privatization has had any influence on stock market
development in transition countries at all. Even though controlling for country effects
may be considered too broad a variable, in fact it contains all the country specific
characteristics we need to account for. Therefore this is a much more general indicator
than using only certain selected economic variables26
. By casting a wide net, we avoid the
problem of possible model misspecification, since it is especially challenging to identify
those economic variables that are truly crucial for stock market development in the case
of transition countries.
1.6.1 Data
Our data comes primarily from the World Development Indicators Database, available
from the World Bank. Where indicated, the data set is supplemented by data from the
World Federation of Exchanges as well as by local stock exchange figures. Dummy
variables for mass privatization are constructed based on different issues of the Transition
Report published by EBRD. A definition and brief description of the most important
variables used in this study are provided in appendix in Table A1.6 and Table A1.7.
In order to investigate whether and to what extent the privatization methods in
transition economies influenced the actual emergence and development of their stock
markets, we look at a sample of the former communist countries. Altogether there are 27
states in Central and Eastern Europe and Central Asia considered to be transition
economies. Based on the availability of data, the majority of them is included in our
26
These variables concern the overall economic development of the country, its stability, other available
channels of financial intermediation, as well as the legal and institutional environment. However, due to the
nature of our sample and the unavailability of a significant part of the necessary data for transition
economies, the inclusion of these factors would lead to serious difficulties in econometric estimations.
There would be an insufficient number of observations, plus an endogeneity problem could arise when
using some economic variables as explanatory variables. Unfortunately, standard methods of dealing with
this problem are very difficult to apply in the case of transition economies because it is practically
impossible to find an appropriate instrument. And even if we were able to come up with some reasonable
one, it is usually impossible to obtain reliable data for it. A two-stage estimation would require even more
variables, leading us straight into the data availability problem again.
1.6 Methodology and data
26
investigation. The list of countries and variables covered is provided in Table A1.5 in the
appendix.
Since our intention is to investigate the short and medium effect of privatization
method on stock market development, the time period under consideration covers the
transition period from 1990 to 2003. In the long run, there exist other important factors
significantly influencing stock market (e.g. entering EU) and it would be become
increasingly difficult to disentangle just the influence of the privatization method.
Nevertheless, our data constitutes an unbalanced panel because stock markets were
established at different points in time in different countries. Moreover, not all transition
countries have proceeded far enough in the transition process to make it possible to
investigate the aforementioned link there. Therefore this unbalanced panel is the result of
“true” missing values as well as observations that are not available due to the non-
existence of a stock market27
.
Yet another problem causing an unbalanced panel is the quality of the available
data. Even though data exists for certain countries, care must be taken to examine the data
before using them and, if necessary, to “clean” them for further estimations. Such
“cleaning” is needed because the nature of transition economies leads to observations that
cannot be included in the data set. It is, however, not possible to stipulate exact rules on
which we made our decisions, as they were primarily based on original country data. In
our case, the estimation results may be easily spoiled by growth rates recorded in the
thousands of percent for cases when a certain newly-created stock exchange traded during
a time period shorter than one year, or when it took several years before even some
trading was initiated28
. Frequent organizational changes on the stock exchanges and other
exogenous factors have in some instances also influenced the actual figures and thus need
27
We do not assign a “zero” value for those countries where the stock market did not exist at the beginning
of transition because such an approach would result in an artificially balanced panel. Even though this
would not change the estimated coefficients, t-statistics could be affected significantly and through them the
results of the whole hypothesis testing. 28
This was the case, for example, in Croatia (1994, 1995 and only in 1996 did the stock exchange begin to
pick up), Latvia (the stock exchange was founded in 1993, trading started in 1995, and only in 1996 did the
situation stabilize to a certain extent), Lithuania (trading officially started in 1993 but the figures are very
low until 1995; in 1996 it began to stabilize), Moldova (official beginning in 1995 but trading lively only in
1997), and Romania (started operation in 1995 but reasonable trading only in 1997).

Chapter 1
27
to be accounted for29
. Another exogenous influence was the Russian crisis. All of these
problems were taken into account when cleaning the data and constructing the actual data
set, so observations that could potentially damage the analysis have either been omitted or
have been remedied by creating suitable dummy variables.
1.6.2 Measures of stock market development
We measure stock market development using standard indicators of market size and
liquidity which have been used in the studies investigating development of stock markets
and its connection to economic growth (Levine and Zervos, 1998; Demirguc-Kunt and
Maksimovic, 1998; Rousseau and Wachtel, 2000; Beck and Levine, 2004). Unlike these
studies, this analysis deals with transition economies and therefore we find it important to
add another measure of stock market development, new capital raised.
The most frequently used indicator of market size is the market capitalization. It
reflects the total value of domestic shares listed on a certain stock exchange. Ideally, this
measure shows the importance of financing through equity issues. To enable comparison
among countries, market capitalization can be expressed as a percentage of GDP.
However, larger markets do not have to perform better, as the size does not necessarily
reflect their effectiveness. This is of particular interest especially in countries where the
number of listed companies results from the implemented privatization method. Under
mass privatization with mandatory stock listing, this indicator of market size can be
significantly inflated because the majority of stocks that are listed are traded only
occasionally, or not at all. Consequently, market capitalization does not necessarily have
to reflect the real stock market activity. This problem could be solved by using data from
the first tier of the market, which usually includes companies that are actually traded.
However, such data are not available from all the transition economies‟ stock exchanges
and, what‟s even worse, the rules for including companies in the first tier differ from
country to country. Nevertheless, the market capitalization to GDP variable is used in our
29
The merger of several exchanges into a new entity (Kazakhstan in 1997, Bulgaria in 1998), the decision
of stock exchange authorities to list a certain group of securities that had not been listed before (Latvia in
1999), the macroeconomic development in a given country (Poland in 1993), and trading system
enhancements initiated by the stock exchange and liberalization of block trading (Lithuania in 1997).

1.6 Methodology and data
28
analysis to show the influence of different privatization methods on the size of the
emerging stock market.
In contrast to the market capitalization variable, the indicators of liquidity do
indeed reflect the real stock market activity, and are not “spoiled” by a high number of
non-traded stocks listed on a particular stock exchange. Moreover, Rousseau and Wachtel
(2000) consider increases in this measure essential especially for emerging markets, since
higher liquidity raises investors‟ confidence in the values of information and risk
diversification associated with trading, which further encourages the inflow of capital.
We employ two measures of liquidity. The first one, market turnover ratio, can be
expressed in currency units or as a share of market capitalization. Share of market
capitalization reflects the value of stocks traded divided by the value of listed stocks; that
is, trading relative to the size of the stock market. The second measure of market liquidity
is value traded, which equals the value of stocks trading divided by GDP. Hence, it
relates the value of trading to the size of the whole economy and does not really measure
the liquidity of the market (Beck and Levine, 2004). This indicator faces a potential
problem, however, if prices of stocks increase because of expectations concerning higher
corporate profits. In such a situation this liquidity measure, as well as market
capitalization, would increase without a rise in the number of transactions, thus not
reflecting the true stock market activity. To eliminate this price effect, Levine and Zervos
(1998) suggest either using both capitalization and value traded together, or using
turnover indicator instead. Turnover ratio is not influenced by price changes as it contains
the price in both numerator and denominator. Therefore, based on the available data we
primarily use this measure as an indicator of stock market development in the transition
countries.
Another indicator that we employ to monitor the development of stock markets in
transition economies is the amount of new capital raised through a particular stock
exchange. In this respect we are interested not only in capital raised by already existing
companies, but primarily by newly admitted enterprises (IPOs). In most of transition
economies, however, the number of IPOs was insignificant, especially in relation to
market capitalization. Nevertheless, we consider new capital raised to be very important,

Chapter 1
29
as it shows the real functioning of the market and fulfilling its main role of providing
financial resources to enterprises. But even though this indicator may seem appropriate,
one has to be aware of its possible shortcomings, namely the fact that data on new capital
raised in the context of transition economies do not necessarily reflect the real situation,
since not everything recorded as “new capital raised” conforms to its true definition30
.
As an example we provide the problem of mergers: in some cases these were recorded as
new capital raised, whereas in fact this was capital that had already existed on the stock
exchange, only under a different name. Another possibility concerns changes in ISIN that
could result in recording an issue with a new ISIN as new capital even though it was
simply different “labeling” of this capital. In our analysis, we only use data from one
source in which the above-described problems are already accounted for, although the
disadvantage is that such data is available only for a limited number of countries31
.
All in all, in order to investigate the development of transitional stock markets
from different perspectives we employ the following variables: market capitalization to
GDP; total value of stocks traded as a percentage of GDP; turnover ratio; and total
amount of new capital raised as a percentage of market capitalization. We conjecture that
the negative effect of privatization is going to influence different variables in a different
way, based on their nature. We anticipate a sudden increase of market capitalization after
mass privatization, while on the other hand stocks traded and turnover ratio as the
indicators of liquidity are expected to decrease, especially over the medium term. When
employing new capital raised the same pattern as for liquidity measures is expected.
The above discussion suggests that all of these stock market indicators face
some potential shortcomings. Nevertheless, taken together, they can provide a reasonable
picture of tendencies in stock market development in transition countries.
30
The World Federation of Exchanges defines new capital raised by shares to be the amount of new capital
raised through the sale of new shares issued by a new issuer (company) through an Initial Public Offering
(IPO), capital increases by already listed companies (reserved to previous shareholders), and SPOs (new
shareholders subscribe the shares). This is the definition that we also adhere to. 31
In this case there are 14 of them.

1.7 Estimation results
30
1.7 Estimation results
The outcome of our estimation is discussed according to the stock market indicators used
as dependent variables.
MARKET CAPITALIZATION TO GDP
Results showing the influence of mass privatization on market capitalization as a
percentage of GDP are provided in the following Table 1.2.
Table 1.2: Estimations of the main model for market capitalization to GDP
MARKET CAPITALIZATION TO GDP Coefficient Standard error R2 R
2 (within)
Contemporaneous effect
Privatization dummy (priv) 1.523 2.468 0.114 0.271
Privatization dummy with trend (tr.priv) 1.454 *** 0.206
One year lag
Privatization dummy (priv) 2.767 2.213 0.116 0.272
Privatization dummy with trend (tr.priv) 1.406 *** 0.219
Two years lag
Privatization dummy (priv) 3.3 * 1.845 0.128 0.268
Privatization dummy with trend (tr.priv) 1.354 *** 0.237
Observation/country 195/23
Note: The table contains results for fixed effect regression. We report estimated coefficients as
well as their significance (***significant at 1%, ** significant at 5% and * significant at 10%) and
standard errors. Constant term is included but not reported.
The estimated coefficients are positive and mostly significant. This is in line with our
expectations of the positive influence of mass privatization on market capitalization. The
coefficients for dummy variables including linear trend are all significant, indicating the
evolving influence of mass privatization on stock market development. The privatization
dummy variable without trend is only significant when two years lag is considered. As
expected, this coefficient is positive due to the fact that the shares of privatized
companies were simply put on the market in the majority of countries. The significance of
the lag only is most probably the result of the time gap between the official start of
privatization and its real implementation when companies finally entered the stock
exchange. It suggests that privatization did not greatly influence stock markets initially.

Chapter 1
31
Within R2
is much higher than overall R2
which confirms the importance of
country specific fixed effects. This is a natural consequence of the fact that the economic
environment in individual transition economies varied considerably, especially with
respect to the different initial conditions and sequencing of reforms.
GROWTH IN STOCKS TRADED
As expected, the impact of privatization on the growth in value of stocks traded (as % of
GDP) is negative and mostly significant. While most coefficients are significant, the R2
measure is much lower than in the case of market capitalization. We posit that the value
of stocks traded in comparison to market capitalization was likely influenced by
privatization only indirectly.
Table 1.3: Estimations of the main model for growth in stocks traded
GROWTH IN STOCKS TRADED Coefficient Standard error R2
R2
(within)
Contemporaneous effect
Privatization dummy (priv) -3.748 *** 0.934 0.031 0.197
Privatization dummy with trend (tr.priv) -0.12 ** 0.063
One year lag
Privatization dummy (priv) -0.347 0.723 0.030 0.068
Privatization dummy with trend (tr.priv) -0.169 *** 0.073
Two years lag
Privatization dummy (priv) -0.728 0.639 0.032 0.074
Privatization dummy with trend (tr.priv) -0.146 ** 0.077
Observation/country 132/21
Note: The table contains results for fixed effect regression. We report estimated coefficients as
well as their significance (***significant at 1%, ** significant at 5% and * significant at 10%) and
standard errors. Constant term is included but not reported.
As Table 1.3 reveals, the immediate effect of privatization on stock trading is
significant only in the first case when the effect of privatization is not lagged. The
introduction of huge numbers of new shares to the stock exchange might have confused
investors and thus they needed time to adjust to the new situation and start their trading
activities again. The negative effect is also reflected in significant results for the
privatization dummy variable that includes linear trend. Thus, trading as an indicator of

1.7 Estimation results
32
stock market liquidity crucial for healthy stock market development is, in fact, negatively
influenced by mass privatization and traditional stock market development is thwarted.
Despite the fact that the negative effect of mass privatization persists with time,
we do not consider it permanent; it relates solely to the transition period that we
investigate. Recent development of stock indices in major transition countries supports
this statement.32
Regardless of initial problems and related costs, market forces have
tended to win out over the long run and contribute to the stabilization of stock markets in
transition economies.
TURNOVER RATIO
This is another indicator of stock market functioning that supports our previous results
and the initial hypothesis. We consider the following outcome even more important,
especially due to the better quality of the turnover ratio indicator which is not spoiled by
price changes or by a high number of listed companies after privatization, and which
reflects the true liquidity of the market.
Table 1.4 shows that the average effect of mass privatization is significant for all
three specifications. All significant coefficients are negative, which only substantiates the
unfavorable influence of privatization on stock markets.
Table 1.4: Estimations of the main model for turnover ratio as dependent variable
TURNOVER RATIO Coefficient Standard error R2
R2
(within)
Contemporaneous effect
Privatization dummy (priv) -72.448 *** 17.77 0.117 0.211
Privatization dummy with trend (tr.priv) -1.523 1.209
One year lag
Privatization dummy (priv) -43.612 *** 15.03 0.101 0.137
Privatization dummy with trend (tr.priv) -1.594 1.303
Two years lag
Privatization dummy (priv) -24.887 ** 12.968 0.08 0.081
Privatization dummy with trend (tr.priv) -1.678 1.399
Observation/country 112/18
Note: The table contains results for fixed effect regression. We report estimated coefficients as
well as their significance (***significant at 1%, ** significant at 5% and * significant at 10%) and
standard errors. Constant term is included but not reported.
32 The Prague Stock Exchange index PX50 recovered to its initial 1994 level of 1,000 only in 2004.

Chapter 1
33
NEW CAPITAL RAISED
This indicator of stock market development accounts for the capital raised through IPOs
in transition countries. With the exception of Poland, there have been just a few IPOs in
other transition countries and thus the number of observations for this indicator of stock
market development is lower than in the previous cases. This fact most probably also
influences the R2 measure. Nevertheless, the importance of this indicator has increased
over time as IPOs on the stock markets of transition countries have become more
common.
The estimated coefficients are significant only in the case when linear trend is
taken into account (see Table 5.1). It is obvious that privatization cannot influence the
amounts of new capital raised immediately since the process of raising capital requires a
lot of preparations and takes a lot of time. The estimated coefficients that are significant
all exhibit negative sign, which is in line with our hypothesis that mass privatization had
negative influence on the functioning of the emerging stock markets.
Table 1.5: Estimations of the main model for new capital raised as dependent variable
NEW CAPITAL RAISED Coefficient Standard
error R
2
R2
(within)
Contemporaneous effect
Privatization dummy (priv) 5801.7 12303.4 0.014 0.077
Privatization dummy with trend (tr.priv) -1263 *** 527.2
One year lag
Privatization dummy (priv) 4568.1 7648.1 0.016 0.080
Privatization dummy with trend (tr.priv) -1331.3 ** 545.2
Two years lag
Privatization dummy (priv) 5446.9 5850.6 0.026 0.089
Privatization dummy with trend (tr.priv) -1481.3 *** 571.9
Observation/country 85/14
Note: The table contains results for fixed effect regression. We report estimated coefficients as
well as their significance (***significant at 1%, ** significant at 5% and * significant at 10%) and
standard errors. Constant term is included but not reported.
1.7.1 Robustness check
We have checked robustness of our results by implementing several robustness checks.
First, in all of the above-described estimations, we included a dummy variable for the

1.7 Estimation results
34
1998 Russian crises. As the influence of the crises was not strong enough in all transition
countries, this dummy variable did not figure significantly in our estimations.
Another modification of the basic model that we test is the inclusion of a quadratic
trend. We consider all the modifications of the main model with different lags and
dependent variables to which we include privatization dummy variable with quadratic
trend. The results that we obtain reveal the same pattern as our main results.
Last but not least, estimations of the basic model with several different measures of
stock market performance that provide consistent results supporting negative influence of
mass privatization can also be considered a robustness check for our results.
In our view, the simple estimation procedure performed above is appropriate both
with respect to the data sample we have available and to the main objective of our
investigation – uncovering a possible connection between mass privatization and stock
market development. Data sufficiency problems occur if we want to include the
development of stock markets over time as an inseparable part of the transition process.
In such a case, we would need to add a trend for each country‟s development. This kind
of estimation is not possible with the small data sample as we have available. If more data
is available, we expect further research in this area will be feasible.
1.8 Conclusion
We use available data from a majority of transition economies to provide empirical
evidence for our hypothesis that mass privatization influenced stock market development
and exerted a negative impact on stock market functioning in these countries. The results
of our estimation, which accounted for privatization method and country effects,
validated the hypothesis in the short and medium run. The connection between mass
privatization and stock market development was confirmed using different indicators of
stock market development.
In accordance with our expectations, market capitalization to GDP increased
following mass privatization which could in general mean a good news for the emerging
markets. Nevertheless, increasing market capitalization alone is not enough, bigger
market does not necessarily need to be a more efficient one. If this was connected with
Chapter 1
35
increasing liquidity and more capital raised, only then we could have concluded that
privatization contributed to positive development of the emerging stock markets.
Nevertheless, this was not the case in transition countries. Our liquidity indicators
confirm that most shares traded occasionally or not at all resulting in negative coefficients
for privatization dummy variable when the value of stocks traded and the turnover ratio
were used to measure stock market development. This trend was quite visible over the
medium term. Moreover, we find negative connection between mass privatization and the
amounts of new capital raised which indicates that the emerging markets are not able to
perform one of their main functions.
Our results further imply that in countries using mass privatization approaches, the
stock market was established and perceived only as a by-product of the privatization
process. These stock markets did not initially fulfil their main economic function of
providing capital resources to enterprises. Such non-transparent markets offering
thousands of securities naturally diminished investor confidence and did little to jump-
start economic growth in transition economies. Despite an unfavourable beginning, the
main stock indices in transition economies have shown improvement in last years. It
seems that resources in the transition economies would have been used more efficiently
had a more careful approach to stock market creation been adopted.

References
36
REFERENCES
Ahdieh R.B. (2003): „„Making Markets: Network Effects and the Role of Law in the
Creation of Strong Securities Markets,‟‟ Southern California Law Review (76): 277.
Bakker M., Gross A. (2004): „„Development of Non-bank Financial Institutions and
Capital Markets in European Union Accession Countries,‟‟ World Bank Working Paper
No. 28.
Beck T., Levine R. (2004): „„Stock Market, Banks and Growth: Panel Evidence,‟‟
Journal of Banking and Finance 28(3): 423 - 442.
Bennett J., Estrin S., Maw J., Urga G. (2004): „„Privatization Methods and Economic
Growth in Transition Economies,‟‟ CEPR Discussion Paper No. 4291.
Berg A., Borensztein E., Sahay R., Zettelmeyer J. (1999): „„The Evolution of Output in
Transition Economies: Explaining the Differences,‟‟ IMF Working Paper, WP/99/73.
Berglof E., Bolton P. (2003): „„The Great Divide and Beyond --- Financial Architecture in
Transition,‟‟ CEPR Discussion Paper No. 3476.
Biais B., Perotti E. (2002): „„Machiavellian Privatization,‟‟ American Economic Review
92(1): 240-258.
Bonin J., Wachtel P. (2002): „„Financial Sector Development in Transition Economies:
Lessons from the First Decade,‟‟ Bank of Finland Institute for Economies in Transition,
DP No.9.
Brada J. (1996): „„Privatization Is Transition --- Or Is It?‟‟ Journal of Economic
Perspectives 10: 67 --- 86.
Campos N., Coricelli F. (2002): „„Growth in Transition: What We Know, What We Don‟t
and What We Should,‟‟ Journal of Economic Literature 40(3): 793-836.
Claessens S., Djankov S., Klingebiel D. (2000): „„Stock Markets in Transition
Economies,‟‟ Financial Sector Discussion Paper No.5, The World Bank.
Claessens S., Lee R., Zechner J. (2003): „„The Future of Stock Exchanges in European
Union Accession Countries,‟‟ CEPR report, published by the Corporation of London,
available at http://www.cepr.org/pubs/fse/
Czech Republic: Capital Market Review (1999), The World Bank Washington, D.C.
De Melo M., Denizer C., Gelb A., and Tenev S. (1997): „„Circumstances and Choice:
The Role of Initial Conditions and Policies in Transition Economies‟‟, World Bank
Chapter 1
37
Policy Research Working Paper No. 1866.
Demirguc-Kunt A., Maksimovic V. (1998): „„Law, Finance and Firm Growth,‟‟ Journal
of Finance 53(6): 2107 --- 2137.
Davis E. P. (2001): „„Multiple Avenues of Intermediation, Corporate Finance, and
Financial Stability,‟‟ IMF Working Paper, WP/01/115.
Djankov S., Murrell P. (2002): „„Enterprise Restructuring in Transition: A Quantitative
Survey,‟‟ Journal of Economic Literature 40(3): 739-792.
Estrin, S., Hanousek, J., Kočenda, E., Svejnar, J.(2009): “Effects of Privatization and
Ownership in Transition Economies,” Journal of Economic Literature (forthcoming).
Estrin S., Stone R. (1997): „„Taxonomy of Mass Privatization,‟‟ In Lieberman I., Stilpon
N., Raj D. (Eds): Between State and Market: Mass Privatization in Transition
Economies, The World Bank and OECD.
EBRD (European Bank for Reconstruction and Development), 1995 --- 2006: Transition
Report.
Falcetti E., Raiser M., Sanfey P. (2001): „„Defying the Odds: Initial Conditions, Reforms
and Growth in the First Decade of Transition,‟‟ EBRD Working Paper No.55.
Fine G., Karlova E. (1998): „„Privatization and the New Securities Markets in the Czech
Republic, Poland and Russia,‟‟ In Lieberman I., Kirkness Ch.: Privatization and
Emerging Equity Markets, co-published by The World Bank and Flemings Washington,
D.C.
Fischer S., Sahay R. (2000): „„The Transition Economies After Ten Years,‟‟ IMF
Working Paper, WP/00/30.
Garcia Valeriano F., Giorgio Luis A. (2003): „„The Impact of the Macroeconomic
Environment on Capital Markets in Emerging Latin American Economies‟‟ In Dowers
K., Masci P. (Eds.): „„Focus on Capital: New Approaches to Developing Latin American
Capital Markets,‟‟ Inter-American Development Bank, Washington D.C.
Gupta N., Ham J., Švejnar J. (2000): „„Priorities and Sequencing in Privatization: Theory
and Evidence from the Czech Republic,‟‟ William Davidson Institute Working Paper
No. 323.
Hanousek J., Filer R. (2000): „„The Relationship between Economic Factors and Equity
Markets in Central Europe,‟‟ Economics of Transition 8(3): 623 - 638.
Hanousek J., Kočenda E. (2003): „„The Impact of Czech Mass Privatization on
Corporate Governance,‟‟ Journal of Economic Studies 30(3/4): 278-293.

References
38
Hanousek, J., Kočenda E., Švejnar J. (2007): „„Origin and Concentration: Corporate
Ownership, Control and Performance in Firms After Privatization,‟‟ Economics of
Transition: 15(1), 1-31.
Hanousek J., Tůma Z. (2002): „„A Test of the Permanent Income Hypothesis on Czech
Voucher Privatization,‟‟ Economics of Transition, 10 (2): 235-254.
Henry P. B. (2000): „„Stock Market Liberalization, Economic Reform, and Emerging
Market Equity Prices,‟‟ Journal of Finance 55(2): 529 --- 64.
King R., Levine R. (1993): „„Finance and Growth: Schumpeter Might Be Right,‟‟
Quarterly Journal of Economics 108(3): 717 --- 738.
Kočenda E. (1999): „„Residual State Property in the Czech Republic,‟‟ Eastern European
Economics 37(5): 6 --- 35.
Kočenda E., Valachy J. (2002): „„Firm Ownership Structures: Dynamic Development,‟‟
Prague Economic Papers 11(3): 255 --- 268.
Köke J., Schröder M. (2002): „„The Prospects of Capital Markets in Central and Eastern
Europe,‟‟ Centre for European Economic Research (ZEW) Discussion Paper No. 02-57.
Korhonen I., Kuus T., Zirnask V. (2000): „„Baltic Securities Markets,‟‟ Bank of Finland,
Institute for Economies in Transition (BOFIT), DP No.5.
La Porta R., Lopez-de-Silanes F., Shleifer A., Vishny R. (1997): „„Legal Determinants
of External Finance,‟‟ Journal of Finance 52(3): 1131 --- 1150.
La Porta R., Lopez-de-Silanes F., Shleifer A., Vishny R. (1998): „„Law and Finance,‟‟
Journal of Political Economy 106(6): 1113 --- 1155.
La Porta R., Lopez-de-Silanes F., Shleifer A., Vishny R. (2000): „„Investor Protection
and Corporate Governance,‟‟ Journal of Financial Economics 58: 3 --- 27.
Levine R., Zervos S. (1998): „„Stock Markets, Banks, and Economic Growth,‟‟ American
Economic Review 88: 537 --- 558.
Lízal L., Švejnar J. (2001): „„Investment, Credit Rationing, and the Soft Budget
Constraint: Evidence From Czech Panel Data,‟‟ The Review of Economics and Statistics
84(2): 353 --- 370.
Pajuste A. (2002): „„Corporate Governance and Stock Market Performance in Central
and Eastern Europe: A Study of Nine Countries, 1994 --- 2001,‟‟ SSRN Electronic
Journal, available at http://ssrn.com/abstract=310419

Chapter 1
39
Perotti E. C., van Oijen P. (2001): “Privatization, Political Risk and Stock Market
Development in Emerging Economies,” Journal of International Money and Finance, 20:
43-69.
Pistor K., Raiser M., Gelfer S. (2000): „„Law and Finance in Transition,‟‟ Economics of
Transition 8(2): 325 --- 368.
Roland G. (2001): „„Ten Years After….Transition and Economics,‟‟ IMF Staff Papers
48, Special Issue.
Rousseau P., Wachtel P. (2000): „„Equity Markets and Growth: Cross-country Evidence
on Timing and Outcomes, 1980 --- 1995,‟‟ Journal of Banking and Finance 24: 1933 ---
1957.
Rozlucki W. (2001): „„Emerging Stock Markets in Central Europe: Where Do We
Stand?‟‟ In Bokros L., Fleming A., Votava C.: Financial Transition in Europe and
Central Asia: Challenges of the New Decade, The International Bank for
Reconstruction and Development / The World Bank.
Simoneti M. (1997): „„Regulating Post-privatization Securities Markets in Transition
Economies,‟‟ In Lieberman I., Stilpon N., Raj D. (Eds): Between State and Market:
Mass Privatization in Transition Economies, The World Bank and OECD.
Stiglitz J. (1999): „„Whither Reform? Ten Years of the Transition,‟‟ Annual Bank
Conference on Development Economics, Washington, World Bank.
Zinnes C., Eilat Y., Sachs J. (2001): „„The Gains from Privatization in Transition
Economies: Is „Change of Ownership‟ Enough?‟‟ IMF Staff Papers 48, Special Issue.
Wagner N., Iakova D. (2001): „„Financial Sector Evolution in the Central European
Economies: Challenges in Supporting Macroeconomic Stability and Sustainable
Growth,‟‟ IMF Working Paper 01/141.
World Bank (2002): „„Transition. The First Ten Years: Analysis and Lessons for Eastern
Europe and the Former Soviet Union, ‟‟ Washington D. C.
World Bank Operations Evaluation Department (2004): „„Economies in Transition: An
OED Evaluation of World Bank Assistance,‟‟ Conference Edition, The World Bank
Washington D. C.
World Development Report 1996: „„From Plan to Market,‟‟ Oxford University Press
Yartey Ch. (2008): “The Determinants of Stock Market Development in Emerging
Economies: Is South Africa different?” IMF Working Paper 08/32.
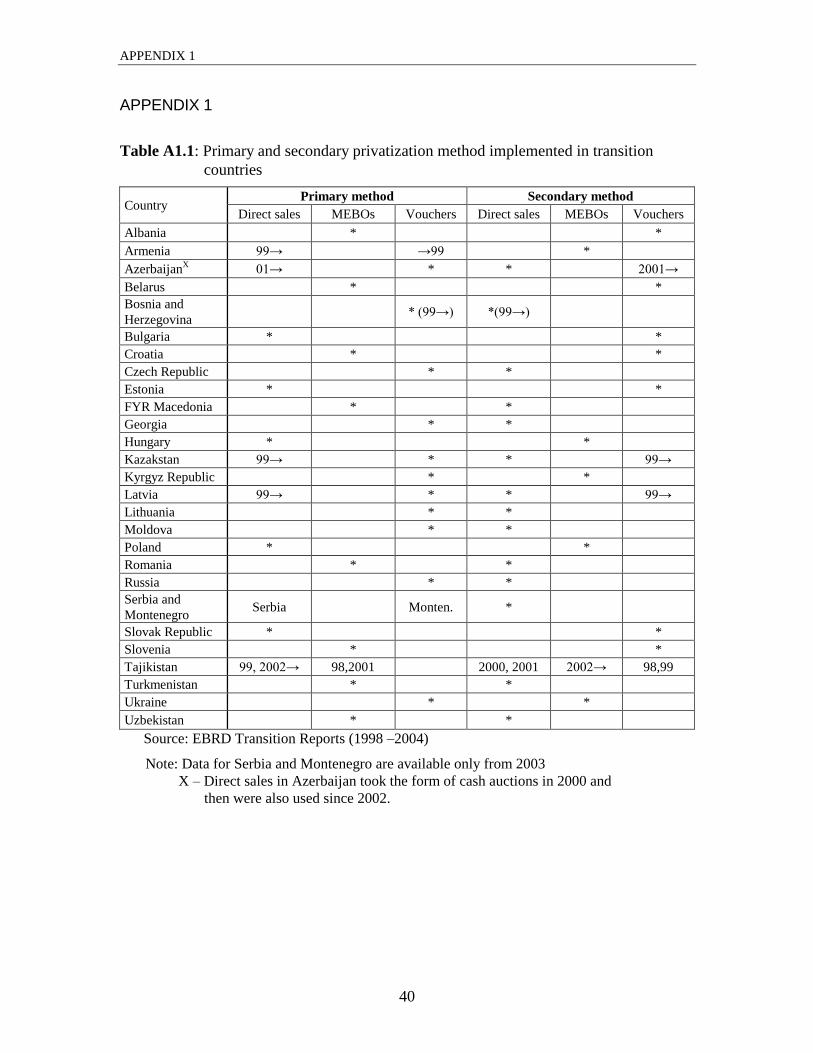
APPENDIX 1
40
APPENDIX 1
Table A1.1: Primary and secondary privatization method implemented in transition
countries
Country Primary method Secondary method
Direct sales MEBOs Vouchers Direct sales MEBOs Vouchers
Albania * *
Armenia 99→ →99 *
AzerbaijanX
01→ * * 2001→
Belarus * *
Bosnia and
Herzegovina * (99→) *(99→)
Bulgaria * *
Croatia * *
Czech Republic * *
Estonia * *
FYR Macedonia * *
Georgia * *
Hungary * *
Kazakstan 99→ * * 99→
Kyrgyz Republic * *
Latvia 99→ * * 99→
Lithuania * *
Moldova * *
Poland * *
Romania * *
Russia * *
Serbia and
Montenegro Serbia Monten. *
Slovak Republic * *
Slovenia * *
Tajikistan 99, 2002→ 98,2001 2000, 2001 2002→ 98,99
Turkmenistan * *
Ukraine * *
Uzbekistan * *
Source: EBRD Transition Reports (1998 –2004)
Note: Data for Serbia and Montenegro are available only from 2003
X – Direct sales in Azerbaijan took the form of cash auctions in 2000 and
then were also used since 2002.
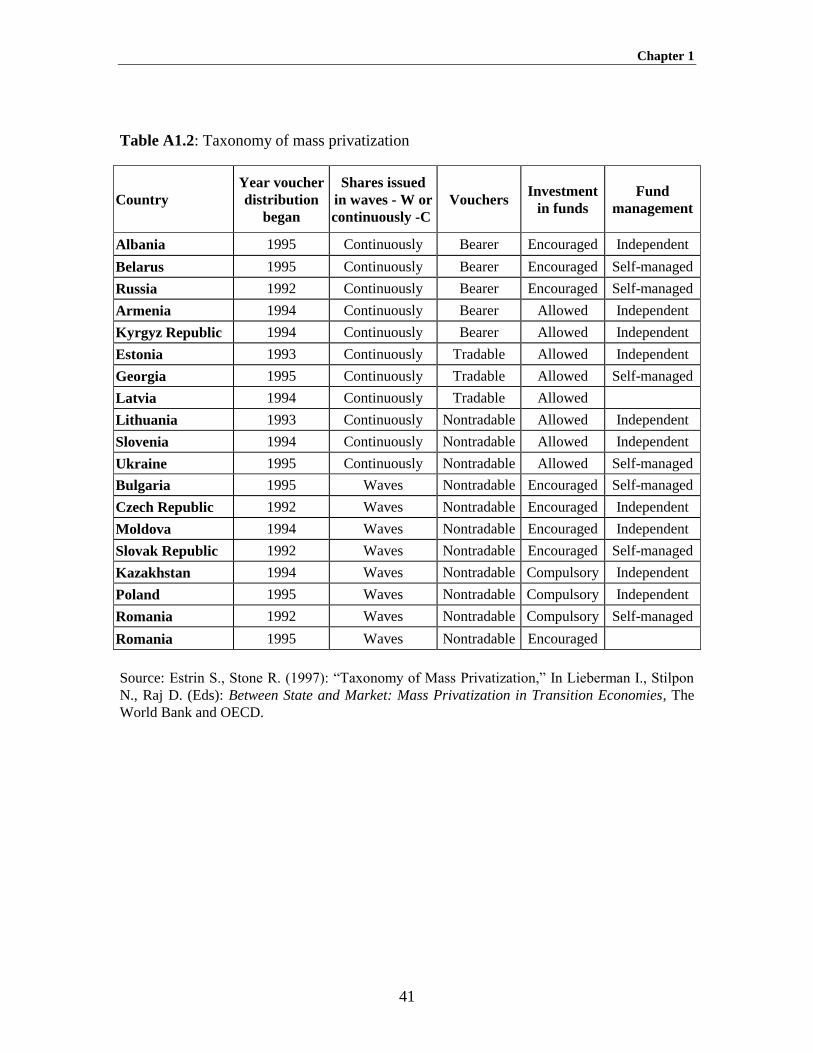
Chapter 1
41
Table A1.2: Taxonomy of mass privatization
Country
Year voucher
distribution
began
Shares issued
in waves - W or
continuously -C
Vouchers Investment
in funds
Fund
management
Albania 1995 Continuously Bearer Encouraged Independent
Belarus 1995 Continuously Bearer Encouraged Self-managed
Russia 1992 Continuously Bearer Encouraged Self-managed
Armenia 1994 Continuously Bearer Allowed Independent
Kyrgyz Republic 1994 Continuously Bearer Allowed Independent
Estonia 1993 Continuously Tradable Allowed Independent
Georgia 1995 Continuously Tradable Allowed Self-managed
Latvia 1994 Continuously Tradable Allowed
Lithuania 1993 Continuously Nontradable Allowed Independent
Slovenia 1994 Continuously Nontradable Allowed Independent
Ukraine 1995 Continuously Nontradable Allowed Self-managed
Bulgaria 1995 Waves Nontradable Encouraged Self-managed
Czech Republic 1992 Waves Nontradable Encouraged Independent
Moldova 1994 Waves Nontradable Encouraged Independent
Slovak Republic 1992 Waves Nontradable Encouraged Self-managed
Kazakhstan 1994 Waves Nontradable Compulsory Independent
Poland 1995 Waves Nontradable Compulsory Independent
Romania 1992 Waves Nontradable Compulsory Self-managed
Romania 1995 Waves Nontradable Encouraged
Source: Estrin S., Stone R. (1997): “Taxonomy of Mass Privatization,” In Lieberman I., Stilpon
N., Raj D. (Eds): Between State and Market: Mass Privatization in Transition Economies, The
World Bank and OECD.

APPENDIX 1
42
Table A1.3: Models of mass privatization
MODEL CHARACTERISTICS
OTHER COUNTRIES
FOLLOWING
THE MODEL
Russian
shares issued continuously
bearer vouchers
funds encouraged
Belarus
Armenian
shares issued continuously
bearer vouchers
funds allowed
Georgia a
Kyrgyz Republic
Lithuanian
shares issued continuously
nontradable vouchers
funds allowed
Estonia b
Latvia b
Slovenia
Ukraine
Czech-Slovak
shares issued in waves
nontradable vouchers
funds encouraged
Bulgaria
Moldova
Romania (1995)
Polish
shares issued in waves
nontradable vouchers
funds compulsory
Kazakhstan
Romania (1992)c
Source: Estrin S., Stone R. (1997): “Taxonomy of Mass
Privatization,” In Lieberman I., Stilpon N., Raj D. (Eds):
Between State and Market: Mass Privatization in Transition
Economies, The World Bank and OECD.
Notes:
a. it is not clear whether vouchers are bearer or registered
b. vouchers tradable for all or part of their validity
c. certificates of ownership in the funds were distributed in
one wave but the exchange of the certificates for shares
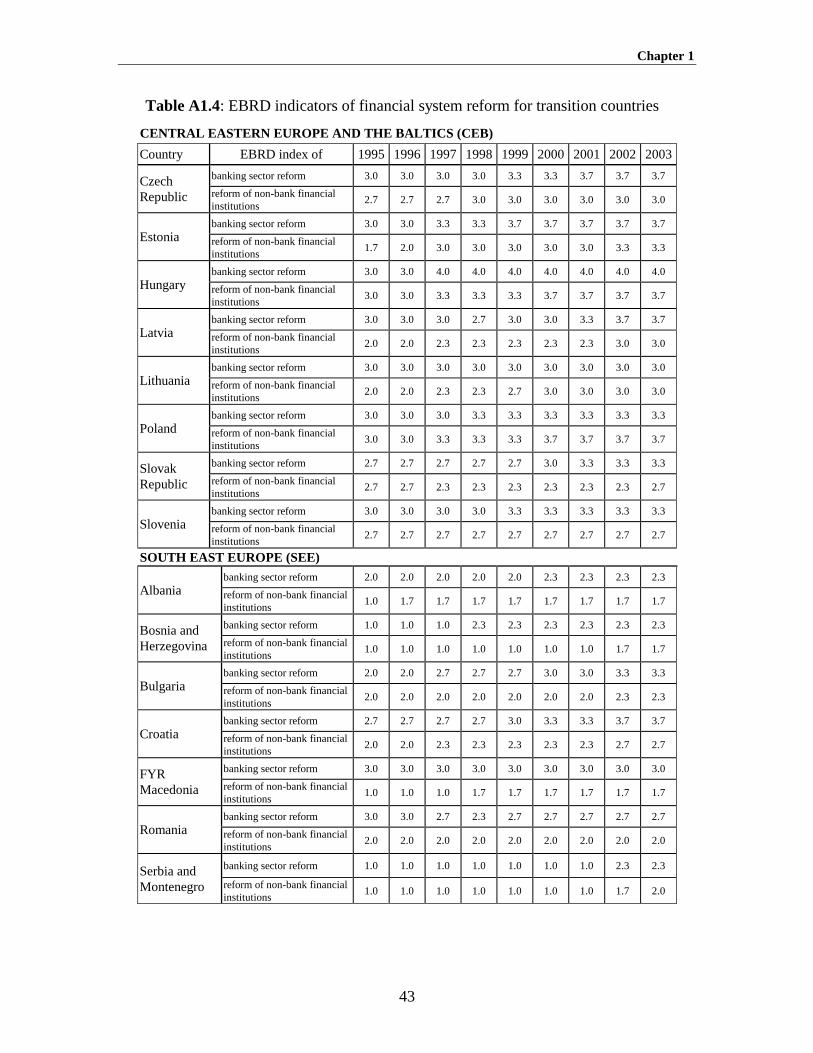
Chapter 1
43
Table A1.4: EBRD indicators of financial system reform for transition countries
CENTRAL EASTERN EUROPE AND THE BALTICS (CEB)
Country EBRD index of 1995 1996 1997 1998 1999 2000 2001 2002 2003
Czech
Republic
banking sector reform 3.0 3.0 3.0 3.0 3.3 3.3 3.7 3.7 3.7
reform of non-bank financial
institutions 2.7 2.7 2.7 3.0 3.0 3.0 3.0 3.0 3.0
Estonia banking sector reform 3.0 3.0 3.3 3.3 3.7 3.7 3.7 3.7 3.7
reform of non-bank financial
institutions 1.7 2.0 3.0 3.0 3.0 3.0 3.0 3.3 3.3
Hungary banking sector reform 3.0 3.0 4.0 4.0 4.0 4.0 4.0 4.0 4.0
reform of non-bank financial
institutions 3.0 3.0 3.3 3.3 3.3 3.7 3.7 3.7 3.7
Latvia banking sector reform 3.0 3.0 3.0 2.7 3.0 3.0 3.3 3.7 3.7
reform of non-bank financial
institutions 2.0 2.0 2.3 2.3 2.3 2.3 2.3 3.0 3.0
Lithuania banking sector reform 3.0 3.0 3.0 3.0 3.0 3.0 3.0 3.0 3.0
reform of non-bank financial
institutions 2.0 2.0 2.3 2.3 2.7 3.0 3.0 3.0 3.0
Poland banking sector reform 3.0 3.0 3.0 3.3 3.3 3.3 3.3 3.3 3.3
reform of non-bank financial
institutions 3.0 3.0 3.3 3.3 3.3 3.7 3.7 3.7 3.7
Slovak
Republic
banking sector reform 2.7 2.7 2.7 2.7 2.7 3.0 3.3 3.3 3.3
reform of non-bank financial
institutions 2.7 2.7 2.3 2.3 2.3 2.3 2.3 2.3 2.7
Slovenia banking sector reform 3.0 3.0 3.0 3.0 3.3 3.3 3.3 3.3 3.3
reform of non-bank financial
institutions 2.7 2.7 2.7 2.7 2.7 2.7 2.7 2.7 2.7
SOUTH EAST EUROPE (SEE)
Albania banking sector reform 2.0 2.0 2.0 2.0 2.0 2.3 2.3 2.3 2.3
reform of non-bank financial
institutions 1.0 1.7 1.7 1.7 1.7 1.7 1.7 1.7 1.7
Bosnia and
Herzegovina
banking sector reform 1.0 1.0 1.0 2.3 2.3 2.3 2.3 2.3 2.3
reform of non-bank financial
institutions 1.0 1.0 1.0 1.0 1.0 1.0 1.0 1.7 1.7
Bulgaria banking sector reform 2.0 2.0 2.7 2.7 2.7 3.0 3.0 3.3 3.3
reform of non-bank financial
institutions 2.0 2.0 2.0 2.0 2.0 2.0 2.0 2.3 2.3
Croatia banking sector reform 2.7 2.7 2.7 2.7 3.0 3.3 3.3 3.7 3.7
reform of non-bank financial
institutions 2.0 2.0 2.3 2.3 2.3 2.3 2.3 2.7 2.7
FYR
Macedonia
banking sector reform 3.0 3.0 3.0 3.0 3.0 3.0 3.0 3.0 3.0
reform of non-bank financial
institutions 1.0 1.0 1.0 1.7 1.7 1.7 1.7 1.7 1.7
Romania banking sector reform 3.0 3.0 2.7 2.3 2.7 2.7 2.7 2.7 2.7
reform of non-bank financial
institutions 2.0 2.0 2.0 2.0 2.0 2.0 2.0 2.0 2.0
Serbia and
Montenegro
banking sector reform 1.0 1.0 1.0 1.0 1.0 1.0 1.0 2.3 2.3
reform of non-bank financial
institutions 1.0 1.0 1.0 1.0 1.0 1.0 1.0 1.7 2.0

APPENDIX 1
44
COMMONWEALTH OF INDEPENDENT COUNTRIES (CIS)
Country EBRD index of 1995 1996 1997 1998 1999 2000 2001 2002 2003
Armenia banking sector reform 2.0 2.0 2.3 2.3 2.3 2.3 2.3 2.3 2.3
reform of non-bank
financial institutions 1.0 1.0 1.0 2.0 2.0 2.0 2.0 2.0 2.0
Azerbaijan banking sector reform 2.0 2.0 2.0 2.0 2.0 2.0 2.3 2.3 2.3
reform of non-bank
financial institutions 1.0 1.0 1.0 1.7 1.7 1.7 1.7 1.7 1.7
Belarus banking sector reform 2.0 1.0 1.0 1.0 1.0 1.0 1.0 1.7 1.7
reform of non-bank
financial institutions 2.0 2.0 2.0 2.0 2.0 2.0 2.0 2.0 2.0
Georgia banking sector reform 2.0 2.0 2.3 2.3 2.3 2.3 2.3 2.3 2.3
reform of non-bank
financial institutions 1.0 1.0 1.0 1.0 1.0 1.7 1.7 1.7 1.7
Kazakhstan banking sector reform 2.0 2.0 2.3 2.3 2.3 2.3 2.7 2.7 3.0
reform of non-bank
financial institutions 1.7 1.7 1.7 2.0 2.0 2.3 2.3 2.3 2.3
Kyrgyz
Republic
banking sector reform 2.0 2.0 2.7 2.7 2.3 2.3 2.3 2.3 2.3
reform of non-bank
financial institutions 1.7 2.0 2.0 2.0 2.0 2.0 2.0 2.0 2.0
Moldova banking sector reform 2.0 2.0 2.0 2.3 2.3 2.3 2.3 2.3 2.3
reform of non-bank
financial institutions 2.0 2.0 2.0 2.0 2.0 2.0 2.0 2.0 2.0
Russia banking sector reform 2.0 2.0 2.3 2.0 1.7 1.7 1.7 2.0 2.0
reform of non-bank
financial institutions 2.0 3.0 3.0 1.7 1.7 1.7 1.7 2.3 2.7
Tajikistan banking sector reform 1.0 1.0 1.0 1.0 1.0 1.0 1.0 1.7 1.7
reform of non-bank
financial institutions 1.0 1.0 1.0 1.0 1.0 1.0 1.0 1.0 1.0
Turkmenistan banking sector reform 1.0 1.0 1.0 1.0 1.0 1.0 1.0 1.0 1.0
reform of non-bank
financial institutions 1.0 1.0 1.0 1.0 1.0 1.0 1.0 1.0 1.0
Ukraine banking sector reform 2.0 2.0 2.0 2.0 2.0 2.0 2.0 2.3 2.3
reform of non-bank
financial institutions 2.0 2.0 2.0 2.0 2.0 2.0 2.0 2.0 2.0
Uzbekistan banking sector reform 1.7 1.7 1.7 1.7 1.7 1.7 1.7 1.7 1.7
reform of non-bank
financial institutions 2.0 2.0 2.0 2.0 2.0 2.0 2.0 2.0 2.0
Source: EBRD Transition reports
Note: value 1 in both cases corresponds to little progress in the reform, value 4+ represents
the standards and performance norms of advanced industrial economies.

Chapter 1
45
Table A1.5: Stock market development indicators of transition countries and their
comparison with developed economies
Country Market capitalization
to GDP
Stocks traded
(% of GDP) Turnover ratio
Armenia 0.75 0.03 5.77
Azerbaijan 0.07 na na
Belarus 3.66 na na
Bulgaria 4 0.4 13.07
Croatia 13.96 0.87 4.18
Czech Republic 20.83 8.51 42.11
Estonia 27.49 10.03 16.66
FYR Macedonia 0.73 0.65 na
Georgia 2.93 0.11 na
Hungary 15.93 10.72 51.93
Kazakhstan 7.68 0.35 24.54
Kyrgyz Republic 0.52 1.07 58.14
Latvia 5.87 1.16 20.9
Lithuania 11.45 1.54 23.03
Moldova 14.5 2.05 24.53
Poland 8.93 3.82 71.8
Romania 3.21 0.6 38.45
Russia 16.79 5.48 21.07
Serbia and Mont. 2.01 0.62 na
Slovak Republic 7.09 4.69 102.94
Slovenia 11.08 2.81 23.31
Ukraine 5.4 0.44 8.6
Uzbekistan 0.83 0.24 108.73
Argentina 27.7 3.7 23.19
Brazil 25.65 11.59 42.49
EMU 44.56 36.2 103.16
Germany 36.04 36.42 134.25
Ireland 63.21 25.62 54.56
Korea, Rep. 41.9 74.1 168.67
Mexico 27.12 9.16 34.22
United Kingdom 131.69 70.42 64.16
United States 105.9 124.12 129.93
Note: All the numbers are averages of the available data for the period 1989 – 2003
Source: WDI Database
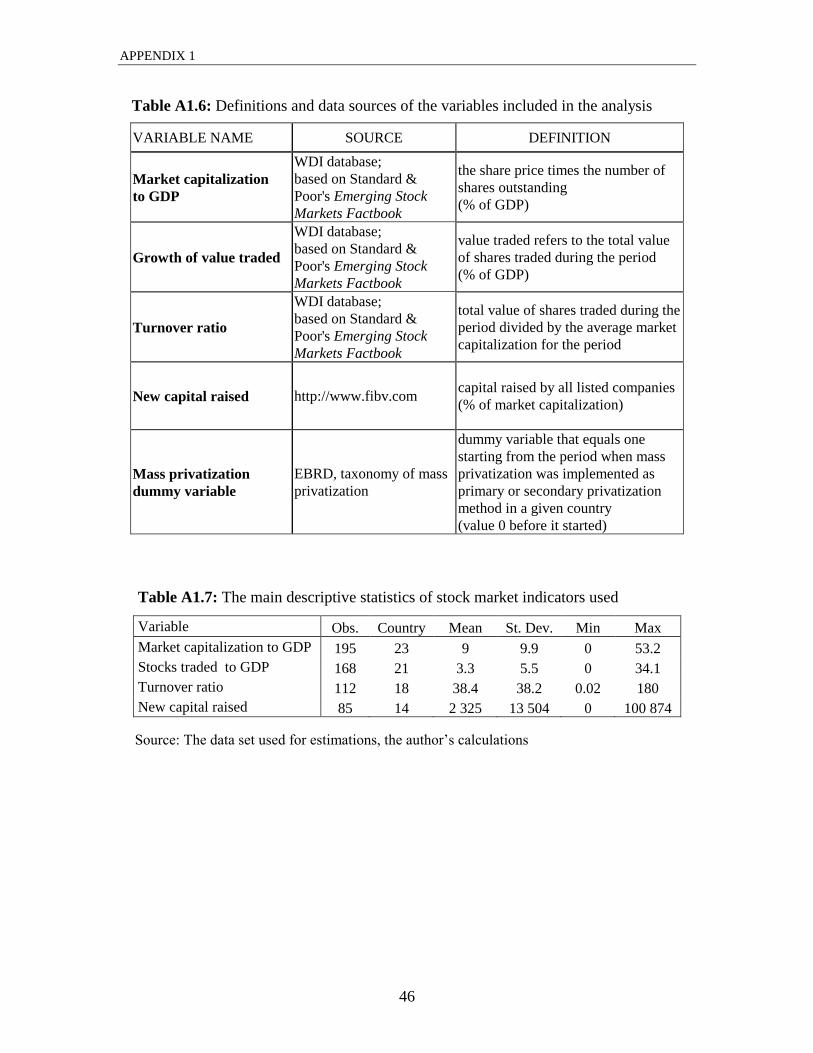
APPENDIX 1
46
Table A1.6: Definitions and data sources of the variables included in the analysis
VARIABLE NAME SOURCE DEFINITION
Market capitalization
to GDP
WDI database;
based on Standard &
Poor's Emerging Stock
Markets Factbook
the share price times the number of
shares outstanding
(% of GDP)
Growth of value traded
WDI database;
based on Standard &
Poor's Emerging Stock
Markets Factbook
value traded refers to the total value
of shares traded during the period
(% of GDP)
Turnover ratio
WDI database;
based on Standard &
Poor's Emerging Stock
Markets Factbook
total value of shares traded during the
period divided by the average market
capitalization for the period
New capital raised http://www.fibv.com capital raised by all listed companies
(% of market capitalization)
Mass privatization
dummy variable
EBRD, taxonomy of mass
privatization
dummy variable that equals one
starting from the period when mass
privatization was implemented as
primary or secondary privatization
method in a given country
(value 0 before it started)
Table A1.7: The main descriptive statistics of stock market indicators used
Variable Obs. Country Mean St. Dev. Min Max
Market capitalization to GDP 195 23 9 9.9 0 53.2
Stocks traded to GDP 168 21 3.3 5.5 0 34.1
Turnover ratio 112 18 38.4 38.2 0.02 180
New capital raised 85 14 2 325 13 504 0 100 874
Source: The data set used for estimations, the author‟s calculations

Chapter 1
47
Figure A1.1: Development of stock market indices in some transition economies
Czech Republic (index PX50) 1994 - 2006
0
200
400
600
800
1000
1200
1400
1600
6.4
.1994
6.4
.1995
6.4
.1996
6.4
.1997
6.4
.1998
6.4
.1999
6.4
.2000
6.4
.2001
6.4
.2002
6.4
.2003
6.4
.2004
6.4
.2005
6.4
.2006
Source: Prague Stock Exchange
Slovak Republic (index SAX) 1993-2006
0
50
100
150
200
250
300
350
400
450
500
14
.09
.19
93
14
.09
.19
94
14
.09
.19
95
14
.09
.19
96
14
.09
.19
97
14
.09
.19
98
14
.09
.19
99
14
.09
.20
00
14
.09
.20
01
14
.09
.20
02
14
.09
.20
03
14
.09
.20
04
14
.09
.20
05
14
.09
.20
06
Source: Bloomberg and Bratislava Stock Exchange

APPENDIX 1
48
Hungary (BUX index) 1991 - 2006
0
5000
10000
15000
20000
25000
1/3
/19
91
1/3
/19
92
1/3
/19
93
1/3
/19
94
1/3
/19
95
1/3
/19
96
1/3
/19
97
1/3
/19
98
1/3
/19
99
1/3
/20
00
1/3
/20
01
1/3
/20
02
1/3
/20
03
1/3
/20
04
1/3
/20
05
1/3
/20
06
Source: Bloomberg

Chapter 2
49
CHAPTER 2
CAN A WRONG ADMINISTRATIVE DECISION BE FIXED
AGAIN? MASSIVE DELISTING ON THE PRAGUE STOCK
EXCHANGE33
2.1 Introduction
Development of emerging stock markets has differed across transition countries. Some of
the countries have followed a standard, so called “top-down”, approach to stock market
development characterized by gradual growth of market capitalization and the number of
securities listed. A bottom-up approach, on the other hand, started with a large number of
listed shares out of which only some have survived on the market (Simoneti, 1997). Thus,
despite the expectations of growth in the number of listed securities as well as the
amounts of trade, some stock markets in transition economies have, after the initial boom,
experienced massive delisting, i.e. a large proportion of the listed share issues was
excluded from public trading within a relatively short period of time. This massive
delisting together with virtually no new listings pointed out problems in fulfilling the
main functions of the stock market34
, which based on our conjecture, may have the roots
in the way these markets were established.
The phenomenon of delisting is to certain extent a common occurrence in
developed economies as well35
. Nonetheless, the number of delisted share issues is
33
For valuable comments and suggestions I am grateful to Tom Berglund, Randall Filer, Jan Hanousek, Jan
Kmenta, Iikka Korhonen and Jan Švejnar, participants of the BOFIT summer workshop in Helsinki (June
2006), the Czech Economic Society Conference in Prague (November 2006) and XVI International "Tor
Vergata" Conference on Banking and Finance in Rome (December 2007). While working on this paper, I
have benefited from GACR Grant No. 402/05/1014. 34
For example they did not fulfill their information function, see Hanousek and Filer (2000) who show that
prices were disconnected with reality. Unlike Poland and Hungary, the Czech stock prices did not
correspond to economic values in the period 1993 – 1999. 35
See for example Macey et al. (2004).
2.1 Introduction
50
insignificant compared to the size of the market. According to the New York Stock
Exchange (NYSE) Factbook 6% of NYSE companies were delisted in 199736
. In the
same year, 75% of companies were delisted from the Prague Stock Exchange (PSE).
When considering these amounts it is, however, necessary to account for the number of
new listings as well. In this respect, transition economies in general fall behind the
developed ones as there have only been several new listings and thus just a few
companies entering the market through initial public offerings on the majority of these
emerging stock markets (Köke and Schröder, 2002; Bakker and Gross, 2004).
Delisting from the transition markets can be viewed from several different
perspectives. Firstly, it indicates that in some cases unsuitable companies were initially
placed to the market. Here delisting undoubtedly benefited the market because these
companies left the market and thus it became more transparent. On the other hand,
delisting in transition economies could hurt small investors with minority holdings37
because there were no exit rules defined at the time of delisting. Furthermore, massive
delisting in conjunction with practically no new listings contributed to shrinking of the
market, which then offered fewer investment opportunities and thus free resources had to
be invested elsewhere, usually abroad.
This situation still concerns the Czech stock market where the number of liquid
securities traded on the stock exchange is relatively low38
. Despite high expectations,
there have been no initial public offerings between June 200439
and December 2006 and
36
The proportion of companies delisted from the NYSE within a year has not exceeded 10% in the period
1995 – 2002 (NYSE Factbook). 37
As it was the case for example in Bulgaria. For more detail see Atanasov et al. (2005). 38
In fact, liquid securities are only the ones that belong to SPAD (System for Support of Share and Bond
Market). In 2006 there were 11 of them, at the end of 2008 the number was 14 (for more details see the
Prague Stock Exchange webpage www.pse.cz). This number was low not only in comparison to other
similar transition countries (e.g. Poland or Hungary, see Table A2.1 in the appendix) but also in comparison
to countries with a similar level of GDP per capita (e.g. in Portugal there were around 50 shares listed on
the main market or South Korea where there where more than 600 listed shares). For more details see
Euronext Lisbon Fact book and the statistics of the World Federation of Exchanges. 39
The first successful IPO of Zentiva took place in June 2004. Zentiva is traded in SPAD, it also became
part of PX-50 index and the value of its shares has almost doubled since its entry. The PSE expected several
potential followers of Zentiva in 2005, however two cases of only dual listing took place: Orco and Central
European Media Enterprises and it seems that Zentiva‟s IPO did not inspire other companies. Two share
issues (ECM Real Estate Investments A.G. and Pegas Nonwovens SA) have however entered the stock
exchange in December 2006.

Chapter 2
51
investors therefore invest their free resources also abroad. This way they in fact indirectly
finance growth of the foreign economies while growth of the Czech economy can be
hindered40
. On the other hand, there was a growing trend in the number of listed
securities since the beginning of trading on the Warsaw and Budapest Stock Exchange
(see Table A2.1 in the appendix). These markets are still attracting new companies, which
come also from abroad. Thus, unlike the Czech market, they have already managed to
provide capital to the corporate sector, especially through IPOs.
Taking into account the implemented institutional and other reforms, we suspect
that differences in the development of the Czech and Slovak market on one hand and the
Polish or Hungarian stock market on the other, have been the result of policies applied in
the early stages of the transition process; most importantly privatization which, based on
Korhonen et al. (2000), lays the foundation for the development of securities markets. In
Poland and Hungary the primary privatization method was direct sales, while in the
Czech Republic it was voucher privatization41
, which even nowadays remains the subject
of much discussion and controversy (Megginson, 2005). This method, as the analysis in
the first chapter suggests, has exhibited a negative short run impact on the emerging stock
markets in transition countries.
Czech voucher privatization can therefore be regarded as an experiment which
allows us to investigate under what conditions a viable stock market arises. In this paper
we analyze this by employing firm-level data. Using the data on listed and delisted
companies we show that it was possible to prevent massive delisting if certain pre-
privatization and privatization characteristics of the companies had been taken into
account when deciding which companies to place on the stock exchange for public
trading following the voucher privatization.
The following section provides detailed description of the stock market
emergence and the delisting process on the Prague Stock Exchange. Section 2.3 examines
determinants of delisting. In sections 2.4 and 2.5 we discuss specifications of estimated
40
Analysts estimate that this way the Czech economy could lose as much as 1.5% of its growth (Ekonom
3/2005). 41
Primary privatization based on the classification in the EBRD Transition Reports.

2.1 Introduction
52
models and the data used. Then, results, their interpretation and robustness follow in
section 2.6. Section 2.7 concludes.
2.2 Privatization and stock market development in the Czech Republic
The Prague Stock Exchange (PSE) started trading in the early 1990‟s as one of the first
stock exchanges in the transition countries42
. Its establishment and further functioning
was closely related to voucher privatization, which was implemented in two waves. This
privatization method was selected because it enabled relatively fast transformation of
ownership rights. Furthermore, voucher privatization, at the time when it was
implemented, was considered to be rather simple, equitable and transparent and thus also
socially and politically acceptable (World Bank, 2002). Any possible drawbacks were
regarded as temporary, with the market expected to be strong enough to solve them and
enable necessary ownership concentration (Ježek, 1997)43
. Unfortunately, such
expectations did not materialize. Voucher privatization failed to concentrate companies‟
ownership structure, minority shareholders‟ rights were harmed, foreign investors were
not attracted and new capital necessary for companies‟ restructuring was not generated
(Lieberman, 1997).
Moreover, voucher privatization incurred certain “hidden” costs that were not
recognized at the beginning and only became obvious during or even after its
implementation. These costs concern the evolution of necessary market institutions of the
type that function in the developed market economies44
. The stock market is undoubtedly
one of them. It was considered to be an important means of enabling the transfer of
ownership rights, the main goal of privatization (World Development Report 1996). Thus
the stock market was formally set up at the beginning of the 1990s, following the end of
the first wave of voucher privatization. Under this privatization scheme shares of all
privatized companies were legally required to be mandatory listed on the stock
42
In fact the Prague Stock Exchange was reopened in the early 1990s because the trading in securities
existed there even before the WWI. 43
Ježek (1997) describes the situation after privatization when capital market was not regulated at all as
false liberalism. 44
“Czech officials deem it more important to privatize state property quickly than to settle in advance the
details of a market economy,” (The Economist, 1993)

Chapter 2
53
exchange45
(PSE Monthly Report, May 1997). Even though listing requirements46
for
companies desiring to enter the market were formally defined by 1993, privatized
enterprises were not subject to them. This is not a standard approach towards stock
market creation because privatization authorities not companies themselves were the ones
to decide on listed companies. Although the managers in the privatized companies
prepared the privatization plans themselves and chose to participate in the voucher
privatization program47
, later evidence from the stock exchange indicates that they did not
know that this privatization method was connected to the mandatory listing of their
shares48
. Moreover, at the time of submission of their privatization projects to the
responsible ministries, virtually no legislation concerning the stock market and its
functioning was in force49
.
The above description suggests that the approach to market creation adopted in
the Czech Republic was a pure administrative decision that ignored the usual listing
requirements and suppressed the traditional concept of stock market development.
Consequently, companies that under standard conditions would prefer to be privately
owned ended up being public right after the PSE was opened. The PSE started trading on
April 6, 1993 and by June 22, 1993 622 share issues from the first wave of voucher
privatization were being traded there. Just a few weeks later, on July 13, 1993, the rest of
45
Even though the listing was mandatory, not all the privatized companies appeared on the stock exchange.
In the first wave 988 companies were privatized, however, only 955 share issues were listed on the stock
exchange. Unfortunately, even the stock exchange authorities cannot explain this difference. Following the
second wave there were 674 share issues listed and three issues were not listed because of their limited
transferability. However, altogether 861 enterprises participated in the second privatization wave. 46
Listing requirements at that time concerned the volume of an issue earmarked for public offer (min. 100
mil.CZK i.e. 3.4 mil. USD), percentage of an issue realized through public offer (min. 20% of the total
volume of an issue) and the length of issuer‟s existence (min. 2 years). In fact, a lot of companies that were
placed on the stock exchange after privatization did not satisfy these requirements. 47
This was envisaged already before the actual privatization started: “Most companies will join, either
voluntarily or on the orders of the government, a give-away scheme based on investment vouchers.” (The
Economist, 1991). Moreover, Kotrba (1995) suggests that authorities “recommended” voucher privatization
to be the most suitable method. 48
PSE Monthly Report (May 1997) mentions that some issuers were surprised when they were told about
their stocks being listed on the stock exchange. This is in line with a general view that many mass
privatization programs were slow to recognize the natural link between privatization and development of
capital market (Lieberman, 1997). 49
Companies were obliged to submit their privatization projects by October 31, 1991 for the first
privatization round and by July 16, 1992 for the second round. A commercial code was enacted on
November 5, 1991 and a securities law on November 20, 1992. This indicates that even the policymakers
were not fully aware of the connection between mass privatization and the stock exchange at the beginning.

2.2 Privatization and stock market development in the Czech Republic
54
the share issues (333) from the first wave entered the market. The number of securities
grew further following the second wave of voucher privatization, when the market was
“filled” with the new issues for the third time (PSE Monthly Report, May 1997). Then,
674 share issues from the second wave were introduced on March 1, 1995. Continuing
the trend of a growing number of issues, the highest number of security issues ever
registered on the exchange (a total of 1,792) was achieved on May 2, 1996. Market
capitalization to GDP reached 31.3% in 1996, which was much higher than in any other
transition economy. Similar figures at that moment were 11.66% in Hungary, 6.42% in
Poland and 9.5% in Russia (EBRD Transition report). This number is comparable to the
market capitalization figures in developed economies, however, when adjusted for the
size of public sector and investment fund holdings, the actual market capitalization in
1997 was 13.7% (Czech Republic: Capital Market Review, 1999)50
.
Hence, in line with Rozlucki (2001), voucher privatization to a large extent
influenced the development of stock markets. Table A2.2 in the appendix shows that
voucher privatization in the Czech Republic was followed by lively trading. This was
basically the result of a liberal regulatory framework and a multiplicity of trading
channels (Czech Republic: Capital Market Review, 1999). Speculators were trying to take
advantage of the stock market boom in the early 1994. Afterwards emerging market funds
from abroad entered the market. However, due to the condition prevailing at the market,
they have left it relatively soon, generally by the fall 1996 (PSE Monthly Report,
February 1997). Accordingly, as the PSE report further stresses, “the true foreign
portfolio investors have not entered the market and domestic investors did not particularly
care to invest in the securities either”. Furthermore, the new market was rather
nontransparent. This was not only due to a large number of listed securities but also
because most of the transactions were conducted off the main market. In 1996 and 1997
as much as 88.5% and 91.1% respectively of all trades at the PSE were conducted as
50
State holdings were deducted as they were not traded in reality. The value of investment funds holdings
was also deducted because the value of their shares was added to the value of securities in which they were
invested, thus they were double counted. Then, as the funds‟ own shares were valued at an average discount
of about 40 percent relative to the portfolio value of the shares in which they were invested, this market
value of investment funds shares was added. For more detail see: Czech Republic: Capital Market Review,
1999).

Chapter 2
55
direct and block trade (Hanousek and Podpiera, 2004). Therefore the price-setting central
market on the PSE remained relatively insignificant and the prices did not carry the true
information. Then, after the foreign investors left and ownership structures consolidated,
the main indicators of the Czech stock market functioning started to worsen (see Table
A2.2 in the appendix). This fact is not only reflected in the development of prices and
liquidity51
but also in a sharp decrease in the number of listed securities since an
exceptionally large number of securities were delisted52
within a relatively short period of
time (see Figure A2.1 in the appendix).
2.2.1 Delisting process
PSE authorities were trying to improve the market‟s situation. To make the market more
transparent and provide a better arrangement for the trading of hundreds of securities, a
segmentation of the market was introduced in September 1995. The listed market was
split into main and secondary markets, and the formerly unlisted securities were
transformed into the free market. The securities on the main and secondary market had to
fulfill certain requirements53
(certain minimal public offer, liquidity criteria, providing
economic information about the company) while the free market did not impose any
obligations on the securities. A large number of unlisted securities did not meet criteria of
the public market (PSE Monthly Report, May 1997). Therefore, the PSE authorities
decided to reduce the number of the security issues traded and delist, i.e. exclude from
public trading, issues that did not conform to the current requirements of the market. The
PSE authorities also took into account the sensitive nature of such a decision, especially
with respect to the significant part of the Czech population that took part in the voucher
privatization. In this respect “the decision concerning delisting could not be commenced
too early and 1997 seemed to be sufficiently far from the end of voucher privatization”
(PSE Monthly Report, May 1997).
51
Even though standard turnover figures were relatively high, they were misleading especially due to
multiple counting of transactions (which were the result of the structure of the market) and the associated
dealing practices (for more detail see Czech Republic: Capital Market Review, 1999). 52
Exceptionally large number when considered as a percentage of companies listed on certain stock
exchange. 53
For more detailed description see the Prague Stock Exchange Factbook 1996.

2.2 Privatization and stock market development in the Czech Republic
56
The process of delisting started at the end of 1996 (in December a trial round of
12 securities were delisted) when stock exchange employees even discussed this issue
personally with all the affected issuers54
. Until that time only an insignificant number of
securities was delisted from the PSE. The reasons for delisting were mostly bankruptcy
and limited transferability of the securities i.e. the delisting decision was not made by the
PSE authorities. In 1997, however, the PSE began to play an important role in the
delisting process. The PSE (Monthly Report, May 1997) cites the following factors to be
crucial for the delisting decision:
time of registration on the PSE (at least one year)
value of trades on the central market
value and frequency of direct and block trades
market capitalization of the issue
number of trading sessions with a non-zero value of trades on the central market
ownership structure
voluntary disclosure of the information on the issuer and the issue
possible interests of the National Property Fund
There were four major waves of massive delisting in 1997 taking place on March 20th,
April 1st, June 2nd, and October 1st. Altogether 1301 issues were excluded from
trading55. For each of these delisting waves certain criteria for delisting were set. They
are listed in the following Table 2.1.
A majority of listed companies were delisted in 1997. In the first wave 100 free
market issues were delisted, in the second 391 issues, the third one concerned 509 share
issues and the last one included 301 issues. In the first three waves for each delisted
security a combination of two of the above mentioned three requirements for the period
of the preceding twelve months had to be met, value and capitalization or value and the
54
Based on the PSE Monthly Report (May 1997), some issuers were surprised when they were told that
their stocks were registered on the exchange, other issuers welcomed their delisting almost enthusiastically. 55
Delisted share issues were afterwards listed on the RM-system (OTC market). Most of the delisted issues
were delisted from RM-system as well, majority of them later than one year after delisting from PSE.
Nowadays, only 3% of the issues delisted from PSE in 1997 are still traded on the RM-system.

Chapter 2
57
number of trading sessions56
. For the fourth wave of delisting both the condition
concerning minimal traded value as well as the number of days when an issue was traded
on the central market had to be fulfilled. The period under consideration was again the
preceding twelve months.
Table 2.1: Delisting criteria set by the PSE
(all of them concern the period of the preceding 12 months)
CRITERION 1st and 2
nd wave 3
rd wave 4
th wave
Traded value in the preceding
12 months less than USD 6,300 USD 18,900 USD 47,300
Market capitalization less than USD 157,000 USD 631,000
Number of days when security
was traded on the central market less than 5 less than 80 less than 200
Displaced issues 100; 391 509 301
Source: Prague Stock Exchange, author‟s calculations (based on the yearly average exchange rate
reported by the Czech National Bank)
Figures in this table show that the delisted companies were very small ones that
would normally not be placed on a stock exchange under standard listing conditions.
They were a fraction of the size of companies that were entering other transition markets
at that time (e.g. an IPO that took place on the Budapest Stock Exchange in 1997 had the
value of USD 4.477 mil.). Moreover, they even did not fulfill the official listing
requirements at the PSE valid in 199757
.
Afterwards, in 1998 only an insignificant number of securities was delisted, most
of them because of the issuer‟s decision. In 1999, 75 issues were excluded from the free
market on September 20th. They were already excluded from the pricing central market
on February 15, 1999 due to low liquidity. This decision was meant to further contribute
to increasing the transparency of the market. The amended Security Act, which entered
56
The PSE claims that except for the above mentioned conditions also other issues were accounted for
when deciding about delisting: value and frequency of direct and block trades, the structure of the company
owners, providing information about the issuer and the security issue to the stock exchange and trading
conducted at the international stock exchanges. Even though these criteria are mentioned by the PSE, it
does not explain how they were taken into account. 57
Volume of the part of the issue released through public offer had to be at least USD 3.4 mil. and
proportion of the issue released through public offer in the total volume of the issue at least 20%. In
addition the issuer had to be in business for at least two years (PSE Monthly Report, February 1997).

2.2 Privatization and stock market development in the Czech Republic
58
into force on May 1, tightened the conditions for admitting and keeping securities in
public markets58
and thus contributed to yet further delisting. However, the number of
additional companies was low. Together there were 34 share issues delisted in 2001.
Further, in 2002 and 2003 only 14 and 10 issues, respectively, were delisted, followed by
another 10 issues in 2004. This trend continued in 2005 and 2006 when 16 and 9
companies, respectively, were delisted, all of them based on the issuer‟s decision. Figure
A2.1 in the appendix and the following Table 2.2 provide a more comprehensive picture
of delisting on the PSE.
Table 2.2: Reasons for delisting firms from the Prague Stock Exchange in 1993 – 2006
reason/year 1993 1994 1995 1996 1997 1998 1999 2000 2001 2002 2003 2004 2005 2006
decision of the authority 1 11 1210 1 65 4 13 7 2
PSE
Ministry of Finance 1
decision not specified
sanction of the PSE board 1 1 1
trading group cancelled 65
insufficient liquidity 10 1210 1
low liquidity and high
own. concentration 5
low marcap and liquidity 9 2 2
low marcap, liquidity and
high own. conc. 3
information duties 1 2
decision of the issuer 6 7 12 37 10 6 11 14 17 5 8 10 16 9
issuer‟s request 2 4 1 2 1 2 2 5 10 9 3
end of public trading 2 3 29 7 6 11 13 15 3 3
limited transferability 4 5 5 7 1
squeeze out 7 6
bancruptcy related 3 3 6 13 5 4 3 10 4 2
start of chapter 7 or 11 1 7 3 2 2 2 1 1
start of liquidation 1 1 1
liquidation 3 2 6 5 2 2 1 7 2 1
Total delisted 9 10 19 61 1225 11 79 28 34 14 10 10 16 9
Delisted (% of listed at
the beginning of year) 1 1.9 3.6 73.4 3.4 26 14.4 22.5 13.7 12.7 15.4 29.1
Source: Prague Stock Exchange and author‟s calculations
58
Admission to the main and secondary market required the issuer to be in the business for a minimum of
three years (before it was only two years). The disclosure duties on the free market were expanded.
Chapter 2
59
Figures in this table confirm that massive delisting took place on the PSE
especially in 1997 when almost 80% of all delisted companies left the market, most of
them due to insufficient liquidity. Such a sharp decline in the number of traded shares in
conjunction with almost no new companies entering the market did not contribute to the
desired development of the newly created market. This leads us to the investigation of the
effects and determinants of delisting in transition economies which is lacking in the
relevant literature. Our research thus helps answer the question if and how it had been
possible to prevent this situation and this way ensure a more standard development of the
emerging stock market. In more general terms we are interested to investigate under what
circumstances a viable market for shares arises.
2.3 Determinants of delisting
Based on the above description of stock market development in the Czech Republic, we
assume that there exist certain indicators according to which it would have been possible
to predict delisting. Delisting indicates an effort of the market mechanism to remedy the
wrong decision of privatization authorities as most of the enterprises excluded from
public market were not natural candidates for public trading. Privatization is therefore the
most important criterion when identifying the determinants of delisting in the Czech
Republic. This approach sheds light on the structure of factors that played an important
role in the delisting process and also indicates that certain determinants were decisive
from the very beginning i.e. it was possible to account for them even in the pre-
privatization period. Factors connected to privatization are important because they are
connected to the concentration of ownership. If the pre-privatization and privatization
determinants turn out significant, it could point out that the decision to place all the
privatized companies to the stock exchange when the stock market was not functioning
yet and could not bear such a high number of securities, was not the best one from the
point of view of stock market development. In this respect emerging market did not
necessarily have to be strong enough to deal with this situation as the authorities were
stressing. Even in the case of important financial centres the government played essential

2.3 Determinants of delisting
60
role in kick-starting financial development since laissez-faire approach and secured
property rights alone were not sufficient (Andrianova et al., 2008).
Based on the above discussion, we consider delisting to be a function of the
following three groups of factors:
)_;;_( privpostprivprivprefdelisting (2.1)
The first group covers pre-privatization characteristics (pre_priv) of the companies, the
second is related to the privatization process (priv) and the third one concerns post-
privatization (post_priv) factors59
.
PRE-PRIVATIZATION FACTORS
These factors contain general characteristics of companies prior to privatization. They
include the industry to which a given company belongs60
, the size of the company as well
as indicators of its financial “health”. We measure the size of the company by the number
of employees and also the total number of the company‟s shares61
. Larger companies are
expected to be less prone to delisting as their size makes them more natural candidates for
public trading. Moreover, it should be much harder to obtain a controlling share in a big
company. For financial indicators we have available the indicators of sales, profit and
debt scaled by the company‟s capital. These are available for the three years before the
privatization took place. However, all of these indicators are based on socialist
accounting practices which do not necessary provide a true picture of a company‟s
situation. This will be taken into account when discussing the results of our estimations.
PRIVATIZATION FACTORS
This set of delisting determinants relates to the privatization process and its aftermath.
We distinguish two privatization waves while also taking into account the companies that
were privatized in both of these waves. An important source of information is the
privatization project that was prepared by the managers of each company before the
actual privatization took place and that was finally accepted. Here the expected ownership
59
This qualification of determinants is based on the timing of information and therefore we do not consider
interactions between these factors. 60
We use PSE classification. 61
Equal to company‟s book value since the nominal value of original shares was 1000 CZK.

Chapter 2
61
structure was indicated and we use the data concerning shares of the company owned by
the National Property Fund (NPF). A higher ownership share of the NPF indicates the
interest of state in a given company. The reasons leading to this decision ranged from the
intention of the state to implement necessary structural changes in a given company to
preventing the company from misusing its monopoly position (NPF Annual Report
1995). As the objective of the NPF was to show how well stock market works and thus
keep its companies publicly tradable, the probability of delisting in these cases can be
considered rather low.
The attractiveness of certain companies in the privatization process is reflected in
the average price for which the shares were sold in the auctions. Companies with a better
future outlook and thus with a lower probability of being delisted should be characterized
by a relatively higher average price of their shares. Different proportions of companies‟
assets were offered in mass privatization, a factor that is reflected by the ratio of the
number of shares in mass privatization to total number of shares. The ownership structure
that arises right after the privatization is crucial for further development of the company.
The proportion owned by individuals as well as investment privatization funds is
expected to play a role here.
POST-PRIVATIZATION FACTORS
We first consider the development of the financial indicators after privatization and the
consolidation of the ownership structure as these could reveal companies that would most
likely be delisted. The indicators that are investigated include sales, profit, operational
profit, total liabilities and value added, all scaled by total assets. Moreover, the sales
variable is used to calculate growth opportunities for a company, defined as the growth
rate between the current and following year of average sales in a given industry,
excluding the company itself. The same calculation is applied to the operational profit
data to obtain potential profit figure.
Further, trading on the stock exchange could also be taken into account. One of
the main trading characteristic is the frequency of trading of the stock. Even if this
indicator is low, it does not have to lead to delisting on the developed market because it
only indicates that the distribution of beliefs is the same among traders. In the Czech case,

2.3 Determinants of delisting
62
however, a low frequency of trading was one of the conditions for delisting set by the
PSE. On the other hand, a high frequency of trading can be considered a good signal,
particularly if this trend persists over time. An irregular pattern of trading intensity can
indicate either a consolidation of ownership structure following mass privatization or an
attempt to influence the price and consequently a potential tender offer price for minority
shareholders (Atanasov et al., 2005). In this respect the development of price and price
differentials can help clarify the situation. Another feature of trading is trading in blocks.
If there are many block trades that significantly influence the price, there is a probability
of price manipulation leading to tunneling and further delisting. Nevertheless, the usage
of trading characteristics as determinants of delisting can cause difficulties in the
estimations because of the possible endogeneity problem. This problem arises if we
assume that market is functioning properly in a sense that it already takes into account the
fact that some of the privatized companies should not be listed on the stock exchange. If
this assumption holds, the fact that the frequency of their trading is low just indicates that
market expects these companies to be delisted and thus endogeneity problem is present.
Nonetheless, we will estimate the model in a reduced equation form in which
simultaneous effects will not be taken into account. Therefore we will consider only the
determinants of delisting that do not concern trading on the stock exchange.
In comparison to our previous discussion, the official reasons for delisting
provided by the responsible authorities are defined rather broadly62
. Table 2.2 in section
2.2 provides them in more detail. It shows that the most important reasons for excluding
firms from public trading in the Czech Republic are based on the decision of the
authorities, mostly the PSE. The most commonly mentioned reason is insufficient
liquidity of securities (about 80% of delisted securities). Then, the end of public trading
based on the decision of the issuer follows (about 6% of delisted companies) and more
than 4% of companies were delisted in 1999 when their trading group on the PSE was
cancelled. The number of companies delisted due to other reasons is insignificant when
62
In this respect it is important to note that the time of delisting also plays a role here. The later certain
security was delisted, the more precisely the reasons for its delisting were defined. In fact, in 1997 when the
highest number of firms was delisted the appropriate reasoning was not provided for all the delisted
companies.
Chapter 2
63
we consider them in relation to all 1510 delisted companies. It is thus clear that the
reasons for delisting provided by the PSE are not sufficient in order to explain the
phenomenon of delisting and a more careful investigation is necessary.
2.4 Methodology
Delisting is modelled as a zero-one phenomenon, i.e. the company is still traded on the
stock exchange (0) or it is delisted (1). We estimate a linear probability model where the
dependent variable is the probability of delisting. It equals one for the companies that
were delisted. The explanatory variables belong to the three groups of factors described in
the previous section (equation 2.1) and thus the estimated model has the following form:
iiii privpostprivprivpreyP __)1( (2.2)
We also take into account possible connections between variables in different groups. It
has already been mentioned that the average share price in a privatization auction reflects
the attractiveness of a given company for investors. Thus, if we assume that market
functions well and the future prospects of a company are already included in this price,
the post-privatization profit variable could be connected to the average price. This could
lead to an endogeneity problem and spoil our results. To account for this problem, we use
the growth in sales and the growth in operational profit instead of plain operational profits
and sales as indicators of the post-privatization development. Both of them are defined as
the growth rate between the current and the following year of average value in a given
industry, excluding the company itself. As the company under consideration is not
included in the construction of these indicators, we consider their usage appropriate to
solve possible endogeneity problem. Furthermore, these indicators are suitable to
describe the post-privatization development. Growth in sales accounts for the
opportunities the company has in its own industry and operational profit variable shows
the profitability i.e. resources available inside the companies. The actual model that we
finally run on the whole data sample has the following specification:

2.4 Methodology
64
)3.2(__
_)1(
32143
2
21321
iiiii
iiiiii
millsgrsalesgroprobothwave
apaptnsprofnpftnsdelP
where
del is a dummy variable that equals 1 for company that was delisted before the end
of 2006 and 0 for not-delisted
tns is total number of shares of a company (in millions of shares)
npf is the share of company owned by the National Property Fund that was indicated
in the company‟s privatization project
prof_tns is profit per share one year before privatization
ap is average price of company‟s shares in the privatization auction (in points)
wave stands for a dummy variable which equals one if the company was privatized
in the first privatization wave
both is a dummy variable that equals one for companies privatized in both waves
opro_gr is growth in operational profit defined as the growth rate of average
operational profit in the industry (between 1996 and 1997), excluding the company
itself
sales_gr stands for growth opportunities, defined as the growth rate of average sales
in the industry (between 1996 and 1997), excluding the company itself
mills is the inverse Mills ratio63
This inverse Mills ratio enables us to account for the missing financial data problem.
Even though our sample contains all the companies privatized under the voucher
privatization scheme, we face the problem of missing observations, due to the fact that
not all the companies were willing to report their financial results. This was possible
because market supervision as well as law enforcement after privatization were weak.
The presence of missing observations leads to a sample selection bias problem that we
address by employing a two stage estimation (Heckman, 1979). The main part of this
estimation constitutes the linear probability model described above. In order to obtain the
63
It is the ratio of the probability density function for the standard normal over its cumulative density
function.

Chapter 2
65
inverse Mills ratio for this model we investigate the firms that do not report information
about their profits before and after the privatization and consider the factors determining
their decision. This approach is a Heckit regression where we employ probit estimation in
the first stage and a linear probability model in the second. We have chosen linear
probability model for several reasons. Firstly, it allows to instrument for profit and in
comparison to logit it provides consistent estimates under standard assumptions (Angrist
and Krueger, 2001). Moreover, the linear probability model can be corrected for sample
selection.
The probit regression, with the dependent variable being missing financial data
as a binary response, that we estimate first has the following form:
)4.2()1( iiiiii missindipfownersizeconstselP
where size accounts for the size of the company64
and its proportion privatized in the
voucher privatization. The set of variables concerning the ownership structure (owner)
described in the privatization project includes dummy variables for domestic and foreign
owners as well as restitutions, National Property Fund share, municipalities and selling
via intermediaries. IPF stands for the actual ownership shares owned by the investment
privatization funds following the privatization. We further account for the industry to
which a given company belongs (ind)65
. Moreover, we define a dummy variable based on
the firm‟s reporting or non-reporting in the pre-privatization period (miss). If a company
has not reported some of its financial indicators before66
, we believe that there is a high
probability that it will continue doing so also after privatization.
Except for this basic two stage model where we only distinguish between delisted
and not delisted share issues, we also employ a more precise classification of companies.
It concerns the three main reasons for delisting: decision of the authority, decision of the
issuer and bankruptcy related reasons. The determinants of delisting may be different for
each of these subgroups. The results of preliminary investigation confirm that the
64
We also add quadratic term to this variable, since we expect the relationship to be nonlinear. 65
We use PSE classification. 66
At least two out of the three pre-privatization indicators are missing in our sample.
2.4 Methodology
66
proportions of missing observations are not significantly different when accounting for
different delisting reasons (see Table A2.8 in the appendix) and therefore there is no need
to estimate the model in two stages as the one above where we only distinguished
between delisted and not delisted companies. Rather, we run multinomial logit estimation
based on a similar model specification as before (equation 2.3), where the dependent
variable takes four different values. They account for not delisted firms, firms delisted
due to decision of the authority, issuer and bankruptcy respectively.
Besides binary regression model, another possibility to estimate delisting is
survival analysis employing a hazard model. The dependent variable in this case is time
elapsed until a given company becomes delisted. The fact that delisting in most cases
occurred in the waves can however cause problems with identification of such a model.
The actual date of delisting is not that important for this analysis and moreover, it may
even be affected by other factors of a mainly technical and administrative nature.
Therefore, we prefer to conduct the analysis by using several variations of binary
regression model instead.
2.5 Data description
Our data set includes the population of firms privatized in the first and the second wave
of the voucher privatization program. Altogether it contains 1664 medium and large non-
financial companies that traded on the Prague Stock Exchange following privatization.
Data concerning privatization come from the Ministry of Privatization of the Czech
Republic as well as the Ministry of Finance (privatization projects, pre-privatization
data). They concern the period 1992 – 1995. The data on holdings after the first and
second privatization wave come from the Prague Securities Centre database. Financial
data, together with the post-privatization ownership structure of the companies are from
the private database ASPEKT67
which is based on the annual reports as well as
information provided to the stock exchange and companies‟ shareholders. Here, the time
period of interest are years 1995 – 1997 i.e. after privatization and before the major
67
ASPEKT database is a Czech source for AMADEUS, a pan-European database containing financial
statements data. All financial statements in our data set are audited.

Chapter 2
67
delisting. Finally, the Prague Stock Exchange provided data about delisting for 1993 -
2006. Details concerning changes in the legal status of delisted companies (bankruptcy,
merger, acquisition) were taken from the Czech companies register68
. Description of the
variables used in the estimation is provided in the appendix (Table A2.9 in the appendix).
2.5.1 Descriptive statistics
Different characteristics of the companies are investigated for the whole sample as well as
for the subcategories of delisted and not delisted companies. Differences between these
subsamples are tested using nonparametric tests69
. Furthermore, in the delisted subgroup
we distinguish the waves of delisting as well as the different reasons for which the
companies were delisted. Descriptive statistics show that the data for all the companies
and subgroups included in analysis are characterized by a very high degree of variability.
This pattern is especially visible when considering median and quartile coefficients70
.
Pre-privatization firm size is measured by the number of employees as well as the
total number of firm‟s shares in the voucher privatization (see Table A2.3 in the
appendix). The absolute number of employees decreases for both delisted and not delisted
subgroups with approaching privatization. This decrease is more significant for the
delisted companies and within this subgroup especially for companies that were delisted
due to bankruptcy. The general decrease in the number of employees before privatization
can be attributed to the overall transition process and restructuring, which was taking
place at the beginning of the 1990s. The difference between the number of employees
three years and one year before privatization shows the dynamics of the ongoing
restructuring. Analysis of the number of employees variable, however, faces a problem
of missing observations, with the number of observations three years before privatization
much lower in comparison to what is available for one year before privatization.
Furthermore, the data concerning the number of employees for the firms included in our
sample is not available for the period after privatization. Therefore, we focus on the total
68
www.justice.cz. By further existence we mean existence of the company‟s capital. Therefore if a company
merged with some other company, its capital is still in use and we consider this acceptable for our purposes. 69
We use nonparametric K-sample test on the equality of medians and the Wilcoxon ranksum test. We do
not provide the exact outcomes of these tests here but they are available upon request. 70
Detailed results are not part of this paper but are available at http://home.cerge-ei.cz/fungacova.

2.5 Data description
68
number of shares which reflects the capital or “book value” of a given company as our
size measure. Moreover, thanks to this pre-privatization measure we can use total assets
variable for the after privatization period because it basically measures the same thing as
the total number of shares variable.
The total number of shares indicator, similar to the number of employees variable,
shows that delisted companies are significantly71
smaller than their counterparts that
remain listed on the stock exchange. Companies delisted based on the decision of the
authority are smaller than companies delisted for other reasons. This result indicates the
effort of the PSE to consolidate the situation on the stock exchange and correct the wrong
administrative decision of placing all the privatization companies‟ shares on the public
market. Moreover, companies delisted in the four main waves in 1997 and before are
significantly smaller than the ones delisted afterwards. Results for the total number of
shares variable thus confirm our expectation that the size of a company measured by the
amount of company‟s capital is an important predictor of delisting, result found also for
Bulgaria (Atanasov et al., 2005). This trend is confirmed by the distribution of companies
listed on the PSE by size (Figure A2.2 in the appendix).
On the other hand, the pre-privatization financial characteristics (sales, debt, and
profit) do not differ significantly for the subgroups of companies that we consider (see
Table A2.4 in the appendix). This could be attributed to the fact that restructuring was
only beginning in the early 1990s as there was no private ownership at that time.
Consequently, its effect cannot yet be visible in the financial indicators. Another possible
explanation is that this data is based on socialist accounting practices which were
different from western standards, reflecting the amount of production rather than the
profitability of the companies72
. Nevertheless, the amount of debt increases for companies
that are not delisted as the time of privatization approaches. This could indicate their
effort to restructure. It is important to note, however, that the number of observations of
debt available in our sample is lower than for the other financial indicators, meaning that
not all the companies were willing to provide this information to the public. Similar to
71
Nonparametric K-sample test on the equality of medians and the Wilcoxon ranksum tests mentioned
above confirm these results. 72
For more details see Filer and Hanousek (2002).

Chapter 2
69
debt, the profit variable also worsens for all the companies as privatization draws nearer.
Profit, especially, decreases one year before privatization starts. This trend can most
probably be attributed to the overall transition process and the abrupt changes that were
going on in the economy at that time. However, the difference between sales three years
and one year prior to privatization shows a significant difference between subsequently
delisted and not delisted companies. Even though sales tend to increase for both
subgroups, the increase for companies that were not delisted was significantly higher.
The average price of shares in the privatization process (see Table A2.5 and Table
A2.6 in the appendix) was significantly higher for companies that were not delisted (see
also Figure A2.3 in the appendix), indicating that these companies were more attractive
for investors. Within the delisted subgroup, the average price is higher for companies
delisted after 1997. All of these findings show that bidders in the privatization process
were able to distinguish between “good” and “bad” companies and evaluate future
prospects of a given company. Companies delisted based on the decision of the issuer
exhibit higher average price than those delisted for other reasons. The fact that despite a
relatively high average price they were delisted may indicate that the owners themselves
found out that there is no reason for having company shares publicly traded due to the
company‟s size and other company characteristics. On the other hand, one could
speculate that the delisting decision of owners may also indicate possible tunneling in a
given company.
Furthermore, when distinguishing the wave in which a given company was
privatized, a difference in average price between the delisted and not delisted subgroups
is apparent. The average price is significantly higher for the companies that belong to the
second wave. The difference between the first and second wave may be attributed to the
fact that the investors might have already acquired experience while bidding in the first
privatization round. Moreover, the stock exchange had already been established by the
time of the second wave and was functioning as a kind of bridge between the real and the
“fictive” i.e. voucher point price based on the socialist accounting standards.
The privatization factors that we consider also include variables describing the
ownership structure that arose right after privatization. Investment privatization funds‟

2.5 Data description
70
holdings differ significantly after the second privatization wave for all the subgroups of
companies that we consider (see Table A2.7 in the appendix). Funds‟ holdings are higher
for delisted companies, which indicates that there was a higher probability of funds‟
owners exercising their power over the companies. When accounting for time of
delisting, the results indicate that funds‟ holdings in companies delisted in and before
1997 are higher in comparison to the rest of the delisted companies. The reason for the
significant differences only in the second wave holdings could be the announcement that
the second privatization wave was the last one which made investors who were really
interested in some company obtain as many of its shares as possible.
The third group of indicators concerns the period after privatization. We consider
the following post-privatization financial characteristics: profit, operational profit and its
growth, sales and their growth, total assets, total liabilities and value added73
. Similar to
our expectations, the above described nonparametric tests that we apply confirm that
these characteristics are significantly different for delisted and not-delisted companies, as
well as for the reasons and time subgroups within the delisted group.
73
Similar to the previous cases detail results are not part of this paper but are available at http://home.cerge-
ei.cz/fungacova.
2.6 Estimation and results
In order to estimate the influence of different factors on delisting we run the above
described two stage Heckit regression on the sample including all companies ever listed
on the PSE. The linear probability model (equation 2.3) provides us with the results
summarized in the following Table 2.3.
All the explanatory variables included in the model with the exception of the pre-
privatization profit indicator are significant. Moreover, the estimated effects exhibit the
expected signs. There are two possible explanations for the non-significance of the pre-
privatization profit. The first one is connected to the fact already mentioned, the quality of
the data from the pre-privatization period. The indicator of profit in this case does not
reflect profit but production and therefore does not necessarily reveal the true picture of a
situation in a given company. The other explanation is the possibility of tunneling.

Chapter 2
71
Table 2.3: Linear probability model for delisting (y=1 for delisting)
Linear probability model Interpretation
Pre-privatization factors Estimated
coefficient
Standard
Error
Overall effect (one st.
deviation change)
Total number of shares (millions of shares) -0.0226 ** 0.010 -4%
Profit before privatization (scaled by book value) 6.5E-06 0.0003 0.01%
Privatization factors Estimated
coefficient
Standard
Error
National property fund ownership -0.003 *** 0.001 -4.26%
Average price in voucher auction (in points) -0.001 *** 0.0003 -5.66%
Average price (squared) 1.1E-06 *** 2.5E-07 0.31%
Average price (overall effect) -5.35%
Privatization wave -0.055 *** 0.015
Privatized in both waves -0.057 ** 0.028
Post-privatization factors Estimated
coefficient
Standard
Error
Operational profit growth -0.0001 **** 3.9E-05 -2.65%
Growth opportunities (sales) 0.006 *** 0.001 4.31%
Mills ratio (sample selection) 0.353 *** 0.087
Constant 0.885 *** 0.027
Number of observations 1,470
Adjusted R2 0.148
Note: The table contains estimation results for the linear probability model. We report
estimated coefficients as well as their significance (* significant at 10%, ** significant at 5%
and *** significant at 1%). In the linear probability model estimated coefficient correspond
to the marginal effect.
The significance of other factors indicates that delisted companies exhibited,
before and during the actual privatization, different characteristics from the companies
that remained on the stock exchange. Especially the size of the company (measured by the
total number of shares which corresponds to company‟s book value) and the ownership
structure described in the privatization project have played a role here. These results
confirm our expectations with larger companies having a lower probability of being
delisted. A one standard deviation change in the size of company measured by total
number of shares, decreases probability of delisting by 4 percent (the last column in the
above Table 2.3). More specifically, this result says that the increase in the size of
company by a million shares decreases the probability of delisting by 2.26 percent. The
significance and magnitude of the results indicate that, as we have argued earlier, not all
the companies privatized in voucher privatization were suitable candidates for immediate

2.6 Estimation and results
72
placement on the stock exchange. Size of the company could have been considered one of
the decisive factors for the necessary filtering to prevent the emergence of a non-
transparent market.
In addition to company size, the proportion of shares held by the National
Property Fund (NPF) could serve as a predictor of possible delisting. Our results show
that an increase in the amount of shares owned by the NPF by one percent decreases the
probability of delisting by 0.3 percent, which is in the one standard deviation change
measure as much as 4.3 percent. This is because the state tends to play a special role in
the ownership structure and in this case it also indicates the future intensions of state
towards the privatized company74
. Another important privatization factor is the average
price of the privatized companies‟ shares. As we expect to find a nonlinear relationship
between average price and delisting, average price is also included in quadratic form. A
higher price indicates higher valuation of the company by bidders75
and thus, greater
expected future prospects and lower probability of being delisted. The results of our
estimation support this hypothesis. An increase in the average price by ten voucher points
decreases the probability of delisting by 1 percent. A one standard deviation increase in
price decreases the probability by 5.35 percent. Thus, the average price in the voucher
auction turns out to be one of the most important predictors of delisting.
Another decisive factor is the wave in which a given company was privatized. Our
results suggest that the probability of delisting is 5.5 percent lower for companies that
were privatized in the first privatization wave and 5.7 percent for those that were
privatized in both waves. This result is in line with findings of Gupta et al. (2000) who
provide evidence that more profitable firms were privatized first in the Czech Republic.
Massive delisting took place in 1997, and thus also post-privatization company
characteristics are expected to influence delisting. We consider operational profit which
is, in comparison to the pre-privatization profit, based on standard accounting practices
and, unlike the overall profit variable, better reflects the real functioning of a given
74
Most of the companies where state owned a significant proportion of shares were so called strategic
companies. 75
Hanousek and Filer (2001) show that prices of larger firms comprising the bulk of assets in the voucher
privatization scheme rapidly incorporated all the public as well as private information.

Chapter 2
73
company because it does not include extraordinary items. The years under consideration
are 1996 and 1997; this time period directly follows privatization and at the same time
precedes the main waves of delisting. As already mentioned, due to a possible connection
between profit and the average price in the privatization auction we construct an
operational profit growth variable based on the operational profit growth in a given
industry. Its estimated coefficient is significant and its sign indicates that decrease of
growth in operational profits by one percentage point increases the probability of delisting
by 0.01 percent, which in the standard deviation change measure translates into 2.65
percent. This result corresponds to our expectations, even though the effect is not as
strong as in the case of pre-privatization and privatization factors, which play key role in
explaining delisting.
The estimated model also considers future prospects of a listed company. We
include a forward looking indicator that accounts for company‟s growth opportunities. As
described in the methodology section, it is based on the growth of sales in a given
industry. Similar to our expectations, the estimated coefficient is significant. One would
expect it to have a negative sign, so that probability of delisting would decrease with
higher growth opportunities. It is however, positive, and one standard deviation increase
in the growth opportunities constitutes a 4.3 percent increase in probability of delisting.
This means that future prospects play a role in delisting but our result also suggests that
the new owners can despite promising future exercise their power and tunnel the
company.
The inverse Mills ratio turns out significant which suggests that the unwillingness
to report financial results plays a role in the delisting process and the two stage estimation
procedure is necessary. R2
as a measure for goodness of fit is not very high, however,
taking into account the structure of the model and a relatively high number of delisted
companies we cannot expect it to be much higher. We employ McNemar-type of test
suggested by Hanousek (2000) to compare our model to a naive estimator on the basis of
their predictive accuracy. This can be interpreted as a test of the significance of the
model. The quality of prediction summarized in Table A2.10 in the appendix and the
corresponding high value of 2 confirm that our estimator highly dominates the naïve

2.6 Estimation and results
74
estimator in terms of prediction accuracy76
. Thus, the estimated model is significant and
supports our hypothesis, that there exist several economic measures, especially from the
pre-privatization and privatization period, based on which delisting of certain company
could have been predicted and that could have been used when deciding which companies
to place on the stock exchange for public trading after the voucher privatization.
2.6.1 Reasons for delisting
Besides distinguishing between delisted and not delisted companies, we also account for
the delisting reasons. There are three main categories of reasons for delisting we
distinguish based on the information from the PSE: decision of the authority, decision of
the issuer and bankruptcy related reasons. We deem it important to examine the
determinants of delisting for these categories and as explained in the methodology section
we employ a multinomial logit model to do it. It has the form of the basic model
(equation 2.3) without Mills ratio but the dependent variable is different in this case. It
can take four different values:
0 for companies that were not delisted
1 for companies delisted based on the decision of the authority
2 for companies delisted on the issuer‟s request
3 for bankruptcy related delisting
The estimation results uncover differences between groups of companies delisted due to
different reasons. As Table 2.4 shows, the most significant results are obtained for the
subgroup delisted due to the decision of the authority. This result is most probably also
due to the size of this subgroup, as it contains as many as 1200 observations (which
comprise 82% of the whole sample). The results for companies delisted due to the
decision of the authority are in line with the results obtained for the basic model. The
marginal effects that are reported stress the importance of company size, which is the
most influential determinant of delisting because the probability of delisting decreases by
30% when increasing the number of shares by one million. Nevertheless, unlike the basic
76
Formally we reject the null hypothesis that the probability of correct prediction is the same for both
models.

Chapter 2
75
model, the coefficient for the National Property Fund (NPF) variable is insignificant here.
This may indicate that the significance of the NPF variable in the basic model was
primarily driven by the companies that were not delisted. However, now when we
distinguish subgroups of companies in more detail, the effects across them differ and the
NPF variable becomes significant even for smaller subgroups.
Table 2.4: Multinomial logit model based on different reasons for delisting
MULTINOMIAL LOGIT Decision of the authority Decision of the issuer Bankruptcy related
Pre-privatization factors coefficient dP/dX coefficient dP/dX coefficient dP/dX
Total number of shares (millions) -2.345 *** -0.296 0.003 0.127 0.046 0.05
Profit before privatization
(scaled by book value) -0.0031 0.001 -0.034 -0.002 -0.0005 0.0002
Privatization factors
National property fund ownership -0.003 0.002 -0.035 *** -0.002 -0.022 * -0.0004
Average price (in points) -0.016 *** -0.002 0.003 0.001 -0.007 0.0001
Average price (squared) 2.8E-05 ** 5.9E-07 -1.2E-05 -2.0E-06 -0.0001 -3.0E-06
Average price (together) -0.002 0.001 -0.0003
Privatization wave -1.081 *** -0.13 -0.118 0.049 0.111 0.026
Privatized in both waves -0.695 ** -0.082 -0.325 0.012 0.584 0.033
Post-privatization factors
Growth opportunities (sales) 0.053 *** 0.004 0.030 -0.001 0.0471 * 0.0002
Operational profit growth -0.001 ** -0.0001 -0.0003 0.0001 -0.002 ** -3.2E-05
Constant 3.758 *** 0.491 0.041 -0.196 -1.051 * -0.11
Number of observations 1,656
Scaled R2 0.245
Note: The table contains estimation results for the multinomial logit model where reasons for delisting are
taken into account. The results for not delisted companies are not reported (it is possible to count them
based on these numbers as the sum of probabilities equals 1). We report estimated coefficients, their
significance (* significant at 10%, ** significant at 5% and *** significant at 1%) as well as marginal
effects (dP/dX) for the particular reasons for delisting.
Yet, the effect of a lower number of observations is visible on the significance of
the other coefficients for companies delisted in the two other subgroups. When
interpreting these results there is another issue that needs to be taken into account.
Companies delisted based on the issuer‟s request can be of two types. The first one is
represented by the companies that are objectively, especially due to their size or area in
which they operate, not appropriate candidates for public trading and their owners
decided to delist in order to correct the wrong administrative decision that followed

2.6 Estimation and results
76
voucher privatization. On the other hand, there are companies that their owners wanted to
delist because they did not want to disclose information about the company to the public.
These two issues then contribute to splitting this subgroup containing a relatively low
number of observations even more and consequently it is not possible to expect any
significant results. Despite this fact, as we have already mentioned, the ownership share
of the NPF plays a significant role in the decision of the issuer subgroup. Increase of the
share owned by the NPF by one percentage point decreases the probability of delisting by
0.2 percent. This result only confirms that companies where NPF has an ownership share
are not expected to be delisted, especially if the reason for delisting is the decision of the
issuer. The strong position of the NPF is visible also in the subgroup delisted due to the
bankruptcy, where the NPF ownership variable is significant as well but its effect is much
smaller (0.04 percentage points). The most important variable for the bankruptcy related
subgroup is the operational profit growth variable. This is exactly what one would expect,
as operational profit is a crucial indicator of a company‟s functioning. Even though its
effect is significant, it is not very high. Thus, despite the fact that not all the results in this
specification turn out significant, there are visible trends that confirm differences between
companies delisted due to different reasons that are in line with our expectations and
previous estimations.
Defining reasons for delisting based on the information we have available is rather
difficult and thus it is possible to view it from several different perspectives. In the
estimations conducted above we were mostly considering the reasons provided by the
stock exchange. The most common reason for delisting defined by the stock exchange
was insufficient liquidity. Until now we have treated it as a decision of the authority. In
the alternative classification we consider companies delisted because of the insufficient
liquidity to be part of the group delisted due to the decision of the issuer. This is because
insufficient liquidity indicates the presence of a dominant owner, who in case he does not
want his company to be publicly traded in fact does not have to do anything. Since the
free float is low, he is only waiting until the company is delisted because of insufficient
liquidity. This further opens a discussion about delisting de facto and de jure. Delisting de
jure is the official delisting reported by the stock exchange, while delisting de facto

Chapter 2
77
concerns the real behavior of the issuers. When taking delisting de facto approach,
delisting due to insufficient liquidity can be considered a decision of the issuer. As a part
of sensitivity analysis, we consider an alternative division of companies based on the de
facto delisting approach and run the multinomial logit model described above on the new
subgroups. The estimation results correspond to the ones already reported. The most
significant results are obtained for subgroup with the highest number of observations and
the signs and magnitudes of the estimated coefficients are in line with the results of our
basic model. The results for the subgroup of companies delisted due to bankruptcy, which
stays the same as in the original division, remain basically unchanged. All of this thus
reconfirms our previous results.
2.6.2 Robustness check
All of the above-described estimations have also been carried out on the subsample that
includes companies that were delisted in 1997 in the four major waves as well as those
that have survived 1997. The companies in this subsample are the most important ones
from the point of view of delisting as this phenomenon was relatively rare and
insignificant before 1997. The estimations on this subsample have shown the same
pattern of results as were described for all the companies. In this way we have in fact used
this subsample to check the robustness of our results.
Furthermore, we have also included industrial dummies in the linear probability
model estimated as the second stage of Heckit regression. The industrial dummies were
defined rather broadly and we only distinguish between heavy and light industries. Even
when including these dummies, the estimated coefficients of other explanatory variables
remained basically unchanged, which once again confirms robustness of our results.
2.7 Conclusion
In its short history the Czech stock market, unlike the Polish or Hungarian one,
experienced massive delisting of shares and virtually no initial public offerings.
Nevertheless, delisting in the Czech Republic was necessary due to the fact that all the
privatized companies were simply placed on the market by the administrative decision
2.7 Conclusion
78
following the voucher privatization. Interestingly enough, except the Czech Republic,
massive delisting was also observed in other transition countries77
where the initial
background was similar to the Czech one: voucher privatization. Massive delisting in
conjunction with almost no new companies entering the market put off the development
of these markets. Accordingly, all of them seem to lack behind the other transition
countries, as shown in Chapter 1.
In this paper we investigate the determinants of delisting and point out that it was
possible to prevent this situation. The results of our estimation indicate that there exist
several factors based on which it was possible to identify companies that were going to be
delisted even before the actual delisting took place. These characteristics include the size
of the company, ownership share of the National Property Fund, average price of
company shares in the privatization process, privatization wave as well as company‟s
future prospects. Furthermore, company‟s non-reporting in the pre-privatization period
plays a role in the delisting process as well. Most of these determinants of delisting are
connected to the pre-privatization and privatization period. This indicates that it could
have been possible to prevent delisting if these issues had been taken into account when
deciding which companies to place on the stock exchange for public trading following the
voucher privatization. Taking into account the overall development on the PSE we
conjecture that massive delisting did not only serve to correct the wrong decision of the
privatization authorities by “cleaning” the market of unsuitable shares but it also sent a
signal concerning the functioning of the whole market. Cleaning itself had a positive
effect in the long run because the market became more transparent. Nevertheless, in the
short run delisting seems to have a negative effect on the price development and the size
of the market.
This development suggests that governments making the important decisions
concerning privatization programs and influencing emerging stock markets should be
very careful when choosing which companies will be privatized using a particular method
and based on which criteria these companies will be placed on the stock exchange. If a
77
Even though the developments in transition countries differed, besides Czech Republic delisting took
place in Bulgaria, Lithuania and Slovakia.

Chapter 2
79
proper filtering of companies had been implemented in the Czech Republic before
placing privatized companies on the stock exchange, a more transparent stock market
fulfilling its main economic functions would have emerged after the privatization. This
result can also be supported by comparing the Czech market to its counterparts in Poland
and Hungary where the stock market evolved gradually and there was no massive
delisting of shares. By taking into account their development one could speculate that
massive delisting in the Czech Republic was one of the decisive factors causing the fact
that there were virtually no new listings on the PSE. Then, with only a few liquid
securities, there were not enough investment opportunities neither for foreign, nor for
domestic investors. This is important especially with respect to the ongoing pension
system reform because the pension funds are usually required to invest some portion of
their portfolio on the local market. If there are no suitable share issues available, they may
end up buying only government bonds and investing more abroad, meaning that their
economy could be deprived of this capital and they will in fact be financing the growth of
some other country. Such an unfavorable development may, based on recent empirical
studies, have implications for the country‟s further economic growth.

References
80
REFERENCES
Andrianova S., Demetriades P., Xu Ch. (2008): “Political Economy Origins of Financial
Markets in Europe and Asia,” Discussion Papers in Economics 08/1, Department of
Economics, University of Leicester.
Angrist J. D., Krueger A. B. (2001): “Instrumental Variables and the Search for
Identification: From Supply and Demand to Natural Experiments,” Journal of Economic
Perspectives, Volume 15(4): 69 – 85.
Atanasov V., Ciccotello Conrad S., Gyoshev Stanley B. (2005): “How Does Law Affect
Finance? An Empirical Examination of Tunneling in an Emerging Market,” William
Davidson Institute Working Paper No.742.
Bakker M., Gross A. (2004), 'Development of Non-bank Financial Institutions and
Capital Markets in European Union Accession Countries', World Bank Working Paper
No. 28
Czech Republic: Capital Market Review (1999), The World Bank Washington, D.C.
EBRD (European Bank for Reconstruction and Development), 1995 – 2003: Transition
Report.
Gupta N., Ham J., Švejnar J. (2000): “Priorities and Sequencing in Privatization: Theory
and Evidence from the Czech Republic,” William Davidson Institute Working Paper No.
323.
Hanousek J. (2000): “Testing of (non-nested) Choice Models via Accuracy of Prediction:
A Non-Parametric Approach,” Central European Journal of Operations Research 8: 259
– 264.
Hanousek J., Filer R. (2000): “The Relationship Between Economic Factors and Equity
Markets in Central Europe,” Economics of Transition 8(3): 623 -638.
Hanousek J., Filer R. (2001): “Informational Content of Prices Set Using Excess
Demand: The Natural Experiment of Czech Voucher Privatization,” European Economic
Review 45: 1619 – 1646.
Hanousek J., Filer R. (2002): “Research Data from Transition Economies,” Journal of
Economic Perspectives 16(1): 225 – 240.
Hanousek J., Podpiera R. (2004): “Czech Experience with Market Maker Trading
System,” Economic Systems 28: 177-191.
Chapter 2
81
Heckman, J. (1979): “Sample Selection Bias as a Specification Error,” Econometrica 47,
153-161.
Ježek T. (1997): “Česká republika bude mať komisiu pre cenné papiere (The Czech
Republic will have Security Exchange Commission),” BURZA 12/1997.
Korhonen I., Kuus T., Zirnask V. (2000): “Baltic Securities Markets,” Bank of Finland
Institute for Economies in Transition, Online, No.5.
Kotrba J. (1995): “Privatization Process in the Czech Republic: Players and Winners,”
pp. 159 – 198, in Švejnar J.: The Czech Republic and Economic Transformation in
Eastern Europe, San Diego, London and Toronto: Harcourt Brace, Academic Press.
Köke J., Schröder M. (2002): “The Prospects of Capital Markets in Central and Eastern Europe,” ZEW Discussion Paper No. 02-57.
Lieberman I. W. (1997): “Mass Privatization in Comparative Perspective,” in Lieberman
I., Stilpon N., Raj D. (eds), Between State and Market: Mass Privatization in Transition
Economies, The World Bank and OECD.
Macey J., O‟Hara M., Pompilio D. (2005): “Down and Out in the Stock Market: The Law
and Finance of the Delisting Process,” SSRN Electronic Journal, available at
http://papers.ssrn.com/sol3/papers.cfm?abstract_id=583401
Mašek F. (2005): “Ani rekordy vše neřeší (Records will not solve all the problems),”
Ekonom 3/2005.
Megginson W. L. (2005): The Financial Economics of Privatization, New York: Oxford
University Press.
Prague Stock Exchange Annual and Monthly Reports (1993 – 2005).
Rozlucki W. (2001): “Emerging Stock Markets in Central Europe: Where Do We Stand?”
In Bokros L., Fleming A., Votava C.: Financial Transition in Europe and Central Asia:
Challenges of the New Decade, The International Bank for Reconstruction and
Development / The World Bank.
Simoneti M. (1997), “Regulating Post-privatization Securities Markets in Transition Economies,” in Lieberman I., Stilpon N., Raj D. (eds), Between State and Market: Mass Privatization in Transition Economies, The World Bank and OECD.
The Economist (1991): “Giving companies away is better than keeping them in state
hands,” September 21, A18-A20.
The Economist (1993): “Making it work,” March 13, 90 – 93.

References
82
World Development Report 1996: “From Plan to Market,” Oxford University Press.
World Bank (2002): “Transition. The First Ten Years: Analysis and Lessons for Eastern
Europe and the Former Soviet Union,” Washington D. C.

Chapter 2
83
APPENDIX 2
Table A2.1: Companies listed and traded on the Warsaw and Budapest Stock Exchange
Warsaw Stock Exchange Budapest Stock Exchange
New
listings
Listed
companies*
Total
turnover -
equities
(mil. USD)
New
listings
Number of
equities*
Total turnover
- equities
(mil. USD)
1990 6 6 48.4
1991 9 9 28.3 14 20 65.6
1992 7 16 167.5 3 23 38.0
1993 6 22 4 345.7 5 28 99.3
1994 22 44 10 305.8 12 40 27.,6
1995 21 65 5 638.7 5 42 347.1
1996 18 83 11 088.2 6 45 1 606.7
1997 62 143 15 964.4 10 49 7 689.7
1998 57 198 17 848.6 8 55 16 139.6
1999 28 221 22 426.0 16 66 14 469.3
2000 13 225 38 913.6 1 60 12 109.5
2001 9 230 19 634.7 1 56 4 836.7
2002 5 216 15 602.8 0 49 5 869.7
2003 6 203 20 512.3 2 53 8 233.1
2004 36 230 32 426.3 1 47 12 774.6
2005 35 255 59 093.0 1 45 24 210.5
2006 38 284 107 806.0 3 43 30 897.4
Note: *depends on the data provided by the stock exchange
Source: Warsaw Stock Exchange
Budapest Stock Exchange
Exchange rates from EIU database
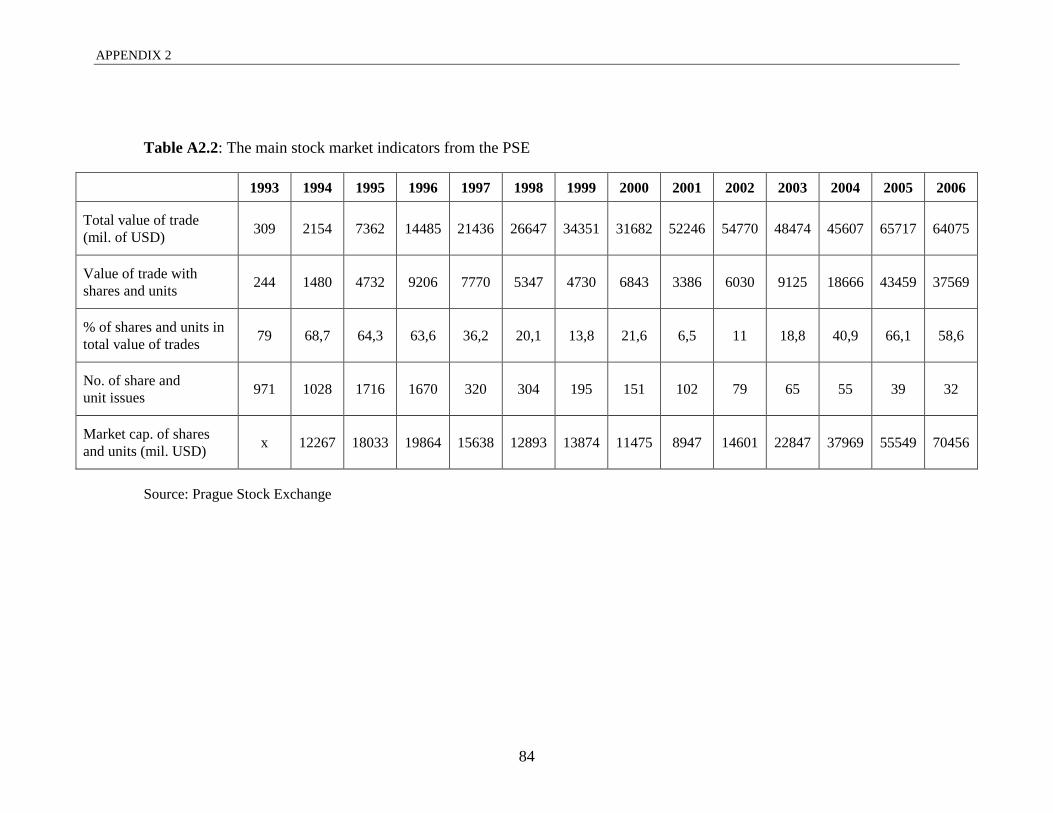
APPENDIX 2
84
Table A2.2: The main stock market indicators from the PSE
1993 1994 1995 1996 1997 1998 1999 2000 2001 2002 2003 2004 2005 2006
Total value of trade
(mil. of USD) 309 2154 7362 14485 21436 26647 34351 31682 52246 54770 48474 45607 65717 64075
Value of trade with
shares and units 244 1480 4732 9206 7770 5347 4730 6843 3386 6030 9125 18666 43459 37569
% of shares and units in
total value of trades 79 68,7 64,3 63,6 36,2 20,1 13,8 21,6 6,5 11 18,8 40,9 66,1 58,6
No. of share and
unit issues 971 1028 1716 1670 320 304 195 151 102 79 65 55 39 32
Market cap. of shares
and units (mil. USD) x 12267 18033 19864 15638 12893 13874 11475 8947 14601 22847 37969 55549 70456
Source: Prague Stock Exchange

Chapter 2
85
Figure A2.1: Securities delisted from the PSE (1993 – 2004) – monthly data
1
10
100
1000Ju
l-93
Jan-
94
Jul-
94
Jan-
95
Jul-
95
Jan-
96
Jul-
96
Jan-
97
Jul-
97
Jan-
98
Jul-
98
Jan-
99
Jul-
99
Jan-
00
Jul-
00
Jan-
01
Jul-
01
Jan-
02
Jul-
02
Jan-
03
Jul-
03
Jan-
04
Jul-
04
Source: Prague Stock Exchange
Note: The number of delisted shares on the vertical axis is scaled logarithmically.
Figure A2.2: Companies listed on the Prague Stock Exchange by size
0
500000
1000000
1500000
2000000
2500000
1995 1996 1997 1998 1999 2000 2001 2002 2003 2004
tota
l num
ber
of
shar
es (
in thousa
nds)
1st quartile
Min
Average
Median
Max
3rd quartile
Note: Since the maximum values are extremely high outliers, maximum value is calculated
to be the upper quartile plus 1.5 times the value of the interquartile range
Source: Prague Stock Exchange
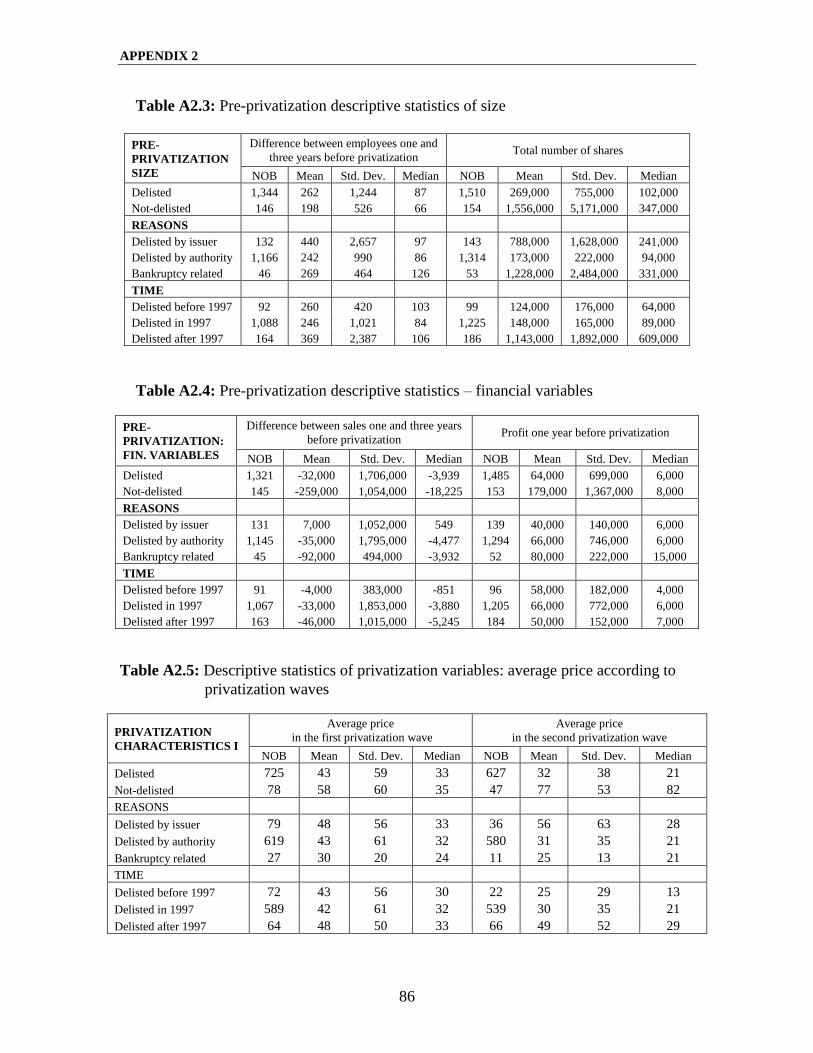
APPENDIX 2
86
Table A2.3: Pre-privatization descriptive statistics of size
PRE-
PRIVATIZATION
SIZE
Difference between employees one and
three years before privatization Total number of shares
NOB Mean Std. Dev. Median NOB Mean Std. Dev. Median
Delisted 1,344 262 1,244 87 1,510 269,000 755,000 102,000
Not-delisted 146 198 526 66 154 1,556,000 5,171,000 347,000
REASONS
Delisted by issuer 132 440 2,657 97 143 788,000 1,628,000 241,000
Delisted by authority 1,166 242 990 86 1,314 173,000 222,000 94,000
Bankruptcy related 46 269 464 126 53 1,228,000 2,484,000 331,000
TIME
Delisted before 1997 92 260 420 103 99 124,000 176,000 64,000
Delisted in 1997 1,088 246 1,021 84 1,225 148,000 165,000 89,000
Delisted after 1997 164 369 2,387 106 186 1,143,000 1,892,000 609,000
Table A2.4: Pre-privatization descriptive statistics – financial variables
PRE-
PRIVATIZATION:
FIN. VARIABLES
Difference between sales one and three years
before privatization Profit one year before privatization
NOB Mean Std. Dev. Median NOB Mean Std. Dev. Median
Delisted 1,321 -32,000 1,706,000 -3,939 1,485 64,000 699,000 6,000
Not-delisted 145 -259,000 1,054,000 -18,225 153 179,000 1,367,000 8,000
REASONS
Delisted by issuer 131 7,000 1,052,000 549 139 40,000 140,000 6,000
Delisted by authority 1,145 -35,000 1,795,000 -4,477 1,294 66,000 746,000 6,000
Bankruptcy related 45 -92,000 494,000 -3,932 52 80,000 222,000 15,000
TIME
Delisted before 1997 91 -4,000 383,000 -851 96 58,000 182,000 4,000
Delisted in 1997 1,067 -33,000 1,853,000 -3,880 1,205 66,000 772,000 6,000
Delisted after 1997 163 -46,000 1,015,000 -5,245 184 50,000 152,000 7,000
Table A2.5: Descriptive statistics of privatization variables: average price according to
privatization waves
PRIVATIZATION
CHARACTERISTICS I
Average price
in the first privatization wave
Average price
in the second privatization wave
NOB Mean Std. Dev. Median NOB Mean Std. Dev. Median
Delisted 725 43 59 33 627 32 38 21
Not-delisted 78 58 60 35 47 77 53 82
REASONS
Delisted by issuer 79 48 56 33 36 56 63 28
Delisted by authority 619 43 61 32 580 31 35 21
Bankruptcy related 27 30 20 24 11 25 13 21
TIME
Delisted before 1997 72 43 56 30 22 25 29 13
Delisted in 1997 589 42 61 32 539 30 35 21
Delisted after 1997 64 48 50 33 66 49 52 29
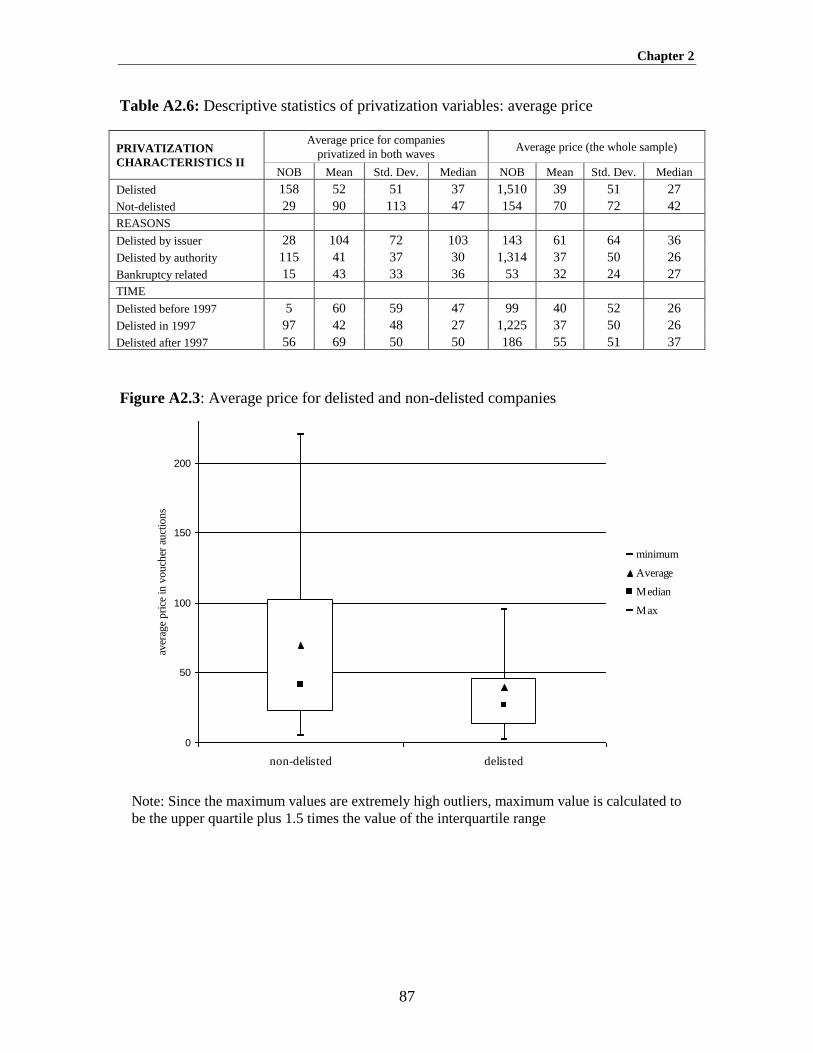
Chapter 2
87
Table A2.6: Descriptive statistics of privatization variables: average price
PRIVATIZATION
CHARACTERISTICS II
Average price for companies
privatized in both waves Average price (the whole sample)
NOB Mean Std. Dev. Median NOB Mean Std. Dev. Median
Delisted 158 52 51 37 1,510 39 51 27
Not-delisted 29 90 113 47 154 70 72 42
REASONS
Delisted by issuer 28 104 72 103 143 61 64 36
Delisted by authority 115 41 37 30 1,314 37 50 26
Bankruptcy related 15 43 33 36 53 32 24 27
TIME
Delisted before 1997 5 60 59 47 99 40 52 26
Delisted in 1997 97 42 48 27 1,225 37 50 26
Delisted after 1997 56 69 50 50 186 55 51 37
Figure A2.3: Average price for delisted and non-delisted companies
0
50
100
150
200
non-delisted delisted
aver
age
pri
ce in
vo
uch
er a
uct
ion
s
minimum
Average
Median
Max
Note: Since the maximum values are extremely high outliers, maximum value is calculated to
be the upper quartile plus 1.5 times the value of the interquartile range

APPENDIX 2
88
Table A2.7: Descriptive statistics of privatization variables: investment priv. funds
INVESTMENT
PRIVATIZATION
FUNDS
Investment privatization funds holdings after
the first wave (% of total number of shares)
Investment privatization funds holdings after
the second wave (% of total number of shares)
NOB Mean Std. Dev. Median NOB Mean Std. Dev. Median
Delisted 881 40 21 41 784 24 22 20
Not-delisted 107 43 22 45 76 18 19 12
REASONS
Delisted by issuer 106 44 22 43 64 20 21 13
Delisted by authority 733 40 21 41 694 25 22 20
Bankruptcy related 42 37 22 36 26 13 22 4
TIME
Delisted before 1997 77 36 21 37 27 23 23 16
Delisted in 1997 686 40 21 41 635 25 22 20
Delisted after 1997 118 42 21 40 122 18 21 10
Table A2.8: Proportions of missing observations in subgroups of companies delisted due
to different reasons
Variable
NOB
% of
total
NOB
Reason1:authority Reason2:issuer Reason3:bankruptcy Not delisted
non-
missing
% of
total
non-
missing
% of
total
non-
missing
% of
total
non-
missing
% of
total
Number of shares 1664 100 1314 100 143 100 53 100 154 100
Profit before priv. 1656 99.5 1308 99.5 142 99.3 53 100 153 99.4
Sales before priv. 1648 99 1300 98.9 141 98.6 53 100 154 100
Average price 1664 100 1314 100 143 100 53 100 154 100
Operat. profit 1996 1477 88.8 1209 92 118 82.5 27 50.9 123 79.9
Sales 1996 1465 88 1198 91.2 117 81.8 27 50.9 123 79.9

Chapter 2
89
Table A2.9: Definitions and data sources of the variables included in the analysis
VARIABLE NAME SOURCE DESCRIPTION
Industry (ind_id_burza) PSE classification the code of industry at the PSE: it includes 19
categories out of which 17 are relevant for us
Employees (e3, e2, e1) Ministry of Privatization
of the Czech Republic
number of employees in the company before
privatization
Total number of shares (tns) Ministry of Privatization of
the Czech Rep. (MP CR)
the total number of shares of a firm i.e. capital of a firm
divided by the value of one share (1000)
Sales (s3, s2, s1)* MP CR sales prior to privatization (three, two and one year)
Profit (p3, p2, p1)* MP CR profit prior to privatization (three, two and one year)
Debt (d3, d2, d1)* MP CR debt prior to privatization (three, two and one year)
Privatization wave (cvl) MP CR the wave in which certain company was privatized
(first or second); we also distinguish companies that
wereprivatized in both waves
National Property Fund
ownership share (npf) MP CR
proportion of company‟s shares that based on the
privatization project were supposed to be owned by the
National Property Fund
Average price (ap) MP CR average price of the firm's shares sold in the voucher
auctions; sold points divided by shares sold
Number of shares in voucher
privatization (nscp_tns) MP CR
the number of shares offered in the voucher
privatization as % of total number of shares
IPFs' holdings after
the first wave (ipf1_tns) Prague Securities Centre
shares held by the investment privatization funds
following the 1st privatization wave (% of total
number of shares)
IPFs' holdings after
the second wave (ipf2_tns) Prague Securities Centre
shares held by the investment privatization funds
following the second privatization wave (% of total
number of shares)
Single largest owner (slo) Prague Securities Centre % of shares held by the single largest owner
Profit (1996 - 2003) ASPEKT database profit defined by Czech accounting standards
Oper. profit (1996 - 2003) ASPEKT database operational profit defined by Czech accounting
standards
Sales (1996 - 2003) ASPEKT database sales defined by Czech accounting standards
Total assets (1996 - 2003) ASPEKT database total assets defined by Czech accounting standards
Total liabilities (1996 - 2003) ASPEKT database total liabilities defined by Czech accounting standards
Note: The data marked with * are based on the socialistic accounting

APPENDIX 2
90
Table A2.10: Results of the McNemar-type test (observed frequencies and 2)
OUR MODEL
NA
IVE
ES
TIM
AT
OR
outcome Incorrect Correct
Incorrect 10 113 123
Correct 1 1346 1347
11 1459 1470
Note: Both models predict correctly 1346 delisted companies and 10 that stayed, however our
model was in comparison to the naive estimator mistaken only once, while the naive estimator
incorrectly predicted 113 cases. This indicates the prediction power of our model that is also
confirmed by the test statistic
2112
2
21122 )(
nn
nn that has an asymptotic
2 distribution. Its value
is 110,04 which makes our results significant at all levels.

Chapter 3
91
CHAPTER 3
DELISTING IN THE SLOVAK AND CZECH REPUBLIC:
GRADUAL VERSUS BIG BANG APPROACH78
3.1 Introduction
This chapter provides further insights concerning the delisting process in transition
countries. We analyze the process of delisting share issues from the Bratislava Stock
Exchange in Slovakia. In this analysis we utilize a special relationship between the Czech
and Slovak economies in order to investigate the role of delisting and the way it is
implemented for the stock market emergence. Recent development suggests that even
though these two economies share identical roots and the first wave of mass privatization
was conducted in the same way in both countries, the subsequent stock market
development in the Czech and Slovak Republic did not follow the same path.
Common background of both countries provides us with the opportunity to use the
Czech case as a benchmark in this study. It is a natural reference point for the analysis of
Slovakia, since both countries were part of the former Czechoslovakia until 1993.
Nevertheless, there are several issues that make the analysis of the Slovak delisting
different. The most important one, from the practical point of view, is the availability of
data. The dataset we have available for Slovakia is smaller. This is not only due to the
fact that Slovakia and its market is smaller but also because the second privatization wave
did not materialize in the Slovak case as planned and consequently we do not have
important explanatory variables connected to privatization for almost half of the listed
companies. Nevertheless, our sample still contains almost 500 companies, which is
sufficient for the analysis. Yet another difference between the two countries is the fact
78
For valuable comments and suggestions I am grateful to Randall Filer, Michael Funke, Jan Hanousek, Jan
Kmenta, Eva Liljeblom, Jan Švejnar and the participants of the Winter Research Workshop in Finance in
Lappeenranta (November 2007). I would like to thank Róbert Vlkolinský, Head of the Listing Department
on the Bratislava Stock Exchange for his help with acquiring the data, valuable comments and discussions. I
am also thankful to Pavel Vodák from the Central Securities Depository of the Slovak Republic for
providing the data and to Katarína Svitková and František Kopřiva for their help with data. While preparing
this paper, I have benefited from GACR Grant No. 402/05/1014.

3.1 Introduction
92
that the stock exchange authorities seem to adopt different strategies (not only towards
delisting) which led to differences in the subsequent development on the Czech and
Slovak markets. This suggests that delisting, its implementation as well as other decisions
of the stock exchange authorities are very important for further functioning of the market.
The aim of this paper is not only the investigation of the delisting process in the Slovak
Republic but also utilizing the Czech and Slovak connection to outline the strategies for
successful stock emergence in other transition economies.
The following section provides description of the Slovak stock market
development and the delisting process in Slovakia. Afterwards we describe the data and
methodology applied. In section 3.5 we provide results of the estimations. Section 3.6
deals with the connection between the Czech and Slovak market, the case of separated
twins, and section 3.7 concludes.
3.2 Privatization and the development of the Slovak stock market
Similar to the Czech Republic, the development of the stock market in Slovakia is closely
related to the mass privatization process. The Bratislava Stock Exchange (BSSE) was
established at the beginning of the 1990s and, together with the Prague Stock Exchange,
started trading on April 6, 1993. This fact is connected to the first wave of privatization
which took place in the Czech as well as in the Slovak Republic between 1991 and
199379
. The situation in Bratislava was very similar to Prague. Based on the approved
privatization projects there were 503 companies privatized in the first wave and their
shares were placed to the stock exchange by law. The companies from the first
privatization wave were introduced in 1993 and at the end of this year there were 512
share and unit issues80
on the BSSE. Unlike the Czech Republic, the second privatization
79
Registration of individuals and investment privatization funds (IPF) started at the end of 1991 and ended
only at the end of 1992. Afterwards the shares were distributed in May 1993 in Slovakia. For more detailed
description see chapter 11 in Marcinčin and Beblavý (eds.), 2000. 80
Unit issues are securities issued by the privatization funds and the stock exchange reported them together
with the share issues. Nevertheless, only share issues are included in our analysis.
Chapter 3
93
wave that was planned did not materialize as originally designed in Slovakia81
.
Nevertheless, some new companies still entered the market and thus the number of share
issues on the stock exchange increased. There were 850 and 970 share and unit issues
listed on the BSSE at the end of 1995 and 1996 respectively.
Until 1997 trading of shares was very lively and accounted for more than half of
the total turnover on the stock exchange (see Table A3.1 in the appendix). Exceptionally
high was this proportion in 1994, right after the first wave of mass privatization. At that
time trading in shares accounted for 86% of the total turnover on the stock exchange.
Similar to the situation in Prague, all this active trading was connected to the post
privatization period when market grew very quickly. As Barto and Kmeť (2000) point
out, the reason for this extraordinary growth was simply fight for majority ownership
shares in the companies privatized in the first privatization wave and thus the stock
market was a means for gaining the control over these companies. Afterwards, the authors
continue, when the ownership structure was consolidated, the stock market became
“redundant“. This trend is visible not only in turnover of shares, but also in the
development of the Slovak share index (SAX), (see Figure A1.1 in the appendix 1) and
the real market capitalization of shares and units. Stock market capitalization was the
lowest in the OECD countries in 2000 (see Figure A3.1 in the appendix). All of these
market measures exhibit significant worsening after 1997. Moreover, a great majority of
trades of shares was conducted in the form of direct trades in 199782
and for unrealistic
prices (BSSE Factbook, 1997) i.e. suspicious prices that are far from the fundamental
value. The BSSE report further specifies other factors that contributed to the worsening of
the situation. The first one is the transformation of the investment privatization funds into
joint-stock companies that was going on for a long time and caused absence of
institutional investors on the market83
. This is one of the factors hampering stock market
development that is stressed also by the OECD in their report on Slovakia (2002).
81
This is connected to changes of the government in 1994. Moravcik‟s government was planning the
second privatization wave (it was supposed to start 15.12.1994) and about 3.3 mil. Slovak citizens
registered to participate in it. However, in the meantime government changed and Meciar, who took the
office, decided to cancel the second wave. 82
Anonymous trades accounted for less than 1% of the total value of trades with shares. 83
These investors, especially domestic ones, are very important for the emerging stock market as was the
case e.g. in Poland.

3.2 Privatization and the development of the Slovak stock market
94
Another one is the lack of foreign investors„ interest in the Slovak market. Nevertheless,
we, as well as Barto and Kmeť (2000), believe that the situation was primarily caused by
a nonstandard approach to market creation which led to having hundreds of companies on
the stock exchange.
After the ownership structure of privatized companies was settled, trading with
shares fell dramatically84
and this is reflected in the development of all of the above
mentioned stock market indicators. Bačišin (2001) mentions several attempts to restore
trading with shares in this period. The first incentive was included in the Programme
Declarations of the Government of the Slovak Republic in 1998. Based on this document
the citizens were supposed to get the chance to acquire shares of some important and
strategic companies. Unfortunately, this had never materialized even though in February
2000 BSSE together with the Association of Securities Dealers and Association of
Investment Companies issued a joint appeal to the Slovak government to offer strategic
companies or at least some part of their shares also to portfolio investors through capital
market.
Besides this attempt, there were several other projects targeted at restoring of
trading with shares implemented on the BSSE. The first one was trading of shares in the
new module of market makers that started in December 2000. Unlike Prague Stock
Exchange where market makers module was introduced in 1998, it did not work in
Bratislava, since there were not enough trades with shares, even outside the price-setting
segment. At the beginning there were several share issues included in the market makers
module but they were delisted in 2004 and there are no share issues traded in this module
nowadays. The second project concerned so called New Market that was meant to attract
quickly growing small and medium size companies willing to acquire new capital through
the issuance of shares. Even though this market was inspired by similar markets
functioning in the developed economies, it has not been successful in Slovakia.
Moreover, a new structure of the market was introduced in July 2001. To make the
market more transparent, the former market of listed securities was divided into a main
84
Due to the finished ownership concentration, the number of securities in free float has declined
significantly (Bačišin, 2002).

Chapter 3
95
listed market, a parallel listed market and a new listed market. Free market was designed
for so called unlisted securities which were still at the stock exchange, however did not
need to fulfil requirements like the listed ones.
Most recently, the activities of the BSSE focus to benefit issuers of securities and
attract them to the local market85
. Since 2006 financial market supervision is under the
National Bank of Slovakia which eliminates complicated reporting and makes
communication with the regulator more efficient. From March 2006 BSSE owns the
Central Securities Depositary which makes the registration of new securities faster and,
what is even more important from the point of view of issuers, less costly. Despite all
these efforts of the BSSE, the situation does not seem to be improving. This may indicate
that the stock exchange alone is not always able to solve the problems of the emerging
stock market. Even though all the governments so far have declared their support to the
capital market development, in reality they have not done enough; especially because the
promised privatization of the minority shares in some strategic enterprises through the
stock exchange has not materialized (TREND, 2006) and thus companies that could have
been interesting for investors are not listed at the stock exchange.
The Slovak stock market can still be characterized by a relatively high number of
illiquid publicly traded securities86
. SAX, the official share index of the BSSE, consists of
only five share issues. Turnover with shares has decreased dramatically in 2005 and 2006
(see Table A3.1 in the appendix). Proportion of the anonymous trades is rather low and
this situation does not contribute to generating true prices. Thus, market prices hardly
reflect the real situation in the publicly traded company. Issuers are still not used to
provide all information necessary to investors and they do not care about their
shareholders, who they still consider a kind of burden left from the privatization
(Gajdzica et al., 2002). This development makes it clear that companies and their
willingness to be publicly traded are essential for the efficient stock market to emerge.
New companies, however, are not willing to enter the market that in fact does not work
85
Slovak companies that plan to issue new shares do so only abroad (e.g. SkyEurope Airlines issued its
shares on the Warsaw and Vienna stock exchanges, IT company Asseco is listed in Warsaw as well). 86
At the end of 2006 there were 256 shares and units on the BSSE, out of which only 10 are so called listed
securities and the rest are unlisted (regulated free market).

3.2 Privatization and the development of the Slovak stock market
96
(Hospodarske noviny, 2006). Thus, a kind of vicious circle emerges and some consider
the integration of the Slovak market into broader Central European market to be the only
chance for its further existence.
3.2.1 Delisting process in the Slovak Republic
Similar to the Czech case, some companies placed on the BSSE were not able to benefit
from the possibility of being publicly traded and were, therefore, later excluded from
public trading i.e. delisted. The delisting process, unlike that for the Prague Stock
Exchange (PSE), started later and, based on the number of companies that remain listed
on the BSSE87
, it may not be over. The number of share issues that remain listed on the
BSSE also suggests that the process of delisting on the Slovak market has followed a
different path in comparison to the Czech case (see Figure A3.2 in the appendix). The
main delisting wave took place five years later than on the PSE and the reasons for
delisting in Slovakia were more uniform. The following Table 3.1 shows the number of
delisted shares in more detail.
The number of delisted companies in the period 1994 – 1997 was, unlike the
Czech Republic, not high. Even though there were altogether 49 share issues with which
trading was terminated during this period, only about one third of them was really
delisted. The rest were securities belonging to companies that were due to e.g.
organizational changes just issuing the shares with a new ISIN88
number, which were
further traded on the stock exchange and thus these ones were not truly delisted.
Therefore they are not considered as delisted in our empirical analysis.
In the following four years the number of delisted companies was not significantly
high either. Relatively more companies delisted in 1998 were those ones that were
deleted from the Slovak Companies Register already earlier and in fact ceased to exist.
However, in most of these cases they were delisted only in a year or later after they were
cancelled in reality. This was caused by the fact that liquidators or other authorities
87
At the end of December 2006 there were 256 share issues, including 46 issues of units listed on the
BSSE. Out of them only 5 issues belong to the main listed market. On the other hand, there were 32 shares
and units listed on the Prague Stock Exchange (out of them 10 were traded on the main market). 88
This happened most probably because the requirements of the security have changed.

Chapter 3
97
responsible for the cancellation of the company did not report this to the Securities
Register and thus it could not announce this fact to the BSSE.
Table 3.1: Share issues delisted from the BSSE and PSE by years
DELISTING
BY YEARS
All share issues delisted
from the BSSE
Shares from the 1st
priv. wave delisted
from BSSE
All share issues
delisted from the
PSE
NOB Percent NOB NOB
1994 1 0.14 0 10
1995 9 1.3 9 19
1996 2 0.29 0 61
1997 5 0.72 4 1225
1998 19 2.74 14 11
1999 8 1.15 3 79
2000 14 2.02 3 28
2001 20 2.88 2 34
2002 339 48.85 201 14
2003 95 13.69 49 10
2004 68 9.8 46 10
2005 73 10.52 34 6
2006 41 5.91 17 9
Total 694 100 382 1526
Source: Bratislava Stock Exchange, Prague Stock Exchange (PSE) and author‟s calculations
Note: The first privatization wave column includes only companies from this wave included
in our sample, i.e. industrial companies (not the financial ones).
The major wave of delisting took place only in 2002 and the majority of securities
was delisted due to not fulfilling their information obligation towards the BSSE. The
process of delisting consisted of two phases. At the beginning, trading with the share
issues of companies which had not fulfilled information obligation was suspended. If the
necessary information was not supplied within a given period of time, the stock exchange
decided about exemption from trading i.e. delisting. Based on the data from the BSSE the
first suspension of trading concerned 496 share issues (of 483 issuers) and it took place
on October 17, 2001. Then, when the required information obligation concerning the first
half of the year 2001 was not fulfilled, the share issues were delisted on May 1, 2002.
This decision concerned 314 share issues of 308 issuers. The groups of share issues
delisted due to not fulfilling information obligation that followed afterwards were

3.2 Privatization and the development of the Slovak stock market
98
smaller89
. Nevertheless, the trend is clear: companies not fulfilling information obligation
at the end of the year were delisted at the end of September of the next year and those
ones that did not fulfil half year information obligation were then delisted at the end of
December of a given year. The following figure shows that fulfilling information
obligation has improved significantly after the 2002 wave of delisting. Yet another
evidence is the fact, that most of the share issues delisted in 2004 - 2006 were delisted on
the issuer‟s request and fulfilment of the information obligation did not play a role during
this period.
Figure 3.1: Fulfilling information obligation by companies
Source: Profit (May 16, 2005): Ročná správa o hospodárení spoločnosti (Yearly report about the
company‟s results).
In addition to not fulfilling the information obligation, the data provided by the
BSSE enable us to distinguish the other two reasons for delisting. The first one is the
decision of the authority, which can be either the BSSE or the former Securities Register
(nowadays the Central Securities Depository) or some regulatory institution (Ministry of
Finance, National Bank of Slovakia or the former Financial Market Authority90
). As the
following Table 3.2 indicates, only 6 percent of all delisted companies were delisted due
to the decision of the authority. The other companies were delisted because they
themselves decided to stop being traded on the exchange. Decision of the issuer means,
89
36 share issues on October 7, 2002; 24 share issues delisted on January 14, 2003; 26 on September 26,
2003; 4 share issues on December 29, 2004; 11 on September 28, 2004; 5 on December 28, 2004; 17 on
September 27, 2005 and 7 on December 30, 2005. 90
From January 1, 2006 all its responsibilities were taken over by the National Bank of Slovakia.

Chapter 3
99
that the general assembly of the company agreed that the company would not be publicly
traded anymore. Not fulfilling the information obligation is in fact also the decision of the
issuer, however, of a different nature. In this case the initiative to delist does not come
directly from the issuer because the stock exchange initiates the whole process and the
issuer only decides to accept or not to accept the conditions set. All in all, unlike the
Czech Republic where most of the companies were delisted due to the decision of the
authority, the majority of the Slovak delisted companies decided about their delisting
themselves. This is most probably connected to the fact that the delisting wave in
Slovakia happened five years later and during this time the companies could judge what
kind of benefits public trading of their shares brings and if they are willing to stay
publicly traded. At the same time, this development suggests that the Czech authorities
were more aggressive and decided to “clean” the market even before the companies
themselves observed the situation and decided not to be publicly listed.
Table 3.2: Number of delisted companies by reasons (1994 – 2006)
REASONS FOR
DELISTING
All share issues 1st privatization
wave
NOB Percent NOB Percent
Decision of the authority 42 6.33 22 5.74
Decision of the issuer 227 34.19 112 29.24
Information obligation 395 59.49 248 64.75
Total 664 100 382 100 Note: The first privatization wave column includes only companies from this wave
included in our sample, i.e. industrial companies (not financial ones)
3.3 Methodology
The impact of various factors that belong to pre-privatization, privatization and post
privatization subgroup on delisting is estimated using a similar binary regression model
as it was in the case of the Czech Republic in chapter 291
. In the Slovak case, however,
there is no need to estimate the model in two stages. With the exception of four
companies, all the firms included in our Slovak sample report their results even before
privatization and we do not face the problem of missing data. We estimate a binary
91
For more detailed description of the different determints of delisting and details of the model see parts 2.3
and 2.4.

3.3 Methodology
100
regression model where the dependent variable is the probability of delisting and the
explanatory variables include pre-privatization and privatization factors as well as the
financial indicators and fulfilling of the information obligation in the period after
privatization. The logit model has the following form:
)1.3(._._.95_
___)1(
32143
21321
iiiii
iiiiii
repgdegopslodumfor
dumnpfaptnsproftnsnscptnsdelP
where
del is a dummy variable that equals 1 for the company that was delisted before the
end of 2006 and 0 for not-delisted
tns is total number of shares of a company (in millions of shares) which in fact
reflects the capital of a given company92
nscp_tns is the share of company privatized in the voucher privatization
prof_tns is profit per share one year before privatization
ap is average price (in points) of a company‟s shares in the privatization auction (as
we expect nonlinear relationship, it enters the model in quadratic as well as cubic
form)
npf_dum is a dummy variable that equals one if the National Property Fund had an
ownership share in a company (based on the information from the company‟s
privatization project)
for_dum is a dummy variable that equals one if a foreign owner had an ownership
share in a company (based on the information from the company‟s privatization
project)
SLO95 is a dummy variable that equals one if the ownership share of the single
largest owner in a given company was higher that 50% in 1995
op_g is growth in operational profit defined as the growth rate of average
operational profit in the industry (between 1996 and 1997), excluding the company
itself
92
The nominal value of original shares was 1000 crowns.

Chapter 3
101
de_g is growth in total debt defined as the growth rate of average total debt level in
the industry (between 1996 and 1997), excluding the company itself
rep is a dummy variable that serves as a proxy for fulfilling of the reporting
obligation of the company; it equals one if company has not reported its operational
profit in 2000 even though it was supposed to do so, 0 otherwise
The data for the variables concerning privatization come from the time when the first
privatization wave took place, i.e. 1993. Ownership data are from 1995, the year when
ownership structure of the companies consolidated after the privatization. The growth in
operational profit and the growth in total debt are defined as the growth rate between the
current and the following year of average value in a given industry, excluding the
company itself. This way we avoid possible endogeneity problems as there might be
connections between some explanatory variables included in the model (e.g. post
privatization profit may be connected to the average price per share in the privatization).
The years under consideration are 1996 and 1997. This is the time period after
privatization when the ownership structures of the companies from the first privatization
wave that are subject of our investigation were already consolidated. At the same time
this time period is also preceding the wave of delisting and financial indicators could thus
provide guidance in identifying the companies that are going to be delisted.
3.4 Data
The dataset consists of all companies that were listed on the BSSE from the beginning of
trading in 1993 till 2006. However, due to the fact that there was no second privatization
wave in Slovakia, the estimations are conducted on the subsample of companies that were
privatized in the first mass privatization wave and then placed on the stock exchange.
This subsample consists of 496 industrial companies93
and contains privatization data
from the Ministry of Privatization and the Ministry of Finance. This data comes from the
years 1991 -1993. Financial data for the post privatization period 1996 – 1997 come from
93
Based on the privatization data, there were 503 Slovak companies privatized in the first privatization
wave. Nevertheless, when linking privatization data to the data provided by the stock exchange, it was
possible to link 500 companies. Another 4 companies were excluded since these were financial institutions,
not industrial firms.

3.4 Data
102
the INFIN database94
. The data concerning delisting were provided by the Bratislava
Stock Exchange. Details about the legal status and further existence of the delisted
companies are taken from the Ministry of Justice of the Slovak Republic Companies95
.
When identifying the reasons for delisting all information that was available at the time
was taken into consideration. Detailed description of the variables used in the estimation
is provided in the appendix (Table A3.7).
Industry dummy variables that we use to calculate growth opportunities are based
on OKEC classification, which is used in the INFIN database as well as in the BSSE data.
The main activities of companies, have however changed over time and since we had
only available the most recent industry classification, we had to adjust it so that it
corresponds to the time period we consider when calculating growth opportunities i.e.
1996 – 1997. The industry data corresponding to the analyzed period come from the
Ministry of Justice of the Slovak Republic Companies Register.
We also use data concerning a single largest owner of the company after the
privatization. It includes his ownership share and identification of the owner‟s type. We
distinguish between domestic and foreign owners as well as the fact if the owner is a
bank, company, individual entrepreneur, state, privatization fund or other subject. This
data come from the Central Securities Depository of the Slovak Republic.
3.4.1 Data description
Descriptive statistics that we use for the subgroup of delisted and not-delisted as well as
for the subgroups concerning different reasons and time of delisting exhibit quite a high
degree of variability. This is most probably connected to the heterogeneity of the
companies that were privatized in the first privatization wave.
Pre-privatization variables that are included in our analysis can be divided into
two groups. The first one concerns the size of a privatized company. It includes the
number of employees and total number of shares which in fact reflects the capital of a
94
This database is provided by the company INFIN Ltd. (Information in Finance). More information
available at http://www.infinet.sk. 95
www.orsr.sk

Chapter 3
103
given company. The second group contains financial indicators for the period before the
privatization took place. The size of the company measured by the number of employees
is decreasing for all the companies with approaching privatization, which can be the sign
of the on-going restructuring process. There are however no significant96
differences in
the number of employees between delisted and not-delisted companies or depending on
the reason for delisting (see Table A3.2 in the appendix). On the other hand, there are
significant differences in size measured by the number of employees as well as the total
number of shares when we take time of delisting into account. Here we distinguish among
companies delisted before the major wave in 2002, companies delisted in 2002 and
companies delisted afterwards. Our results show that the smallest companies were
delisted already before the main wave. This points out to the fact that the size of the
company, similar to the Czech case, matters for delisting. Moreover, there are significant
differences between delisted and not-delisted companies when the indicator of total
number of shares is used. From the financial indicators included in the second group of
pre-privatization indicators only the profit one year before the privatization exhibits
significantly differences in values for different subgroups of companies (see Table A3.3
in the appendix). Based on our nonparametric test it is significantly different for delisted
and not-delisted companies and also for the companies delisted due to different reasons.
As one would expect, it is higher for not-delisted companies, thus indicating that they
might be strong enough to survive on the stock exchange.
Further we examine several variables connected to the privatization process (see
Tables A3.4 and A3.5 in the appendix). The majority of these indicators exhibit
significantly different values for various subsamples of companies. The most important
from our point of view are the differences in average price which is significantly different
for all subgroups that we consider. Companies that were not delisted have higher average
price in comparison to the delisted ones. This indicates that bidders in the privatization
process were able to judge the future prospects of the companies based on the then
available information. The lowest average price concerns the companies that were
delisted due to not fulfilling the information obligation. This result is confirmed also
96
We employ nonparametric K-sample test on the equality of median to test for this.

3.4 Data
104
when accounting for the time of delisting – the lowest average price concerns companies
delisted in 2002 during a big wave of delisting which arose especially due to not fulfilling
the information obligation. Thus these might be the weakest companies that had to be
pushed out of the stock exchange by the authorities.
The ownership structure presented in the privatization plan is different for delisted
and not-delisted companies. In delisted ones, the National Property Fund (NPF) tends to
hold lower proportion of shares and foreign investors tend to be stronger in not-delisted
companies, which is in line with our expectations. Moreover, there are significant
differences when considering the NPF ownership and the time of delisting. Companies
with higher NPF ownership share tend to be delisted later because NPF is a shareholder
with a rather strong position. Another evidence of a strong ownership position of NPF as
well as foreign owners is the fact that when accounting for delisting reasons delisting by
issuer is the most common for companies with high NPF or foreign share.
Finally, the descriptive statistics of the post-privatization variables included in our
model are summarized in Table A3.6 in the appendix. The indicators of growth in
operational profit and growth in total debt as they were defined above are investigated. As
expected growth of operational profit that in fact represents the potential profit figure is
significantly lower for delisted companies and for the ones delisted in 2002 or earlier. On
the other hand, except for delisted and not-delisted companies there are no significant
differences in the growth rate of total debt, which might indicate that all the companies
were indebted to certain extent after the privatization since they needed resources for
restructuring.
This brief inspection of the pre-privatization, privatization and post-privatization
variables suggests that there are certain differences between delisted and not-delisted
companies and we are going to examine these in more detail further.
3.5 Estimation results
The above described logit model is run on the sample of all companies listed on the
BSSE after the first wave of voucher privatization. The results of our estimation are
summarized in the following Table 3.3.

Chapter 3
105
Table 3.3: Logit model for delisting (y=1 for delisting)
LOGIT ESTIMATION Results Interpretation
Pre-privatization factors Estimated
coefficient
Standard
error dP/dX
Effect of one
st.deviation change
Total number of shares (millions of shares) -0.242 0.247 -0.036 -0.034
Profit before privatization (scaled by book value) -0.189 0.544 -0.028 -0.007
Privatization factors
Proportion of shares in mass privatization -0.007 0.013 -0.001 -0.018
Average price in voucher auction (in points) -0.029 * 0.016 -0.004
Average price (quadratic) 0.0004 ** 0.0002 0.0001
Average price (cubic) -1.3E-06 *** 5.2E-07 -1.9E-07
Average price (overall effect) -0.003 -0.130
National property fund ownership -1.074 ** 0.496 -0.160
Foreign owner ownership share -2.040 ** 1.016 -0.303
Single largest owner dummy (1995) 0.774 * 0.454 0.115
Post-privatization factors
Operational profit growth -0.010 ** 0.005 -0.002 -0.045
Total debt growth 0.005 * 0.003 0.001 0.042
Reporting dummy 2.476 *** 0.471 0.368
Constant 1.519 1.354 0.226
Number of observations 489
Scaled R2 0.167
Note: The table contains estimation results for the logit model. We report estimated coefficients,
their significance (* significant at 10%, ** significant at 5% and *** significant at 1%) as well as
marginal effects (dP(y=1)/dX).
The explanatory variables describing the pre-privatization period do not show up
significant in the estimation. Profit before privatization was not significant in the Czech
case either and this fact is most probably connected to the quality of this data that is based
on the socialist accounting. In this sense, profit does not necessarily reflect real profit and
the situation in a company but only production. Apart from the profit indicator, unlike the
Czech Republic, even the company size does not play a role as determinant of delisting in
Slovakia. Such a result is surprising and rather nonstandard, especially when taking the
situation in the Czech Republic as benchmark. It may indicate that there were not enough
companies delisted from the Slovak market or the size of delisted companies follows a
random distribution. Indeed, unlike Czech Republic, there were also relatively big
companies delisted from the stock exchange since after receiving majority ownership
share some owners decided not to be listed anymore.

3.5 Estimation results
106
Almost all coefficients of the explanatory variables connected to the privatization
process are significant. The only exception is the proportion of the company privatized in
the voucher privatization. Descriptive statistics confirm that it was relatively high for the
majority of the observations and this low variability might have contributed to the non-
significance of the estimated coefficient. Nevertheless, the most important factor is the
average price in voucher auctions which in our setting could be considered a proxy for
share price. The results correspond to our expectations as higher price in voucher auctions
indicates a higher valuation of the company and thus better future prospects and lower
probability of delisting. We expect nonlinear relationship between average price and
delisting and therefore average price enters the model also in quadratic and cubic form.
Their combined effect on delisting is significant and negative. A one standard deviation
increase in the average price decreases the probability of delisting by 13 percent.
The ownership share of the National Property Fund (NPF) and the foreign owners,
as reported in the privatization projects, is an important determinant as well. The results
show that the probability of delisting decreases by 16 percent in the presence of the NPF.
Furthermore, the foreign owner contributes to decreasing this probability even more, by
30.3 percent. These results point out that these groups of owners had significant impact
on privatized companies and the ownership structure is one of the key factors that
determine delisting. The role of the single largest owner with majority ownership share is
also important. Probability of delisting increases by 11.5 percent for the companies where
single largest owner owned more than 50% of the company's shares at the end of 1995,
i.e. in the time when the ownership structure after the first privatization wave was more
less settled. The same holds true when the percentage of company owned by a single
largest owner is considered instead of the dummy variable for more than 50% ownership
share. The higher the ownership share of a single largest owner, the higher is the
probability of being delisted97
. We have also accounted for the type of the single largest
owner in our estimations, nevertheless it was not significant.
The main delisting wave took place in 2002 and therefore post-privatization firm
97
We do not report these results since the estimated coefficients for the other variables are in line with the
ones reported for the main model.

Chapter 3
107
characteristics are also included in our model. All of the estimated coefficients in this
group are significant. The most important from them is the dummy variable describing
fulfilling of the reporting obligations. It is constructed based on the availability of data for
a given company in 2000, long enough before the main delisting wave took place in 2002.
According to these results, the probability of delisting increases by 36.8 percent if a
company does not fulfil its reporting obligation in 2000. This result is also in line with the
fact that most of the companies delisted in 2002 left the market due to not fulfilling
information criteria required by the BSSE.
The other two post-privatization variables assess financial situation of a company;
we use the indicator of operational profit and total debt. In order to prevent problems with
possible endogeneity in estimation, we construct growth in operational profit and growth
in total debt variables as the growth rate between the current and the following year of
average value in a given industry, excluding the company itself. Even though the
estimated coefficients in our model are significant with expected signs, their influence is
lower than in the case of the reporting dummy variable which might also be a
consequence of the way they were constructed. The probability of delisting decreases
with increasing growth potential in operational profit so that one standard deviation
increase in operational profit growth constitutes a 4.5 percent decrease in the probability
of delisting. On the other hand, one standard deviation increase in the growth of total debt
brings about 4.2 percent increase in the probability of delisting. These results are in line
with our expectations and show that future prospects reflected in our growth variables are
important determinants of delisting.
Table 3.3 further shows that the measure for goodness of fit - R2 is not very high.
It is however sufficient when taking into consideration the nature of the estimated model
and a relatively high proportion of delisted companies in our dataset. Similar to the Czech
case, we apply a McNemar-type of test suggested by Hanousek (2000) to compare our
model to a naive estimator on the basis of their predictive accuracy. The results
summarized in Table A3.8 in the appendix confirm that our estimator dominates the
naive estimator in terms of prediction accuracy. This way the significance of our results is
confirmed. They show that there are several economic variables which could have been

3.5 Estimation results
108
used when placing privatized companies on the stock exchange after the first privatization
wave and thus prevent massive delisting.
3.6 Czech and Slovak connection: tale of separated twins
Czech Republic is a natural reference point for the analysis of Slovakia, since both
countries were part of the former Czechoslovakia and share common historical and
cultural background. Moreover, mass privatization which prompted stock market
emergence was originated using the same concept in both countries. The first
privatization wave was conducted in the same way. On the other hand, the second one did
not materialize as originally designed in Slovakia. Despite this fact a lot of new share
issues entered the Slovak stock market in 1995 and 1996 and thus the situation on the
market was basically the same as in the Czech Republic; at both the Prague Stock
Exchange (PSE) as well as the BSSE the maximum number of listed share issues was
achieved in 1996.
Afterwards however, the development on both markets started to differ. While
1225 share issues were delisted in four waves during 1997 in the Czech Republic, in
Slovakia no significant delisting took place until 2002 when 339 share issues were
delisted from the BSSE. Then, between 2003 and 2006, another 280 issues were delisted.
Nevertheless, as it was already mentioned, there is still a relatively large number of share
issues listed on the BSSE even nowadays. This development suggests two different
approaches to delisting.
Czech institutions implemented a kind of a “big bang” strategy i.e. a lot of issues
that did not fulfil specified criteria were delisted within a short period of time. This way
market was cleaned relatively quickly, became more transparent and this contributed to
its attractiveness for investors. Development on the stock exchange measured by the PSE
index confirms its gradual growth after this cleaning. On the other hand, even though
some delisting took place in Slovakia, the stock exchange authorities are still trying to
keep companies listed (on the so called free market), work with companies individually,
explain the advantages of being listed to them and they seemed to hope that the
companies would then, later on move to the listed market. It is however rather difficult to

Chapter 3
109
proceed with this kind of strategy when market is not working, it does not fulfil its main
functions and consequently provides no motivation for companies to stay listed. In fact,
Slovak companies have never experienced a really functioning stock market which only
adds uncertainty. Taking into account the size of the Slovak market, it is also possible to
speculate that the gradual strategy of BSSE is preferred to the “big bang” one because
otherwise the existence of the whole market could be seriously threatened98
.
Description of the development on both markets suggests that there are significant
differences between the Czech and Slovak market which we also confirm in the following
estimations. Similar logit model as described above in the equation (3.1) is run on the
sample including all the Czech and Slovak companies privatized in the first privatization
wave. The explanatory variables are in the similar way as before divided into the pre-
privatization, privatization and post-privatization ones. In this case, however, a country
dummy variable based on the company‟s location is added into the model. It indicates if a
company is Czech or Slovak. Dependent variable is again dummy variable for delisting.
Results of the estimation are displayed in the following Table 3.4.
Similar to our previous estimations, all the estimated coefficients with the
exception of the pre-privatization profit are significant and have expected signs. The most
influential is the country dummy variable indicating that the probability of delisting of a
Slovak company is 17 percent lower than for a Czech one. This result is highly significant
and it is in line with the strategy implemented by the BSSE that is trying to keep the
companies listed on the stock exchange as long as possible and gradually work on
improving their situation.
We have also tried to add interaction terms into main model, however, the
corresponding estimated coefficients were not significant. This indicates that the selected
determinants of delisting matter in the same way at both markets.
The aforementioned description of the Czech and Slovak emerging stock markets
and their unique common background suggest that this case of “separated twins” can be
used not only to uncover the reasons for massive delisting and its effect on the market
98
Even nowadays when the market formally exists, there are voices suggesting closing it completely (Let‟s
Be Honest and Close the Stock Exchange, Hospodarske noviny, 25.7.2006).

3.6 Czech and Slovak connection: tale of separated twins
110
functioning but also to identify strategies critical for a successful stock market
development in other emerging economies. A close connection between these two
markets and a very similar unfavorable development on both markets in the first half of
the 1990s, despite different institutional changes, emphasizes the importance of mass
privatization implemented in these countries. Moreover, different delisting strategies and
subsequent development on these markets suggest that the decisions of the stock
exchange authorities are crucial for further functioning of the market.
Table 3.4: Logit model for the Czech and Slovak Republics (y=1 for delisting)
LOGIT ESTIMATION Results Interpretation
Pre-privatization factors Estimated
coefficient
Standard
Error dP/dX one SD
effect
Total number of shares (millions of shares) -0.194 ** 0.082 -0.023 -0.036
Profit before privatization (scaled by book value) -0.010 0.015 -0.001 -0.005
Privatization factors
Average price in voucher auction (in points) -0.003 *** 0.001 -0.0004 -0.021
National property fund ownership dummy -0.357 ** 0.182 -0.043
Foreign owner ownership dummy -0.937 *** 0.362 -0.112
Post-privatization factors
Operational profit growth -0.008 ** 0.004 -0.001 -0.024
Total debt growth 0.005 * 0.003 0.001 0.018
Slovak dummy variable -1.425 *** 0.226 -0.170
Constant 2.464 *** 0.145 0.294
Number of observations 1 476
Scaled R2 0.055
Note: The table contains estimation results for the logit model. We report estimated
coefficients, their significance (* significant at 10%, ** significant at 5% and *** significant
at 1%) as well as marginal effects (dP(y=1)/dX).
3.7 Conclusion
Similar to the Czech Republic, the Slovak stock market has experienced a rather big wave
of delisting. This happened despite the fact that the second privatization wave did not
materialize in Slovakia. The majority of companies was delisted only in the year 2002,
five years later than in the Czech Republic. Our examination uncovers, that variables
connected to privatization play an important role in this process and based on them it was

Chapter 3
111
possible to identify companies that were going to be delisted even before the actual
delisting took place.
Using the Czech and Slovak connection we point out that despite the same initial
conditions, their stock markets have developed in a different way after the companies
privatized under the mass privatization scheme entered them. This seems to be the result
of significantly different strategies adopted by the PSE and the BSSE. This result points
out a crucial role that authorities play in the development of the emerging stock markets.

References
112
REFERENCES
Bačišin V. (2002):“Kapitálový trh,” In Macinčin A. (eds.): Hospodárska politika na
Slovensku 2000 – 2001, Slovenská spoločnosť pre zahraničnú politiku.
Barto M., Kmeť T. (2000): “Bankový sektor v Slovenskej republike,” In Marcinčin A.,
Beblavý M. (eds.): Hospodárska politika na Slovensku 1990 – 1999, Centrum pre
spoločenskú a mediálnu analýzu, Výskumné centrum Slovenskej spoločnosti pre
zahraničnú politiku a INEKO – Inštitút pre ekonomické a sociálne reformy.
Bratislava Stock Exchange Factbooks (1996 – 2004)
Gajdzica M., Jakoby M., Morvay K., Pažitný P. (2002): “Celkový ekonomický vývoj,” In
Kollár M., Mesežnikov G. (eds.): Slovensko 2002: Súhrnná správa o stave spoločnosti,
Inštitút pre verejné otázky, Bratislava.
Hanousek J. (2000): “Testing of (non-nested) Choice Models via Accuracy of Prediction:
A Non-Parametric Approach,” Central European Journal of Operations Research 8: 259
– 264.
Hospodarske noviny (2006): “The Volume of Trades with Shares is Thousand Times
Higher on the Prague Stock Exchange than on the Bratislava Stock Exchange. Czechs are
trading, Slovaks still not (Objem obchodov s akciami na pražskej burze je tisíckrát väčší
ako na bratislavskej. Česi obchodujú, Slováci stále nie),” July 25.
Marcinčin A., Beblavý M. (eds.), (2000): Hospodárska politika na Slovensku 1990 –
1999, Centrum pre spoločenskú a mediálnu analýzu, Výskumné centrum Slovenskej
spoločnosti pre zahraničnú politiku a INEKO – Inštitút pre ekonomické a sociálne
reformy.
OECD (2002): Economic Survey of Slovak Republic, Vol. 2002/11.
Trend (2006): “Capital Market Was Not Awaken by Economic Growth (Kapitálový trh
nezobudil ani svižný hospodársky rast),” June 26.
Vlkolinský R. (2005): “Ročná správa o hospodárení spoločnosti,” Profit (16.5.2005)

Chapter 3
113
APPENDIX 3
Table A3.1: The main stock market indicators from the BSSE
1993 1994 1995 1996 1997 1998 1999 2000 2001 2002 2003 2004 2005 2006
Number of share and
unit issues 512 523 850 970 918 833 830 866 888 510 452 389 306 256
of that listed 11 19 21 21 14 14 11 10 12 15 14 14 13 10
of that unlisted 501 504 829 949 904 819 819 856 876 495 438 375 293 246
Total turnover
(bil of SKK) 0.2 6.3 40.1 114.1 164.1 299.1 188.4 255.5 393.5 643.2 1096.7 432.3 1001.9 992.1
Turnover of shares and units
(bil. of SKK) 0.1 5.4 24.7 83.1 82.7 37.3 20.2 25.1 45.8 34.9 24.4 21.4 2.1 2.6
% of share and unit in total
turnover 53.7 86.4 61.7 72.8 50.4 12.5 10.7 9.8 11.6 5.4 2.2 4.9 0.21 0.26
% of negotiated deals in
turnover of shares and units 79.5 85.6 98.4 91.1 97.2 94.8 91.3 92.6 94.8 97.0 93.4 60.2 79.8 52.4
Market cap. of shares and
units (bil.of SKK) 93.8 97.4 158.3 184.1 184.1 152.0 150.8 154.9 167.6 105.0 110.9 140.1 151.7 153
Real market capitalization of
shares (% of GDP) 12.3 12.8 11.5 6.7 6.0 6.6 7.8 6.9 7.5 9.5 9.6 9.2
Total market capitalization
(% of GDP) 30.6 32.0 28.1 21.2 18.5 17.5 16.9 9.6 9.2 10.6 10.3 9.6
Source: Bratislava Stock Exchange
Note: Real market capitalization is market capitalization (MC) of issues which have market price. it does not include nominal value of issues which were traded
just in negotiated deals. includes units and shares of investment funds.
Total market capitalization includes nominal MC. real MC and MC of units and shares of investment funds
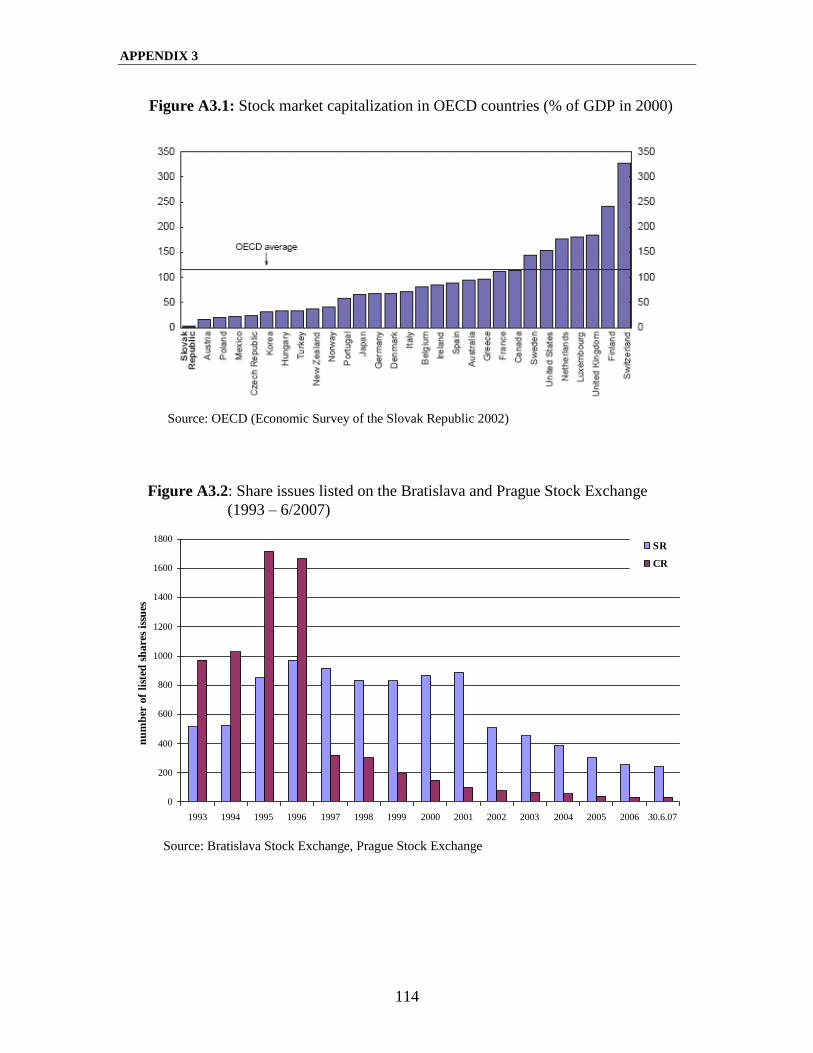
APPENDIX 3
114
Figure A3.1: Stock market capitalization in OECD countries (% of GDP in 2000)
Source: OECD (Economic Survey of the Slovak Republic 2002)
Figure A3.2: Share issues listed on the Bratislava and Prague Stock Exchange
(1993 – 6/2007)
0
200
400
600
800
1000
1200
1400
1600
1800
1993 1994 1995 1996 1997 1998 1999 2000 2001 2002 2003 2004 2005 2006 30.6.07
nu
mb
er o
f li
sted
sh
are
s is
sues
SR
CR
Source: Bratislava Stock Exchange, Prague Stock Exchange

Chapter 3
115
Table A3.2: Pre-privatization descriptive statistics of size
PRE-
PRIVATIZATION:
SIZE
Difference between emloyees one and three
years before privatization Total number of shares
Subgroup/Indicator NOB Mean Std. Dev. Median NOB Mean Std. Dev. Median
Delisted 307 193 348 75 382 210769 913409 57020
Not-delisted 100 214 390 94 114 292668 1097164 71006
REASONS
Delisted by authority 14 176 326 78 22 83773 178171 24902
Delisted by issuer 86 180 292 66 112 331444 1604496 51168
Information obligation 207 199 371 82 248 167536 342647 61626
TIME
Delisted before 2002 22 231 288 120 35 122835 216297 34666
Delisted in 2002 171 213 396 82 201 184668 379817 65094
Delisted after 2002 114 154 272 55 146 267782 1405775 52703
Table A3.3: Pre-privatization descriptive characteristics – financial variables
PRE-PRIVATIZATION:
FINANCIAL
VARIABLES
Difference between sales three and
one year before privatization
Profit one year before privatization
(% of total number of shares)
Subgroup/Indicator NOB Mean Std. Dev. Median NOB Mean Std. Dev. Median
Delisted 301 -110673 1573684 4644 379 0.086 0.264 0.044
Not-delisted 89 8347 201416 1266 113 0.113 0.174 0.069
REASONS
Delisted by authority 13 -12270 168814 6636 22 0.215 0.616 0.036
Delisted by issuer 86 -339363 2924906 8841 112 0.096 0.177 0.060
Information obligation 202 -19642 213047 3446 245 0.070 0.244 0.032
TIME
Delisted before 2002 21 13681 156382 21413 35 0.14 0.49 0.04
Delisted in 2002 167 -21677 229218 4287 198 0.08 0.26 0.03
Delisted after 2002 113 -265307 2551932 3426 146 0 0 0.05
Table A3.4: Descriptive characteristics of privatization variables I
PRIVATIZATION
CHARACTERISTICS I
Number of shares in voucher priv.
(% of total number of shares)
Average price in the first privatization
wave
Subgroup/Indicator NOB Mean Std. Dev. Median NOB Mean Std. Dev. Median
Delisted 382 90 17 97 382 31 33 23
Not-delisted 114 86 20 97 114 37 54 30
REASONS
Delisted by authority 22 92 15 97 22 45 36 42
Delisted by issuer 112 90 17 97 112 37 36 32
Information obligation 248 90 17 97 248 27 31 21
TIME
Delisted before 2002 35 95 14 97 35 34 30 31
Delisted in 2002 201 90 17 97 201 28 33 21
Delisted after 2002 146 90 17 97 146 34 34 30

APPENDIX 3
116
Table A3.5: Descriptive characteristics of privatization variables II
PRIVATIZATION
CHARACTERISTICS II
Proportion of shares held by the National
Property Fund
Proportion of shares held by
foreign investors
Subgroup/Indicator NOB Mean Std. Dev. Median NOB Mean Std. Dev. Median
Delisted 382 3.60 11.57 0 382 0.58 5.87 0
Not-delisted 114 7.24 16.02 0 114 1.51 8.19 0
REASONS
Delisted by authority 22 1.32 6.18 0 22 0 0 0
Delisted by issuer 112 4.41 13.66 0 112 0.99 8.08 0
Information obligation 248 3.44 10.89 0 248 0.44 4.87 0
TIME
Delisted before 2002 35 0 0 0 35 2.29 13.52 0
Delisted in 2002 201 3.25 10.80 0 201 0.55 5.40 0
Delisted after 2002 146 4.95 13.62 0 146 0.21 2.57 0
Table A3.6: Descriptive characteristics of post-privatization variables
POST-
PRIVATIZATION
CHARACTERISTICS
Growth rate – potential profit
(based on operational profit
between 1996 and 1997)*
Growth rate – debt
(based total debt
between 1996 and 1997)*
Subgroup/Indicator NOB Mean Std. Dev. Median NOB Mean Std. Dev. Median
Delisted 382 -27.0 28.5 -31.1 382 48 51 56.9
Not-delisted 114 -22 32.9 -26 114 40.1 55.8 23.1
REASONS
Delisted by authority 22 -31.3 9.7 -36 22 48.3 19.6 56.9
Delisted by issuer 112 -25.0 32.0 -27.9 112 45.7 59.6 28
Information obligation 248 -27.6 28.0 -33.8 248 49.2 49.3 56.9
TIME
Delisted before 2002 35 -28.5 23.8 -36.4 35 47.8 17 56.9
Delisted in 2002 201 -30.1 25 -36.4 201 47.2 42.7 56.9
Delisted after 2002 146 -22.4 33.6 -26.7 146 49.4 65.9 34.2
*Note: Both growth indicators are calculated as the growth rate between the current and the
following year of average value in a given industry, excluding the company itself.

Chapter 3
117
Table A3.7: Definitions and data sources of the variables included in the analysis
VARIABLE NAME SOURCE DESCRIPTION
Employees Ministry of Privatization
of the Czech Republic
number of employees in the company before
privatization
Total number of shares
(tns)
Ministry of Privatization of
the Czech Republic (MP CR)
the total number of shares of a firm
i.e. capital of a firm divided by the value of one
share (1000)
Profit (p3, p2, p1) MP CR profit prior to privatization (three, two and one
year)
Average price (AP) Ministry of Privatization
of the Czech Republic
average price of the firm's shares sold in the
auctions; sold points divided by shares sold
Number of shares in
mass priv. (NSCP_TNS)
Ministry of Privatization
of the Czech Republic
the number of shares offered in the coupon
privatization as % of total number of shares
Shares held by the
National Property Fund
Ministry of Privatization
of the Czech Republic
% of shares that should based on the privatization
project be kept by the NPF
Shares held by foreign
investors (for)
Ministry of Privatization
of the Czech Republic
% of shares that should based on the privatization
project be sold to a foreign investor
Single largest owner
(slo)
Central Securities Depository
of the Slovak Republic
% of shares owned by the single largest owner at
the end of 1995
Operational profit
(1995 - 2000)
INFIN database,
supplemented by AMADEUS
operational profit defined by the Slovak
accounting standards, row 29 in the profit and
loss account
Total debt
(1995 - 2000) INFIN databaase
total debt defined by the Slovak accounting
standards, row 86 of the in the balance sheet
Note: Ministry of Privatization of the Czech Republic was the successor of the Ministry for Privatization of
the Czechoslovak Federative Republic
Table A3.8: Results of the McNemar-type test (observed frequencies and 2)
OUR MODEL
NA
IVE
ES
TIM
AT
OR
outcome Incorrect Correct
Incorrect 15 98 113
Correct 10 369 379
25 467 492
Note: Both models predict correctly 369 delisted companies and 15 that stayed, however our model was in
comparison to the naive estimator mistaken only ten times, while the naive estimator incorrectly predicted
98 cases. This indicates the prediction power of our model that is also confirmed by the test statistic
2112
2
21122 )(
nn
nn that has an asymptotic
2 distribution. Its value is 71.704 which makes our results
significant at all levels.