privatization in malaysia - · pdf filereproduced or utilized in any form or by any...
TRANSCRIPT


Privatization in MalaysiaRegulation, rent-seeking and policy failure
In recent years, privatization has fallen out of favour in many countriesbecause the underlying political factors have not been well understood. Thisbook examines Malaysia’s privatization programme, focusing on howpolitical constraints resulted in the failure of four major privatizations: thenational sewerage company (IWK), Kuala Lumpur Light Rail Transit (LRT),national airline (MAS) and national car company (Proton). It considerswhy developing countries such as Malaysia might want to embark on pri-vatization, the factors that lead to policy failure and what is needed to makeit work. It shows clearly that political motives driving privatization oftendominate purely economic considerations, and thus it is necessary to analyseprivatization within the specific country context. It argues that failure in theMalaysian case was due to political considerations that compromised insti-tutional design and regulatory enforcement, leading to problems associatedwith corruption. It concludes that privatization does not necessarily improveincentives for efficiency or enhance the finance available for capital invest-ment, and that successful privatization depends on the state’s institutionaland political capacity to design and manage an appropriate set of subsidies.Overall, this book is a comprehensive examination of privatization inMalaysia, providing important insights for understanding the politicaleconomy of this process in other developing countries.
Jeff Tan is a political economist at the School of Oriental and AfricanStudies, University of London. His other research interests are in regulation,state capacity, industrial policy, institutions and governance.
Routledge Malaysian Studies SeriesPublished in association with Malaysian Social ScienceAssociation (MSSA)
Series Editors:Mohammed Hazim Shah, University of MalayaShamsul A.B., University Kebangsaan MalaysiaTerence Gomez, United Nations Research Institute for SocialDevelopment, Geneva
The Routledge Malaysian Studies Series publishes high quality scholarshipthat provides important new contributions to knowledge on Malaysia. It alsosignals research that spans comparative studies, involving the Malaysianexperience with that of other nations.
This series, initiated by the Malaysian Social Science Association (MSSA)to promote study of contemporary and historical issues in Malaysia, anddesigned to respond to the growing need to publish important research,also serves as a forum for debate on key issues in Malaysian society. As anacademic series, it will be used to generate new theoretical debates in thesocial sciences and on processes of change in this society.
The Routledge Malaysian Studies Series will cover a broad range of sub-jects including history, politics, economics, sociology, international relations,geography, business, education, religion, literature, culture and ethnicity. Theseries will encourage work adopting an interdisciplinary approach.
The State of MalaysiaEthnicity, equity and reformEdited by Edmund Terence Gomez
Feminism and the Women’s Movement inMalaysiaAn unsung (r)evolutionCecilia Ng, Maznah Mohamad and tanbeng hui
Governments and Markets in East AsiaThe politics of economic crisesJungug Choi
Health Care in MalaysiaThe dynamics of provision, financingand accessEdited by Chee Heng Leng and SimonBarraclough
Politics in MalaysiaThe Malay dimensionEdited by Edmund Terence Gomez
Privatization in MalaysiaRegulation, rent-seeking and policyfailureJeff Tan
Privatization in MalaysiaRegulation, rent-seeking and policy failure
Jeff Tan

First published 2008by Routledge2 Park Square, Milton Park, Abingdon, Oxon OX14 4RN
Simultaneously published in the USA and Canadaby Routledge270 Madison Ave, New York, NY 10016
Routledge is an imprint of the Taylor & Francis Group, an Informa business
© 2008 Jeff Tan
All rights reserved. No part of this book may be reprinted orreproduced or utilized in any form or by any electronic,mechanical, or other means, now known or hereafterinvented, including photocopying and recording, or in anyinformation storage or retrieval system, without permission inwriting from the publishers.
British Library Cataloguing in Publication DataA catalogue record for this book is available from the British Library
Library of Congress Cataloging in Publication DataTan, Jeff, 1965–
Privatization in Malaysia : regulation, rent-seeking, and policy failure /Jeff Tan.
p. cm.—(Routledge Malaysian studies series ; 6)Includes bibliographical references and index.1. Privatization—Malaysia. 2. Privatization—Malaysia—Case studies.
3. Malaysia—Politics and government. I. Title.HD4300.6.T36 2007338.95951′05—dc22
2007012482
ISBN10: 0–415–42821–1 (hbk)ISBN10: 0–203–93480–6 (ebk)
ISBN13: 978–0–415–42821–7 (hbk)ISBN13: 978–0–203–93480–7 (ebk)
This edition published in the Taylor & Francis e-Library, 2007.
“To purchase your own copy of this or any of Taylor & Francis or Routledge’scollection of thousands of eBooks please go to www.eBookstore.tandf.co.uk.”
ISBN 0-203-93480-6 Master e-book ISBN

Dedicated to my parents, Tan Siew Soo and Yeoh Siew Hong


Contents
List of tables ixAcknowledgements xiAbbreviations xiii
1 Introduction: why privatize? 1
2 Privatization, rents and rent-seeking 7
Why privatize in developing countries? 10Why may privatization fail? 18What is needed to make privatization work? 33
3 Institutional and political failure: privatization in Malaysia 39
Why did Malaysia privatize? 41Malaysia’s privatization programme (1983–2000) 52Why did privatization fail? 64Conditions for successful privatization 72
4 Universal access and private provision: Malaysia’s nationalsewerage system 78
Challenges 80Background 82Performance 84Problems 90Conclusion 103
5 The myth of privatized urban rail: Kuala Lumpur Light Rail Transit 106
Challenges 107Background 111Performance 114

Problems 123Conclusion 131
6 Perverse incentives: Malaysia Airlines 133
Challenges 135Background 139Performance 140Problems 147Conclusion 156
7 Rents and industrial upgrading: Proton 158
Challenges 161Background 164Performance 167Problems 179Conclusion 186
8 Summary and conclusion 188
Notes 196References 206Index 225
viii Contents
Tables
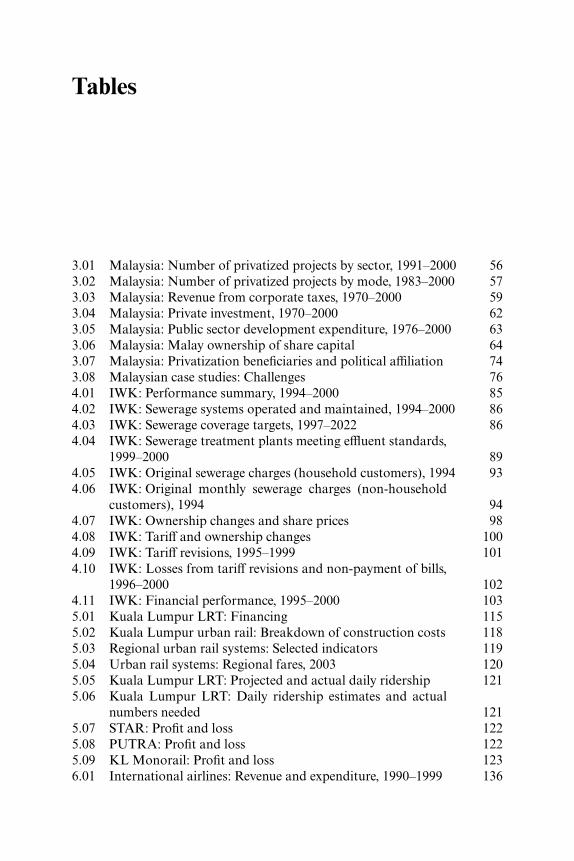
3.01 Malaysia: Number of privatized projects by sector, 1991–2000 563.02 Malaysia: Number of privatized projects by mode, 1983–2000 573.03 Malaysia: Revenue from corporate taxes, 1970–2000 593.04 Malaysia: Private investment, 1970–2000 623.05 Malaysia: Public sector development expenditure, 1976–2000 633.06 Malaysia: Malay ownership of share capital 643.07 Malaysia: Privatization beneficiaries and political affiliation 743.08 Malaysian case studies: Challenges 764.01 IWK: Performance summary, 1994–2000 854.02 IWK: Sewerage systems operated and maintained, 1994–2000 864.03 IWK: Sewerage coverage targets, 1997–2022 864.04 IWK: Sewerage treatment plants meeting effluent standards,
1999–2000 894.05 IWK: Original sewerage charges (household customers), 1994 934.06 IWK: Original monthly sewerage charges (non-household
customers), 1994 944.07 IWK: Ownership changes and share prices 984.08 IWK: Tariff and ownership changes 1004.09 IWK: Tariff revisions, 1995–1999 1014.10 IWK: Losses from tariff revisions and non-payment of bills,
1996–2000 1024.11 IWK: Financial performance, 1995–2000 1035.01 Kuala Lumpur LRT: Financing 1155.02 Kuala Lumpur urban rail: Breakdown of construction costs 1185.03 Regional urban rail systems: Selected indicators 1195.04 Urban rail systems: Regional fares, 2003 1205.05 Kuala Lumpur LRT: Projected and actual daily ridership 1215.06 Kuala Lumpur LRT: Daily ridership estimates and actual
numbers needed 1215.07 STAR: Profit and loss 1225.08 PUTRA: Profit and loss 1225.09 KL Monorail: Profit and loss 1236.01 International airlines: Revenue and expenditure, 1990–1999 136
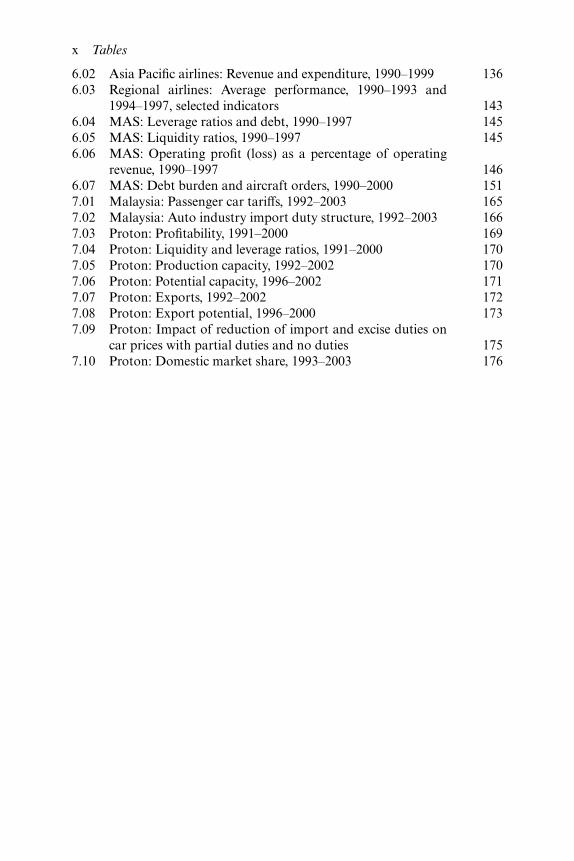
6.02 Asia Pacific airlines: Revenue and expenditure, 1990–1999 1366.03 Regional airlines: Average performance, 1990–1993 and
1994–1997, selected indicators 1436.04 MAS: Leverage ratios and debt, 1990–1997 1456.05 MAS: Liquidity ratios, 1990–1997 1456.06 MAS: Operating profit (loss) as a percentage of operating
revenue, 1990–1997 1466.07 MAS: Debt burden and aircraft orders, 1990–2000 1517.01 Malaysia: Passenger car tariffs, 1992–2003 1657.02 Malaysia: Auto industry import duty structure, 1992–2003 1667.03 Proton: Profitability, 1991–2000 1697.04 Proton: Liquidity and leverage ratios, 1991–2000 1707.05 Proton: Production capacity, 1992–2002 1707.06 Proton: Potential capacity, 1996–2002 1717.07 Proton: Exports, 1992–2002 1727.08 Proton: Export potential, 1996–2000 1737.09 Proton: Impact of reduction of import and excise duties on
car prices with partial duties and no duties 1757.10 Proton: Domestic market share, 1993–2003 176
x Tables
Acknowledgements
I would like to thank the British Council for the British Chevening Scholar-ship which allowed me to undertake my PhD. I am very grateful to MushtaqH. Khan for agreeing to supervise my research at the School of Orientaland African Studies (SOAS), and for his insight, stimulating discussions, andfaith in me. I am also indebted to Jomo K.S. for his invaluable guidance,constant support, encouragement and feedback. Finally, I want to thankEdward Terence Gomez for his time and support in getting my researchpublished.

Abbreviations
AFTA Asian Free Trade AgreementAFTK Available freight tonne kilometresAPTK Available passenger tonne kilometresARP Area road pricingASEAN Association of Southeast Asian NationsASK Available seat kilometresASN Amanah Saham Nasional (National Unit Trust Scheme)ATK Available tonne kilometresBBMB Bank Bumiputra Malaysia BhdBEC Bumiputra Economic CongressBhd Berhad (limited company)BNM Bank Negara Malaysia (Central Bank)BO Build-operateBOD Biochemical oxygen demandBOO Build-operate-ownBOT Build-operate-transferBPIMB Bank Pembangunan dan Infrastruktur Malaysia Bhd (Develop-
ment and Infrastructure Bank)BPPP Bahagian Pembangunan Perakunan dan Pengurusan (Planning
Research Development Unit, National Audit Division)BT Build-transferCBU Completely built upCDRC Corporate Debt Restructuring CommitteeCEPT Common Effective Preferential TariffCIC Capital Issues CommitteeCIMB Commerce International Merchant Bankers BhdCKD Completely knocked downCMGI Commerce MGI Sdn BhdCPA Central planning areaCVLB Commercial Vehicle Licensing BoardDanaharta State asset management companyDBKL Dewan Bandaraya Kuala Lumpur (Kuala Lumpur City Hall)DGSS Director General of Sewerage Services
DOE Department of EnvironmentDoR Department of RailwaysDRB Diversified Resources BhdDSS Department of Sewerage ServicesEBIT Earnings before interest and tax EC European CommunityEIB European Investment BankEMS Engine management systemEON Edaran Otomobil NasionalEPF Employees Provident FundEPSFD Economic Planning & Social Facilities DepartmentEPU Economic Planning UnitFTDKVP Federal Territory Development & Klang Valley Planning
DivisionGSP Generalized Scheme of PreferencesHICOM Heavy Industries CorporationHOV High occupancy vehicleHPU Highway Planning UnitIATA International Air Transport AssociationIBD International Business DivisionICA Industrial Coordination ActICAO International Civil Aviation OrganizationICP Inter-departmental Committee on PrivatizationICU Implementation and Coordination UnitIFC International Finance CorporationIPC Infrastructure Project CompanyIPP Independent power producerIWK Indah Water KonsortiumJBIC Japan Bank for International CooperationJICA Japan International Co-operation AgencyJIT Just-in-timeJKR Jabatan Kerja Raya (Public Works Department)JPJ Jabatan Pengangkutan Jalan (Road Transport Department)KCT Klang Container TerminalKEJORA Lembaga Kemajuan Johor Tenggara (South East Johor Develop-
ment Authority)KfW Kreditanstalt für WiederaufbauKL PRT Kuala Lumpur People Rapid TransitKLIA Kuala Lumpur International AirportKLSE Kuala Lumpur Stock ExchangeKLTG Kuala Lumpur Transit GroupKTMB Keretapi Tanah Melayu Bhd (Malayan Railways)KWAP Kumpulan Wang Amanah Pencen (State Pension Fund)LLM Lembaga Lebuhraya Malaysia (Malaysian Highway Authority)LOA Lease of asset
xiv Abbreviations
LoS Level of serviceLPPJ Road Transport Licensing BoardLRT Light rail transitLTA Land Transport AuthorityLTAT Lembaga Tabung Angkatan Tentera (Armed Forces Savings
Board)LTD Long-term debtLTL Long-term leaseMARA Majlis Amanah Rakyat (Council of Trust for Indigenous People)MAS Malaysia AirlinesMBO Management-buy-outMC Mitsubishi CorporationMCA Malaysian Chinese AssociationMHS Malaysian Helicopter ServicesMIC Malaysian Indian CongressMIDA Malaysian Industrial Development AuthorityMMC Mitsubishi Motor CompanyMoED Ministry of Entrepreneur DevelopmentMoF Ministry of FinanceMoHA Ministry of Home AffairsMoT Ministry of TransportMoW Ministry of WorksMRT Mass Rapid TransitMTI Ministry of Trade and IndustryNCF Net cash flowNEL North East LineNEP New Economic PolicyNFPEs Non-financial public enterprisesNIE New Institutional EconomicsNPL Non-performing loanNWW North West WaterOBA Off-budget agencyOEM Original equipment manufactureOSA Official Secrets ActPAP Privatization Action PlanPBT Profits before taxPernas Perbadanan Nasional (National Corporation)PFI Private finance initiativePMD Prime Minister’s DepartmentPMP Privatization Master PlanPNB Permodalan Nasional Berhad (National Equity Corporation)PPP Public–private partnershipPROTON Perusahaan Otomobil NasionalPSD Public Service DepartmentPTF Privatization Task Force
Abbreviations xv
PUTRA Projek Usahasama Transit Ringan AutomatikRAC Railway Asset CorporationR&D Research and developmentRIDA Rural Industrial Development AuthorityRM Ringgit Malaysia (Malaysian ringgit)ROA Return on assetsROE Return on equityRPK Revenue passenger-kmRTO Road Transport OrdinanceSCB Siam Commercial BankSdn Bhd Sendirian Berhad (private limited company)SEDC State Economic Development CorporationSIA Singapore International AirlinesSMI Small- and medium-scale industrySMRT Singapore Mass Rapid TransitSOA Sale of assetSOE State-owned enterpriseSS Suspended solidsSSA Sewage Services ActSTAR Sistem Transit Aliran RingganSTL Short-term leaseSTP Sewerage treatment plantTAC Track access chargeTC Technical committeeTNB Tenaga Nasional BerhadTOC Train operating companyTRI Technology Resources Industries BhdTRTA Teito Rapid Transit AuthorityUDA Urban Development AuthorityUMNO United Malays National OrganisationUSPD Usahasama Proton-DRB Sdn BhdUTD Urban Transportation DepartmentVDP Vendor Development Programme
xvi Abbreviations

1 IntroductionWhy privatize?
The debate over privatization is essentially the debate over the relativeefficiency of the state versus markets and private property in the allocation ofresources. Privatization is said to improve efficiency by changing the structureof incentives, reducing the possibilities of damaging state interventions,improving monitoring and introducing competition. The mainstream litera-ture has largely focused on the correlation between privatization and per-formance (by comparing public and private firms) and on establishing thecausality between private ownership and performance. However, the resultsof privatization have been mixed, with the evidence of efficiency gainsinconclusive. These approaches are also usually hampered by methodologicaldifficulties and there is a lack of general consensus on the correlation betweenprivatization (private ownership) and economic performance.
Methodological problems arise from attempts to measure performance, inparticular key variables (e.g. allocative efficiency), the use of criteria whichmostly favours the private sector, interpreting financial profitability and theabsence of common agreement on what constitutes successful performancegiven the often multiple objectives and different goals of public enterprises.In particular, it is often unclear whether improved efficiency is due to achange in ownership or structural changes which accompany privatization,especially increased competition. Evidence of improved performance hasalso been limited to certain sectors with industry-specific conditions, tele-communications being one of the few such instances, and it is unclearwhether these can be replicated in other sectors.
As a result, a growing body of literature has found that the evidence‘does not support any general proposition about the superiority of privateover public ownership or vice versa’ (Vickers and Wright 1989: 23, citedin Tatahi 2003: 90) and ‘there exists neither compelling theoretical reasonsnor unambiguous empirical evidence for either developed or developingcountries suggesting the pervasive “inefficiency” of public enterprises’(Chang and Singh 1992: 42), with ‘no clear-cut evidence that public owner-ship necessarily results in inferior performance’ (Chang and Singh 1993: 34).Several important international surveys on the performances of public versusprivate enterprises conclude that in a competitive environment, private and
public firms do not differ significantly in their economic performance (seeMillward and Parker 1983; Borcherding et al. 1982, cited in Tatahi 2003).Other studies also point to competition and regulation as more important orat least necessary if privatization is to be more efficient (Vickers and Wright1989; Caves and Christensen 1980; Faere et al. 1985; Atkinson et al. 1986;Yarrow 1986; Vickers and Yarrow 1988; Bishop and Kay 1989; Beesley andLittlechild 1989; and Martin and Parker 1997, all cited in Tatahi 2003: 80;Cook and Uchida 2003; also see Hemming and Mansoor 1988; Vickers andYarrow 1991; Parker and Kirkpatrick 2003).
Despite this, privatization continues to be widely accepted in principle,and the failure of privatization in developing countries has been normallyattributed to institutional weaknesses leading to problems of patronage andcorruption. The conditions for successful privatization are then said todepend on strengthening institutions, democracy, transparency and account-ability. However, these explanations are restricted by a narrow understandingof what privatization and regulation entail, based on an apolitical andahistorical reading of the constraints facing developing countries, andgrounded in theoretically flawed arguments about the incentive benefits ofprivatization.
We make two main claims. The first challenges the theory that privatizationimproves incentives by aligning residual control (ownership) with residualreturns (profit). It will be argued that the private sector, both in developedand developing countries, is often unable and unwilling to finance projectswith high capital costs such as infrastructure provision on its own, making itnecessary for the state to share risks even after privatization. In addition, theprovision of public goods or services (such as urban transit and sewagetreatment) in developing countries is often not profitable, partly because uni-versal service obligations require that these should be affordable. A subsidymay then be required, even by a very efficient operator, if the tariff customersare willing to pay is less than the minimum cost the producer can achieve.But a subsidy may also allow inefficiency to survive, particularly in sectorswith insufficient competition. These state interventions dilute incentivesbecause there is no longer a direct relationship between management qualityand profits, thereby necessitating regulation. However, asymmetric informa-tion will prevent regulators knowing for sure whether an adequate level ofefficiency has been achieved. In principle, tough regulators can still achieveefficiency over time in a number of ways, for instance, by setting tariff reduc-tion targets with fixed levels of subsidies. But the success of these strategiesdepends on the credibility of the regulator’s threats that failure to achievetargets may result in the selection of a different operator or the imposition ofa financial penalty. The success of privatization will then depend on insti-tutional prerequisites for effective regulation that can maintain incentivesfor performance in a context where the state is still providing subsidies andsharing risks.
This brings us directly to the second and related claim: privatization
2 Introduction: why privatize?

necessitates continued and often even greater state intervention in terms ofmaintaining some subsidies, perhaps creating new ones, devising newmethods of regulation and coordinating certain sectors such as rail networks.Regulation will not only involve promoting competition and enforcing rules,but also managing subsidies, setting targets, changing property rights andlaws and other interventions that go beyond the simple but standard textbookunderstanding of regulation. In addition to the issues already discussed,developing countries often also face a shortage of domestic capitalists, andgovernments will often be engaged in developing entrepreneurial capacity.States in successful developers have played a central role in the emergence ofthe capitalist class. Privatization in this context can also be seen as a processthat aims to facilitate the emergence of domestic capitalists and to thatextent, it usually has a political motivation in addition to the standard eco-nomic ones. It is our contention that the political motive often dominates,and has to be understood on its own terms.
When the issue of emerging domestic capitalism is introduced, we have anassociated problem of catching up, as discussed in the late developmentliterature (e.g. see Amsden 1989; Wade 1990). When new domestic capitalistsare encouraged to take over advanced technologies, their initial productivityis expected to be low, till they have had the opportunity of learning-by-doing(see Arrow 1962). This means that we can expect a further set of subsidies tobe required, this time temporary subsidies that also need to be monitored andwithdrawn over a short period of time to create both the opportunity andincentive for catching up (as discussed in the literature on late industrializa-tion and infant industries). This presents different regulatory challenges, withthe state needing to ensure that subsidies are conditional upon performancetargets being met. This is because the presence of a regulatory structure orintent does not guarantee success as regulatory failure can be the result ofinstitutional failure (e.g. poor incentive structures) or political failure (e.g.ineffective implementation of subsidy withdrawal). This means that effectiveregulation will depend on the state’s political capacity just as much as, or evenmore so than, its institutional capacity. This is because the failure to enforceconditionality is usually due to the state’s political failure to impose disciplineon capitalists.
Thus state failure in the context of privatization can occur before or afterprivatization and we will refer to these as ex ante and ex post state failures.Ex ante failure can often be unavoidable given the problems of asymmetricinformation, shortage of entrepreneurs and political considerations, all ofwhich potentially affect the choice of privatization and candidate. It is there-fore critical that the state is able to correct any mistakes ex post, throughpolicy changes, tweaking regulatory structures, devising and enforcing con-ditionality for new or existing subsidy structures, and so on. This ex postfailure can provide a more useful explanation for the failure of privatizationin developing countries. That is to say, successful privatization will dependon the state’s political capacity, in particular its ex post capacity to correct
Introduction: why privatize? 3

mistakes. Understanding the sources of the state’s appropriate politicalcapacities will then allow us to explain better how successful the state hasbeen in managing privatization, and the conditions that need to be met forimproving the chances of success in the future.
Theories addressing state failure and the literature on the developmentalstate provide a useful framework to analyse factors that are important foreffective state intervention. The success of the East Asian developmentalstates has been generally attributed to the state’s autonomy to develop andimplement policy, combined with networks of information exchange withproductive groups (particularly capitalists), which enabled it to both identifyareas of necessary intervention, and then implement these interventionseffectively (e.g. see Johnson 1982; Wade 1990; Evans 1994; Weiss 1998;Woo-Cummings 1999). State capacity in this context will then depend onthe nature of the state–society relationship, and the strength of the state inrelation to the group(s) it engages with. In developing countries, a capitalistclass is often absent or very weak, and the state–society relationship willusually involve the exercise of influence and the exchange of information with‘unproductive’ groups. Regardless of the state’s potential for eventual suc-cess, its allocation of resources is likely to be through patron–client networksrather than formalized or institutionalized channels since states in late devel-opers rarely have the qualities of Weberian states. The nature of these patron–client networks, and the relative strength of the state in relation to the groupsthat are accommodated within these networks (which depends on the broaderbalance of power between groups and classes in society), will affect how andto whom resources are allocated, and most crucially, determine the state’scapacity to ensure efficient outcomes by enforcing discipline (e.g. see Khan1998). The latter approach suggests that the analysis of the prospects andperformance of privatization needs to be located in a country context, look-ing specifically at the nature of social relations and the balance of power insociety and within the networks of governance in which decisions aboutprivatization and the regulation of rules and subsidies take place.
This book seeks to explain why privatization may fail by looking at thepolitical motivations behind this, and the constraints on the state’s politicalcapacity to manage subsidies associated with privatization. The discussionwill take place on two levels. Broadly, we examine the role of (and motivationsbehind) privatization in the context of state attempts to create domesticentrepreneurial capacity, looking at the problems of institutional andpolitical failure. Specifically, we apply this analytical framework to explainMalaysia’s privatization performance and the failure of four of its largestprivatizations: Indah Water Konsortium (IWK, the operator of the nationalsewerage system), Kuala Lumpur’s Light Rail Transit (LRT), MalaysiaAirlines (MAS, the national airline) and Proton (the national car company).
Malaysia’s privatization programme between the mid 1980s and mid 1990swas amongst the most extensive in the developing world, widely publicized,hailed as a success story, and promoted as a model for other developing
4 Introduction: why privatize?
countries. However, subsequent state bail-outs, and the financial failure andeventual renationalization of these four privatizations by 2000, reveal thatthis conclusion was premature. Failure here has been generally blamed on theproblems of patronage and corruption associated with weak institutions.While this focus on political factors is useful, it does not consider the specificeconomic and political challenges related to efficiency and redistributionwhich the state sought to address through privatization. We will examinethe failure of privatization in the context of these challenges by askingthree central questions: Why privatize in developing countries? Why mayprivatization fail? What is needed to make privatization work?
A careful reading of Malaysia’s economic history and political economyreveals that changes within the Malay middle class – as opposed to changes inthe balance of power between Malays and other ethnic groups – are criticalfor understanding Malaysia’s economic policy-making and performancevis-à-vis its privatization strategy. This perspective allows us to identify thedrivers of Malaysia’s privatization programme, the motivations behind this,the subsequent constraints on the state’s disciplinary capacity, and how thisaffected the institutional arrangements and outcomes of privatization. Weargue that the drive for a massive privatization strategy was in response toeconomic inefficiencies but more crucially came from changes in socialrelations within the Malay middle class that led to increased competition forresources within the ruling Malay party. The emergence of new factionsshifted the balance of power, and privatization facilitated the redistributionof resources away from beneficiaries of the state’s previous redistributivepolicy in favour of emerging factions centred on key political leaders. Thispersonalized and gradually undermined the previously centralized patronagenetwork, and led to a growing moral hazard problem as the politicalleadership became increasingly unwilling or unable to discipline its closesupporters. The nature of the changes within these patron–client relation-ships also affected the choice of privatization sectors and candidates, andmost crucially, the state’s ability to implement corrective policy or enforcediscipline.
This approach allows us to locate our case studies within what we argue isthe appropriate political context, while avoiding some of the methodologicalpitfalls of cross-country and cross-industry comparisons which typify muchof the literature. The case studies will offer both a broader discussion of thechallenges for privatization in the respective industries as well as a detailedexamination of the specific case. Each case study is assessed on its own terms,but within a common analytical framework with performance measuredagainst economic general indicators (efficiency, capital investment andfinancial performance) as well as indicators specific to each industry and inrelation to official objectives. This provides for much richer sources of data,while taking into account non-economic factors which allow us to makeuseful comparisons and to draw policy lessons. The case studies provide theevidence to support our two main claims that: 1, privatization in developing
Introduction: why privatize? 5
countries typically necessitates the continuation of state financial support fora variety of reasons; and 2, successful privatization will depend on the state’scapacity, in particular its ex post political capacity, to correct ex ante failureand to manage the appropriate subsidy regimes.
The book is structured as follows. Chapter 2 examines the main argumentsfor privatization. These are shown to be problematic, as they do not identifythe political motivations for privatization in developing countries, and failto account for the political reasons why privatization may fail. The typicalrecommendations to strengthen institutions do not address the mainproblems that drive regulatory failure in countries like Malaysia. The chapterthen examines sources of state capacity, looking at social relations and thebalance of power specific to the country.
Chapter 3 provides the background to understand the political context inwhich privatization was undertaken in Malaysia, looking at both economicand political imperatives in order to properly locate the subsequent case studychapters. Malaysia’s privatization programme will be examined within thetheoretical framework presented in Chapter 2, applying the three centralquestions to the Malaysian case. A discussion of the country’s redistributiveNew Economic Policy (NEP) shows that this was both a consequence and acause of changes in social relations, in particular the growth of and increasingdifferentiation within the Malay middle class. This provides the context inwhich to understand the drivers of the Malaysian government’s privatizationstrategy. The drivers came from both the growing political demands of a newMalay upper middle class, and the challenges faced by the government inmanaging the public sector. The chapter then provides some backgroundand details of Malaysia’s privatization programme, and evaluates its per-formance from 1983–2000. The results, measured against official objectives,will be shown to be mixed, with privatization in particular failing to developa dynamic Malay capitalist class. We then trace the failure of Malaysia’sprivatization programme to the state’s ex ante and ex post failure, and suggestwhy the latter is of far greater consequence for the success of privatization inMalaysia.
Chapters 5–7 present the case studies on IWK, the Kuala Lumpur LRT,MAS and Proton respectively. The first half of each case study will examinethe challenges posed for privatization, provide the background to each ofthese decisions to privatize, and assess performance based on official objec-tives. The second half of the case studies then examines the problems, lookingat the state’s ex ante and ex post failure as explanations. Failure in eachcase was due to both types of state failure, but we argue that the state’s expost failure was the key factor explaining the eventual failure of the fourcase studies. Chapter 8 summarizes the main findings and presents theconclusions.
6 Introduction: why privatize?
2 Privatization, rents andrent-seeking
Privatization is argued to provide better incentives and monitoring throughthe clear designation of property rights, while also reducing damaging stateinterventions. Improved efficiency as a result is then seen to encourage theprivate owner or operator to undertake much-needed capital investment.However, privatization does not necessarily lead to the clear designation ofproperty rights, reduce state intervention or enhance the private financingof capital investment. This is because the private sector is often unable or un-willing on its own to meet the high cost of capital investment associated withtypical privatizations (e.g. sewerage and water services). This is especiallyso in developing countries where there is in addition a shortage of entre-preneurial capacity. Furthermore, the ability of the private sector to meetcapital investment targets will in part also depend on projected revenuesbased on cost-covering tariffs. However, cost-covering tariffs are usuallypolitically unfeasible for many critical services. High capital costs and theinability of tariffs to cover high operational costs will then require statesubsidies which in turn dilute incentives associated with private ownershipunless they are combined with additional and credible incentives andsanctions.
In addition, governments in developing countries will often be attemptingto create domestic capitalists due to a shortage of entrepreneurial capacitybut also because of political pressure from groups contesting for resources.This will require additional subsidies for learning (also known as ‘rents forlearning’) in order to develop entrepreneurial capacity, and in the long term,promote efficiency and technological ‘catching up’. The processes involvedhere have elements similar to the process of (primitive) capital accumulationin early capitalism (e.g. see Marx 1979) in addition to the regulatory issuesraised in the privatization of public sector enterprises in advanced countries.As such, privatization will often be closely tied in with state motivations andthe political forces behind this. Here, the mainstream literature on privatiza-tion suffers from several shortcomings when attempting to explain the failureof privatization in developing countries because it tends to largely ignore thepolitical context and hence political motivations which often drive privatiza-tion. These can affect both the character of privatization (what is privatized,
how and to whom) and determine the type and efficacy of related institutionsthat are important for the success of privatization. Economic theoriesexplaining the success or failure of privatization have generally ignoredrelated literature on why institutions fail and why weak institutions persist(e.g. see Alavi, H. 1982; Khan 1997, 1998, 2000b).
While effective regulation is seen as central for successful privatization,the discussion in the literature is limited in scope, focusing on institutionalprerequisites, with regulation viewed as a second-best option in the absenceof competitive markets. Proposed institutional solutions focus on strengthen-ing relevant institutions to promote transparency and accountability, and aregulatory framework which safeguards the private sector from politicalintervention and which promotes competition (e.g. see Vickers and Yarrow1991; Clague 1997b; Williamson 2000). This does not address the problemsrelated to the management of subsidies, especially in relation to the learningprocesses necessary for creating a viable private operator. Here the privatiza-tion literature fails to identify some important conditions for effectiveregulation in developing countries because it does not begin by identifyingsome of the key motivations for privatization, including state attempts todevelop domestic entrepreneurs.
A further problem is that these institutional preconditions are oftenunrealistic for developing countries as they are based on a partial reading ofproblems in an ahistorical and apolitical framework of analysis. Implicitly,this means that institutions are benchmarked against existing Westernstandards, but these institutions were themselves the outcome rather than thecause of specific patterns of economic development in developed countries(e.g. see Chang 1999). As such, their prescription is unrealistic, as almostno developing country is able to meet these conditions. The mainstreamapproach to governance and regulation is also more concerned with how toimprove the efficiency of service delivery rather than how to accelerate theprocess of dynamic change which is a necessary part of the developmentprocess (Rowthorn and Chang 1993; Khan 2004). The latter has historicallyrequired a different type of interventionist capacity, in particular connectedwith the efficient provision and regulation of dynamic rents that accelerategrowth and ensure successful structural transformations (e.g. see Amsden1989; Wade 1990; Aoki et al. 1997; Khan 2000a, 2000b).
Effective regulation is thus central to privatization but its treatment needsto go beyond measures to overcome market failure and strengthening insti-tutional structures to include discussion of sources of state failure and inade-quate state capacities with respect to the specific transformational tasks thatthe state is trying to achieve. Whether privatization leads to capital accumula-tion or capital consumption by the new owners will depend on the design ofincentive structures (including rents to support learning, the managementof long-term subsidies and/or terms of risk-sharing), and the ability of thestate to enforce effective and credible sanctions for non-performance. Theoutcome of privatization, including what is privatized, how, to whom, and
8 Privatization, rents and rent-seeking
more crucially, the performance of privatized entities, will thus be determinedby both institutional and political factors.
Failure can then be either due to poorly structured incentives (institutionalfailure) or well-structured incentives which are not effectively implemented(political failure). Institutional failure usually relates to mistakes made exante (e.g. failure to ensure the viability of the privatization project in the firstplace) while ex post failure refers to the failure to correct mistakes andenforce discipline. As the choice of privatization and candidate will be con-strained by political considerations and imperfect information, particularlyin developing countries, the state’s (ex post) political capacity is usuallymore critical for successful privatization outcomes. The perception that pri-vatization will reduce the role of the state is therefore misguided becauseprivatization in fact necessitates continued and effective state intervention,and indeed the enhancement of regulatory capacity in key areas. The mainconcern should then be to ensure that the state has the capacity to interveneeffectively, in particular, to correct mistakes.
Unfortunately, the analysis of politics in the privatization literature islimited, and restricted to ex ante political constraints (i.e. opposition bygroups with vested interests such as politicians and trade unions) (e.g. Cookand Kirkpatrick 1988; Bienen and Waterbury 1989; Roland 1994; Shirley1997), focusing on weak political and economic institutions. There is a grow-ing recognition of the need to take into account political power and conflictarising from existing social relations (e.g. Cook and Minogue 1990; Parker2001; Parker and Kirkpatrick 2002, 2003) and an emphasis on institutionalcompatibility (e.g. Kessides 2004). However, discussion of political factorstends to centre on the problem of corruption and remains largely uninformedby theory and with little analytical priority. We will build on the existingprivatization literature but also draw from developmental state theories toprovide a theoretical framework to explain the problem of institutional andpolitical failure.
Theories addressing state failure and the literature on the developmentalstate provide a more useful framework to analyse factors that are importantfor effective state intervention, looking in particular at the East Asian develop-mental states which Malaysia sought to emulate. The lessons that can begleaned from this suggest that effective state intervention depends on thecompatibility of institutions and patterns of intervention with the balance ofpolitical power in society. The strength of the state in relation to variouscompeting groups in society is critical for understanding the outcome,because it can help to determine whether the state is able to resist challengesfrom those who stand to lose out from the proposed changes, and whethercritical incentive structures can be effectively enforced. The analytical priorityof political factors in our analysis is justified because without an understand-ing of the political constraints, it is difficult to identify the institutional inter-ventions that may be effective, or to explain why particular institutions do notwork in that context. This approach can explain why weak institutions may
Privatization, rents and rent-seeking 9

often persist where the state lacks the political capacity to enforce, as it isunlikely that it can change institutions if it is unable to implement policy inthe first place. It is therefore important to locate the analysis of institutionalchanges such as privatization within an analysis of the political constraintsfacing the state in a specific country.
This chapter seeks to identify the important conditions for successfulprivatization by critically examining theory and the evidence of privatizationin developing countries. It will ask the following questions: Why privatize indeveloping countries? Why may privatization fail? What is needed to makeprivatization work? This will provide the framework to explain Malaysia’sprivatization experience and the four case studies in the following chapters.The chapter is divided into four sections. The following section briefly looksat the reasons why developing countries would want to privatize, and com-pare this with the main arguments for privatization. It will be argued thatmost of the conventional theories of privatization very often do not identifythe real motivations of privatization in specific developing countries and aretherefore unable to analyse the very problem they seek to address.
The next section examines why privatization may fail, looking at con-ventional (institutional) arguments. Many of these arguments are problem-atic because the institutional preconditions identified are based on ahistoricaland unrealistic benchmarks and ignore the realities of the development pro-cess, in particular the specific political constraints faced by specific countries.This requires an analysis of state capacity, looking in particular at how this isaffected by the (changing) balance of power in society. The fourth sectionseeks to identify some of the conditions for successful privatization, lookingat both institutional and political capacity. We argue that while an appro-priate institutional design is necessary, political capacity is more important asthis is far harder to correct if not in place, and also determines the quality ofinstitutions and the ability of the state to strengthen weak institutions.
Why privatize in developing countries?
Conventional arguments for privatization
Arguments in favour of privatization are based on the efficiency claimedfor private property rights, principal agent theories comparing asymmetricinformation problems under public and private ownership, and public choicetheories looking at the ways in which objectives and outcomes are determinedin bureaucracies. These theoretical developments came about in response topoor public sector performance, escalating operational and capital costs, andstate fiscal constraints in both advanced and developing countries (Batley1996). These theories mostly showed that, where feasible, private provision(and market choices) was socially preferable and superior to public provisionor production (Windsor 1996). Privatization improved efficiency by: 1,changing the objectives of the firm’s ultimate owners; and 2, reducing the
10 Privatization, rents and rent-seeking

possibilities of continuous government intervention (Hakim et al. 1996b;Payson and Steckler 1996; Stottmann 2000). This improved the monitoringof managerial performance (Vickers and Yarrow 1991) thereby addressingthe problems of poor operational and financial performance of state-ownedenterprises (SOEs) and the underinvestment in infrastructure.
Clearly designated property rights
According to property rights and principal agent theories, private ownershipis superior to public ownership because clearly defined property rightsprovide incentives for monitoring and improving efficiency through thealignment of residual control (ownership) and residual return (profit)(Alchian and Demsetz 1972). This is because there are a series of principal–agent problems in public enterprises. All citizens are joint owners of theresidual and are therefore the ultimate principal. They have to contract withgovernment, their agent, to manage public enterprises, but government inturn has to contract with managers, who have most of the residual controlrights. The government’s problem as principal is that it is unable to providethe appropriate incentives to the agent (managers of SOEs) to exert effortin monitoring the performance of workers and employees in a context ofasymmetric information. Private ownership is seen as the most efficient wayto align incentives because the owner of the residual thereby gains effectiveresidual control rights (Alchian and Demsetz 1972). This alignment isattenuated with shareholding, where the residual owners and control rightsagain become separated, but specific mechanisms such as the market inmanagers, takeover threats and regulation ensure that managers in share-holder-owned companies have better incentives and compulsions formonitoring than managers in public enterprises. Different forms of privatiza-tion can improve incentives by transferring responsibility and risk to theprivate sector. Hence, while the public sector bears all the commercial risks ina service contract, this risk is shared in the case of a lease, and fully assumedby the private sector in build-operate-transfer (BOT) and build-operate-own(BOO) contracts, and divestitures.
Reduced state intervention
Private ownership is also shown in these models to enable a more crediblepromise for the state not to intervene, thus providing beneficial incentiveeffects for employment and investment (Sappington and Stiglitz 1987a).According to public choice theory, the state is intrinsically inefficient andperpetually overburdened and underdisciplined (Linder 2000), and ‘publicenterprises are inefficient because they address the objectives of politiciansrather than maximize efficiency’ (Boycko et al. 1996: 309). SOEs are seen tobe constrained by the behaviour of politicians and bureaucrats who pursuetheir own utility rather than the public interest. As such, political motives
Privatization, rents and rent-seeking 11
usually outweigh efficiency considerations (Krueger 1990; Vickers and Yarrow1991), and any economic intervention by the state is viewed as a potentiallycounter-productive policy response and an invitation to rent-seekingbehaviour. The greater the degree of regulation, the more private resourcesare absorbed by rent-seeking activities (Krueger 1974, 1990; Buchanan 1980).
Because SOEs, through the allocation of rents, are seen as a vehicle toredistribute wealth or promote politically motivated redistributive arrange-ments (Jones and Mason 1982), privatization is desirable as it ‘effectivelydrives a wedge between politicians and managers’ by depoliticizing firms andmaking it too costly for politicians to subsidize them (Boycko et al. 1996:318). By placing some distance between the government and producer andsubstantially increasing the transaction costs of such interventions, privatiza-tion is said to make more credible the promise not to use public fundsto subsidize losses (Sappington and Stiglitz 1987a; Stiglitz 1996). This alsohas beneficial effects by subjecting the firm to the discipline of the market.Privatization therefore limits government intervention by changing ‘theresidual rights of intervention’ and altering the incentives to intervene(Sappington and Stiglitz 1987a: 80).
Financing capital investment
The increasing cost of infrastructure development has required new financingsolutions, and privatization has been promoted as a way of mobilizingresources and investing them cost-effectively to meet the growing needs ofdeveloping countries while also overcoming existing inefficiencies. Privatiza-tion is seen as suitable for high-cost, capital-intensive infrastructure projectswhere cost is the main concern and where there are limited externalities(Heilman and Johnson 1992; Rosenau 2000b) because private ownership issaid to provide more incentives or make it easier to implement cost-coveringtariffs, thus making the project more viable. The private sector is said to offerpotential efficiency gains (needed to turn around or restructure failing publicenterprises), new sources of funding (leveraged development) and projectrevenue enhancement (World Bank 1994; Hakim et al. 1996b; Payson andSteckler 1996). While governments may have access to cheaper credit, this isargued to be insufficient to outweigh inefficiencies arising from lax financialdiscipline, leading to cost overruns and delays in infrastructure construction(World Bank 1994). In this case, an efficient private operator who can reducecost and raise efficiency can theoretically raise money more cheaply as lendersface lower default rates.
Privatization problems
These well-known arguments for privatization are, however, problematicbecause the private sector is often unable or unwilling to finance capitalinvestment on its own, thereby necessitating state subsidies. Subsidies will
12 Privatization, rents and rent-seeking
also be needed for welfare reasons and to promote learning. These subsidiespotentially dilute incentives, thereby requiring continued state interventionin the form of regulation and subsidy management. As such, privatizationdoes not lead to the clear designation of property rights or finance capitalinvestment, especially in developing countries, and it does not reduce stateintervention.
Subsidies for capital costs, welfare and learning
The benefits of privatization are premised on the clear designation ofproperty rights where the private owner, as the residual claimant, has fullincentives to improve efficiency as this impacts directly on his or her residualreturns. This, however, requires that the private owner must either be ableto control revenue and/or bear risks. In reality, these incentives are dilutedand full divestitures have been limited because of: 1, the high capital costsand significant externalities associated with large-scale projects such as ininfrastructure; 2, welfare concerns (which constrain the implementation ofcost-covering tariffs); and 3, the lack of entrepreneurial capacity (whichnecessitates learning and ‘catching up’).
Contrary to privatization providing new funding sources for capital-intensive projects, large capital investments usually require some publicfinancing. This is because infrastructure development is characterized bylong-term contracts involving durable assets with high sunk costs, assetlumpiness, long gestation periods and uncertainty. Being capital-intensivemeans that turnover compared to investment is low, while long lead timesmean that the financing requirements during the initial stages of the work arehigh (Fayard 1999) yet revenue is low in the early years of the operation.Consequently, many infrastructure projects which offer positive economicand social benefits cannot break even (Poole 1996; Fayard 1999). Addition-ally, a higher price elasticity for demand leads to uncertain revenues, withinvestors expecting a higher rate of return given the higher risk (Payson andSteckler 1996). Private sector financing also costs more due to the possibilityof default, project-specific risks and limited liability (Sappington and Stiglitz1987a; Daniels and Trebilcock 2000). As a result, the private sector facesgreat difficulties in financing such high-cost, long-gestation projects withoutgovernment guarantees (to secure long-term loans) and tax breaks (to reducethe tax burden at the beginning of the loan period) (Windsor 1996; Fayard1999; Dunn 2000). The state must therefore either reduce the private sector’sshare of the cost, or its risk, to ensure the project is viable for private sectorparticipation (Heilman and Johnson 1992).
In contrast, the state can keep costs down by providing long-term loans,given that long maturity is more important than low interest rates (see Fayard1999) (provided that moral hazard problems can be mitigated because thestate as a financier is likely to be perceived as a weaker enforcer of changes inmanagement than a private financier). This is complicated by the perceived
Privatization, rents and rent-seeking 13

need for government financial assistance to encourage private participationto ensure that projects that have negative net private present value are under-taken (Daniels and Trebilcock 2000). This may also involve monopoly pricingor profit guarantees to attract investors or ensure project viability (e.g. seeKessides 2004).
Given the difficulties the private sector faces in financing capital intensiveprojects, privatization has increasingly involved some form of public–privatepartnership (PPP) (see Supiot 1996; Sparer 1996 and 1998; Saltman andFigueras 1998, all cited in Pongsiri 2001: 14), with the actual number ofcomplete divestitures being small, especially in sectors such as rail whereconcessions have been the dominant form of private participation (Kessides2004). A striking feature of PPPs is the high degree of government financialassistance because of the very high capital costs and the need to subsidizepublic goods or compensate for positive externalities. Despite the promiseof private sector investment in infrastructure with privatization, ‘utilityoperators around the world are having an extraordinarily hard time securingthe financing needed to maintain and expand services’ (Kessides 2004: 11),and subsidies and grants play an increasingly significant part of infra-structure investment in developed countries.
The sharing of risks leads to risk-incentive trade-offs as private incentivesare reduced where the risk is transferred back to the state (Heilman andJohnson 1992; Daniels and Trebilcock 2000). As risks have largely been borneby the public sector, there can be no clear designation of property rights asthe owner ‘cannot capture the whole social and economic benefits generated’nor would such a designation ensure efficiency and high levels of investment(Fayard 1999: 12–13). This means that the owner’s ‘residual’ depends justas much on government decisions as on performance in monitoring thework process, and this can significantly dilute the incentives to monitor inthe absence of adequate institutional arrangements and regulation. Wheregovernment subsidies finance the project, the government may constraindesign and construction options, but more importantly may be unwillingto let the project fail or terminate concessions given the ‘essential’ natureof public services and political repercussions of interruptions in theirprovision.
Operational subsidies will be needed where the private operator can-not charge cost-covering tariffs or fares. Cost-covering tariffs are usuallypolitically sensitive but remain a central element of investment-orientedregulation as this is seen to encourage efficient actions by consumers,suppliers and investors, promote financial viability and increase access toaffordable services (Kessides 2004). Past pricing policies by SOEs and subsidymechanisms are seen as seriously flawed as they undermined the financialviability of utilities, leading to chronic underinvestment and a deteriorationin service quality as subsidies are poorly targeted while distorted pricesimpose significant costs (Kessides 2004). As underpricing leads to under-investment, privatization is said to require aligning prices with underlying
14 Privatization, rents and rent-seeking
costs to attract investors, particularly if the private sector is expected to investin rehabilitating the system or expanding coverage (Kessides 2004).
The case for cost-covering tariffs is thus twofold. On the one hand, this isneeded to expand affordable services and access, especially for poor people.However, this will involve raising service charges which impact upon poorpeople. To counter this, it is argued that subsidized services (e.g. water,electricity and telecommunications) largely benefit the middle and upperclasses, and hence increased prices mainly affect these groups rather than thepoor. The privatization of utilities in Latin America, for example, is arguedto have hurt mainly the middle class (Morley 2000, cited in Cornia 2003). Onthe other hand, it is argued that ‘many poor people would be willing to payfor efficient services if they were offered’, and regulatory impedimentsto financial viability are said to be eliminated when utilities are allowed tocharge appropriate prices in a competitive environment (Kessides 2004:50–51).
In reality, cost-covering tariffs are often not possible because much of thepopulation in developing countries have a limited ability to pay for basicservices, and tariff increases usually encounter strong resistance (e.g. seeParker and Kirkpatrick 2002: 16; Estache 2003; Kessides 2004), not leastfrom the middle class. Not surprisingly, privatization has become increasinglymore unpopular, for example in Latin America and Sri Lanka (Zeufack2004). As such, the government is obliged to guarantee universal serviceprovision of basic services even after privatization. The general unwillingnessof populations in developing countries to pay for higher service charges isthe reason why governments have been unable (as opposed to unwilling) toimplement cost-covering tariffs. Subsidies will therefore be necessary foroperational viability if universal service obligations and public unwillingnessto pay higher charges prevent the implementation of cost-covering tariffs orfares.1 This is not to argue that cost-covering tariffs are unimportant in orderto attract private participation, as demonstrated by the withdrawal of UKfirm Biwater from a planned water project in Zimbabwe in 1999 becauseconsumers were too poor to pay the necessary tariffs to meet the company’sprofit projections (Parker and Kirkpatrick 2002). Rather, the choice isbetween cost-reflective tariffs which are politically difficult to implement, orlower prices but with subsidies to guarantee returns for private investors.Welfare and political considerations mean that the state will need to subsidizecapital and operational costs to help make privatization commerciallyfeasible for the private sector to invest in infrastructure.
Subsidies will also be required because many developing countries lack theentrepreneurial capacity in terms of depth (capabilities and technologies) andbreadth (a large enough pool of potential entrepreneurs) (e.g. see Jonesand Mason 1982: 25). Capital formation is not limited by political risk (i.e.the threat of state predation) (e.g. see Bates 2001) but rather the lack ofdomestic capitalists. As such, privatization is likely to be undertaken wherethe state is engaged in developing entrepreneurial capacity, and this will
Privatization, rents and rent-seeking 15
require subsidies for learning and ‘catching up’. Rather than merely imple-menting measures to encourage private investment, governments will thenneed to help the private sector in developing countries to acquire tech-nological and entrepreneurial skills, which requires learning-by-doing. Theoperation of enterprises during this critical period usually requires direct orindirect state subsidies (i.e. rents for learning or conditional subsidies)(e.g. see Amsden 1989; Wade 1990; Aoki et al. 1997; Khan 2000a, 2000b).
Regulation and management of subsidies
The necessity for subsidies discussed above will require continued, and insome areas, enhanced state intervention, both ex ante and ex post. The statemust be able to ensure that correct decisions are made ex ante in relationto what is privatized, to whom and how, the types of subsidies required, andthe appropriate regulatory framework. This will depend largely on its insti-tutional capacity and available information to make the right technicaldecisions. However, the state must also be able to make and implementdecisions post privatization in response to ex ante mistakes and changingentrepreneurial capacity (in the case of the management of learning rents).This will entail some element of ex post state discretion involving qualitativejudgements which are often arbitrary (i.e. how high to set targets, how muchsubsidy to provide, how much pressure to apply, when to withdraw subsidies,and when to replace private sector operators with new ones).
The management of learning rents in developing countries will thereforeentail a very different type of regulation involving political judgement andnot just technical requirements. This will require more dynamic regulatorystructures to respond to changing entrepreneurial capacity, and to pushentrepreneurs to levels previously not achieved and which cannot be achievedin the public sector. Regulation here is thus not just about providing a stableand predictable environment to encourage private investment, or to protectconsumer welfare in monopoly environments, but also to manage rents,especially those related to promoting learning and developing entrepreneurialcapacity. The ability of the state to intervene ex post to correct ex ante mis-takes and respond to changing circumstances will depend on the politicalcontext (in particular the balance of power in society that may allow orprevent some types of disciplining of entrepreneurs).
Political motivations for privatization
We have argued that privatization entails continued state intervention interms of providing implicit and explicit subsidies. Successful privatizationwill then depend on how well the state can design and manage these subsidies.As discussed above, the ability of the state to intervene effectively, particu-larly to correct ex ante mistakes, will be politically circumscribed, dependingon the state’s strength in relation to the groups receiving subsidies. This will in
16 Privatization, rents and rent-seeking
turn depend on the political context in which privatization is undertaken.Here, conventional arguments for privatization are based on the assumptionthat developing countries privatize mainly for economic reasons (e.g. seeHemming and Mansoor 1988; Kikeri et al. 1994; Plane 1997). The failurehere to account for the political motivations behind privatization restricts ourunderstanding of the character of privatization in many developing countriesin terms of what is privatized, how and to whom, and the effectivenessof related institutions and state intervention, which are central to our assess-ment of privatization. As such, this approach cannot explain why privatiza-tion may fail, and why weak institutions persist.
Privatization is an inherently political process as ‘what is privatized andhow represents the state’s continuing intervention within the economy,favouring certain capitals at the expense of others’ (Fine 1997: 376; also seeVickers and Yarrow 1991). Different constellations of political interest willthus produce different levels of political response to pressure for privatization(Cook and Minogue 1990: 29; also see Cook 1997). Privatization may beundertaken as part of state attempts to develop domestic entrepreneurialcapacity to meet developmental objectives, or be politically motivated (e.g. bypowerful groups contesting resources and political leaders wishing to securesupport through the distribution of economic resources to these groups).Decisions to ‘establish, retain or divest a public enterprise are thus not madein a political vacuum’ and ‘ownership and control of economic units areinstruments for advancing certain interests and frustrating others’ in thestruggle for power among various interest groups (Jones and Mason 1982:16; also see Cook and Kirkpatrick 1988). As politics will drive decisionsto privatize (Parker and Kirkpatrick 2003), who benefits depends on whichgroups are more powerful and influential. The nature and outcome ofprivatization will therefore be affected by the balance of power in society. So,while there may often be economic (fiscal and efficiency) reasons, privatiza-tion will usually be pushed through by groups which stand to gain the mostand will only be introduced if it is politically feasible to do so, namely wherethe balance of power in society favours its introduction.
This balance of power, and the character of the groups contesting andpotentially benefiting, will in turn shape the nature of a country’s privatiza-tion programme. In developed countries, privatization is usually awardedto existing capitalists most capable of financing and running former stateenterprises. This is not the case in developing countries where there is a lackof entrepreneurial capacity and where groups contesting for privatizationprojects may not be capitalists but often members of an ‘unproductive’intermediate class who are politically powerful or well-connected. This willinvariably affect how privatization is undertaken in terms of the chosenindustries, mode of privatization, choice of candidates as future owners, thechoice of regulatory structure, and performance (outcome), particularlywhere privatization is used to develop domestic capitalists. This allows us toaddress one of the paradoxes in public choice theory: why should politicians
Privatization, rents and rent-seeking 17

and bureaucrats support privatization if this is not in their interest? Here,privatization will be politically motivated where it offers opportunitiesfor certain groups (including politicians and bureaucrats) to captureresources. Understanding the political context and motivations for privatiza-tion thus helps explain the character of privatization which allows us to thendetermine why privatization may fail and what conditions are necessary for itto work.
Why may privatization fail?
Conventional arguments for privatization blame failure on weak political andeconomic institutions, the problems of patronage and corruption associatedwith these, and arbitrary state intervention in many developing countries. Asa result, privatization is characterized by poor choices, poor implementationand weak regulation, with a lack of credible commitment to contracts orpolicies. There are two problems with this explanation. First, it does notlocate institutional failure within a country’s political context nor accountfor political motivations. This is important given that institutions are theoutcome of historical and political factors. This will then allow us to explainwhy weak institutions may persist, and to come up with more appropriatesolutions to improve the state’s regulatory capacity. Looking at a country’spolitical context will also help us correctly identify the motivations forprivatization. As discussed in the previous section, privatization will often bepolitically motivated, especially in developing countries. This will affect whatis privatized, how and to whom. Second, and as a result of this, privatizationwill entail regulation which goes beyond conventional views of regulation inthe context of market failure. Hence, rather than simply promoting com-petition and safeguarding property rights (to encourage private investment),regulation will be needed to deal with diluted incentives arising fromsubsidies for capital costs, welfare considerations and learning (to developdomestic entrepreneurial capacity).
The success of privatization then depends on the effectiveness of stateregulation in the context of managing these subsidies. This will depend onthe state’s institutional and political capacity. The failure of privatizationcan thus be due to institutional or political failure. As mentioned earlier,institutional failure refers to the absence of, or weaknesses in, political andeconomic institutions which affect the choice, implementation and regulationof privatizations. Political failure refers to the inability of the governmentto enforce regulation. As we shall see, both explanations of failure are basedon different conceptions of what privatization involves, and thus providedifferent recommendations for successful privatization. Both institutionaland political failures represent state failures which can occur before (ex ante)or after (ex post) privatization. It will be argued that political failure, inparticular the state’s ex post failure, is more serious and provides a moreuseful explanation for the failure of privatization because mistakes are bound
18 Privatization, rents and rent-seeking

to occur ex ante due to informational constraints and political considerationswhich affect the choice of privatization.
Conventional explanations of failure
Weak political institutions
The view that failure is due to weak institutions is grounded in the NewInstitutional Economics (NIE) which seeks to explain (market) failure interms of transaction costs, imperfect information, the structure of propertyrights and collective action problems (Clague 1997a; Williamson 2000; alsosee Bardhan 1989b). For the NIE, underlying the failure of privatization indeveloping countries is the problem of political interference which is seento undermine regulatory independence, thereby affecting private investmentand incentives. Governments in developing countries are viewed as corruptand incompetent, lacking credible commitments not to intervene, failingto safeguard property rights and being incapable of implementing proper,consistent regulatory procedures. As a result, privatization in developingcountries is poorly implemented and regulated, lacking regulatory inde-pendence and credibility, and subject to widespread corruption, regulatoryand political capture, and arbitrary political intervention (Tullock 1967;Stiglitz 1971; Krueger 1974; Bhagwati 1982; Laffont 1996, cited in Kessides2004: 80; Daniels and Trebilcock 2000).
Corruption, patrimonialism, cronyism and clientelism are seen to createserious problems for public administration in developing countries(Theobold 1990, cited in Parker and Kirkpatrick 2002: 13; also see Boeker1993, cited in Plane 1997: 364; Cook and Kirkpatrick 1995; Parker and Kirk-patrick 2003). Corruption has been blamed for the failure of privatizationin Zambia and many parts of Africa, India and a number of transitionaleconomies (Tangri 1999; Tangri and Mwenda 2001; Craig 2000, 2001, allcited in Parker and Kirkpatrick 2002: 14; University of Greenwich 2001;Meseguer 2002, both cited in Parker and Kirkpatrick 2003). The absence ofregulatory independence is also argued to be a major reason for the failure ofprivatization in developing countries, made difficult by deliberate governmentactions and a lack of understanding of the importance of separation ofpowers (Kessides 2004). Regulatory capture is associated with a weightingwhich favours producer over consumer surplus, while political capture occurswhen regulation becomes a tool of self-interest within government or theruling elite. The latter is considered a much greater risk given the problemsof credible commitment, history of arbitrary administrative intervention,and discretionary use of executive power said to characterize developingcountries (Stiglitz 1998, cited in Parker and Kirkpatrick 2002: 8; Pongsiri2001; Kessides 2004).
The state’s lack of credibility to commit to contracts or policies isattributed to weak political and economic institutions which safeguard
Privatization, rents and rent-seeking 19
contracts and property rights (e.g. see Clague 1997b; Williamson 2000). Theabsence of democracy and transparency means that ‘policies are changed byabsolute decree with no prior notice’ and ‘bureaucrats may have a great dealof discretion in the application of business regulations’, with their decisionsbeing unpredictable (Clague 1997b: 25–26). The underlying assumption hereis that state intervention is potentially damaging and the state is prone topredation, which makes it necessary to limit the scope of state interventionto the enforcement of contracts and property rights, while making crediblethe threat not to confiscate or intervene arbitrarily.2
Here, democracy is the best way to safeguard property and contractualrights by preventing arbitrary state intervention (e.g. see Clague et al. 1997;Haggard 1997; Bates 2001). Democracy is said to reduce the incentive ofpolitical leaders to redistribute because the majority or ruling group has amore ‘encompassing interest’ in society’s productivity (e.g. see Olson 1997;Olson and Kahkonen 2000). An autocrat, in comparison, may also have anencompassing interest in the society, but is seen to have the power and incen-tive to unilaterally confiscate assets whenever he has a short-term horizon.The literature does not explain why democratically elected leaders shouldhave longer-term horizons given their usually limited terms in office com-pared to many autocrats, or how democratic institutions could provide sucha credible commitment not to confiscate (e.g. see Przeworski and Limongi1993). Instead, it is argued that a democracy provides for more secureproperty and contract enforcement rights because it constrains politicalleaders from repressing the political rights of opponents or eliminating thevital interests of losers given that political tenure is limited (Clague et al.1997; Olson 1997; Olson and Kahkonen 2000; Leftwich 2002).
Weak economic institutions
The benefits of privatization come from changed incentives for privatizedfirms which depend on the competition and regulation facing such firms(Vickers and Yarrow 1991). The fundamental privatization theorem statesthat ‘when certain conditions are satisfied, government involvement cannotimprove upon the performance of the private market’ (Sappington andStiglitz 1987a: 568). Here, privatization failures are analogous to marketfailures, and have been blamed on weak economic institutions in developingcountries (compared to developed countries), exacerbated by political inter-ference and corruption as discussed above. It is for these reasons that therelationship between privatization, incentives and efficiency are believed tobe less clear-cut, and the differences between public and private ownershipin developing countries is less distinct than in countries with stronger institu-tions and private sectors.
A number of regulatory failures have been identified, based on a com-parison of institutional structures between developed and developingcountries (see Noll 1999; Stern and Holder 1999; Cook 1999; Brownbridge
20 Privatization, rents and rent-seeking

and Kirkpatrick 2000, all cited in Parker and Kirkpatrick 2002: 2).Developed countries are seen to have competitive product, capital andlabour markets; protected and well-defined property rights; well-understoodstandards of business conduct; and relatively high standards of probityin public administration. In contrast, developing countries are said to becharacterized by imperfectly competitive and incomplete markets; under-developed capital markets; weak management and patronage in appoint-ments; poorly protected private property rights; weak business ethics; andlow standards of public administration, including cronyism and corruption(Parker and Kirkpatrick 2003: 23).
Furthermore, regulatory frameworks in developing countries are seen asfragmented and lacking in coherence (Kessides 2004), constrained by the lackof technical expertise, insufficient institutional preconditions (including alack of checks and balances, and weak auditing, accounting and tax systems),a resistant political and administrative culture, and opposition fromorganized labour (Parker and Kirkpatrick 2002; Kessides 2004). A study ofinfrastructure regulation in six Asian developing countries (Bangladesh,India, Indonesia, Malaysia, Pakistan and the Philippines) found significantweaknesses in coherence, independence, accountability, transparency andpredictability (Stern and Holder 1999, cited in Kessides 2004: 91).
Problems with conventional explanations
Conventional explanations focussing on institutional failure essentiallylook at ex ante failure, namely mistakes made before privatization. Thisincludes the state’s failure to determine the viability of a privatization projectand is usually, though not wholly, related to information and institutionalfailure. Decisions may be based on insufficient or incorrect information, and/or the government may choose to privatize without the necessary institutionsor procedures in place. The emphasis here is on strengthening institutionsto encourage private investment (by reducing corruption and arbitrarypolitical intervention) and promoting efficiency (by maintaining competitivepressures). This usually involves good governance measures at the broaderlevel (i.e. democracy, transparency and accountability), and substantiveprocedures in the case of privatization (i.e. transparent selection, clearlyspecified contracts and predictable regulation). This approach is problematicbecause ex ante mistakes will invariably occur as a result of informationconstraints, thereby compromising the choice of candidates, contractspecification and regulation. Furthermore, while these measures are desirablein themselves, they are based on an ahistorical reading of institutionaldevelopment and a restricted view of privatization in developing countrieswhich do not take into account political factors and why privatization may beundertaken.
Privatization, rents and rent-seeking 21

Information constraints
Arguments to improve institutional arrangements are based on conventionalexplanations of privatization failure as a result of weak institutions. As such,proposed solutions generally emphasize the need to strengthen the selectionprocess, contract specification and regulation. However, the state’s abilityto make the correct decisions in these three areas will be constrained byimperfect information.
Conventional explanations stress the importance of transparency andcompetition in the selection process (e.g. see Kikeri et al. 1994). Competitivebidding is central as it ensures transparency and the most efficient outcomeby stimulating interest across a broad range of potential partners. Awarding aconcession to the bidder proposing the lowest future tariff levels, for example,indicates the highest efficiency. However, competitive bidding is dependent onthe quality of available information and incurs significant transaction costswhich the government must shoulder (Weber 2002). Information is neededso that bids are realistic and viable (in terms of risks to the private sector)as poor-quality information results in underbidding and renegotiations(Stottmann 2000). More crucially, a transparent selection process (even if thiswas politically possible) does not guarantee that the chosen candidate will bethe most efficient as the government is unable to properly screen applicantsdue to asymmetric information. Here, the winning bidder may not be themost efficient, conform closest to government objectives or be the one whovalues the asset the most, but simply the most optimistic about the futureprice of the asset, the best at price discrimination or the most likely to defaulton promises (Sappington and Stiglitz 1987a; Stiglitz 1996); or may have thegreatest ex post bargaining ability, especially if there is the possibility ofrenegotiation (without competition) (Kessides 2004).
The requirements for domestic ownership or control in developingcountries also mean that expertise is usually secured through a technicalpartnership with a foreign party. This means that the local owner or conces-sionaire need not have the requisite expertise or experience so long as this canbe obtained from overseas. Hence, selection here will not necessarily be on thebasis of the most competitive bidder but rather the best politically connectedbidder. Indeed, this is an important criterion for foreign companies seeking alocal partner to secure privatization contracts in developing countries.
More importantly, inappropriate candidate choice may not lead to failureif this can be remedied through learning rents and clearly specified incentivesand penalties. The key difference between developed and developingcountries in the context of asymmetric information is that inappropriatecandidates can be more easily disciplined through the threat of replacementin the former where there are less constraints on entrepreneurial capacity.The institutional design of the process of divestment can also matter. Forexample, if the enterprise is first leased out before being privatized, non-performing candidates may be more easily replaced (e.g. the concession can
22 Privatization, rents and rent-seeking
later be given to someone else), but reallocation may not be as easily carriedout if outright privatization is the first step. As ex ante mistakes will invari-ably occur in the selection process, transparency is less important than thestate’s capacity to correct mistakes arising from political and informationconstraints.
Successful privatization is also argued to depend on contract specificationto clearly allocate risks and establish accountability. The contract needs toaddress the problems arising from the divergent interests of the governmentand private sector, and an incentive-accountability structure is neededespecially when partners have separate interests (Rosenau 2000b). How risk isshared is directly related to the incentive structure of the contract (Heilmanand Johnson 1992).
However, contract design is also constrained by imperfect information,namely the inability to specify all future contingencies, leading to incompletecontracts (where it is not possible to fully specify incentives and risks) andinevitable contract renegotiation. Ex post contract renegotiations are there-fore likely where the quality of information is poor at the start, and thepossibility of early renegotiation may in turn lead to unrealistically low bids(Dnes 1995, cited in Kessides 2004: 106). The high incidence of contractrenegotiation has been blamed on political interference, opportunisticbehaviour and flawed contract design (Guasch et al. 2003, cited in Kessides2004: 107). However, as it is neither possible (due to asymmetric informationand the inability to predict the future) nor desirable (in terms of the flexibilityto deal with the circumstances arising from future uncertainties) to designcomplete contracts, governments and firms agree to performance standardsthat can be modified to fit contingencies, with contracts often providingloopholes or relying on loose parameters of fulfilment (MacNeil 1978,cited in Weber 2002: 49). As such, contract renegotiation (and post-contract opportunism) almost always remains a reality (e.g. see Parker andKirkpatrick 2002).
Furthermore, contract renegotiation appears to result in regulatory, asopposed to political, capture in developing countries (Kessides 2004).Evidence shows that contract renegotiation has been high in Latin America,especially in transport (where 50 per cent of contracts were renegotiated)and water (75 per cent renegotiations), with two out of every three of theserequested by the operator and leading to increased tariffs or reduced invest-ment (Estache 2003). The ability of the state to enforce contracts thenbecomes more important than actual contract design as ‘(e)ven the best con-tracts – those that clearly specify terms of fulfilment and breach – must beenforceable in order to be effective in practice’ (Weber 2002: 48).
This is especially important as contracts are not only limited by incompleteinformation but also by the limits of liability and enforcement. As there arebounds on the losses the contractor can be forced to bear (e.g. due tobankruptcy laws or political considerations), the contractor may renege onthe contract rather than deliver. Hence ‘with feasible penalties for failure that
Privatization, rents and rent-seeking 23
are dwarfed by the social losses that would result from failure, the privateproducers cannot be induced through monetary means to invest theappropriate level of effort to prevent failure’ (Sappington and Stiglitz 1987a:573). Contract enforcement is further limited by the prohibitively high costsof enforcement and the perception of being anti-business and deterringpotential investors (Weber 2002). The key condition here is thus one of con-tract enforcement and credible sanctions by the state to ensure that theprivate sector fulfils its obligations, especially where subsidies are involved.The failure to do so, rather than poor contract specification, provides a betterexplanation why privatization may fail.
Finally, successful privatization will depend on the regulatory framework.Regulation is needed as it is not possible to fully specify incentives andrisks in a contract, and because the natural monopoly features of publicinfrastructure projects limit competition and hence incentives for efficiency.Regulation is thus conventionally seen as necessary to address three broadclasses of market failure: imperfect competition, imperfect information andexternalities (Sappington and Stiglitz 1987b). Following from this, the discus-sion of regulation is largely restricted to preserving incentives for efficiency inthe absence of competition. Competition is seen as preferable to regulationbecause competitive markets are believed to generate superior knowledge ofconsumer demands and producer supply costs. In other words, the socialwelfare results of regulation remain ‘second best’ as the regulator does nothave sufficient information to regulate optimally to maximize social welfare(Sidak and Spulber 1998, cited in Parker and Kirkpatrick 2002: 8). As such,measures to promote competition such as through unbundling and isolatingmonopoly segments is preferred as these also reduce the need for regulation(World Bank 1994; Kessides 2004).
Here, the emphasis is on ‘good governance’ measures (independence,transparency, predictability, accountability and credibility) in order to safe-guard the private sector from arbitrary interventions, thereby providing astable and predictable environment which encourages private investment(e.g. see Levy and Spiller 1993). A set of substantive procedures follow fromthese guiding principles aimed at promoting regulatory independence,accountability, commitment and credibility (e.g. freedom from political inter-ference; adequate funding; judicial appeals; transparent decision-makingprocesses) (Parker 2001; Smith 1997, cited in Kessides 2004: 85). Discussionof the state’s regulatory capacity has therefore generally focused on narrowtechnical and institutional requirements, namely financial and humanresources (i.e. qualified personnel with regulatory expertise) and coherence(i.e. clearly defined responsibilities between different agencies and govern-ment departments), with the choice of regulation dependent on the regula-tory authority’s technical capacity and available information. For example,both price cap regulation and rate of return regulation3 require extensive andreliable information on all aspects of the utility business to determine theappropriate benchmark (or price cap) and rate of return, while sophisticated
24 Privatization, rents and rent-seeking

regulatory training and technical ability are needed to calculate realisticbenchmarks.
However, regulation will be compromised by imperfect information. Bysharing some of the capital costs or subsidizing the operator in return forlower tariffs, the private owner’s residual return no longer has a one-to-onerelationship to effort in management. The presence of asymmetric informa-tion means that managers are much better informed about industry con-ditions and their behaviour can be monitored only imperfectly (Vickers andYarrow 1995). This makes it even more difficult to determine the operator’sactual costs and profits, and hence, the appropriate amount of subsidies orlevel of price cap. This creates disincentives by encouraging the operator toartificially inflate costs. Privatization therefore does not solve the problems ofincentives and monitoring, and entails greater regulation to monitor thesesubsidies, particularly to ensure that performance targets are met. And if thestate has to monitor and sanction subsidies, this raises precisely the types ofquestions about incentives and constraints in the state sector that were usedto explain the underperformance of public enterprises in the first place.
More critically, this is a narrow view of what regulation entails in privatiza-tion. Regulation will also involve managing subsidies and enforcing dis-cipline to ensure performance targets are met, and not just safeguardingprivate investment and promoting competition. The issue of rent manage-ment becomes central to the regulatory framework if these rents are to leadto efficient outcomes (Khan 2004). Effective regulation depends not just oninstitutional capacity but more so on the state’s political capacity, as regula-tory effectiveness is constrained by the capacity of governments to enforceregulatory rules (e.g. see Cook 1999). This includes the power to efficientlyallocate – and reallocate – property rights and subsidies (i.e. to replace ownersand concessionaires, or withdraw subsidies) and implement difficult decisionsdepending on the type of privatization and sector.
In developing countries, this may involve coordinating capital andoperational decisions to integrate sectors such as transport networks, andoverriding public opposition to tariff or fare increases if this is needed toensure commercial viability. It may also require the political capacity toprovide subsidies with the appropriate credible threats to prevent moralhazard problems and sustained inefficiency of the private sector replacingthe inefficiency of the public sector. The state’s ability to subject firms tomarket discipline therefore depends not just on its regulatory capacity(e.g. see Kessides 2004) but more explicitly its effective political capacity (seeKhan 2004), especially as high-density narrow-interest groups may develop,leading to pressure for protection and other types of subsidies (Olson 2000;also see Krueger 1990). From this perspective, the failure of privatizationis due to the state’s ex post failure to correct mistakes and manage rents. Abroader view of privatization and regulation must therefore take into accountthe political context and motivations behind the decision to privatize.
Privatization, rents and rent-seeking 25

A historical view of institutions
Conventional institutional recommendations are unrealistic as they arebenchmarked against Western norms that do not account for the politicalrealities in developing countries nor explain the performance of countries inEast Asia which industrialized without these institutions in place. For thatmatter, they do not even reflect the experiences of advanced countries atsimilar stages of their economic development (e.g. see Chang 2002; Huberet al. 1993).
There is no clear correlation between governance indicators (such asdemocracy and transparency/low corruption) and performance (e.g. seePrzeworski and Limongi 1993; Khan 2004). This claim is a fairly recent onegiven that democracy (i.e. universal suffrage and the freedom to form unions)was historically seen to threaten property rights (Przeworski and Limongi1993). Rather, democracy in Europe was the outcome of shifts in the balanceof class power as a result of capitalist development which transformedthe class structure, enlarging the working and middle classes (e.g. seeHuber et al. 1993). That is to say, institutions are a product of both social,economic and political history, and current conditions (e.g. see Parker 2001),and institutional change depends on the nature of social relations and thebalance of power in society, with the emergence of efficiency-improvingarrangements affected by redistributive considerations (Bardhan 1989b;Parker and Kirkpatrick 2002). This perspective gives us a different set ofinsights when we try to make sense of the constraints facing privatizationstrategies.
The experiences of advanced countries and late industrializers duringtheir transition to capitalism demonstrate that the allocation of new propertyrights, through political processes that implicitly grants some individualsmassive rents, is an important part of the process of capital accumulation(Khan 2004). This process has not been transparent and indeed, corruptionhas played a historical role in the emergence of the entrepreneurial class inEurope (Bardhan 1997). In the case of South Korea in the 1980s and 1990s,more recent evidence reveals substantial corruption was involved in theallocation of new property rights or rents. As competition for resourceswill be intense and thus more heavily contested in developing countries, thecreation of new property rights (e.g. through privatization) is unlikely to beallocated through transparent processes but instead in personalized and par-tisan ways, and through patron–client networks (Khan 1998, forthcoming).
As such, anti-corruption measures will be difficult to implement as itmay not be in the interest of the state or powerful groups. Moreover, wherenon-capitalist or unproductive groups are politically dominant, efforts topromote good governance institutions such as democracy may simply lead topolitical capture by these groups becoming easier. Political and nationalisticconsiderations also prevent privatization to specific ethnic groups or foreigninterests (Cook and Kirkpatrick 1988; Parker and Kirkpatrick 2003), further
26 Privatization, rents and rent-seeking

limiting the pool of acceptable candidates. As such, focusing on corruptionignores the intrinsically political nature of privatization which often cannotbe undertaken using transparent processes. Here, weak institutions are oftenthe outcome of political factors as well as a cause of failure.
Political failure
As privatization entails continued state intervention, its success depends onthe effectiveness of this intervention. This includes the institutional capacityto make the correct ex ante decisions relating to the choice of candidates,contract specification and regulation. However, as discussed in the previoussection, ex ante decisions will invariably be compromised by imperfectinformation and the political context in which privatization is undertaken.This can affect state decisions and institutional arrangements, leading to pooror incorrect choices. Thus, while it is important for the state to have theinstitutional capacity to make the right decisions, it must more importantlybe able to implement these, correct any ex ante mistakes which result frominformation constraints, and respond to changing entrepreneurial capacityin relation to the management of learning rents. That is to say, privatizationcan fail because: 1, the state has failed to clearly specify terms and conditionsof subsidies, thereby failing to preserve incentives for the private owner oroperator; 2, the state may make the correct decisions but be unable to imple-ment these, in which case failure will be in enforcing conditions which mustaccompany any subsidy programme; and/or 3, the state is aware of decisionswhich turn out to be incorrect ex post, but is unable to rectify these. Thefailure to implement policy and to correct ex ante mistakes represent ex postpolitical failures, and this can provide a more useful explanation for thefailure of privatization in the context of developing countries.
The political motivations that usually drive privatization in developingcountries can explain why ex ante failure often occurs (e.g. where privatiza-tion proceeds despite the lack of sufficient information and viability, orwithout proper institutions in place) as powerful interests ‘may be pushingsome forms of privatization that are economically not sensible but politicallydifficult to avoid’ (Roland 1994: 1161). This will affect the choice, imple-mentation and regulation of privatizations, as well as the accompanyinginstitutions. The persistence of weak institutions (i.e. weak procedures,regulatory frameworks and regulatory capacity) may, in this perspective, be areflection of a wider political failure on the part of the state to strengtheninstitutions given the existing balance of power in society. The choice ofprivatization will be in part shaped by the strength of groups which standto gain. Hence, where there are powerful but ‘unproductive’ groups, privatiza-tion could involve non-competitive sectors, usually infrastructure construc-tion or former state monopolies. This has often been the case in developingcountries.
This means that the efficiency gains from private operations or ownership
Privatization, rents and rent-seeking 27
is not guaranteed, and successful privatization will depend on state supportto help finance the privatization, subsidize any operational losses where cost-covering tariffs may not be possible, and promote learning in order to developthe necessary entrepreneurial capacity to run the enterprise efficiently. Thisis more important than the choice of candidate because the lack of skillsand capital can theoretically be addressed through learning rents and statesubsidies. Whether privatization leads to learning and efficiency gains willtherefore depend on the ability of the state to manage these subsidies. Thisentails a different sort of regulation, one which requires the institutionalcapacity to make the right decisions, but more importantly, the politicalcapacity to credibly enforce sanctions where performance targets are notmet (Khan 2004), especially where implicit subsidies are involved in thedetermination of the sale price, and where there are learning rents to developentrepreneurial capacity. Rather than committing not to intervene, the statemay also have to intervene arbitrarily and possibly even reallocate propertyrights where necessary. The failure to do so represents the state’s ex postfailure and is more important as this is more difficult to correct than insti-tutional or ex ante failure.
In the case of developing countries, it may be difficult to reallocate anenterprise to an alternative entrepreneur because appropriate alternativeentrepreneurial capacity may not be available and political constraintsmay prevent reallocation of assets away from powerful or well-connectedindividuals. As there may be no efficient entrepreneurs ex ante, and in somecases no entrepreneurs at all in that particular sector, the allocation ofresources through privatization is bound to involve some degree of arbitrari-ness in developing countries. The purpose of privatization is indeed oftento create entrepreneurs. Thus the choice in most developing countries isnot between unproductive and productive entrepreneurs, but rather to ensurehow ‘one can transform into the other depending on the relationship withthe state and the state’s ability to effectively enforce growth-enhancinginstitutions’ (Khan 2004: 34).
In other words, there is no reason why inappropriate candidates cannotbe made productive provided there are sufficient incentives, learning rentsand credible state sanctions. (Conversely, it is crucial that the state is able toensure that productive groups do not become unproductive.) In addition,the state’s ex post capacity may be further constrained by public serviceobligations and also national considerations. This can lead to moral hazardproblems where privatization involves important enterprises (e.g. a nationalairline) or projects (e.g. public infrastructure) as it cannot easily substitutenon-performing private owners, yet it is also politically unfeasible to let theenterprise or project fail, even more so if this involves the provision of apublic good (e.g. water or sewage treatment). The choice then is betweensubsidizing the private firm in order to ensure continued service provision or,as a last resort, renationalizing the project. Here, renationalization representsthe ultimate failure of privatization. The state’s political failure to manage
28 Privatization, rents and rent-seeking

subsidies in this context can therefore provide a more important explanationfor the failure of privatization.
Without accounting for this type of political context, the discussion ofcorruption and ‘good institutions’ is also meaningless as the persistenceof weak institutions cannot be explained. As privatization policies areembedded in social relations, ‘cultural and political assumptions and factorsrelated to privatization need to be analysed . . . in a dynamic perspective intheir own right, allowing for a fuller understanding of how they relate tothe privatization process’ rather than being treated ‘simply as barriersto economic development’ (Torp and Rekve 1998: 91, cited in Parker andKirkpatrick 2003: 16). This can account for regulatory or political capture insmall, poor countries where the regulator is more likely to be too weak toavoid capture by powerful interest groups (Noll 2000c, cited in Kessides 2004:102), and in societies with a culture of cronyism and clientelism, particularlyin developing countries with strong family loyalties, clan systems and culturalnorms favouring relationship contracting (Guasch and Hahn 1999: 137, citedin Parker and Kirkpatrick 2002: 13). The failure to correctly identify thesesources of state failure has partly accounted for the mixed performance ofprivatization in developing countries.
Many aspects of state failure particularly in the context of privatizationcan usually be traced to political constraints posed by the balance of power insociety. Even when regulatory institutions appear to be appropriate, they mayfail because of an incompatibility of the institutions with the existing balanceof power that prevents effective implementation (also see Levy and Spiller1993: 249). As the state’s political capacity, in particular its ex post capacityto enforce sanctions and discipline, is central to the success of privatizationin developing countries, it is important to examine the sources of, and con-straints on, state capacity in order to identify the factors that may lead tostate failure. These will then enable us to prioritize the important conditionsfor successful privatization.
The discussion of state capacity has been central to developmental statetheories.4 These theories provide useful lessons by examining the sources ofstate capacity and the state’s ability to manage (learning) rents. The dis-cussion here is closely related to the conditions in which privatization maybe undertaken in developing countries. Here, state capacity has been definedin terms of the strength or capacity to implement economic policieseffectively, and ability to exercise a large measure of control over thebehaviours of domestic and foreign capital (Koo and Kim 1992). The statemust be able to manage conflict (e.g. between different segments of capital),allocate resources to the most productive sectors and enforce discipline. Itmust be able to construct economic rules that advance the long-term interestsof capital and technological character of the nation as a whole, and as such,promote growth (Pempel 1999: 142). The success of the East Asian lateindustrializers (initially Japan, and later Taiwan and South Korea) hasbeen attributed to the state’s ‘embedded autonomy’ – the combination of an
Privatization, rents and rent-seeking 29
autonomous bureaucracy (i.e. ‘Weberian bureaucratic insulation’) and thickexternal ties to the economy’s organized agents (Evans 1994: 96). That isto say, the state needs to be insulated enough to be able to independentlyformulate and implement policy, but also connected to productive groups insociety.
Bureaucratic capacity, coherence and autonomy from societal forces aresaid to provide the ability to devise long-term economic policies withoutinterference from private interests. This ‘coherent meritocratic bureaucracy’is said to have strong internal networks based on a strict selection processrequiring formal competence rather than clientelistic ties or traditionalloyalties (Johnson 1982; Evans 1994). It is the implementation of strategiesby a comparatively autonomous technocratic elite and the institutionalizingof close relationships between business leaders and state officials in theformation of a dynamic export-oriented regime of capital accumulation thatis seen to characterize the developmental state (Johnson 1982). As capitalaccumulation demands close connections to private capital, such connectionshave to be with industrial capital, enabling state elites to incorporate thesepowerful groups in the state’s economic project (Evans 1995).
The nature of this state–capital relationship is seen as one of ‘strategicinterdependence’ between both parties, where there is a mutually dependentrelationship between government and big business (Barzelay 1986, cited inChoi 1993: 23–24) and in which both must feel that their own success dependson the fortunes of the other partner (Vartiainen 1999). The concept of thedevelopmental state means that ‘each side uses the other in a mutually bene-ficial relationship to achieve developmental goals and enterprise viability’(Johnson 1999: 60). The state’s embedded autonomy is seen to provide itwith the ‘infrastructural power’ or ‘transformative capacity’ to coordinateindustrial change by ‘penetrating’ and ‘extracting’ resources from societyand allocating them to desired ends, shaping incentives through coordinateddecision-making to ‘elicit desired behaviours’ (Mann 1991, cited in Felker1998: 87; Weiss and Hobson 1995; Weiss 1998; also see Rodrik 1995 andBardhan 2000). Here, state capacity is not about strong or authoritarianstates or coercive power to forestall political challenges, but rather ‘negotia-tive power’ to negotiate rudimentary reciprocity between political and eco-nomic actors (Weiss and Hobson 1995). The diversity in state structures,state-economic linkages and interstate relations inform the autonomy,strategies and capacities of modern states to facilitate industrial change(Weiss and Hobson 1995).
However, the relationship between the state’s autonomy and its capacityis ambiguous (e.g. see Crone 1995; Fine 2003), where state capacity is oftenequated with autonomy or insulation (e.g. see Mackie 1995; Gomez 2002b),and state autonomy linked with efficiency (e.g. see Rowthorn and Chang1993). It is also unclear whether a developmental state is autonomous orresponsive to capitalist interests. On the one hand, this positive state–capitalrelationship is seen to allow the state to implement policies in favour of
30 Privatization, rents and rent-seeking
business (Koo and Kim 1992). South Korea’s developmental policies in the1960s and 1970s are said to derive largely from the consistency of its policyimplementation in favour of large capital which in turn ensured businessconfidence and a favourable investment climate, with both business cartelsand state economic bodies ‘committed to high growth, realising that theywould have to swim or sink together’ (Pempel 1999: 164). On the other hand,the South Korean state was also largely autonomous of business since itcould choose to damage business interests (e.g. as in the case of the Kukjechaebol) when state demands for bribes or political subservience were notmet (Khan 2004: 178).
What is important here is the nature of the state’s relations with socialgroups and the composition of these social groups. In some cases, theremay not even be a capitalist class to undertake economic investment. Wherecapitalists are absent from these groups, the task of the state is to transformselected candidates into capitalists. This will involve the creation of newproperty rights (e.g. through privatization) and supported with learningrents and other subsidies. The state’s ex ante ability to select winners in thiscontext will very likely be determined by its political strength relative to thosecontesting (e.g. see Cook and Minogue 1990; Haggard and Maxfield 1999).The main lesson from the South Korean case is that effective state inter-vention was possible because the state could enforce decisions by penalizingpoor performers and rewarding good performers (Pempel 1999). Here, thestate could allocate and reallocate property rights and subsidies becauseSouth Korean history was such that organizationally powerful intermediateclass social factions who could be purchased to protect inefficient industrieswere simply absent, and at the same time, there was a sufficient pool ofpotential candidates for the capitalist class which allowed the state to replacenon-performing capitalists relatively easily. As such, resources could beallocated without significant political constraints to efficient entrepreneurs,and these were also the entrepreneurs who could offer the highest payoffs tothe state (Khan 1998). In principle, the state could enforce both predatoryand developmental actions, but chose the latter as this offered bigger payoffsin the long run.
In contrast, most developing countries typically have powerful factions,often led by unproductive social groups who can, for a price, protectinefficient enterprises. These countries also have a far more limited pool ofqualified candidates to select from and impose discipline on through thethreat of replacement. These conditions can effectively constrain the state’sex post ability to transform those initially selected into efficient capitaliststhrough the efficient management of rents. State capacity thus does not onlydepend on the state’s reach (its connections with capitalist groups or otherproductive relationships) but also its ability to overcome political constraints(i.e. resistance to disciplining). Hence, while the South Korean state couldmaximize rents extracted from capitalists and at the same time ensurecompliance with productivity maximization, many developing country states
Privatization, rents and rent-seeking 31

are faced with the problem of incompetent (non-capitalist) candidates whoare also harder to discipline.
As the state’s connection with society in developing countries may not beproduction-oriented alliances but rather with unproductive ‘non-capitalist’classes created and brought together by the colonial legacy and struggle forindependence, these groups have had to be accommodated. These groupshave been variously described as ‘a well-educated but economicallyunproductive professional class’ (Pempel 1999: 169–170), the ‘educatedsalaried middle classes’ (Alavi, H. 1982: 299), and the intermediate class leftbehind in the development process (Khan 1998: 19), whose political role isof considerable importance, organizing resistance and developing ways to‘modify certain market outcomes “politically”’ (Alavi, H. 1982: 299; Khan1998: 19). State capacity therefore not only depends on the state’s relation-ship with segments of capital but also on political constraints posed by othergroups in society outside the ‘developmental alliance’.
Furthermore, the state–society relationship in developing countries is notformalized or ‘institutionalized’ (as has been argued by some in the SouthKorean case [e.g. see Evans 1994]) but personalized, usually between patronsand clients. Patron–client relationships are repeated relationships of exchangebetween specific patrons and their clients. The nature of this relationship (interms of how it is likely to influence economic decisions) depends on theobjectives and ideologies of the patrons and clients; the number of potentialclients and their degree of organization; the homogeneity of clients; and theinstitutions through which patrons and clients interact, including the degreeof fragmentation of institutions (Khan 1998: 23–26). More critically, therelative power of patrons and clients can determine how resources are allo-cated. In South Korea, it was possible for the state to extract the maximumeconomic payoff while ensuring that resource allocation was efficient becauseclients of the state both in the business sector and in politics were weak.Inefficient clients could not defend themselves and the state had no interest indefending them.
However, where the patron is politically weak, inefficient clients may easilysurvive because clients in this context may be offering political support (orthe absence of political opposition) rather than an economic payoff. Thispolitical corruption may be necessary to ensure stability but can also begrowth-reducing. This depends in part on the degree of centralization, withcentralized corruption being potentially less harmful (Bardhan 1997; also seeShleifer and Vishny 1993) as reflected in the different impact of corruptionon economic growth in South Korea and South Asia (e.g. see Khan 1998).Patron–client networks in India and Pakistan reveal the substantial politicalpower of clients from intermediate ‘non-capitalist’ classes whose necessaryaccommodation made it more difficult for the state to reallocate rents moreefficiently. This partly explains the persistence of inefficient rents in theIndian subcontinent (Khan 1998, undated).
32 Privatization, rents and rent-seeking

What is needed to make privatization work?
Privatization will entail state intervention to finance capital costs, subsidizeany operational losses where cost-covering tariffs may not be possible, and topromote learning in order to develop the necessary entrepreneurial capacityto run an enterprise efficiently and for technological catching up. Whetherprivatization leads to learning and efficiency gains will therefore depend onthe ability of the state to manage these subsidies. Here, the state’s ex postcapacity to correct ex ante mistakes is more important than its capacity tomake the correct ex ante decisions in the first place. This is because ex antedecisions relating to selection, contract specification and regulation will beconstrained by political factors and incomplete information. From this per-spective, rather than its institutional capacity, the state’s political capacitywill be more important to correct ex ante mistakes and implement policy andenforce conditionality essential for the success of any subsidy programme
Political capacity
The management of rents necessary for successful privatization in developingcountries will require that the state is able to deliver the appropriate crediblethreats, including reallocating property rights by replacing owners where per-formance targets are not met. It may also need to enforce contracts (where theprivate operator or owner reneges) and coordinate capital and operationaldecisions to integrate sectors such as transport networks. And it will needto override public opposition to tariff or fare increases if this is needed toensure commercial viability, or provide and enforce conditional (operational)subsidies. As discussed in the previous section, all these will depend on thestrength of the state in relation to the private owner or concessionaire, whichin turn will be determined by the balance of power in society, and specifically,the compatibility of related institutions with this.
The assessment of state capacity must therefore take into account thecountry’s political context, looking specifically at how patron–client relation-ships affect the allocation of economic resources and the capacity of the stateto enforce discipline. The persistence of weak policies and institutions, andthe failure of efficient institutional change, lies in the balance of power insociety between social factions and classes (Brenner 1976, 1985; Bardhan2000), and in particular, ‘powerful interest groups opposed to change whocan impose unacceptable costs on others or the state’ (Khan 2004: 33). This isbecause the effectiveness of institutional capacities ‘depends on their com-patibility with the underlying distribution of power’ and enforcementrequirements need to be compatible with existing power structures for institu-tions to perform efficiently (Khan 2004: 35). In other words, to be effectivelyenforced by the state, institutions must be ‘compatible with or cannot beopposed by powerful interests within society’ (Khan 2000a; also see Shirley1997). Privatization should therefore not be pursued if the state lacks the
Privatization, rents and rent-seeking 33
political capacity to override the interests of powerful but unproductivegroups who could resist necessary efforts to sustain or improve performancein the new private sector. The incompatibility of the enforcement require-ments of particular institutions with pre-existing social power structures canexplain why similar state policies and institutions can lead to very differentoutcomes.
The overriding condition for successful privatization then is the state’spolitical capacity to implement the necessary institutions required forenforcing compliance with productivity-enhancing regulations. As this willlargely depend on the existing political conditions in a country, and the tech-nologies of the enterprises being privatized, the assessment of state capacitywill entail a careful political, economic and historical analysis of thatcountry. Where privatization is being driven by powerful interests, it isimportant to identify the dynamic elements or groups who may form pro-ductive alliances with the state and contribute to the process of capitalaccumulation. This could mean that it may not be possible or even desirableto blindly pursue transparent processes and other ‘good governance’measures, even more so if unproductive groups stand to gain by using this tomobilize factional support for their own ends.
This does not mean that moves towards greater transparency and account-ability should not be pursued as ends in themselves, only that we should notexpect these moves to result in an environment necessarily more conducivefor successful privatization, or indeed for economic development in general.Instead, a more complex analysis is needed to understand the very specificpolitical and economic challenges facing developing countries. This alsorequires a broader view of regulation which recognizes the importance ofpromoting learning and capital accumulation. A long-term solution wouldhave to ‘help productive forces within developing countries organize’ (Khan2004: 34) and some privatizations can assist in accelerating these socialchanges.
Institutional capacity
Having determined the state’s political capacity to implement policy, wecan then look at the institutional requirements. The three most importantinstitutional requirements that follow for successful privatization are: 1,project viability and privatization design; 2, regulatory and contract design;and 3, selection. The ranking of these institutional conditions are based onan assessment of which institutions, if poorly structured, would prevent theothers from functioning; and which conditions, if not met, could be most, orleast, easily corrected. Following this line of reasoning, we could argue that atransparent selection process, regulatory independence and clearly stipulatedcontracts will not overcome the problems arising from a lack of projectviability, especially if there are no measures in place to make an unviableproject more viable. On the other hand, as argued earlier, inappropriate
34 Privatization, rents and rent-seeking

candidate choice may not lead to failure if this can be remedied throughlearning rents and clearly specified incentives and penalties.
Project viability and privatization design
The most important institutional condition is the capacity to determinewhether an enterprise or project is financially feasible and commerciallyviable. This requires:
• identifying the problems to be solved in order to determine the aims andmost appropriate mode of privatization;
• determining operating and capital costs and projected revenue;
• ensuring that the deal can be properly financed, without creating anunrealistic debt burden which may affect operations and capital invest-ment;
• determining tariff conditions (level and structure, subsidy arrangements,collection performance, disconnection policy) and consumer preferences,affordability and willingness to pay (Stottmann 2000).
The issue of project viability is separate from that of candidate selectionbecause the provision of certain public goods is often not commercially viableand has traditionally been subsidized as a result, usually for welfare reasons.This is the case for sewerage services and urban rail networks which usuallyrequire capital and operational subsidies, especially in developing countries,in order to keep tariffs affordable or politically acceptable. Similarly, airlinesand auto manufacture are extremely difficult sectors, characterized by regularfailures in the face of inherent industry problems. In these circumstances, weargue that even the most suitable candidate is unlikely to make a fundamentaldifference to the commercial viability of the privatization as ongoing statesubsidies will be needed, and success needs to be measured against second oreven third best outcomes. These examples are discussed in further detail inthe case study chapters. In addition, the state will usually have to make theseenterprises attractive enough for the private sector to participate, usually byproviding sufficient subsidies together with incentives and compulsionsfor improving management and efficiency. However, if the state could haveoperated the enterprise more efficiently in the first place, there would be noreason to privatize.
The mode of privatization will depend on the level of information, regula-tion and monitoring, with regulatory capacity determining which privatiza-tion option is most appropriate. For example, it is possible to proceed withlimited information in the case of service and management contracts withfixed fees, while management contracts with performance incentives requiresufficient information to define incentives. Leases, BOT contracts and con-cessions require good system information, and in the case of divestiture,very good system information is essential. A strong regulatory framework is
Privatization, rents and rent-seeking 35
essential for divestiture, concessions, BOT contracts and leases, and is neededto monitor service and management contracts. A concession or BOT contractwould therefore be difficult to implement where regulatory capacity is weak,the regulatory environment uncertain, and information poor. Finally, cost-covering tariffs are regarded as necessary in the case of a lease, concession ordivestiture. In reality, this will depend on the willingness of consumers to payhigher charges and the capacity of governments to impose these or, failingthat, provide operational subsidies which will require careful monitoring andenforcement of conditions.
In the case of a utility, key parameters in assessing performance include:5
• its present and projected service area;
• current operating and maintenance cost;
• current characteristics of the service;
• current tariff levels and structure and collection efficiency;
• current and projected consumption;
• a basic inventory of the assets and their condition and serviceability;
• human resources;
• the capital cost of improvements and annual expenditure necessary toachieve intended service levels;
• availability of funding for service improvements through grants, equityand loans; and
• the additional operating costs due to system expansions, considering theefficiency gains that private operations might achieve.
The most important condition here is determining consumer preferences,affordability and willingness to pay, and where cost-covering tariffs areneeded, implementing measures to change public attitudes towards (higher)user charges. It is also crucial to ensure that measures are in place to make theproject commercially viable through subsidies where cost-covering tariffscannot be implemented. This last point is important because, as mentionedabove, some projects such as urban rail networks may be economicallydesirable but may not necessarily be financially or commercially viable. Thiswill entail careful privatization design and clearly specifying conditions forsubsidies, performance parameters and investment levels.
Contract and regulatory design
The second most important institutional condition is a contract which clearlystipulates obligations and penalties, and in tandem with this, an effectiveregulatory framework which effectively monitors performance and enforcesappropriate penalties for non-compliance. A contract should clearly specifyobligations (completion date, security, penalties for defaults in performance,a payment schedule based on satisfactory completion of sequential stages),and incorporate pricing and subsidies in contractual commitments to make
36 Privatization, rents and rent-seeking
these more predictable (Daniels and Trebilcock 2000). To safeguard againstcontract renegotiation, careful provision must be made to deal withunexpected events over the life of the contract. This includes conditionsunder which adjustment can be made; guidelines determining when andunder what conditions contract renegotiation must occur (rather than priceor service adjustment by agreement or by regulatory discretion); the processby which renegotiation must be initiated and conducted; and a definition ofclear arbitration provisions (Stottmann 2000). The regulator’s technicalcapacity will depend entirely on the quality of personnel and regulatoryexpertise. Regulatory staff should have the technical ability to specify theconditions of supply (access and possible exclusion), tariffs, prices and ser-vice/product quality, investment and profits (returns on capital), technicalstandardization and operational rules. This will in turn require adequatefinancial resources to attract and retain skilled professionals.
Selection
Least important in the context of privatization in developing countries is atransparent selection process as this is limited by inadequate and asymmetricinformation and often constrained by quite substantial costs associatedwith open bidding. Auctions can reduce information problems when valuinghighly idiosyncratic assets (where there are no obvious benchmarks to deter-mine the minimum return required) but work best where the allocated goodis stable and well defined. Furthermore, bundled goods which typify manyinfrastructure projects pose competitive bidding design problems (Danielsand Trebilcock 2000).
Transparency will also be sacrificed in competitive negotiations where thegovernment invites proposals from selected bidders to meet specific serviceobjectives. This may be favoured where projects have many possible technicalvariations which the contracting entity may want to explore without beingbound by standard solutions required by competitive bidding (Stottmann2000), and to reduce the costs of organizing competitive bidding (andwhere the government may favour a few candidates). Similarly, in directnegotiations, the project proposal originates from the private sector. This maybe needed to attract innovative projects and secure private sector involvementin smaller cities and towns where the cost of entering competitive biddingmay be high relative to the expected returns (Stottmann 2000), but can also bean easy way to secure privatization funds.
Obviously there needs to be a minimum standard of competence. The pre-qualification of bidders arguably serves to ensure that potential bidders havethe technical and financial capacity, and a track record performing similartasks, thereby weeding out inappropriate firms before they prepare costlyproposals. However, the shortage of entrepreneurial capacity in developingcountries means that bidders often do not have the experience or technical oreven financial capacity which in turn requires some form of foreign technical
Privatization, rents and rent-seeking 37

partnership and/or state support in the form of financing and learning rents.The ability of the selected candidate to deliver will then depend on the natureof any technical agreements and the structure of incentives and penalties, andmost of all, on the state’s capacity to enforce these. The relative importanceof these will clearly depend on the country context, industry and period.
Having established these conditions for successful privatization in develop-ing countries, we can now proceed to explain Malaysia’s privatizationexperience in the next chapter. The following four chapters will then look indetail at the failure of four case studies to determine what factors wereresponsible and what conditions needed to be in place for their successfulprivatization. As we shall see, Malaysia’s privatization programme generallyfailed to meet many of the institutional criteria above due to the politicalconstraints and the nature of patron–client relationships. However, failurewas ultimately due to the state’s inability to correct ex ante mistakesand strengthen weak institutions because its (ex post) political capacity wasconstrained by the balance of power in society.
38 Privatization, rents and rent-seeking

3 Institutional and politicalfailurePrivatization in Malaysia
Between the mid 1980s and mid 1990s, Malaysia’s privatization programmewas one of the most extensive in the developing world, both in terms of scaleand scope. By 2001, the state was restructuring, bailing out and taking overmajor companies involved in privatized enterprises or projects. This cul-minated in the renationalization of four of the largest privatizations (subjectof the subsequent case study chapters). What happened? Failure occurred ontwo levels (institutional and political) before (ex ante) and after (ex post)privatization. These failures can best be explained by asking why Malaysiaprivatized in the first place because political motivations will affect privatiza-tion decisions, institutional arrangements and outcomes. This is turn requiresan examination of the country’s political context, namely changes in socialrelations and the balance of power, and how these constrained the state’scapacity to make the correct ex ante and ex post decisions.
From the literature, we can identify a number of key changes in socialrelations that affected the development of policy in general and towardsprivatization. The emergence of a Malay middle class was directly responsiblefor the introduction of redistributive policies under the New Economic Policy(NEP) in 1971 to foster and accelerate the development of an ethnic Malaycapitalist class. These policies were driven by an ‘ethnic imperative’ to createMalay entrepreneurs, and involved an ‘efficiency trade-off’. This led to publicand private sector inefficiency, but also longer-term problems due to thelower efficiency of the Malay capitalists that the government sought topatronize. The NEP also substantially increased the size of the middle classand transformed the nature of patron–client networks. This increased com-petition for resources in the ruling Malay party, UMNO (the United MalaysNational Organisation), which in turn centralized and personalizedpatron–client networks around a few key leaders. The emergence of a groupof influential entrepreneurs in this context was a key factor in the decision toprivatize because their support in intra-party leadership contests wascrucial. Privatization was an extension of the NEP and closely related tostate attempts to foster and accelerate the development of an ethnic Malaycapitalist class. These political factors were eventually to also compromiseprivatization policies and the accompanying institutions.

However, while the literature touches on political motivations, this tendsto be divorced from the political and economic context. Specifically, itdoes not adequately address the key challenges facing the state, and thenature of constraints on its (ex post) political capacity to correct mistakes.It will be argued that while policies were largely driven by an ethnicimperative (which was politically necessary to accommodate the demands ofan emerging Malay middle class), the government also pursued broadlydevelopmental policies (e.g. see Lall 1995; Jomo and Gomez 2000) and,through privatization, sought to address both economic (efficiency) andpolitical (redistribution) concerns that had arisen under the NEP. Here thegovernment faced two related challenges. The first was to promote learningin order to develop a dynamic capitalist class capable of successfully runningprivatized companies or projects, and furthering the process of capitalaccumulation. Learning was also necessary for technological acquisitionfor catching up, especially in the case of infant industries or technology-intensive sectors. Secondly, the government also needed to ensure thecommercial viability of privatized enterprises and projects, especially wherethese involved high capital costs, large externalities and social considerationsdiscussed in the previous chapter. As conditional subsidies were neededto facilitate learning and/or ensure commercial viability, the success ofprivatization depended on the government’s political capacity to imposecredible subsidization strategies and enforce compliance, including with-drawing subsidies and even reallocating property rights where conditionswere not met.
The question then is whether privatization improved the government’spolitical capacity to better address economic inefficiency by promotinglearning (e.g. through conditional subsidies). This was not in general what weobserve in Malaysia, where the government has historically failed to imple-ment or even stipulate conditionality. The constraints on the government’sability to do so then become a crucial explanation for the failure of privatiza-tion strategies. As discussed in Chapter 2, privatization can be said to improvefirm performance by reducing the possibility of state interventions (e.g.subsidies, bail-outs) thereby subjecting the firm to the discipline of themarket. However, this crucially does not improve the government’s dis-ciplinary capacity which will be needed to effectively manage subsidies. In thecase of Malaysia, privatization did not substantially change the relationshipbetween the government and enterprise. Rather than a more ‘arm’s length’relationship, the national and economic significance of many of the largerprojects or enterprises meant that the government was unlikely to allow theseto fail. In the case of three of the case studies (Kuala Lumpur LRT, MAS andProton), privatization was also inappropriate as it could not address inherentindustry-related problems.
Furthermore, the emergence of the new Malay middle class (under theNEP) increased conflict over resource allocation and altered the balance ofpower. Growing political contestation in UMNO increased the importance of
40 Institutional and political failure
patron–client networks in intra-party contests, resulting in more centralizedand personalized patron–client relationships as the Prime Minister sought toconsolidate power. This in turn compromised the state’s political capacityto correct mistakes or discipline the private sector by creating moral hazardas privatization beneficiaries were closely associated with key members of theleadership, even acting as proxies in some cases. As a result, inefficiencieswere tolerated and failure even rewarded. These inefficiencies, inherited fromthe NEP, subsequently affected learning and technology absorption.
This chapter will examine how changing social relations (reflected inchanging patron–client relationships) shaped privatization and its accom-panying institutions, and constrained the government’s ex post politicalcapacity to correct mistakes and enforce discipline. The following sectionlocates Malaysia’s privatization programme in the context of the NEP, whichwas itself the outcome of the country’s changing social relations. This pro-vides the necessary context for examining why Malaysia privatized, lookingspecifically at the problems of public and (Malay) private sector inefficiency,and changing social relations arising from the NEP. This is followed byan assessment of the performance of Malaysia’s privatization programme,looking at how it failed. The next section then examines why privatizationfailed by identifying constraints to the government’s institutional andpolitical capacity posed by ethnic redistribution, crony capitalism and thebalance of power. The final section summarizes the main arguments andlocates the four case studies in the context of state capacities to promotelearning and commercial viability, briefly outlining the privatization andindustry challenges in each case, and identifying reasons for failure andnecessary conditions for successful privatization.
Why did Malaysia privatize?
The political context
Malaysia’s privatization needs to be understood in terms of governmentattempts to meet economic and political challenges related to growth andredistribution. This was first officially sanctioned under the NEP whichsought to promote Malay capital accumulation by increasing Malayopportunities for ownership participation, jobs and business. The NEP andits legacy have shaped Malaysia’s political economy since. It is thereforeimportant to examine the specific historical and political circumstancesleading to the introduction of the NEP in order to explain why privatizationwas undertaken within the context of redistributive policies. The NEP isgenerally regarded as a policy shift in response to inter-ethnic inequalitywhich led to the 1969 ‘race riots’. However, a closer examination of thedecade after independence reveals NEP-type policies already in place, and theemergence of an increasingly impatient and vocal Malay middle class whichwas already benefiting from these policies.
Institutional and political failure 41
The origins of the NEP can be traced back to British colonial rule whichemasculated Malay political and economic power, enabling British com-panies to dominate commerce, banking and services, and to own almost allthe major tin mines and plantations. The Chinese were prominent onlyin small and medium-sized businesses (retail trade, small construction,restaurants) (Puthucheary, J. 1960; Lim 1985; Bowie 1991), with Malaysconfined to agriculture, and remaining economically weak. However, despiteoverwhelming economic control by British capital (see Puthucheary, J. 1960;Tan, T.W. 1982), emerging inequalities were perceived along ethnic lines(e.g. see Jesudason 1989; Bowie 1991), partly because Chinese businesses wereconspicuous in the countryside where they took over rural transportation andrice milling (Lim 1981), and acted as intermediaries between British capitaland the Malay peasantry.
In the lead-up to Independence, British colonial authorities repressed left-wing nationalist groups and instead encouraged the formation of ethnic-based political parties led by conservative, pro-British middle class elements.These groups were represented mainly by Malay aristocrats (in UMNO) andthe Chinese and Indian bourgeoisie (in the Malaysian Chinese Association,MCA and Malaysian Indian Congress, MIC, respectively). Power washanded to these three parties as part of the Alliance Party, with Independenceconditional on British economic interests being guaranteed, and an inter-communal consensus, where the majority Malay population retained politicalpower and special privileges in return for citizenship rights and economicfreedom for non-Malays.
As a result, Independence did not alter the pattern of economic controlby British companies, with the government’s First Five Year Plan (1956–60)committed to free enterprise and attracting foreign investment (Lim 1985;Rasiah and Ishak 2001), the latter motivated by UMNO’s desire to curbChinese expansion (Gomez 1999). Between 1957 and 1960, public expenditurewas mainly on infrastructural development (50 per cent) and agricultural andrural development (23 per cent), with only 1.4 per cent allocated to commerceand industry development (Lim 1985). Early state intervention was gearedtowards improving the poor socio-economic position of Malays by pro-moting new economic activities (through public enterprises with redistribu-tional objectives), expanded education and public employment opportunities,and rural development and infrastructure (Salleh and Meyanathan 1993,cited in Lall 1995: 530) in order to secure political support (Lim 1985; Jomo1990).
Nonetheless, there were already attempts to redress ethnic economicimbalances with the Federal Constitution’s guarantee of Malay ‘specialrights’, the first legal action to create a Malay bourgeoisie (Lim 1985). How-ever, the lack of success here led to pressure from aspiring Malay business-men, and resulted in greater support for Malay businesses through protection(quotas for business licences, employment and education), assistance (credit,training and business premises), and acquisition (corporate ownership) (see
42 Institutional and political failure

Lim 1985). This included 30 per cent Malay quotas on company boards,preferential access for transport and timber licences, and 25 per cent quotasfor government contracts (Lim 1985; Shamsul 1986). Almost all Malaybusinessmen, regardless of type,1 were either created by the state or at theleast with crucial state support (Jomo 1993a) and were heavily dependent onthe state which remained in control (Ho 1988).
The emergence of an increasingly vocal Malay business class was itself theoutcome of a growing Malay middle class since independence. This includedthe increase in Malay teachers (with 80 per cent of the Federation of MalayTeachers Association belonging to UMNO), Malay businessmen,2 and afourfold increase in junior civil servants (Clarke 1964, cited in Neuman 1971:229). Changes over a ten-year period before 1970 show that the Malay middleclass grew at a faster rate than the non-Malay middle class, being ‘able tobenefit as much in sharing in the significant increase in the middle- andupper-income groups’ (Tan T.W. 1982: 124–125, 325; also see Shamsul 1986)and enjoying the highest rate of household income increase between 1957 and1970 (Snodgrass 1972, cited in Ho 1988: 106; also see Aris bin Othman1977).3 Even the slow progress of Malay equity from 2 to 6 per cent in sevenyears was ‘phenomenal’ given the small base (Tan T.W. 1982).
Tangible and significant benefits, including extremely fast and unusuallyhigh rates of post-Independence benefits, served to heighten expectations andaspirations, and contributed to the Malay middle class’s impatience. For thisgroup, the stakes were high and their reactions sharpest following ‘modest’changes in ownership and control of the economy since 19574 (Tan T.W.1982; Gomez and Jomo 1997), and as a result of their frustration at theinability of the civil service to continue absorbing the emerging universitygraduates who then turned to commerce (Jomo 1990). Increasing inter-ethnicinequality (partly a reflection of the Malay rural demography) and con-straints faced by Malay businesses led to calls for direct state intervention andthe creation of Malay capitalists.
Demands for greater government intervention in favour of economicredistribution for Malays came not from lower-income groups, but middle-and upper-middle-income Malays (Tan T.W. 1982; Toh and Jomo 1981, citedin Puthucheary, M. 1984: 218). This group began to exert pressure throughthe Associated Malay Chambers of Commerce,5 Kuala Lumpur PettyTraders Association, and UMNO6 (Lim 1985; Ho 1988; Jesudason 1989),and secured the support of then Deputy Prime Minister Tun Abdul Razakwho introduced the Bumiputra Economic Congress (BEC) (Puthucheary, M.1984). Demands made at the first BEC in 1965 led to the establishment ofBank Bumiputra (to provide Malays with credit facilities), and the reorgani-zation of the Rural Industrial Development Authority (RIDA) in the formof MARA (the Council of Trust for Indigenous People). Delegates at thesecond BEC in 1968 even threatened to cause political instability if Malayswere not given their share of the economy, and demands made here weresubsequently incorporated in the NEP (Lim 1985; Searle 1999).
Institutional and political failure 43
The Alliance Party’s failure to secure a two-third parliamentary majorityin the 1969 elections was seen as a direct threat to Malay ‘special rights’ andprovided the emerging Malay middle class with the opportunity to pushfor redistributive policies in favour of Malays (Hua 1983; Jomo 1990). It alsoprovided UMNO with the tactical mobility and strength to replace theoriginal communal settlement and pursue policies which could not havebeen implemented earlier in a bureaucracy part-controlled by British-trainedcivil servants and expatriates (Ho 1988), and was supported by a shift inthe balance of power within UMNO MPs and legislators towards Malayvernacular teachers,7 former government clerks, local party cadre and smallbusinessmen (Goh 1971; Ahmad 1985; Neuman 1971).
The thrust of the NEP was largely shaped by demands from the emergingMalay middle class. Hence, while it officially aimed to eradicate povertyirrespective of race, the NEP’s main focus was to benefit this group byrestructuring society to eliminate the identification of race with economicfunction. This involved the redistribution of wealth to the Malay middle classthrough substantial increases in education, (public) employment and businessopportunities, and the ownership of share capital in the corporate sector,with the aim of creating Malay capitalists (Rasiah and Ishak 2001). Greateraccess to education through a quota system facilitated Malay employment inthe public sector, which expanded rapidly as a result.8
Increasing government control and ownership of the banking sectorinfluenced lending patterns and ensured compliance with lending targetsfor Malays9 (Chin and Jomo 2000). Low interest rates, easy credit10 andpreferential lending aimed to assist Malay businesses, while the state madeeven larger funds available despite the poor track record of Malay businesses(Jesudason 1989). Risky forms of collateral were accepted, and it was alsonot uncommon for the Malay partner to acquire shares without the cashpayment of capital but with the future earnings of allotted shares (Tan T.W.1982). Malay ownership was also facilitated through the state acquisitionof shares which provided the quick control of well-managed, profitable com-panies11 as well as training for a new generation of Malay managers. Theinitial process of increasing Malay corporate ownership centred on the 1968Capital Issues Committee (CIC) which set share prices, usually below marketprice, for Malay individuals and SOEs, and the 1975 Industrial CoordinationAct (ICA) which required companies to set aside 30 per cent of shares issuedfor Malay equity (Jesudason 1989).
Reasons for privatization
The political imperative to develop (Malay) entrepreneurial capacitythrough the quick transfer of assets to state agencies (and the desire to bypassthe Chinese business sector) entailed an efficiency trade-off which led topublic and private sector inefficiency. As NEP programmes to support Malaycapitalists were essentially the extension of (unsuccessful) pre-NEP policies
44 Institutional and political failure

(Shamsul 1986), it created a dependency on continued state support,increasing patronage and rent-seeking. While these inefficiencies weretolerated during a period of high economic growth in the 1970s, they werenot sustainable in the 1982 economic recession. The government sought toaddress these problems through privatization.
However, while public sector reform is usually associated with episodesof economic downturn, the rapid pace of privatization post-1986 can bedescribed as ‘reform without downturn’ (Campos and Esfahani 1996: 208).In short, there were other (non-economic) reasons for privatization. Theserelated to changes in the composition of Malay society, namely theemergence of a new Malay middle and business class which increased com-petition for resources within UMNO, and ultimately pressure for changes inthe redistributive process in favour of emerging Malay capitalists alignedwith particular factions of the political leadership. Public sector inefficiencyand economic crisis facilitated the policy shift but privatization wasultimately politically motivated, reflecting a shift in the balance of powerwhich allowed a new group of businessmen-cum-politicians and profes-sionals contesting for political power in UMNO to reward supporters.(UMNO’s leadership itself increasingly came from business and professionalbackgrounds, reflecting the changes in the composition of the party’smembership.) Privatization thus represented a change in the way resourceswere controlled and allocated, and was in part driven by the factionalstruggles in UMNO and supported by an emerging group of big business-men which stood to benefit from the sale of state assets at the expense ofthose who continued to rely on NEP-style assistance and hand-outs.
Public sector inefficiency
Privatization was in part a response to public sector problems and state fiscalconstraints, in particular the unsustainability of public sector expansionunder the NEP (Jomo 1993a). To meet NEP redistribution and employmenttargets, the public sector expanded into one of the largest in developingcountries by the late 1970s (Wilson 1999). Between 1970 and 1983, thebureaucracy grew fourfold to 521,818 employees, public sector expenditureincreased over tenfold to RM35.4 billion in 1982, and the number of SOEsincreased from 109 to 656 by 1980 (Khoo B.T. 1995). The expansion of thepublic sector was such that even federal government officials were uncertainhow many public enterprises had been established in the early 1980s, not justby the federal and state governments, but also by various statutory bodies,regional development agencies and similar public sector bodies.
By 1983, two-thirds of government expenditure was spent running twenty-seven of the largest public enterprises (Khoo K.J. 1992). In 1984, the Ministryof Public Enterprise could only report the annual returns of 269 out of 900public enterprises, whose accumulated losses came up to RM137.3 million(Supian 1988; Kamal and Zainal 1989). Public sector borrowing, including
Institutional and political failure 45

loans from domestic agencies, increased from RM26.5 billion (1980) toRM100.6 billion (1986). The economic burden of this large, financiallydraining public sector became unsustainable with the global recession inthe 1980s, with falling oil prices (1982–86), the collapse of the tin market(1985), and declining prices of other major exports (after 1984) substantiallyincreasing the budget deficit from RM120 million (1981) to RM3.5 billion(1987) (Gomez and Jomo 1997). Under pressure to implement fiscal austeritymeasures as well as economic reform, the government offered financiallyweak public enterprises the option of closure, rehabilitation or privatization(Gomez 1994).
Public enterprise performance was hampered by ambiguous criteria andunclear, often contradictory and multiple objectives (e.g. redistributionand employment generation versus efficiency); a lack of coordination onthe different levels (state and federal, municipal and regional, and betweenministries); a serious shortage of competent and experienced Malay manager-ial expertise; and the absence of proper guidelines on selection and monitor-ing of management performance (Puthucheary, M. 1984). Little attentionwas given to viability and managerial competence (Jesudason 1989). Direct-orships were not based on management ability and experience but politicaland bureaucratic considerations (Ismail and Osman 1991) and led to theemergence of self-aggrandizing rentier managers, rather than disciplined,competent and entrepreneurial administrators (Gomez 1994; Jomo 1995;Gomez and Jomo 1997). Easy access to credit encouraged SOEs to operateon high gearing ratios without adequate pre-investment planning or firstdeveloping expertise (Puthucheary, M. 1984), while government bail-outs12
and protection from market forces bred complacency and resulted in abloated bureaucracy, inferior services, major inefficiencies, low productivity,limited innovation and high costs (Ismail and Osman 1991; Felker 1993;Gomez and Jomo 1997). Ethnic considerations entailed an efficiency trade-off, where incentives to attract foreign investment lacked technological andperformance conditions (Rasiah and Ishak 2001). State agencies were notinterested in building up an indigenous technological capacity, preferringeasy access to foreign partners and technology (Jesudason 1989). Theeagerness to promote redistribution created distortions for the efficientfunctioning of SOEs, subsequently adversely affecting both efficiency anddistributive equity (Gouri et al. 1991). As a result, most SOEs became com-mercially unviable, and there remained real problems of state entrepreneur-ship without the basic technical and managerial attributes (Jesudason 1989).
Private sector inefficiency
Privatization was also a response to other constraints posed by state-drivencapital accumulation under the NEP, in particular related inefficienciesin the private sector. Government efforts to promote entrepreneurshipthrough affirmative action under the NEP actually discouraged learning.
46 Institutional and political failure
Positive discrimination in education led to low internal social rates of returnand low social productivity of schooling, while the lowering of universityentrance requirements for rural (Malay) students led to the concentrationof Malays in the liberal arts and social sciences (Bruton 1992). This createda major obstacle for effective Malay entry into modern industry andnecessitated civil service expansion to absorb Malay graduates (partly also tocompensate for the slack demand in the private [manufacturing] sector)(Meerman 1979, cited in Bruton 1992: 251; Bruton 1992).
The government believed that entrepreneurship could be learned throughownership and management, supported by preferential treatment. It soughtto create Malay entrepreneurs by taking over established firms in order toprovide new owners with ready-made companies (Bruton 1992). This quickcontrol of profitable companies by state agencies increased de facto Malayequity ownership and provided training for Malay SOE managers. However,the government also minimized risk and provided windfall gains (throughshare purchase) for Malay entrepreneurs, and there was little interest orunderstanding of specific training, accumulated experience, or trial and error(Bruton 1992, 1998). This insulation from market competition and easyaccess to finance undermined the possible disciplining experience of businessmanagement, while the speed of asset acquisition by new Malay businessmenundermined their learning-by-doing (Jesudason 1989; Gomez and Jomo1997).
The lack of skills and previous learning base meant that the governmentwas unable to address the issue of absorbing complex organizational andproduction processes necessary for technological upgrading and industrylinkages (Bruton 1992; Lall 1995). Unlike South Korea, Malaysia did nothave large industrial conglomerates or many (non-resource-based) majormanufacturers with strong records of international competitiveness to under-take industrial upgrading (Jomo and Tan 1999). More crucially, unlike SouthKorea, subsidies were allocated without performance conditions. As a result,greater economic opportunities and state protection under the NEP did notincrease business acumen or produce a class of dynamic Malay capitalists(Gale 1981; Jesudason 1989; Bowie 1991; Khoo B.T. 1995; Crouch 1996;Gomez and Jomo 1997). Rather, it perpetuated Malay dependence on thestate, creating a ‘subsidy mentality’ among businesses, with a ‘permanentmiddle class’ dependent on the government (Jesudason 1989; Kamal 1989;Khoo B.T. 1995). Government attempts to create large (Malay-controlled)conglomerates thus mainly resulted in their move into non-tradable sectors.
Learning failure, subsidy dependence and rentier behaviour led to ineffi-ciency and a lack of productive base, often characterized by divestment forquick profits (Jesudason 1989; Gomez 1999) or ‘Ali-Baba’ (Malay–Chinese)relationships where Malays handed over control and management of com-panies to non-Malays in exchange for salaried directorships (Bruton 1992).Many Malay businessmen were highly geared on loans and were toodependent on preferential share allotments acquired under the NEP, lacking
Institutional and political failure 47

managerial and financial skills, particularly in project implementation andmanagement, and undertaking questionable projects (Bruton 1992; KhooB.T. 1995). Malay businessmen also faced capital, skilled labour and marketlimitations, and competition from SOEs and Chinese businesses. By the endof the 1970s, many businesses had failed despite significant support, anddemands grew for more protection and assistance in the form of easier credit,lengthier grace periods for loan repayment, more training, better businesspremises, etc. (Bruton 1992).
There were also wider economic problems. While the economy continuedto register high growth rates, this was largely due to external factors (e.g.higher commodity and oil prices), with Chinese and foreign investmentdeclining following the Industrial Coordination Act (ICA) (Bowie 1988).Structural problems emerged by 1980 with low private investment (whichincreased the public sector share), slow growth in agricultural productivity,land constraints, highly concentrated manufacturing and shallow foreign-ledexport sectors with weak linkages, labour shortages in agriculture along withurban unemployment, slow technological progress (beyond original equip-ment manufacture [OEM]) and technology transfer problems (Bruton 1992;Lall 1995; Rasiah 1998). According to the government’s Industrial MasterPlan (Malaysia 1983a), restructuring under the NEP adversely affectedindustrialization and was cited by US investors as the most serious disincen-tive to invest in the country (Schlossstein 1991).
Changing social relations
While privatization was partly in response to NEP inefficiencies, it did notseek to fundamentally change the NEP’s redistributive policies, or the natureof state–capital relations. Instead, privatization was to be implementedwithin the context of the NEP. As such, economic motivations are insufficientto explain why privatization was introduced. Rather, privatization wasultimately motivated by political considerations related to changes in socialrelations and the increasing competition in UMNO. The recession intensifiedthe conflict over resources in UMNO, particularly between predominantlysmall businessmen who continued to rely on state subsidies and an emerginggroup of big businessmen and former SOE managers who stood to benefitfrom privatization and who were closely connected to the new political leader-ship, itself increasingly represented by former businessmen such as FinanceMinister Daim Zainuddin. Mahathir Mohamad also represented a breakfrom previous prime ministers, coming from a professional (as opposed toaristocratic) background and was staunchly pro-business and anti-state.
The motivations for privatization here can be partly traced back to thepersonal motivations of individual leaders (e.g. see Gomez 2002b). Privatiza-tion decisions were widely believed to have personally benefited Daim, whileMahathir and Deputy Prime Minister Anwar Ibrahim were more likely tohave been politically motivated, with privatization presenting opportunities
48 Institutional and political failure
to reward their supporters, thereby securing political support (e.g. see Yusoff1990; Gomez 1991, 2002c). Where economic redistribution was previouslycentralized through the party (e.g. see Khan 2000b), privatization allocatedresources increasingly through personalized patron–client networks centredon certain political leaders.
Increasing competition for resources can be traced to the substantialgrowth in the Malay middle class which changed the composition ofUMNO’s membership and altered the balance of power within the party,shifting power away from the bureaucracy (Leigh 1992; Felker 1998). Thiswas facilitated in part by the 1982 recession (e.g. see Jomo 1993a, 1994) whichenabled Prime Minister Mahathir to centralize authority, bypass thebureaucracy to initiate state–business relationships and eventually introduceprivatization. Central to this was the support of an influential segment ofNEP-nurtured Malay state managers, businessmen and the new Malaymiddle class. The expansion of the Malay middle class was a direct result ofthe NEP. ‘Between 1970 and 1990 the proportion of the Malay workforceworking in middle-class occupations more than doubled from 12.9 to 27.0 percent’ (Crouch 1993: 142) and, by one estimate, increased by more than tenfoldbetween 1970 and 1998 (see Jomo 1999b). Malay representation increased ineight prized professions13 (from 5 per cent in 1970 to 25 per cent in 1988)(Jomo 1990), managerial posts14 (especially in the commercial and industrialsector) (Ismail and Osman 1991), and among university graduates (whomoved into business following the exhaustion of employment opportunitiesin the public sector) (Jomo 1990).
The emergence of the Malay middle class pushed UMNO to assert itself,eventually establishing the party’s political and economic hegemony. Thiswas made possible by UMNO’s direct involvement in business, with theformation of Fleet Holdings in 1972, the party’s own holding company, inorder to establish its financial independence from the Malaysian ChineseAssociation (e.g. see Yusoff 1990; Bowie 1991). Under the NEP, the govern-ment was initially able to centralize redistribution without state capture dueto a unified party elite under a strong leadership which had the support of alarge middle class and rural populace (as a result of bureaucratic expansionand rural development) (Leong 1991, cited in Felker 1998: 90). This cen-tralized patronage allowed UMNO to control resources, providing benefits toits supporters and strengthening party loyalty (Jesudason 1989; Crouch 1992;Khoo K.J. 1992; Felker 1998). The government was also able to strengthenand insulate the state’s planning and economic agencies,15 with bureaucratscontrolling resources through the management of state assets, and initiallywith minimal private business influence on economic policies (Felker 1998;Leong 1991, cited in Felker 1998: 90).
Despite its continued dependence on the state, the Malay business classgrew in organization and influence (Jesudason 1989), with the growingnumber of Malay businessmen fostered by the NEP becoming an increasinglyimportant element in the Malay political elite by the 1980s. This was reflected
Institutional and political failure 49
in the changing composition of UMNO leaders from politicians and‘administocrats’ to a combination of politicians and businessmen (Leigh1992), with significantly more Malay politicians active as businessmen (ontheir own and on UMNO’s behalf) and Malay businessmen active in politicsafter the NEP (Ho 1988). Corporate restructuring increased Malay shareownership from 1.5 per cent in 1969 to 19.4 per cent in 1988, and individualshare ownership among Malays increased to 67 per cent.16 State efforts tocontrol the ‘commanding heights of the economy’ (e.g. plantations and tinmines), driven by concerns with finding the quickest way to accumulate assetsand control well-managed, profitable companies, also created a powerfulgroup of former state managers increasingly active in business (Jesudason1989).
The late 1970s saw the emergence and transformation of the Malay bour-geoisie from primarily directors – not owners – of large corporations (beforethe mid 1970s) to Malay millionaires (Lim 1985), with professional andtrustee Malay executive directors becoming prominent by the late 1980s(Searle 1999). This shift in power was accompanied by changes in the occu-pational background and outlook of UMNO leaders and grassrootsmembers, with schoolteachers and other local leaders replaced by business-men and university-educated professionals produced by the NEP (Crouch1992; Searle 1999). ‘Middle-class elements’ were able to completely takeover UMNO by the early 1980s (Jomo 1999b), and by the time privatizationwas introduced, there was already a large Malay middle class, including ayounger, more professionally trained managerial cadre whose support wasimportant, and who had to be accommodated (e.g. see Milne and Mauzy1999). However, as mentioned in the previous section, this group did notnecessarily represent a dynamic, independent capitalist class, being theproduct of state policies which sought the quickest and easiest way to createcapitalists. As such, they continued to be dependent on state support but werealso increasingly impatient and ambitious.
The changing composition of the Malay middle class altered patron–clientrelationships and reshaped the internal politics within UMNO localbranches. UMNO’s expansion into business established the party’s economicdominance and financed intra-party/leadership contests by securing votesthrough the allocation of contracts to supporters. Increasing economicpatronage changed the nature of the patron–client relationship, transforminglocal UMNO representatives into political patrons. Elected members of par-liament who were previously political patrons (providing political support inreturn for economic benefits) greatly increased their control of the districtdevelopment machinery, allowing them to become economic patrons, distri-buting development benefits and purchasing continued support (Shamsul1986). While Malay businessmen were heavily dependent on their accessto government patronage, they became an important force in the internalpolitics of UMNO through the party’s extensive patronage network (KhooK.J. 1992; Crouch 1992; Aziz 1997), increasing bitter factional struggles
50 Institutional and political failure
for nomination and outbreaks of violence at UMNO branch and divisionmeetings after 1984 (Shamsul 1986). Although factions were already presentin all levels of UMNO (Ahmad 1985), the rise of ‘money politics’ was closelyrelated to (if not a direct result of) the NEP (Shamsul 1986). This resulted in aseries of bitter contests between 1981 and 1987, culminating in the leadershipchallenge and open party split in 1987 (Khoo K.J. 1992; Crouch 1992).
Conflict arose between state agencies17 and small Malay contractors, andtimber merchants and businesses (Lim 1985; Bowie 1988), with SOEsfrequently encroaching into areas where Malays were already operating orcould easily move into (Bruton 1992). (This eventually compelled the state totrim back the role of SOEs, focus on heavy industries, and finally divestownership to Malays [Lim 1985].) The main conflict though appeared to bebetween two factions (e.g. see Malek 1986). The pro-‘distribution’ faction,comprising small and medium Malay businessmen, and the ‘bureaucraticclass’, were concentrated primarily at the branch level of UMNO and withinvarious Malay chambers of commerce, heavily dependent on access topatronage, and favoured continued state intervention. This group was mostaffected by the government’s response to the 1980s recession which includedthe tightening of credit,18 austerity measures, the suspension, restructuring orshelving of State Economic Development Corporations (SEDCs) (Searle1999) and centralization of assets.
The so-called pro-‘growth’ faction, on the other hand, involved a coalitionof political and business elites. This included a cadre of NEP-trained Malaybusinessmen whose support for privatization facilitated the shift to narrowand personalistic policy networks in order to bypass formal bureaucraticchannels, enabling politicians to take over control of state-held assets fromtechnocrats and bureaucrats (Shamsul 1986; Felker 1999; also see Gomez2002b, 2002c). This group is said to have grown independent of state spon-sorship and patronage, viewing the NEP as imposing market distortions andobstructions to growth and new business opportunities (e.g. see Khoo K.J.1992; Crouch 1992; Khoo B.T. 1995; Searle 1999). Certainly there weregovernment concerns about the sustainability of redistributive policies in thecontext of a recession and existing inefficiencies, and privatization shiftedthe focus away from the NEP’s ‘redistribution with growth’ to an emphasison ‘growth with redistribution’. However, the economic rhetoric was alsolargely to justify redistributive policies in favour of an emerging factionwithin UMNO that was closely aligned to a segment of the political leader-ship and increasingly benefiting from patronage as a result. This led to thegradual erosion of the Ministry of Trade and Industry’s powers through thetransfer of profitable enterprises to trust agencies directly under the PrimeMinister’s control19 and transfer of UMNO shares and assets to the newUMNO treasurer and Minister of Finance Daim Zainuddin (Yusoff 1990;Khoo K.J. 1992).
Privatization therefore needs to be understood in terms of the contest forand conflict over the control and allocation of resources, including rents. This
Institutional and political failure 51

was in turn influenced by the changing social relations. Here, Mahathir’svictory in intra-party struggles – especially in 1987 following the introductionof privatization – owed much to the successful creation under the NEP of a‘Malay rentier-business cadre’ who stood to benefit (disproportionately) fromgreater business opportunities following privatization, and whose supportwas crucial (Jomo 1993a; Felker 1993). This group of prominent and richbusinessmen can be traced back to two key NEP institutions, Peremba andFima, where they served under Daim and Mahathir respectively. Perembawas co-founded by Daim before Mahathir appointed him as FinanceMinister. It was the property development arm of the Urban DevelopmentAuthority (UDA) and was set up to train Malay managers and entrepreneurs(Malaysian Industry, January 1996). Fima was set up in 1972 as a quasi-government food production company, with Mahathir as its chairman andlater director until his appointment as Prime Minister.
Privatization provided this new group of businessmen with opportunitiesfor rent capture at the expense of the pro-‘distribution’ faction because theywere closely connected with the political leadership. These rents includedsignificant implicit subsidies in privatization contracts which were difficultto capture under the NEP where state ownership and (bureaucratic)control restricted rents mainly to broad-based subsidies and cheap credit.Privatization also presented a segment of the political leadership with theopportunities to reward its supporters, thereby securing future supportat party elections (e.g. see Gomez 1990, 1991). All this is not to saythat economic reasons were not important. Rather, it was these politicalfactors and motivations which affected the character of Malaysia’s pri-vatization programme, including its performance and the types of institutions,and the government’s ability to promote learning and ensure commercialviability.
Malaysia’s privatization programme (1983–2000)
The discussion above allows us to make sense of Malaysia’s privatizationprogramme. Announced in 1983, privatization represented a change in howresources were allocated within UMNO as a result of a shift in the balance ofpower and was as such to be implemented within the context of the NEP’sredistributive policies. Privatized public sector assets were to provide the basisfor further corporate growth of the Malay private sector, and ownershipconditions were to reduce ownership imbalances between Malay and otherinterests (Malaysia 1985; Galal et al. 1994b), mainly through fostering Malayentrepreneurs and through the transfer of state-owned assets to individuals.
Officially, privatization aimed to:
1 relieve the government’s financial and administrative burden;2 improve efficiency and productivity through competition and employee
incentives;
52 Institutional and political failure
3 facilitate economic growth by increasing the role of the private sector indevelopment;
4 reduce the size and presence of the public sector; and5 help meet NEP targets by providing opportunities for restructuring the
ownership pattern.
However, it is the final objective which accounts for some of the main featuresof the privatization programme. Privatization was characterized by a non-transparent selection process, weak regulation and the lack of completedivestiture (Malaysia 1991b). Decisions and regulation remained highlycentralized and personalized, reflecting the increasingly personalized patron–client networks, while the mode and sectoral distribution of privatizationallowed the government to continue directing economic activity and promotecapital accumulation methods consistent with the preferences (and abilities)of the new Malay middle class. Despite its scale and scope, privatizationinvolved relatively few (complete) divestitures and a predominance of con-tracting out, focusing mainly on the non-tradable sector (e.g. constructionand property development), as well as completely new projects initiated bythe private sector.
All these facilitated easy capital accumulation by supporting economicactivity in rentier sectors, but affected the performance of privatizationbecause the government failed to address inherited inefficiencies and promotelearning and commercial viability due to constraints posed by patron–clientnetworks. As a result, by 2001, the government begun scaling back theprogramme following the failure and renationalization of several largeprivatizations and public companies involved in these, signalling the end ofits ‘owner-manager’ model by replacing the private owners with professional(state) managers (e.g. see The Star, 10 August 2002; Kennedy 2002).
Background and main features
The government defines privatization as the transfer to the private sector ofactivities and functions which have traditionally rested with the public sector.This applies to enterprises already owned by the government and to newprojects normally implemented by the public sector (Malaysia 1991b), andrequires the transfer of management responsibility, assets (or the rights touse assets) or personnel. The four main modes of privatization are sale ofassets or equity; lease of assets; management contracts; and build-operate-transfer (BOT) and build-operate (BO) (Malaysia 1991b). However, pri-vatization is also broadly defined to include partial divestitures (with thegovernment retaining majority ownership); joint public-private sectorventures; schemes to draw private financing into construction projects(e.g. highways and low-cost housing schemes); licences to operate in sectorspreviously exclusive to the public sector (e.g. TV broadcast, telecommunica-tions); contracting out of public services (e.g. garbage collection); contracted
Institutional and political failure 53

leasing of public properties; corporatization; and management-buy-out(MBO) (Jomo 1990). In addition, the chosen mode was to reflect therequirements of national objectives.
On paper at least, there were clear privatization procedures. The Privatiza-tion Task Force (PTF) monitored progress of feasibility studies, establishedtechnical committees, coordinated the privatization of SOEs and advised theInter-departmental Committee on Privatization (ICP) (Ismail and Lee 1990;Malaysia 1991b). The ICP (technically the highest decision-making body)made recommendations to the Cabinet, and was responsible for planning,monitoring, coordinating and evaluating the implementation of the privatiza-tion programme. Decisions were based on ‘feasibility’ and ‘desirability’.Feasibility was determined by the ease of privatization (in terms of SOE-restructuring and legal or regulatory changes) and attractiveness to theprivate sector (in terms of its competitive market position, growth potentialand financial profile). Desirability was based on government priorities foreconomic development and improvements in the provision of goods andservices. Privatization could be initiated by the government or private sector.Government-initiated privatization normally required a detailed study todetermine viability and mode of privatization before a tender or negotiationswith a single party where circumstances warranted. In the case of privatesector-initiated privatization, the first promoter to submit a detailed feasi-bility study to the PTF had the exclusive rights to negotiate with the govern-ment. This was designed to reward private sector initiatives and innovations(Malaysia 1996). Nonetheless, private sector-initiated privatization was tobe only considered under circumstances where the proposer offered a uniquecost-effective solution or potential savings, or possessed technical know-how,patent rights or some other component essential to the proposal (e.g. seeJomo 1994: 75).
To support this, new modes of privatization were introduced (e.g. build-transfer [BT] and asset swap) to facilitate the privatization of land develop-ment and ‘accommodate the requirements of more innovative proposalssubmitted by the private sector’ (Malaysia 1996: 203). As such, rather thanmerely representing a transfer of activities and functions to the private sector,privatization often resulted in completely new projects developed by theprivate sector which may not have otherwise been undertaken by the state.20
This does not reduce the government’s financial burden or the size of thepublic sector, or improve efficiency, but does increase the role of the privatesector and is consistent with NEP targets. The private sector-initiatedapproach helped expedite implementation and encourage private sectorproposals. The Privatization Master Plan (PMP) identified 234 privatizationproposals initiated by the private sector, of which 109 were implemented(Malaysia 1996; also see Jomo 1994).
Gauging the exact scale of Malaysia’s privatization programme is difficultbecause the data does not include every public sector activity or functiontransferred to the private sector. For example, privatization implemented
54 Institutional and political failure

prior to 1983 ‘for reasons of efficacy of execution of activities rather than toconsciously achieve some national objectives’, and which do not involve thetransfer of assets or personnel, is excluded (Malaysia 1991b: point 21), evenif these transferred activities to the private sector. This includes contracts ona turnkey basis and contracting out of services by municipalities and othergovernment organizations (e.g. security, cleaning, laundry and maintenanceof hospital facilities) undertaken between 1986 and 1990 (Malaysia 1991a;Jomo 1994). Smaller privatizations (of less than 500 employees) and divest-ments since 1981 are also often excluded from official statistics, includingthe first state divestments where equity in 45 companies was transferred toPermodalan Nasional Berhad (PNB, the National Equity Corporation) andAmanah Saham Nasional (ASN, the National Unit Trust Scheme), andequity in another 120 companies to private parties in 1981. Similarly, cor-poratization is sometimes excluded, while non-financial public enterprises(NFPEs) were only categorized under the public sector in the Fifth MalaysiaPlan (1986–90) (Malaysia 1986).
Furthermore, there is no comprehensive list of privatizations on a state orfederal or municipal level, with information largely scattered and restrictedfollowing amendments to the Official Secrets Act (OSA) to cover governmenttender documents (Jomo 1994). This limits access to details of privatizationtenders, contracts, estimates of project value and names of beneficiaries,especially given the practice of using nominees.21 The exclusion of these pri-vatizations from official records, and the data problems, tend to under repre-sent the actual scale of privatization (itself a reflection of the degree of stateintervention under the NEP, with SOEs involved in almost every economicsector) (see Adam and Cavendish 1995; Plane 1997: 352).
Nonetheless, the available evidence allows us to outline some broad fea-tures of Malaysia’s privatization programme. Privatization was characterizedby the overwhelming number of Malay beneficiaries, in line with the objectiveof ‘restructuring the ownership pattern in the economy’. Here, the mode andsectoral distribution of privatization was also consistent with the preferencesof the Malay middle class in general, focusing largely on sectors where Malayenterprises were most concentrated, namely in ‘construction’ (the largestprivatized sector), ‘government services’, and ‘wholesale and retail trade,hotels and restaurants’ (Table 3.01; also see Ho 1988).
Furthermore, although divestiture (through the sale of equity) was themethod with the highest privatizations (109 out of 328 in 1983–2000)(Table 3.02), this was a relatively small number and restricted to partialdivestiture, where the government disposed only a small fraction of the publicsector during the first decade, with only a fraction of the shares going intoprivate hands (Galal et al. 1994b). In the case of majority divestiture,the government often retained effective control through a ‘golden share’ (aspecial rights redeemable preference share), with management largelyunchanged (Ho 1988; Jomo 1994). Instead, privatization largely involvedcontracting out. Officially there were 79 privatizations through contracting
Institutional and political failure 55

out (BOT/BOO/BT) in 1983–2000 (Table 3.02), the highest method of pri-vatization after sale of equity and sale/lease of assets. For reasons discussedearlier, this figure may be much higher when other BOT/BOO/BT projectsrelated to infrastructure, construction and property development areincluded. (For example, there were around 47 major privatized road projects,and based on UMNO’s list of privatizations alone, 60 property or construc-tion-related privatizations.)22 This emphasis on contracting out (in non-tradable sectors, mainly in construction and property development) offeredsecure rents and was again consistent with the sectors in which many Malaycompanies were active.
Despite the procedures on paper, privatization remained highly centralizedand personalized in practice. Where some allocations were made by theMinistry of Trade and Industry in the 1980s, this prerogative was increasinglyexercised by the Ministry of Finance (MoF) in the 1990s. This followedMahathir’s consolidation of power and his appointment of close friend DaimZainuddin as Finance Minister. While the expanded scope of privatizationallowed for numerous methods of privatization which spread transfers as
Table 3.01 Malaysia: Number of privatized projects by sector, 1991–2000
Sector Privatizations Share of total (%)
1991–1996Agriculture and forestry 16 7.8Mining and quarrying 10 4.9Manufacturing 31 15.2Construction 46 22.5Electricity, gas and water 14 6.9Transport, storage and communications 22 10.8Wholesale and retail trade, hotels and restaurants 23 11.3Finance, real estate and business services 13 6.4Government services 11 5.4Other services 18 8.8
Total 204 100
1996–2000Agriculture and forestry 8 8.2Manufacturing 2 2Construction 27 27.6Electricity and gas 12 12.2Transport 16 16.3Water and sewerage 4 4.1Wholesale and retail trade, hotels and restaurants 6 6.1Finance, real estate and business services 3 3.1Government services 20 20.4
Total 98 100
Source: Adapted from Malaysia (1996: 204, Tb 7–1); Malaysia (2001a: 185).
56 Institutional and political failure
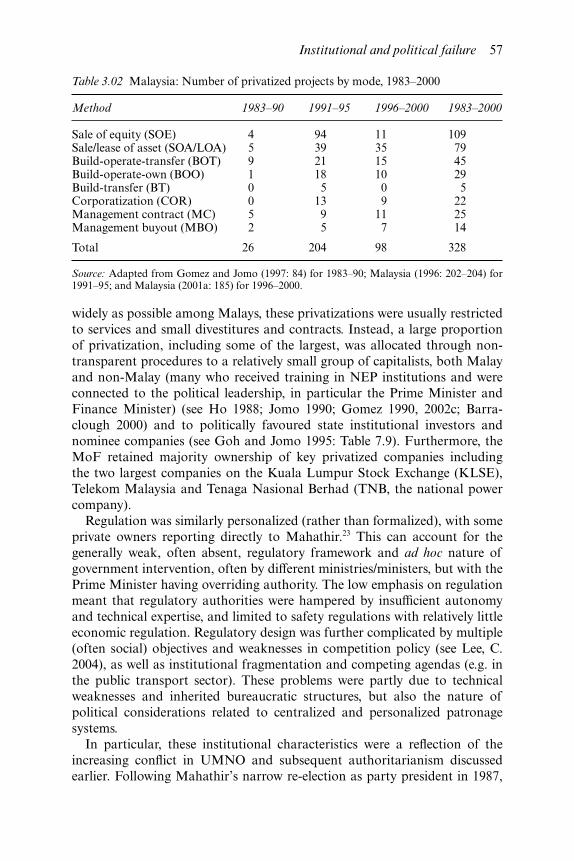
widely as possible among Malays, these privatizations were usually restrictedto services and small divestitures and contracts. Instead, a large proportionof privatization, including some of the largest, was allocated through non-transparent procedures to a relatively small group of capitalists, both Malayand non-Malay (many who received training in NEP institutions and wereconnected to the political leadership, in particular the Prime Minister andFinance Minister) (see Ho 1988; Jomo 1990; Gomez 1990, 2002c; Barra-clough 2000) and to politically favoured state institutional investors andnominee companies (see Goh and Jomo 1995: Table 7.9). Furthermore, theMoF retained majority ownership of key privatized companies includingthe two largest companies on the Kuala Lumpur Stock Exchange (KLSE),Telekom Malaysia and Tenaga Nasional Berhad (TNB, the national powercompany).
Regulation was similarly personalized (rather than formalized), with someprivate owners reporting directly to Mahathir.23 This can account for thegenerally weak, often absent, regulatory framework and ad hoc nature ofgovernment intervention, often by different ministries/ministers, but with thePrime Minister having overriding authority. The low emphasis on regulationmeant that regulatory authorities were hampered by insufficient autonomyand technical expertise, and limited to safety regulations with relatively littleeconomic regulation. Regulatory design was further complicated by multiple(often social) objectives and weaknesses in competition policy (see Lee, C.2004), as well as institutional fragmentation and competing agendas (e.g. inthe public transport sector). These problems were partly due to technicalweaknesses and inherited bureaucratic structures, but also the nature ofpolitical considerations related to centralized and personalized patronagesystems.
In particular, these institutional characteristics were a reflection of theincreasing conflict in UMNO and subsequent authoritarianism discussedearlier. Following Mahathir’s narrow re-election as party president in 1987,
Table 3.02 Malaysia: Number of privatized projects by mode, 1983–2000
Method 1983–90 1991–95 1996–2000 1983–2000
Sale of equity (SOE) 4 94 11 109Sale/lease of asset (SOA/LOA) 5 39 35 79Build-operate-transfer (BOT) 9 21 15 45Build-operate-own (BOO) 1 18 10 29Build-transfer (BT) 0 5 0 5Corporatization (COR) 0 13 9 22Management contract (MC) 5 9 11 25Management buyout (MBO) 2 5 7 14
Total 26 204 98 328
Source: Adapted from Gomez and Jomo (1997: 84) for 1983–90; Malaysia (1996: 202–204) for1991–95; and Malaysia (2001a: 185) for 1996–2000.
Institutional and political failure 57
he consolidated his authority both within UMNO, where he amended theconstitution to increase his power (Milne and Mauzy 1999), and in govern-ment, with the concentration of power in a few key regulatory agenciesdirectly under the Prime Minister’s Department (Searle 1999). UMNO’s con-trol of key economic and technocratic agencies of government, specificallythe MoF, Ministry of Trade and Industry, and Economic Planning Unit(EPU, located in the Prime Minister’s Department) meant that decision-making became increasingly centralized, allowing Mahathir to bypass keybureaucratic interests (Felker 1999) and impose his own views on economicpolicies, with even the EPU having to defer to the Prime Minister on hischoice of key projects (e.g. see Jesudason 1989; Milne and Mauzy 1999).Here, increasing competition did not lead to decentralized patron–clientnetworks but instead prompted Mahathir to strengthen his authority, in partby securing political support through the greater personal control of resourceallocation.
Privatization performance (1983–2000)
Assessment of Malaysia’s privatization performance is affected by method-ological difficulties (discussed in Chapter 2) as well as data problems dis-cussed in the previous section. As a result, evidence is patchy at best andinconclusive. One solution is to measure performance in terms of the officialaims of privatization.
Relieving the government’s administrative and financial burden
Privatization saved the government RM122.0–RM132.2 billion in capitalexpenditure (Malaysia 1996, 2001b; The Edge, 18 December 2000) andaround RM7 billion in operating expenditure (The Edge, 18 December 2000;Far Eastern Economic Review, 25 January 2001).24 While savings on operatingexpenditure represented less than 1 per cent of operating (current) expendi-ture, savings on capital expenditure was around 25 per cent of total develop-ment expenditure of the public sector from 1981 to 2000 (Malaysia 1986,1996, 2001b). However, these were only savings in accounting and not eco-nomic terms since the money was still spent on capital expenditure throughgovernment-guaranteed or soft loans to the private sector (i.e. it was effec-tively still a loan to the government but through the private sector). Mostnon-financial public enterprises (NFPEs) and even government developmentexpenditure have been primarily financed by the private capital market, albeitwith government-guaranteed loans in the former and government borrowingsin the latter.
Furthermore, the state provided RM5.1 billion in soft loans for privatiza-tion projects (1983–96) (The Edge, 6 November 2000) and RM4.8 billion ‘forprojects with a high social component’ (1991–95) (Malaysia 1996). Most ofthese soft loans were later transferred back to the state, while ‘contingent
58 Institutional and political failure

liabilities’ incurred through the guarantee of minimal revenue flows to privateoperators are believed to have been around RM20–RM30 billion (Jomo2002). The government’s desire to ensure the success of its privatization pol-icy (e.g. by discounting asset prices) also crowded out private demand forcapital for non-privatization purposes, as well as the creation of assets(through productive investment) in favour of the transfer of assets (throughprivate acquisition of government stock) (Jomo 2002).
Privatization saw revenue from corporate taxes grow steadily in absoluteterms and as a percentage of total government revenue from 1980 to 2000.However, revenue from corporate taxes already exhibited high growth ratesbefore privatization (19 per cent in 1971–75 and 14.3 per cent in 1976–80,where GDP was at 7.2 and 7.8 per cent respectively) and as a percentage ofgovernment revenue (20.4 per cent in 1970 and 22.8 per cent in 1975) (Malay-sia 1981). Furthermore, corporate tax revenue declined in growth rate andabsolute terms in the first seven years of privatization (Table 3.03). There isalso no clear evidence that additional recurrent revenues from leases or tax-ation compensated for the loss of recurrent revenue from the government’smore profitable investments (Jomo 1994), especially given the revenue fore-gone through tax exemptions such as the RM4.5 billion for highway com-pany PLUS (Asian Wall Street Journal, 21 December 1998).
The government earned RM21.2–RM23.1 billion from the sale of equityand RM12.7 billion from the sale of assets (Malaysia 1996, 2001b; The Edge,18 December 2000) although the volume of privatization revenue ‘remainedminiscule during the 1980s’ (Cavendish and Mistry 1992: 39, cited in Cookand Kirkpatrick 1995: 297). Furthermore, this does not take into account thevery substantial cost of government bail-outs, takeovers and renationaliza-tions, nor the loss of revenue through the undervaluation of public-listedshares25 (e.g. see Ismail and Lee 1990; Jomo 1994; Goh and Jomo 1995).
Similarly, the transfer of an estimated RM7.45 billion in federal debt tothe private sector by 1990 through privatization (Ismail and Lee 1990)needs to take into account the transfer back of outstanding private sectordebt through renationalizations and the state purchase of non-performing
Table 3.03 Malaysia: Revenue from corporate taxes, 1970–2000
Year Total(RM billion)
% of govtrevenue
Years Total(RM billion)
Growthrate (%)
GDP(%)
1970 0.49 20.41975 1.2 22.8 1971–75 0.49 19 7.21980 2.5 18.1 1976–80 1.2 14.3 7.81985 3.9 18.6 1981–85 16.1 8.7 4.91990 4.5 15.2 1986–90 16.9 1 6.71995 11.7 23 1991–95 43.7 21.1 8.72000 13.9 22.5 1996–2000 77.8 3.5 4.7
Source: Adapted from Malaysia (1981, 1986, 1991a, 1996, 2001a).
Institutional and political failure 59

loans (NPLs), many from privatized enterprises or companies involved inprivatized projects.26 By early 2000, the state asset management companyDanaharta had acquired RM47 billion worth of NPLs from financialinstitutions (Chin and Jomo 2001), including RM3.09 billion (the singlelargest NPL) from Renong (UMNO’s holding company and the largestprivatization beneficiary) (Far Eastern Economic Review, 22 February2001).
Finally, privatization reduced the size of the public sector by transferring114,198 employees to the private sector between 1983 and 200027 (excludingtransfers from privatized SOEs such as hospital and port services) (Malaysia1996, 2001b). However, as the private sector was not allowed to retrenchemployees in the first five years, privatization did not address inefficienciesarising from excess staff that were merely transferred to the private sector(Ismail and Lee 1990).
Improving efficiency and productivity
Efficiency gains are typically measured by profit margins, profit–asset ratios,labour and total factor productivity, production and export data, sales per-formance, capital investment, leverage and dividend policy. Early studiesfound efficiency gains in the privatizations of Malaysia Airlines (MAS), portsand Sports Toto (the state lottery) (Jones and Fadil 1992, 1994; Galal et al.1994); solid waste infrastructure and services (Lee Y.F. 1997); and improve-ments in TV broadcasting (Ismail and Lee 1990; Tan C.H. 1991; MohamadSheriff 1991, both cited in Ghosh 1999) and Telekom Malaysia (MohamadSheriff 1991, cited in Ghosh 1999).
The privatization of three ports (Klang Container Terminal, Penang Portand Johor Port) has been credited for increasing cargo-handling and improv-ing productivity and profits (Ismail and Lee 1990; Malaysia 1991b, 1996,2001b; Jones and Fadil 1992; Jones 1994; Galal et al. 1994b; Singaravelloo1996). However, much of this improvement was due to output growth, whichwas the result of exogenous demand shifts, e.g. the increase in the number ofship calls at Malaysian ports as a result of new shipping lines commencingdirect calls, and additional services by existing lines (Malaysia 2001b).It is also unclear if privatization of an unprofitable port would have beensuccessful (Hochstein 1996).
Telekom Malaysia reported improvements following corporatization in1987 and (49 per cent) divestment in 1990, registering steady profit growth forseven consecutive years, increasing returns on assets, and increasing revenueper subscriber, production per employee, direct exchange lines per employeeand response to faults/complaints, while also improving existing services andproviding new services (Malaysia 1991b, 1996, 2001b). The corporatizationof TNB, the national power company, saw a reduction in system losses, andimprovements in average fuel conversion efficiency, revenue generated andaccess to the public (Malaysia 1996, 2001b), and significantly improved
60 Institutional and political failure

infrastructure and strategic investment which reduced power outages (Leary1998). However, TNB’s profitability decreased while cost per unit and costto public per unit per output increased as a result of unequal power purchaseagreements with (private) independent power producers (IPPs) (MalaysianBusiness, 1 September 1993; The Sun, 2 January 1996; New Straits Times,8 January 1996, 4 July 1996; The Star, 28 December 1996, 5 October 1999,23 January 1999; Business Times, 11 November 1998; Malaysia 2001b).Furthermore, despite divestment, both Telekom Malaysia and TNBremained majority state-owned.
The contracting out of solid waste infrastructure and services improvedgarbage collection in Kuala Lumpur from 5.7 tons of waste per vehicle perday before privatization to 8.7 tons in 11 municipalities, and resulted in costsavings in nine others (Lee Y.F. 1997). Sports Toto, the privatized lotteryfund, expanded and introduced new products as well as registered gainsamounting to 11 per cent of predivestiture sales (to 1990) from improvedmarketing to expand market share (Galal et al. 1994b; Jones 1994). Revenuesfrom levies on the privatized lottery were three times greater (in real terms)than revenue from the former SOE (Kikeri et al. 1994). However, it is notentirely clear that Sports Toto’s performance was the result of privatizationand not other factors, particularly given that ‘minimal efforts were taken bythe government to expand operations in view of the [unIslamic] nature of thecompany’s activity’ (Ismail 1991: 624).
Overall, the evidence here is small (given the scale of privatization),selective (often restricted to a few same case studies or sectors) and employsdifferent measurements. The diverse modes of privatization and differententities privatized also make pre- and post-privatization comparisons orcomparisons with similar SOEs difficult if not impossible. It is also some-times not clear whether efficiency gains, where these took place, were theresult of privatization or favourable macroeconomic conditions.
Facilitating economic growth
Privatization is argued to have facilitated economic growth through cor-porate expansion and greater utilization of growth opportunities throughprivate sector motivation (Malaysia 1991b). This was reflected in overalllevels of private investment, corporate and industry growth, and marketcapitalization. Private investment increased absolutely and in terms of itsshare of total investment and GNP (1983–97). Private investment growthrates also exceeded GDP growth rates after 1986. However, although theincrease in private investment is most likely the result of privatization(particularly in the case of large BO/BOT infrastructure projects in the late1980s and early 1990s) (Malaysia 1991b), private investment was alreadygrowing rapidly and constituted over 60 per cent of total investment from1970 to 1980 (Table 3.04).
Institutional and political failure 61

Privatization has been credited with enhancing economic growth (Tan C.H.1991) by releasing resources for corporate expansion through efficiency gains,although no evidence of this has been produced. Growth is also said to havebeen generated by allowing private entrepreneurship in sectors previouslymonopolized by the state, and through the multiplier effect, especially in(BOT) road construction, electricity supply, telecommunications and TVbroadcasting (Malaysia 1991a, 1991b, 1996, 2001b; Leary 1998). However,the examples of BOT projects and licensed activities merely involve theprivate sector substituting for what the public sector would otherwise haveundertaken at lower cost to users (see Jomo 1989).
Privatization significantly deepened the capital market. The public listingof the thirteen entities privatized by June 1992 raised market capitalizationby RM201.1 billion, accounting for 28 per cent of total capitalizationand making the Kuala Lumpur Stock Exchange (KLSE) the largest stockmarket in Southeast Asia and the fourth largest in Asia (Malaysian Business,16 August 1992; Investors Digest, November 1992). TNB and TelekomMalaysia alone – the two largest companies on the KLSE – accounted forRM62.08 billion (11 per cent) of market capitalization in 1995 (Tan, C. 1996;Malaysia 1996). Between 1996 and 2000, five newly listed InfrastructureProject Companies28 (IPCs) raised RM3.5 billion through the issue of newshares (Malaysia 2001b).
However, there is considerable evidence that companies in Malaysiaseek stock market listing for signalling purposes, to secure more bank crediton better terms rather than to raise money directly on the stock market.Three quarters of the US$35 billion estimated to have been borrowed fromabroad were accounted for by three privatized SOEs (MAS, TNB and
Table 3.04 Malaysia: Private investment, 1970–2000
Year Private investment(RM billion)
Share of totalinvestment (%)
Share of GNP (%)
1970 1.5 67.9 12.11975 2.5 62.3 14.11980 10.4 62.6 20.11981 11.5 55.2 20.51982 11.4 50 191983 12 49 18.31984 13.3 52.6 181985 12.3 53 17.11990 24.2 64.7 21.91995 57.7 71.6 28.51997 87.9 73.8 39.21998 n/a 57.9 18.52000 42.9 49.2 13.8
Source: Adapted from Malaysia (1981; 1986; 1991a; 1996; 2001a).
62 Institutional and political failure
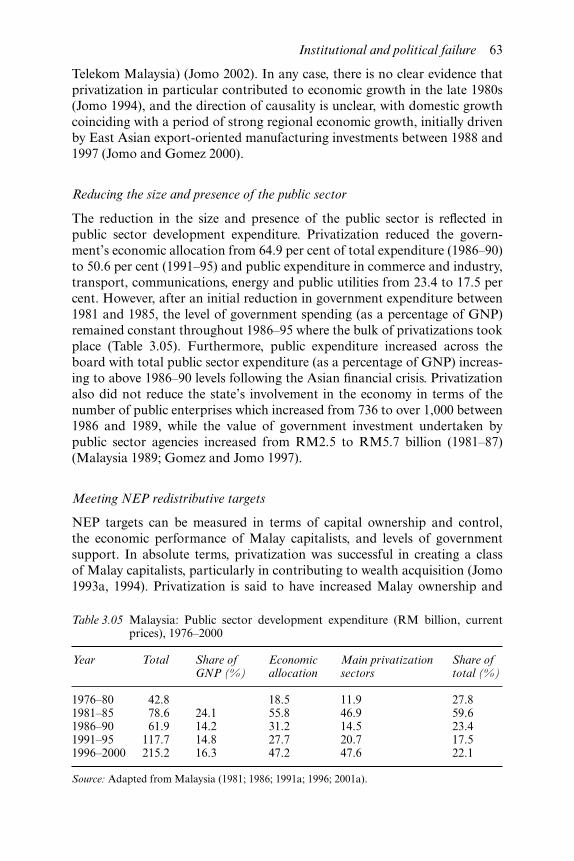
Telekom Malaysia) (Jomo 2002). In any case, there is no clear evidence thatprivatization in particular contributed to economic growth in the late 1980s(Jomo 1994), and the direction of causality is unclear, with domestic growthcoinciding with a period of strong regional economic growth, initially drivenby East Asian export-oriented manufacturing investments between 1988 and1997 (Jomo and Gomez 2000).
Reducing the size and presence of the public sector
The reduction in the size and presence of the public sector is reflected inpublic sector development expenditure. Privatization reduced the govern-ment’s economic allocation from 64.9 per cent of total expenditure (1986–90)to 50.6 per cent (1991–95) and public expenditure in commerce and industry,transport, communications, energy and public utilities from 23.4 to 17.5 percent. However, after an initial reduction in government expenditure between1981 and 1985, the level of government spending (as a percentage of GNP)remained constant throughout 1986–95 where the bulk of privatizations tookplace (Table 3.05). Furthermore, public expenditure increased across theboard with total public sector expenditure (as a percentage of GNP) increas-ing to above 1986–90 levels following the Asian financial crisis. Privatizationalso did not reduce the state’s involvement in the economy in terms of thenumber of public enterprises which increased from 736 to over 1,000 between1986 and 1989, while the value of government investment undertaken bypublic sector agencies increased from RM2.5 to RM5.7 billion (1981–87)(Malaysia 1989; Gomez and Jomo 1997).
Meeting NEP redistributive targets
NEP targets can be measured in terms of capital ownership and control,the economic performance of Malay capitalists, and levels of governmentsupport. In absolute terms, privatization was successful in creating a classof Malay capitalists, particularly in contributing to wealth acquisition (Jomo1993a, 1994). Privatization is said to have increased Malay ownership and
Table 3.05 Malaysia: Public sector development expenditure (RM billion, currentprices), 1976–2000
Year Total Share ofGNP (%)
Economicallocation
Main privatizationsectors
Share oftotal (%)
1976–80 42.8 18.5 11.9 27.81981–85 78.6 24.1 55.8 46.9 59.61986–90 61.9 14.2 31.2 14.5 23.41991–95 117.7 14.8 27.7 20.7 17.51996–2000 215.2 16.3 47.2 47.6 22.1
Source: Adapted from Malaysia (1981; 1986; 1991a; 1996; 2001a).
Institutional and political failure 63

control of share capital;29 Malay control of companies on the KLSE;30 andMalay equity in privatized companies.31 This centred on transportation(32.2 per cent), construction (27.1 per cent) and agriculture (24.3 per cent)(1996–2000) (Malaysia 2001b), consistent with the sectoral distribution ofprivatization. However, the total Malay share of capital had risen steadilysince 1971, with the biggest growth from 4.3 to 9.2 per cent between 1971 and1975 (Table 3.06). On the other hand, the increase of the individual Malayshare of capital from 5.8 per cent (1980) to 18.6 per cent (1995, before theAsian financial crisis), and increasing concentration of individual share inthe Malay stake from 39 per cent (1975) to 67 per cent (1988)32 (Jomo 1990),coincided with privatization where the government transferred assets fromtrust agencies to individuals. This was mirrored in the decline in the corre-sponding share of trust agencies from 6.7 per cent (1980) to 2 per cent (1995)(Table 3.06).
However, despite the steady increase in the Malay share of capital, therehave been significant dilutions of Malay interests in privatized enterprises(see Arab-Malaysian Merchant Bank et al. 1995: Table 2.16, cited in Jomo2002). Malay interests divested RM1.79 billion worth of shares in publiclylisted companies up to 1993, of which 53 per cent were shares of companieslisted during 1990–92, indicating a ‘lack of sustaining power of [Malays] tohold the equity in the long-term’ and ‘the pursuit of short-term capital gains’(Malaysia 1996: 210; 2001b). This suggests that privatization failed to pro-duce a dynamic class of efficient Malay entrepreneurs (Rasiah and Ishak2001), with Malay participation restricted to property, construction, financeand other non-tradable sectors, and dependent on continued governmentsupport and intervention. Failure was reflected in state restructuring,bail-outs and takeovers of companies owned by the small group of Malaycapitalists who received the bulk of privatization.
Why did privatization fail?
From the evidence in the previous section, the performance of Malaysia’sprivatization programme is mixed at best and clearly failed to meet long-term
Table 3.06 Malaysia: Malay ownership of share capital (%) (selected years)
Year Total Individual Trust agencies
1971 4.3 2.6 1.71975 9.2 3.6 5.61980 12.5 5.8 6.71985 17.8 10.1 7.71990 19.3 14.2 5.11995 20.6 18.6 2.01999 19.1 12.8 17.4
Source: Adapted from Malaysia (1981, 1986, 1996, 2001a).
64 Institutional and political failure

NEP objectives of creating an independent Malay capitalist class. This is ofimmediate relevance to our discussion (and the case studies that follow) asit relates to the government’s ability to promote learning and commercialviability through privatization in order to address problems arising fromthe NEP. The literature has attributed failure to the government’s ex antemistakes as a result of ethnic considerations and political patronage whichaffected rational economic policy, undermining efficiency and promotingunproductive rent-seeking. However, this focus on ex ante mistakes down-plays the political (and information) constraints which invariably result inpoor privatization decisions in the first place, and which then necessitateex post corrective measures in the form of regulation and the management ofsubsidies if privatization is to be successful.
Evidence shows that the Malaysian government has historically lackeddisciplinary capacity, failing to withdraw subsidies or protection, for example.Privatization did not improve the government’s disciplinary capacity, whichcontinued to be constrained by existing patron–client relationships, thescarcity of capital and social costs of bankruptcy. Failure in the end was dueto the state’s inability to correct mistakes that were made based on ethnicallyor politically motivated decisions, or information that turns out ex post tohave been flawed. This ex post failure to correct mistakes is more importantthan the ability to make the correct ex ante decisions and provides a moreuseful explanation for the performance of Malaysia’s privatization pro-gramme which was characterized by the government’s inability to enforcediscipline. Constraints on the government’s disciplinary capacity can betraced back to changes in social relations under the NEP and privatization.
Ex ante failure
Ethnic redistribution
The increase in state intervention under the NEP in favour of ethnic redistri-bution has been associated with a dramatic increase in the scope of patronageand rent-seeking at the expense of rational economic policy (Tan, T.W. 1982;Jomo 1986, 1993a; Jesudason 1989; Jomo and Gomez 2000), with the stateunconstrained by social forces, including a weak private sector, and financedby its considerable resources, in particular oil revenues (Jesudason 1989). TheMalay-dominated state elite aligned itself with foreign capital (in order tobypass Chinese businesses) in exchange for directorships, joint-ventures, andother passive, essentially rentier, rewards (Lubeck 1992; Henderson andApplebaum 1992b). Consultation between state and business was neglectedin favour of inter-ethnic political bargains that benefited an unproductiverentier bourgeoisie beholden to a political patronage system legitimated byethnic chauvinism and thus hostile to the discipline of market competition(Gomez 1990, 1991; Lubeck 1992).
Rents were largely redistributive and not designed to promote learning,
Institutional and political failure 65
while the process of capital accumulation was channelled to serve politicaland ethnic imperatives. The result was an inefficient and fragile Malaybourgeoisie as ‘political elites were rewarded precisely for breaking the rulesof market rationality’ and economic inefficiency was compensated bypolitical rewards for UMNO (Jesudason 1989: 99–100). NEP licences, con-tracts, concessions and political access to enormous funds from the bankingsystem contributed to the rapid growth in the number of Malay businessmenand allowed UMNO to provide benefits to its supporters and strengthenparty loyalty (Crouch 1992; Khoo K.J. 1992). This became a more importantcriterion than technical competence, with party discipline enforced throughthe threat of recalling loans (Gale 1981; Mehmet 1988; Jesudason 1989;Gomez 1990; Crouch 1992; Gomez and Jomo 1997; Searle 1999). Policychanges (and failure) are attributed to changes in the balance of powerbetween ethnic groups. Increasing state intervention is seen as a result of abreakdown of the ‘consociational’ framework (Jesudason 1989) or changes inthe ‘communal settlement’ (Bowie 1991) where one ethnic group gains theupper hand, leaving the state unconstrained to act. Here, the state is viewedthrough ‘public choice theory’ lenses, comprising self-serving bureaucratsand politicians who abuse their power, especially when unchecked by theprivate sector.
This analysis of the state independent of social forces (and its assumptionsof the motivations of the private sector) is problematic, and fails to identifythe political forces behind state actions and the groups or factions whichstand to gain or lose. As such, the question of state autonomy is notaddressed, and it remains unclear in whose interest the state acts, given thatpolicies have favoured certain groups over others and that the state has alsoimplemented industrial strategies which also benefited non-Malay businesses,sometimes at the expense of Malays. As a result, increasing conflict inUMNO remains outside this framework. This is a crucial point becauseincreasing intra-ethnic, rather than inter-ethnic, conflict has been the maincause of political instability since the 1969 ‘race riots’, and central to howresources have been allocated.
By ignoring this, ethnic accounts break down when attempting to explainprivatization. This was less a response to Chinese capital’s ‘obstructionism’during the NEP (Bowie 1991) and more to changes in social relations withinthe Malay community, specifically the emergence of the new Malay middleand business class pushing for a shift in resource allocation in its favour. It isin this context that ethnic considerations can partly account for ex ante mis-takes related to the choice of candidates, though this needs to be viewed morebroadly in terms of learning failure under the NEP (as discussed previously).The NEP was itself the result of political (more so than ethnic) imperatives toaccommodate an increasingly impatient Malay middle class. Governmentpolicies were the outcome of changes in the balance of power within UMNOrather than between Malays and non-Malays, and state actions were a reflec-tion of this. Privatization was a continuation of redistributive policies, this
66 Institutional and political failure
time benefiting a newly emerged group of businessmen closely associatedwith a segment of the UMNO leadership, and whose support was crucial inthe party’s leadership contests. This allowed Mahathir to consolidate hisposition as party president and push through policies which rewarded hissupporters but which also aimed to address efficiency and technological con-straints under the NEP. However, for reasons discussed earlier, these politicalmotivations affected ex ante decisions, namely the types of privatizationpursued, how (and to whom) this was allocated, and the types of institutionsthat were created.
Political patronage
Ethnic explanations tend to converge with arguments about political patron-age and crony capitalism, but these have tended to be largely descriptive. The‘political business’ model, on the other hand, seeks to explain how politicians,and not the state, distribute rents (through the state) by looking at howthe changing balance of power between capital and the state affects ‘thedynamics of policy-making and policy implementation’ (Gomez 2002b: 3, 7).This is an instructive approach which allows us to establish ‘the institutionsor actors in whom power is centred, and the nature of the relationshipbetween capital and the state’, thereby determining how rents are allocated(Gomez 2002b: 7). Political funding by business is central in influencingthe distribution of rents through factions (loosely based around a leader)(Gomez 2002b). As a result, privatization increased rent-seeking and moneypolitics, and led to a highly geared and unsustainable conglomerate-styleexpansion, where the politically powerful dominated financially profitablebut rentier activities (Gomez 1991, 2002c; Rasiah 1998, 2001). This was com-pounded by the absence of an open tender system as a result of a ‘first come,first served’ policy which allowed the government to allocate resources on thebasis of political and personal connections (Jomo 1994). Privatizationbeneficiaries were not competent enough because their selections were notbased on strict economic criteria as political considerations outweighedeconomic optimality (e.g. see Wedeman 2002).
One of the difficulties in the political business model though is that statecapacity is equated with autonomy, with the degree of state independencefrom capital said to determine the level of corruption and form of rent distri-bution (Gomez 2002b, 2002c). This assumes that the state can be independentof social forces, and can act and implement policies without political con-straints. While the nature of the state’s relationship with capital is central toits analysis, the model does not explicitly explain how this relationship affectsgovernment policy and capacity. Furthermore, it presumes that the correctchoice of candidate would have made a difference. This is similar toMahathir’s arguments in favour of handpicking candidates (to prevent lobby-ing or outright corruption from influencing policy decisions) (Felker 1998;Mahathir 1998a, 1998b), the main difference being that the political business
Institutional and political failure 67
model emphasizes transparent, as opposed to personalized, selection pro-cesses. Here, the leadership was aware of the importance of selection,33 andbelieved its choice of rich, successful businessmen ‘had already proven theirability to run big operations’ and thus their ability to improve the perform-ance of companies to be privatized (Mahathir, quoted in New Straits Times,27 November 1995; also see Mahathir 1998a, 1998b). Failure can then beattributed to ex ante mistakes in the wrong choice of candidates.
However, the arguments are flawed in both cases given the constraints ofasymmetric information and available entrepreneurial capacity. It is alsodebatable whether competitive bidding would even be possible in the contextof resistance to change and other political considerations (Ismail and Osman1991) as increasing political competition and conflict would place politicalloyalty above economic criteria. Furthermore, a more transparent selectionprocess may not improve the quality of candidates given the lack of entre-preneurial capacity, types of enterprises and serious industry challenges. Interms of our four case studies, it is unlikely that there were more suitablecandidates with experience in building and operating a national sewerage orurban rail system, running a major airline or manufacturing cars. The taskis therefore not so much to select winners but rather to create successfulcapitalists in these areas through a combination of incentives and effectivesanctions to enforce conditionalities. Here, the government sought to developa handful of very large industrialists with ‘the acumen to accumulate wealth’to contribute to industry and commerce, providing employment and govern-ment revenue (Mahathir 1986: 11). This was closely modelled on the success-ful experiences of South Korea which Mahathir sought to emulate. However,South Korea’s success was not due to ‘picking winners’ but rather ‘creating’winners by setting export performance and productivity targets, and with-drawing support whenever performance lagged (Alavi, R. 1996; Wade 2003).This means that the effectiveness and efficiency of government actiondepends on ex post measures, in particular its disciplinary capacity.
Ex post failure
While ethnic and political factors affected ex ante decisions, the main prob-lem the government faced was in its ex post failure to correct mistakes. Thisfailure to enforce discipline and promote learning appears to be a historicalproblem, with the state constrained at various periods by different factors, inpart related to ethnic and political considerations. However, the literature onethnic considerations and political patronage is generally divorced from thediscussion of the key industrial and technological challenges facing the statewhich privatization partly sought to address.
There is evidence that the government was aware of ex ante mistakesrelated to privatization and attempted to address these, suggesting that ethnicand political considerations were tempered by an economic imperative asthere were limits to efficiency losses the government was prepared to accept.
68 Institutional and political failure

As successful privatization requires the state to make the correct decisionsand then to correct decisions that turn out ex post to have been incorrect, weneed to examine what constrained the government’s political capacity todo so in order to explain why privatization failed. Furthermore, as ethnicmotivations and patronage networks were largely a result of underlyingpolitical forces, it is necessary to examine these political factors, rather thantheir manifestation, if we are to identify the constraints to the government’sex post political capacity.
Ethnic-based explanations also invariably simplify changing social rela-tions, downplaying the conflict within UMNO which affected the state’s dis-ciplinary capacity. Here, aspects of the political business model (Gomez2002b, 2002c) can offer greater insight by examining the relationship(through patron–client networks) between different segments of capital withfactions within the political leadership. We will build upon both these argu-ments to show how the government’s disciplinary capacity was constrained,why the government historically failed to enforce discipline, why privatizationdid not improve the government’s disciplinary capacity, and how this affectedthe performance of privatization, specifically the four case studies.
Disciplinary constraints under the NEP
Although the NEP allowed the government to centralize redistribution,it also resulted in the overexpansion of the public sector, with the emergenceof a small but powerful ‘bureaucratic-capitalist elite’ capturing rents andexercising considerable influence over policy (Jomo 1986; Mehmet 1988;Bowie 1991; Bruton 1992; Jomo and Tan 1999). This introduced managerialand control problems as state bureaucrats entrenched themselves and resistedgovernment attempts to discipline them, with policy adjustments becomingincreasingly more difficult (Bruton 1992). The government sought to addressthese problems by closing down loss-making SOEs34 (Tan C.K. 1984) andreducing public expenditure after 1983. However, the public deficit remainedhigh as SOEs were less subject to budgetary discipline (Ismail and Osman1991; Jomo 2002).
The government’s disciplinary capacity has been constrained since the1970s, with concerns raised in two Malaysia Plans regarding the efficiencylosses due to protection (Alavi, R. 1998), and again in 1983 by the MalaysianIndustrial Policy Study (Malaysia 1983b) which recommended the halvingof average levels of protection (Jomo and Edwards 1993). Despite this,inefficient import-substituting industries continued to receive high (and evenincreasing) levels of protection without proper evaluation, monitoring orperformance conditions, and irrespective of productive capabilities, allowingunsuccessful firms to waste rents (Bruton 1992; Alavi, R. 1996, 1998; Jomoand Tan 1999; Rasiah and Ishak 2001; Rasiah 2001).
Selective state intervention was of a much poorer quality and considerablyless effective than in Taiwan and South Korea in the 1960s and 1970s, with
Institutional and political failure 69
little evidence of rent deployment favouring industrialization or productiveuse, and a reliance on foreign rather than domestic-led manufacturing growth(due to the lack of Malay entrepreneurial ability and the desire to constrainChinese capital) (Jomo and Tan 1999). The state’s failure to direct domesticcapital into strategic manufacturing industries adversely affected industrial-ization (Jesudason 1989; Bowie 1991; Felker 1998; Jomo and Tan 1999), pre-venting the emergence of an efficient, ‘deepening’ industrial policy (Jomoand Tan 1999: 303). Instead, rents provided wrong incentives, encouragingefficient companies into protected sectors. Furthermore, foreign-dominatedmanufactured exports had few production or technological linkages (seeFelker 1998: 83). The result was a weak technological base and inadequatehuman resource development and skills formation (Malaysia 1985). Theprivate sector was unable to provide comprehensive and detailed industry-level information (to guide policymaking) or mobilize large networks ofproducers to respond to government initiatives and incentives due to the top-down nature of networks (where private sector appointments are based onpersonal friendship or reputation) and the legacy of ethnically fragmentedbusiness networks and representation (Felker 1998).
Central to the discussion of industrialization is thus the process of tech-nological innovation and, related to this, the role of the state. The state needsto underwrite the high cost of information about technology, especially whengains are large, with economies of scale (Jomo and Edwards 1993), and pro-vide incentives for innovation (i.e. Schumpeterian rents) (e.g. see Khan2000b). However, protection does not guarantee success unless it induceslearning (Bruton 1998). The capacity to learn is said to depend on industry’s‘collective learning’ ability (facilitated by human capital and competitivepressures from exporting) and ‘knowledge accumulation’ (learning-by-doing), as well as the ability of the government to learn from its mistakes(Bell et al. 1984; Jacobsson 1993; Bruton 1998; Kim 2004). More importantly,learning will depend on the government’s capacity to enforce conditionalsubsidies and correct mistakes once identified.
The Heavy Industries Corporation (HICOM) was the government’sattempt to address the issue of absorbing complex organizational and pro-duction processes necessary for technological upgrading and industrylinkages.35 However, as heavy industries were set up to serve domestic, ratherthan export, markets, there was no systematic attempt to guide or monitorthe technological development process, with the sector characterized bysoft budgets (Lall 1995) and the lack of performance targets and condition-alities. Learning was also compromised by the complex nature of thetechnology, lack of (Malay) skills and desire to bypass Chinese capital. Thegovernment later sought to address HICOM’s poor performance byreplacing the (Malay) management with foreigners and non-Malays inthe 1980s, and later privatizing the company (which included its subsidiaryProton). Privatization can therefore be partly seen as an attempt to improvethe technological acquisition and industrial upgrading process. The success
70 Institutional and political failure

of privatization then depended on whether the government was better ableto enforce discipline in order to address these technological and learningchallenges.
Disciplinary constraints under privatization
The government tried to address technological and learning challengesthrough a policy shift in the early 1980s, culminating in the introduction ofprivatization. The ‘Look East’ policy in 1981 sought to raise productivityand competitiveness by changing attitudes and work habits (Bruton 1992).This was followed by ‘Malaysia Incorporated’ in 1983 which aimed to buildnetworks with the organized business sector to improve government-businesscoordination and engage the private sector in pursuing goals in industrialupgrading. This institutionalizing of direct, high-level, public-private net-works also aimed to free policymaking from inefficiencies and inadequateoversight of bureaucratically minded industrial policy of the 1970s and 1980sby centralizing decision-making and rent allocation (Felker 1998).
Privatization facilitated the shift of power away from the bureaucracy bycentralizing authority in economic policymaking (in the Prime Minister’sDepartment) and elevating links between political and select business leaders,drawing ‘business into greater consultation within clientelist channels at theapex of the political party and government system’ (Felker 1999: 104; Leigh1992). This allowed ‘political elites to de-bureaucratise policy-making’, reinin SOEs and streamline regulation, and, through the dialogue processwith business, discipline the bureaucracy for greater efficiency, particularly ineconomic regulation (Felker 1999: 104). The government was increasinglyunwilling to subsidize broadly, focusing on public-allocated growthopportunities more narrowly among a small group of entrepreneurs throughthe management of key government-linked projects in order to overcomedistributional constraints and inefficiencies (Felker 1993).
This shift occurred in the broader context of greater authoritarianism asMahathir sought to consolidate power in his party and government inresponse to increasing intra-party political contestation and his narrowvictory in UMNO elections. Growing conflict increased the importance ofpatron–client networks in winning intra-party contests. The leadershipresponse was to develop more centralized and personalized patron–clientrelationships (mainly around the Prime Minister and Finance Minister and,to a lesser extent, Deputy Prime Minister Anwar Ibrahim) which alsoaffected privatization decisions and institutional arrangements. Decisionswere made by Mahathir and in particular, Daim, widely regarded as thearchitect behind Malaysia’s privatization programme and believed to havenamed the (‘first come, first served’) beneficiaries. His continued influenceeven after stepping down as Finance Minister was reflected in the continuedallocation of privatizations to his close associates, some of whom werebelieved to have been acting as his proxies. Evidence shows that the bulk of
Institutional and political failure 71
major privatizations were awarded to close associates (and even familymembers) of Daim and Mahathir, strongly suggesting that privatization wasused to secure and reward political support (e.g. see Gomez 1990, 1991, 1994,1997). Daim also allegedly profited personally from some of the biggestprivatizations (e.g. MAS, LRT System 2, North-South Highway) which wentto his close associates and protégés, some of whom admitted that they wereacting as proxies for UMNO (whose finances were controlled by Daim asparty treasurer) (Yusoff 1990; Gomez 1991).
Personalized patron–client networks involving vested party and individualinterests led to moral hazard, making it difficult to then discipline clients,particularly given the increasing competition and conflict in the party. Themore intense the competition, the more dependent the patron was on theclient for support, and the more personalized the patron–client relationshipbecame. Mahathir’s resort to increasing authoritarianism to reassert centralcontrol suggests the lack ‘of negotiative power’ (i.e. the political capacityto impose discipline on clients through negotiated processes) (see Weiss andHobson 1995). There were also further moral hazard problems arising fromthe national or economic importance of many privatizations (e.g. infra-structure, public services) (see Chang and Singh 1997). As such, privatizationdid not promote a more ‘arm’s length’ relationship between government andenterprise, or improve the credibility of the government not intervening in thelikelihood of failure, particularly in the four case studies that follow.
Conditions for successful privatization
We started out by asking three questions: Why did Malaysia privatize? Whydid privatization fail? What are the important conditions for success? Thesequestions are closely related. Motivations for privatization affect privatiza-tion decisions, institutional arrangements and performance outcomes. Thismakes it necessary to locate privatization in a country context in order toidentify its motivations, causes of failure and conditions for success. Wehave argued that Malaysia’s privatization programme was motivated by botheconomic (efficiency) and political (redistributive) considerations, but thatthe latter was more important. Key decisions (about what was privatized,how and to whom, and about the regulatory framework) were mainly shapedby political factors. As such, Malaysia’s privatization programme was drivenby redistributive priorities, with the bulk of privatizations going to Malaybeneficiaries and focused on non-tradable/non-competitive sectors consistentwith the preferences and abilities of this group, namely in constructionand services, and mainly through (BOT) concessions. Moreover, many keyprivatizations, including the four case studies that follow, were awarded to asmall group of (mainly Malay) businessmen closely associated with a factionof UMNO’s leadership.
Privatization was characterized by non-transparent, personalized selec-tion; undisclosed contracts; weak personalized regulation (also see Leeds
72 Institutional and political failure
1989, cited in Cook and Kirkpatrick 1995: 306–307; Lee, C. 2004); and a widescope of modes, including private sector-initiated projects. Conventionalarguments attribute these to the problems of patronage and corruptionassociated with weak economic and political institutions. However, this failsto identify the reasons for weak institutions because it assumes that privatiza-tion is largely undertaken for economic reasons and ignores political factorswhich drive such decisions. The literature on Malaysia examines some ofthese political motivations but generally attributes failure to ethnic concernsand crony capitalism, failing to explain why weak institutions persist. Infact, privatization decisions ignored (admittedly weak) official guidelines forfeasibility and desirability, suggesting that the problem was not just due toinstitutional failure but also the government’s political failure to implementpolicy.
In contrast to these explanations, we have argued that privatization waspolitically driven by changes in social relations within the Malay communityand UMNO specifically. This can be traced back to the emergence of a newMalay middle and business class under the NEP which led to increasingconflict and leadership contests in the party. The ascendancy of a pro-business faction in UMNO shifted the balance of power and enabled thetransfer of the control of state assets from bureaucrats (under the NEP) topoliticians. Ongoing conflict over resources in UMNO led to Prime MinisterMahathir consolidating authority by centralizing decision-making and allo-cating privatization assets to his supporters through increasingly per-sonalized patron–client networks, with regulation similarly centralized andpersonalized. This allows us to explain the non-transparent processes andinherent regulatory weaknesses which led to ex ante mistakes in privatizationdecisions and design. The performance of privatization here was affected bythe government’s ex ante failure to ensure project viability, proper privatiza-tion design, contract and regulatory design, and selection as discussed inChapter 2. However, as these decisions were politically unavoidable (andarguably necessary for political stability), it was more important for thegovernment to be able to correct ex ante mistakes. Here too, the governmentfailed to implement conditionality and enforce discipline, and it is this ex postfailure that led to failure in all of our four case studies.
The four failed privatizations to be investigated were thus characterized bythe state’s ex ante and ex post failures. Ex ante (institutional) failure relatedto the choice of industry and candidate, weak contract and regulatory design,and non-transparent and personalized selection, with beneficiaries closelyassociated with individual political leaders (Table 3.07). The privatizationsof the Kuala Lumpur LRT, MAS and national car manufacturer Proton,though ‘desirable’ (in terms of promoting economic development andimproving the provision of goods and services) were arguably not ‘feasible’(in terms of potential profitability and attractiveness to the private sector)without ongoing state support. The general inability of urban rail net-works to meet operational, let alone capital, costs should have made the LRT
Institutional and political failure 73
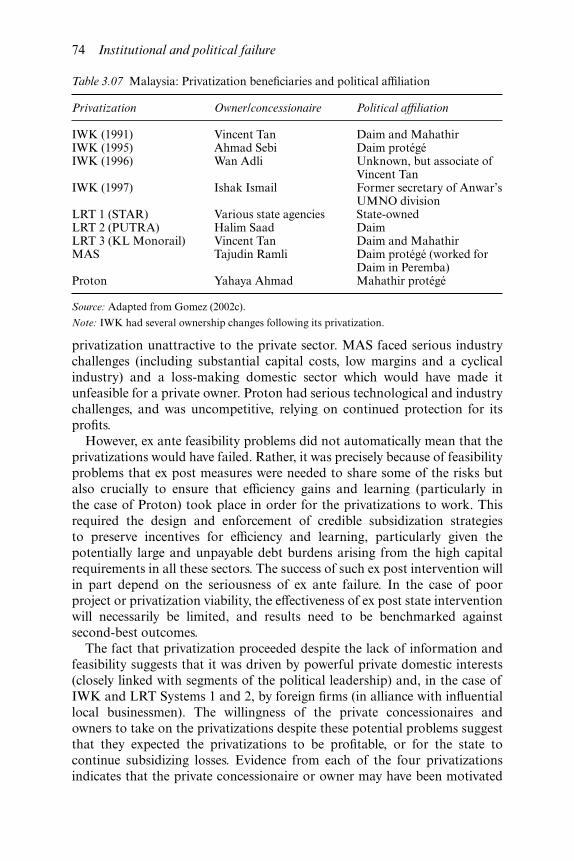
privatization unattractive to the private sector. MAS faced serious industrychallenges (including substantial capital costs, low margins and a cyclicalindustry) and a loss-making domestic sector which would have made itunfeasible for a private owner. Proton had serious technological and industrychallenges, and was uncompetitive, relying on continued protection for itsprofits.
However, ex ante feasibility problems did not automatically mean that theprivatizations would have failed. Rather, it was precisely because of feasibilityproblems that ex post measures were needed to share some of the risks butalso crucially to ensure that efficiency gains and learning (particularly inthe case of Proton) took place in order for the privatizations to work. Thisrequired the design and enforcement of credible subsidization strategiesto preserve incentives for efficiency and learning, particularly given thepotentially large and unpayable debt burdens arising from the high capitalrequirements in all these sectors. The success of such ex post intervention willin part depend on the seriousness of ex ante failure. In the case of poorproject or privatization viability, the effectiveness of ex post state interventionwill necessarily be limited, and results need to be benchmarked againstsecond-best outcomes.
The fact that privatization proceeded despite the lack of information andfeasibility suggests that it was driven by powerful private domestic interests(closely linked with segments of the political leadership) and, in the case ofIWK and LRT Systems 1 and 2, by foreign firms (in alliance with influentiallocal businessmen). The willingness of the private concessionaires andowners to take on the privatizations despite these potential problems suggestthat they expected the privatizations to be profitable, or for the state tocontinue subsidizing losses. Evidence from each of the four privatizationsindicates that the private concessionaire or owner may have been motivated
Table 3.07 Malaysia: Privatization beneficiaries and political affiliation
Privatization Owner/concessionaire Political affiliation
IWK (1991) Vincent Tan Daim and MahathirIWK (1995) Ahmad Sebi Daim protégéIWK (1996) Wan Adli Unknown, but associate of
Vincent TanIWK (1997) Ishak Ismail Former secretary of Anwar’s
UMNO divisionLRT 1 (STAR) Various state agencies State-ownedLRT 2 (PUTRA) Halim Saad DaimLRT 3 (KL Monorail) Vincent Tan Daim and MahathirMAS Tajudin Ramli Daim protégé (worked for
Daim in Peremba)Proton Yahaya Ahmad Mahathir protégé
Source: Adapted from Gomez (2002c).
Note: IWK had several ownership changes following its privatization.
74 Institutional and political failure

by potential short-term rents instead of longer-term profits arising fromimproved operational efficiency. This is most evident in the case of the LRT(where construction costs were higher than comparable regional networks)and Proton (where the company continued to rely on profits from a protecteddomestic market). Even in the case of IWK, privatization was very likelydriven by the prospect of monopoly rents from compulsory sewerage charges.Irregularities at MAS suggest that rents may have been earned from thepurchase of aircraft and the creation of subsidiaries. This preference forshort-term profits through rent capture was also arguably consistent with theabilities of the private operators, most of whom had no previous experiencein these or related sectors.
Here, the government failed to address potential moral hazard problemswhich made these short-term rents more attractive than potential profitsarising from greater efficiency in operations and production. However, thisis not to say that failure was due to the poor choice of candidates. As men-tioned, the selection of these candidates was politically and economicallycircumscribed, and also needs to be considered in terms of state effortsto create domestic capitalists. In this context, it was crucial the governmenthad the capacity to manage the subsidies necessary for ensuring that theprivatization was viable. It therefore needed credible sanctions to ensure thatthe privatizations addressed industry challenges (see Table 3.08). Instead,failure was ultimately due to the government being unable to implementthe necessary ex post measures to address industry challenges and promotelearning. There is evidence that the government attempted but failed toenforce the collection of tariffs (IWK), coordinate investment and publictransport policy (LRT), and enforce discipline (Proton, MAS).
Each of these failures highlights the different political constraints to thestate’s political capacity. With the possible exception of IWK, these politicalfailures can be partly explained by changes in social relations which increasedcompetition for resources in UMNO and changed the nature of patron–clientnetworks, compromising privatization decisions, related institutions andregulation, and ultimately the government’s capacity to correct mistakes. Thegovernment’s disciplinary capacity had historically been weak, and attempts,through privatization, to improve (Malay) private sector inefficiency arisingfrom the NEP largely failed. This was partly because successful privatizationrequired the effective management of rents, yet privatization per se did notenhance the state’s political capacity to enforce the rules and conditionalityintegral for the success of any subsidy programme.
This allows us to explain why the completion of LRT System 3 was con-siderably delayed and the project scaled down without penalties (when theconcessionaire ran out of money) as the concessionaire was closely associatedwith the Prime Minister and Finance Minister. As for LRT System 2 andMAS, the owners were closely related to UMNO, and in particular, Daim,possibly even acting as proxies. This may explain why the government failedto intervene earlier in the case of MAS, and why its owner and LRT System 2
Institutional and political failure 75
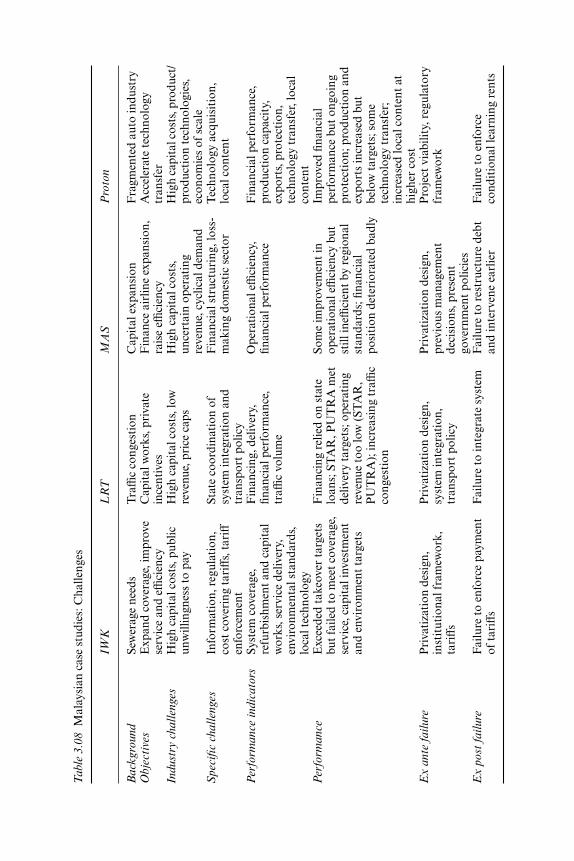
Tab
le 3
.08
Mal
aysi
an c
ase
stud
ies:
Cha
lleng
es
IWK
LR
TM
AS
Pro
ton
Bac
kgro
und
Sew
erag
e ne
eds
Tra
ffic
cong
esti
onC
apit
al e
xpan
sion
Fra
gmen
ted
auto
indu
stry
Obj
ecti
ves
Exp
and
cove
rage
, im
prov
ese
rvic
e an
d effi
cien
cyC
apit
al w
orks
, pri
vate
ince
ntiv
esF
inan
ce a
irlin
e ex
pans
ion,
rais
e effi
cien
cyA
ccel
erat
e te
chno
logy
tran
sfer
Indu
stry
cha
lleng
esH
igh
capi
tal c
osts
, pub
licun
will
ingn
ess
to p
ayH
igh
capi
tal c
osts
, low
reve
nue,
pri
ce c
aps
Hig
h ca
pita
l cos
ts,
unce
rtai
n op
erat
ing
reve
nue,
cyc
lical
dem
and
Hig
h ca
pita
l cos
ts, p
rodu
ct/
prod
ucti
on t
echn
olog
ies,
econ
omie
s of
sca
leS
peci
fic
chal
leng
esIn
form
atio
n, r
egul
atio
n,co
st c
over
ing
tari
ffs,
tar
iffen
forc
emen
t
Stat
e co
ordi
nati
on o
fsy
stem
inte
grat
ion
and
tran
spor
t po
licy
Fin
anci
al s
truc
turi
ng, l
oss-
mak
ing
dom
esti
c se
ctor
Tec
hnol
ogy
acqu
isit
ion,
loca
l con
tent
Per
form
ance
indi
cato
rsSy
stem
cov
erag
e,re
furb
ishm
ent
and
capi
tal
wor
ks, s
ervi
ce d
eliv
ery,
envi
ronm
enta
l sta
ndar
ds,
loca
l tec
hnol
ogy
Fin
anci
ng, d
eliv
ery,
fina
ncia
l per
form
ance
,tr
affic
volu
me
Ope
rati
onal
effi
cien
cy,
fina
ncia
l per
form
ance
Fin
anci
al p
erfo
rman
ce,
prod
ucti
on c
apac
ity,
expo
rts,
pro
tect
ion,
tech
nolo
gy t
rans
fer,
loca
lco
nten
tP
erfo
rman
ceE
xcee
ded
take
over
tar
gets
but f
aile
d to
mee
t cov
erag
e,se
rvic
e, c
apit
al in
vest
men
tan
d en
viro
nmen
t ta
rget
s
Fin
anci
ng r
elie
d on
sta
telo
ans;
ST
AR
, PU
TR
A m
etde
liver
y ta
rget
s; o
pera
ting
reve
nue
too
low
(ST
AR
,P
UT
RA
); in
crea
sing
tra
ffic
cong
esti
on
Som
e im
prov
emen
t in
oper
atio
nal e
ffici
ency
but
still
ineffi
cien
t by
reg
iona
lst
anda
rds;
fina
ncia
lpo
siti
on d
eter
iora
ted
badl
y
Impr
oved
fina
ncia
lpe
rfor
man
ce b
ut o
ngoi
ngpr
otec
tion
; pro
duct
ion
and
expo
rts
incr
ease
d bu
tbe
low
tar
gets
; som
ete
chno
logy
tra
nsfe
r;in
crea
sed
loca
l con
tent
at
high
er c
ost
Ex
ante
failu
reP
riva
tiza
tion
des
ign,
inst
itut
iona
l fra
mew
ork,
tari
ffs
Pri
vati
zati
on d
esig
n,sy
stem
inte
grat
ion,
tran
spor
t po
licy
Pri
vati
zati
on d
esig
n,pr
evio
us m
anag
emen
tde
cisi
ons,
pre
sent
gove
rnm
ent
polic
ies
Pro
ject
via
bilit
y, r
egul
ator
yfr
amew
ork
Ex
post
failu
reF
ailu
re t
o en
forc
e pa
ymen
tof
tar
iffs
Fai
lure
to
inte
grat
e sy
stem
Fai
lure
to
rest
ruct
ure
debt
and
inte
rven
e ea
rlie
rF
ailu
re t
o en
forc
eco
ndit
iona
l lea
rnin
g re
nts
concessionaire were rewarded through generous buy-out terms, rather thanpenalized for failure after the government took over the enterprises. Thegovernment’s ex post capacity to correct mistakes or enforce discipline wasfurther constrained by national interests, where the economic importance ofeach project/enterprise introduced a further moral hazard, making it unlikelythe government would not intervene in the event of failure. Privatizationhere did not provide for an ‘arm’s length’ relationship as the governmentcontinued to have a vested interest. At the same time, the government wasalso unable to easily replace non-performing private owners or concession-aires because of the personalized nature of the patron–client relationship andthe limited pool of available entrepreneurs.
What we can conclude from the discussion in this and the preceding chap-ters then is that the conditions for successful privatization will depend on thepolitical context. This will necessitate looking at the state’s institutional andpolitical capacity, and the compatibility of current and proposed institutionalarrangements with the existing balance of power in society. This politicaleconomy approach provides a useful analytical framework in contrastto conventional institutional recommendations which tend to ignore thepolitical context and hence fail to identify important political constraintsfacing the state’s management of subsidies which are central to successfulprivatization. While the actual details will differ from country to country,depending on the historical and political circumstances, institutionalendowments, social relations, etc, the most important condition for successfulprivatization in the context of developing countries is the state’s ex postpolitical capacity to correct ex ante mistakes by implementing policy andenforcing discipline in relation to the management of subsidies.
Institutional and political failure 77
4 Universal access and privateprovisionMalaysia’s national seweragesystem
The provision of water and sanitation services has traditionally been publiclyprovided to ensure universal access. This has entailed affordable charges,which usually means tariff levels which cannot cover the cost of service pro-vision, let alone service expansion, particularly in developing countries.These financial constraints have resulted in the underinvestment of water andsanitation systems, with consequences for service quality and coverage. As aresult, the choice facing developing countries is usually between public pro-vision and universal access (but at the cost of increasingly poor service deliveryand coverage), or private provision with higher charges (to finance serviceimprovements and expand coverage). Privatization will therefore depend onthe ability of the private operator to charge cost-covering tariffs, or morespecifically, the public’s willingness to pay higher charges. This will ultimatelydepend on the state’s political capacity to enforce an appropriate tariff struc-ture. If higher charges are not politically viable, or if universal access remainsa priority, then the state will have to subsidize operations to attract privateparticipation and ensure the project is commercially viable. The successof privatization in this context will depend on the state’s institutional andpolitical capacity to manage any subsidy regime.
These issues are all at the heart of Malaysia’s privatized national seweragesystem. The failure of the private concessionaire to meet system coverage,capital investment, refurbishment and environmental targets can beexplained by the state’s ex ante and ex post failures. Ex ante failure related tothe government’s failure to account for information problems when privat-izing the sewerage system. The ability of the private concessionaire to under-take capital expansion depended on the commercial viability of the project,namely whether revenues were sufficient to cover capital and operatingexpenses. This in turn depended on sufficient information to determinecurrent costs and tariff levels. However, there was insufficient information oncosts and public willingness to pay. Poor data on the condition of assets andcurrent performance raised operating costs and affected the concessionaire’sability to meet service, capital investment and environmental targets. None-theless, privatization proceeded because it arguably provided opportunitiesfor monopoly rents from compulsory sewerage charges and a large capital

works programme, as well as high share prices on the stock market (throughthe control of a publicly listed company) and profits from ‘capital gains’which partly accounted for a series of ownership changes. In this sense, theex ante failure to account for information constraints was in part the resultof changes in social relations and patron–client networks. The original andsubsequent concessionaires were all aligned to sections of the political leader-ship, and each was prepared to pay a premium for a controlling stakein Indah Water Konsortium (IWK), the private concessionaire, despite theproblems of increasing costs and reduced revenues following downward tariffrevisions.
Rather than subsidize the operator to keep sewerage charges low, thegovernment chose to structure tariffs so that industry and business heavilycross-subsidized household customers, but without first determining thepolitical viability of this tariff structure. This led to opposition from bothhousehold and commercial/industrial customers, resulting in several tariffrevisions. The inability to enforce this tariff structure was a reflection of thegovernment’s ex post failure, and this further affected the concessionaire’sfinancial performance and ability to finance capital expansion. However,despite these tariff revisions, IWK was still considered commercially viableprovided there were no bill collection problems. This was not the case, and thecontinued non-payment of bills by both household and commercial/industrialcustomers resulted in serious cash flow problems and the concessionaire’sinability to continue operations. IWK’s failure was therefore ultimately theresult of the state’s ex post failure to impose credible subsidization strategiesand, crucially, to enforce the payment of tariffs.
This political (rather than information or institutional) failure underlinesthe basic fact that the operation of any private sector activity requires anunderlying state enforcement of rights and contracts that cannot be taken forgranted in developing countries, even those with apparently ‘hard states’ likeMalaysia. Successful privatization in this case thus depends foremost on thestate’s ex post (political) capacity to enforce policy. This case study alsohighlights the difficulties of implementing cost-covering tariffs for essentialservices, especially in developing countries. Such tariffs often cannot bedetermined through simple cost-benefit analysis (even with sufficient infor-mation) and will instead have to be negotiated or set by the government at alevel which is economically viable and politically acceptable. As this will beunlikely to cover costs and provide a reasonable rate of return for the conces-sionaire, it will require operational subsidies and ongoing state interventionin the form of regulation.
This chapter is structured as follows. The next section examines thechallenges faced by the privatization of sewerage treatment systems. This isfollowed by a background to the privatization and subsequent renationaliza-tion of the national sewerage system, and evaluation of performance in termsof delivery (the number of sewerage systems taken over, service provision,maintenance, capital works, effluent quality) and other objectives (local
Malaysia’s national sewerage system 79

technology, Malay ownership). The next section examines the government’sex ante and ex post failures which affected IWK’s performance, lookingat information, institutional and political failure. The concluding sectionsummarizes the main causes of IWK’s failure and important conditions forsuccessful privatization.
Challenges
Public sector inefficiencies, and the increasing and considerable cost of waterand sanitation infrastructure, are the two main reasons for privatization.Large infrastructure projects such as water supply and sewage treatment arehampered by inefficient operations and the lack of adequate funds (to operateand maintain existing facilities, and to build new systems). In addition, thecost of development of each cubic metre of water for the next generation ofprojects has been estimated at two to three times higher than the previousgeneration, and low- and medium-income countries are expected to spend upto 1 per cent of GDP (US$50 billion a year) on water and sanitation servicesby 2010 (Biswas 2000). The possible inefficiency of the public sector is par-ticularly serious in this context. Public sector water and wastewater utilitieswere found to be operating below acceptable levels of performance withpoor management (antiquated management techniques, poorly trained andmotivated managers and staff, unattractive salaries, regular political inter-ference in management practices and decision-making process) and lowproductivity (overstaffing), while inadequate pricing and inefficient billingand bill collection systems prevented utilities from raising financial resourcesneeded for maintaining and operating adequately, and prevented thegeneration of much-needed funds for investing in system rehabilitation andexpansion (World Bank 1994; Stottmann 2000; Biswas 2000).
Privatization is thus seen to offer developing countries the chance to:
1 acquire technical and managerial expertise and better technologies toimprove economic efficiency in both operational performance and use ofcapital investment;
2 inject investment capital into the sector or gain access to private capitalmarkets;
3 insulate the sector from short-term political intervention in utilityoperations and limit opportunities for intervention by powerful groups;and
4 turn around or restructure failing public enterprises (Biswas 2000).
The ability and willingness of the operator to improve efficiency andundertake capital investment will, however, depend on the incentive structureof the concession and a regulatory framework to distribute the benefitsbetween the concessionaire (in the form of profits) and consumers (throughlower prices and better services). Under a well-structured contract,
80 Malaysia’s national sewerage system
profitability will depend on how much the operator can reduce costs whilestill meeting the performance standards set out in the concession agreement.The private sector must feel the deal is financially feasible, especially if it isexpected to invest in system rehabilitation or expansion. High profits here willmake it easier for the concessionaire to invest in capital works but may notprovide incentives to improve operational efficiency. A regulatory frameworkis thus needed to preserve incentives by enforcing targets for performance(service coverage, quality) and capital investment, as well as adjust tariffs andarbitrate disputes.
Central to the system’s commercial viability is the issue of seweragecharges which should cover operating costs and provide a reasonable returnon capital if the operator is to have the incentives to remain efficient andundertake capital expansion. The setting of tariffs is both a technical andpolitical process. It requires a detailed knowledge of the utility’s currentoperational and maintenance costs; current tariff levels and the efficiencyof revenue collection; current and projected demand for sewerage services;capital costs of improvements and annual expenditures necessary to maintainservice levels; availability of funding for service improvements throughgrants, equity and loans; and additional operational costs for systemexpansion, as well as likely efficiency gains that the private operator mightachieve. However, while high profits can facilitate capital investment, thiswill in part depend on whether cost-covering tariffs are publicly acceptable,especially in developing countries. Because sewerage charges are generallyvery sensitive, a key challenge is in determining an acceptable tariff level interms of what consumers are willing to pay, as misjudging consumer demandmay contribute to poor sanitation system design and performance (e.g. seeCorreia 1998). The main challenge facing governments is thus to balanceeconomic and political requirements by determining appropriate tariff levelsnecessary to preserve private sector incentives while accounting for politicalsensitivities and public willingness to pay. The setting of tariffs must thereforealso take political considerations into account while ensuring the viability ofthe utility.
Assessment of sanitation demand can be conducted through a variety ofmethods, although these can be costly and unreliable, involving complex,multi-faceted issues. It is important to also have mechanisms to raise publicawareness and form public opinion, for example through regular mediareports about drinking water quality, environmental water quality and risksof pollution, and the cost of water supply and sewerage (Kraemer 1998).However, awareness and support for sewerage treatment will also depend onconsumer ability and willingness to pay, especially in developing countrieswhere income levels are low. Here, the government has two options. It candeal with the political sensitivities surrounding sewerage charges by keepingtariff levels artificially low (and hence, politically acceptable), or it canimplement cost-covering tariffs. The first option may be more desirable,especially after prolonged system neglect and the absence of explicit tariff
Malaysia’s national sewerage system 81
charges, as in the Malaysian case. This will require subsidizing the operatorand some form of incentive regulation. The second will depend on thepolitical capacity to enforce the payment of tariffs, especially if there is publicopposition to this.
In either case, privatization will require the government continue to play acentral role, and in reality, acceptable sewerage charges are usually below thecost of service provision. This is important, especially as sewage treatmentcosts more than the provision of clean water because more capital equipmentis needed to clean dirty water than to clean river water. Yet drinking water isoften subsidized in developing countries for political reasons, as is the casein Malaysia, making it even harder to introduce sewerage charges which arepotentially higher than water rates. The high cost of sewerage treatment hasalso required continued state assistance, with grants playing an importantpart in financing capital investment, even in developed countries. Govern-ment grants comprised over 40 per cent of capital investment in waste-water treatment in Germany and France, and were also significant in theNetherlands and Portugal (Correia 1998). This indicates the difficulties ofoperating sewerage services on a purely commercial basis.
Furthermore, as public health aspects of sewerage treatment require uni-versal coverage, costs will vary across regions, depending on population levelsand density. As such, sewerage services – and thus tariff levels – will becheaper in larger, highly populated urban centres compared to smaller townsor rural areas. Because it is politically difficult to have different tariff charges,especially as this will be seen as disadvantaging certain (poorer) segments ofthe population, the government has to either subsidize operations, or tariffshave to be cross-subsidized. In the case of Malaysia, the government failedto impose a credible subsidization strategy needed to address the challengesrelated to the determination of tariffs and enforcement of payment. It choseto keep tariff levels low by charging much higher rates for commercial/industrial users in order to cross-subsidize household customers, yet theserates were rejected by both groups of customers. More crucially, the govern-ment lacked the political capacity to enforce payment of tariffs, even afterseveral downward revisions.
Background
The privatization of Malaysia’s sewerage system needs to be understoodwithin the context of the country’s sewerage needs following three decadesof neglect and underfunding. This was due to low priorities for seweragedevelopment (compared to water supplies) and an unwillingness on thepart of most local (municipal) government authorities to finance capitalexpenditure through higher user charges. The allocation of funds forsewerage development consistently and substantially lagged behind that forwater supplies. Only US$330 million was allocated to sewerage services by thefederal government between 1976 and 1995 compared to US$3,089 million to
82 Malaysia’s national sewerage system

develop water infrastructure (Lum 1994). On top of this, and as previouslymentioned, wastewater is more expensive to treat than drinking water. As aresult, coverage was low, and poor effluent quality from untreated sewageled to water pollution and health risks. Only 3.4 per cent of the country’spopulation was served by central sewerage systems in 1970, mainly in largeurban centres, barely increasing to 5 per cent in 1990, compared to 100 percent of urban and 66 per cent of rural populations with access to safe watersupplies. Eighty per cent of sewage treatment plants (STPs) did not meetDepartment of Environment (DOE) effluent discharge standards. River andwater quality deteriorated between 1 and 2 per cent every year, with 72 percent of rivers polluted in the 1980s and early 1990s largely due to untreatedsewage (Business Times, 2 March 1996).
Low coverage was due to attitudes to sewage treatment, and institutionaland resource constraints. Safe water has been perceived as a basic need andprerequisite for development, and the pace of economic development wasseen as sustainable without a corresponding development of sewerage infra-structure. The Local Government Act 1974 enabled local authorities torecover capital costs for the development of sewerage infrastructure througha 5 per cent charge on the assessed annual value of properties, and chargefor operating costs for sewerage services. But despite feasibility studiessuggesting this was financially viable, most state authorities perceived this tobe too expensive for consumers (Lum 1994).
The water and sewerage system was also characterized by the lack of asingle agency entrusted with overall responsibility for planning and manage-ment. As a public health concern, sewerage services came under the purviewof both federal and state authorities. Jurisdiction and administration cameunder local municipal authorities, although a variety of other authoritieswere also involved, including Jabatan Kerja Raya1 (JKR, Public WorksDepartment), the Ministry of Housing and Local Development, Ministryof Health and DOE.2 Federal ministries provided support but as theyhad only an advisory status with local authorities, policies were not alwaysadhered to.
Prior to privatization, the federal government invited proposals for theprivate financing of infrastructure projects, and one local authority hadsigned a memorandum of understanding to accept a privatization offer, withanother two in the process of doing so (Lum 1994). IWK’s proposal to takeover 48 major local authorities was accepted by the federal government oncondition that it also took over sewerage services from the remaining 95smaller local authorities, with a common tariff nationwide to enable cross-subsidization from richer to poorer sectors to make sewerage servicesaffordable (Lum 1994). The proposal was initiated in 1991 by North WestWater (NWW), a UK-based water supply and sewage treatment company,through its country manager, David Chew, whose job was to develop businessin Malaysia3 which initially involved finding local partners willing to take amajority stake. Chew came up with the privatization proposal in consultation
Malaysia’s national sewerage system 83

with Vincent Tan’s Berjaya Group4 to enable NWW to progress with theproject in Malaysia.5
IWK was incorporated on 25 January 19916 with a nominal paid-up capitalof RM2. The consortium was led by the Berjaya Group, through BerjayaIndustrial (20 per cent), with the other shareholders being NWW (25 percent), Lembaga Tabung Angkatan Tentera (LTAT, Armed Forces SavingsBoard) (20 per cent), the Royal Malaysian Police Investment Cooperative(20 per cent) and AIMS Worldwide7 (15 per cent). IWK was awarded a 28-year concession in 1993 to manage, operate and maintain a nationwidesewerage system previously administered separately by the 143 localauthorities. Ownership of all public sewerage system assets would revert backto the federal government free of charge at the end of the concession periodin 2020. Privatization aimed to:
1 improve service and quality through enhanced efficiency;2 expand coverage through new capital investment to increase the number
of households directly connected to centralized sewerage services;3 develop and promote low cost, indigenous sewerage treatment tech-
nology for export; and4 develop Malay entrepreneurial capacity through the ownership and
management of assets.
The privatization was characterized by several changes of ownership andmanagement following public unwillingness to pay and three tariff revisions.Tariff revisions and continued customer refusal to pay led to cash flowproblems which affected the concessionaire’s ability to meet operational andcapital commitments. On 4 February 1999 the government became a specialshareholder and on 23 June 2000 the Ministry of Finance (MoF) paidRM192.5 million in cash to Prime Utilities Bhd (PUB, the most recent ownerof IWK) for its entire stake in IWK.
Performance
IWK commenced operations in May 1995. Under the concession agreement,it had to meet coverage, capital investment and service targets, as well asenvironmental and performance standards set by the Director General ofSewerage Services (DGSS) and the DOE. Its performance can be measuredby examining whether it met the terms of the concession agreement inrelation to: 1, system coverage; 2, refurbishment and capital works; 3, servicedelivery; 4, environmental standards; 5, the development of indigenous tech-nology; and 6, New Economic Policy (NEP) objectives, namely the Malayownership and management of assets. We find that IWK exceeded targetsfor taking over sewage treatment plants (STPs), but failed to meet overallcoverage, capital investment, service and environment targets (Table 4.01). Italso failed to develop local technology or Malay managerial expertise.
84 Malaysia’s national sewerage system

System coverage
IWK was to take over sewerage services maintained by 143 local authoritieswithin two years from the federal government. However, by 2000, the federalgovernment’s Department of Sewerage Services (DSS) only managed to takeover, and pass over to IWK, sewerage services of 84 local authorities,thus failing to meet overall coverage targets (National Audit Department,Malaysia 2000; Sewerage Services Department, Malaysia 2001). The conces-sion agreement also required IWK to take over 1,500 STPs and 2,200 kmof sewer pipes. IWK exceeded this figure, taking over 6,457 STPs, 9,236 km ofsewer pipes, and 906,785 septic tanks, along with 277 network and pumpstations between 1995 and 2000, providing sewerage services to 12.42 millionpeople (Table 4.02).
IWK had to improve coverage for connected sewerage services and septictank use in 48 (Category A) major towns and 96 (Category B) smaller townsover six phases between 1994 and 2022 (Table 4.03). By the end of 2000, ninemillion people were connected (about 45 per cent of the total population)and 4.5 million served by septic tanks (22.5 per cent of total population)(Sewerage Services Department, Malaysia 2001). This is an improvement of72.8 and 66.6 per cent respectively (compared to around a total of 7.6 millionpeople served by the 144 local authorities in 1996)8 but remained below 2002targets of 63.8 and 29.0 per cent coverage for Categories A and B towns(Prime Utilities 1996).
Refurbishment and capital works
The capital works programme targeted 84.3 per cent sewerage connectionand 15.7 per cent septic tank coverage in 48 major towns, and 29.5 and 70.5per cent coverage respectively in 96 smaller towns by the end of 28 years atan estimated cost of RM6.06 billion over six phases (Table 4.03) (SewerageServices Department, Malaysia 1998). IWK was required to plan and under-take an infrastructure programme in six phases, which included constructing
Table 4.01 IWK: Performance summary, 1994–2000
Concession targets Target (year) Actual (year)
System coverage Number of localauthoritiesSTPsSewer pipes
143
1,5002,200
84
6,4579,236
Refurbishment — — RM181 million(1995–2000)
Capital works Coverage RM600 million(1998–2002)
RM145.2 million(1997–2001)
Note: STPs = sewerage treatment plants.
Malaysia’s national sewerage system 85
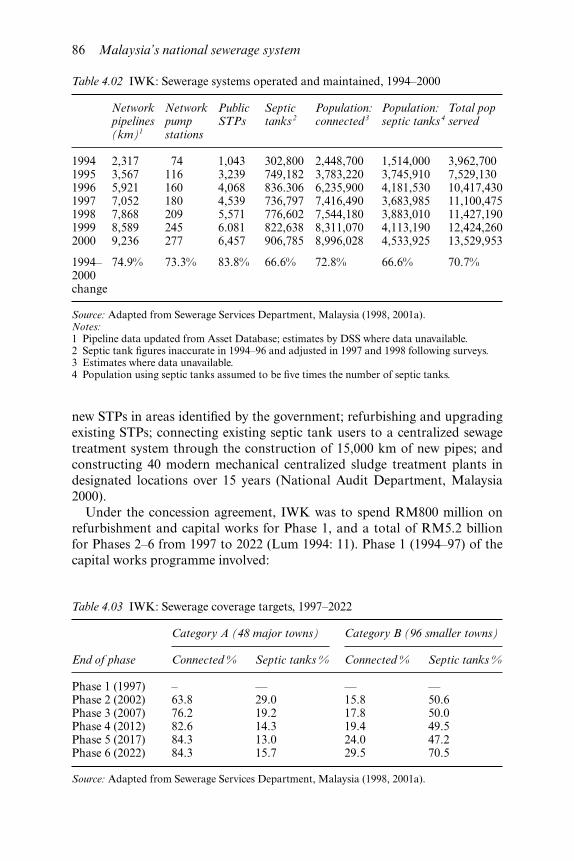
new STPs in areas identified by the government; refurbishing and upgradingexisting STPs; connecting existing septic tank users to a centralized sewagetreatment system through the construction of 15,000 km of new pipes; andconstructing 40 modern mechanical centralized sludge treatment plants indesignated locations over 15 years (National Audit Department, Malaysia2000).
Under the concession agreement, IWK was to spend RM800 million onrefurbishment and capital works for Phase 1, and a total of RM5.2 billionfor Phases 2–6 from 1997 to 2022 (Lum 1994: 11). Phase 1 (1994–97) of thecapital works programme involved:
Table 4.02 IWK: Sewerage systems operated and maintained, 1994–2000
Networkpipelines(km)1
Networkpumpstations
PublicSTPs
Septictanks 2
Population:connected 3
Population:septic tanks 4
Total popserved
1994 2,317 74 1,043 302,800 2,448,700 1,514,000 3,962,7001995 3,567 116 3,239 749,182 3,783,220 3,745,910 7,529,1301996 5,921 160 4,068 836.306 6,235,900 4,181,530 10,417,4301997 7,052 180 4,539 736,797 7,416,490 3,683,985 11,100,4751998 7,868 209 5,571 776,602 7,544,180 3,883,010 11,427,1901999 8,589 245 6.081 822,638 8,311,070 4,113,190 12,424,2602000 9,236 277 6,457 906,785 8,996,028 4,533,925 13,529,953
1994–2000change
74.9% 73.3% 83.8% 66.6% 72.8% 66.6% 70.7%
Source: Adapted from Sewerage Services Department, Malaysia (1998, 2001a).Notes:1 Pipeline data updated from Asset Database; estimates by DSS where data unavailable.2 Septic tank figures inaccurate in 1994–96 and adjusted in 1997 and 1998 following surveys.3 Estimates where data unavailable.4 Population using septic tanks assumed to be five times the number of septic tanks.
Table 4.03 IWK: Sewerage coverage targets, 1997–2022
Category A (48 major towns) Category B (96 smaller towns)
End of phase Connected % Septic tanks % Connected % Septic tanks %
Phase 1 (1997) – — — —Phase 2 (2002) 63.8 29.0 15.8 50.6Phase 3 (2007) 76.2 19.2 17.8 50.0Phase 4 (2012) 82.6 14.3 19.4 49.5Phase 5 (2017) 84.3 13.0 24.0 47.2Phase 6 (2022) 84.3 15.7 29.5 70.5
Source: Adapted from Sewerage Services Department, Malaysia (1998, 2001a).
86 Malaysia’s national sewerage system

• refurbishing poor and non-functioning STPs and pump stations;
• constructing new STPs for Jelutong and Bayan Baru in Penang (whereuntreated sewage was being released into the sea);
• undertaking sewerage connection projects in Labuan, Port Dickson andLangkawi, and twelve connected sewerage projects in Johor Baru, KualaLumpur, Ipoh, Seremban, Melaka, Kangar and Kuching;
• replacing all biosoil type plants; and
• constructing new sludge treatment facilities (National Audit Depart-ment, Malaysia 2000).
IWK’s refurbishment and capital cost estimates were based on data pro-vided by all local authorities for 1,500 STPs. However, it later discovered thenumber of STPs in fact exceeded 6,000, raising operating and capital costs.Furthermore, an estimated 80 per cent of STPs handed over by the localauthorities were in a state of disrepair or disuse, requiring additionalrefurbishment costs, and failed to meet effluent standards.9 A refurbishmentstrategy was formulated and plans drawn up to upgrade sewerage systems,with refurbishment works to improve safety and aesthetic aspects givenpriority to address public dissatisfaction with the condition of STPs.Refurbishment works were also carried out to restore the mechanical andelectrical systems to working order.
Between 1995 and 2000, IWK spent RM181 million refurbishing 481 STPs(Prime Utilities 2000). However, 81 per cent of the 6,205 STPs had not beenrefurbished by 2000 (National Audit Department, Malaysia 2000). IWK alsocarried out a total of 38 capital projects as part of Phase 1 of its capital worksprogramme between 1995 and 2000. The total amount committed to theseprojects was RM224.3 million, with 37 projects completed by 2000 at a costof RM145.2 million, and another 11 projects worth RM99.8 million atvarious stages of completion (Sewerage Services Department, Malaysia2001). This compares to the target of RM600 million in capital investmentfor Phase 1. IWK thus failed to carry out critical infrastructure work dueunder the terms of the concession, including construction of new STPs.10
Service delivery
IWK was to desludge all septic tanks in local authority areas in accordancewith a schedule to ensure compliance with the original design requirements,generally once every two years. It was estimated that on-schedule desludgingwould reduce the pollution load of surface water sources by more than halfwithin two years as 99 per cent of septic tanks were found not to have beendesludged since 198011 (Sewerage Services Department, Malaysia 1998).
IWK was expected to desludge 736,797 individual septic tanks for theoperational areas between 1994 and 1997, but only carried out 324,308 first-round septic tank desludgings (44 per cent) (Sewerage Services Department,Malaysia 1998). By 2000, IWK had desludged 491,685 out of 906,785 septic
Malaysia’s national sewerage system 87

tanks (54 per cent) (Sewerage Services Department, Malaysia 2001). How-ever, an estimated 65 per cent of home owners with septic tanks did not allowIWK to undertake first-round desludging, without which the company wasunable to register households for billing purposes (National Audit Depart-ment, Malaysia 2000). In addition, a total of 13,122 home owners refused toconnect their septic tanks to the sewerage network constructed by IWK asthey did not want to pay RM2,000–RM2,500 (depending on the distance tothe sewerage network) for this service (National Audit Department, Malaysia2000). The desludging programme could not be carried out effectively dueto a lack of proper sludge disposal sites, slow approval by state governmentsfor land applications, public objections to temporary sludge disposal sites,and public refusal of desludging services (Sewerage Services Department,Malaysia 1998).
Environmental standards
STP performance is measured by its ability to meet effluent quality standards.The Environmental Quality (Sewerage and Industrial Effluents) Regulations1979 require effluents from STPs to comply with specified discharge standards.IWK was required to carry out sampling analysis of effluent quality inaccordance with the requirements of the concession agreement. It managedto meet the sampling requirements for 36 per cent of the plants within thefirst year after take over. The shortfall was mainly due to the poor physicalcondition of the plants handed over, some of which had been abandoned foryears. Samples could not be taken from such plants since the outlets hadeither been buried or could not be traced. However, a year after takeover andrefurbishment works, IWK managed to take the required number of samplesfrom 88.7 per cent of the plants.
The concession agreement also required IWK to analyse samples for bio-chemical oxygen demand (BOD), suspended solids (SS), pH, ammoniacalnitrogen, and oil and grease. Most of the STPs were able to comply with pHand oil and grease standards, but compliance rates for SS and BOD were low.This was because a large number of treatment plants (72 per cent in 1997)were either communal septic tanks or Imhoff tanks, which were not designedto comply with these standards. According to IWK, 80 per cent of its 8,000plants in 1999 had not reached the required (BOD) standards mainly due tolack of local expertise, which led to a reliance on unsuitable foreign-designedsystems (New Straits Times, 15 September 1999).
By 2000, 86.1 per cent of plants maintained by IWK were small plantsserving populations of less than 2,000 each, with a large number of thesestill being communal septic tanks and Imhoff tanks which had difficultiescomplying with discharge standards. Furthermore, some sewerage systems,most notably in Georgetown, Penang, had no treatment system, withuntreated sewage discharged through a marine outfall. The failure to under-take capital works in Penang resulted in an estimated 78 and 44 million litres
88 Malaysia’s national sewerage system

of raw sewage being released into the sea daily in Jelutong and Bayan Barurespectively (National Audit Department, Malaysia 2000). According to theMinistry of Science, Technology and Environment, despite improvementssince 1997, water quality in Malaysia remained poor, with high levels ofE. coli detected in the sea, indicating discharge of untreated sewage (Water &Environment International, March 2000, 9 [66]).
Less than 17 per cent of the 5,409 STPs operated by IWK in 1998 compliedwith the discharge standards (Table 4.04). The remaining 83.5 per cent oftreatment plants were given contravention licences while they were beingupgraded.12 The DOE reported 13,398 cases of environmental pollutionattributed to sewage discharges by households (42.3 per cent), industry (37.5per cent), livestock (16.7 per cent) and agriculture (3.5 per cent) (NationalAudit Department, Malaysia 2000). As a result of not meeting environmentalstandards, IWK was issued with RM158.7 million worth of fines by the DOEbetween 1994 and April 1998. However, IWK was given an exemption by theMoF and only had to pay RM56.9 million (National Audit Department,Malaysia 2000).
Technology
Privatization was expected to promote the adaptation of imported tech-nology for local needs and to develop low-cost Malaysian technologyfor sewerage systems for export to developing countries. By IWK’s ownadmission, the failure of the company’s STPs to meet environmentalstandards was due to a lack of expertise, and the inappropriateness ofimported technology for local conditions (New Straits Times, 15 September1999). Privatization failed to initiate development of appropriate localtechnology and did not even address local sewage treatment requirements.
Malay ownership
The privatization of the sewerage system was an opportunity to further theNEP’s ‘restructuring’ (to reduce ethnic disparities) as well as redistribution
Table 4.04 IWK: Sewerage treatment plants meeting effluent standards, 1999–2000
Location Year Totalplants
Totalplantstested
NumbermeetingA standard(%)
NumbermeetingB standard(%)
Catchment areas 1999 973 805 6 (1)Others 1999 5,049 4,077 1,101 (27)Catchment areas 2000 995 617 11 (2)Others 2000 5,215 3,659 1,493 (41)
Source: Adapted from National Audit Department, Malaysia (2000).
Malaysia’s national sewerage system 89
objectives by: 1, developing Malay entrepreneurial capacity through a Malayvendor scheme, and; 2, through ownership and management of assets. Theparticipation of Malay contractors in IWK’s refurbishment/capital worksprogrammes as well as operations and maintenance averaged only 37 per cent(Prime Utilities 1998). While privatization offered the opportunity for Malayownership of assets, it was characterized by several changes of ownership andmanagement following each tariff revision.
Shortly after commencing operations in 1993, IWK was acquired by pub-licly listed Berjaya South Island (another Berjaya Group company) inNovember 1995 for RM450 million through a share swap. Berjaya SouthIsland later changed its name to Prime Utilities Bhd (PUB). A condition ofthe sale was that PUB was guaranteed IWK’s pre-tax profit for 1997–99(‘secured financial years’) of not less than RM105 million for each financialyear13 (Prime Utilities 1999: 45). Profit guarantee agreements following eachsale were introduced by the Securities Commission in an effort to ensure thatprofit projections were realistic, with the seller having to compensate thebuyer in the form of payment of the profit shortfall by instalments or by wayof issuance of new securities (see Securities Commission, Malaysia 1999b).
In August 1996, Wan Adli Wan Ibrahim (Berjaya Group’s executivedirector on the board of PUB) acquired 19.01 per cent of PUB (throughTranswater Corporation Bhd) for RM228.16 million at RM20 per share.Transwater later increased its interest in PUB to 26.53 per cent. A SecondProfit Guarantee Agreement of RM105 million a year, with the same con-ditions, was signed on 28 August 1997 for 1999–2001 following divestment bycertain parties and revisions made to the sewerage concession requestedby the government (Prime Utilities 1999). On 15 September 1997, IdrisHydraulic Bhd acquired a 32 per cent controlling stake in PUB for RM370million cash.14 Of the 32 per cent PUB stake acquired by Idris Hydraulic,10 per cent (six million shares) was purchased from Ilham Desiran Sdn Bhd(a wholly owned subsidiary of Transwater, controlled by Wan Adli)for RM142.5 million at RM23.75 per share; 19 per cent at RM20 per share,with the remaining 3 per cent bought on the open market. The purchase pricerepresented a ‘hefty premium’ based on PUB’s price of RM14.50 on 15September 1997 (The Star, 16 September 1997). The succession of owner-ship changes suggests that Malay ownership was only short term with littleapparent gain in management experience.
Problems
IWK’s failure to meet coverage, capital investment and environment targetswas due to the government’s ex ante and ex post failures. Ex ante failure wasthe failure to account for information and institutional problems. Poor dataon the quantity and quality of assets to be taken over increased operationalcosts and affected service provision. There was also insufficient informationon the utility’s operating costs to determine appropriate tariff levels. Rather
90 Malaysia’s national sewerage system
than subsidizing the operator to keep tariff levels low, the government soughtto do this through cross-subsidies (by charging commercial/industrialcustomers substantially higher rates). The government should have beenaware of these problems, many of which were already present before pri-vatization, including potential public opposition to higher charges (seeLum 1994). As a result, commercial/industrial customers refused to pay thesubstantial tariff increase needed to subsidize households, and householdcustomers also refused to pay the new rates.
This led to three downward tariff revisions which crucially did not improvethe bill collection, leading to serious cash flow problems which affectedoperations, capital investment and ultimately, the operator’s financial via-bility. This was compounded by the government’s unwillingness to providepromised funding for capital expansion. (According to a former IWKdirector, the government had promised funding for capital expansion inreturn for lower tariffs, but was perhaps worried that this may have been usedto cover operational losses.15)
Related to this is the question why privatization proceeded and why thecompany continued to attract new buyers despite ex ante information andongoing problems. One possible reason is the belief that the concession of apublic utility would provide guaranteed revenue, and that the state wouldensure the company’s commercial viability. In this sense, the ex ante failureto account for information decisions were in part the result of political con-siderations related to the interests of (potential) buyers, all of whom wereclosely aligned to sections of the political leadership. However, it was thegovernment’s ex post failure to impose credible subsidization strategiesand enforce the payment of tariffs (rather than ex ante failure related toinformation and institutional problems) that ultimately led to IWK’s finan-cial failure. Insufficient information affected the determination of both tarifflevels (leading to several tariff revisions) and consumer willingness to pay.Nonetheless, the company would have remained commercially viable, despitethe tariff revisions, provided it could collect tariff payments. The fact that itcould not collect bills, and the ad hoc way in which tariffs were determinedand revised, was a reflection of both institutional and political failure. Here,the government failed to legislate against the non-payment of seweragecharges, and even when it did so later, was unable to enforce payment.
Ex ante failure
Tariff structure
There was insufficient information on assets and hence operational costs inorder to determine appropriate tariff levels. It is also unclear whether IWKwas to take over from 143 or 144 local authorities.16 IWK’s original proposalinvolved a financial model of revenue streams based on a tariff structurewith periodic tariff rate increases and assumed annual growth in customer
Malaysia’s national sewerage system 91
numbers as well as capital and operating costs for the provision of sewerageservices to meet this demand. If the rate of growth of customers exceeded theassumed growth, or the inflation rate for costs turned out to be lower thanassumed, then IWK would stand to make more profits, and vice versa (Lum1994). However, projecting growth in customer numbers, particularly thosearising from new housing developments (for which IWK would not berequired to incur capital costs, but for which it would gain from increasedrevenues by providing sewerage services), was difficult, and the governmentfaced the burden of meeting the shortfall in the event of non-realization ofrevenue projections. The internal rate of return was eventually fixed at 14–18per cent to ensure the project’s continued viability, with flexibility to varytariff rates periodically, taking into account audited revenues and costreviews by consultants as to reasonableness.17 The government would alsoprovide a RM478 million soft loan to help the concessionaire keep charges tocustomers bearable (Lum 1994).
IWK’s initial financial forecasts were based on the original tariff rates andestimates of its customer base and assets to be taken over. However, the tariffrates could not have been determined by the likely number of customersor operating costs given incomplete information on these. IWK’s estimates ofSTPs (carried out by a team of university students hired to interview localauthorities to establish the number and condition of treatment plants) provedto be incorrect due to poor record-keeping by the local authorities18 (The Sun,12 December 1996; New Straits Times, 10 August 1999).
It was only over a two- to three-year period during IWK’s rolling pro-gramme of taking over from local authorities that it discovered there werethree times the number of plants it had originally accounted for, with barely20 per cent of these functioning as local authorities often had no budgetsto operate STPs (Far Eastern Economic Review, 27 September 2001). Theremaining 80 per cent of plants were in a state of disrepair or disuse, andrequired additional refurbishment costs. (Additional costs were also incurredfrom having to take on a lot more staff than necessary from some localauthorities as stipulated in privatization contracts.19) IWK also did not haveits own customer database, and its initial charges were based on householdsreceiving water bills from the various state government Departments ofWater Works, on which IWK’s sewerage charges were tagged (Business Times,11 February 1997). Charging on the basis of water consumption was seen as areasonable basis to estimate revenue provided there was access to water bills.This, however, proved problematic, with some state water companies refusingto provide data on water consumption figures for free.20
Without sufficient information on the operations and refurbishment costsof the sewerage assets to be taken over, the proposed tariff rates appear tohave been based on a study commissioned by IWK on the willingness ofcustomers to pay monthly charges if improvements were carried out by aprivate company. According to the DGSS, the Frank Small survey found that76 per cent were willing to pay RM5 a month, 50 per cent were willing to pay
92 Malaysia’s national sewerage system

RM10 a month, and 25 per cent were willing to pay RM20 a month, with76 per cent believing that payment for sewerage treatment was justified (Lum1994).
Tariffs were commonly applied across the country to provide a cross-subsidy from large to smaller urban centres where the unit capital andoperating costs were higher (Sewerage Services Department, Malaysia 1998).As a result, tariff rates were based on different principles. The household ratewas calculated from the annual assessed value of a property (i.e. the monthlybasic charge) and actual water usage (i.e. monthly usage charge by cubicmetres of water used), with separate rates for connected services and septictank services. The government decided on RM5 per household as an accept-able monthly household sewerage charge, but to reduce the burden on lowerincome groups, the household tariff structure was based on the assessed valueof the premises and water consumption. Tariff charges were then set betweena minimum of RM2 a month (for lower income groups) and a maximum ofRM10 a month, regardless of water consumption.
Higher rates for commercial/industrial customers – estimated to contribute50–60 per cent of IWK’s total turnover – were then needed to recover thebalance of capital and operating costs (Malaysian Business, 16 June 1995).After much negotiation, the rate agreed for the first five years was set at aboutthe middle of the range for commercial/industrial water supplies, i.e.RM1.20/cubic metre for connected customers, and RM0.90/cubic metre forseptic tanks (Tables 4.05 and 4.06) (Lum 1994). This represented 125 per centof the water bill in order to subsidize household users.21
Industry was assumed to treat its own industrial wastewater, only dis-charging household wastewater into public sewers or septic tanks. Chargesfor discharge of untreated or pre-treated industrial wastewater into publicsewers were to be negotiated on a case-by-case basis (Sewerage ServicesDepartment, Malaysia 1998). Commercial/industrial rates were based onthe number of occupants per day (for hotels), property size (for offices andshopping complexes) and production volume (for manufacturers). The public
Table 4.05 IWK: Original sewerage charges (household customers), 1994
Category of
Monthly basic charge(RM)
Monthly usage charge(RM/m3)
assessed value Connected Septic tank Connected Septic tank
Up to RM600 2.00 2.00 n/a n/aRM601–RM1,000 1.00 0.68 0.14 0.07RM1,001–RM3,000 2.11 1.43 0.14 0.07RM3,001–RM10,000 5.32 3.61 0.14 0.07Above RM10,000 10.00 10.00 10.00 n/a
Source: Adapted from Sewerage Services Department, Malaysia (1998).
Note: The minimum monthly sewerage charge is RM2.00, the maximum is RM10.00.
Malaysia’s national sewerage system 93
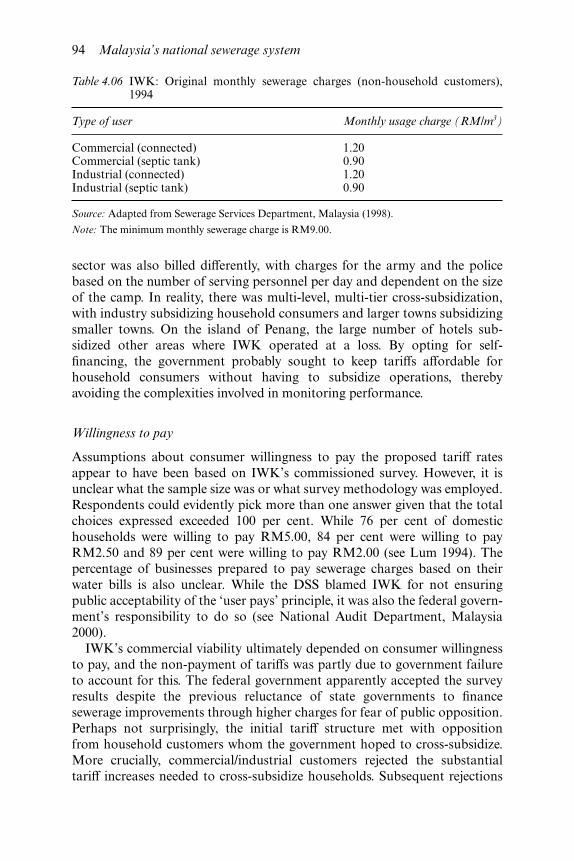
sector was also billed differently, with charges for the army and the policebased on the number of serving personnel per day and dependent on the sizeof the camp. In reality, there was multi-level, multi-tier cross-subsidization,with industry subsidizing household consumers and larger towns subsidizingsmaller towns. On the island of Penang, the large number of hotels sub-sidized other areas where IWK operated at a loss. By opting for self-financing, the government probably sought to keep tariffs affordable forhousehold consumers without having to subsidize operations, therebyavoiding the complexities involved in monitoring performance.
Willingness to pay
Assumptions about consumer willingness to pay the proposed tariff ratesappear to have been based on IWK’s commissioned survey. However, it isunclear what the sample size was or what survey methodology was employed.Respondents could evidently pick more than one answer given that the totalchoices expressed exceeded 100 per cent. While 76 per cent of domestichouseholds were willing to pay RM5.00, 84 per cent were willing to payRM2.50 and 89 per cent were willing to pay RM2.00 (see Lum 1994). Thepercentage of businesses prepared to pay sewerage charges based on theirwater bills is also unclear. While the DSS blamed IWK for not ensuringpublic acceptability of the ‘user pays’ principle, it was also the federal govern-ment’s responsibility to do so (see National Audit Department, Malaysia2000).
IWK’s commercial viability ultimately depended on consumer willingnessto pay, and the non-payment of tariffs was partly due to government failureto account for this. The federal government apparently accepted the surveyresults despite the previous reluctance of state governments to financesewerage improvements through higher charges for fear of public opposition.Perhaps not surprisingly, the initial tariff structure met with oppositionfrom household customers whom the government hoped to cross-subsidize.More crucially, commercial/industrial customers rejected the substantialtariff increases needed to cross-subsidize households. Subsequent rejections
Table 4.06 IWK: Original monthly sewerage charges (non-household customers),1994
Type of user Monthly usage charge (RM/m3)
Commercial (connected) 1.20Commercial (septic tank) 0.90Industrial (connected) 1.20Industrial (septic tank) 0.90
Source: Adapted from Sewerage Services Department, Malaysia (1998).
Note: The minimum monthly sewerage charge is RM9.00.
94 Malaysia’s national sewerage system
of revised tariff rates suggest that fundamental opposition to the ‘user pays’principle remained.
Opposition from household customers to the first round of sewerage billscentred on disparities in rates for the same usage, and on whether all waterconsumed was discharged into sewers. There were strong objections to the‘exorbitant fees’ and having to pay more for a service which had previouslynot been separately billed (Business Times, 11 February 1997), particularlyas there was no corresponding reduction in council rates.22 Questions werealso raised about the legality of charging for services not yet rendered, withcustomers perceiving no benefit from the charges or desludging services(e.g. see Business Times, 11 February 1997).
The 200 per cent increase in sewerage charges for the commercial sectorcompared with previous Kuala Lumpur City Hall (DBKL) charges was seenas too drastic, unjustified and contributing to inflation (Lum 1994). Thestrongest opposition came from business groups, whose monthly billincreases ranged from RM100 (e.g. for coffee shops) to RM24,000 for a five-star hotel. Increases in sewerage charges occurred at the same time as IWKsought to finance its capital works programme through a public flotation.This required high profit projections to secure a premium share price uponlisting at the same time as the company was trying to convince the publicto pay sewerage charges. This undermined public willingness to pay chargesto what was supposedly going to be a highly profitable company.23
Institutional failure
To facilitate privatization, the government implemented legislative and insti-tutional changes to consolidate laws and introduce a regulatory authority.However, there were inadequacies in both legislation and regulatory struc-ture, and overall responsibility was still not clearly designated. The regulatoryauthority was not independent, being subordinate to the Minister of Housingand Local Government, and it was not entirely clear which ministry ordepartment was ultimately responsible. For example, the new IWK manage-ment appointed in August 1996 worked closely with the Ministry of Housingand Local Government, Ministry of Finance (MoF), Economic PlanningUnit (EPU) and other relevant departments on a comprehensive review ofsewerage services. The results were announced by the Prime Minister, withsubsequent details of the review provided by the Minister of Housing andLocal Government (Prime Utilities 1997).
It was not clear who determined tariffs or how these could be revised, norwas there an appeals system. While Section 9 (i) of the Sewerage Services Act(SSA) 1993 states that the DGSS has powers to promote the interests ofcustomers with respect to ‘the prices to be charged for the services’, the powerto impose charges lies with the Minister who ‘may from time to time byregulations prescribe, either separately or as a consolidated rate, seweragecharges, fees or levy’ (Section 30). According to the concessionaire, the DGSS
Malaysia’s national sewerage system 95
may have prepared the recommendation and been involved in negotiations,but it was the politicians who made decisions.24 (The number of ministersmaking announcements relating to the industry may have been a reflection ofthis.)
Regulatory performance was affected by institutional weaknesses, namelyresource constraints, initial reluctance to legislate penalties for non-paymentof sewerage charges and failure to accurately gauge public willingness to pay.The role of the regulatory authority was assessed by the National AuditDepartment (2000), which found no programme for monitoring the 2,600STPs operated by the private sector, or enforcement, with the DSS onlyacting on complaints. Furthermore, there were no performance indicatorsfor IWK and monitoring was based on monthly reports supplied by theconcessionaire25 (National Audit Department, Malaysia 2000).
There was no programme for monitoring effluent quality for STPs, withIWK itself testing effluent quality in over 6,000 STPs, and the DSS merelyaccepting these results without independent verification. Plant inspectionswere conducted by IWK staff without supervision by the DSS, and twoprivate companies were found to be operating STPs without licence. Thefailure of the DSS to obtain court orders for 13,122 home owners whorefused to connect their septic tanks to a central sewerage system (asauthorized by Section 24 of the SSA 1993) suggests that enforcement was aproblem (Malaysia 2002). The DSS also allowed three factories to dischargeindustrial effluent into the public sewerage systems without testing the qualityof the effluent, while another nine factories did so without written approval.A large part of the regulatory problems was due to understaffing,26 and lackof skilled technical staff, with 20 of 57 positions in the DSS yet to be filled by2000. The National Audit Department (2000) recommended more financialand human resources for the DSS to be effective. However, the inabilityof IWK to meet service delivery targets and environmental standardswas not due to information or institutional (regulatory) failure, but rather,to the company’s cash flow problems from the non-payment of seweragecharges.
Political factors
Despite these ex ante failures, privatization proceeded because it was alsomotivated by political considerations related to initial profit projections aswell as opportunities for monopoly rents for a group of businessmen closelyconnected to sections of the political leadership. In this sense, the ex antefailure to account for information constraints was in part constrained bypolitical considerations related to the choice of candidates. Privatization wasdriven by the commercial interests of North West Water (the overseas partnerwho initiated the project) in collaboration with powerful domestic interests,initially Vincent Tan (a beneficiary of several lucrative privatizations andclosely associated with the Prime Minister and Finance Minister), and later
96 Malaysia’s national sewerage system
fuelled by a group of Malay businessmen who believed they could make easymoney through a publicly listed monopoly.
The privatization was initially regarded as a viable and even highly profit-able project, and IWK’s prospects rated highly, with its discounted cash flowestimated at at least RM3 billion, revenue at RM34–RM50 billion, andoperating costs at RM18 billion over the 28-year concession period, based onthe initial tariff rates and an average turnover growth of 10 per cent (TheEdge, October 1994, Malaysian Business, 16 June 1995). Tariff revisions wereexpected to affect revenue by between 5 per cent (for a finite period) and25 per cent (over the 25 year concession period). Nonetheless, most analystsestimated a return on investment of 25–30 per cent, and there was continuedoptimism about IWK’s prospects (see Malaysian Business, 16 June 1995;Business Times, 11 February 1997, 15 November 1997). The control of IWKthus provided opportunities for monopoly rents, and its acquisition byBerjaya South Island aimed to transform that company (an investment-holding company whose main subsidiary’s principal activity was garmentmanufacturing) into a major utility group managing one of the world’slargest privatized sewerage projects.
The succession of ownership changes that followed subsequent tariff revi-sions were arguably in part motivated by profit guarantees as well as ‘capitalgains’ profits from each sale, and the possibility of further profits from thelarge capital works programme and high share prices on the stock market.Although profit guarantees were not without problems,27 buyers were none-theless willing to pay a premium over the market price because of expectedprofits and also because control of a publicly listed company providedopportunities for ‘signalling’ to secure more bank credit on better terms(e.g. see Jomo 2002). This can be seen from the profits made from each sale(Table 4.07), and the fact that none of IWK’s owners had relevant experience.IWK’s five original owners made an estimated RM350 million in extra-ordinary gains from the sale to PUB (Malaysian Business, 16 June 1995),while the sale of Transwater’s entire stake in PUB to Idris Hydraulic providedWan Adli with a nominal profit of RM27.6 million (The Star, 18 September1997). The first sale of IWK to PUB enabled Vincent Tan to acquire controlof another listed company while retaining his interest in IWK (Prime Utilities1995, 1996; Gomez and Jomo 1997). Although Berjaya South Island’s profits(through its main business of garment manufacturing) were declining, thecompany’s share price increased from RM4.52 to RM32 following news ofthe proposed purchase (The Edge, October 1994). Berjaya Group receivedRM860 million cash for the sale of IWK to Angsana Embun (New StraitsTimes, 26 August 1996). The share price of Transwater, IWK’s third owner,also rose substantially following its purchase of IWK.
With the exception of Vincent Tan, the original concessionaire, all theownership changes were between Malays who were also closely related to theleadership of UMNO. Ahmad Sebi Bakar, a substantial shareholder in PUB,was a close associate of Finance Minister Daim (Gomez and Jomo 1997;
Malaysia’s national sewerage system 97

Gomez 2002c). Tan, the other substantial shareholder in PUB, was himself aclose associate of Prime Minister Mahathir (Prime Utilities 1996). IdrisHydraulic’s majority shareholder Ishak Ismail was a close ally of DeputyPrime Minister Anwar Ibrahim and executive committee member ofUMNO’s Permatang Pauh division (headed by Anwar before his dismissal).Anwar was reported to have ‘tapped Ishak for “national service” in late 1997’following two previous changes in ownership (Far Eastern Economic Review,25 March 1999).
However, not all the new owners got paid,28 and this could be related totheir relationships with the UMNO leadership. The main loser appearsto have been Ishak Ismail, affiliated with Anwar, and the last private ownerof IWK. Ishak had sacked Aminuddin Rouse (IWK director and deputyexecutive chairman, and the nephew of Prime Minister Mahathir’s wife) inmid-January 1999. A few weeks later the government exercised its specialshare and became a special shareholder in IWK (having provided supportloans totalling RM925 million). This entitled the government to nominatetwo representatives to the board, and more active and direct participation inthe management of IWK (Prime Utilities 1999). Aminuddin was appointedexecutive chairman and one of two government representatives on the boardon 8 February 1999. On 27 March 2000, PUB proposed to sell its stake inIWK (of 100 million shares) to the MoF for RM192.54 million cash (orRM1.92 per share) and to rescind IWK’s profit guarantee agreement of
Table 4.07 IWK: Ownership changes and share prices
Owner Berjaya PrimeUtilities(B. Sth Island)
PrimeUtilities(Transwater)
IdrisHydraulic
MinistryofFinance
Majorityshareholder
VincentTan
Ahmad Sebi Wan Adli IshakIsmail
MinistryofFinance
Share price paid(RM)
— 15.00 20.00–24.93 20.00–23.75 1.92
Date of purchase Jan 1991 Nov 1995 Aug 1996–Dec 1997
Sept 1997 June2000
Total price (RMmillion)
— 540 302.9 142.5 192.54
Stake (%) 20 100 26 32 100Profit/(loss) fromsale (RM million)
17.5* 138.2** 27.6 (80.9) —
Source: Adapted from The Star (31 October 1996, 16 September 1997, 18 September 1997); NewStraits Times (31 January 1997); Prime Utilities (1996); Cheong (1995, cited in Gomez and Jomo,1997).Notes: Berjaya South Island later became Prime Utilities Bhd (PUB). PUB was later bought byTranswater. * Vincent Tan’s 20 per cent of the RM350 million made by IWK’s original ownersfrom the sale to PUB. ** Based on the 20 per cent sale to Transwater.
98 Malaysia’s national sewerage system
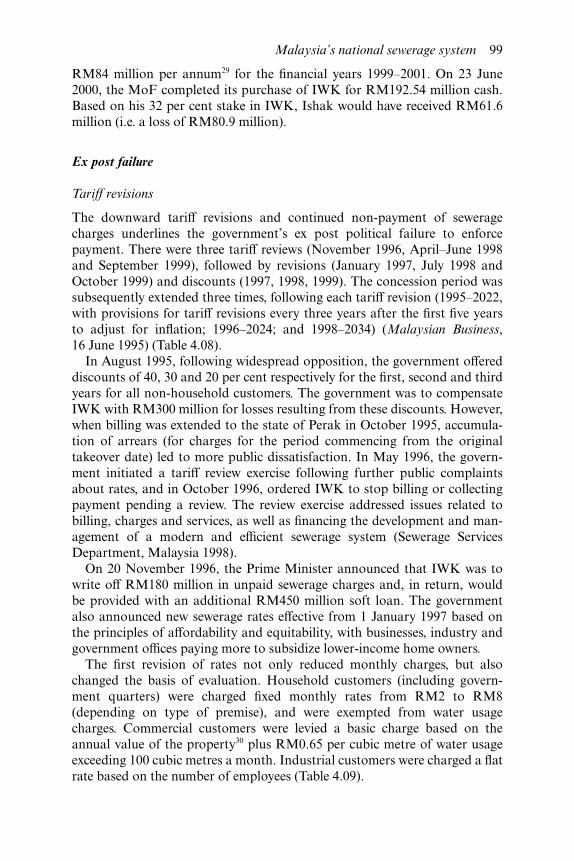
RM84 million per annum29 for the financial years 1999–2001. On 23 June2000, the MoF completed its purchase of IWK for RM192.54 million cash.Based on his 32 per cent stake in IWK, Ishak would have received RM61.6million (i.e. a loss of RM80.9 million).
Ex post failure
Tariff revisions
The downward tariff revisions and continued non-payment of seweragecharges underlines the government’s ex post political failure to enforcepayment. There were three tariff reviews (November 1996, April–June 1998and September 1999), followed by revisions (January 1997, July 1998 andOctober 1999) and discounts (1997, 1998, 1999). The concession period wassubsequently extended three times, following each tariff revision (1995–2022,with provisions for tariff revisions every three years after the first five yearsto adjust for inflation; 1996–2024; and 1998–2034) (Malaysian Business,16 June 1995) (Table 4.08).
In August 1995, following widespread opposition, the government offereddiscounts of 40, 30 and 20 per cent respectively for the first, second and thirdyears for all non-household customers. The government was to compensateIWK with RM300 million for losses resulting from these discounts. However,when billing was extended to the state of Perak in October 1995, accumula-tion of arrears (for charges for the period commencing from the originaltakeover date) led to more public dissatisfaction. In May 1996, the govern-ment initiated a tariff review exercise following further public complaintsabout rates, and in October 1996, ordered IWK to stop billing or collectingpayment pending a review. The review exercise addressed issues related tobilling, charges and services, as well as financing the development and man-agement of a modern and efficient sewerage system (Sewerage ServicesDepartment, Malaysia 1998).
On 20 November 1996, the Prime Minister announced that IWK was towrite off RM180 million in unpaid sewerage charges and, in return, wouldbe provided with an additional RM450 million soft loan. The governmentalso announced new sewerage rates effective from 1 January 1997 based onthe principles of affordability and equitability, with businesses, industry andgovernment offices paying more to subsidize lower-income home owners.
The first revision of rates not only reduced monthly charges, but alsochanged the basis of evaluation. Household customers (including govern-ment quarters) were charged fixed monthly rates from RM2 to RM8(depending on type of premise), and were exempted from water usagecharges. Commercial customers were levied a basic charge based on theannual value of the property30 plus RM0.65 per cubic metre of water usageexceeding 100 cubic metres a month. Industrial customers were charged a flatrate based on the number of employees (Table 4.09).
Malaysia’s national sewerage system 99

Tab
le 4
.08
IWK
: Tar
iff a
nd o
wne
rshi
p ch
ange
s
1995
1996
1997
1998
1999
2000
Tar
iff r
evie
w21
Nov
embe
rA
pril–
June
Sept
embe
rT
ariff
rev
isio
n1
Janu
ary
1 Ju
ly1
Oct
ober
Tar
iff r
educ
tion
hous
ehol
d,co
mm
erci
al,
30%
com
mer
cial
5–20
%co
mm
erci
alG
ovt
loan
s(R
M m
illio
n)in
dust
rial
433.
750
3.8
545.
4
Con
cess
ion
exte
nsio
nU
ntil
2022
Two
year
sto
202
410
yea
rsto
203
4O
wne
rshi
pP
UB
(Ahm
ad S
ebi)
PU
B(W
an A
dli)
I. H
ydra
ulic
(Ish
ak I
smai
l)I.
Hyd
raul
ic(I
shak
Ism
ail)
I. H
ydra
ulic
(MoF
)M
oF
Dat
eN
ovem
ber
Aug
ust
Sept
embe
r
Sou
rce:
Ada
pted
fro
m P
rim
e U
tilit
ies
(199
5–20
00);
var
ious
new
spap
ers.
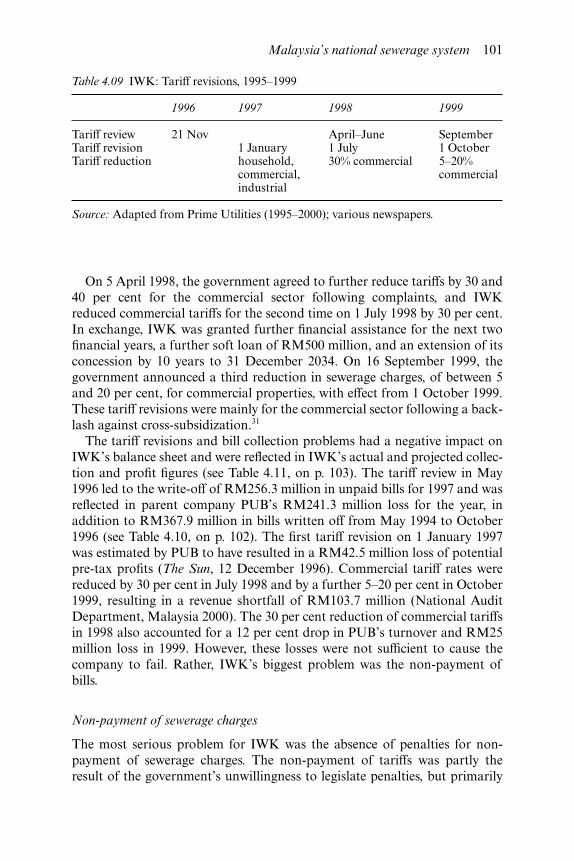
On 5 April 1998, the government agreed to further reduce tariffs by 30 and40 per cent for the commercial sector following complaints, and IWKreduced commercial tariffs for the second time on 1 July 1998 by 30 per cent.In exchange, IWK was granted further financial assistance for the next twofinancial years, a further soft loan of RM500 million, and an extension of itsconcession by 10 years to 31 December 2034. On 16 September 1999, thegovernment announced a third reduction in sewerage charges, of between 5and 20 per cent, for commercial properties, with effect from 1 October 1999.These tariff revisions were mainly for the commercial sector following a back-lash against cross-subsidization.31
The tariff revisions and bill collection problems had a negative impact onIWK’s balance sheet and were reflected in IWK’s actual and projected collec-tion and profit figures (see Table 4.11, on p. 103). The tariff review in May1996 led to the write-off of RM256.3 million in unpaid bills for 1997 and wasreflected in parent company PUB’s RM241.3 million loss for the year, inaddition to RM367.9 million in bills written off from May 1994 to October1996 (see Table 4.10, on p. 102). The first tariff revision on 1 January 1997was estimated by PUB to have resulted in a RM42.5 million loss of potentialpre-tax profits (The Sun, 12 December 1996). Commercial tariff rates werereduced by 30 per cent in July 1998 and by a further 5–20 per cent in October1999, resulting in a revenue shortfall of RM103.7 million (National AuditDepartment, Malaysia 2000). The 30 per cent reduction of commercial tariffsin 1998 also accounted for a 12 per cent drop in PUB’s turnover and RM25million loss in 1999. However, these losses were not sufficient to cause thecompany to fail. Rather, IWK’s biggest problem was the non-payment ofbills.
Non-payment of sewerage charges
The most serious problem for IWK was the absence of penalties for non-payment of sewerage charges. The non-payment of tariffs was partly theresult of the government’s unwillingness to legislate penalties, but primarily
Table 4.09 IWK: Tariff revisions, 1995–1999
1996 1997 1998 1999
Tariff review 21 Nov April–June SeptemberTariff revision 1 January 1 July 1 OctoberTariff reduction household,
commercial,industrial
30% commercial 5–20%commercial
Source: Adapted from Prime Utilities (1995–2000); various newspapers.
Malaysia’s national sewerage system 101

due to its inability to enforce payment of tariffs. Even after legislation, en-forcement was weak, undermining revenue collection. Continued oppositioneven after downward tariff revisions and IWK’s RM6 million public aware-ness campaign (The Sun, 9 October 1997, New Straits Times, 10 October1998) suggested an ongoing unwillingness to pay. The National AuditDepartment (2000) recommended that the government raise public awarenessabout the importance of sewerage services to increase willingness to pay, andalso review sewerage charges with the possibility of including them in waterbills or as part of local council assessment rates.
While the downward revision of tariffs affected IWK, the company ran outof money when businesses, including hotels in Kuala Lumpur, refused to pay(Table 4.10). At one point, IWK was only collecting 15 per cent of what it wasbilling on a monthly basis.32 In 1998, only 37 per cent of consumers (includ-ing 30 per cent of 73,000 commercial customers) had settled their bills,leaving IWK with RM92.7 million (RM45 million from the commercialsector) in outstanding payments. In 1999, commercial users accounted forRM72 million of the RM121 million in arrears.33 IWK also faced difficul-ties collecting RM144.3 million in household tariffs in 2000 due to publicopposition (National Audit Department, Malaysia 2000).
IWK’s cash flow problems were compounded by the government’s failureto provide the promised loans for capital investment.34 The governmentoffered IWK cash as long as the company wrote off unpaid bills andrefunded those who had paid when IWK needed all the money it could get.35
As a result, IWK’s operating revenue was insufficient to cover its operatingcosts, with the company registering a RM32.2 million loss for the financialyear ended April 2000 (Table 4.11), and an accumulated loss of RM332.9million.
Despite the lack of information on customer numbers and assets, IWKwas generally expected to cover its operating costs based on the proposedtariff structure and the original number of plants, provided there was 100 percent collection.36 Instead, operational viability was undermined by tariffrevisions, and the failure of the government to provide promised loans. By2000, IWK was no longer considered a viable business, even with 100 per cent
Table 4.10 IWK: Losses from tariff revisions and non-payment of bills, 1996–2000
Year Tariff Revision (RM million) Unpaid Bills (RM million)
1996 367.9**1997 256.31998 92.71999 103.7* 121.02000 144.3
Notes: *1998–99 revenue shortfall (National Audit Department, Malaysia 2000); **1994–96 billswritten off (National Audit Department, Malaysia 2000).
102 Malaysia’s national sewerage system
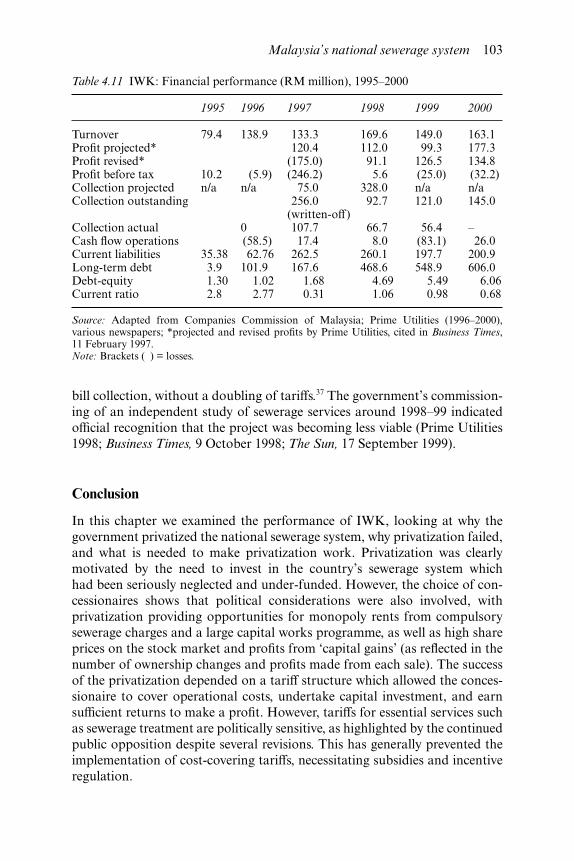
bill collection, without a doubling of tariffs.37 The government’s commission-ing of an independent study of sewerage services around 1998–99 indicatedofficial recognition that the project was becoming less viable (Prime Utilities1998; Business Times, 9 October 1998; The Sun, 17 September 1999).
Conclusion
In this chapter we examined the performance of IWK, looking at why thegovernment privatized the national sewerage system, why privatization failed,and what is needed to make privatization work. Privatization was clearlymotivated by the need to invest in the country’s sewerage system whichhad been seriously neglected and under-funded. However, the choice of con-cessionaires shows that political considerations were also involved, withprivatization providing opportunities for monopoly rents from compulsorysewerage charges and a large capital works programme, as well as high shareprices on the stock market and profits from ‘capital gains’ (as reflected in thenumber of ownership changes and profits made from each sale). The successof the privatization depended on a tariff structure which allowed the conces-sionaire to cover operational costs, undertake capital investment, and earnsufficient returns to make a profit. However, tariffs for essential services suchas sewerage treatment are politically sensitive, as highlighted by the continuedpublic opposition despite several revisions. This has generally prevented theimplementation of cost-covering tariffs, necessitating subsidies and incentiveregulation.
Table 4.11 IWK: Financial performance (RM million), 1995–2000
1995 1996 1997 1998 1999 2000
Turnover 79.4 138.9 133.3 169.6 149.0 163.1Profit projected* 120.4 112.0 99.3 177.3Profit revised* (175.0) 91.1 126.5 134.8Profit before tax 10.2 (5.9) (246.2) 5.6 (25.0) (32.2)Collection projected n/a n/a 75.0 328.0 n/a n/aCollection outstanding 256.0
(written-off)92.7 121.0 145.0
Collection actual 0 107.7 66.7 56.4 –Cash flow operations (58.5) 17.4 8.0 (83.1) 26.0Current liabilities 35.38 62.76 262.5 260.1 197.7 200.9Long-term debt 3.9 101.9 167.6 468.6 548.9 606.0Debt-equity 1.30 1.02 1.68 4.69 5.49 6.06Current ratio 2.8 2.77 0.31 1.06 0.98 0.68
Source: Adapted from Companies Commission of Malaysia; Prime Utilities (1996–2000),various newspapers; *projected and revised profits by Prime Utilities, cited in Business Times,11 February 1997.Note: Brackets ( ) = losses.
Malaysia’s national sewerage system 103
The Malaysian government was aware of the sensitivities here (especiallygiven the previous reluctance of state governments to increase seweragecharges in order to finance capital expansion) and sought to keep tariffs lowfor household customers through cross-subsidies from commercial/industrialcustomers. This was ostensibly to ensure the project was self-financing butpossibly also because the state lacked the experience and technical ability todeal with the complexities of subsidies and incentive regulation. The successof this strategy depended on the correct determination of tariff levelseconomically and politically to ensure that the operator could earn sufficientreturns and that customers were willing to pay this. As it turned out, bothhousehold and commercial/industrial customers opposed the new seweragecharges, even after several tariff revisions, resulting in the subsequentfinancial problems and renationalization of IWK.
The failure of IWK was thus the result of the government’s ex ante and expost failures. In the former, the government proceeded with the privatizationdespite the absence of information to determine assets, asset condition andtariff levels, and without properly accounting for public willingness to paysewerage charges. This led to the concessionaire having to take over moreSTPs than agreed, increasing operational and capital costs, particularly asmany plants were in poor condition. On top of this, downward tariff revi-sions reduced revenues. These factors adversely affected the concessionaire’sability to meet coverage, capital investment and environment targets, andprompted the subsequent changes in ownership. However, despite this, theprivatization was seen to be commercially viable, as reflected in the premiumpaid by each new owner.
Instead, IWK’s inability to continue financing operations and capitalinvestment was ultimately due to its cash flow problems arising from thenon-payment of sewerage charges. This was the result of the government’s expost (political) failure to enforce the payment of tariffs. Privatization didnot improve the financing or operational efficiency of the national seweragesystem because the government did not have the institutional capacity todesign a credible subsidization programme, and more critically, the politicalcapacity to enforce legislation and payment necessary to ensure its com-mercial success, or even discipline many politicians (including those ingovernment) who continued to undermine IWK’s credibility and encouragenon-payment (New Straits Times, 24 March 1998).
This brings us to our final question: What is needed for privatization towork? Clearly, the main condition for the successful privatization of sewerageservices was the government’s political capacity to design and implement acredible cross-subsidization strategy, and in particular, to enforce thepayment of tariffs. Contrary to public choice arguments that privatizationinsulates the sector from short-term political intervention in utilityoperations and limits opportunities for intervention by powerful groups(e.g. see Biswas 2000), political capacity is needed to enforce tariff paymentsif the privatization of sewerage services is to succeed. In this case, ‘restrictive
104 Malaysia’s national sewerage system

pricing policies’ (i.e. non-cost covering tariffs) are not so much about short-term gains but rather a reflection of political constraints. A key lesson here isthat sewerage charges have to be politically determined, which will oftenpreclude cost-covering tariffs. This will then necessitate subsidies which willin turn entail ongoing state intervention in the form of regulation to preserveincentives.
Malaysia’s national sewerage system 105

5 The myth of privatized urbanrailKuala Lumpur Light RailTransit
Contrary to privatization theory, urban rail systems have relied largely onpublic funds, either in the form of grants and subsidies, or loans throughstate-owned or international (development) financial institutions. Further-more, urban rail privatization is fraught with difficulties because railwaysand metro systems cannot generate the revenues from fares to cover the fullcosts of their infrastructure, train operations and investment, as well as pro-vide a return on capital. This has necessitated substantial subsidies, partlyalso to limit (politically sensitive) fare increases, and to help finance capitalexpansion. As these subsidies will affect the structure of risks and incentives,privatization per se is unlikely to address issues of financing and efficiency.
There are several possible reasons then why privatization may proceed eventhough it cannot address problems inherent in urban rail provision. Firstly,the government may actually believe that privatization can work. Secondly,it potentially benefits all parties, providing construction rents for the con-cessionaire and profits for banks, while at the same time allowing the govern-ment to have infrastructure projects (privately) financed. This was the case inMalaysia, where privatization aimed to facilitate the construction of KualaLumpur’s Light Rail Transit (LRT) to address growing traffic congestion.However, privatization also allowed for resources to be allocated, throughpatron–client networks, to parties closely associated with segments of thepolitical leadership. This political consideration shaped the nature of theprivatization which was consistent with the preference of domestic capitalistsfor construction-based projects (discussed in Chapter 3). This can explainwhy the government chose to privatize both construction and operations tothe same concessionaire, thereby providing the opportunities for monopolyrents from construction (reflected in higher cost per kilometre compared tosimilar systems in the region). However, this also resulted in a huge debtburden arising from capital expenditure, and which could not be sustainedgiven the problems mentioned above, creating a moral hazard which furtherreinforced the attractiveness of short-term profits from construction overlong-term profits from operations.
Failure here was partly due to the government’s ex ante failure to properlydetermine project viability, and to structure the privatization to avoid creating
a moral hazard. However, as ex ante mistakes are inevitable because ofinformation and political constraints, it was more important for the govern-ment to be able to implement ex post measures to ensure the project’scommercial viability by promoting system integration necessary to increasepassenger numbers. Here, the failure of privatization was ultimately due tothe government’s ex post political failure. The government was unable toforce the concessionaires and private developers to accept route alignmentand the physical integration of stations necessary for system integration; itcould not streamline bus operations and prevent private bus operators fromplying LRT routes; it failed to restrict parking in the city and regulate parkingcharges; and it failed to restrict private cars in the city centre. In short,the government lacked the institutional and political capacity to plan andcoordinate a successful urban rail system, needing to renationalize the LRTin order to make the necessary changes to better integrate the system.
The experiences of the UK, Singapore and Bangkok demonstrate thatsuccessful (urban) rail provision depends on effective regulation and govern-ment coordination of investment and policies to integrate different modes oftransport. This requires the institutional capacity to identify an appropriatelevel of subsidy, and political capacity to enforce cost reductions and capitalinvestment within this subsidy level. More crucially, having committed towhat was arguably a commercially unviable privatization, the governmentneeded to implement measures to at least ensure a second-best outcome. Thiswill depend on its political capacity to enforce the regulation, coordinate theinvestment and implement the policies necessary. It is not the privatizationin itself that will lead to success but rather the effective and insulated inter-vention of the state in financing and coordinating these processes and inmonitoring performance.
This chapter is structured as follows. The next section examines thechallenges faced by the privatization of urban rail systems. This is followedby a background to the privatization and subsequent renationalization ofthe Kuala Lumpur LRT. We then evaluate the performance of the three LRTsystems in terms of financing, delivery, financial performance and impact ontraffic volume (congestion). The following section examines the government’sex ante and ex post failures which affected performance, looking at infor-mation, institutional and political failure. We conclude by summarizing themain causes of the LRT’s failure and important conditions for successfulprivatization.
Challenges
Rail privatization is argued to finance capital investment and provide incen-tives to improve efficiency. Evidence however shows that the private sectorhas had difficulty financing (urban) rail systems and improving efficiency.This is because the rail industry is characterized by high capital costs and lowfarebox ratios (the ratio of fares to operating costs) which are compounded
Kuala Lumpur Light Rail Transit 107

by insufficient ridership. Privatization cannot resolve the conflict betweenpublicly acceptable fares, and the need to cover costs and provide a return oninvestment. As such, privatized railways have been largely financed by publicfunds in order to keep fares low and carry out capital investment. This has inturn undermined incentives for efficiency and strengthened the importanceof regulation. Rather than the fragmentation which follows privatization,viable urban rail systems require coordination and integration, and are thusdependent on the government’s institutional and political capacity to planand coordinate investment, and implement policy.
High capital costs
Capital investment is needed to build as well as expand networks, not justto meet projected passenger growth but also to increase ridership throughsufficient network coverage. Privatization is meant to finance much-neededcapital expansion by mobilizing private funds. However, rail operators havegenerally relied on substantial subsidies and grants to meet the cost of capitalinvestment and the private sector has been unable or unwilling to finance raildevelopment, with only three private sector urban rail schemes committedbefore the 1997–98 Asian financial crisis (two in Kuala Lumpur and one inBangkok) (Shoji 2001; Shaoul 2004). Instead, the privatization of rail systemshas been largely financed by public funds, usually through state-owned orinternational financial and development institutions. The substantial capitalcost is the reason why many cities underwrite the cost of infrastructure pro-vision (e.g. by building new lines, boosting capacity and procuring assets suchas rolling stock).
Over 80 per cent of debt financing for Bangkok’s Skytrain came from state-owned or international (development or financial) institutions1 and the statefinanced the construction of tunnels and stations of Bangkok’s Metrounderground urban rail system. The privatization of British Rail involved theseparation of infrastructure maintenance and investment to Railtrack, andoperations to some 25 train operating companies (TOCs). Railtrack received£1 billion from the European Investment Bank (EIB) and Kreditanstalt fürWiederaufbau (KfW) (the German development bank) (Whitehouse 2003).In addition, the government wrote off a £1.6 billion debt burden before pri-vatization, provided £225 million of debt relief on flotation, and underpricedshares, all to ensure the private owner could earn the appropriate rate ofreturn without resorting to higher fares (Shaoul 2004). Between 1986 and1994, public funds provided 52–72 per cent of finances for railways in Europe(Shaoul 2004). Even in Japan, where urban railways tend to pay for operatingand infrastructure costs, there are special subsidies for subway and infra-structure construction (Shoji 2001).
Privatization also did not improve capital investment or efficiency here.The operator of Bangkok’s Skytrain was unable to expand network coveragenecessary to increase ridership due to debt problems, while Railtrack’s total
108 Kuala Lumpur Light Rail Transit
investment over four years (to March 2000) was less than required and wentlargely into station refurbishments and leasing shop lots in stations ratherthan network expansion (see Shaoul 2004). Railtrack was also unable to meetdeadlines and cost estimates, with the upgrade of the West Coast Main Line(the most important trunk rail route in the UK) two years behind scheduleand expected to cost four times the original £2.5 billion estimate (Shaoul2004; United Kingdom 2006). The privatization of British Rail also increasedsubsidies by £300 million and required a further £5 billion in public invest-ment to maintain the network (Harris 1999; Terry 2001b). Total subsidiesfor the 25 private TOCs following privatization were ‘higher than BritishRail ever received’ (Shaoul 2004: 32–33). Despite these grants and subsidies,Railtrack’s debt increased from £701 million (just before privatization in1996) to over £3.9 billion in 2001 (Shaoul 2004). TOCs, on the other hand,made no profits in the first two years after privatization and the sameoperating margins (2 per cent) after that, mainly due to considerably highersubsidies (Shaoul 2004). Service provision, meanwhile, deteriorated afterprivatization, with declining punctuality and increasing customer complaints(Bagwell 2004).
Low farebox ratios
Fares have not traditionally covered operating costs (let alone capital invest-ment) in urban rail systems (Cox 1997; Halcrow Consultants 1999), withthe exception of Hong Kong and Singapore (both city states), and severalJapanese operators. The average farebox ratios for European urban railsystems in 1991 was 49 per cent (Shoji 2001). This is because fares are usuallytoo low (and higher fares politically sensitive), and ridership is constrained bynetwork coverage and existing transport policies, including automobile use.Fares have only covered 30–40 per cent of operating costs in the US and 55per cent in the UK (Hakim et al. 1996b) while farebox ratios have deteriorated(Bly et al. 1979; Allen 1982, both cited in Shoji 2001). Low ridership levels andhigh operating costs have required operational and capital subsidies as well asthe state underwriting capital costs (Halcrow Consultants 1999; Shoji 2001).
One way to increase farebox ratios is through higher fares based on the‘user pays’ principle as is partly the case in some Japanese cities (Shoji 2001).However, in reality, universal service obligations (and political concerns)preclude this option, and contrary to privatization theory, rail fares cannotbe economically determined. As rail is a high fixed-cost industry, it largelycharges customers differential rates per service at the point of use as it doesnot provide a comprehensive and universal service, unlike utilities. Thismeans that in the absence of adequate demand, full-cost pricing per serviceis self-defeating (Shaoul 2004). Railways and metro systems cannot generatethe revenues from fares to cover the full costs of their infrastructure, trainoperations and investment, as well as making a rate of return on capitalemployed. In the context of private finance, this means subsidizing the
Kuala Lumpur Light Rail Transit 109
providers of finance which can undermine incentives for improving efficiency(Shaoul 2004).
Government debt relief and grants to prevent higher fares following BritishRail’s privatization reflects the political sensitivities surrounding thisissue even in industrialized countries (see Shaoul 2004). Instead, fares areoften negotiated (e.g. Bangkok and Kuala Lumpur) or set by the government(e.g. Singapore and Manila), and subsidies are required to keep these afford-able. Higher fares also further jeopardize ridership given the already lowpassenger numbers. Even in densely populated Asian cities with higherridership intensity, operators in less densely populated areas (e.g. in Japan)have received increasing subsidies (Shoji 2001). Furthermore, successful railoperators have relied on diversification, with non-rail business providing justunder half the revenue of major Japanese rail operators and over 60 per centof the revenue of minor operators in 1995 (Shoji 2001). Even with a very highdaily ridership of 370,000, income from property development was animportant source of revenue for Kowloon–Canton Railway’s Light RailDivision2 in Hong Kong (Light Rail Transit Association 1997; Kowloon–Canton Railway Corporation 2003).
State coordination and capacity
The problems of high capital costs and low farebox ratios inherent in urbanrail systems have necessitated government grants and operational subsidies.In addition, successful urban rail systems also need to be part of wider trans-port policies. Both these depend on the government’s ability to structureincentives and enforce conditions, as well as coordinate investment and inte-grate transport systems. The failure of Railtrack illustrates the difficulties ofmanaging subsidies and structuring incentives, with industry fragmentation,increasing transaction costs and overheads leading to cost-cutting measures(e.g. contracting out) to earn returns on capital. This affected coordinationand coherence (not to mention safety), making ‘planning, implementationand accountability in the industry difficult, if not impossible’ (Shaoul 2004:32). On the other hand, awarding a BOT contract to the same company mayaddress the problem of fragmentation but introduces a moral hazard wherebythe concessionaire may choose to earn rents through construction ratherthan profits from operations, especially as farebox ratios are unable to coveroperating and capital expenses. This can undermine incentives and is thereason that many governments choose to underwrite the cost of infra-structure. More crucially, the UK government was unable to enforce sanc-tions against Railtrack for its failure to improve passenger train performanceand meet its investment programme set out in the Network Licence (White-house 2003). Underlying this was the government’s lack of political capacityto implement the necessary policies and enforce discipline.
Bangkok’s experience further illustrates the problem of political failureand is particularly illuminating given the remarkable similarities with Kuala
110 Kuala Lumpur Light Rail Transit

Lumpur’s LRT. Both systems were privatized through build-operate-own(BOO)/build-operate-transfer (BOT) concessions and based on grosslyinflated passenger projections, presumably to enhance project viability inorder to secure financing. This meant that ridership was insufficient to coveroperating costs, let alone meet interest payments (not to mention repay theprincipal loan or invest in further expansion). Rather than being economic-ally determined, fares had to be negotiated, and none of the operators wereable to charge fares which they felt were necessary to recoup their invest-ments. However, the lower fares did not increase passenger numberssufficiently to make up for the shortfall in revenue. This was compounded byline integration problems (e.g. the lack of a common ticketing system andpoor feeder bus services), inadequate network coverage (in the case ofBangkok), and inconsistent price regulations (and subsidies) across differentmodes of transportation (making it much cheaper to travel by bus). Under-lying these problems was the political failure of both governments toimplement credible subsidization policies, plan and coordinate investmentand system integration, and enforce an integrated transport policy in thecontext of the private provision of urban rail. The failure to do this led torenationalization.
Background
Kuala Lumpur’s LRT system comprises two LRT lines and a monorail. Thiswas part of long-term government plans for an integrated transport systemto address increasing traffic congestion and projected growth around KualaLumpur through the construction of a privately financed urban rail system.Plans for an LRT were first commissioned in a 1970s study of mass rapidtransit systems in 30 cities around the world which concluded that the projectwas feasible and profitable in conjunction with land development projects(see Townsend 2003). This was followed up with a Master Plan Transporta-tion Study, carried out between 1979 and 1981. In 1984, the governmentapproved two LRT lines, and the 1984 Kuala Lumpur Structure Plan byKuala Lumpur City Hall (DBKL) recommended a rail system and a singlepublic transport agency (under the Ministry of the Federal Territory).DBKL also identified a corridor, sector coverage (targeting growth areas),ridership, population projections and a related land use strategy.3 The LRTsystem was subsequently delayed by the 1986 recession and fiscal constraints,with several proposals turned down due to cost.4 In 1987, another study wasconducted as part of the Klang Valley Transportation Plan.
In 1991, the government revived plans to introduce a ‘one-system publictransport’ in the city based on studies by the Ministry of Transport,Economic Planning Unit (EPU) and DBKL (New Straits Times, 15 July1991). This was to include two LRT lines and a monorail with feeder busservice, and full integration with other city public transport, including busesand a dual-track railway service. City buses were to be given new routes (to
Kuala Lumpur Light Rail Transit 111

complement, and not compete with, the LRT), and DBKL was to merge buscompanies into a conglomerate for a more efficient public transport system.Between 1990 and 1993, three light rail corridors were identified and con-cessions were awarded, without open tender, to three private operators on aBOO basis in line with the government’s privatization policy. System 1 wasawarded to Sistem Transit Aliran Ringgan (STAR), System 2 to ProjekUsahasama Transit Ringan Automatik (PUTRA) and System 3 to KualaLumpur Monorail (KL Monorail).
Privatization
System 1 (STAR)
In 1990, TaylorWoodrow (a UK-based company involved in housing,property development, construction and engineering) put in a bid for System1 and won the right to progress the work and to secure funding, design andconstruction of the project following the failure of previous bids.5 Taylor-Woodrow then formed a consortium with German rail manufacturerAdtranz6 and created the operating company STAR on 13 November 1991 tobuild and operate the 27-km route. Two 60-year concession agreementswere signed with STAR, the first on 22 December 1992 for Phase 1 (worthRM1.28 billion),7 and the second for Phase 2 (Sections A and B) on 26 June1995 (worth RM2.1 billion). The design, supply and construction contractworth RM1.65 billion was signed with Kuala Lumpur Transit Group(KLTG), a joint-venture between Taylor Woodrow (construction) andBombardier/Adtranz (rail systems) on 17 July 1995.
Construction was completed on schedule and within budget, with revenueoperations starting on 16 December 1996 (Phase 1, 12 km) and July 1998(Phase 2, 11.8 km), in time for the 1998 Commonwealth Games in KualaLumpur. The 3.2 km northern extension was completed in December 1998,increasing the total route to 27 km. Operations were the responsibility ofSTAR and KLTG handed over the project to STAR once it was built.TaylorWoodrow-Adtranz also subsequently reduced its equity in STAR,which then effectively became a state-owned entity, with state institutionalinvestors owning 50 per cent of equity.
System 2 (PUTRA)
System 2 was proposed as part of a traffic study by the University of Malayain 1993 and, later, as part of the Klang Draft Structure Plan in 1994 (NewStraits Times, 30 November 1993; Malay Mail, 6 June 1994). However, theEPU was reported to have already solicited privatization bids for System 2 inSeptember 1993 from the Renong Group and MMC Group (New StraitsTimes, 19 October 1993). PUTRA was incorporated on 15 February 1994by Renong, a major conglomerate linked to the ruling Malay party UMNO
112 Kuala Lumpur Light Rail Transit

(see Gomez 1991) which had been a previous recipient of several majorprivatization contracts. The 60-year concession agreement for System 2 wasawarded to PUTRA on 7 August 1995. The project was estimated to costRM4.35 billion but later revised to RM5.4 billion, with a projected date ofcompletion of April 1998 (Phase 1) and early 1999 (Phase 2) (New StraitsTimes, 4 May 1995; Business Times, 8 August 1995; The Edge, 12 May 1997,13 July 1998, 26 August 1996). Construction began in September 1995 andwas completed on time and below budget, with revenue operationscommencing on 1 September 1998 (Phase 1) and 1 June 1999 (Phase 2).
System 3 (KL Monorail)
The monorail project was originally proposed by Hitachi Corporation ofJapan in the 1980s but rejected due to cost. In 1992, a consortium led bySingapore contractor Lum Chang Holdings was reported to have securedthe RM900 million monorail project (Business Times, 6 January 1992,26 February 1992; Malay Mail, 13 April 1992, 30 December 1993; NewStraits Times, 6 December 1994). However, the project was subsequentlyawarded to Kuala Lumpur People Rapid Transit (later renamed KualaLumpur Monorail) on 29 October 1996, as part of Kuala Lumpur LinearCity, an ambitious RM10 billion transport and mixed development projectwhich was later deferred. Both projects were proposed by David Chew in1994 (The Edge, 26 August 1996), who was also behind the privatization ofthe national sewerage system. He subsequently bought over KL Monorailfrom Vincent Tan. The 30-year BOT concession was awarded on 26 April1997 for KL Monorail to ‘develop, design, construct, finance, manage,operate and maintain the Kuala Lumpur monorail’ over a 16-km route withcompletion originally scheduled for mid-1998 (in time for the Common-wealth Games in Kuala Lumpur) (The Edge, 2 October 1995). However, thiswas later rescheduled to mid-2000 and KL Monorail negotiated to revise theconcession agreement and shorten the original route by half. Despite this,the project was considerably delayed, with operations commencing only on23 August 2003.
Renationalization
All three concessionaires faced financial difficulties. STAR and PUTRA hadproblems servicing their loans and financing rolling stock. KL Monorail ranout of money following the 1997 Asian financial crisis and only resumedconstruction after obtaining another loan (Far Eastern Economic Review,18 August 2000; Hilmi 2003). Following insufficient operational revenuearising from low passenger numbers and mounting debt problems barely ayear after commencement of full operations for Systems 1 and 2 in 1998, thegovernment announced it was to issue RM2.5 billion of bonds to settle theloans of STAR (along with KTMB, the mainline rail operator) and RM4.5
Kuala Lumpur Light Rail Transit 113

billion zero coupons8 for the debts of STAR (RM2.2 billion) and PUTRA(RM2 billion). Up to RM8 billion in government bonds were also to beissued to swap against the group debts of Renong, PUTRA’s parent com-pany,9 while KL Monorail was provided with a RM300 million soft loanin 1999. By early 1999, the government began looking at merging STARand PUTRA, and in December 2000, announced it was taking over bothoperations and leasing them back to the private sector. In November 2001,the Ministry of Finance (MoF) purchased the outstanding debts of STARand PUTRA totalling RM5.5 billion via the issuance of RM5.5 billion fixedrate serial guaranteed bonds to the lenders of both companies. It took overall assets and operations in April and May 2002. System 3 remained privatelyowned.
Performance
The main aim of the LRT was to improve Kuala Lumpur’s public transportnetwork and reduce traffic congestion by facilitating private finance, deliveryand operations. Its performance can be gauged in terms of: 1, financing(including the share of private and public funds); 2, delivery (constructioncost, deadlines, fares); 3, financial performance (including ridership andrevenue); and 4, impact on traffic volume. Privatization was not wholly suc-cessful in raising private capital as state loans were central to the financing ofall three projects. In terms of delivery, only Systems 1 and 2 were completedon time, while System 3 was substantially delayed and its scope reduced. Allthree projects cost less than Bangkok’s Skytrain, but were more expensiveper kilometre than the Singapore MRT and LRT lines, especially whenaccounting for track topography (i.e. percentage of elevation and tunnels).Fares for Systems 1 and 2 were comparatively low but System 3 had thehighest fares per kilometre. All three operators faced financial difficultiesupon commencement of operations. Finally, the LRT system did not appearto reduce traffic congestion although this was in part related to wider failingsin the public transport system and public transport policy.
Financing
State loans were central to the financing of all three privatizations, and it isalso unlikely that the projects would have been financed without implicitgovernment support and backing which helped the concessionaires securecommercial loans. Table 5.01 provides a summary of private versus publicfinancing of Systems 1, 2 and 3.
System 1 (STAR)
System 1 was to have been financed with RM600 million by shareholders,RM2.2 billion in commercial loan and guarantee facilities, and RM1.35
114 Kuala Lumpur Light Rail Transit
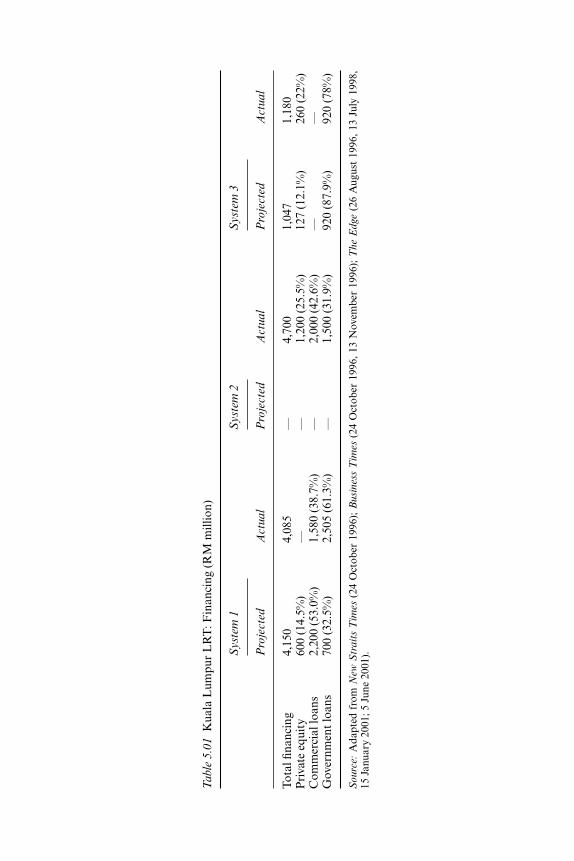
Tab
le 5
.01
Kua
la L
umpu
r L
RT
: Fin
anci
ng (
RM
mill
ion)
Sys
tem
1S
yste
m 2
Sys
tem
3
Pro
ject
edA
ctua
lP
roje
cted
Act
ual
Pro
ject
edA
ctua
l
Tota
l fina
ncin
g4,
150
4,08
5—
4,70
01,
047
1,18
0P
riva
te e
quit
y60
0 (1
4.5%
)—
—1,
200
(25.
5%)
127
(12.
1%)
260
(22%
)C
omm
erci
al lo
ans
2,20
0 (5
3.0%
)1,
580
(38.
7%)
—2,
000
(42.
6%)
——
Gov
ernm
ent
loan
s70
0 (3
2.5%
)2,
505
(61.
3%)
—1,
500
(31.
9%)
920
(87.
9%)
920
(78%
)
Sou
rce:
Ada
pted
fro
m N
ew S
trai
ts T
imes
(24
Oct
ober
199
6);
Bus
ines
s T
imes
(24
Oct
ober
199
6, 1
3 N
ovem
ber
1996
); T
he E
dge
(26
Aug
ust
1996
, 13
Jul
y 19
98,
15 J
anua
ry 2
001;
5 J
une
2001
).
billion in government support loans (The Edge, 26 August 1996). This total ofRM4.15 billion amounted to 14.5 per cent equity, 53.0 per cent commercialloans, and 32.5 per cent government loans. However, between 1993 and 1998,System 1 was funded, in two separate stages for Phase 1 (1993) and Phase 2(1995) with RM1.58 billion in commercial loans and RM2.51 billion invarious government loans.10 This means that over 60 per cent of the financingfor System 1 came from public funds (see Table 5.01). This is perhaps notsurprising given that STAR was essentially a state-owned company, especiallyafter TaylorWoodrow-Adtranz reduced its 30 per cent equity, with stateinstitutional investors owning 50 per cent of equity.11 This also indicates thatthe private sector (TaylorWoodrow in particular) was unwilling to be involvedbeyond the construction stage, suggesting that it was mainly interested in thispart of the project. In addition, state loans were also important for providingfinancing at favourable interest rates and generous conditions, including10–15 year interest-free grace periods and 30-year loan maturity (e.g. seeJICA 1997, 1998a).
System 2 (PUTRA)
Funding for System 2 was to come from commercial banks and to be largelysourced locally (Business Times, 8 August 1995). In total, PUTRA wasfinanced through RM300 million equity, RM900 million shareholders’advances, RM2 billion commercial loans, and RM1.5 billion governmentsupport loans. This total of RM4.7 billion comprised 25.5 per cent equity,42.6 per cent commercial loans, and 31.9 per cent government loans (seeTable 5.01). Additionally, government backing was crucial in helping securecommercial loans, in particular for PUTRA’s parent company Renong,which became highly leveraged in order to finance the project12 (BusinessTimes, 29 May 2001). PUTRA’s average interest rate (8.86 per cent) waslower than STAR’s (10.25 per cent) and the company was also subjectto lower interest rates on government soft loans (6 per cent) compared toSTAR (8 per cent) and more favourable loan periods (e.g. see The Edge,17 November 1997; JICA 1998a; JICA 1997).
System 3 (KL Monorail)
System 3 was to be privately financed through RM600 million in authorizedcapital, RM127 million paid-up capital and RM920 million in governmentsupport loans (Business Times, 9 September 2002). This total of RM1.05billion amounted to 12 per cent private equity and 88 per cent public funds.Under its listing exercise, KL Monorail’s promoters increased their paid-upcapital from RM127 to RM260 million. The project was eventually financedwith RM260 million in private equity (22 per cent) and RM920 million ingovernment loans (78 per cent) (see Table 5.01). Government support loans
116 Kuala Lumpur Light Rail Transit
included RM300 million13 and an interest-free RM620 million infrastructureloan.
Delivery
Delivery can be gauged in terms of construction (projected and actual costs,regional comparisons of cost per kilometre, projected and actual completiondates) and operations (fares per kilometre). Systems 1 and 2 were completedon time but System 3 was substantially delayed and its scope reduced.
Construction
System 1 as a whole was officially launched on 11 July 1998 with operationscommencing on 6 December 1998, one month ahead of the concessionagreement. Construction for System 2 began in September 1995 and wascompleted before the deadlines of April 1998 (Phase 1) and early 1999 (Phase2), and below budget, with revenue operations commencing shortly after.System 3 was originally scheduled for completion in mid-1998 but was laterrescheduled for the end of 1999 (Section 1) and the start of 2000 (Section 2),and again for mid-2000 (JICA 1998; The Edge, 10 February 1997; Far EasternEconomic Review, 18 August 2000). Following the 1997–98 Asian financialcrisis, KL Monorail entered into a Revised Concession Agreement on30 April 2000 to reschedule the project and reduce its scope. This led to theproject being scaled down from the original RM2.1 billion to RM1.17 billion,and the route shortened from 16 km to 8.6 km, with completion rescheduledto December 2001, trial runs in January 2002 and operations in the first halfof 2002 (The Edge, 4 December 2000). Actual operations only commenced on23 August 2003.
STAR and PUTRA completed construction within or below the projectedcost – RM3.5 billion for System 1 (or US$34.1 million per km) and RM4.35billion for System 2 (US$39.5 million per km) (Table 5.02). The higher cost ofSystem 2 was due to 79 per cent of its route being elevated and 15 per centunderground. In comparison, only 35 per cent of System 1’s route waselevated, with the rest built at-grade (on ground level) and utilizing existing(disused) rail tracks. System 3 was eventually completed at a cost of RM1.169billion (US$37.1 million per km), which, being entirely elevated, was moreexpensive than System 1 but not significantly cheaper than System 2 despiteits simpler technology and reported savings from locally designed and builttrains (see The Edge, 15 January 2001). The final cost was also significantlyhigher than the 1995 estimate of RM840 million. In short, KL Monorail onlycompleted half the route for more than half the cost, and in twice the time.
In terms of regional performance, all three systems were cheaper to buildcompared to Bangkok’s Skytrain but more expensive per kilometre com-pared to Singapore’s MRT and LRT lines, even those built around the sametime (i.e. after 1996) (Table 5.03). (It is worth noting that the Skytrain is
Kuala Lumpur Light Rail Transit 117

exceptionally expensive by any standards, while Bangkok’s Metro subwaysystem, though the most expensive system, is nonetheless comparable withSingapore’s NEL MRT which is similarly built entirely underground.)Systems 1 and 3 in particular had the highest costs, especially given theabsence of tunnels, System 1’s predominantly ‘at-grade’ track, and System 3’ssimpler monorail construction.
System 3, at US$37.1 million per kilometre, compares very poorly againstsimilar elevated LRT lines in Singapore (which range from US$15.9 toUS$24.2 million per kilometre) and Manila (US$34.3 million per kilometre).System 2’s track is broadly comparable with the MRT (North South and EastWest Lines), with both having about the same percentage of elevated track(79 versus 75 per cent). However, despite the MRT’s higher percentage oftunnels (28 per cent versus Systems 2’s 15 per cent), its cost per kilometre islower (US$36 million versus US$39.5 million per kilometre) (Table 5.03). Theevidence here is consistent with the general acknowledgment within theindustry that construction rents are significant and widespread, with the costsof construction projects in Malaysia widely known to be inflated.14
Operations (fares)
Systems 1 and 2 had fares comparable with the region, with System 3 havingthe highest fares (Table 5.04). Fares were based on proposals by operatorsto meet operations and maintenance cost, and for returns based on proposedprofit margins15 but which depended on government approval.16 The conces-sion agreement specified a fare table until the end of the concession periodand operators needed to give notice for upward fare reviews which had to beagreed by the government.17 However, the government did not favour yearlyincreases, preferring fare reviews every three to five years instead. Fares forSystem 1 (US$0.03 per km) and System 2 (US$0.02 per km) were comparable
Table 5.02 Kuala Lumpur urban rail: Breakdown of construction costs (RM million)
Stage Distance(km)
1995 costestimate*
1997 costestimate**
Final cost‘
System 1 Phase 1 12 1,200 1,761 1,270Phase 2 15 — 2,061 2,230
System 2Section 1 14.1 — 1,872Section 2 14.9 4,350 2,695 4,350
(Sections 1+2)
System 3 Section 1+2 16 2,100 — —Section 1 8.6 840 1,169 1,169
Source: Adapted from STAR and PUTRA; JICA 1998a; *BKWPPLK March 1998; **JICA1997.
118 Kuala Lumpur Light Rail Transit
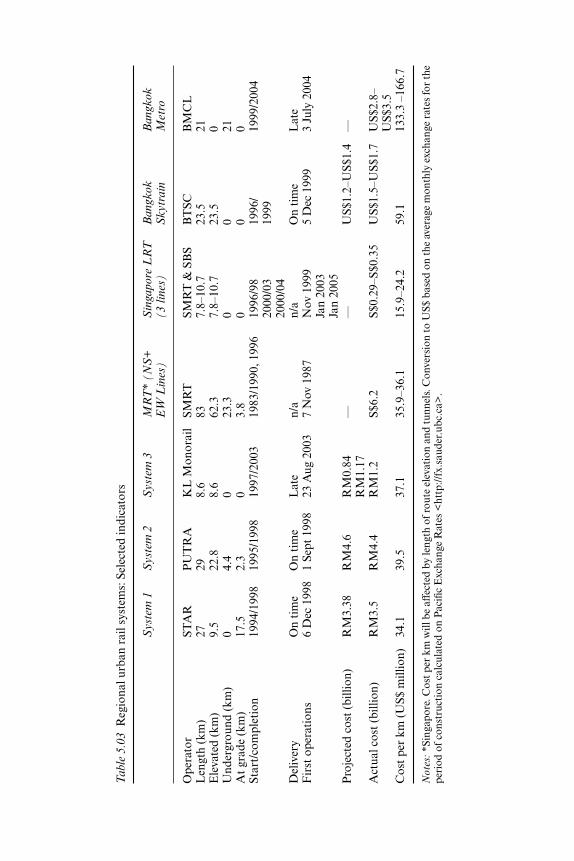
Tab
le 5
.03
Reg
iona
l urb
an r
ail s
yste
ms:
Sel
ecte
d in
dica
tors
Sys
tem
1S
yste
m 2
Sys
tem
3M
RT
* (N
S+
EW
Lin
es)
Sin
gapo
re L
RT
(3lin
es)
Ban
gkok
Sky
trai
nB
angk
okM
etro
Ope
rato
rST
AR
PU
TR
AK
L M
onor
ail
SMR
TSM
RT
& S
BS
BT
SCB
MC
LL
engt
h (k
m)
2729
8.6
837.
8–10
.723
.521
Ele
vate
d (k
m)
Und
ergr
ound
(km
)A
t gr
ade
(km
)
9.5
0 17.5
22.8
4.4
2.3
8.6
0 0
62.3
23.3
3.8
7.8–
10.7
0 0
23.5
0 0
0 21 0St
art/
com
plet
ion
1994
/199
819
95/1
998
1997
/200
319
83/1
990,
199
619
96/9
820
00/0
320
00/0
4
1996
/19
9919
99/2
004
Del
iver
yO
n ti
me
On
tim
eL
ate
n/a
n/a
On
tim
eL
ate
Fir
st o
pera
tion
s6
Dec
199
81
Sept
199
823
Aug
200
37
Nov
198
7N
ov 1
999
Jan
2003
Jan
2005
5 D
ec 1
999
3 Ju
ly 2
004
Pro
ject
ed c
ost
(bill
ion)
RM
3.38
RM
4.6
RM
0.84
RM
1.17
——
US$
1.2–
US$
1.4
—
Act
ual c
ost
(bill
ion)
RM
3.5
RM
4.4
RM
1.2
S$6.
2S$
0.29
–S$0
.35
US$
1.5–
US$
1.7
US$
2.8–
US$
3.5
Cos
t pe
r km
(U
S$ m
illio
n)34
.139
.537
.135
.9–3
6.1
15.9
–24.
259
.113
3.3
–166
.7
Not
es: *
Sing
apor
e. C
ost p
er k
m w
ill b
e aff
ecte
d by
leng
th o
f rou
te e
leva
tion
and
tunn
els.
Con
vers
ion
to U
S$ b
ased
on
the
aver
age
mon
thly
exc
hang
e ra
tes
for
the
peri
od o
f co
nstr
ucti
on c
alcu
late
d on
Pac
ific
Exc
hang
e R
ates
<ht
tp://
fx.s
aude
r.ub
c.ca
>.

with the MRT (North South and East West lines) (US$0.02 per km) andcheaper than Singapore’s LRT (US$0.05–US$0.07 per km). However, itshould be noted that this comparison was after PUTRA’s fares were reducedby over 60 per cent. At US$0.08 per kilometre, System 3’s fares were the mostexpensive.
Financial performance
The success or failure of privatization is ultimately reflected in the conces-sionaires’ financial performance. All three concessionaires faced financialdifficulties shortly upon commencing operations, and in November 2001, theMoF purchased the outstanding debts of STAR and PUTRA totallingRM5.5 billion and took over all assets and operations by May 2002. KLMonorail was unable to finance System 3, needing to scale down and delaythe project, and secure more loans, including RM300 million from thegovernment (Far Eastern Economic Review, 18 August 2000; Hilmi 2003).
Financial problems were the result of low revenues largely due to financialprojections being based on grossly overoptimistic ridership projections.STAR’s projections to recoup investments within 15 years and for operatingprofits by 2000 were based on ridership forecasts of between 80,000 and170,000 passengers per day. In 1997 STAR carried between 46,000 and 65,000passengers a day. STAR’s projected daily ridership for 1999 was 165,000–170,000 (10–12 per cent of the population in the catchment area), but actualpassengers numbers were 65,000 in 1999 and still only 80,000–92,000, just30 per cent of its capacity in 2003.18 PUTRA’s projected daily ridership was360,000 a day (or 14.5 per cent of the population in the catchment area),while actual ridership was 12,000 in July 1999. This increased to 125,000 inAugust 2000 as a result of a 60 per cent fare reduction in July 1999. Ridershipin 2003 was 150,000–160,000 a day,19 still less than half original projections.KL Monorail projected 60,000–80,000 passengers daily in its first year ofoperations, increasing by 5–8 per cent thereafter. This was later revised to85,900 passengers daily for 2002 and 181,200 by 2008. Actual ridershipfigures for 2003 were around 11,000 a day, increasing to around 39,000 inAugust 2004 (Table 5.05). Despite the large discrepancy between projected
Table 5.04 Urban rail systems: Regional fares (US$), 2003
STAR PUTRA Monorail MRT(NS+EWLines)
SingaporeLRT(3 lines)
BangkokSkytrain
BangkokMetro
Length (km) 27 29 8.6 83 7.8–10.7 23.5 21Fare per km 0.03 0.02 0.08 0.02 0.05–0.07 0.04 0.04
Notes: Conversion to US$ based on the average monthly exchange rates in 2003–4 calculated onPacific Exchange Rates <http://fx.sauder.ubc.ca>.
120 Kuala Lumpur Light Rail Transit
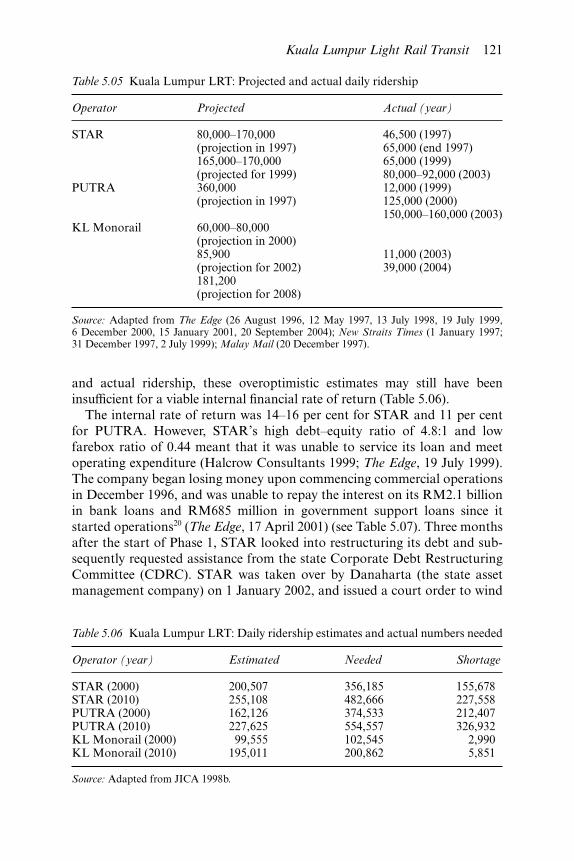
and actual ridership, these overoptimistic estimates may still have beeninsufficient for a viable internal financial rate of return (Table 5.06).
The internal rate of return was 14–16 per cent for STAR and 11 per centfor PUTRA. However, STAR’s high debt–equity ratio of 4.8:1 and lowfarebox ratio of 0.44 meant that it was unable to service its loan and meetoperating expenditure (Halcrow Consultants 1999; The Edge, 19 July 1999).The company began losing money upon commencing commercial operationsin December 1996, and was unable to repay the interest on its RM2.1 billionin bank loans and RM685 million in government support loans since itstarted operations20 (The Edge, 17 April 2001) (see Table 5.07). Three monthsafter the start of Phase 1, STAR looked into restructuring its debt and sub-sequently requested assistance from the state Corporate Debt RestructuringCommittee (CDRC). STAR was taken over by Danaharta (the state assetmanagement company) on 1 January 2002, and issued a court order to wind
Table 5.05 Kuala Lumpur LRT: Projected and actual daily ridership
Operator Projected Actual (year)
STAR 80,000–170,000(projection in 1997)
46,500 (1997)65,000 (end 1997)
165,000–170,000(projected for 1999)
65,000 (1999)80,000–92,000 (2003)
PUTRA 360,000(projection in 1997)
12,000 (1999)125,000 (2000)150,000–160,000 (2003)
KL Monorail 60,000–80,000(projection in 2000)85,900(projection for 2002)
11,000 (2003)39,000 (2004)
181,200(projection for 2008)
Source: Adapted from The Edge (26 August 1996, 12 May 1997, 13 July 1998, 19 July 1999,6 December 2000, 15 January 2001, 20 September 2004); New Straits Times (1 January 1997;31 December 1997, 2 July 1999); Malay Mail (20 December 1997).
Table 5.06 Kuala Lumpur LRT: Daily ridership estimates and actual numbers needed
Operator (year) Estimated Needed Shortage
STAR (2000) 200,507 356,185 155,678STAR (2010) 255,108 482,666 227,558PUTRA (2000) 162,126 374,533 212,407PUTRA (2010) 227,625 554,557 326,932KL Monorail (2000) 99,555 102,545 2,990KL Monorail (2010) 195,011 200,862 5,851
Source: Adapted from JICA 1998b.
Kuala Lumpur Light Rail Transit 121

up on 17 May 2002. The company had assets worth RM3.1 billion and debtsof RM3.6 billion.
PUTRA expected to recover the RM4.35 billion cost of System 2 in 21years from operations alone. However, its performance was similarly affectedby its debt load and low farebox ratio of 0.22 (Halcrow Consultants 1999).PUTRA’s revenues were almost 30 per cent lower than STAR’s, despiteoperating a more lucrative route, while its operating costs were 73 per centhigher, resulting in an operating loss 164 per cent higher than STAR’s.Failure to reach its projected ridership reduced PUTRA’s ability to serviceits debt obligations, putting it under financial stress as soon as operationscommenced (Ratings Agency Malaysia, cited in The Edge, 13 July 1998)(see Table 5.08). In November 1999, PUTRA announced it was defaultingon interest payments to service its US$526 million construction loan andsubsequently requested CDRC assistance.21
KL Monorail expected to become profitable by 2007 with a projectedaverage annual net profit of RM82 million (RM561 million revenue) for2007–10, increasing to RM1.66 billion (RM3.03 billion revenue) for 2011–20,RM3.69 billion (RM5.72 billion revenue) for 2021–30, and RM4.41 billion(RM6.18 billion revenue) for 2031–40 (The Edge, 21 April 2003). Earlierprojections and actual results suggest that this is unlikely and the companyrecorded increasing losses (Table 5.09), with its commercial viability depend-ent on the approval of a debt-restructuring proposal, further loans and oper-ational profits.22 However, according to the company’s auditors, ‘there isuncertainty on the ability of [KL Monorail] to achieve profitable operationsin the foreseeable future’.23
Table 5.07 STAR: Profit and loss (RM million)
1993 1994 1995 1996 1997 1998 1999 2000Turnover — — — 1,709.0 34.7 35.2 40.0 0Operatingrevenue
— — — — — — — 59.2
Profit/(loss)before tax
914.0 2,269.0 (5,181.5) (14,957.0) (75.5) (134.4) (245.9) (236.6)
Source: Adapted from Companies Commission of Malaysia.
Table 5.08 PUTRA: Profit and loss (RM million)
1999 2000 2001
Turnover 6.5 43.1 71.3Operating revenue 71.3Operating costs 45.5 (80.4) (115.5)Profit/(loss) before tax (38.8) (126.8) (614.6)
Source: Adapted from Companies Commission of Malaysia.
122 Kuala Lumpur Light Rail Transit

Traffic volume
The daily traffic volume in Kuala Lumpur was expected to be reduced by aminimum of 25 per cent by the end of 1999 when all the traffic mitigationfactors were in place. These included the LRT system, high-occupancyvehicle lanes, a review of parking charges, KTMB commuter trains and theamalgamation of eight bus companies into two. However, unlike Singaporewhich has the capacity to monitor and track traffic growth, assessing anyreduction in traffic volume in Kuala Lumpur, especially attributable to theLRT system, is difficult. Nonetheless, the number of registered vehicles in thecity clearly indicates increasing car ownership, while declining average speedsover the past 10 years suggests increasing traffic congestion, even four yearsafter the commencement of LRT operations (JICA 1998). This is supportedby ongoing media reports and regular government-commissioned studieson traffic congestion, with traffic conditions expected to remain susceptibleto chronic congestion in the foreseeable future without drastic measures(Business Times, 5 October 1998). The LRT system thus did not facilitate amodal shift in transport use, although this also depended on an integratedpublic transport network and the implementation of complementary policies.It is the failure of the government to implement these measures which we nowturn to.
Problems
The Malaysian government was aware of the need for an integrated andcoordinated public transport system. Its failure to implement this (and thetraffic demand management methods discussed above), unlike Singapore,reveals the lack of institutional and political capacity. However, it is thegovernment’s political failure that is most striking, and the main reason whyprivatization failed. The failure of the LRT occurred on two levels. First, the
Table 5.09 KL Monorail: Profit and loss (RM ’000)
1997 1998 1999 2000 2001 2004 2005** 2006**
Projected*revenue
— — — — — 36,000.0 70,000.0 105,000.0
Turnover/revenue
— — — — 734.9 15,080.0 32,535.0 38,618.0
Projected*profit/(loss)
(42,000.0) (37,000.0) (8,000.0)
Profit/(loss)before tax
(43.2) (227.6) 13.9 121.1 409.9 (46,240.0) (75,936.0) (80,646.0)
Source: Adapted from Companies Commission of Malaysia; * The Edge, 21 April 2003; ** KLInfrastructure Group (2006).
Kuala Lumpur Light Rail Transit 123

government failed to ensure that the project and privatization were com-mercially viable (i.e. ex ante failure). This was partly related to informationproblems, although the evidence on construction costs indicates that theprivatization was very likely driven by short-term interests in search ofconstruction rents rather than operational profit. Underlying this werepatron–client networks that shaped the choice of project (i.e. infrastructureconstruction) and how this was allocated.
Second, having committed to the project, the government failed to thenimplement the necessary policies to maximize the LRT’s commercial viability,despite awareness of the problems and solutions. There is clear evidence ofthis ex post failure to correct mistakes. The government could not plan theroute optimally because it was unable to override commercial interests whorefused access to space for stations to be built. It was unable to force theoperators of Systems 1 and 2 to integrate their routes and provide commonstations and ticketing systems. It failed to merge bus companies and preventbus operators from plying LRT routes. It could not regulate parking faresor introduce a ‘congestion’ charge necessary to encourage a modal shiftfrom private to public transport. And it was unable to pass the necessarylegislation to centralize transport planning and authority.
Ex ante failure
The privatization of the LRT system could have proceeded for severalreasons. The government could have believed that the project was viable giventhe international consensus in favour of privatization, and lobbying byforeign and local commercial interests. Failure here could have then been dueto the government lacking the necessary information to make the correctdecision. Conversely, privatization also potentially offered opportunities formonopoly rents from construction to parties close to the political leadershipand would have been partly politically motivated. In this case, ex ante failurewould have been related to political considerations which constrained thegovernment’s decision. The concessions for Systems 2 and 3 were awarded,without open tender, to individuals closely linked to segments of the politicalleadership, and the nature of the project was consistent with Malaysia’spattern of privatization, focusing on infrastructure construction. (System 1remained state-owned.)
By awarding the concessions for construction and operations to the samecompany in each case, the government may have also sought to ensure theproject was self-financing. However, this led to a moral hazard problem,where profits could be made either up front (from construction) or spreadthrough the concession period (in the form of operating surpluses). From ourprevious discussion, we have seen that the project was flawed, based onunrealistic passenger projections which were arguably used to secure projectapproval (and financing). This created a large and potentially unpayable debtburden and led to a moral hazard problem where short-term profits from
124 Kuala Lumpur Light Rail Transit
construction became more attractive, particularly as there was no chance ofever recouping costs let alone making profits (see Halcrow Consultants 1999).The long concession period also reduced risks and incentives as businesses donot plan 30 to 60 years ahead (Fayard 1999; Halcrow Consultants 1999).
The evidence suggests that the concessionaires may not have been inter-ested in actual operations, and may have expected state assistance given theimportance of the project. TaylorWoodrow, as a construction company,was arguably more interested in the construction rather than operations ofSystem 1, and reduced its stake in STAR upon securing the concession(despite government efforts to get it to increase its equity share),24 leavingoperations to state agencies which controlled the consortium. PUTRA on theother hand, was owned by Renong, UMNO’s holding company, and wasrelieved of the project and its debts when the government renationalized theLRT system. KL Monorail was able to reduce its capital commitment andextend its concession period without penalties. The company continued tooperate the monorail but at a loss and with substantial government loans.
The higher cost of construction for all three projects when comparedwith similar systems in Singapore and Manila suggests that privatizationoffered the possibility of monopoly rents during construction. The large dis-crepancies between projected and actual ridership figures further suggest thatinflated forecasts served to secure project approval and financing, and that theprivatization of the LRT system was in fact not commercially viable withoutmuch larger subsidies (see The Edge, 13 July 1998). While there is a strongtendency for rail costs to be underestimated (e.g. see Flyvbjerg et al. 2002),project approval can also be secured where inflated construction costs aredisguised by over-optimistic revenue forecasts. The close relationship betweenpatron and client could also explain why the government did not disciplinethe operator of System 3 (KL Monorail) despite its failure to carry out theagreed capital investment or meet deadlines. The government also paid morefor System 2 (which was owned by an UMNO-related company) than System1 (state-owned) despite the former having a much higher debt.
Ex post failure
Having failed to determine that the privatization was viable before pro-ceeding, the government more crucially failed to then promote commercialviability. The implementation of any ex post policies would have differentialbenefits and costs, and successful implementation would require statecapacity to override attempts by potential losers to veto the suggestedchanges. These failures could have partly been due to institutional fragmen-tation, but from media reports we have seen that the government was awareof the problems affecting the performance of the LRT and sought to addressthese by: 1, physically integrating the LRT system; 2, streamlining busoperations and integrating the public transport system; and 3, managingtraffic. However, its ability to implement the necessary policies here was
Kuala Lumpur Light Rail Transit 125
constrained by private sector obstructionism, including the refusal of theLRT operators to cooperate, and by institutional fragmentation. Evidence ofex post failure can be found in the government’s inability to integrate theLRT system, streamline bus operations and reduce the use of cars. Thissuggests that the failure was more clearly due to the government’s lack of (expost) political capacity to enforce policy, and especially to override politicalresistance.
Failure to integrate the system
Successful LRT operations depended on government policies to promoteintegration between the different LRT lines. This included route alignment,access to stations, fare structure and common ticketing, and physical inter-face. The government identified corridors and mapped out areas that neededcoverage, but failed to plan and integrate the individual LRT lines, and theLRT system as part of the wider public transport network. Crucial decisionswere left to the individual concessionaires25 and there was no requirementor even encouragement for the operators to work together (Halcrow Con-sultants 1999). As a result, route alignment and station locations werenot optimal, fares and ticketing were not standardized, physical interfacebetween separate lines was poor, and the public transport network as a wholewas not integrated. All these factors contributed to low ridership.
Route alignment was compromised by space and cost constraints, withSystem 1 built on existing old rail tracks rather than through densely popu-lated areas,26 resulting in lower passenger numbers compared to System 2.System 2 was delayed by land acquisition problems and many of its stationswere isolated. Part of its route was affected by the refusal of the developer ofMid-Valley Mega Mall, a major shopping centre, to accommodate a station.Similarly, KL Monorail’s final station had to be built some 150 m from themain rail hub connecting all three LRT lines with the commuter rail network,because the owners of the adjacent land refused access.27
Poor physical integration was compounded by the different concession andconstruction periods, and the lack of cooperation among concessionairesand other commercial interests. Both STAR and PUTRA proceededindependently and refused to cooperate in terms of common stations andticketing. In the end, the government had to allow the common stations to beconstructed independently, physically connecting these later.28 The proposedconsolidation of the ticketing and fares systems, joint maintenance offacilities and the placing of all operators under one company, made littleheadway as operators would not cooperate, and the government was unableto enforce this. According to STAR CEO Zainal Abdul Ghani, operatorswere ‘pulling in different directions’ due to a failure to understand theirrespective roles in ‘the bigger picture’ (The Edge, December 2001). Anexample of this was KL Monorail’s fares which were more expensive thanLRT fares even though the monorail was to function as a ‘downtown
126 Kuala Lumpur Light Rail Transit
people mover’ (see City Hall Kuala Lumpur, undated). This further under-mined cumulative system effects.29
Failure to streamline bus operations
As rail coverage is naturally limited to a catchment area of 600-metre radius,the LRT system must rely partly on an efficient feeder bus service to increaseridership. Stations were serviced by a flat fare (RM0.50) feeder bus with aprojected 15-minute (peak) and 20-minute (off-peak) interval. However,the service proved unreliable and was unprofitable for the contracted buscompanies, leading to its eventual discontinuation and takeover by the LRToperators themselves.30
The LRT system also needed an efficient and complementary bus servicewhich functioned as a dispersal system. However, the existing public trans-port system was characterized by poor integration between modes and theabsence of a coherent network, with parallel bus services competing directlyagainst LRT routes rather than acting as feeder services to LRT stations(Halcrow Consultants 1999). Buses also operated on flat fares (which weretightly regulated) compared to distance-based fares on the LRT, making itmuch cheaper to travel by bus than by LRT.
The government sought to streamline and integrate bus operations, andrestructure fares to encourage interchange into the LRT system. However,its proposed merger of the 14 bus companies was delayed because of thepolitical influence of bus company owners.31 Even after the governmentfinally got the majority of bus companies to merge into two consortiums(inner and outer city), their commercial viability was undermined by thecontinued operations of independent bus operators plying parallel routesamounting to an estimated 30 per cent of total passenger kilometres(Halcrow Consultants 1999).
Failure to reduce car use
Passenger numbers on the LRT largely depended on government policies toinduce a modal shift from private to public transport use, and originaldemand forecasts for the LRT were based on government and DBKL plansto ‘aggressively’ pursue certain policies to promote the use of publictransport.32 Discussions on restricting cars centred on introducing area roadpricing (ARP, a form of ‘congestion’ charge), promoting high-occupancyvehicles (HOVs), restricting parking spaces and reviewing parking charges.However, the government was unable to introduce the necessary legislation,relying instead on cooperation from the public and businesses. As a result,these measures were never implemented, with government policies largelyincoherent and characterized by institutional fragmentation. The voluntarycar pooling campaign failed repeatedly as the government was unwillingor unable to enforce its HOV policy, first mooted in 1994. Similarly, the
Kuala Lumpur Light Rail Transit 127

introduction of ARP was not implemented despite being raised as early as1991.33 This was expected to restrict car trips to 1997 levels, increase thepublic transport share of daily passenger trips to 24.2 per cent (2000), 25.4per cent (2010) and 28.9 per cent (2020), and improve the LRT operators’financial performance (although these figures were based on higher thanactual ridership) (Rosli and Ooi 1993; JICA 1998b).
To work, ARP needed to be complemented by increased parking charges inthe city and urban development control, as well as traffic guidance systems(JICA 1998b). The government sought to introduce these measures byphasing out all roadside parking to discourage single-occupancy vehicles(1994 and 1996), increasing parking fees in the city centre (1995, 1996, 1997)and reducing parking areas, including freezing approvals for new high-risebuildings in the city centre and reducing cheap or free parking spaces inexisting and new buildings. However, the government found it difficult toimplement these due to existing local by-laws34 and opposition by the build-ing and national car industries, parking operators, businesses and interestgroups (see Business Times, 1 May 1997, 17 January 2001; New Straits Times,26 January 1998, 17 January 2001). The government was even unable topromote ‘park and ride’ facilities at LRT stations as it was more lucrative forcar park operators to be located in the city.
Instead, conflicting solutions were often proposed, partly driven by apreference for road construction that also characterized much of Malaysia’sprivatization programme. Traffic congestion also increased in the absenceof urban development control, particularly as new housing and commercialprojects were developed without accompanying public transport infra-structure. In the absence of urban planning, the government’s three-prongedpublic transport strategy for Kuala Lumpur involving the bus, the LRT andcommuter rail services was seen to be insufficient to offset the additionaldemand on the transport system generated by new commercial developmentsin the city.35
Institutional fragmentation
Incoherent and conflicting transport policies were also the result of insti-tutional fragmentation. In 1993, urban transport policy in Kuala Lumpurinvolved 10 ministries, 12 federal agencies and seven local agencies overseeingplanning, financing, implementation, fares, operations, regulation andenforcement. The absence of a single agency responsible for administering allaspects of transportation comprehensively resulted in delays in the decision-making process.36 Despite proposals for a single body with overall responsi-bility for transport policy in 1984 and 1995, this was never established.37 Theabsence of a central transport authority and laws also complicated the intro-duction of ARP as it was unclear who would receive revenues collected.38
Instead, institutional changes after 1986 increased the powers of the EPU butwithout really centralizing authority.
128 Kuala Lumpur Light Rail Transit
In 1986, the Ministry of Transport was responsible for formulating policiesrelating to land, sea and air transport, and for coordinating all planningactivities as well as ensuring the implementation of development programmesand projects of the departments and statutory bodies under it. The Ministryof Public Enterprises through the Road Transport Licensing Board (LPPJ)determined policies related to applications for operating licences, fares,routes, etc. The EPU had one representative out of the seven members on theLPPJ council. The Ministry of Works was responsible for infrastructure con-struction, improvement and maintenance. This was undertaken through thePlanning Research Development Unit (BPPP – planning of federal roads),state Public Works Department (JKR – planning of state roads), and Malay-sian Highway Authority (LLM – planning of toll expressways). Proposalsfor public transport projects in the Klang Valley could also originate fromthe local (Selangor) state government, Ministry of the Federal Territory,and DBKL. Within Kuala Lumpur, DBKL also shared traffic control andsurveillance responsibilities with the Road Transport Department (JPJ).
Authority for the regulation of the development and operation of publicroad transport (granted by Part V of the Road Transport Ordinance [RTO]1958 Amended) provides JPJ and the Ministry of Transport with the task ofadministration and enforcement of the RTO and subsidiary legislation so asto ensure road safety in the regulation and control of commercial transportuse. However, overall implementation of the RTO also comes under the pur-view of the LPPJ, traffic branch of the police, the Ministry of Environment,JKR and local government authorities. Crucially, neither the Ministry ofTransport nor the Ministry of Public Enterprises were given the outrightresponsibility for assuring that public transport services were adequate.Furthermore, while the roles of LPPJ and JPJ are separate, this division ofauthority was not always efficient. While public road transport was con-trolled by LPPJ and JPJ, rail was directly regulated by the respective depart-ment under the Ministry of Transport, i.e. Malayan Railways (KTMB),which was the sole operator of railway services in the Klang Valley and itsmanagement was under the jurisdiction of the Railway Ordinance 1948.
By 1994, planning for all modes of transport including traffic control wasthe responsibility of the EPU. Local governments carried out planning,design, construction and maintenance of smaller projects, and implementa-tion of general plans and big projects (e.g. railways) already determined andfinanced by the federal government. The Ministry of Transport oversaw alltransport modes, the Ministry of Works concentrated on road matters only,and the Ministry of Entrepreneur Development was responsible for busesand taxis.
However, this did not reduce overlap and duplication, leading to someconflicting policies or programmes39 with a lack of clarity about roles andresponsibilities,40 including which body was responsible for governmenttargets for transport modes quoted by STAR and PUTRA as the basis oftheir demand forecasts (Halcrow Consultants 1999). The institutional
Kuala Lumpur Light Rail Transit 129
framework for urban rail remained highly fragmented, being dividedbetween the EPU, DBKL and local governments (planning); EPU and MoF(financing); MoT, Department of Rail and Railway Asset Corporation(implementation); Cabinet and EPU (fares); and MoT (regulation) (HalcrowConsultants 1999).
The absence of a central authority was due to the government’s lack ofpolitical capacity to override the competing interests of various departments.As existing law did not provide sole authority to a single department,departments and ministries were unwilling and under no legal obligationto give up existing powers. This was further complicated by the sharing ofportfolios among the ruling coalition’s component parties, with no one partywilling to give up authority. In this context, DBKL’s 1984 proposal for asingle transport agency came from one ministry with no authority. Even theMoF’s Special Task Force on Public Transportation, formed in 2001 by thefederal government in the absence of a central authority, relied on persuasionand networks rather than enforcement.41
In contrast, Singapore’s urban rail network is financed by the governmentthrough the Land Transport Authority (LTA) and run by two companies,based on an initial 10-year license. The Singapore Mass Rapid Transit(SMRT) Corporation (62.3 per cent state-owned) operates two urban raillines, two light rail services, rail operations and maintenance, and bus andtaxi services. The private SBS Transit runs a bus service and one urbanand one light rail line. Fares are regulated by the Public Transport Counciland integrated by the LTA through an integrated fare system. This integratedoperations enabled SMRT to earn an average annual pre-tax profit of S$118million (1999–2001), with its MRT rail system registering an average annualpre-tax profit of S$113 million (1999–2003) on an average daily ridershipof 1.03 million (1999–2003) across four integrated networks (SMRTCorporation 2001–4). The commercial viability of the MRT was due tothe government underwriting the cost of infrastructure construction, whichallowed the company to operate without the burden of debt servicing. TheLTA continues to finance the expansion of the rail network to accommodatepassenger growth from new housing developments.
More crucially, the MRT was undertaken as part of an integrated trans-port policy. But unlike the UK, Malaysia and Thailand, the Singaporegovernment had the political capacity to develop the necessary institutionsand policies, supported by relevant laws which it was able to enforce aspart of an integrated transport policy covering different modes of transport.Policy was implemented through the LTA which had the regulatory powersto: plan, design, construct, manage and maintain roads (through the StreetWorks Act); plan, design, construct, manage, operate, maintain and regulatethe railway (the Rapid Transit Systems Act); and provide parking placesfor motor vehicles, and license and regulate the use of parking places(the Parking Places Act). This enabled the government to limit automobiletraffic using price mechanisms (auctions or certificate of entitlement,
130 Kuala Lumpur Light Rail Transit
heavy taxes on car ownership, road use and parking charges) and maximizepublic mobility through the use of public and non-motorized transport andtaxis.
Conclusion
Privatization does not address the considerable financing and systemcoordination requirements of urban rail systems. The sector is characterizedby very high capital costs and low farebox ratios which have made it difficultfor operators to finance capital expenditure, cover operating costs and earn areturn on investment. In addition, fares often need to be kept low due to thepolitical sensitivity of high fares and thus cannot cover costs. High fares willalso potentially reduce passenger numbers. The inability of the private sectorto provide affordable fares and at the same time finance capital expansion hasnecessitated state subsidies. This in turn will require ongoing state inter-vention to monitor and regulate performance. The state will also need tocoordinate capital investment and operations to promote system integration,and to integrate urban rail systems with the wider public transport network inorder to improve coverage and hence, passenger numbers.
The main economic objective of the LRT was to improve Kuala Lumpur’spublic transport network and reduce traffic congestion. Privatization aimedto facilitate the private finance, delivery and operation of the system. Whilethe private sector helped finance the LRT, public funds were central to allthree privatizations, contributing between 32 and 78 per cent of financing. Interms of delivery, Systems 1 and 2 were completed on time but System 3 wassubstantially delayed and its scope considerably reduced. All three projectswere more expensive per kilometre than comparable lines in Singapore andManila, in particular System 3. Fares for Systems 1 and 2 were comparativelylow but System 3 had the highest fares per kilometre in the region. Theconcessionaires of Systems 1 and 2 faced financial difficulties upon com-mencement of operations and were unable to service interest payments ontheir loans. System 3, while still privately owned and operated, faces increas-ing financial difficulties following mounting losses, and its commercial viabil-ity will depend on debt restructuring, further loans and operational profitswhich seem unlikely in the foreseeable future. Finally, the LRT system did notappear to reduce traffic congestion although, as discussed, this was in partrelated to wider failings in the public transport system and public transportpolicy.
The privatization of the LRT was characterized by both ex ante and expost failures in terms of our definitions. Despite the problems inherent inurban rail systems, the privatization proceeded because it was partlymotivated by political considerations. These in turn affected decisionsrelated to the type of privatization, resulting in the government’s ex antefailure to ensure project viability and preserve incentives. Privatizationallowed resources to be allocated to parties close to segments of the political
Kuala Lumpur Light Rail Transit 131

leadership, and the nature of the privatization was consistent with the prefer-ences of local capitalists, centring on infrastructure construction. Ratherthan underwrite capital costs to allow the private operator to focus on oper-ational efficiency without a debt burden (as is the case in Singapore), thegovernment awarded the concessions for construction and operations to thesame operator in each case. This created opportunities for short-term rentsfrom construction but also led to a moral hazard where this became moreattractive than long-term profits arising from operational efficiency.
This is supported by the comparative evidence of construction costs inthe region. The attractiveness of profits from construction as opposed tooperations may also have provided STAR and PUTRA with a strongmotivation to complete construction on time. This ex ante failure to properlystructure incentives created a huge debt burden resulting in the financialproblems of the concessionaires for Systems 1 and 2. This was compoundedby revenue projections based on grossly inflated and unrealistic passengernumbers (for all three systems) which were partly based on governmentpolicies to promote public transport, but arguably also to secure projectapproval and financing. As a result, the concessionaires for Systems 1 and 2were unable to service interest payments on loans.
However, as ex ante decisions were in part constrained by imperfect infor-mation and political considerations, the success of the LRT system thendepended on the government implementing policies to integrate the publictransport network thereby increasing passenger numbers and improving theproject’s commercial viability. From the evidence, we know that the govern-ment was aware of what policies were needed ex post, but was unable toimplement these. The government failed to physically integrate the LRTsystem, streamline bus operations and integrate the public transport system,and restrict cars in the city. It could not enforce conditionalities on the con-cessionaires, override private-sector recalcitrance and obstructionism, andcentralize planning and authority in order to implement a coherent transportpolicy. Instead, state intervention was marked by institutional fragmentation(itself the outcome of political factors) and the absence of a coherent trans-port policy. This indicates that the government’s ex post failure was due topolitical, rather than institutional, factors and underlines the importanceof the state’s political capacity to enforce system integration as the mostimportant condition for successful urban rail operations. This problem isunlikely to be addressed by privatization for the reasons already discussed.
132 Kuala Lumpur Light Rail Transit
6 Perverse incentivesMalaysia Airlines
Privatization offers the possibility of financing an airline’s capital expansionand improving efficiency. However, the airline industry is characterized bysubstantial and increasing capital costs, low profit margins, and periodicdownturns. This has led to regular bankruptcies and mergers, and necessi-tated state subsidies and bail-outs because of the economic cost of failure. Inthis context, the benefits of private ownership are less clear cut as it does notnecessarily provide a more credible promise for the state not to intervene.Furthermore, the substantial capital costs are often beyond the financialcapacity of the private sector, necessitating some form of state financialassistance or implicit guarantee of commercial loans as has been the casehistorically. This potentially undermines incentives as risks are shared.Furthermore, national airlines are prestigious and usually created andmaintained for political reasons. This introduces a moral hazard where thegovernment has a vested interest in the viability of the airline, and privatiza-tion does not necessarily promote a more ‘arm’s length’ relationship betweengovernment and enterprise in this case.
The privatization of Malaysia Airlines1 (MAS) aimed to help finance theairline’s expansion plans. However, privatization was arguably not ‘feasible’in terms of ‘attractiveness to the private sector’ given the significant industrychallenges, MAS’s low profitability and institutional constraints arising fromits role as national carrier. It was also not feasible for the government becausethe substantial capital costs involved were prohibitive for any potentialprivate investor. Why then did privatization proceed? On the one hand, itappeared to have been motivated by political considerations related to stateefforts to promote Malay entrepreneurs. The candidate was also closelyassociated with the political leadership, in particular Finance Minister DaimZainudin, suggesting that the privatization decision was shaped by politicalfactors related to intra-party rivalry within UMNO.
On the other hand, recent evidence suggests that the sale may have beenrelated to government attempts to cover substantial foreign exchange lossesby Bank Negara Malaysia (BNM), the central bank, by raising much neededfunds on the private financial markets.2 According to the owner, he was‘instructed’ to purchase a controlling stake in MAS in the ‘national interest’
(see The Sun, 6 July 2006). This would partly explain why MAS was sold atRM8 per share when this was only worth RM3.50, with commercial bankslikely to have been ‘instructed’ to lend the money.3 It may also explain why thegovernment paid RM8 per share upon renationalization when shares wereworth only RM3.80, and despite already having a controlling stake in theairline.
In either scenario, the outcome was the same. Ex ante failure to properlystructure incentives affected performance. Privatization improved produc-tivity in certain areas, but MAS remained inefficient by regional standards.This ongoing inefficiency compared to its regional competitors, and its debtburden, had a negative impact on the airline’s financial performance, andthe government was forced to intervene when the new owner, faced withmounting company and personal debts, was unable to continue financingthe airline. While it remains unclear what actually motivated privatization,the central issue is why the government, despite being aware, was unableto address problems that arose from ex ante failures to properly structureincentives.
Regardless of whether the candidate was the actual owner or merely anominee or agent of the government, privatization did not significantlychange the institutional relationship between the airline and the state.Management decisions were generally constrained by the state, and thegovernment continued to have a say in major decisions, although the newowner appeared to have some autonomy over certain decisions (includingthose related to the airline’s contracts with third party companies). As anagent, the owner would have had few incentives to improve efficiency. Thepurchase structure of the airline and subsequent fleet expansion also placeda huge debt burden on the new owner which was unsustainable and acted as afurther disincentive, particularly given the problems inherent in the airlineindustry. These factors, independently or in combination, arguably createdperverse incentives for the pursuit of short-term profits (in this case, throughthe third-party purchase of aircraft and the creation of separate cargo andcatering divisions)4 (e.g. see New Straits Times, 25 February 2002).
The near bankruptcy and subsequent renationalization of MAS thus hada series of contributing factors that can be classified as ex ante and ex postfailures of government. In the former category, the choice of candidate waspoor (regardless of government motivation), and the government failed toensure that the financial structure of the privatization was viable, or accountfor the substantial capital demands and cyclical nature of the industry. In thelatter category, it failed to correct this ex ante failure, including addressingproblems related to previous government policies (which affected MAS) andmonitoring and disciplining the new owner, despite being aware of problemsfairly early on. Here, successful privatization would have required that thegovernment structure the purchase of the airline viably, or implement correc-tive measures by providing operational subsidies (especially as domestic fareswere regulated), monitor performance and enforce conditionality.
134 Malaysia Airlines

Both types of failures were in part related to the nature of resource alloca-tion through patron–client networks, and the legacy of previous state capitalaccumulation strategies discussed in Chapter 3. The choice of candidate wasconsistent with ongoing state attempts to create a class of Malay industrialistswho were also closely associated with (and loyal to) segments of the politicalleadership. However, the new owner did not have the financial and managerialcapacity, having based his corporate expansion on the takeover of existingprofitable enterprises through his political connections (e.g. see Gomez andJomo 1997). This compromised his ability to finance and run the airline. Hisclose association with the political leadership and the national importance ofthe airline also led to a moral hazard, where the government was unlikelyto allow it to fail, but was also unable to intervene earlier to enforce discipline(or replace the owner) and prevent the airline’s financial deterioration.
This chapter is structured as follows. The next section will provide a dis-cussion of the challenges faced by the airline industry, how privatizationaddresses these, and the challenges posed specifically by MAS (includinggovernment objectives). This is followed with an overview of MAS, itsprivatization and renationalization. We then evaluate the operational andfinancial performance of MAS in relation to its immediate regional com-petitors, accounting for the effects of the Asian financial crisis. The followingsection identifies the main problems in terms of ex ante and ex post failures.The final section summarizes the main findings and concludes.
Challenges
The aim of privatizing airlines is to finance capital expansion and enhanceoperational efficiency. However, the airline industry is characterized by lowprofit margins, high indebtedness, rising capital costs and overcapacity, withstate subsidies and bail-outs common features, especially in recent years. Theairline business model is also highly risky, being capital-intensive and highlyleveraged, with a high controlling premium of around 30 per cent. Profitabilityis cyclical, with high profits attracting excessive entry and fare competition,followed by a period of losses and restructuring. Airlines thus need highmargins and a guaranteed uptake (passenger load), but demand is susceptibleto the industry’s cyclical nature and external shocks, resulting in problems ifnot failures.
Historically, airlines have only been able to make profits on their operationsin favourable circumstances and the industry has only been marginally profit-able between 1960 and 1990 (Davies 1964; Doganis 1991). Even in 1984–89,the most successful period in airline history, operating profit only averagedabout 4–6 per cent (at its peak), and dropped to 1–2 per cent after interest andnon-operating items were included (Doganis 1991). Operating margins werefurther reduced after taking into account operating revenues, expenses,profit and loss. High capital costs and low profit margins led to airline debt.The significant difference between operating results and profits after tax
Malaysia Airlines 135
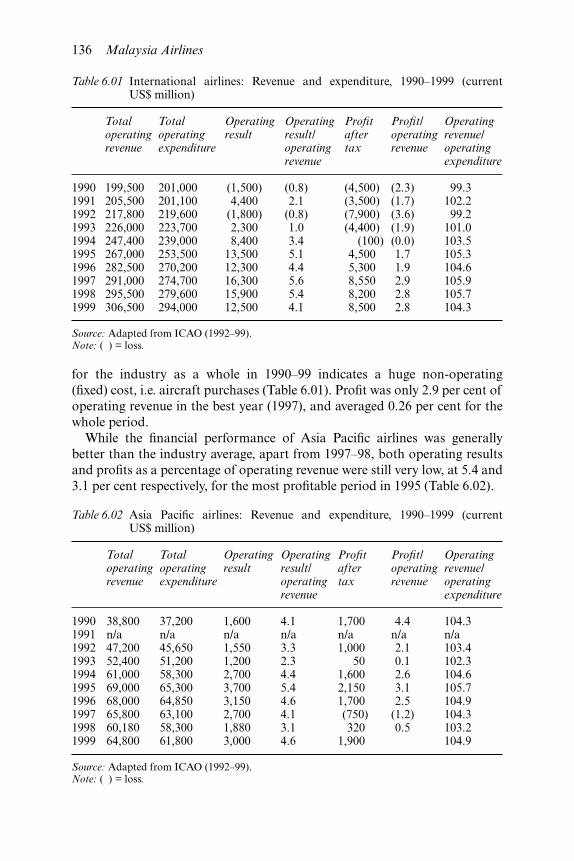
for the industry as a whole in 1990–99 indicates a huge non-operating(fixed) cost, i.e. aircraft purchases (Table 6.01). Profit was only 2.9 per cent ofoperating revenue in the best year (1997), and averaged 0.26 per cent for thewhole period.
While the financial performance of Asia Pacific airlines was generallybetter than the industry average, apart from 1997–98, both operating resultsand profits as a percentage of operating revenue were still very low, at 5.4 and3.1 per cent respectively, for the most profitable period in 1995 (Table 6.02).
Table 6.01 International airlines: Revenue and expenditure, 1990–1999 (currentUS$ million)
Totaloperatingrevenue
Totaloperatingexpenditure
Operatingresult
Operatingresult/operatingrevenue
Profitaftertax
Profit/operatingrevenue
Operatingrevenue/operatingexpenditure
1990 199,500 201,000 (1,500) (0.8) (4,500) (2.3) 99.31991 205,500 201,100 4,400 2.1 (3,500) (1.7) 102.21992 217,800 219,600 (1,800) (0.8) (7,900) (3.6) 99.21993 226,000 223,700 2,300 1.0 (4,400) (1.9) 101.01994 247,400 239,000 8,400 3.4 (100) (0.0) 103.51995 267,000 253,500 13,500 5.1 4,500 1.7 105.31996 282,500 270,200 12,300 4.4 5,300 1.9 104.61997 291,000 274,700 16,300 5.6 8,550 2.9 105.91998 295,500 279,600 15,900 5.4 8,200 2.8 105.71999 306,500 294,000 12,500 4.1 8,500 2.8 104.3
Source: Adapted from ICAO (1992–99).Note: ( ) = loss.
Table 6.02 Asia Pacific airlines: Revenue and expenditure, 1990–1999 (currentUS$ million)
Totaloperatingrevenue
Totaloperatingexpenditure
Operatingresult
Operatingresult/operatingrevenue
Profitaftertax
Profit/operatingrevenue
Operatingrevenue/operatingexpenditure
1990 38,800 37,200 1,600 4.1 1,700 4.4 104.31991 n/a n/a n/a n/a n/a n/a n/a1992 47,200 45,650 1,550 3.3 1,000 2.1 103.41993 52,400 51,200 1,200 2.3 50 0.1 102.31994 61,000 58,300 2,700 4.4 1,600 2.6 104.61995 69,000 65,300 3,700 5.4 2,150 3.1 105.71996 68,000 64,850 3,150 4.6 1,700 2.5 104.91997 65,800 63,100 2,700 4.1 (750) (1.2) 104.31998 60,180 58,300 1,880 3.1 320 0.5 103.21999 64,800 61,800 3,000 4.6 1,900 104.9
Source: Adapted from ICAO (1992–99).Note: ( ) = loss.
136 Malaysia Airlines

The industry is further characterized by short-run marginal costs closeto zero, encouraging airlines to sell remaining seats at virtually any priceabove the very low marginal cost of carrying an additional passenger. Priceinstability is aggravated by the tendency of new entrants to aggressively tryto capture market share, and financially weak or subsidized (often national)carriers to generate sufficient cash flow by undercutting existing tariffs(Doganis 1991). The high cost of exit has also jeopardized the profits ofefficient airlines as loss-making or inefficient airlines continue to operate withsubstantial subsidies. Besides direct payments, indirect government supportmay involve rescheduling debts, cross-subsidies, as well as undercuttingexisting fares in order to generate sufficient cash flow to meet daily payments(Doganis 1991). Subsidies have been made available either as a support for anadolescent industry, or for political and prestige reasons (Davies 1964).
Although new technology reduced operating costs per capacity tonne-kilometre, it also drastically raised capital costs. The cost of a new aircraftincreased from US$2 million (for a 200-seater Boeing 707 or 250-seaterDouglas DC-8 in the mid-1950s) to US$45 million (for a 265-seater AirbusA310 in 1984) and US$60 million (for the same plane in 1990). At least threeEuropean airlines suffered losses of around £8 million each in 1961 as a resultof plane purchases, while US airlines merged as a means to survive (Davies1964). Nonetheless, airlines continued to purchase new aircraft as a result ofeasier access to financing, facilitated by manufacturers and leasing com-panies, and competitive pressures, despite the industry performing poorly.The result was high levels of indebtedness among many major airlines by theearly 1980s.
High capital expenditure increased the debt–equity ratios and interestrepayments. A large part of current revenues is needed to finance interestpayments on accumulated debts. After paying interest, International AirTransport Association (IATA) member airlines collectively lost US$5.65billion in 1980–82 (Doganis 1991). Interest charges for the world’s airlinestotalled around US$4.0–4.5 billion in 1987. (To finance the estimated US$400billion invested globally on aircraft between 1990 and 2000, airlines wouldhave needed an operating profit before interest of 6 per cent a year which hadnot been achieved since 1969.) Additional earnings, not leverage alone, arekey to financing the industry’s needs (Mandell 1979). The growing reliance onexternal finance, rather than self-financing or equity capital, also contributedto very high debt–equity ratios, with many airlines under-capitalized andneeding capital injections to manage interest payments and order new aircraftwithout bankrupting themselves (Doganis 1991).
The tendency of airlines to embark on massive fleet expansions has createdovercapacity in times of sharply falling profit margins, particularly withnewer, higher-capacity and faster aircraft. Airlines have historically expandedtheir fleets, which increased aircraft capacity without corresponding growthin passenger traffic (Davies 1964). This is largely due to the time lag betweenordering (when growth rates are high) and receiving new aircraft, and the
Malaysia Airlines 137
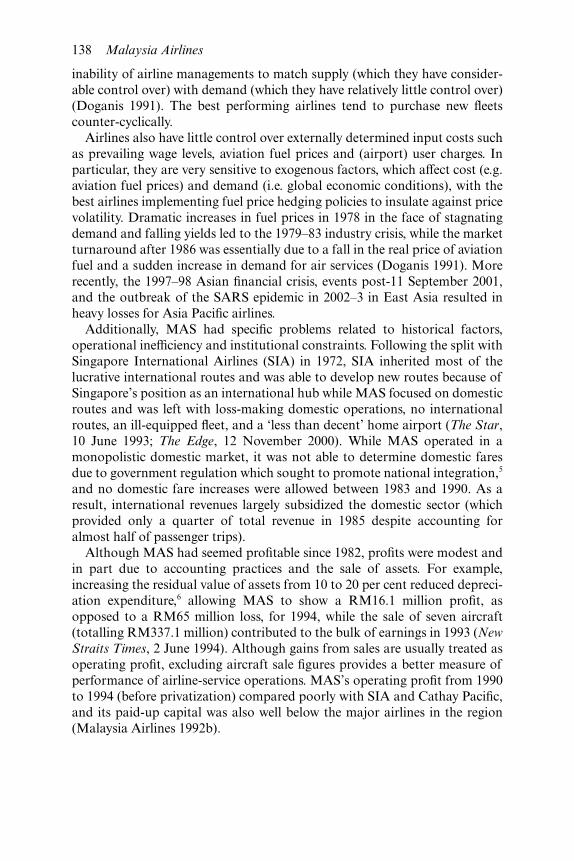
inability of airline managements to match supply (which they have consider-able control over) with demand (which they have relatively little control over)(Doganis 1991). The best performing airlines tend to purchase new fleetscounter-cyclically.
Airlines also have little control over externally determined input costs suchas prevailing wage levels, aviation fuel prices and (airport) user charges. Inparticular, they are very sensitive to exogenous factors, which affect cost (e.g.aviation fuel prices) and demand (i.e. global economic conditions), with thebest airlines implementing fuel price hedging policies to insulate against pricevolatility. Dramatic increases in fuel prices in 1978 in the face of stagnatingdemand and falling yields led to the 1979–83 industry crisis, while the marketturnaround after 1986 was essentially due to a fall in the real price of aviationfuel and a sudden increase in demand for air services (Doganis 1991). Morerecently, the 1997–98 Asian financial crisis, events post-11 September 2001,and the outbreak of the SARS epidemic in 2002–3 in East Asia resulted inheavy losses for Asia Pacific airlines.
Additionally, MAS had specific problems related to historical factors,operational inefficiency and institutional constraints. Following the split withSingapore International Airlines (SIA) in 1972, SIA inherited most of thelucrative international routes and was able to develop new routes because ofSingapore’s position as an international hub while MAS focused on domesticroutes and was left with loss-making domestic operations, no internationalroutes, an ill-equipped fleet, and a ‘less than decent’ home airport (The Star,10 June 1993; The Edge, 12 November 2000). While MAS operated in amonopolistic domestic market, it was not able to determine domestic faresdue to government regulation which sought to promote national integration,5
and no domestic fare increases were allowed between 1983 and 1990. As aresult, international revenues largely subsidized the domestic sector (whichprovided only a quarter of total revenue in 1985 despite accounting foralmost half of passenger trips).
Although MAS had seemed profitable since 1982, profits were modest andin part due to accounting practices and the sale of assets. For example,increasing the residual value of assets from 10 to 20 per cent reduced depreci-ation expenditure,6 allowing MAS to show a RM16.1 million profit, asopposed to a RM65 million loss, for 1994, while the sale of seven aircraft(totalling RM337.1 million) contributed to the bulk of earnings in 1993 (NewStraits Times, 2 June 1994). Although gains from sales are usually treated asoperating profit, excluding aircraft sale figures provides a better measure ofperformance of airline-service operations. MAS’s operating profit from 1990to 1994 (before privatization) compared poorly with SIA and Cathay Pacific,and its paid-up capital was also well below the major airlines in the region(Malaysia Airlines 1992b).
138 Malaysia Airlines

BackgroundThe privatization of MAS was partly to overcome government financial con-straints and meet the airline’s capital expansion plans in 1984 (which wouldhave otherwise required MAS to generate an unrealistic profit of US$30million a year) (Doganis 1991). Partial divestiture was seen as an attractivesolution to meet the airline’s capital investment needs in the absence ofadditional equity capital from the government, and MAS was corporatized7
in 1985 (Doganis 1991). Some equity was sold to the public and the Bruneigovernment in September 1985 for RM180 million, but the Malaysiangovernment retained a significant interest through the Ministry of Finance(MoF) (Gomez and Jomo 1997). The airline was publicly listed on 16December 1985. In 1988, Bank Negara Malaysia (BNM), the central bank,acquired a 32 per cent stake in MAS from the MoF.
While divestiture of MAS shares8 (based on a 1985 consultant’s proposal)reduced the government’s share from 90 to 42 per cent by November 1986, itdid not really change the institutional relationship between MAS and thegovernment (Jones and Fadil 1992). The creation of a ‘golden share’ allowedthe government to retain control by having the right to appoint threedirectors, ensure repayment of capital paid up on the special share in priorityover any other shareholder in the event of the company winding-up, andrequire MAS to redeem the special share at par at any time (Malaysia Airlines1995). However, the government would stop guaranteeing MAS loans andcredit facilities.
In December 1993, the government announced that Malaysian HelicopterServices (MHS), a publicly listed company controlled by Tajudin Ramli,would acquire the 32 per cent stake in MAS from BNM for RM1.79 billion(or RM8 per share when MAS shares were trading for RM3.50).9 Therewas no open bidding, and according to Tajudin in a document filed in courtin 2006, the actual sale was made to his private company, RZ EquitiesSdn Bhd, to expedite the sale and bypass time-consuming approvalswhich MHS, as a publicly listed company, would have had to obtain; this wasnecessary to offset large foreign exchange losses incurred by BNM (estimatedat RM16–RM32 billion) when it speculated on the sterling in 1994 (seeThe Sun, 6 July 2006).
However, rather than cash, the MAS acquisition was to involve a shareswap, with BNM obtaining 112 million new RM1 MHS shares, issued atRM16 each (Gomez and Jomo 1997). After a fall in share prices, the shareswap proposal involving MAS and MHS was rescinded, and RZ Equitiesacquired a 32 per cent stake (224 million shares) in MAS for RM1.79 billionin June 1994 (Gomez and Jomo 1997). MHS was given a one-year call optionto acquire RZ Equities from Tajudin and did so in August 1994. MHS laterchanged its name to Naluri. Tajudin assumed control of MAS on 6 August1994. The purchase was entirely financed by bank loans, the largest in thecountry, with Tajudin pledging most of his shares in Naluri and TRI and his
Malaysia Airlines 139

other interests as security for the syndicated loan. With the sale, Tajudin(through DCB Merchant Nominees (Tempatan) Sdn Bhd) owned 32 per centof MAS, while the government owned 27.2 per cent10 and retained a ‘goldenshare’ through the MoF.
After successive losses and mounting debts between 1998 and 2000,Tajudin admitted he could no longer finance MAS. The government con-firmed on 6 November 2000, after two years of speculation, that it wasinvolved in talks to buy Tajudin’s stake in MAS, and approved, in principle,the purchase of MAS on 23 November 2000 (Asian Wall Street Journal,24 November 2000). On 20 December 2000, Tajudin signed an agreement tosell his share in MAS back to the MoF for RM1.79 billion, or RM8 per share,when MAS shares were trading for around RM3.80. The government wasreported to have agreed on the price considering the net tangible assetsof MAS and the premium for a controlling stake (New Straits Times,21 December 2000) even though it paid less to the Brunei government andalready owned 49.2 per cent of MAS by 12 December 2000 through variousagencies.11
Performance
Privatization here will be taken to refer to the period after the sale of acontrolling stake to Tajudin in December 1993 as the government continuedto be the majority shareholder after corporatization in 1985. MAS’s per-formance can be measured in terms of operational efficiency (revex ratio,productivity, passenger load factor, passenger yield) and financial perform-ance (leverage, liquidity and profitability). Although both sets of indicatorswere affected by the 1997–98 Asian financial crisis, we can isolate externalfactors in assessing the performance of MAS before and after privatization intwo ways.
The first is to examine data before the Asian financial crisis, which startedin the second half of 1997. As MAS’s financial year ends in June, this allowsus to consider data covering three years of privatization before the crisis(1994–97), with the three years prior to privatization (1990–93), excluding1993–94 (which may be viewed as a transition year as privatization wasannounced at the end of 1993 and Tajudin only assumed control of MAS on6 August 1994). Although this is a fairly brief period to assess, it doesisolate, to a degree, the impact of the Asian financial crisis, and provides someindication of efficiency gains and financial performance.
Secondly, we can reduce the effects of external factors by comparingMAS’s average performance in each period (as well as post-1997) with thecombined average performance of its main regional competitors (referred toas MAS’s ‘competitors’) – Singapore International Airlines (SIA), CathayPacific and Thai Airways. It is also important to examine trends for each ofthese indicators, and to locate them in the context of overall industry trends.Hence, if MAS exhibited improvements which coincided with general
140 Malaysia Airlines
improvements in the industry, then these may not necessarily have been dueto management decisions. This is instructive as the seriousness of MAS’sfinancial problems only became obvious after 1997, as its competitorswere recovering. This suggests that the causes of its operational and financialproblems can be traced to the period before 1997.
MAS’s performance is broadly consistent with the trends in the airlineindustry, particularly the higher than average growth in the Asia Pacificregion. The global industry between 1990 and 2000 was characterized bystrong growth rates in traffic and passenger kilometres, with the exception of1991–93 and 1997–98. This growth was highest in the Asia Pacific, which wasleast affected by the early 1990s slump, but most severely affected by the1997–98 crisis which began in the second half of 1997. The region, however,started recovering by 1999.
Given the nature of MAS’s domestic sector, and the regulation of domesticfares, and in order to facilitate regional airline comparisons, the data mainlyfocuses on international flights, and as much as possible from the sameindustry source. (However, it is not possible to separate MAS’s internationaland domestic data in most instances, which means that if the domestic sectorwas being subsidized by international revenues, the results may be biased.Among MAS’s competitors, only Thai Airways operates domestic flights.) Asthe data has been gathered from the public domain, it is subject to someinconsistencies depending on the source and accounting year, and in the caseof MAS financial reports, frequent revisions. As a rule, data from MAS’smost recent financial statement will be used for earlier years. Airline com-parisons will be based on International Civil Aviation Organization (ICAO)data. ICAO and IATA data for the year listed usually refers to the entireperiod, while data from MAS refers to the financial year until June. Thisdiscrepancy may affect MAS figures for 1997 in some instances, but notsufficiently to invalidate observations of trends and relative performancebased on efficiency and financial ratios. It also allows us to compare airlineperformances.
Operating efficiency
Operating efficiency can be measured by the revex ratio, productivity, passen-ger load factor and passenger yield (Table 6.03).
Revex ratio
MAS’s average revex ratio (total operating revenue as a percentage of totaloperating expenditure) increased marginally from 100.112 before privatizationto 102.2 after privatization. This represented a marginal improvement inrelation to its competitors’ combined average but still compared poorly toSIA (111.9 per cent), Cathay Pacific (112.9 per cent) and Thai Airways (114.0per cent) after privatization. Malaysia Airlines’ own data suggests a more
Malaysia Airlines 141
significant improvement from 97.0 to 104.1. However, regardless of source,performance before and after privatization was generally below the AsiaPacific and world averages. This means that operationally, MAS wasgenerally losing money and its performance after privatization was onlymarginally better, and even then, only for the period 1994–96. This comparesunfavourably with its performance before privatization if we take intoaccount the industry downturn in 1990–93.
Productivity
Total capacity (available tonne kilometres or ATK) is measured by addingavailable passenger tonne kilometres (APTK) and available freight tonnekilometres (AFTK). MAS had the largest fleet, but the lowest output andATK for international flights, and had significantly fewer (international)passenger-kilometres (passenger-km) compared to the three other Asian air-lines. This was because, despite carrying the most passengers, MAS’s totalinternational passengers (4.7 million before and 6.5 million after privatiza-tion) was the lowest, and substantially less compared to SIA (8.1 million and11.4 million) and Cathay Pacific (7.9 million and 10.2 million), contributingthe lowest operating revenue of the four airlines here.
Data for MAS’s total employees include domestic operations, hence it isdifficult to isolate the company’s labour productivity for useful comparisonswith SIA and Cathay Pacific (which only operate international flights). None-theless, average labour productivity improved significantly after privatizationfrom 170.6 to 315.6 (’000 ATK per employee), and from 37.8 to 61.0 per centof its competitors’ combined average, in part as a result of longer workinghours after privatization. However, MAS’s labour productivity remainedlow compared to SIA and Cathay Pacific (but higher than Thai Airways after1995), although, as mentioned, this figure was likely to have been weigheddown by domestic operations.13
Passenger load factor
Passenger load factor is a measure of capacity utilization, derived by dividingpassenger traffic (revenue passenger-km, RPK) by passenger capacity (avail-able seat kilometres, ASK). Improvements in MAS’s average passenger loadfactor for international flights were negligible (from 68.4 to 68.7 per cent) andconsistent with the fairly constant international average of 67.6 per centfor 1991–97. MAS’s average passenger load factor (as a percentage of itscompetitors) decreased after privatization from 99.0 to 96.9 per cent. Itspassenger load factor was partly a reflection of the industry average and thecompany’s periodic fleet expansion programmes. However, passenger loadfactor showed little improvement after privatization, and was higher on averagefor domestic flights, most notably from 1994, indicating excess capacity oninternational flights following the company’s international fleet expansion.
142 Malaysia Airlines
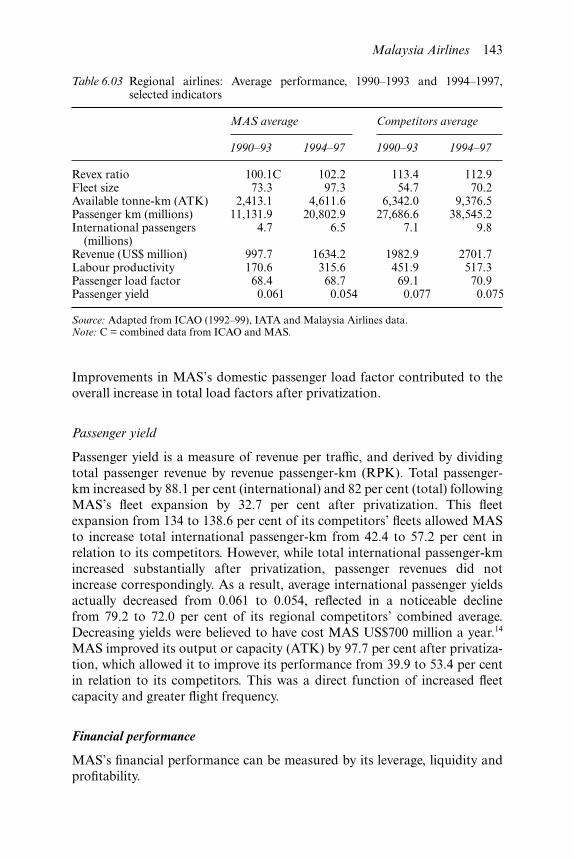
Improvements in MAS’s domestic passenger load factor contributed to theoverall increase in total load factors after privatization.
Passenger yield
Passenger yield is a measure of revenue per traffic, and derived by dividingtotal passenger revenue by revenue passenger-km (RPK). Total passenger-km increased by 88.1 per cent (international) and 82 per cent (total) followingMAS’s fleet expansion by 32.7 per cent after privatization. This fleetexpansion from 134 to 138.6 per cent of its competitors’ fleets allowed MASto increase total international passenger-km from 42.4 to 57.2 per cent inrelation to its competitors. However, while total international passenger-kmincreased substantially after privatization, passenger revenues did notincrease correspondingly. As a result, average international passenger yieldsactually decreased from 0.061 to 0.054, reflected in a noticeable declinefrom 79.2 to 72.0 per cent of its regional competitors’ combined average.Decreasing yields were believed to have cost MAS US$700 million a year.14
MAS improved its output or capacity (ATK) by 97.7 per cent after privatiza-tion, which allowed it to improve its performance from 39.9 to 53.4 per centin relation to its competitors. This was a direct function of increased fleetcapacity and greater flight frequency.
Financial performance
MAS’s financial performance can be measured by its leverage, liquidity andprofitability.
Table 6.03 Regional airlines: Average performance, 1990–1993 and 1994–1997,selected indicators
MAS average Competitors average
1990–93 1994–97 1990–93 1994–97
Revex ratio 100.1C 102.2 113.4 112.9Fleet size 73.3 97.3 54.7 70.2Available tonne-km (ATK) 2,413.1 4,611.6 6,342.0 9,376.5Passenger km (millions) 11,131.9 20,802.9 27,686.6 38,545.2International passengers
(millions)4.7 6.5 7.1 9.8
Revenue (US$ million) 997.7 1634.2 1982.9 2701.7Labour productivity 170.6 315.6 451.9 517.3Passenger load factor 68.4 68.7 69.1 70.9Passenger yield 0.061 0.054 0.077 0.075
Source: Adapted from ICAO (1992–99), IATA and Malaysia Airlines data.Note: C = combined data from ICAO and MAS.
Malaysia Airlines 143

Leverage
MAS’s poor financial performance was partly due to operational problems,largely the result of the substantial debt and interest payments incurred fromits fleet expansion. Long-term debt (LTD) increased significantly in 1993,1994 and 1998 following new aircraft purchases (Malaysia Airlines 1994). Asa result, MAS’s debt and debt–equity ratios increased noticeably after 1993indicating a serious debt problem. MAS’s leverage increased, as can be seenin its average debt ratio,15 which increased from 0.49 to 0.71. As a result, theaverage debt–equity ratio16 increased from 1.02 to 2.50 after privatization(Table 6.04).
Interest also grew in the same period, especially after 1997, with operatingprofit and cash increasingly unable to cover interest payments, as illustratedin the decreasing interest cover and cash–interest ratios. Although the averageinterest cover17 improved marginally from −0.09 to −0.07, operating profitand cash were generally insufficient to cover interest payments in 1991–97.The high average cash–interest ratio of 4.02 before privatization was largelydue to a RM337 million profit from the sale of aircraft in 1993. Nonetheless,the average cash–interest ratio of 0.60 after privatization indicates that theairline was having problems meeting interest payments. Interest cover wasnever good to begin with and steadily deteriorated after 1994. Similarly, itscurrent assets–interest ratio declined noticeably in the same period, indicatingthe company had problems meeting interest payments (Table 6.04).
Liquidity
Average liquidity (current ratio) was poor throughout the period and actuallydeclined from 0.59 to 0.54 after privatization, consistent with the decliningtrend from 1993. Net cash flow from operating activities (including aircraftsales) minus interest payments improved after privatization. This is evenmore true after we remove revenue from the sale of aircraft, which reveals anegative cash flow after interest payments for 1991 and 1993 (Table 6.05).
Profitability
Profitability is determined by the airline’s ability to generate unit revenueshigher than unit costs. Low unit costs are no guarantee of profit if an airlineis unable to even generate the low unit revenues necessary to cover such costs.MAS’s operating profit as a percentage of operating revenue was belowthe international and regional average, and was very poor compared to SIA,Cathay Pacific and Thai Airways. Except for 1994, this figure deterioratedsteadily until 2000. Average operating profit as a percentage of operatingrevenue declined from −0.07 to −0.40 after privatization, although the latterfigure included the whole of 1997 (i.e. the start of the Asian financial crisis).However, while this distorts the picture before and after privatization, MAS’s
144 Malaysia Airlines
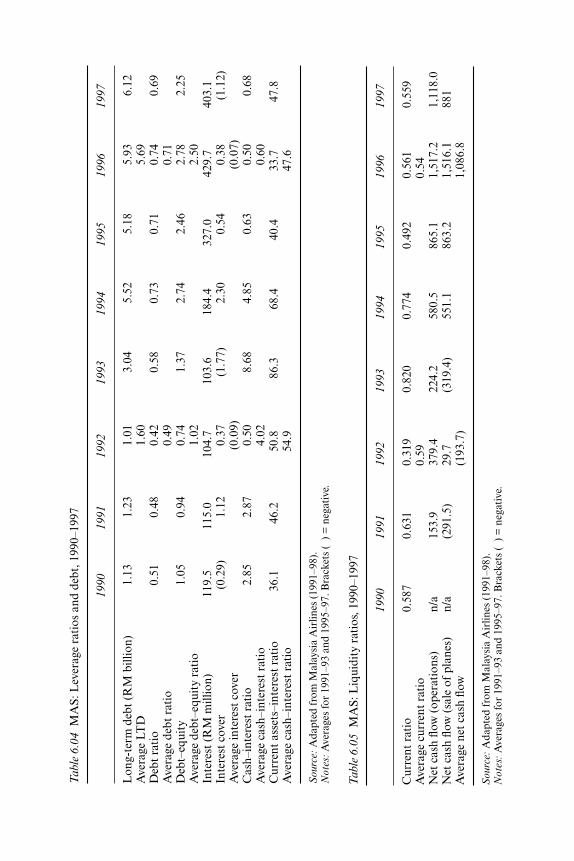
Tab
le 6
.04
MA
S: L
ever
age
rati
os a
nd d
ebt,
199
0–19
97
1990
1991
1992
1993
1994
1995
1996
1997
Lon
g-te
rm d
ebt
(RM
bill
ion)
1.13
1.23
1.01
3.04
5.52
5.18
5.93
6.12
Ave
rage
LT
D1.
605.
69D
ebt
rati
o0.
510.
480.
420.
580.
730.
710.
740.
69A
vera
ge d
ebt
rati
o0.
490.
71D
ebt–
equi
ty1.
050.
940.
741.
372.
742.
462.
782.
25A
vera
ge d
ebt–
equi
ty r
atio
1.02
2.50
Inte
rest
(R
M m
illio
n)11
9.5
115.
010
4.7
103.
618
4.4
327.
042
9.7
403.
1In
tere
st c
over
(0.2
9)1.
120.
37(1
.77)
2.30
0.54
0.38
(1.1
2)A
vera
ge in
tere
st c
over
(0.0
9)(0
.07)
Cas
h–in
tere
st r
atio
2.85
2.87
0.50
8.68
4.85
0.63
0.50
0.68
Ave
rage
cas
h–in
tere
st r
atio
4.02
0.60
Cur
rent
ass
ets–
inte
rest
rat
io36
.146
.250
.886
.368
.440
.433
.747
.8A
vera
ge c
ash–
inte
rest
rat
io54
.947
.6
Sou
rce:
Ada
pted
fro
m M
alay
sia
Air
lines
(19
91–9
8).
Not
es:
Ave
rage
s fo
r 19
91–9
3 an
d 19
95–9
7. B
rack
ets
()
= n
egat
ive.
Tab
le 6
.05
MA
S: L
iqui
dity
rat
ios,
199
0–19
97
1990
1991
1992
1993
1994
1995
1996
1997
Cur
rent
rat
io0.
587
0.63
10.
319
0.82
00.
774
0.49
20.
561
0.55
9A
vera
ge c
urre
nt r
atio
0.59
0.54
Net
cas
h fl
ow (
oper
atio
ns)
n/a
153.
937
9.4
224.
258
0.5
865.
11,
517.
21,
118.
0N
et c
ash
flow
(sa
le o
f pl
anes
)n/
a(2
91.5
)29
.7(3
19.4
)55
1.1
863.
21,
516.
188
1A
vera
ge n
et c
ash
flow
(193
.7)
1,08
6.8
Sou
rce:
Ada
pted
fro
m M
alay
sia
Air
lines
(19
91–9
8).
Not
es:
Ave
rage
s fo
r 19
91–9
3 an
d 19
95–9
7. B
rack
ets
()
= n
egat
ive.
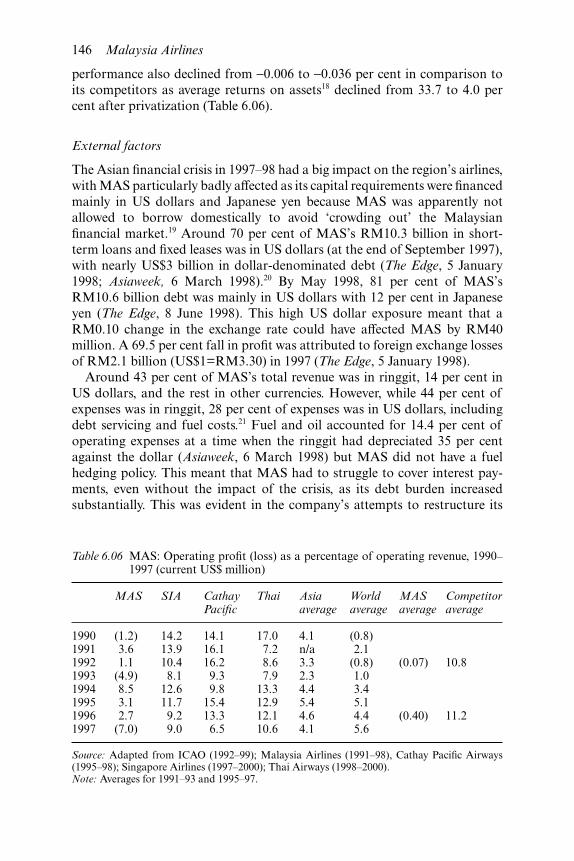
performance also declined from −0.006 to −0.036 per cent in comparison toits competitors as average returns on assets18 declined from 33.7 to 4.0 percent after privatization (Table 6.06).
External factors
The Asian financial crisis in 1997–98 had a big impact on the region’s airlines,with MAS particularly badly affected as its capital requirements were financedmainly in US dollars and Japanese yen because MAS was apparently notallowed to borrow domestically to avoid ‘crowding out’ the Malaysianfinancial market.19 Around 70 per cent of MAS’s RM10.3 billion in short-term loans and fixed leases was in US dollars (at the end of September 1997),with nearly US$3 billion in dollar-denominated debt (The Edge, 5 January1998; Asiaweek, 6 March 1998).20 By May 1998, 81 per cent of MAS’sRM10.6 billion debt was mainly in US dollars with 12 per cent in Japaneseyen (The Edge, 8 June 1998). This high US dollar exposure meant that aRM0.10 change in the exchange rate could have affected MAS by RM40million. A 69.5 per cent fall in profit was attributed to foreign exchange lossesof RM2.1 billion (US$1=RM3.30) in 1997 (The Edge, 5 January 1998).
Around 43 per cent of MAS’s total revenue was in ringgit, 14 per cent inUS dollars, and the rest in other currencies. However, while 44 per cent ofexpenses was in ringgit, 28 per cent of expenses was in US dollars, includingdebt servicing and fuel costs.21 Fuel and oil accounted for 14.4 per cent ofoperating expenses at a time when the ringgit had depreciated 35 per centagainst the dollar (Asiaweek, 6 March 1998) but MAS did not have a fuelhedging policy. This meant that MAS had to struggle to cover interest pay-ments, even without the impact of the crisis, as its debt burden increasedsubstantially. This was evident in the company’s attempts to restructure its
Table 6.06 MAS: Operating profit (loss) as a percentage of operating revenue, 1990–1997 (current US$ million)
MAS SIA CathayPacific
Thai Asiaaverage
Worldaverage
MASaverage
Competitoraverage
1990 (1.2) 14.2 14.1 17.0 4.1 (0.8)1991 3.6 13.9 16.1 7.2 n/a 2.11992 1.1 10.4 16.2 8.6 3.3 (0.8) (0.07) 10.81993 (4.9) 8.1 9.3 7.9 2.3 1.01994 8.5 12.6 9.8 13.3 4.4 3.41995 3.1 11.7 15.4 12.9 5.4 5.11996 2.7 9.2 13.3 12.1 4.6 4.4 (0.40) 11.21997 (7.0) 9.0 6.5 10.6 4.1 5.6
Source: Adapted from ICAO (1992–99); Malaysia Airlines (1991–98), Cathay Pacific Airways(1995–98); Singapore Airlines (1997–2000); Thai Airways (1998–2000).Note: Averages for 1991–93 and 1995–97.
146 Malaysia Airlines

debt as early as March 1997 (at least six months before the Asian financialcrisis).
MAS was thus severely affected by the 1997 crisis, with the ringgit’sdepreciation requiring more capital injection to meet its loan obligations andworking capital. But while the industry and its competitors began recoveringafter 1998, MAS’s performance deteriorated badly until its renationalizationin 2000. The recovery of Thai Airways, despite the baht’s depreciation,suggests that there were other problems which affected MAS’s performance.In July 1997, MAS was reported to have finalized plans to raise RM3.1billion to reduce its RM6.1 billion in company loans (at US$1 = RM2.50).This was abandoned following the currency depreciation and then pegging ofthe ringgit (at US$1 = RM3.80) (New Straits Times, 22 February 2000).However, with insufficient cash flow, MAS would have been unable to surviveits over-borrowing even without the impact of the 1997–98 crisis.22
Problems
The data on MAS shows that its operational performance did not improvesignificantly after privatization while its financial position deteriorated con-siderably. This can be explained by two types of government failure. Ex antefailure was evident in the choice of owner, purchase structure (which createdan unsustainable debt burden), and an essentially unchanged state–businessrelationship, all of which undermined incentives. MAS also inherited con-ditions and problems which had existed before privatization, including theneed to service unprofitable domestic routes and previous managementinvestment decisions. However, this does not explain why the governmentfailed to correct these problems when they became known. Despite a continu-ing representation on the board, and significant powers through its ‘goldenshare’, the government failed to monitor performance or intervene eventhough it was aware of problems, including mismanagement, early on. Thisex post failure to correct earlier mistakes was arguably a more importantfactor in MAS’s poor performance as more timely intervention could havelimited financial losses. This suggests that the government’s ability to inter-vene was very likely constrained by political factors, in part due to the natureof patron–client relationships, in particular, the owner’s close associationwith the Finance Minister,23 as well as the national importance of the airline.Both these factors created a moral hazard, where the government wasunlikely to allow the airline to fail, but was also unable to intervene earlier toenforce discipline or replace the owner.
Ex ante failure
There were three aspects of ex ante failure: poor selection, poor purchasestructure and the failure to account for the airline’s inherited problems. Thechoice of owner necessitated the privatization be financed entirely by loans,
Malaysia Airlines 147

and also affected the quality of management. The purchase structure in turnundermined incentives for efficient management by creating a huge debtburden. MAS also inherited problems, including previous managementdecisions, which further affected its performance and the new owner’s abilityto finance the airline.
Selection and purchase structure
The new owner had neither the financial capacity nor the managerialexperience. Tajudin was a trained accountant and former merchant banker24
who had emerged as a major entrepreneur after acquiring a controlling stakein publicly listed Technology Resources Industries Bhd (TRI, formerly RoxyElectric Industries) in June 1990. He had no experience running an airline,although there is some indication of interest. Tajudin was reported to haveproposed a second airline to the government in 1991, and MHS, a listedhelicopter and air services company, purchased a 33.3 per cent stake inNetherlands-based Schreiner Aviation and 24.9 per cent of World Airways in1993 reportedly to compete with MAS (The Edge, 17 July 1995). Between1990 and 1993, TRI acquired MHS which later changed its name to Naluri.However, Tajudin’s earlier corporate success was attributed to state patron-age rather than business acumen, and the development of TRI into a Malayconglomerate was apparently the result of ‘changes in ownership, rather thanthrough accumulation and expansion of a company’s productive investmentactivities’ (Gomez and Jomo 1997).
MHS’s fixed assets were equivalent to the cost of two Boeing 737s, butit was expected to take over an airline with a fleet of ninety-four planes(including fifty-two Boeing 737s). This affected the purchase of MAS whichwas based entirely on RM1.79 billion in loans (the largest in the country),without a clear ‘take out’ plan other than to wait for MAS shares – pledged ascollateral – to appreciate. This was as much a reflection of Tajudin’s limitedfinancial capacity as it was of his political influence to secure loans. However,the poor purchase structure created an unviable debt burden, which sub-sequently affected the owner’s ability to continue financing operations. It wasalso based on flawed project evaluations (with over-optimistic estimates) andeasy credit from banks (Far Eastern Economic Review, 25 January 2001).Interest repayments, estimated at RM144–RM179 million a year (based oninterest rates of 8–10 per cent) would have created disincentives to improveefficiency given the minimal likelihood of the owner recovering capital costs.
The financial problems of Tajudin’s other publicly listed companies –Naluri (which owned MAS) and TRI – further affected his ability to financeMAS, with the sale of MAS seen as necessary to pay off Naluri’s RM890million debt under the government’s Corporate Debt Restructuring Com-mittee (CDRC) scheme (Business Times, 27 June 2000). (Tajudin reportedlywanted to sell his stake in MAS as early as 1997 [The Edge, 17 March 1997].)Naluri was also directly involved in the failed Air Maldives (a joint venture
148 Malaysia Airlines
with the Maldives government in 1994). Tajudin was accused of acting in badfaith by pushing the commercially unviable London route, blamed forNaluri’s failure to provide finance and threatened with legal action (FarEastern Economic Review, 7 December 2000; New Straits Times, 15 August2000).
The owner’s airline inexperience was evident in the lack of yield manage-ment, untimely fleet expansion and reports of financial impropriety. Theseare discussed in detail below. However, as these ex ante problems could havetheoretically been corrected, the quality of the government’s ex post inter-vention becomes a more important determinant of successful privatization,particularly in the absence of more suitable candidates (i.e. with at leastTajudin’s limited financial capacity, a better understanding of the airlineindustry, and superior management skills and connections to run the industrybetter).
Inherited problems
The new owner inherited several problems with the airline: an unprofitabledomestic sector, poor international routes and previous managementdecisions. As the country’s national carrier, MAS was obliged to continueflying unprofitable domestic routes on government-set fares as part of itsnational service. MAS’s domestic flights were more expensive per kilometredue to the shorter stages (distances) and contributed less revenue despitegreater passenger numbers. Revenue per passenger was RM93 (domestic) andRM435.40 (international) in 1990 and RM118.90 (domestic) and RM656.90(international) in 1998 (Malaysia Airlines 1998). Estimated losses from thedomestic sector ranged between RM7 million and RM360 million a year (TheStar, 11 August 1994; New Straits Times, 28 June 2000), but MAS was notallowed to raise its fares, partly due to pressure from politicians from the eastMalaysian states of Sabah and Sarawak.
The domestic sector was unprofitable due to the government requirementfor relatively frequent and cheap flights, with a high proportion of employeesstaffing counters in remote airports servicing local destinations, and a mis-matched fleet which kept aircraft utilization down and imposed heavydemands on maintenance, spare parts and training (Far Eastern EconomicReview, 8 July 1999; also see Malaysian Business, 1 July 1999). Losses werecompounded by a high fuel bill (due to the high number of domestic flightsand short sector lengths) which dragged down profits (New Straits Times,17 March 1994). The continued operation of the domestic sector necessitatedsome form of subsidy rather than relying on cross-subsidies from MAS’sinternational operations as this would only undermine the airline’s com-petitiveness. The government subsequently chose to separate domestic routesfrom MAS’s main operations, but only after its renationalization.
Historically, MAS was also disadvantaged by limited international routes,with many focused in areas of high Malaysian traffic prior to privatization
Malaysia Airlines 149

(e.g. London, Hong Kong, Madras). Route expansion only occurred in thelate 1980s but was hampered by a lack of interest in and scepticism aboutthe viability of the new Kuala Lumpur International Airport (KLIA) as ahub versus Bangkok and Singapore (Paribas Capital Markets 1994; TheEdge, 12 November 2000). The previous management also failed to enter intostrategic alliances to cope with growing international competition (BusinessTimes, 29 November 2000). Furthermore, air treaties and new airline routesare negotiated by governments, often for non-commercial reasons, and trafficrights were not under Tajudin’s direct control (Asiaweek, 6 March 1998;The Edge, 2 January 2001). MAS also suffered big losses from several inter-national routes (e.g. Mexico, Johannesburg, Vancouver)25 which were largelyinitiated by the Prime Minister and maintained for diplomatic reasons. Theseroutes were subsequently suspended (The Edge, 7 August 2000).
MAS’s inefficiency was partly related to overcapacity (and fleet under-utilization) following major fleet expansions in 1990–94 and 1995–96, whichpreceded industry downturns. It is unclear whether the major fleet expansionprogramme in 1995 was initiated by Tajudin given that MAS was alreadyengaged in the expansion of its fleet to around 100 planes in a move whichwas described as aggressive, ambitious, but untimely (at a time of intenseindustry competition and fare cutting), and far outpacing demand foradditional capacity (Paribas Capital Markets 1994; Asian Wall Street Jour-nal, 25 May 1995). MAS made firm commitments in 1990–91 to purchasenine Boeing 747–400 (for delivery in 1991–97), twenty-six Boeing 737–400/500 (1992–95) and ten Airbus A330 (1994–96), with options for seven Boeing747–400 (1995–99), sixteen Boeing 737–400/500 (1995–98) and six AirbusA330 (1997–98) (Malaysia Airlines 1991). On 27 March 1991, MAS signed anagreement with Boeing to purchase six Boeing 747–400 aircraft, and in 1992,confirmed orders for seventy-two aircraft in line with its fleet modernizationand expansion programme (Malaysia Airlines 1992a).
In 1992, MAS took delivery of twenty-two planes26 for approximatelyRM2 billion. It also signed an order on 14 May 1992 for seventeen Boeing737–400s (for 1993–95 delivery) for RM1.6 billion. In 1993, twenty-seven newplanes were added,27 with delivery expected of another eleven Boeing 737–400/500 (in 1994–96) and two Boeing 747–400 (in 1995–97), and upgradesto the Airbus A330 (by 1995/96), with efficiency and productivity in fleetutilization expected to improve operating costs (Malaysia Airlines 1994). Theseventy-two aircraft were financed with a RM1.75 billion rights issue (on5 August 1992) and a US$120 million loan as part of MAS’s fleet renewalprogramme which was to run to 1998 (The Star, 10 March 1993). By themanagement’s own admission, the high gearing required for fleet expansion‘could constrain and erode profitability due to high interests’ (Malaysia Air-lines 1992b) and delivery of the sixteen aircraft was expected to jeopardizeprofitability in the shorter term (TA Securities 1993; New Straits Times, 17March 1994).
The evidence thus suggests that MAS was already in the middle of a hugefleet renewal programme, and may have committed itself in 1992 to increase
150 Malaysia Airlines
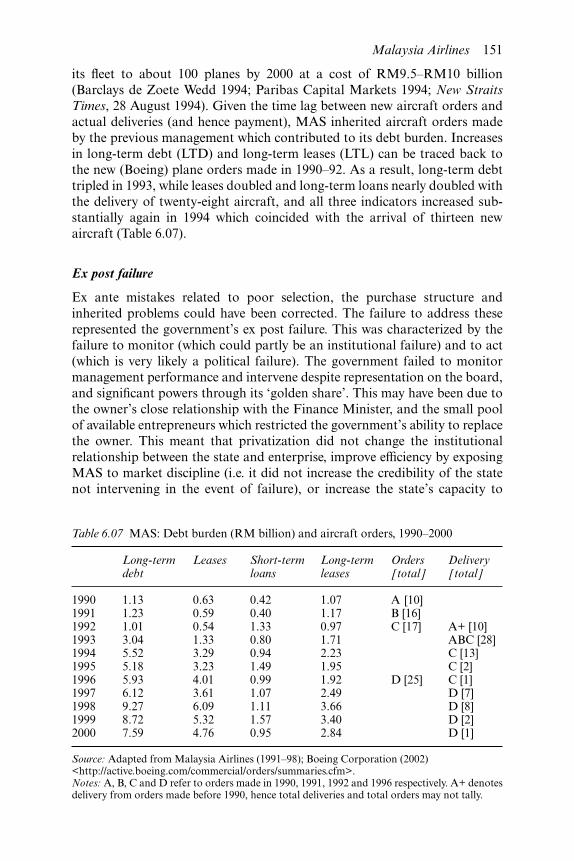
its fleet to about 100 planes by 2000 at a cost of RM9.5–RM10 billion(Barclays de Zoete Wedd 1994; Paribas Capital Markets 1994; New StraitsTimes, 28 August 1994). Given the time lag between new aircraft orders andactual deliveries (and hence payment), MAS inherited aircraft orders madeby the previous management which contributed to its debt burden. Increasesin long-term debt (LTD) and long-term leases (LTL) can be traced back tothe new (Boeing) plane orders made in 1990–92. As a result, long-term debttripled in 1993, while leases doubled and long-term loans nearly doubled withthe delivery of twenty-eight aircraft, and all three indicators increased sub-stantially again in 1994 which coincided with the arrival of thirteen newaircraft (Table 6.07).
Ex post failure
Ex ante mistakes related to poor selection, the purchase structure andinherited problems could have been corrected. The failure to address theserepresented the government’s ex post failure. This was characterized by thefailure to monitor (which could partly be an institutional failure) and to act(which is very likely a political failure). The government failed to monitormanagement performance and intervene despite representation on the board,and significant powers through its ‘golden share’. This may have been due tothe owner’s close relationship with the Finance Minister, and the small poolof available entrepreneurs which restricted the government’s ability to replacethe owner. This meant that privatization did not change the institutionalrelationship between the state and enterprise, improve efficiency by exposingMAS to market discipline (i.e. it did not increase the credibility of the statenot intervening in the event of failure), or increase the state’s capacity to
Table 6.07 MAS: Debt burden (RM billion) and aircraft orders, 1990–2000
Long-termdebt
Leases Short-termloans
Long-termleases
Orders[total]
Delivery[total]
1990 1.13 0.63 0.42 1.07 A [10]1991 1.23 0.59 0.40 1.17 B [16]1992 1.01 0.54 1.33 0.97 C [17] A+ [10]1993 3.04 1.33 0.80 1.71 ABC [28]1994 5.52 3.29 0.94 2.23 C [13]1995 5.18 3.23 1.49 1.95 C [2]1996 5.93 4.01 0.99 1.92 D [25] C [1]1997 6.12 3.61 1.07 2.49 D [7]1998 9.27 6.09 1.11 3.66 D [8]1999 8.72 5.32 1.57 3.40 D [2]2000 7.59 4.76 0.95 2.84 D [1]
Source: Adapted from Malaysia Airlines (1991–98); Boeing Corporation (2002)<http://active.boeing.com/commercial/orders/summaries.cfm>.Notes: A, B, C and D refer to orders made in 1990, 1991, 1992 and 1996 respectively. A+ denotesdelivery from orders made before 1990, hence total deliveries and total orders may not tally.
Malaysia Airlines 151
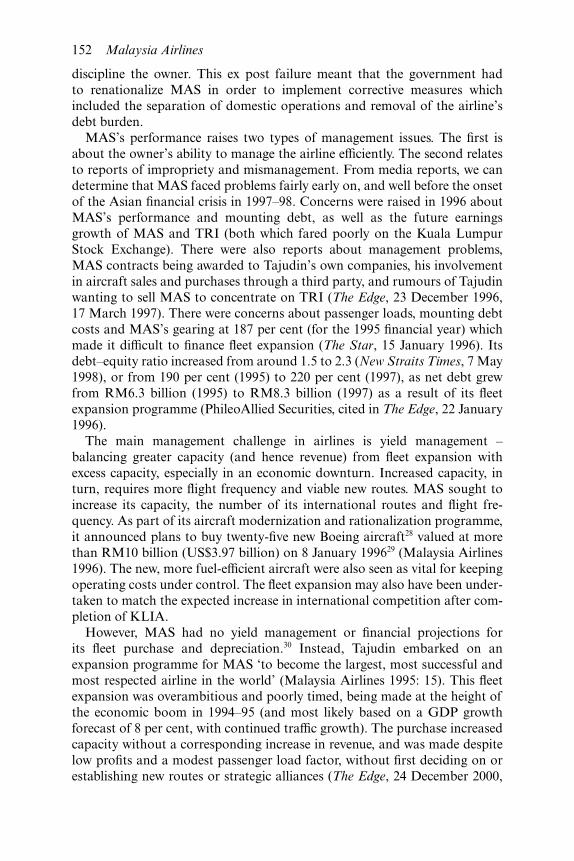
discipline the owner. This ex post failure meant that the government hadto renationalize MAS in order to implement corrective measures whichincluded the separation of domestic operations and removal of the airline’sdebt burden.
MAS’s performance raises two types of management issues. The first isabout the owner’s ability to manage the airline efficiently. The second relatesto reports of impropriety and mismanagement. From media reports, we candetermine that MAS faced problems fairly early on, and well before the onsetof the Asian financial crisis in 1997–98. Concerns were raised in 1996 aboutMAS’s performance and mounting debt, as well as the future earningsgrowth of MAS and TRI (both which fared poorly on the Kuala LumpurStock Exchange). There were also reports about management problems,MAS contracts being awarded to Tajudin’s own companies, his involvementin aircraft sales and purchases through a third party, and rumours of Tajudinwanting to sell MAS to concentrate on TRI (The Edge, 23 December 1996,17 March 1997). There were concerns about passenger loads, mounting debtcosts and MAS’s gearing at 187 per cent (for the 1995 financial year) whichmade it difficult to finance fleet expansion (The Star, 15 January 1996). Itsdebt–equity ratio increased from around 1.5 to 2.3 (New Straits Times, 7 May1998), or from 190 per cent (1995) to 220 per cent (1997), as net debt grewfrom RM6.3 billion (1995) to RM8.3 billion (1997) as a result of its fleetexpansion programme (PhileoAllied Securities, cited in The Edge, 22 January1996).
The main management challenge in airlines is yield management –balancing greater capacity (and hence revenue) from fleet expansion withexcess capacity, especially in an economic downturn. Increased capacity, inturn, requires more flight frequency and viable new routes. MAS sought toincrease its capacity, the number of its international routes and flight fre-quency. As part of its aircraft modernization and rationalization programme,it announced plans to buy twenty-five new Boeing aircraft28 valued at morethan RM10 billion (US$3.97 billion) on 8 January 199629 (Malaysia Airlines1996). The new, more fuel-efficient aircraft were also seen as vital for keepingoperating costs under control. The fleet expansion may also have been under-taken to match the expected increase in international competition after com-pletion of KLIA.
However, MAS had no yield management or financial projections forits fleet purchase and depreciation.30 Instead, Tajudin embarked on anexpansion programme for MAS ‘to become the largest, most successful andmost respected airline in the world’ (Malaysia Airlines 1995: 15). This fleetexpansion was overambitious and poorly timed, being made at the height ofthe economic boom in 1994–95 (and most likely based on a GDP growthforecast of 8 per cent, with continued traffic growth). The purchase increasedcapacity without a corresponding increase in revenue, and was made despitelow profits and a modest passenger load factor, without first deciding on orestablishing new routes or strategic alliances (The Edge, 24 December 2000,
152 Malaysia Airlines

12 November 2000). MAS’s routes were limited in comparison to its directcompetitors, and it remained outside the world’s airline alliances includingthe 15-member Star Alliance, and its main competitor, Oneworld. Thedecision to expand the fleet was also questionable as MAS was in the middleof a (less ambitious) fleet modernization programme, having recently takendelivery of twenty-seven new-generation, fuel-efficient aircraft, which in-cluded twenty-one Boeing 737–400/500 and six Boeing 747–400, with furtherdelivery of another eleven Boeing 737–400/500 (in 1994–96), two Boeing 747–400 (in 1995 and December 1997), and upgrades to the Airbus A330 (by1995–96) to make its fleet the youngest in the region and possibly the world(Malaysia Airlines 1994).
As a result, although the increases in capacity and flights improved someperformance indicators, financial performance deteriorated with decreasingyields (due to inefficient yield management, e.g. the poor choice of routes)and a growing debt burden. The increased debt burden and interest repay-ments led to over-gearing and liquidity problems with MAS unable tosufficiently cover its interest payments given its low operating revenue. Thefleet expansion was thus a serious management mistake, undertaken withoutfirst establishing new routes and when profits were insufficient to justify this,resulting in low ATK and passenger load factors, indicating both under-utilization and overcapacity. However, such expansion is not atypical in theairline industry and market pressures from SIA and Cathay Pacific may haveprompted MAS to upgrade and expand its fleet to remain competitive.
Tajudin also embarked on short-term cost-cutting measures at MAS whichimproved some productivity indicators but resulted in the deterioration ofservice standards and put the airline at a disadvantage in maintaining andimproving long-term competitiveness (The Edge, 24 December 2000). Insteadof implementing a fuel hedging policy, MAS chose to cut costs through a lowfuel policy (denied by MAS), which violated international safety standards.This came to light following a plane crash in Sabah and investigations in theUK after an MAS aircraft’s emergency landing due to low fuel reserves(The Edge, 24 December 2000). Tajudin’s management style alienated anddemoralized staff, causing considerable dislocation and leading to some 80pilots leaving for other airlines31 (The Edge, 12 November 2000). MeanwhileMAS continued to be overstaffed, with inefficiency and low productivity, andhigher than average operational costs (The Sun, 14 June 2001; The Edge 2 July2001, 10 December 2001).
Finally, Tajudin created ‘viable profit centres’, including MAS Catering(April 1995) and MAS Cargo (April 1996). In theory, these profit centres weremeant to be more focused and hence more profitable by increasing businessand revenue, despite additional costs. However, management of the variousdivisions was unfocused and territorial.32 While MAS Cargo revenuesincreased from RM580 million (1996) to RM660.6 million (1997) (withRM8.1 million in profit), this was on the back of a record 44.6 per centgrowth of cargo and air traffic in 1996 (Malaysia Airlines 1996, 1997).
Malaysia Airlines 153

Furthermore, MAS Cargo had seen steady increases in revenue beforeprivatization, including a 42.5 per cent increase to RM376.0 million (1991)and a 23.6 per cent increase to RM464.8 million (1992) (Malaysia Airlines1992a). Instead, aggressive expansion left the cargo and catering divisionsprofitless, with the effects felt after 1997 when MAS Cargo recorded its secondstraight year of losses of RM123.9 million on 30 September 1999 (Asian WallStreet Journal, 27 July 2000; The Edge, 21 February 2000). MAS Cateringalso started losing money, with pre-tax profit falling from RM19.6 million(1996) to RM13.1 million (1997) despite meal production increasing from18,000 meals a day in 1992 to 28,000 (Malaysia Airlines 1992a, 1996, 1997).
Both divisions became subjects of police investigations from 9 January2002 following an internal audit by the new management. A police report waslodged against Tajudin, Wan Aishah Wan Hamid (a former MAS director)and MAS Cargo vice-president Ralph Gotz for breaches of the CompaniesAct in failing to disclose their interests in related-party transactions. Investi-gations centred on management irregularities and the misappropriation offunds at MAS Cargo; business arrangements between MAS and a German-based cargo handler controlled by Tajudin; and contracts between MAS andAdvanced Cargo Logistic GmbH (60 per cent owned by Naluri) to develop itsEuropean cargo hub33 (New Straits Times, 25 February 2002). These con-tracts were believed not to have favoured MAS, resulting in MAS scalingdown its commitments to minimize the adverse financial impact after itsrenationalization34 (Business Times, 19 February 2002; New Straits Times,25 February 2002).
MAS subsequently filed a civil claim against Tajudin and two others forRM174.62 million following losses at its cargo operations in Germany from1999 to 2001, alleging breach of duties in entering into various projects andbusinesses with third parties in total disregard to the interest of the company.The airline also claimed that Tajudin (with his co-defendants) had conspiredto cause loss and damage to the company, and sought substantial damagesand an account of all secret profits/benefits. MAS also filed a suit againstNaluri, MAS Golden Holidays Sdn Bhd (MGH) and MAS Hotels &Boutiques Sdn Bhd (MHB) for dishonest assistance in the breach of fiduciaryduties and obligations by Tajudin, and sought damages for alleged dishonestassistance and knowing receipt, damages for alleged conspiracy and damagesfor alleged unlawful interference in the business of MAS and MGH.
As was the case in the other case studies, this alleged behaviour was con-sistent with the pursuit of short-term rents rather than long-term operationalprofits from efficiency gains. In this case, it may have been due to the unpay-able debt burden which created perverse incentives for the owner, or the factthat the owner may only have been an agent of the government. Conversely, itmay have also been shaped by the preferences of domestic capital for suchrents as discussed in Chapter 3.
Privatization did not significantly alter the relationship between MAS andthe state, and did not improve monitoring or increase the credibility of the
154 Malaysia Airlines
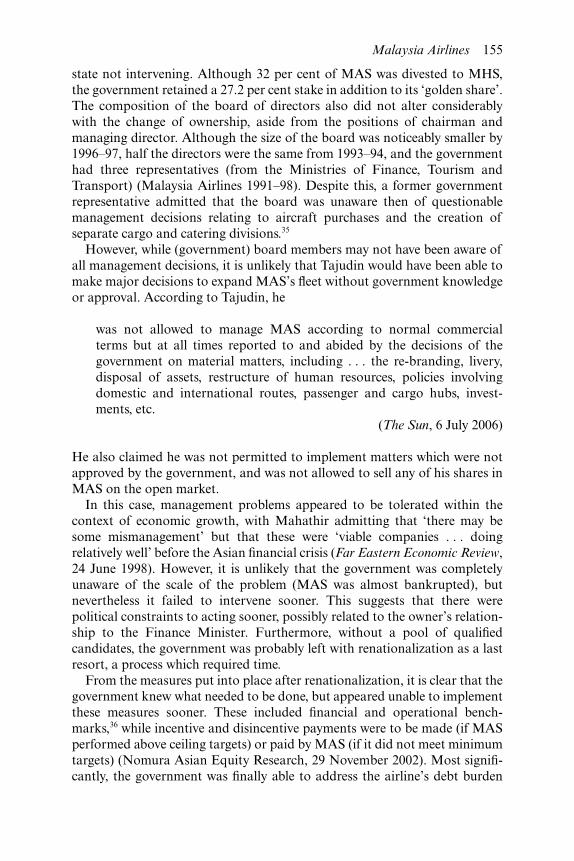
state not intervening. Although 32 per cent of MAS was divested to MHS,the government retained a 27.2 per cent stake in addition to its ‘golden share’.The composition of the board of directors also did not alter considerablywith the change of ownership, aside from the positions of chairman andmanaging director. Although the size of the board was noticeably smaller by1996–97, half the directors were the same from 1993–94, and the governmenthad three representatives (from the Ministries of Finance, Tourism andTransport) (Malaysia Airlines 1991–98). Despite this, a former governmentrepresentative admitted that the board was unaware then of questionablemanagement decisions relating to aircraft purchases and the creation ofseparate cargo and catering divisions.35
However, while (government) board members may not have been aware ofall management decisions, it is unlikely that Tajudin would have been able tomake major decisions to expand MAS’s fleet without government knowledgeor approval. According to Tajudin, he
was not allowed to manage MAS according to normal commercialterms but at all times reported to and abided by the decisions of thegovernment on material matters, including . . . the re-branding, livery,disposal of assets, restructure of human resources, policies involvingdomestic and international routes, passenger and cargo hubs, invest-ments, etc.
(The Sun, 6 July 2006)
He also claimed he was not permitted to implement matters which were notapproved by the government, and was not allowed to sell any of his shares inMAS on the open market.
In this case, management problems appeared to be tolerated within thecontext of economic growth, with Mahathir admitting that ‘there may besome mismanagement’ but that these were ‘viable companies . . . doingrelatively well’ before the Asian financial crisis (Far Eastern Economic Review,24 June 1998). However, it is unlikely that the government was completelyunaware of the scale of the problem (MAS was almost bankrupted), butnevertheless it failed to intervene sooner. This suggests that there werepolitical constraints to acting sooner, possibly related to the owner’s relation-ship to the Finance Minister. Furthermore, without a pool of qualifiedcandidates, the government was probably left with renationalization as a lastresort, a process which required time.
From the measures put into place after renationalization, it is clear that thegovernment knew what needed to be done, but appeared unable to implementthese measures sooner. These included financial and operational bench-marks,36 while incentive and disincentive payments were to be made (if MASperformed above ceiling targets) or paid by MAS (if it did not meet minimumtargets) (Nomura Asian Equity Research, 29 November 2002). Most signifi-cantly, the government was finally able to address the airline’s debt burden
Malaysia Airlines 155
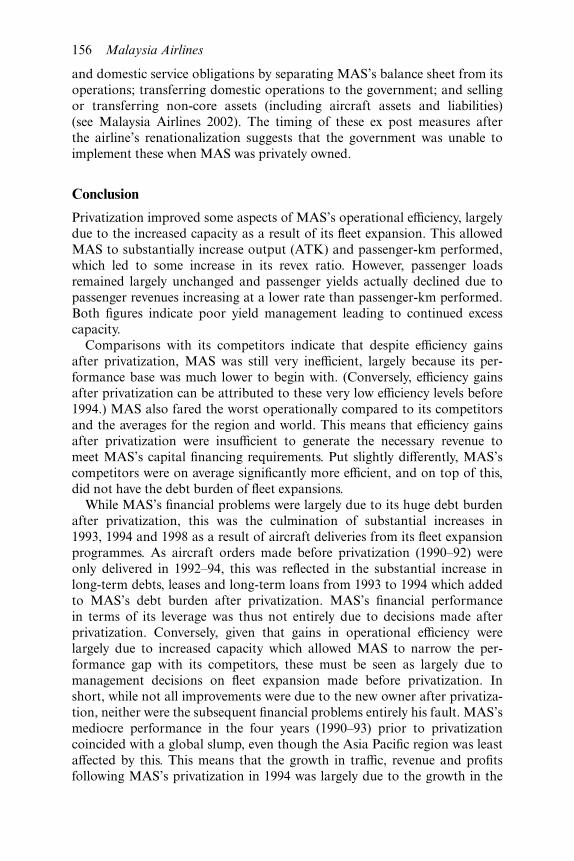
and domestic service obligations by separating MAS’s balance sheet from itsoperations; transferring domestic operations to the government; and sellingor transferring non-core assets (including aircraft assets and liabilities)(see Malaysia Airlines 2002). The timing of these ex post measures afterthe airline’s renationalization suggests that the government was unable toimplement these when MAS was privately owned.
Conclusion
Privatization improved some aspects of MAS’s operational efficiency, largelydue to the increased capacity as a result of its fleet expansion. This allowedMAS to substantially increase output (ATK) and passenger-km performed,which led to some increase in its revex ratio. However, passenger loadsremained largely unchanged and passenger yields actually declined due topassenger revenues increasing at a lower rate than passenger-km performed.Both figures indicate poor yield management leading to continued excesscapacity.
Comparisons with its competitors indicate that despite efficiency gainsafter privatization, MAS was still very inefficient, largely because its per-formance base was much lower to begin with. (Conversely, efficiency gainsafter privatization can be attributed to these very low efficiency levels before1994.) MAS also fared the worst operationally compared to its competitorsand the averages for the region and world. This means that efficiency gainsafter privatization were insufficient to generate the necessary revenue tomeet MAS’s capital financing requirements. Put slightly differently, MAS’scompetitors were on average significantly more efficient, and on top of this,did not have the debt burden of fleet expansions.
While MAS’s financial problems were largely due to its huge debt burdenafter privatization, this was the culmination of substantial increases in1993, 1994 and 1998 as a result of aircraft deliveries from its fleet expansionprogrammes. As aircraft orders made before privatization (1990–92) wereonly delivered in 1992–94, this was reflected in the substantial increase inlong-term debts, leases and long-term loans from 1993 to 1994 which addedto MAS’s debt burden after privatization. MAS’s financial performancein terms of its leverage was thus not entirely due to decisions made afterprivatization. Conversely, given that gains in operational efficiency werelargely due to increased capacity which allowed MAS to narrow the per-formance gap with its competitors, these must be seen as largely due tomanagement decisions on fleet expansion made before privatization. Inshort, while not all improvements were due to the new owner after privatiza-tion, neither were the subsequent financial problems entirely his fault. MAS’smediocre performance in the four years (1990–93) prior to privatizationcoincided with a global slump, even though the Asia Pacific region was leastaffected by this. This means that the growth in traffic, revenue and profitsfollowing MAS’s privatization in 1994 was largely due to the growth in the
156 Malaysia Airlines

overall industry, particularly the higher than average growth rates in the AsiaPacific region.
MAS’s poor performance can be attributed to a series of factors that canbe usefully classified as ex ante and ex post failures of government. Privatiza-tion was strongly motivated by political considerations related to state effortsto promote Malay entrepreneurs and possibly government attempts tocover foreign exchange losses by BNM. In either case, ex ante decisions wereconstrained by political factors (namely the nature of patron–client relation-ships), with the choice of private owner closely associated with segments ofthe political leadership, in particular the Finance Minister. This also partlyaccounted for poorly structured incentives which affected performance.Privatization was unable to finance the airline’s capital expansion programmeor improve efficiency as the owner did not have the money in the first place,and was unable to improve performance sufficiently to pay for this. This wasbecause the government failed to properly structure the airline’s purchaseto prevent the owner from being saddled with an unpayable debt burden inthe context of inherent industry problems and cycles which it did not accountfor. (On the other hand, if the owner was merely an agent or nominee ofthe government, then he would have had even fewer incentives to improveefficiency.) In addition, MAS was expected to subsidize domestic routes andwas constrained by previous management decisions. These created perverseincentives which were reflected in reports of mismanagement and financialimpropriety.
More crucially, the government failed to correct these ex ante failuresdespite being aware of the problems. The financial restructuring of MASafter its renationalization aimed to relieve the airline of its debt burden anddomestic obligations, while also introducing performance benchmarks topromote efficiency. The introduction of these measures only after MAS’srenationalization suggests that the government may have lacked the politicalcapacity to implement them earlier. This is partly because state intervention(e.g. the reallocation of property rights) is more difficult with divestiturecompared to a concession, particularly where there is a limited pool ofpotential candidates to replace the owner with. However, the state’s ex post(political) capacity to correct mistakes was also compromised by the owner’sclose association with the political leadership and the national importance ofthe airline which created a moral hazard where the government was unlikelyto allow the airline to fail, but was also unwilling to discipline the owner.Here, the government’s ex post failure to correct mistakes represented a big-ger problem than the original ex ante failure when it privatized the airline.This once again underlines the importance of the state’s political capacity tocorrect mistakes as the most important condition for successful privatization.The state’s political capacity can in turn only be determined by locating theprivatization within a country context.
Malaysia Airlines 157

7 Rents and industrial upgradingProton
The automobile industry offers strong backward linkages with key heavyindustries and manufacturing sectors, and is as such often a central part ofindustrialization strategies in developing countries. However, in order tomove beyond the basic assembly of imported vehicles, the domestic firm willneed to acquire the necessary technology to develop indigenous design andmanufacturing capabilities. This task is challenging in itself but is made evenmore difficult in the context of late industrialization where the latecomer willbe constrained by its initial inefficiency until learning takes place. Domesticfirms will also find it difficult to meet the substantial capital requirementsfor both technology acquisition and scale economies in a mature industry.It is for these reasons that countries attempting to industrialize will need tosubsidize domestic firms for learning and eventual ‘catching up’. Technologyacquisition is thus key to the development of a competitive domestic autoindustry, but this can only take place if subsidies promote learning.
As subsidies potentially dilute incentives, these must be conditional onperformance targets being met if learning and associated efficiency gains areto take place. The success of the technology acquisition process will thereforedepend on the management of any explicit or implicit subsidy programme,in particular, the state’s institutional capacity to design the appropriate incen-tive structures, and especially its political capacity to enforce conditionalities,including withdrawing subsidies if necessary. However, state support, in theform of learning rents and other subsidies, may not be enough to encouragea domestic industry given the capital requirements and risks involved,especially in the early stages, and limited entrepreneurial capacity. Domesticcapitalists may be unavailable or simply unable or unwilling to invest, inwhich case the state may have to undertake the initial investment. In this case,incentives are further diluted due to the separation of residual control (own-ership) from residual income (profits) which characterizes state-ownedenterprises (SOEs).
Proton, Malaysia’s national car project, was launched in 1983 as part of astate-led heavy industries programme to rationalize the car industry, pro-mote industrialization through backward linkages, and meet ethnicredistributive objectives. As an infant industry, Proton’s immediate challenge
was technology acquisition necessary to develop design and productioncapabilities in order to produce a Malaysian car. To facilitate this process,Proton was provided with significant learning rents in the form of tax breaksfor R&D, and tariff and import duty exemptions. Despite this, technologicalprogress was slow and the company remained uncompetitive and dependenton protection. Proton’s privatization in 1995 can thus be seen in terms ofgovernment attempts to increase efficiency by improving the technologyacquisition process. Privatization was also consistent with government effortsto promote capital accumulation and create Malay industrialists.
This raises two key issues. If technology acquisition requires an effectiverent-management strategy in this sector, then success is dependent onwhether enforcement of conditionality is easier or more difficult with privateownership. Improvements from privatization can be said to come fromchanges in the management and regulatory structure. Privatization mayprovide a more tractable management structure by reducing the owner–manager–worker chain of command, thereby improving the owner’s incen-tives (e.g. see Alchian and Demsetz 1972). It also provides an opportunity tochange the state–enterprise relationship through a more effective regulatorystructure. By creating an arm’s length relationship between the governmentand the enterprise, privatization offers the potential for more crediblesanctions and hence, a more effective regulatory structure by ensuring thatsubsidies are only temporary and contingent upon meeting performancetargets.
However, these potential benefits may not be likely where political con-siderations determine the choice of candidate, and where the national sig-nificance of the enterprise will mean the state has a continued vested interest.It is indeed very likely that these two factors will be related, with the choiceof candidate politically determined precisely because of the enterprise’simportance. Secondly, even if privatization improved the government’senforcement capacity, commercial viability would still depend on the privateowner’s financial capacity to meet and sustain the substantial capital invest-ment requirements for technology acquisition and large-scale production.This is an even more difficult task in the context of a mature industry charac-terized by low growth, overcapacity, industry consolidation and high entrybarriers.
Proton’s privatization was characterized by ex ante and ex post statefailures. While privatization may have been ‘desirable’ (in terms of industrial-ization), it was arguably not ‘feasible’ (in terms of potential profitability andattractiveness to the private sector) given the high capital costs, technologicalchallenges and industry trends. Government requirements relating to localcontent and Malay participation further affected Proton’s competitiveness.These factors would have undermined private incentives, and the case forprivatizing Proton was weak, offering only a second-best solution in terms ofaddressing long-term technological problems. One possible explanation forprivatization then is that it offered the opportunity to earn short-term profits
Proton 159

through a protected domestic market (along with long-term profits throughimproved technology and international competitiveness). Here, failure can beblamed on the government’s decision to proceed with the privatization with-out a clear understanding of the global conditions and industry challenges,including the financial resources and time required for technology acquisi-tion, and without designing a viable subsidization strategy with a clear timeframe for protection. This was compounded by earlier state failure to securetechnology transfer from Proton’s Japanese partner and ensure that the pro-ject was commercially viable. This ex ante failure on the government’s partappeared to have been due to leadership mistakes in approving the project inthe first place, and later believing it was still viable in spite of industry trends.
However, the issue is less about whether Proton was viable to begin withbut whether privatization accelerated the technology acquisition processwhich was key to developing a more competitive product to capture marketshare and facilitate economies of scale. Here, privatization was not even ableto provide a second-best outcome (e.g. in terms of Proton’s own modesttargets) because of the government’s ex post failure. The government did nothave a long-term plan for the reduction and eventual removal of tariff andimport duty exemptions to accelerate the process of technology upgrading,and there was no performance-related conditionality or attempt to with-draw rents. As discussed in Chapter 3, this has been a historical problem inMalaysia, in part related to ethnic and political considerations. In Proton’scase, the government’s disciplinary capacity was also constrained by specificaspects of patron–client relationships between the company and the politicalleadership due to the Prime Minister’s continued personal interest in thedevelopment of a flagship auto manufacturing sector in Malaysia that gavethe company national importance. This political commitment created amoral hazard and meant that privatization did not change the fundamentalweaknesses in the institutional relationship between the government andenterprise.
To complicate matters, ex ante and ex post decisions were also adverselyaffected by ethnic considerations. The desire to promote Malay participationin the auto industry undermined proper project evaluation and, later, Pro-ton’s competitiveness, most notably through its local Vendor DevelopmentProgramme (VDP) which required Proton to source components from(inefficient) Malay vendors. Proton’s inefficiency arose from insufficienteconomies of scale. This was the result of a small domestic market, limitedproduction capacity and limited exports. The inability to achieve economiesof scale was due to technology transfer problems which compromisedproduct design and production scale, as well as poor marketing and distri-bution, particularly overseas. Despite management efforts, both capacityexpansion and technology acquisition involved substantially more capitaland time than the new owner could afford, and which the government did notfully account for when it initiated the project or when it decided to privatize.
However, the timing of the decision to sell Proton back to the government
160 Proton

(when Proton’s domestic market share was declining, and with industryliberalization approaching), and the owner’s subsequent diversification intoother non-competitive sectors, suggests that the owner was unwilling toundertake the necessary capital investment and may have been attracted toProton because of the rents from car sales in a protected domestic market.This preference was consistent with the general preference of Malaysiancapital for captive rents in non-competitive sectors, as discussed in Chapter 3,and underlies the difficulties the government faced in attempting to create adynamic capitalist class. While Proton subsequently developed its own bodydesign and engine, and rationalized its local content programme and dist-ribution, this occurred only after it was renationalized. Crucially, productdesign remained poor and uncompetitive as Proton was unable to developthe necessary technology. This again illustrates the inherent technologicalchallenges in the industry, and the viability problems of the project, not tomention privatization. More critically, it underlines the importance of thestate’s disciplinary capacity in the management of necessary subsidies (inthis case, learning rents) as the most important condition for successfulprivatization.
This chapter is structured as follows. The next section will discuss thechallenges faced by the auto industry and Proton specifically. This is followedby the background to Proton’s creation, privatization and renationalization.We then evaluate the performance of Proton before and after privatization,looking at its financial performance, production capacity, export and pro-tection levels, technology acquisition, local content, and marketing and dis-tribution. The following section identifies the main problems and causes offailure, and prioritizes the main conditions necessary for successful privatiza-tion. The final section summarizes the main findings and concludes.
Challenges
Competitiveness in the auto industry is largely a function of economies ofscale and productivity. The capacity to sell vehicles also depends on finalproduct quality and marketing and distribution. The level of technology willdetermine the quality of product design and the efficiency of the productionprocess. Marketing and distribution are also important as achievingeconomies of scale requires selling cars. Here, Proton faced industry-relatedchallenges as well as challenges specific to late industrializers, along withconstrains posed by wider government objectives.
Industry characteristics and trends
The auto industry is characterized by requirements for substantial scaleeconomies and capital investment, as well as increasing concentration,overcapacity and low margins. Industry data, particularly in the 1970s (whenfeasibility studies for Malaysia’s national car project were being conducted)
Proton 161
provides some context in which to assess challenges faced by the car industry.Estimates of economies of scale in annual passenger car production rangedfrom 100,000 cars per year (1959) to 600,000 (1972), with a minimum of800,000 units for long-term viability (in the 1970s), and fairly constantreturns at 700,000–1.5 million units (Maxcy and Silvertson 1959; Rhys 1972;White 1971, all cited in Bloomfield 1978). Economies of scale for engines in1971 were around 400,000–500,000 per year, with final assembly at 200,000–300,000 units per year (Pratten 1971, cited in Bloomfield 1978). The collapseof the British auto industry in the 1990s can be traced back to the competitivedisadvantage of many UK firms by 1975 because of the failure to achieve thenecessary economies of scale (Central Policy Review Staff 1975, cited inBloomfield 1978: 85–86). The high-volume and increasingly capital-intensivenature of the industry also required high levels of capacity utilization foreconomic and profitable operation, with severe financial consequences forunderutilization of capital and production capacity.
Both scale economies and technology involve high capital costs. Earlyestimates of capital requirements in the US ranged from US$576 million (inthe 1950s) to US$1 billion (1960s) to produce 800,000 cars per year (White1971, cited in Bloomfield 1978), with marketing costs increasing from 31 to46 per cent of distribution costs by 2000 (Automotive News, 15 October2001). Companies also faced heavy expenditure for new model development(with shorter model life cycles of two to three years) and to meet morestringent environmental and safety standards. High capital requirements,overcapacity and low margins have historically necessitated industryrationalization with long-term trends towards mergers, strategic alliancesand partnerships needed to provide technical economies of scale, capitalresources for model development, more automated production, andincreased marketing efforts (Bloomfield 1978; Bando 2000). Industry ration-alization was also necessitated by low margins and declining profitability,partly the result of intense competition and overcapacity.
Overcapacity resulted in a big drop in profitability. Of the major carproducers in 1973–87, only General Motors’ net income as a percentage ofnet revenue averaged around 5 per cent, with Ford and Chrysler on occasionexceeding this. In general, the figure was below 5 per cent, with the last threecompanies registering significant, consecutive losses (Bloomfield 1991).Profits for many companies in Western Europe were small even before the oilcrisis, and only Daimler and Peugeot made substantial profits and retainedfull profitability. Several large corporations had to be bailed out (BritishLeyland) while others went bankrupt (Iso, Jensen, MG Rover), changed own-ership (Ferrari, Lamborghini, Aston Martin, Maserati) or merged (Citroën/Peugeot, DAF/Volvo). Overcapacity was expected to remain a problem untilthe end of the 1980s, possibly with as much as 25 per cent of the world’s carcapacity needing to be phased out for industry viability (Bloomfield 1978).
162 Proton
Late-comer and specific challenges
As an infant industry, Proton’s competitiveness was further constrained bytechnology transfer problems and a limited domestic market size. Economiesof scale requires exports, which in turn depend on technology (for productdesign and efficient production), marketing and distribution. The reason whyproduction scale is not large is that the product is not competitive enough tocapture a larger market share. But if it does not capture a larger market shareit will not become more competitive. Here the technology acquisition strategyof the government is critical, since scale of production cannot be vast at theoutset, and requires significant state assistance in the form of conditionalsubsidies, whether explicit or implicit, if the enterprise is to succeed. Thus,the problem of scale economies needs to be located within the context oftechnology acquisition.
In addition, Proton also had to meet government objectives to rationalizethe local automotive industry; spearhead the development of componentmanufacturing industries; provide incentives for the acquisition and upgrad-ing of technology, engineering norms and industrial skills; and promoteNew Economic Policy (NEP) restructuring objectives (by developing Malayparticipation as well as creating and sustaining employment). These were inpart shaped by the political and economic imperatives discussed in Chapter 3.Specifically, a national car project allowed the government to meet thegrowing demands of the Malay middle class by promoting backward linkageswith local component manufacture, while at the same time addressing theeconomic challenges of industrial upgrading. This meant that Proton had toupgrade its own technological capabilities as well as those of its local vendorsto ensure that government objectives were met, and local component costswere kept low.
In return, Proton was provided with learning rents in the form of tariff andexcise duty exemptions, and tax rebates for product development. Successfultechnology acquisition depends on the terms of technology transfer agreedwith the technical partner, and the firm’s ‘absorptive capacity’ (i.e. existingknowledge and competence, and the intensity of effort or commitment) (seeBell et al. 1984; Jacobsson 1993; Kim 2004). However, Proton’s technologyacquisition was affected by political considerations, namely NEP objectivesto promote Malay (and bypass domestic Chinese) capital which comprom-ised learning and efficiency. The haste of negotiations with Mitsubishi alongwith managerial constraints (inherited from the NEP) compromised technol-ogy acquisition. Proton’s competitiveness was further hampered by the needto support (inefficient) local component manufacturers through technologytransfers. Finally, Proton had no control over marketing and distribution.Domestic distribution, image and branding were handled by Edaran Oto-mobil Nasional (EON), the national distributor which was not owned byProton. This led to coordination problems between production and distribu-tion, conflicts of interest (e.g. Proton was unable to even determine accessory
Proton 163

fittings and retail prices), and price increases which profited EON at theexpense of Proton (The Edge, 12 April 1999).1 These constraints createdadditional challenges for Proton as a late comer, and subsequently alsoaffected its performance after privatization.
Background
The origins of Proton can be traced back to the government’s efforts topromote local content and greater efficiency in the 1960s through integrationof a fragmented auto industry. This aimed to reduce imports, save foreignexchange, create employment, develop strong forward and backward linkageswith the rest of the economy, transfer industrial technology, and increaseMalay automotive participation. However, despite government measures topromote local content, efficiency and greater Malay participation, the marketremained fragmented by the late 1970s, with a multiplicity of assembly plantsproducing low volumes of numerous makes and models due to the smallmarket.2 The refusal of assemblers to standardize design, material anddimensional specifications further limited economies of scale (Doner 1991).Local content was around 8–10 per cent and local component manufacturelargely involved assembly of non-proprietary items (e.g. tyres, batteries,exhaust systems, paints) or imported parts, with low levels of technology(Chee and Fong 1983; Doner 1991; Tharu 1994). Malay presence in theindustry was minimal, and mainly restricted to auto distribution and recondi-tioning, usually in the weakest firms (Doner 1991). The industry remainedlocal Chinese-dominated, import-dependent and disappointing in terms ofits contribution to industrialization. Total sales rose in 1983, but imports forthe assembly sector grew faster, while the industry’s (parts and assembly)contribution to total manufacturing output and GDP declined (Doner 1991).
By June 1978, problems in the auto sector, combined with stagnation andpoor economic performance, led to a change in government policy, fromfostering import-substitution type industries run by foreign car manufac-turers, to state-led development of a Malaysian car as key to a Malay-led,second-stage import substitution (Doner 1991). This aimed to address issuesrelated to constraints on economies of scale posed by too many assemblyplants and a small domestic market; the domination of the local autoindustry by joint ventures between Japanese car manufacturers and localChinese assemblers, to the exclusion of Malay companies; and the slowprogress of local production of auto parts (Bando 2000).
The Heavy Industries Corporation of Malaysia (HICOM) was created in1980 to undertake large-scale ventures in strategic manufactures,3 including anational car. Following unsuccessful talks with Japanese car manufacturerDaihatsu,4 Mahathir proposed the national car project to MitsubishiCorporation (MC) in October 1981 after his appointment as Prime Ministerthat year (Doner 1991). The project was approved in November 1982 and acontract was signed between HICOM and MC and its subsidiary, Mitsubishi
164 Proton

Motor Company (MMC), in May 1983. Proton was incorporated on 7 May1983 as a joint-venture company between the Malaysian government throughHICOM (70 per cent), MMC (15 per cent) and MC (15 per cent) to manu-facture, assemble and sell motor vehicles and related products, includingaccessories, spare parts and other components. Mitsubishi agreed to establishan 80,000 unit capacity plant with Proton (with US$168 million in Japaneseloans) to stamp, assemble, paint and test 1,300cc and 1,500cc engine cars(Doner 1991; Tharu 1994). The agreement covered ‘starting dates, equityshares, training of Malaysian personnel, and new design changes every twoyears, with model changes every five years’ (Doner 1991).
Production was to begin in 1986, with a capacity of 40,000 vehicles a yearand output of 5,000 vehicles in the first year, increasing annually to 120,000 ayear by the 1990s. Local content was to start at 36 per cent, with the localmanufacture of engines and transmissions planned (Doner 1991; Tharu1994). Proton launched its first car, the 1.3 litre Saga, in July 1985, almost ayear ahead of schedule, and produced 8,700 cars that year. It was exemptfrom import duties until 1991, after which it had to pay 13 per cent importduty on CKD (completely knocked down) packs (compared with 42 percent for non-national cars) and half the excise duty of non-national cars(depending on engine capacity) (see Table 7.01). This gave Proton cars a24–64 per cent price advantage over non-national cars with comparableengine sizes and allowed the company to capture 65 per cent of the passengervehicle market by 1987 and 74.2 per cent in 1993 (SalomonSmithBarney2002; The Sun, 12 June 1993). A progressive duty structure also skewedindustry volume towards the smaller engine segments dominated by Proton(Table 7.02).
Proton was converted into a public company on 22 November 1990 andpublicly listed on the Kuala Lumpur Stock Exchange (KLSE) on 26 March1992.5 On 20 October 1995, Khazanah (the Ministry of Finance’s investmentarm) sold its 32 per cent stake in HICOM, without open tender, for anestimated RM1.72 billion (at RM5.20 per share) to Mega Consolidated
Table 7.01 Malaysia: Passenger car tariffs, 1992–2003 (%)
National Non-national CKD(completely knockeddown)
Non-nationalCBU (completelybuilt up)
Import duty* 13 42 140–300Excise duty** 50% of the rate for
non-national carBased on value Based on value
Sales tax*** 10 10 10
Source: Adapted from TA Securities (1996).Notes: *Duty on imported parts; **duty on finished product; ***sales tax is calculated at 10per cent of (cost, insurance, freight + import duty charged). For import duty on non-national CBU,see Table 7.02.
Proton 165

Sdn Bhd on a ‘willing buyer willing seller basis’.6 Mega Consolidated waswholly owned by Gadek Bhd, which was in turn owned by DiversifiedResources Bhd (DRB), the main listed company of Yahaya Ahmad. With theacquisition of HICOM, both DRB and Mega Consolidated collectivelyowned 95 per cent of HICOM, and the company became DRB-HICOM.
The choice of Yahaya Ahmad was consistent with the broad features ofprivatization described in Chapter 3. He was politically well connected, beinga personal friend of Prime Minister Mahathir and Deputy Prime MinisterAnwar Ibrahim. However, he also had relevant experience, having trained asan automotive engineer in the UK, worked in the industry, and started upseveral automotive-related companies.7 In 1992, Yahaya invited Mahathir tovisit the plant of Automotive Manufacturers (a DRB subsidiary) which hadthe capacity to produce 46 different models (including Isuzu, Mitsubishi,Citroën and Tata vehicles), and offered to help Proton overcome capacityconstraints8 (Malaysian Business, 1 July 1993; The Star, 16 March 1996;Asiaweek, 11 April 1997). In June 1993, the government announced DRB’sjoint-venture with Proton through Usahasama Proton-DRB Sdn Bhd(USPD) to manufacture the Satria.
Yahaya was subsequently killed in an accident on 3 March 1997 and wasreplaced as chairman by Saleh Sulong, his business partner and DRB-HICOM’s general manager. However, Yahaya no longer played a strategicrole after the appointment of Tengku Mahaleel as Proton’s managingdirector in 1997. Following the 1997–98 Asian financial crisis, DRB-HICOMfaced financial difficulties and was unable to pay its mounting debts orfinance Proton’s expansion plans. The death of owner Yahaya also createdsome uncertainty about the future of the company. The government startedpurchasing shares in Proton as early as September 1997.9 On 29 October1998, state oil company Petronas confirmed it was considering purchasingProton and subsequently purchased 27.2 per cent of Proton from DRB-HICOM for RM7 per share in April 2000.
Table 7.02 Malaysia: Auto industry import dutystructure, 1992–2003 (%)
Categories CKD CBU
Proton 13 n/a
Non-national carsFirst 1799cc 42 1401800–1999cc 42 1702000–2499cc 60 2002500–2999cc 70 250Above 3000cc 80 300
Source: Adapted from Ministry of International Tradeand Investment, Malaysia.
166 Proton
Performance
Although Proton was privatized in March 1992 following its public listing,the government remained the controlling shareholder. Privatization heretherefore refers to the period after the sale of a controlling stake to YahayaAhmad in October 1995. Proton’s performance needs to be assessed inrelation to the problems the company faced prior to privatization. Specific-ally, privatization sought to improve efficiency and competitiveness byaddressing slow technology acquisition and diseconomies of scale (low pro-duction capacity). Success here can be gauged by Proton’s productioncapacity, export performance, protection levels, technology development andlocal content. Privatization also needed to address Proton’s marketing anddistribution as its sales performance depended on this. While Proton con-tinued to be profitable, this was due to protection, tax exemptions, rebatesand subsidies, and the company remained uncompetitive. Technology acqui-sition was slow and proved too costly for the private owner, and Proton failedto meet even its own targets for production capacity and export, continuingto rely on the domestic market through protection. Problems in marketingand distribution were similarly only addressed after the company’srenationalization, but in any case could not compensate for the lack of com-petitiveness of Proton cars.
Examination of these performance indicators will focus on the two-yearperiod immediately before (1993–94) and after privatization (1996–97) inorder to exclude the effects of the Asian financial crisis from the end of1997. As ownership and control of Proton was only transferred to Yahayain October 1995, this year will be viewed as a transition year. This briefperiod necessarily restricts analysis, especially given the time needed toimplement the necessary changes and the time lag between implementationand results. This is particularly so with technology transfer and local con-tent. Furthermore, as Proton’s financial year ends in March, the annualreports do not provide clear evidence of trends. As such, measures takenafter privatization will be examined over a longer period (for which data isavailable) through a review of the longer-term impact of changes intro-duced by Yahaya. This is to provide a more balanced assessment of post-privatization improvements while factoring in the effects of the 1997–98Asian financial crisis. Data is mainly sourced from SalomonSmithBarney(based on data provided by Proton). There are discrepancies between thisand data published in the press, for example, but SalomonSmithBarneyprovides a consistent detailed data source for comparison. Selected com-parisons with Hyundai, South Korea’s first passenger car manufacturer,provide a benchmark given the success of that company and the Malaysiangovernment’s attempt to emulate it.
Proton 167

Financial performance
Proton’s financial performance after privatization improved in almost allareas due to a growing domestic car market, continued protection andfavourable exchange rates. An increase in average turnover from RM2.7billion (1993–94) to RM5.7 billion (1996–97) enabled Proton to increaseaverage profits before tax (PBT) (from RM296.6 to RM741.9 million),average net profit (RM256.1 to RM548.7 million), average return on assets(ROA) (10.5 to 14.7 per cent), average return on equity (ROE) (23.9 to 29.1per cent) and PBT margins (9.85 to 12.65 per cent) (Table 7.03). However,average net profit margins actually declined marginally from 9.8 to 9.4 percent, while average net interest cover deteriorated from −8.35 to −25.5 percent (Table 7.04). Furthermore, the high net profit margin (11.9 per cent)and ROA (18.5 per cent) in 1997 were not particularly significant improve-ments over Proton’s net profit margin in 1993 (11.6 per cent) and ROA in1992 (15.9 per cent).
Proton’s improved operating profit margin was attributed to its across-the-board cost-cutting exercise in 1996–97, lower local component costs (as aresult of Proton pressing local suppliers to reduce costs), higher efficiencyratios of 94 per cent, less capital works-in-progress, and high margins derivedfrom a good model mix, and increased plant efficiency (see Asiaweek, 11April 1997; The Edge, 10 March 1997, 30 June 1997). Yahaya claimed to have‘delayered’ and ‘downsized’ Proton’s staff ‘to empower management to takeresponsibility and make decisions quickly’ (Business Times, 19 August 1996),although there appeared to be no cutting of staff.10
However, improved operating margins were also due to the depreciationof the Japanese yen11 by 25 per cent (1996) and 16 per cent (1997) (The Edge,24 June 1996). The company also benefited from a lower effective tax rate foradditional reinvestment allowances arising from higher capital expenditurein 1996 (The Sun, 16 July 1996). Sales growth in 2001 and 2002 was the resultof the overall increase in Malaysian car sales due to lower interest rates, aRM1.25 billion government fund to finance car purchases for teachers, exciseduty exemptions for hire-car operators using national cars, and generous hirepurchase periods (Malaysian Business, 16 January 2002; Investors Digest,16 February 2002; Business Times, 6 May 2002).
Production capacity
Proton’s production capacity expansion increased from an average of 12.3per cent (1993–94) to 18.2 per cent (1996–97) (Table 7.05) and this continuedto increase in 1998 before being reduced in 1999 and 2000 following the Asianfinancial crisis. Capacity utilization increased along with production capacityand was generally high (well above 80 per cent for 1995–2002, with the excep-tion of 1998) and above Proton’s own breakeven level (calculated at 67 percent in 2000), although this was already high in 1994 (SalomonSmithBarney2002).
168 Proton

Tab
le 7
.03
Pro
ton:
Pro
fita
bilit
y, 1
991–
2000
(R
M m
illio
n)
Tur
nove
rT
urno
ver
grow
thP
rofi
tbe
fore
tax
PB
Tgr
owth
Net
profi
tN
et p
rofi
tgr
owth
Net
pro
fit
mar
gin
RO
A-e
ndR
OE
-end
1991
1,78
6.0
261.
518
7.0
10.5
1992
2,19
1.8
22.7
407.
956
.025
9.4
38.7
11.8
15.9
42.2
1993
2,28
6.5
4.3
311.
2(2
3.7)
265.
22.
211
.611
.827
.119
943,
087.
035
.028
2.0
(9.4
)24
6.9
(6.9
)8.
09.
220
.719
953,
708.
420
.130
7.9
9.2
232.
1(6
.0)
6.3
7.6
17.1
1996
5,16
6.7
39.3
454.
647
.635
5.9
53.3
6.9
10.9
22.5
1997
6,22
2.2
20.4
1,02
9.1
126.
474
1.5
108.
911
.918
.535
.719
986,
788.
59.
172
4.6
(29.
6)44
0.6
(40.
6)6.
58.
516
.919
994,
075.
0(4
0.0)
99.0
(86.
3)66
.8(8
4.8)
1.6
1.2
2.4
2000
6,49
6.7
59.4
141.
342
.870
.65.
61.
11.
32.
6
Sou
rce:
Ada
pted
fro
m P
roto
n (2
001)
; Sal
omon
Smit
hBar
ney
(200
3).
Not
es: P
BT
(pro
fit b
efor
e ta
x); R
OA
(ret
urns
on
asse
ts);
RO
E (r
etur
ns o
n eq
uity
). G
row
th r
ates
, net
pro
fit m
argi
n, R
OA
and
RO
E a
re in
per
cent
age
(%).
Bra
cket
s(
) =
neg
ativ
e or
loss
.
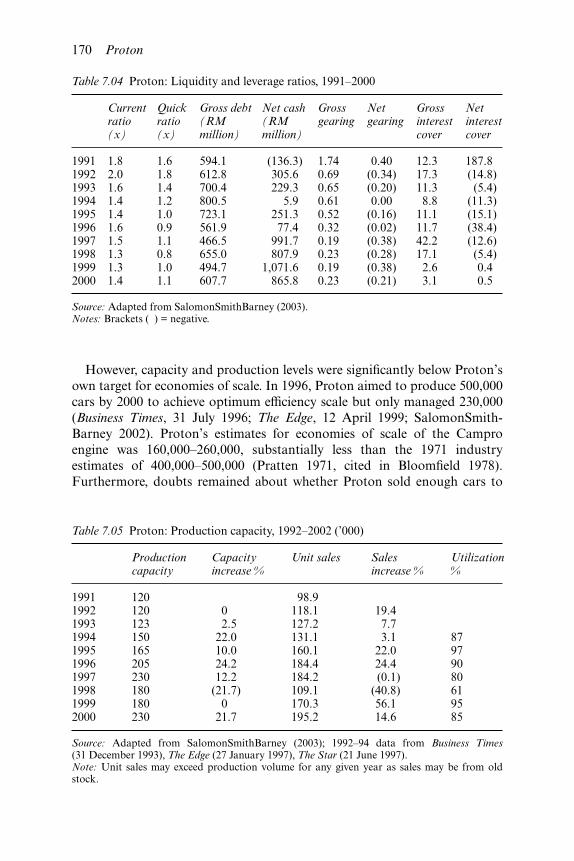
However, capacity and production levels were significantly below Proton’sown target for economies of scale. In 1996, Proton aimed to produce 500,000cars by 2000 to achieve optimum efficiency scale but only managed 230,000(Business Times, 31 July 1996; The Edge, 12 April 1999; SalomonSmith-Barney 2002). Proton’s estimates for economies of scale of the Camproengine was 160,000–260,000, substantially less than the 1971 industryestimates of 400,000–500,000 (Pratten 1971, cited in Bloomfield 1978).Furthermore, doubts remained about whether Proton sold enough cars to
Table 7.04 Proton: Liquidity and leverage ratios, 1991–2000
Currentratio(x)
Quickratio(x)
Gross debt(RMmillion)
Net cash(RMmillion)
Grossgearing
Netgearing
Grossinterestcover
Netinterestcover
1991 1.8 1.6 594.1 (136.3) 1.74 0.40 12.3 187.81992 2.0 1.8 612.8 305.6 0.69 (0.34) 17.3 (14.8)1993 1.6 1.4 700.4 229.3 0.65 (0.20) 11.3 (5.4)1994 1.4 1.2 800.5 5.9 0.61 0.00 8.8 (11.3)1995 1.4 1.0 723.1 251.3 0.52 (0.16) 11.1 (15.1)1996 1.6 0.9 561.9 77.4 0.32 (0.02) 11.7 (38.4)1997 1.5 1.1 466.5 991.7 0.19 (0.38) 42.2 (12.6)1998 1.3 0.8 655.0 807.9 0.23 (0.28) 17.1 (5.4)1999 1.3 1.0 494.7 1,071.6 0.19 (0.38) 2.6 0.42000 1.4 1.1 607.7 865.8 0.23 (0.21) 3.1 0.5
Source: Adapted from SalomonSmithBarney (2003).Notes: Brackets ( ) = negative.
Table 7.05 Proton: Production capacity, 1992–2002 (’000)
Productioncapacity
Capacityincrease %
Unit sales Salesincrease %
Utilization%
1991 120 98.91992 120 0 118.1 19.41993 123 2.5 127.2 7.71994 150 22.0 131.1 3.1 871995 165 10.0 160.1 22.0 971996 205 24.2 184.4 24.4 901997 230 12.2 184.2 (0.1) 801998 180 (21.7) 109.1 (40.8) 611999 180 0 170.3 56.1 952000 230 21.7 195.2 14.6 85
Source: Adapted from SalomonSmithBarney (2003); 1992–94 data from Business Times(31 December 1993), The Edge (27 January 1997), The Star (21 June 1997).Note: Unit sales may exceed production volume for any given year as sales may be from oldstock.
170 Proton

be able to develop its own engines (The Edge, 24 June 2000; Business Times,13 September 2000). The cost of Proton producing its own engines andtransmission was considered too high given its capacity,12 and its targetremained small compared to Hyundai’s annual production of 1.3 million in1995. Excluding the effects of the 1997–98 crisis, and based on a growth rateof 10–20 per cent a year, Proton’s capacity would only have increasedto 240,000–340,000 by 2000, suggesting initial targets may have been toooptimistic (Table 7.06).
Part of Proton’s long-term plan to become more competitive was bysubstantially increasing production capacity by opening Proton City, a state-of-the-art plant, expected to save 20 per cent in costs by employing just-in-time (JIT) methods to cut down on stocking and space.13 In 1999, Protonannounced it was two years away from a fully automated internet-based end-to-end procurement, production and distribution system initiated in 1997(The Edge, 12 April 1999). Proton City was postponed following the 1997–98Asian financial crisis and its owner’s inability to finance capacity expansion.The project was later financed by Petronas before it sold Proton toKhazanah.
Exports
Export performance is one measure of competitiveness. Proton’s exportsincreased by an average of 20.7 per cent (1996–97) compared to a contractionof 4.1 per cent (1993–94) (Table 7.07). However, export growth slowed sub-stantially after 1997 and contracted after 1999, while exports as a percentageof unit sales actually declined from an average of 15.8 per cent to 14.7 percent after privatization, indicating a growing reliance on the protecteddomestic market. Hyundai’s capacity expansion in comparison was driven byits export markets, in particular North America, which allowed Hyundaito increase production capacity from 150,000 in 1984 to 700,000 in 1988.(Gwynne 1991).
Table 7.06 Proton: Potential capacity*, 1996–2002 (’000)
10% projected growth 20% projected growth Actual
1996 1651997 181.5 198 2051998 199.7 237.6 2301999 219.6 285.1 1802000 241.6 342.1 1802001 265.8 410.5 2302002 292.4 492.6 240
Source: Adapted from SalomonSmithBarney (2003).Note: * Based on 10–20% p.a. projected growth rates.
Proton 171
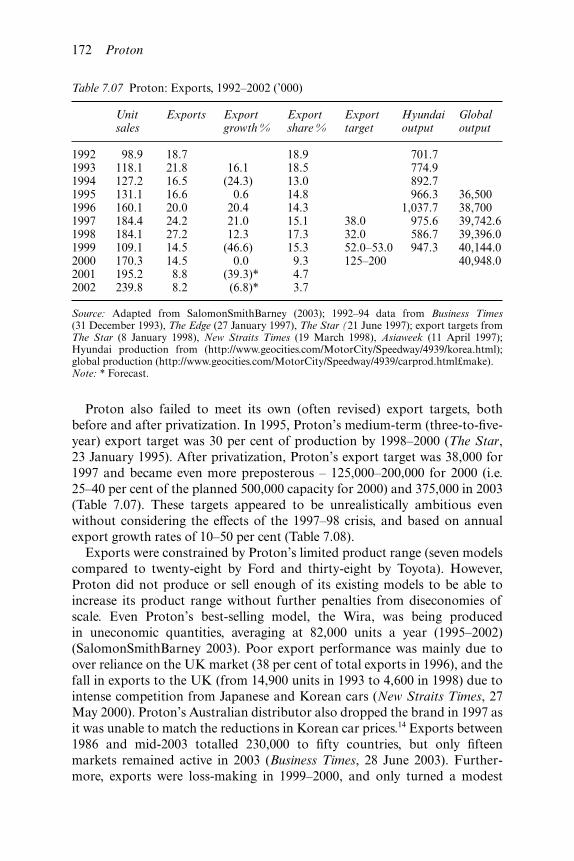
Proton also failed to meet its own (often revised) export targets, bothbefore and after privatization. In 1995, Proton’s medium-term (three-to-five-year) export target was 30 per cent of production by 1998–2000 (The Star,23 January 1995). After privatization, Proton’s export target was 38,000 for1997 and became even more preposterous – 125,000–200,000 for 2000 (i.e.25–40 per cent of the planned 500,000 capacity for 2000) and 375,000 in 2003(Table 7.07). These targets appeared to be unrealistically ambitious evenwithout considering the effects of the 1997–98 crisis, and based on annualexport growth rates of 10–50 per cent (Table 7.08).
Exports were constrained by Proton’s limited product range (seven modelscompared to twenty-eight by Ford and thirty-eight by Toyota). However,Proton did not produce or sell enough of its existing models to be able toincrease its product range without further penalties from diseconomies ofscale. Even Proton’s best-selling model, the Wira, was being producedin uneconomic quantities, averaging at 82,000 units a year (1995–2002)(SalomonSmithBarney 2003). Poor export performance was mainly due toover reliance on the UK market (38 per cent of total exports in 1996), and thefall in exports to the UK (from 14,900 units in 1993 to 4,600 in 1998) due tointense competition from Japanese and Korean cars (New Straits Times, 27May 2000). Proton’s Australian distributor also dropped the brand in 1997 asit was unable to match the reductions in Korean car prices.14 Exports between1986 and mid-2003 totalled 230,000 to fifty countries, but only fifteenmarkets remained active in 2003 (Business Times, 28 June 2003). Further-more, exports were loss-making in 1999–2000, and only turned a modest
Table 7.07 Proton: Exports, 1992–2002 (’000)
Unitsales
Exports Exportgrowth %
Exportshare %
Exporttarget
Hyundaioutput
Globaloutput
1992 98.9 18.7 18.9 701.71993 118.1 21.8 16.1 18.5 774.91994 127.2 16.5 (24.3) 13.0 892.71995 131.1 16.6 0.6 14.8 966.3 36,5001996 160.1 20.0 20.4 14.3 1,037.7 38,7001997 184.4 24.2 21.0 15.1 38.0 975.6 39,742.61998 184.1 27.2 12.3 17.3 32.0 586.7 39,396.01999 109.1 14.5 (46.6) 15.3 52.0–53.0 947.3 40,144.02000 170.3 14.5 0.0 9.3 125–200 40,948.02001 195.2 8.8 (39.3)* 4.72002 239.8 8.2 (6.8)* 3.7
Source: Adapted from SalomonSmithBarney (2003); 1992–94 data from Business Times(31 December 1993), The Edge (27 January 1997), The Star (21 June 1997); export targets fromThe Star (8 January 1998), New Straits Times (19 March 1998), Asiaweek (11 April 1997);Hyundai production from (http://www.geocities.com/MotorCity/Speedway/4939/korea.html);global production (http://www.geocities.com/MotorCity/Speedway/4939/carprod.html£make).Note: * Forecast.
172 Proton

RM3.7 million in pre-tax profit in 2001 largely due to Proton UK breakingeven (New Straits Times, 20 November 2001). By 2003, exports still contrib-uted only 5–10 per cent of revenue, despite a target of 30 per cent (which wasstill low compared to Hyundai) (New Straits Times, 20 October 2003).
Protection
Proton’s efficiency can also be measured by ongoing protection levels, actualprogress towards regional trade liberalization under the Asian Free TradeAgreement (AFTA), and projections involving lower protection levels. Underthe Association of Southeast Asian Nations (ASEAN) Common EffectivePreferential Tariff (CEPT, the main mechanism for the realization of AFTA),import duties for cars were expected not to exceed 20 per cent by 2003.Despite early imminent government warnings to Proton about the removal oftrade barriers under AFTA, Malaysia’s automotive import duty structureremained essentially unchanged since 1991.
Instead, the government announced in September 1999 that it was notready to reduce tariffs on imported CKD and CBU units, and rejected cuts inimport tariffs on automobiles and auto parts from Thailand. In early May2000, it secured deferment for the transfer of CKD units from the temporaryexclusion list to the inclusion list on 1 January 2005. Mahathir admitted thatProton would not be very competitive in an open market and the govern-ment’s request for continuation of protective tariffs on auto imports until1 January 2005 was accepted by ASEAN on 18 July 2000. The governmentalso kept its options open in case Proton remained uncompetitive. Accordingto the Deputy Minister of International Trade and Industry: ‘If by 2005 westill feel that we need to be exempted from AFTA, we will then review thepolicy’ (New Straits Times, 25 August 2000).
Table 7.08 Proton: Export potential (’000), 1996–2000
Target 10% projectedgrowth
20% projectedgrowth
50% projectedgrowth
Actual
1996 20.01997 38.0 22.0 24.0 30.0 24.21998 32.0 24.2 28.8 45.0 27.21999 52.0–53.0 26.6 34.6 67.5 14.52000 125–200 29.3 41.5 101.3 14.52001 32.2 49.8 158.0 8.82002 35.4 59.8 228.0 8.2
Source: Adapted from SalomonSmithBarney (2003).Note: Calculations based on the Korean Institute for Economics and Technology forecastedannual average growth rates of 48.7–51.2 per cent for South Korean automobile exports between1984 and 1990 (Industrial Management, 9(6), 1987).
Proton 173

Even Proton’s Japanese director admitted that it would not be easy to cutcosts and improve the quality of locally manufactured cars in ‘four shortyears’ before AFTA in 2005, and expected Proton’s market share to fall from60 to 30 per cent (New Straits Times, 22 July 2000).15 The impact of partialduties would substantially reduce the price difference between Proton andcompeting Japanese models while the removal of duties would make com-petitor models significantly cheaper (TA Securities 1996) (Table 7.09).
Proton’s continued reliance on protection for its price advantage wasreflected in a steady loss of market share from 74 per cent (1993) to 43–45 percent (2003) as the government relaxed its control over new car prices, allow-ing distributors to cut prices (Table 7.10). By 2003, the price gap betweenProton and its competitors declined considerably, with comparable modelsfrom Japanese, Korean and American manufacturers16 selling for betweenRM50,000 and RM76,676 compared to RM72,811 for the Proton Waja 1.6X(the premier model of the range).
Technology development
Proton attempted to increase competitiveness by reducing costs and increas-ing production, pushing for technology transfer to reduce its import contentfrom 30 per cent (in 1996) to 10 per cent. Yahaya sought to overcome tech-nology transfer problems with Mitsubishi through tie-ups with French carmanufacturer Citroën, and later, Renault, and through the purchase, inOctober 1996, of Lotus Group International Limited, a British automotiveengineering company and manufacturer of luxury sports cars. The Citroëntie-up was initiated by Yahaya with the aim of using the engine of the CitroënAX.17 (Yahaya also owned the Citroën franchise through DRB-HICOM sub-sidiary, Directional.) The deal for the 10-year-old Citroën AX was attractiveas it involved no further development costs, and was 50 per cent cheaperthan the cost of Proton’s previous small model, the Satria 1.3L.18 However,Citroën had replaced the AX with the Saxo and was no longer interested in itsdevelopment, and Proton complained about technology transfer problems(Asiaweek, 4 November 1997). The Tiara 1.1 (a rebadged Citroën AX) wasreleased in 1996, but was poorly conceived, lacking features and sufferingmechanical problems. Three years later, and after several generous discounts,Proton discontinued its production.
By mid-1996, Proton only had 20 per cent design competency and itsacquisition of Lotus was a major step in upgrading its engineering capabil-ities. There were immediate benefits, reflected in the modest commercialsuccess locally of its ‘Lotus-tuned’ versions of the Satria 1.8 GTi andPerdana V6 2.0 (both released in 1998), as well as potential cost savings.Lotus also contributed to the Campro engine19 and two new models, the Wajaand Gen-2. Development of the Waja began in June 1996 and the car waslaunched in November 2002. The Waja was Proton’s first in-house design anda departure from variations of the Mitsubishi Lancer, although still based on
174 Proton
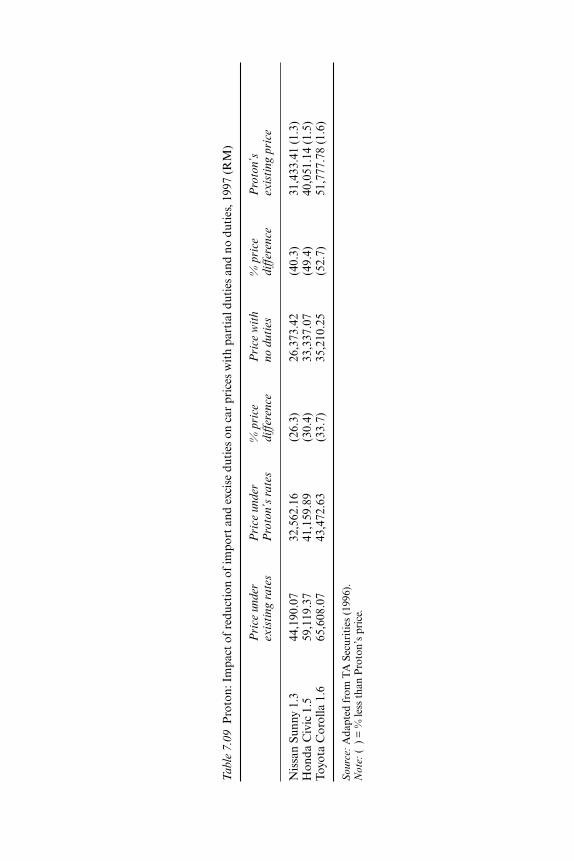
Tab
le 7
.09
Pro
ton:
Im
pact
of
redu
ctio
n of
impo
rt a
nd e
xcis
e du
ties
on
car
pric
es w
ith
part
ial d
utie
s an
d no
dut
ies,
199
7 (R
M)
Pri
ce u
nder
exis
ting
rate
sP
rice
und
erP
roto
n’s
rate
s%
pri
cedi
ffer
ence
Pri
ce w
ith
nodu
ties
% p
rice
diff
eren
ceP
roto
n’s
exis
ting
pri
ce
Nis
san
Sunn
y 1.
344
,190
.07
32,5
62.1
6(2
6.3)
26,3
73.4
2(4
0.3)
31,4
33.4
1 (1
.3)
Hon
da C
ivic
1.5
59,1
19.3
741
,159
.89
(30.
4)33
,337
.07
(49.
4)40
,051
.14
(1.5
)To
yota
Cor
olla
1.6
65,6
08.0
743
,472
.63
(33.
7)35
,210
.25
(52.
7)51
,777
.78
(1.6
)
Sou
rce:
Ada
pted
fro
m T
A S
ecur
itie
s (1
996)
.N
ote:
()
= %
less
tha
n P
roto
n’s
pric
e.

a Mitsubishi (Carisma) platform, for which Proton bought the intellectualproperty rights. Mitsubishi and Renault supplied engines, the latter tie-upfollowed the failure of the Tiara and Proton’s dissatisfaction with Citroën.The Waja increased local content to 95 per cent, and savings from this modelwere reflected in profit margins about three times those of the Wira, whiledevelopment of the Campro engine was expected to save Proton RM2,000per car (i.e. 30 per cent in engine costs alone),20 or RM200 million a year (10–15 per cent of costs) in royalty payments (Business Times, 27 September2002).
Proton’s engine management system, jointly developed with Lotus Engin-eering and Siemens VDO in July 2001, cost RM20 million but was estimatedto reduce Proton’s engineering development cost by 20–30 per cent (up toRM145 million in annual material costs) (Business Times, 18 January 2002;New Straits Times, 13 February 2002). Proton’s expenditure on importedparts and materials, mainly engines and transmissions from Japan andEurope, declined from RM1.72 billion (2000) to RM1.44 billion (2001) andRM1.29 billion (2002) (Business Times, 28 June 2003). However, increasedtechnical capabilities did not significantly reduce Proton’s technical fees, withroyalties (for engine assembly) actually increasing as a percentage of totaltechnical fees (SalomonSmithBarney 2003), suggesting that there was insuffi-cient technology transfer to translate into significant cost reductions.
The Proton Gen-2, developed after Proton’s renationalization, was basedon a variation of the Carisma platform but with Proton’s own body andengine. In response to pressure to release new models to regain market share,the Gen-2 was rushed into production in 2004 and resulted in design prob-lems and poor build quality which received some poor reviews in the UKmotoring press.21 More crucially, Proton was unable to develop the necessaryvariable valve timing technology for the Campro engine, or its own gearbox,having to source this from Mitsubishi. These problems illustrate the difficul-ties and considerable time required for technology acquisition. Technologydevelopment proceeded at a slow pace, with delivery of the Waja and Gen-2delayed because of supply bottlenecks and new versions for production notbeing ready (The Economist, 8 May 2004). The Campro engine, originallyscheduled for production by 2002, was only released in 2004 due to technicaldifficulties (Business Times, 13 September 2000, 14 June 2002; The Economist,
Table 7.10 Proton: Domestic market share, 1993–2003 (%)
1993 1994 1995 1996 1997 1998 1999 2000 2001 2002 2003
74.0 71.0 61.7 63.9 64.0 64.0 54.0 52.1–63.4* 63.7* 62.0 43.0–45.0**
Source: Adapted from Business Times (31 December 1993), The Edge (27 January 1997), TheStar (21 June 1997) for 1994–98; Autoworld <http://www.autoworld.com.my/> for 1999–2000; *Malaysian Automotive Association (cited in The Edge, 23 September 2003); ** SalomonSmith-Barney (2003).
176 Proton
8 May 2004). Overall, Proton was still seen as inferior, uncompetitive in priceand technology (due to an outmoded mass production stage with pockets ofJIT practices), and with the worst-quality record in the country (The Sun, 25September 1997; Business Times, 22 March 2002; The Economist, 8 May2004). Even by 2002, Proton’s competitiveness continued to be constrainedby technology limitations, a lack of new products and cost, with pricesexpected to increase by 11 per cent (Business Times, 20 January 2001, 22March 2002). Poor design and disappointing sales also led to the discontinu-ation of the Juara mini-van/people carrier in 2002.
Local content
As most of Proton’s cost savings were expected to come from lower compon-ent costs, it was important to increase local content and, at the same time,reduce its costs. Yahaya attempted to reduce the cost of local components byrestructuring Proton’s component manufacturing and Vendor DevelopmentProgramme (VDP), and pushing vendors to expand capacity (by meeting30 per cent export targets) and to invest in R&D (to reduce technologicaldependence) (Business Times, 19 August 1996). Proton also moved away fromits previous single-source policy in 1997, requiring several companies to com-pete for the supply of particular parts (New Straits Times, 1 April 2002).Proton managed to increase local content and reduce the cost of local com-ponents after privatization, but this came from local vendors being issuedwith directives to comply with price reductions, rather than from efforts toimprove vendor efficiency (Asiaweek, 11 April 1997; The Star, 8 February2001). Furthermore, previously increasing local content appeared to level off(SalomonSmithBarney 2003), suggesting that further gains may not havebeen possible without actual efficiency improvements or technologicaladvances.
Domestic parts manufacturers remained uncompetitive, lacking expertiseand largely dependent on overseas partners for technology (e.g. see The Edge,10 August 1998; Bando 2000). Many of Proton’s parts and equipment con-tinued to be inferior, in part due to vendor complacency arising from securelong-term contracts and political pressure (Bando 2000; Business Times,2 January 2002), and most of Proton vendors did not possess the QS9000certification needed to supply the major car manufacturers, with even thelarger vendors continuing to depend primarily on Proton (The Sun,13 September 2000; New Straits Times, 8 March 2002; Business Times,26 June 2003). Increasing local content did not reduce Proton’s costs as pro-duction of local components relied on imported material from Japan, andlocal component costs actually increased following the ringgit’s devaluationafter mid-1997 (The Edge, 16 September 1996; also see Business Times,4 December 1998). Import content was still high at 30 per cent (Proton’starget was 10 per cent), and imported Japanese parts continued to make up 30per cent of the cost of a Proton car by late 1997, further exposing Proton to
Proton 177
currency fluctuations (Asiaweek, 4 November 1997). Increasing local contentalso made Proton less competitive than ASEAN-assembled cars with lowerlocal content (New Straits Times, 8 November 2002).
Proton sought to restructure its vendor programme by streamlining its151 vendors into 30–40 ‘system suppliers’ who would have to upgrade withthe R&D capability to design and fabricate component systems for Protonand other manufacturers. A significant feature was the creation of second-and third-tier sub-contractors and suppliers who would supply first-tiervendors to improve efficiency and reduce costs. Proton was only able toimplement a modular approach to component sourcing with the productionof the Waja, where 20 ‘tier one’ vendors acquired design and engineeringcapabilities for component development and verification to manufacturecomponents in collaboration with Proton engineers (Proton 2001). However,Proton only managed a 3–4 per cent reduction in local component costs in2003 as the loss of market share made it difficult to negotiate for lower localcomponent costs with vendors given their smaller output.22 Petronas waslater reported to have sought government approval to source cheaper partsfrom overseas to lower costs after it took over Proton and AFTA offeredProton the opportunity to source components more cheaply and lower itsselling price by 18 per cent (at 6 per cent per annum) (The Edge, 6 December1999).
Marketing and distribution
Yahaya sought to make Proton more market-oriented, focusing on market-ing, price positioning and building up its market image. This involvedchanging EON’s sales culture from one of merely taking orders to actuallytrying to sell cars, and improving its existing marketing strategy by reassess-ing and repositioning in low-profit overseas markets, rather than by exploringnew ones. After privatization, Proton appointed USPD as its second nationaldistributor (for the Tiara, Satria, Satria GTi, Wira Aeroback and Putramodels). USPD was set up following DRB’s joint venture to assemble theSatria with Proton. However, EON and USPD operated as separate businessunits, and Yahaya did not seem to address integration and coordinationproblems. As a result, there were inconsistencies in sales forecasts and quality,customer support, and marketing, leading to a mismatch between demandand production (by as much as eight times for the Satria GTi) (The Edge,12 April 1999). Proton was still unable to determine retail prices, leading toEON remaining more profitable (The Star, 8 February 2001). Furthermore,EON’s marketing of the car relied on similar strategies as before, and Protoncontinued to receive customer complaints on its cars and service levels, withmany dealers only interested in selling cars but not in after-sales service (TheStar, 28 May 2001).
It was only much later that Proton attempted to address integration andcoordination problems through the acquisition of 70 per cent of USPD from
178 Proton
DRB-HICOM for RM297 million in 2000.23 It refused to purchase EON(partly because EON would not agree to contribute 30 per cent to Proton’snew model development costs) and instead chose to make USPD (renamedProton Edar) its sole distributor, relegating EON to the status of ‘superdealer’.24 The purchase of USPD (and its subsequent increase in market shareat the expense of EON) allowed Proton to gain control of distribution andmarketing, and to bypass problems associated with EON. The new ‘superdealer’ arrangement also allowed Proton to combine both EON’s and ProtonEdar’s resources, rationalize and streamline sales and after-sales service,and promote a common corporate identity (Business Times, 1 April 2003).Proton, through Proton Edar, determined prices, allowing it to better pitchmodels against the competition (The Star, 8 February 2001). Proton Edaralso determined and installed accessories (e.g. air-conditioners, rubber matsand body stripes) which were previously very lucrative for EON. EON wasallowed to maintain existing margins (which were higher than for otherdealers, but lower than for Proton Edar), but its model range was restrictedand it was not allowed to undercut Proton Edar’s retail prices (BusinessTimes, 10 April 2003, 21 August 2003). These changes were only implementedafter Proton’s renationalization.
Nonetheless, sales still relied on cheap financing, special promotionalpackages and government support. Exports continued to suffer fromproblems with branding, product quality, pricing, sales, after-sales serviceand distribution, and the company appeared unable to resolve the contra-diction between selling cheap, basic cars and trying to compete in moreexpensive market segments (New Straits Times, 13 May 2000). While theacquisition of Lotus was meant to provide Proton cars with superior per-formance and a niche market, Proton found it difficult to shed its past image.According to its CEO Tengku Mahaleel, the Proton brand was ‘somewhereat basement bargain’ and ‘neither here nor there . . . bought because theyare cheap and there is decreasing nationalistic support’ (Business Times,10 January 2001, 10 August 1998). This was compounded by regular state-ments from the Prime Minister that Proton would concentrate on selling ‘notso sophisticated cars with all the gadgets’ in Asia, the Middle East and NorthAfrica (given its inability to compete technologically) (The Star, 7 October2000).
Problems
From the available evidence, privatization did not improve Proton’s perform-ance overall. While some financial indicators improved, this was on the backof continued protection and the growth of the domestic market. Productioncapacity increased but was still below economies of scale and Proton’s owntargets. Exports increased in absolute terms until 1998 (but not as a share oftotal sales) and declined to pre-1992 levels after 1999. Proton continued tolose domestic market share despite ongoing protection. Underlying these
Proton 179

problems was the slow rate of technology acquisition and failure to achieveeconomies of scale (production capacity). As a result, the company remaineduncompetitive, relying on domestic sales, with protection levels unchanged.Proton’s overall poor performance can be explained by the government’s exante and ex post failures.
Ex ante failure
Ex ante failure occurred at Proton’s conception and privatization. Asan infant industry, Proton’s viability crucially depended on technologyacquisition and learning rents. However, the haste in which the national carproject was originally created led to several ex ante failures on the govern-ment’s part. It failed to secure a favourable technology transfer agreementwith Mitsubishi, ensure that learning rents (protection) was temporary andconditional upon meeting performance targets, and plan for exports. These exante failures affected Proton’s learning and technology acquisition. Underthese circumstances, privatization in itself was unlikely to solve Proton’s mainproblems, at most only providing a second-best outcome, and the decision toprivatize represented another ex ante failure. The government continuedto underestimate the problems inherent in the auto industry (and especiallyan infant industry), and the ability of the private sector to undertake such aproject, particularly where other economic and social objectives wereinvolved, namely Proton’s role in spearheading industrialization by support-ing local (Malay) component manufacture.
Proton’s technology acquisition was affected by political considerations,namely the need to promote Malay (and bypass domestic Chinese) capital,and the legacy of the NEP which compromised learning. This affectednegotiations for technology transfer and the learning process, creating add-itional problems for Proton as a late comer, and subsequently also affectingits performance after privatization. Negotiations with Mitsubishi, Proton’stechnical partner, were compromised by inexperienced (HICOM) officialsand the highly centralized and secretive nature of negotiations, led byMahathir, which excluded Malaysian Industrial Development Authority(MIDA) officials and (Chinese) Malaysian firms with experience in CKDpricing, technology transfer and local content (Doner 1991). As a result, thecontract left several areas vague (including future local content levels, CKDunit prices, royalty payments, local content, technology transfer, andexports), providing gains ‘far more secure for Japan and Mitsubishi than forMalaysia’ (Far Eastern Economic Review, 20 April 1989; Doner 1991).25
Moreover, Proton did not have the right management or engineeringexpertise to meet learning requirements, and opted to use existing com-ponents and make modifications to the existing body instead of graduallydeveloping its own technology (Malaysian Business, 16 October 2002; also seeBusiness Times, 10 January 1992). According to Proton’s managing directorMohd Nadzmi, technology transfer was slow because ‘no one knew how
180 Proton
to go about it’ and Proton’s management initially did not understand thebusiness thoroughly (Malaysian Business, 1 July 1994: 14). As a result, pro-gress was slow and Proton essentially remained a (Malay) assembler, relyingon Mitsubishi technology and essentially rebadging old Mitsubishi models.In-house engine assembly only began in 1990, six years after commencementof operations, and the high cost of using Mitsubishi’s engines and ongoingroyalty payments affected Proton’s competitiveness.26
Proton’s original and subsequent production targets (after privatization)were substantially below industry estimates for economies of scale, with thegovernment underestimating the capital and technological requirements, andtime needed to develop a Malaysian car. While it sought to emulate SouthKorea’s car industry, the government did not account for global conditions(including overcapacity) and industry forecasts made in the 1970s, as well asongoing trends towards industry rationalization. Capacity expansion wasfurther constrained by domestic market size and the lack of internationalcompetitiveness, particularly in the context of global overcapacity.
Proton’s original and subsequent production targets (5,000 units in 1985,120,000 by the 1990s, and 500,000 by 2000) were well below industry levelsfor economies of scale. Its planned capacity of 80,000 in 1985 was alsouneconomical, while actual capacity in 1985 was even lower at 40,000. Thesefigures were significantly below Hyundai’s first production planned for 1976(55,000) and 1978–1979 (120,000). By 1987, Hyundai was producing 670,000cars (Bloomfield 1991). Proton’s planned capacity expansion was ambitiousand depended on substantial sales growth which only a large export marketcould provide. Hyundai’s breakthrough as a major exporter came when itentered the North American market, selling 169,000 cars in 1986 and 263,000in 1987, allowing it to increase production capacity from 150,000 (in 1984) to700,000 (1988) (Gwynne 1991).
In comparison, the Malaysian government did not even have export plansfor Proton to be able to duplicate these economies of scale, and the originalagreement in fact incorporated a de facto restriction on exports of the Saga(Doner 1991; Tharu 1994). Furthermore, Proton’s Japanese management wasapparently not interested in competing with Mitsubishi, and targeted marketsthat Mitsubishi had no interest in and which only required minor modifica-tions to the car.27 As a result, early attempts to enter the US market failedpartly due to the need for expensive modifications. Instead, as late as 1995,Proton continued to rely on ‘a very strong, very big, domestic base’ for a‘competitive production volume’ of 250,000–300,000 a year in 199528 whentotal passenger car sales for the entire country that year was only 285,792(Malaysian Motor Traders Association, cited in Business Times, 31 January1997).
On top of this, privatization did not change Proton’s relationship withits local suppliers, and the company continued to find it difficult to reducecomponent costs due to government policies on Malay vendors. Proton hadto support local industries, meet NEP objectives by promoting Malay
Proton 181

participation, and sustain employment. Its workforce increased from 3,104in 1991 to an estimated 6,000 in 1998 and it was not allowed to retrench(Business Times, 10 January 1992). Multiple government objectives createdconflicting requirements. While Proton’s competitiveness required the ration-alization of parts suppliers, the VDP sought to support more local (Malay)vendors, undermining economies of scale and preventing Proton fromsourcing cheaper components elsewhere (The Edge, 6 December 1999; Bando2000). Proton’s competitiveness was thus closely related to the performanceof local vendors, who remained inefficient and protected by the VDP, andwhose efficiency was further constrained by their inability to export in orderto benefit from economies of scale. Even the price of Proton’s cars weresubject to government approval, and it was not allowed to raise prices follow-ing the currency crisis and rising costs after 1997 (The Star, 29 November1999; The Edge, 6 March 2000).
Crucially, privatization was undertaken without a clear understanding ofthe main problems Proton faced, and did not appear designed to addressthese issues. On the other hand, the privatization was consistent with thegovernment’s strategy of promoting (Malay) capital accumulation targetedat parties close to the political leadership by providing the opportunitiesfor both short-term profits (from sales in a protected domestic market) andlong-term profits (from exports). The subsequent actions of Proton’s parentcompany DRB-HICOM suggest that it may have been more interested inpursuing short-term rents.
Ex post failure
In the context of the ex ante failures discussed above, the government’scapacity to ensure that long-term profits were pursued through technologyacquisition and greater competitiveness was crucial for the success of Proton.The failure to do so represented an ex post failure, and this was evident in thegovernment’s inability to reduce protection levels, suggesting that privatiza-tion did not fundamentally alter the institutional relationship between thegovernment and enterprise. Furthermore, while Proton made some progresstowards greater efficiency, important changes were implemented only after itsrenationalization, indicating that the private owner did not have the financialcapacity to sustain the required capital investment, and that the governmentwas unable to design and implement a credible subsidization strategy toensure that capital investment and learning took place.
The constraints of insufficient production scale are related to technologyacquisition necessary for product competitiveness. Sub-optimal volumes ofproduction arising from small domestic markets can limit technologicaldiffusion in the auto industry in developing industries given the high costs(Odaka 1983; The Edge, 24 June 2000; New Straits Times, 22 July 2000;Business Times, 13 September 2000). As such, it is more useful to analysethe problems of economies of scale in terms of the lack of efficiency and
182 Proton
competitiveness needed to capture a larger market. In the case of an infantindustry such as Proton, competitiveness depends on the success of thegovernment’s technology acquisition strategy through conditional subsidies.The failure of Proton’s privatization reveals that the real limitations ofMalaysia’s technology acquisition strategy (compared to South Korea)was in its management of learning rents, particularly the absence of a clearstrategy and time frame for the removal of protection, and lack of strictperformance targets such as exports which would be a clear indication ofincreasing competitiveness.
As noted in Chapter 3, this lack of disciplinary capacity appears to be anongoing problem and, in this case, was reflected in the government’s con-tinued (ex post) failure to enforce conditionality. Technology upgrading wasthus arguably much slower in Malaysia because the government lacked acredible strategy of providing conditional subsidies that could be effectivelywithdrawn if performance was poor. This could have been partly due to thelimitation of having only one major car manufacturing unit which limitedthe institutional capacity of the state to play a ‘carrot and stick’ game withthe enterprise. The government’s disciplinary capacity was also likely tohave been constrained by the nature of patronage relationships, which per-sonalized regulation. This was compounded by the Prime Minister’s personalinterest in the project. While the government did previously display thecapacity to sack the (Malay) management before privatization, it appearedunwilling to discipline Proton’s private owners.
Privatization therefore did not improve the state’s ability to enforce con-ditions despite Proton being provided with substantial learning rents.There was no clear timetable to make Proton competitive in terms of tariffexemptions, even as late as 2002 (two years after securing the postponementof AFTA) with the government failing to outline a strategy (Business Times,1 February 2002). Instead, Mahathir announced that the government had notgradually reduced import duties because it was confident that Proton wouldbe efficient and cost-effective by 2005 (New Straits Times, 7 May 2002). Thesubsequent announcement that Malaysia would start reducing import tariffson foreign cars assembled in ASEAN as early as 2003 was equally vague(Business Times, 17 December 2002). This may have been due to the depth ofthe technological challenges (which in turn suggests privatization did notsignificantly improve Proton’s efficiency) but also the political consequencesof failure, particularly given that this was a Malay company and the PrimeMinister’s ‘pet project’ (Asian Wall Street Journal, 23 November 1998).
Furthermore, the government continued to own a significant stake in thecompany, and was represented on the board, with the Prime Minister con-sulted on all major decisions, including major appointments (The Star,16 March 1996). However, government intervention was weak and oftenpersonalized, and Proton was not exposed to greater competition or the realthreat of bankruptcy. The absence of regulation was mirrored by Mahathir’scontinued personal intervention in Proton’s affairs, from suggesting new
Proton 183

markets to apparently vetoing the sale of Proton shares. While Proton’slong-term survival lay in making strategic affiliations with foreign car manu-facturers in order to secure a global production network, Mahathircontinued to resist this in order to preserve Proton’s ‘national identity’ asletting ‘foreigners decide what automobile production would be in Malaysia. . . would be detrimental to Malaysia’ (The Star, 7 October 2000; BusinessTimes, 23 June 1998).29 He also continued to intervene even after steppingdown as Prime Minister in 2003, announcing his own appointment asProton’s adviser in 2004 (shortly after Proton’s largest shareholder Khazanahattempted to remove four directors including the chief executive Mahaleel)which led to several Proton board members threatening to resign (Asian WallStreet Journal, 19 April 2004; The Economist, 8 May 2004).
Technology acquisition was also constrained by the substantial capitalcosts involved which were beyond the owner’s financial capacity. The costsinvolved in enhancing Proton’s technological and production capabilitieswere substantial, with the company needing at least US$1.05 billion forR&D in 1998 and RM300 million to RM1 billion a year (or 5–11 per cent ofits revenue) on product development (excluding vendor costs) (The Edge, 28December 1998; Business Times, 10 April 2003). While the total developmentcost of the final version of the Saga, Proton’s first (rebadged) model, wasRM12.5 million, the Waja cost almost RM1 billion to develop (includingRM600 million for the platform alone) with each new model estimated at afurther RM1 billion (The Edge, 12 April 1999; New Straits Times, 27 May2000; The Star, 8 February 2001). By May 2001, the total cost of the nationalcar project was RM14 billion (The Star, 28 May 2001). Proton also expectedto spend RM1.2–RM1.5 billion in capital expenditure for capacity expansionfor 1996–2000, and the cost of raising capacity to 500,000 cars a year with theconstruction of Proton City was estimated at RM4 billion, later revisedto RM5–RM6 billion over three to four years (to produce one million carsby 2010) (Business Times, 19 August 1996; The Edge, 16 September 1996;The Star, 24 July 1997; The Sun, 25 September 1997).
Proton’s owner was unable to sustain this level of capital investment. Thedecision to sell Proton in late 1998 was in part to help pay DRB-HICOM’smounting debts (estimated at around RM3 billion) but it also coincidedwith Proton’s steady loss of domestic market share, the downturn in carsales in 1998 (although Proton’s sales growth started declining in 1997), thepoor outlook for the auto sector, the looming AFTA deadline, and arequirement for increasingly substantial capital investment. Monthlynational car sales slowed down from 9,356 units (December 1997) to 4,857(January 1998) and was expected to fall by 40–65 per cent in the second halfof the 1998 financial year due to weak demand, increased export com-petition, and the higher cost of Japanese raw material (The Star, 27 June1998; The Edge, 6 July 1998, 2 March 1998). Proton’s own sales were expectedto fall by 60 per cent in 1998 (The Star, 1 December 1997; Business Times,19 March 1998).
184 Proton
Although Proton was financially healthy with RM900 million in cash, arelatively low debt–equity ratio of 1:5 (as at March 1998), and a 9.1 per centincrease in turnover to RM6.8 billion, net profit fell by 40.6 per cent for the1998 financial year (The Edge, 6 July 1998). By July 1998, Proton reduced itsproduction from 4,500 to 2,000 cars a week and was faced with an inventory of25,000 cars and vendor problems (The Edge, 13 July 1998, 10 August 1998).Higher component costs (as a result of the ringgit’s depreciation) and a fall incar sales forced Proton to further reduce production from 20,000 to 5,000 carsa month, resulting in a RM82 million pre-tax loss for the six months ending30 September 1998 (Business Times, 4 December 1998, 10 August 1998).
Following Proton’s privatization, DRB-HICOM aimed to become ‘amajor industrial group which is global and highly diversified’ where ‘manu-facturing, financial services and construction would continue to remain [its]core business’ (Business Times, 19 August 1996). Despite this, about 75 percent of its total sales (RM829 million in 1997) came from Proton cars, withfew of its other subsidiaries able to generate cash flow let alone profit (seeNew Straits Times, 19 March 1998; The Edge 12, April 1999, 7 February2000; Malaysian Business, 1 April 2000). HICOM’s operating profit wasinsignificant after stripping out earnings from EON and Proton, and by 1999,only its automotive segment was making money (Malaysian Business, 1 April2000; The Edge, 7 February 2000). The timing of the decision to sell Protonback to the government suggests that the owner may have preferred rentsfrom a highly protected domestic market rather than invest in technologyacquisition and production capacity needed to compete internationally.DRB-HICOM continued to distribute Proton and EON’s substantial profitsthrough its national dealership of Proton further suggests that this may havebeen a more important source of profit than manufacturing. This wasreflected in DRB-HICOM’s subsequent organizational restructuring andfocus post privatization, shifting towards other non-competitive sectors ofthe economy.
After the sale of Proton (along with Proton Edar and Gadek Capital),the company amalgamated four listed companies to form the DRB-HICOMGroup, focusing on three core divisions – automotive, property and con-struction – which generated 50, 17 and 33 per cent of the group’s revenuerespectively (New Straits Times, 2 May 2002). The focus on property andconstruction was consistent with the pattern of Malaysia’s privatization andthe preferences of (Malay) capital for non-tradable sectors. EON contributedtwo thirds of automotive earnings, but this was expected to decline as bothit and Proton lost market share. DRB-HICOM subsequently secured thefranchise for Honda and Chevrolet cars. Although it started out as an indus-trial conglomerate, the company shifted its focus to securing governmentcontracts including the supply and maintenance of military vehicles for theMinistry of Defence, and construction, with RM2 billion worth of contracts,mainly in the construction of Phase 1 of the electrified double-trackingrailway project between Ipoh and Rawang (New Straits Times, 2 May 2002).
Proton 185
This suggests that DRB-HICOM’s main interest in Proton may have beenin the sale (rather than manufacture) of cars through EON’s exclusive dis-tributorship. However, as Proton’s (and EON’s) market share declined, andsubstantial capital investment was required, DRB-HICOM chose to disposeof Proton and shift its focus to non-competitive sectors (property and con-struction), with its interest in automotive restricted to the assembly anddistribution (rather than R&D and manufacturing) of more competitiveimported brands.
Proton itself also sought to diversify into new areas of growth andannounced a major revamp in 2003 in response to technology acquisitionproblems, substantial capital costs, increasing competition (from Honda andToyota) and delays in its new model launches. The revamp was to transformProton from a manufacturer of vehicles to a provider of a wide range ofproducts and services, focusing on four core areas (manufacturing, salesand marketing, engineering services and ancillary products) (Investors Digest,16 June 2003). Parts of the state bureaucracy also believed Proton was notviable, with an attempted boardroom coup by Proton’s largest shareholder,Khazanah, on 7 April 2004 aimed at removing chief executive Mahaleel30 andselling off Proton’s substantial assets (Reuters, 8 April 2004). The evidencesuggests that the government’s ex post failure was in part due to the economicsignificance of the project and personal interest and intervention of the PrimeMinister which constrained the state’s capacity to enforce conditionalities.
Conclusion
In this chapter, we examined why the government privatized Proton, whyprivatization failed, and what was needed to make privatization work. Protonwas created as an infant industry to address technological challenges andmeet NEP goals. Privatization aimed to overcome inefficiencies under stateownership as well as develop Malay capitalists. The data from the briefperiod before and after privatization, supported by evidence over the longerterm between 1996 and 2000/3, reveal that Proton’s performance did notimprove in the crucial areas after privatization. It was unable to increaseefficiency and competitiveness as measured by its production capacity,exports, technology acquisition and local content. Increasing turnover andprofits were the result of a growing domestic market which Proton dominatedthrough tariff and import duty exemptions. Even then, its market share hadstarted declining after 1995. More crucially, while it made some progresstechnologically, privatization did not improve Proton’s technology acquisi-tion process sufficiently as reflected in its continued uncompetitivenessinternationally, with exports declining as a share of total sales. This clearlyshows that Proton was unable to address technological challenges and con-tinued to rely on a protected domestic market for its profits. Furthermore,technology acquisition took longer and cost more than the owner could bear,and important changes only took place after renationalization.
186 Proton

Proton’s poor performance was due to both types of government failurethat we have identified in our case studies. Ex ante failure occurred at theproject’s inception, and again when Proton was privatized. In both instances,the government failed to determine project viability or introduce measuresto achieve viability. It also did not account for the substantial cost of invest-ment in capital and R&D, and the lack of incentives for the owner to con-tinue meeting these costs in the context of significant industry challenges.Instead, Proton received ongoing protection without performance criteria orconditionality, and the government was unable to enforce discipline. Thismeant that Proton’s competitiveness after privatization depended on thegovernment’s ability to better manage learning rents. As technology acquisi-tion requires an effective rent-management strategy in this sector, success isthen dependent on whether enforcement of conditionality is easier or moredifficult with private ownership.
The answer clearly is that if the fundamental problem was a failure toenforce conditional subsidies in the first place, privatization by itself isnot likely to make much of a difference. Proton’s failure thus highlights thelimitations of the government’s technology acquisition and capital accumula-tion strategies given the nature of Malaysia’s patron–client relations, legacyof the NEP and characteristics of the capitalist class. As discussed in Chapter3, the government’s lack of a credible strategy to enforce conditional sub-sidies has been a historical feature. The government’s disciplinary capacitywas partly affected by the nature of patron–client networks and the statusof Proton as the sole national car company. This created a moral hazardproblem given the personalized patronage relationships and Proton’s size andeconomic significance which made it difficult to enforce credible sanctions.
This failure can be located within the wider context of government failureto promote (Malay) capital accumulation in dynamic sectors. This wasevident in the continued preference of DRB-HICOM for rents through itsmonopoly distributorship of Proton (through EON) rather than manu-facturing, and its subsequent shift into non-manufacturing sectors, includingreal estate and government contracts. Here, the timing of the decision to sellProton back to the government, and DRB-HICOM’s subsequent corporatefocus, suggest that the owner may have preferred earning rents from aprotected domestic market rather than addressing technology acquisitionproblems in order to become internationally competitive. This was inturn arguably a legacy of the government’s previous capital accumulationstrategies under the NEP discussed in Chapter 3, and its ongoing lack ofdisciplinary capacity. In this case, while the government’s ex post politicalcapacity – its capacity to correct earlier mistakes – was crucial to the successof Proton, this was significantly affected by ex ante failure.
Proton 187

8 Summary and conclusion
This book set out to explain the failure of four Malaysian case studies byasking three questions: Why privatize in developing countries? Why mayprivatization fail? What is needed to make privatization work? We haveargued that privatization can be motivated by economic and political factorsand will often be intrinsically tied with state efforts to promote capitalaccumulation and develop entrepreneurial capacity in developing countries.Furthermore, the very fact that it is the government which decides on pri-vatization makes it an inherently political process, with potentially large dis-tributive and political consequences (e.g. see Vickers and Yarrow 1991; Fine1997). In addition, a lack of entrepreneurial capacity in developing countriescan paradoxically lead to intense political competition for privatized assetsas there are many potential entrepreneurs whose entrepreneurial capacityhas not been tested. This then presents a very different set of problems andconditions for successful privatization which is directly related to the state’scapacity to facilitate the transition of candidates into capitalists.
There are two related claims in this book. The first is that privatizationis not sufficient for ensuring efficient economic outcomes for a variety ofreasons. These reasons include the financing constraint of infrastructure andlarge-scale investments in general, the possibility that the enterprise operatesin a monopolistic or oligopolistic market, the absence of pre-existing entre-preneurs with adequate management skills, technology-learning issues,political transfers necessary for stability, and public unwillingness to paycost-covering tariffs. All these have necessitated state financing (most recentlythrough public–private partnerships) and subsidies for learning and welfare.As a result, privatization does not improve incentives because the qualityof residual control (management effort exerted by owners) is not uniquelyaligned with residual returns (profit). This brings us to our second claim.Given the ongoing need for subsidies and regulation to deal with a variety ofconstraints that prevents the alignment of residual control with residualreturns, the success of privatization depends on the institutional and politicalconditions that allow or constrain the implementation and management ofregulations and subsidies. This means that privatization does not reduce thelikelihood of state intervention, and in the case of developing countries, may
necessitate an expanded role for the state. Regulation will be necessary inthe context of monopolies and as subsidies will be needed to help meet thehigh cost of capital expenditure, where cost-covering tariffs cannot beimplemented, and where the shortage of entrepreneurial capacity necessitateslearning rents. In this context, an important condition for successfulprivatization is the state’s regulatory capacity which needs to be conceivedbeyond what regulation conventionally involves in developed countries.
Regulatory capacity depends both on the state’s institutional and politicalcapacity. However, as institutions are also the outcome of political factors,effective regulation will depend more so on the state’s political rather thaninstitutional capacity. This is because any effective system of regulationimplicitly assumes there are effective sanctions the state can use. Hence, evenif we can design such a system, the state must be able to enforce it through acredible threat of penalties, e.g. by imposing heavy personal fines or transfer-ring the company to someone else. In the Western context, there is a crediblethreat for non-delivery where the state simply gives the contract to someoneelse, and the company that failed to deliver goes bankrupt. In developingcountries, the scarcity of capital and social costs of bankruptcy often meansthat the threat of bankruptcy is often not a credible threat. In addition, thenature of resource allocation through patron–client networks will furtherconstrain the state’s disciplinary capacity. The failure of privatization canthus be due to different combinations of institutional and political con-straints that add up to specific state failures in different cases.
Here, we have distinguished between institutional and political failure toexamine the composition of state failure in a number of different examples ofprivatization failure in Malaysia. Ex ante failure refers to mistakes madebefore or during the privatization process and is often related to informationor institutional constraints, although it can also be affected by politicalfactors. Ex post failure refers to the state’s failure to correct these mistakesand to ensure the viability of privatization, and is usually political in nature.The longer the time frame, the more likely it is that ex post failures arepolitical, because institutions and policies can be changed over time, and ifthey are not, it is usually because of some underlying political constraints.Because ex ante mistakes will often be unavoidable (given the shortage ofentrepreneurs and as information is asymmetric), it becomes even moreimportant for the state to be able to correct these ex post through theappropriate regulatory policies and by enforcing conditionality.
These theoretical considerations, discussed in Chapter 2, allow us tomake sense of Malaysia’s extensive privatization programme examined inChapter 3. By applying our three central questions to the Malaysian case,we are able to establish the political motivations behind the government’sdecision to privatize, the reasons why the performance of privatization as awhole has been mixed, and what conditions are necessary for successfulprivatization. Privatization in Malaysia was motivated by both economic andpolitical factors. However, it was the latter that was more important as this
Summary and conclusion 189
affected the character and outcome of privatization. Changes in socialrelations, namely the emergence of a new Malay middle class, increasedpolitical contests within UMNO, the Malay ruling party. As a result, theallocation of resources, previously centralized through UMNO’s control ofthe state, became increasingly personalized around a few political leaders.This was reflected in the privatization programme, which was characterizedby a personalized, non-transparent selection process, weak regulation, andlimited complete divestitures, together with continued state intervention andpresence in many privatized former state enterprises.
Gauging the performance of Malaysia’s privatization is hampered bymethodological, data and measurement problems. One alternative is tomeasure performance against official objectives. Here, privatization is arguedto have relieved the government’s financial and administrative burden,improved efficiency, contributed to economic growth, reduced the size andpresence of the public sector, and helped meet New Economic Policy (NEP)redistributive targets. However, the evidence is patchy, incomplete andinconclusive, and our brief review of privatization between 1985 and 2000suggests that:
1 savings in government expenditure are largely on paper and need to bebalanced against the provision of soft loans and loss of revenue;
2 the evidence of efficiency gains is mixed and not comprehensive;3 the impact of privatization on economic growth is difficult to establish;4 there was no significant reduction in the level of government spending (as
a percentage of GNP); and5 privatization increased the private individual Malay share of capital and
control of publicly listed companies (as opposed to state ownership onbehalf of Malays) but did not reduce Malay dependence on governmentsupport.
This last point is of particular relevance to our discussion given ongoinggovernment attempts to create Malay capitalists through economic redis-tribution which involved education, (public) employment and businessopportunities. Central to this was the learning process in terms of managerialtraining in SOEs and through learning rents in specific sectors. The state’sfailure to create an independent Malay capitalist class (reflected in continuedstate intervention which included subsidies, protection and bail-outs) illus-trates the ongoing difficulties in promoting learning. Failure here can betraced back to the government’s ex ante and ex post failures. The former isrelated to ethnic considerations and patronage, which compromised thechoice of privatizations and candidates. However, these problems are part ofthe political reality and are inevitable given the intense competition forresources which follow any state attempt to develop entrepreneurial capacity.As such, it is more important for the state to ensure that selected candidatesmeet performance targets. The failure to do so, either by implementing
190 Summary and conclusion

appropriate policy, or enforcing discipline or conditionality, represents thegovernment’s ex post failure and provides a more important explanationfor the failure of privatization. Evidence shows that the Malaysian govern-ment has historically lacked disciplinary capacity, failing to withdraw sub-sidies or protection, for example. Here, privatization did not improve thegovernment’s disciplinary capacity, which continued to be constrained byexisting patron–client relationships, the scarcity of capital and social costs ofbankruptcy.
The discussion of Malaysia’s political economy in Chapter 3 allows us tolocate the four case studies that follow. The evidence from each of the casestudies supports the two claims made in this book. In each case, privatizationnecessitated some form of state financial support due to high capital costs.State support was also required either because cost-covering tariffs or farescould not be implemented (IWK, LRT) or learning rents were needed(Proton). IWK needed state loans in order to keep sewerage charges low andpublicly acceptable. The three LRT operators all relied on generous stateloans which accounted for between 32 and 78 per cent of project financing atfavourable interest rates and lengthy loan periods. MAS was entirely financedby commercial loans based on implicit state guarantees, but despite this, theprivate owner was unable to finance the airline’s fleet expansion. Protonrelied heavily on state support in the form of import duty exemptions, sub-sidies and tax breaks to finance its capital investment.
Poor performance in each case was partly due to the government’s exante failure to determine project or privatization viability and the degree ofnecessary state support that would be required either over the short term orover the longer term in each case. Such an ex ante analysis may have enabledthe identification of the institutional mechanisms that would be necessary ineach case to ensure that the subsidies were not wasted, and owners had thebest mix of incentives and compulsions to maximize their managementeffort. Thus, in the case of IWK, privatization proceeded without sufficientinformation on the economic viability requirements of sewerage treatmentplants given the constraints on pricing. This prevented the operator fromcovering operating and capital costs, and the government from determiningappropriate tariff levels. Poor data on asset condition and performance raisedoperating costs and affected the concessionaire’s ability to meet service andenvironmental targets. Inappropriate tariff levels led to bill collectionproblems that ultimately undermined the operator’s ability to meet capitalinvestment targets. IWK’s experience here also illustrates the difficulties insetting tariffs, which often have to be negotiated rather than set according tostrict economic criteria. The privatization of the LRT system was based onthe assumption that urban rail systems can be privately financed and arecommercially viable whereas this has rarely been the case. To make mattersworse, this was based on grossly overoptimistic ridership projections(arguably to secure project approval). This led to operational losses whichcould not be sustained by the operators of Systems 1 and 2. The LRT case
Summary and conclusion 191
again demonstrates the fact that tariffs or fares usually have to be negotiated,as has been the case in Singapore, Bangkok and Manila.
Similarly, MAS was privatized despite well-known industry problemsrelated to high capital costs and the cyclical nature of the airline industry.Furthermore, the privatization was poorly structured, based entirely on loanswhich created an unpayable debt burden and affected the owner’s abilityto finance the airline. Proton was poorly conceived as a project and failed totake into account industry characteristics, global trends (towards industryrationalization) and the substantial technological and financial challenges.As Proton’s success depended crucially on the technology acquisition processand hence, on the state’s management of learning rents, privatization was aninappropriate policy response.
The fact that privatization proceeded despite these problems stronglysuggests that it was motivated by political considerations. This could thenexplain some of the choices made in terms of candidates and privatizationmethod. With the exception of LRT System 1 (which was owned by stateagencies), all the other privatizations were awarded to individuals closelyassociated with a few political leaders, in particular, the Prime MinisterMahathir Mohamad and former Finance Minister Daim Zainuddin (seeChapter 3, Table 3.07). As discussed in Chapter 3, this was related to thegrowing political contest within UMNO which saw the increasingly per-sonalized allocation of resources as a means of securing political support.At the same time, the political leadership also sought to continue to developentrepreneurial capacity through the privatization process. The success ofthis depended on the government’s disciplinary capacity to ensure that anyefficiency trade-off was only temporary. However, the government’s discip-linary capacity has historically been constrained by the legacy of the NEP’spreferential treatment policies, which undermined the process of learning-by-doing, and led to a preference for easy rents. This affected the nature ofprivatized projects that were concentrated in non-competitive sectors, largelycentred on infrastructure construction, with each of the privatization caseshere providing opportunities for economic rents.
Despite the lack of information, the privatized national sewerage systemwas widely regarded as profitable based on the original and even revisedtariffs. This is why each subsequent new owner was prepared to pay a pre-mium for control of IWK even after the government revised tariffs down-wards, and indeed, each sale netted the previous owner substantial profits.Moreover, control of IWK increased the parent company’s share price andfacilitated ‘signalling’ on the stock market to secure more bank credit onbetter terms. In the case of the LRT, the government chose to privatize boththe construction and operation of the LRT system to the same concessionairebecause profits were at least guaranteed in the former. This would have pro-vided strong incentives for the operator of System 2 to meet the constructiondeadline, and may explain why the foreign (technical) partner for System 1sold its stake back to the state upon completion of the project. The higher
192 Summary and conclusion
cost per kilometre for all three LRT systems, and in particular System 3,compared to similar lines in Singapore and Manila, provides evidence thatrents may have been earned from construction. Similarly, reports ofimpropriety at MAS suggest that rents could have been earned from thepurchase of new aircraft (through a third party) and relocation of theairline’s hub in Germany, and through the creation of separate cargo andcatering divisions. Finally, the owner of Proton was either more interestedin earning rents through the sale (as opposed to manufacture and export)of Proton cars in a protected domestic market, or was unwilling/unable toinvest further to improve technological and productive capacities. This wasillustrated by the timing of the sale of Proton back to the government, andthe company’s subsequent move into non-competitive sectors.
However, while these problems affected performance, failure in each casewas ultimately due to the government’s ex post (political) failure to correctthese mistakes. The government lacked the political capacity to overridebusiness and consumer interest groups necessary to implement a viable sub-sidization strategy and, more crucially, to enforce the payment of tariffs in thecase of IWK. It failed to integrate both the LRT and public transport system,and reduce the use of private cars (all of which were central to increasing theLRT’s ridership and commercial viability) because it was unable to enforceconditionalities on the concessionaires, override private sector recalcitranceand obstructionism, and centralize planning and authority in order toimplement a coherent transport policy. It failed to address problems relatedto the airline industry (e.g. high capital costs and periodic downturns) andimplement a credible subsidization strategy (in the case of MAS’s loss-making domestic sector), and did not intervene despite being aware of mis-management and impropriety. (The fact that these problems were addressedonly after the airline’s renationalization further suggests that the govern-ment’s disciplinary capacity was constrained.) And it failed to enforcediscipline by reducing protection levels for Proton.
The question is then: what constrained the government’s ex post capacity?Understanding the sources of state capacity and failure is important if we areto establish why privatization failed and what conditions are necessary forsuccessful privatization. Theories addressing state failure and the literatureon the developmental state provide a more useful framework to analysefactors that are important for effective state intervention, based on theexperiences of the East Asian developmental states which Malaysia sought toemulate. State theories generally highlight the importance of autonomy orinsulation from social forces necessary for the state to develop and implementpolicy. At the same time, the state must also be connected to productivegroups in society (i.e. capitalists), in order to promote development. Thisapproach grounds state capacity within an analysis of social relations and thebalance of power in society.
However, developing countries often lack a capitalist class to undertakeeconomic investment. This means that the state’s connection with society will
Summary and conclusion 193

be with non-capitalist groups which are also often ‘unproductive’. Thestate will then have to create capitalists, usually through the creation of newproperty rights (e.g. through privatization) and by providing rents forlearning. The success of this will depend on the state’s ex post capacity todiscipline candidates by imposing conditionalities. The developmentalstate literature suggests that effective state intervention depends on the com-patibility of institutions and patterns of intervention with the balance ofpolitical power in society determined by the nature of social relations. Thestrength of the state in relation to various competing groups in society willdetermine the outcome, whether it is able to resist challenges by losers, andwhether critical incentive structures can be effectively enforced.
In the case of Malaysia, the state’s disciplinary capacity was constrainedby the personalized nature of patron–client networks which was the outcomeof increasing political contest in UMNO. The case studies highlight differentpolitical constraints faced by the state, and provide evidence of constraintsposed by patron–client networks. In the case of the LRT, both Systems 2 and3 were privatized to parties closely associated with either the Prime Ministeror Finance Minister. This may account for the government’s failure to dis-cipline the owner of KL Monorail who failed to meet the original target anddeadline, and instead successfully renegotiated the concession. It may alsoexplain why the owner of MAS received twice the market price for his 30 percent stake in the airline even after running up substantial debts, and despitethe government already controlling the airline through ownership of almosthalf the shares.
The government was unable to discipline the owner of Proton by reducingprotection levels, partly because of the enterprise’s national and economicsignificance but also because of the owner’s relationship with the PrimeMinister and the latter’s personal interest in the creation of a Malay-ownednational car. In the case of IWK, the government’s political failure to enforcepayment of tariffs (for industry and households) illustrates the basic fact thatthe operation of any private sector activities requires an underlying stateenforcement of rights and contracts.
This brings us to the conditions for successful privatization. Much of theliterature on privatization has been preoccupied mainly with the link betweenprivatization and performance. Poor privatization performance in developingcountries has been largely blamed on weak public institutions, the problemsof patronage and corruption associated with these, and arbitrary stateintervention. Proposed solutions thus usually involve strengtheningrelevant institutions to promote transparency and accountability, including aregulatory framework which safeguards the private sector from politicalintervention and which promotes competition. While these institutionalpreconditions are important and were not met in the case of Malaysia, thespecific conditions of developing country economies mean that even if theseinstitutions existed, privatization by itself would not necessarily have resultedin the appropriate improvements in economic performance. We have argued
194 Summary and conclusion

that it is more pertinent to ask why a different set of institutional failurespersisted which compromised the management of regulatory structures andof ongoing subsidies that were arguably necessary for the performance of theenterprises in the sectors we have looked at. We were concerned to explainwhy the government failed to rectify these issues, and for that matter, whyit proceeded with privatization in these sectors despite institutionalinadequacies. Our answer was to point out a range of institutional andpolitical constraints that operated both ex ante and ex post, and which col-lectively point to the importance of political constraints in the performanceof privatization in Malaysia. Effective regulation and the management ofsubsidies was undermined by institutional problems, but even more so, by thegovernment’s failure to enforce sanctions and take corrective measures whereneeded. Successful privatization thus depends not just on an appropriateinstitutional design that addresses the specific problems faced by the indus-tries being privatized, but also by the state’s political capacity to enforce andimplement the necessary regulatory structure, investments and financing.
Privatization should therefore only be undertaken if the state has both thenecessary institutional and political capacity to devise and enforce credibleregulatory and subsidization strategies. This means that the sectors appro-priate for privatization and the extent of privatization that is feasible dependson pre-existing institutional and political structures. The identification of thelimits of viable privatization can only be based on a country-specific casestudy approach in order to examine the nature of social relations and dis-tribution of power, and the specific technological and financial requirementsof the sectors being privatized. This approach may better inform the designof privatization strategies in developing countries in the future.
Summary and conclusion 195
Notes
2 Privatization, rents and rent-seeking
1 A more uncompromising view is that uneconomic services (e.g. loss-making butsocially desirable transport routes) do not make sense and should be abolished(e.g. see Hakim et al. 1996b). However, the alternative of addressing equitableaccess through a coupon system merely sidesteps the issue of who should pay foressential services.
2 Bardhan (2000) provides a critical discussion.3 Price cap regulation ‘caps’ prices and pegs price increases to an independent meas-
ure, usually determined by reference to the inflation rate and an assessment of thepotential for efficiency improvements (i.e. a retail price index, possibly adjusted forexpected efficiency gains). Rate of return regulation establishes an acceptable profiton the firm’s regulatory asset base after allowing for efficient capital and operatingcosts (Parker 2001: 14).
4 The developmental state ‘establishes as its principle of legitimacy its ability topromote and sustain development, understanding by development the combinationof high rates of growth and structural change in the productive system’ (see Castells1992: 56).
5 See Kessides (2004: 112) and Stottmann (2000).
3 Institutional and political failure: privatization in Malaysia
1 Malay businessmen have been variously categorized as independently wealthy(e.g. aristocrats), government proxies or rentiers (Tan T.W. 1982: 291); politiciansor aristocrats or those with close political connections with such people (Lim1981; Lim 1985: 54); and figurehead capitalists, executive professional and execu-tive-trustee directors, functional capitalists and bureaucrats-turned-businessmen)(Searle 1999: 81).
2 Even though Malay businessmen in parliament were small in absolute terms,their numbers were high relative to their proportion in Malay society (Neuman1971). Similarly, Malay politicians were overrepresented among Malay companydirectors, with the highest representation from UMNO (Lim 1981). For example,in 1972, 13.2 per cent of Malaysian directors were politicians, a ‘very high per-centage’ given the small size of MPs. Furthermore, 26 per cent of Malay directors(rising to 50 per cent if we include civil servants), compared to 6 per cent of non-Malay directors, had political backgrounds (Lim 1981: 55–61).
3 Malay classes have been categorized by income, with the middle class at RM3,600–RM7,000 per household per year and upper income at RM 12,000 (Aris Othman1977: 106).
4 The frustration of this group at making inroads into the modern sector was

directed primarily at the Chinese, and later, at the UMNO-led Alliance govern-ment (Searle 1999: 40).
5 Ethnic Malay business associations largely represented medium-scale enterprisesdependent on bureaucratic patronage (Felker 1999: 103).
6 Many Malay businessmen were present or past high-level UMNO officials and topcivil servants.
7 This group demanded Malay as the sole medium of instruction in order to benefitfrom higher education and government employment opportunities. Not coinci-dentally, UMNO’s heads of branches and committee members at the time ofIndependence were mainly teachers (Ahmad 1985: 90).
8 The system of ethnic recruitment which became the basis of quotas and privilegedaccess for Malays to the higher administrative positions was first introduced by theBritish for its Malay Administrative Service (Means 1986).
9 Malays were also designated a ‘priority group’ which required a minimum of20 per cent of new loans be allocated to Malay individuals or Malay-controlledcompanies (Searle 1999).
10 For example, loans below RM5,000 did not require collateral or a guarantor.11 Companies controlled by the government were skewed towards those with larger
paid-up capital and higher gross profits (Tan T.W. 1982).12 The government bailed out Bank Rakyat (after losses of RM65 million) in 1976
and Bumiputra Malaysia Finance (RM2.5 billion) in 1983 (Ismail and Osman1991: 88; also see e.g. Daim 1990: 32).
13 These were doctors, lawyers, engineers, veterinary surgeons, dentists, accountants,surveyors and architects.
14 Malay managers increased from 7,400 in 1971 to over 61,000 (1985) (Ismail andOsman 1991: 39).
15 This included the Economic Planning Unit (EPU), Public Service Department(PSD) and the Implementation and Coordination Unit (ICU).
16 These figures are argued to have been grossly underestimated to justify continuedredistributive policies under the NEP (Jomo 1990).
17 E.g. Pernas (the National Corporation), the Urban Development Authority(UDA) and State Economic Development Corporations (SEDCs).
18 Protests against economic reform and liberalization by this group led to resolu-tions at the Bumiputra National Economic Symposium (organized by the MalayChamber of Commerce and Industry) calling on the government to establish atrust fund to prevent the forfeiture of property used as collateral for loans and‘changing the rules of the game if necessary’ to make loans for Malays easier(Searle 1999: 53).
19 This included the transfer of profitable enterprises under Pernas (headed bythe Minister of Trade Tengku Razaleigh Hamzah who contested the UMNOpresidency) to PNB (which answered directly to Mahathir).
20 On the other hand, even when these proposals involved the private sector takingover the management/operation of existing state-run facilities, they were classifiedas new projects developed by the private sector (e.g. sewerage and garbage dis-posal, construction) (see Ismail and Lee 1990).
21 Nominees were used to hide ownership identities. In 2001, the governmentstopped this practice in order to improve transparency.
22 This (incomplete) list provided details of 171 privatizations between 1983 and1998, and was released at the 1998 UMNO General Assembly in response toallegations (by Anwar supporters) that privatizations were mainly awardedto supporters of Mahathir and Daim.
23 Eric Chia was authorized to run the state steel company Perwaja as if he owned it,and regularly reported directly to Mahathir who had to personally approve anyproject (Bernama, 20 September 2004). Perwaja was bailed out after incurring
Notes 197

huge losses and Chia was arrested and charged with dishonestly authorizing thepayment of RM76.4 million to another company after Mahathir stepped down asPrime Minister.
24 It is unclear whether savings in capital expenditure includes RM8.2 billion ofinfrastructural development from 1983 to February 1991 through BOT and BOcontracts (Malaysia 1991b).
25 An estimated RM362 million was foregone from the sale of MAS (RM68.25million), MISC (RM221 million), Tradewind (RM33.73 million) and Sports Toto(RM39.26 million) (Ismail and Lee 1990; Ismail 1991).
26 This was mainly in construction and real estate, where NPLs increased from16.8 and 8.3 per cent respectively by the end of 1998 to 29.7 per cent for bothsectors by the end of 1999 (Chin and Jomo 2001: 125–126).
27 The breakdown is as follows: 53,718 (1983–90); 43,038 (1991–95); 17,442 (1996–2000).
28 Powertek, Lingkaran Transkota, YTL Power International, Puncak Niaga andDigi.com.
29 By 12.6 per cent from RM37 billion (1995) to RM59 billion (1999) (Malaysia2001b).
30 From 26 per cent (1995) to 26.7 per cent (1999) (Malaysia 2001b).31 From RM4.15 billion (21.7 per cent) in 1983 to RM8.58 billion (25.6 per cent) as
at December 2000 (Malaysia 2001b).32 The NEP widened intra-ethnic inequality among Malays, concentrating wealth
and control of corporations in the hands of a very small number of Malay indi-viduals (Tan T.W. 1982; Schlossstein 1991). Of the two million Malay investors inthe National Unit Trust Scheme (ASN), less than 2 per cent managed to acquireshares above RM5,000 in 1990 (Ismail and Osman 1991).
33 According to Mahathir, ‘They must not be the kind of people who would sell theirshares for quick gains’ (Mahathir 1998a: 29).
34 It closed down two subsidiaries of the Lembaga Kemajuan Johor Tenggara (SouthEast Johor Development Authority) (KEJORA) in 1981 following huge losses forseveral years; served notices to other SOEs to perform; and later ordered forty-onesubsidiaries of various SEDCs to shut down (Tan C.K. 1984).
35 HICOM was also arguably driven by the personal preferences of Mahathir (thenMinister of Trade and Industry) for large-scale, often prestige projects, and hisdesire to promote Malay industry. This may explain why the government optedfor South Korea’s heavy industrialization model rather than Taiwan’s focus onsmall- and medium-scale industries (SMIs) which were dominated by Chinesefirms in Malaysia.
4 Universal access and private provision: Malaysia’s national seweragesystem
1 JKR was responsible for the planning, design and construction of infrastructureprojects; operation and maintenance of water supplies and specific governmentbuildings; and offered technical expertise to the various levels of government.
2 DOE monitored and enforced environmental standards such as pollution.3 United Utilities, NWW’s parent company, had previously secured a contract in
1989 to upgrade a water treatment plant in Ipoh.4 Berjaya Group was owned by Vincent Tan, a beneficiary of several privatization
projects, including Sports Toto (the state lottery) and the Kuala Lumpur monorailsystem.
5 According to a former IWK director, as the project was an unsolicited proposal tothe government, there was no guarantee it would be accepted and it depended ongovernment legislation (personal interview, 2003).
198 Notes

6 IWK was incorporated as Indah Water Management (M) Sdn Bhd, changing itsname to Indah Water Konsortium Sdn Bhd (IWK) on 13 May 1993.
7 AIMS Worldwide was controlled by Berjaya Group executive director GhaziHasbullah Ramli, who was also IWK’s executive chairman and a close friend ofAhmad Sebi (who later purchased IWK).
8 There is insufficient data on actual population coverage for the 48 major and 96smaller towns to separately determine whether these targets were met.
9 For example, IWK was later expected to provide treatment for ammonia pollutionin 5,200 plants which was estimated to involve an additional RM1 billion in capitalexpenditure (New Straits Times, 14 March 1998).
10 These included Jelutong, Bayan Baru and Padang Matsirat, and STPs and pipenetworks in Teluk Kemang and Sungala, Port Dickson. The STP in Kuah,Langkawi, was only 90 per cent constructed; connected sewerage services had notbeen implemented aside from Seremban Municipal Council; and 42 biosoil STPshad yet to be replaced (National Audit Department, Malaysia 2000).
11 IWK’s performance compared favourably with local authorities, where only 20 percent of the population was connected in Kelantan, and 3.2 per cent of septic tanksdesludged in 1999 (National Audit Department, Malaysia 2000).
12 The number of contravention licences, however, went down from 3,263 in 1997 to2,762 in 1998 (Water & Environment International, March 2000, 9 [66]).
13 This figure was reduced to RM84 million when LTAT opted for a moratorium forits portion (20 per cent) of the guaranteed profit.
14 IWK appointed three new directors (Jaganath Sabapathy, Surendran Palachan-dran and Albert Cheok) and retained five former directors (Ishak Ismail, ZulkifliAbdul Rahman, Ramli Ibrahim, Lodin Wok Kamaruddin and Gordon Tregaskis).
15 Personal interview (2003).16 According to the Sewerage Services Department, Malaysia (1998) and National
Audit Department, Malaysia (2000) respectively.17 According to a former IWK director, if the concessionaire exceeded the rate
of returns the amount charged would be reduced, and if it fell below a ‘neutralwindow’ it could increase charges (personal interview, 2003).
18 ‘There were no records because local authorities never visited the plants,performed maintenance or paid electricity for any of the plants’ (ibid).
19 Ibid.20 Ibid.21 The pricing mechanism was determined by the DGSS, initially by agreement,
which he could then adjust. Provisions were made for tariff reviews every five yearsor so in line with inflation and IWK’s capital works programme. The concessiondid not provide for a mechanism for arbitrating disputes (ibid).
22 ‘Local and state authorities took the opportunity to increase their revenueseven though it was likely that most local councils never budgeted for seweragetreatment in the first place’ (ibid).
23 Ibid.24 Personal interview (2003).25 According to the Deputy DGSS, this was based on sample audits by the DSS
and a quantitative audit was being put in place in late 2003 (personal interview,August 2003).
26 Each DSS branch was staffed by only three to six employees who were expected tocover large areas, including entire states.
27 Profit guarantee agreements were very difficult to enforce, and most of theguarantor companies had no money. Both the Royal Malaysian Police InvestmentCooperative and Armed Forces Savings Board (LTAT) refused to pay the profitguarantees as it was against their constitutions.
28 According a former IWK director (personal interview, 2003).
Notes 199

29 This excludes LTAT’s share.30 This ranged from RM10 per month to RM11,500 (unconnected) and RM15,000
(connected).31 According to the Deputy DGSS (personal interview, 2003).32 According to a former IWK director (personal interview, 2003).33 The highest number of debtors was in Johor (RM34 million) and lowest in Kuala
Lumpur (RM8.6 million) (The Sun, 8 March 1999) where customers were used topaying as this was included in their assessment charges, according to a formerIWK director (personal interview, 2003).
34 According to a former IWK director, there was a reluctance and some suspicionat the MoF, and IWK’s nominees were unable to ‘open doors’ as would havenormally been the case. ‘The government didn’t lend it the money it promised, andat the end of the day, the government brought it back into public ownership inorder to protect the position on operating expenditure; and the capital refurbish-ment had not really taken place’ (personal interview, 2003).
35 Ibid.36 According to a former IWK director and the Deputy DGSS (personal interviews,
2003).37 According to a senior executive at PUB in 2000 and former IWK executives in
2001 (e.g. see Far Eastern Economic Review, 27 September 2001).
5 The myth of privatized urban rail: Kuala Lumpur Light Rail Transit
1 This comprised US$548 million from Siam Commercial Bank (32.9 per centmajority owned by the Thai Ministry of Finance), US$424 million from Kreditan-stalt für Wiederaufbau (KfW) (the German development bank), and US$80million from the International Finance Corporation (IFC) (the World Bank’sinvestment arm), with US$676 million from equity contributors (including afurther US$20 million from the IFC).
2 This is an extensive system at 31.75 km with 57 stations.3 According to a senior manager at the Ministry of Finance (MoF) Special Task
Force for Public Transport in the Klang Valley (personal interview, 2003).4 These included the contract for Metrolink, the first stage of the LRT, awarded to
an Australian consortium in 1987, and a monorail project proposed by Hitachi ofJapan in the 1980s.
5 The company had worked in Malaysia for around 40 years and became aware ofthe project through its local contractor Teamwork. According to TaylorWoodrowInternational Operations Director, other bids were excluded in this period whilethe company created a financial appraisal ‘to allow the equity investors to thinkthey were making a good investment’. This took several years. The governmentwanted System 1 to be created in a stand-alone manner and independentlyfinanced, with a guaranteed income from operating revenue (personal interview,2003).
6 Adtranz provided the rail system and trains for System 1. It was later bought byBombardier.
7 This covered the construction cost, financing and pre-operating expenses fromJalan Ampang to the city centre.
8 This was issued by the Infrastructure Development Corporation, wholly owned bythe MoF.
9 Renong was to pledge PLUS (the North South Highway concessionaire) assecurity (The Edge, 12 October 1998).
10 This comprised RM719.8 million government support loans, RM466.6million government loan, RM32.7 million Khazanah loan, and RM1.29 billionEPF loan.
200 Notes

11 This comprised EPF (20 per cent); Lembaga Urusan Tabung Haji (15 per cent);KWAP (5 per cent); LTAT (5 per cent); and Khazanah (5 per cent).
12 Renong also received RM1.2 billion as part of the government’s RM5.1 billion ofsoft loans allocated to privatized projects (New Straits Times, 30 October 1996;The Edge, 17 November 1997).
13 This was repayable in 30 instalment between 2008 and 2022 at 5 per cent interest(STAR; The Edge, 15 January 2001; 5 June 2001).
14 This point was raised by several local and international consultants (personalinterviews, 2002–3) and more recently in the press, e.g. see AFP, 15 September2005 (‘Malaysian Construction Sector Riddled with Corruption’).
15 The internal rate of return was 15 per cent (STAR) and 11 per cent (PUTRA).16 According to a senior manager at the MoF Special Task Force for Public Trans-
port in the Klang Valley, the government left it to operators to determine optimumfares based on market sensitivity tests and was confident that fares would not beunderpriced (personal interview, 2003).
17 Ibid.18 According to Tai Tuck Leong, Perunding Traffik Klasik (the consultant for the
LRT system after renationalization) and a senior manager at the MoF SpecialTask Force for Public Transport in the Klang Valley (personal interviews, 2003);also see Hilmi (2003).
19 Personal interwiews as in n. 18, and Hilmi (2003).20 According to STAR CEO Zainal Ghani, STAR’s problem was in repaying RM2.1
billion in bank loans and RM685 million in government support loans (The Edge,19 July 1999).
21 PUTRA was also affected by its parent company’s debt load of around RM6.8billion. Renong was estimated to need to set aside at least RM1.8 billion in 1998–99 primarily to subscribe to Commerce Asset’s rights issue (RM179 million), andto complete Phase 2 of LRT System 2 (RM1.3 billion). Renong’s debt problemwas the consequence of embarking on several capital-intensive projects, includingSystem 2, simultaneously (The Edge, 13 July 1998).
22 According to the auditors’ report in KL Infrastructure Group’s financial state-ments for the year ended 30 April 2006.
23 Ibid, p. 8.24 According to Tai Tuck Leong (personal interview, 2003).25 According to a senior manager of the MoF Special Task Force for Public
Transport in the Klang Valley (personal interview, 2003).26 In addition, the government decided to extend a line south (Phase 2) for the 1998
Commonwealth Games through a sparsely populated area. As compensation,STAR received approval for a 3-km extension north into a high-density residentialarea (from Sultan Ismail to Sentul Timur) (Hilmi 2003).
27 The land was jointly owned by a Malaysian and a Singaporean company, thelatter reported to be unwilling to allow access, according to a senior manager ofthe MoF Special Task Force for Public Transport in the Klang Valley (personalinterview, 2003).
28 Ibid.29 According to Tai Tuck Leong (personal interview, 2003).30 Feeder bus operator Intrakota cited poor financial returns servicing these routes
(New Straits Times, 26 March 1998). STAR took over the feeder bus service inApril 1998 (Business Times, 26 March 1998; Malay Mail, 27 March 1998).
31 According to a senior manager of the MoF Special Task Force for Public Trans-port in the Klang Valley, commercial bus operators were represented by differentpolitical factions, each with its own political backers (personal interview,2003).
32 Ibid.
Notes 201

33 DBKL and the government conducted separate studies for an ARP in 1991 (NewStraits Times, 6 August 1991; Business Times, 20 November 1991). In 1993, thecentral bank’s annual report pointed out that the LRT system should be comple-mented with traffic restrictions in the city centre to effectively reduce congestion(Bank Negara Malaysia [1993], cited in Malay Mail, 31 March 1993).
34 Local by-laws did not allow DBKL to dictate rates for private car park operatorsbut this was recently amended and DBKL can now specify parking charges. Theresult has been a gradual increase in parking fares in the city centre.
35 According to Tai Tuck Leong (New Straits Times, 12 October 1995).36 According to DBKL Urban Transportation Division Director Mahfix Omar
(Business Times, 17 February 1993).37 According to a senior manager of the MoF Special Task Force for Public Trans-
port in the Klang Valley, establishing a transport authority was difficult, even after20 years. The absence of a central transport authority and laws also complicatedthe introduction of ARP as it was unclear who would receive revenues collected(personal interview, 2003).
38 Ibid.39 For example, one of the Ministry of [Malay] Entrepreneur Development’s objec-
tives was to encourage the development of small businesses (such as KualaLumpur’s mini buses), but it was also responsible for implementing the policy fortwo lead bus operators (Halcrow Consultants 1999).
40 For example, a three-ministry task force set up in 1996 to conduct a comprehensivestudy on the public transport sector comprised the Ministries of Transport,Entrepreneur Development, and Culture, Arts and Tourism (Business Times, 22March 1996).
41 According to a senior manager of the MoF Special Task Force for Public Trans-port in the Klang Valley (personal interview, 2003); also see Business Times,5 February 1997.
6 Perverse incentives: Malaysia Airlines
1 The company is registered as Malaysian Airline but is officially known as MalaysiaAirlines as stated on its logo.
2 According to court documents filed by the owner in his countersuit of Danaharta,the state asset management company, in 2006 (see The Sun, 6 July 2006).
3 According to industry sources, there is suggestion that some banks were instructedto lend while others willingly did so in the context of rapid economic growth andprojections of MAS share prices rising from RM8 to RM15 (personal interviews,2003).
4 According to a former MoF representative on the MAS board, aircraft werebought at a very high cost through a third party related to the new owner, andmany similar transactions were at uncompetitive rates and went through theowner’s companies. This was also raised by several investment analysts (personalinterviews, 2002–3).
5 Between the peninsular states and Sabah and Sarawak in east Malaysia.6 The residual value is the scrap value of an asset. By increasing the scrap value,
the amount to be depreciated falls, so there is less to be depreciated over thesame number of years, leaving more for profits. Simple depreciation is cal-culated by subtracting the residual from the asset value and then dividing by thenumber of years. Therefore, by increasing the residual value, the amount to bedepreciated (asset value minus residual) over the same number of years becomessmaller.
7 Corporatization is seen as the first stage of divestiture.8 This involved the sale of 35 million existing ordinary shares for RM63 million, 70
202 Notes

million new ordinary shares for RM126 million, and an estimated RM283 millionfrom a second sale to foreigners at a considerably higher price.
9 According to court documents filed by Tajudin in his countersuit of Danaharta(see The Sun, 6 July 2006).
10 Through KWAP (the state pension fund) (11.6 per cent), Skim Amanah SahamBumiputra (9.8 per cent) and the Employees Provident Fund (EPF) (5.8 per cent).Another 5 per cent was owned by the State Secretary of Sabah, on behalf of thatstate government.
11 This followed KWAP increasing its stake in MAS to 20.04 per cent through thepurchase of an additional 9 per cent (72.12 million) MAS shares from the BruneiInvestment Agency at RM4 each for RM280 million (Business Times, 4 December2000, 12 December 2000; The Edge, 11 December 2000).
12 This figure uses combined data from ICAO and MAS due to the unavailability ofICAO data for 1992–93.
13 ATK per employee is dependent on the cost of employees in relation to the outputthey generate, and not number of employees; hence, ATK per employee perUS$1,000 labour costs would be more indicative of productivity if the data wasavailable.
14 According to a private consultant responsible for the post-privatization restruc-turing of MAS (personal interview, 2003).
15 Average debt ratio = (long-term debt + leases) divided by (LTD + equity + leases).16 Average debt equity ratio = LTD + (leases divided by equity).17 Average interest cover = operating profits divided by interest.18 Return on assets (ROA) = EBIT minus tax divided by average total sales
(i.e. revenue).19 According to Tajudin in court documents filed in 2006 (The Sun, 6 July 2006).20 Note that debt figures quoted here may differ from figures in the tables depending
on the actual date.21 This increased from US$7 a barrel in August 1995 to a three-year high at
US$27.50 in December 1995 (Business Times, 13 December 1995).22 According to the former head of the Corporate Debt Restructuring Committee
[CDRC]) (personal interview, 2003).23 This point was raised by industry consultants, investment analysts and business
journalists (personal interviews, 2002–3).24 Tajudin was general manager of UDA Merchant Bank, which no longer exists.25 According to a former MoF representative on the MAS board (personal interview,
2003).26 This comprised one (of 52) Boeing 747–400, 18 Boeing 737–400, two (of six)
Boeing 737–500, one de Havilland Canada DHC-6 (Malaysia Airlines 1993).27 This comprised 21 Boeing 737–400/500 and six Boeing 747–400.28 This comprised 10 Boeing 747–400 and 15 Boeing 777–200ER.29 This was first reported by Asian Wall Street Journal (25 September 1995).30 According to a private consultant responsible for the post-privatization restruc-
turing of MAS (personal interview, 2003).31 This was also raised by a former MoF representative on the MAS board, private
consultant responsible for the post-privatization restructuring of MAS, and AsianWall Street Journal journalist (personal interviews, 2002–3).
32 According to a private consultant responsible for the post-privatization restruc-turing of MAS (personal interview, 2003).
33 ACL operated a cargo facility in Hahn, Germany, that MAS contracted to use asits global cargo hub in 1999. However, the Hahn cargo centre was 110 kilometresby road to Frankfurt International Airport.
34 Tajudin faced similar allegations following his resignation from Celcom, where thenew management lodged a police report over RM260 million of fictitious invoices
Notes 203

made to the group between 1998 and 1999, and sought to recover RM185 millionfrom share deals and around RM50 million in unauthorized payments madeto three former directors (including Tajudin) for termination of services and acompany car (The Star, 13 September 2002).
35 According to a former MoF representative on the MAS board (personal interview,2003).
36 Financial benchmarks included targets for passenger revenue, load factors, fuelcost and consumption, comparing pre-budget and actual data, with variances tobe shared between MAS and the state-owned PNB on a pre-determined basis(with a range of 10–50 per cent depending on the item). Operational benchmarkscovered safety, security, punctuality and service (Nomura Asian Equity Research,29 November 2002).
7 Rents and industrial upgrading: Proton
1 This eventually led to EON’s majority shareholder UMW (which also owned theToyota franchise) being bought out by the Ministry of Finance (MoF), MC andMMC in February 1989.
2 Eleven assemblers produced 25 makes and 122 models of commercial andpassenger vehicles, with local content at 8 per cent (Doner 1991).
3 HICOM was initiated by Mahathir Mohamad, as Minister of Trade and Industry,and established with three priority investments: an integrated steel plant, a cementfactory and an automotive plant.
4 Daihatsu later became technical partner in Perodua, the second national carproject, which essentially involved the assembly and rebadging of Daihatsu carsrestricted to below 1,000cc.
5 Its main shareholders were HICOM (29.2 per cent), the MoF (17.8 per cent), MC(8.7 per cent), MMC (8.7 per cent), and PNB, the National Equity Corporation(2.9 per cent) (Business Times, 10 January 1992).
6 HICOM’s share price was RM4.52–RM4.78 in the week before and after theprivatization. The deal was financed through an offshore bank in Labuan (NewStraits Times, 20 October 1995, 7 August 1999).
7 Yahaya was regional/general franchise manager at Wearnes Brothers and executivedirector at Wira Wearnes. He started up Automotive Corporation (M) Sdn Bhdin 1979, auto assembler Master-Carriage (with Saleh Sulong) in 1980, MasterRadiators Sdn Bhd, Master Seats Sdn Bhd, Auto Elegance Car Centre Sdn Bhd(later renamed USPD), Automotive Manufacturers (M) Sdn Bhd (AMM), andAuto Prominence (M) Sdn Bhd.
8 This was reported to have boosted Yahaya’s bid for Proton, allowing him to beat amanagement buyout by previous Proton managing director Mohd Nadzmi andother senior Proton executives (The Star, 16 March 1996; Asiaweek, 11 April1997).
9 See The Edge, 29 September 1997, 1 December 1997, 4 September 1998,11 September 1998.
10 There were no indications that any of Proton’s 6,000 staff was retrenched, accord-ing to a former Proton senior marketing executive (personal interview, 2003) andTA Securities (11 June 1998). Also see Business Times (10 January 2002).
11 Around 40 per cent of Proton’s cost was in yen.12 According to Proton’s alternate director Fumio Yoshimi (New Straits Times,
22 July 2000).13 JIT aims to reduce inventory costs and capital for warehouses by supplying goods
just as needed.14 According to a former Proton senior marketing executive (personal interview,
2003).
204 Notes

15 Proton’s market share was expected to shrink from 65 to 55 per cent upon imple-mentation of the CEPT, and then to 30 per cent over five years (if the CEPT wasintroduced in 2003), and to drop to 50 per cent immediately and decline to 20 percent over the next seven years (if the CEPT was introduced in 2000) (DRB-HICOM circular to shareholders, 8 September 2000; Business Times, 8 September2000; TA Securities, 26 July 2000).
16 Toyota Vios 1.5 (RM72,607), Honda City 1.5 (RM76,676), Kia Spectra(RM69,000), Hyundai Accent 1.5 (circa RM50,000) and Chevrolet Aveo 1.5(RM65,000).
17 According to a former Proton senior marketing executive (personal interview,2003).
18 According to Leonard Khong, a Malaysian motoring journalist (personal inter-view, 2003).
19 This was in collaboration with Michigan Automotive Research and Germancompany EDAG Engineering and Design.
20 According to Peter Chong (auto analyst at SalomonSmithBarney) (personalinterview, 2003); also see The Edge, 22 July 2002.
21 See e.g. Auto Trader <http://ces.autotrader.co.uk/ces/roadtest.do?usedCar=0&capcode=PRG216GSX5HPIM%20%20%20%20%20%20&rtid=211080&price=10406> and the Automobile Association <http://www.theaa.com/allaboutcars/carsearch/carsearch_cartest_reports.jsp?carTest=carTest&latestReports=n&modelID=A8&modelName=GEN-2&makeName=Proton> (both accessed3 February 2007).
22 According to Peter Chong (personal interview, 2003).23 Proton later acquired another 15 per cent of USPD from Khazanah for RM81
million.24 This entailed a minimum order of 100,000 cars a year, with Proton able to appoint
other ‘super dealers’.25 Mahathir later complained that the Japanese were ‘dragging their feet’ on tech-
nology transfer, with Proton having to pay royalties for incomplete technology(Business Times, 20 May 1993; Asiaweek, 4 November 1997).
26 An imported engine block constituted 40 per cent of final cost.27 According to a former Proton senior marketing executive (personal interview,
2003).28 According to Proton managing director Mohd Nadzmi (The Star, 23 January
1995).29 According to DRB-HICOM chairman Saleh Sulong, offers by Ford and
DaimlerChrysler were not accepted, as ‘shareholding has to be majorityMalaysian because it is a national car company’ (Malaysian Business, 1 April2000).
30 Proton’s board of directors was eventually able to sack Mahaleel in July 2005(AutoAsia E-newsletter, 26 July 2005).
Notes 205

References
Adam, C. and Cavendish, W. (1995) ‘Early Privatizations’, in Jomo K.S. (ed) Pri-vatization in Malaysia: Rents, Rhetoric, Realities, London: Westview Press.
Ahmad Atory Hussain (1985) Pembentukan Dasar Awam Malaysia [Malaysia’sPublic Policy Formation], Kuala Lumpur: Utusan Publications.
Alavi, H. (1982) ‘State and Class Under Peripheral Capitalism’, in H. Alavi andT. Shanin (eds) Introduction to the Sociology of ‘Developing Countries’, London:Macmillan Press.
Alavi, R. (1996) Industrialisation in Malaysia: Import Substitution and Infant IndustryPerformance, London: Routledge.
—— (1998) ‘Management of Protection Policy: Lessons from Malaysian Experience’,in Ishak Yussof and Abdul Ghafar Ismail (eds) (1998) Malaysian Industrialisation:Governance and the Technical Change, Bangi: Penerbit Universiti KebangsaanMalaysia.
—— (1999) ‘Rents, Technological Innovation and Firm Competitiveness in a Bumi-putra Malaysian Firm’, in Jomo K.S., G. Felker, and R. Rasiah (eds) IndustrialTechnology Development in Malaysia: Industry and Firm Studies, London: Routledge.
Alchian, A. and Demsetz, H. (1972), ‘Production, Information Costs, and EconomicOrganisation’, American Economic Review, 62: 777–795.
Amsden, A. (1989) Asia’s Next Giant: South Korea and Late Industrialization, NewYork: Oxford University Press.
Aoki, M., Kim, H.K. and Okuno-Fujiwara, M. (eds) (1997) The Role of Governmentin East Asian Economic Development: Comparative Institutional Analysis, Oxford:Clarendon Press.
Applebaum, R. and Henderson, J. (eds) (1992) States and Development in the AsianPacific Rim, London: Sage Publications.
Arab-Malaysian Merchant Bank [AMMB], Arthur D. Little, Nik Saghir and Ismail(1995). Government of Malaysia: Post Privatization Study, Volume I, Centre forPolicy Studies, October.
Aris bin Othman (1977) ‘Growth, Equality and Poverty in Malaysia, 1957–1980’,PhD dissertation, Boston University.
Arrow, K. (1962) ‘The Economic Implications of Learning by Doing’, Review ofEconomic Studies, 29: 155–173.
Asia Equity (1997) ‘Proton’, stock analysis, March.Aston, T.H. and Philpin, C.H.E. (eds) (1985), The Brenner Debate: Agrarian Class
Structure and Economic Development in Pre-Industrial Europe, Cambridge: Cam-bridge University Press.
Aziz Zariza Ahmad (1997) Mahathir’s Paradigm Shift, Taiping: Firma.Bagwell, P. (2004) ‘The Sad State of British Railways: The Rise and Fall of Railtrack,
1992–2002’, Journal of Transport History 25 (2).Bailey, E. and Pack, J. (eds) (1987) The Political Economy of Privatization and Deregu-
lation, Aldershot: Edward Elgar.Bando, T. (2000) ‘Future of the Malaysian National Car Project’, Asian Economic
Review, 4th Quarter.Barclays de Zoete Wedd (1994) ‘Malaysia Airlines’, stock analysis, April–June.Bardhan, P. (ed) (1989a) The Economic Theory of Agrarian Institutions, Berkeley:
University of California Press.—— (1989b) ‘Alternative Approaches to Theory of Institutions in Economic
Development’, in P. Bardhan (ed) The Economic Theory of Agrarian Institutions,Berkeley: University of California Press.
—— (1997) ‘Corruption and Development: A Review of Issues’, Journal of EconomicLiterature, September (35): 1320–1346.
—— (2000) ‘The Nature of Institutional Impediments to Economic Development’, inM. Olson, and S. Kähkönen (eds) A Not-so-Dismal Science: A Broader View ofEconomies and Societies, Oxford: Oxford University Press.
Barraclough, S. (2000), ‘The Politics of Privatisation in Malaysia’, ContemporarySoutheast Asia, 22 (2): 344–357.
Barrett, T. (1999) ‘PPPs in the Financing of European Transport Infrastructure’,European Conference of Ministers of Transport (ECMT) Seminar on Public-Private Partnerships (PPPs) in Transport Infrastructure Financing, Paris, 12January <http://www.cemt.org/online/ppp99/Barrett.pdf> (accessed 13 February2007).
Bates, R. (2001) Prosperity and Violence, New York: W.W. Norton & Company.Batley, R. (1996) ‘Public-Private Relationships and Performance in Service Provision’,
Urban Studies, 33 (4–5): 723–751.Bell, M., Rosa-Larson, B. and Westphal, L. (1984) ‘Assessing the Performance of
Infant Industries’, Journal of Development Economics, 16: 101–128.Bhagwati, J. (1982) ‘Directly Unproductive, Profit-Seeking Activities’, Journal of
Political Economy, 90 (5): 988–1002.Bienen, H. and Waterbury, J. (1989) ‘The Political Economy of Privatization in
Developing Countries’, in P. Cook and C. Kirkpatrick (eds) (2000a) Privatizationin Developing Countries, Volume II, Cheltenham: Edward Elgar Publishing.
Bishop, M. and Kay, J. (1989) ‘Privatization in the United Kingdom: Lessons FromExperience’, World Development 17: 643–657.
Biswas, A.K. (2000) ‘Water For Urban Areas of the Developing World in the Twenty-First Century’, in J. Uito and A.K. Biswas (eds) Water for Urban Areas: Challengesand Perspectives, New York: United Nations University Press.
BKWPPLK (Bahagian Kemajuan Wilayah Persekutuan dan Perancang LembahKlang) (1988) ‘Wilayah Lembaga Klang Maklumat Asas’ [Klang Valley GeneralInformation] (Volume III), Kuala Lumpur: Prime Minister’s Department.
Bloomfield, G. (1978) The World Automotive Industry, Newton Abbot: David andCharles.
—— (1991) ‘The World Automotive Industry in Transition’, in C.M. Law (ed) (1991a)Restructuring The Global Automobile Industry, London: Routledge.
Bowie, A. (1988) ‘Redistribution with Growth? The Dilemmas of State-SponsoredEconomic Development in Malaysia’, in J. Ravenhill, (ed) (1995) Singapore,
References 207

Indonesia, Malaysia, The Philippines and Thailand Volume I, Aldershot: EdwardElgar Publishing.
—— (1991) Crossing The Industrial Divide (State, Society and the Politics of EconomicTransformation in Malaysia), New York: Columbia University Press.
Boycko, M., Shleifer, A. and Vishny, R. (1996) ‘A Theory of Privatization’, TheEconomic Journal, 106 (435): 309–319.
Brenner, R. (1976) ‘Agrarian Class Structure and Economic Development inPre-Industrial Europe’, Past and Present, 70 (Feb): 30–75.
—— (1985) ‘The Agrarian Roots of European Capitalism’, in T.H. Aston andC.H.E. Philpin (eds), The Brenner Debate: Agrarian Class Structure and EconomicDevelopment in Pre-Industrial Europe, Cambridge: Cambridge University Press.
Brownbridge, M. and Kirkpatrick, C. (2000) ‘Financial Regulation in DevelopingCountries: Survey Article’, Journal of Development Studies, 37 (1): 1–24.
Bruton, H. (1992) Sri Lanka and Malaysia, Washington: Oxford UniversityPress.
—— (1998) ‘A Reconsideration of Import Substitution’, Journal of Economic Litera-ture, 36, June.
Buchanan, J. (1980) ‘Rent Seeking and Profit Seeking’, in J. Buchanan, R. Tollisonand G. Tullock (eds) Toward A Theory of Rent Seeking Society, Austin: TexasUniversity Press.
Buchanan, J., Tollison, R. and Tullock, G. (eds) (1980) Toward A Theory of RentSeeking Society, Austin: Texas University Press.
Campos, J.E. and Esfahani, H.S. (1996) ‘Why and When Do Governments InitiatePublic Enterprise Reform?’, in P. Cook and C. Kirkpatrick (2000a) Privatization inDeveloping Countries Volume I, Cheltenham: Edward Elgar Publishing.
Castells, M. (1992) ‘Four Asian Tigers with a Dragon Head: A Comparative Analysisof the State, Economy and Society in the Asia Pacific Rim’, in R. Applebaum andJ. Henderson (eds) States and Development in the Asian Pacific Rim, London: SagePublications.
Cathay Pacific Airways (1995) Annual Report, Hong Kong: Cathay Pacific Airways. —— (1996) Annual Report, Hong Kong: Cathay Pacific Airways.—— (1997) Annual Report, Hong Kong: Cathay Pacific Airways. —— (1998) Annual Report, Hong Kong: Cathay Pacific Airways. Chang H.J. (1993) ‘The Political Economy of Industrial Policy’, Cambridge Journal
of Economics, 17: 131–157.—— (1999) ‘The Economic Theory of the Developmental State’, in M. Woo-
Cummings (ed) The Developmental State, London: Cornell UniversityPress.
—— (2002). Kicking Away the Ladder: Development Strategy in Historical Perspective,London: Anthem Press.
—— (ed) (2003) Rethinking Development Economics, London: Anthem Press.Chang H.J. and Singh, A. (1992) ‘Public Enterprises in Developing Countries
and Economic Efficiency’, Geneva: United Nations Conference on Trade andDevelopment.
—— (1993) ‘Public Enterprises in Developing Countries and Economic Efficiency:A Critical Examination of Analytical, Empirical and Policy Issues’, Geneva:UNCTAD Review 4.
—— (1997) ‘Can Large Firms Be Run Efficiently Without Being Bureaucratic?’,Journal of International Development, 9 (6): 865–875.
208 References

Chee P.L. and Fong C.O. (1983) ‘Ancillary Firm Development in the MalaysianMotor Vehicle Industry’, in K. Odaka (ed) The Motor Vehicle Industry in Asia,Singapore: Singapore University Press.
Chin K.F. and Jomo K.S. (2000) ‘Financial Sector Rents in Malaysia’, in M.H. Khanand Jomo K.S. (eds) Rents, Rent Seeking and Economic Development, Cambridge:Cambridge University Press.
—— (2001) ‘Financial Liberalisation and System Vulnerability’, in Jomo K.S. (ed)Malaysian Eclipse: Economic Crisis and Recovery, London: Zed Books.
Choi B.S. (1993) ‘Financial Policy and Big Business in Korea: The Perils of FinancialRegulation’, in S. Haggard, Lee, C.H. and S. Maxfield (eds) The Politics of Financein Developing Countries, London: Cornell University Press.
City Hall Kuala Lumpur (undated) Draft Structure Plan Kuala Lumpur 2020, KualaLumpur: City Hall Kuala Lumpur.
Clague, C. (1997a) Institutions and Economic Development, London: The JohnsHopkins University Press.
—— (1997b) ‘The New Institutional Economics and Economic Development’, inC. Clague (ed) Institutions and Economic Development, London: Johns HopkinsUniversity Press.
Clague, C., Keefer, P., Knack, S. and Olson, M. (1997) ‘Democracy, Autocracy, andInstitutions Supportive of Economic Growth’, in C. Clague (ed) Institutions andEconomic Development, London: Johns Hopkins University Press.
Clarke, T. and Pitelis, C. (eds) (1993) The Political Economy of Privatisation, London:Routledge.
Cobb, M.J. (2004) ‘Mass Transit System: Planning & Financing the ‘Mega Projects’’,IDC International Development Consultants, LLC <http://www.idcworld.com/bangkok.htm> (accessed 13 February 2007).
Cook, P. (1997) ‘Privatization, Public Enterprise Reform and the World Bank:Has ‘Bureaucrats in Business’ Got It Right?’, in P. Cook and C. Kirkpatrick (eds)(2000a) Privatization in Developing Countries Volume II, Cheltenham: EdwardElgar Publishing.
—— (1999) ‘Privatization and Utility Regulation in Developing Countries: TheLessons So Far’, Annals of Public and Cooperative Economics, 70 (4): 549–587.
Cook, P. and Kirkpatrick, C. (1988) ‘Privatisation in Less Developed Countries: AnOverview’, in P. Cook and C. Kirkpatrick (eds) (2000a) Privatization in DevelopingCountries Volume I, Cheltenham: Edward Elgar Publishing.
—— (1995) ‘Privatisation Policy and Performance’, in P. Cook and C. Kirkpatrick(eds) (2000b) Privatization in Developing Countries Volume II, Cheltenham: EdwardElgar Publishing.
—— (eds) (2000a) Privatization in Developing Countries Volume I, Cheltenham:Edward Elgar Publishing.
—— (eds) (2000b) Privatization in Developing Countries Volume II, Cheltenham:Edward Elgar Publishing.
Cook, P. and Minogue, M. (1990) ‘Waiting for Privatisation in Developing Countries:Towards the Integration of Economic and non-Economic Explanations’, in P. Cookand C. Kirkpatrick (eds) (2000b) Privatization in Developing Countries Volume II,Cheltenham: Edward Elgar Publishing.
Cook, P. and Uchida, Y. (2003) ‘Privatisation and Economic Growth in DevelopingCountries’, Journal of Development Studies, August, 39 (6): 121–154.
Cornia, G.A. (2003) ‘Globalization and the Distribution of Income Between and
References 209
Within Countries’, in H.J. Chang (ed) Rethinking Development Economics, London:Anthem Press.
Correia, F. (ed) (1998) Institutions for Water Resources Management in Europe Volume1, Rotterdam: A.A. Balkema.
Cox, W. (1997) ‘New Urban Rail In America: Exorbitant Costs, Negligible Benefits’,Engineering News Record, December 16. <http://www.publicpurpose.com/pp-rail.htm> (accessed 13 February 2007).
Crone, D.K. (1995) ‘State, Social Elites and Government Capacity in Southeast Asia’,in J. Ravenhill (ed) Singapore, Indonesia, Malaysia, The Philippines and ThailandVolume I, Aldershot: Edward Elgar Publishing.
Crouch, H. (1992) ‘Authoritarian Trends, the UMNO Split and Limits to StatePower’, in J. Kahn and F. Loh (eds) Fragmented Vision: Culture and Politics inContemporary Malaysia, Sydney: Allen and Unwin.
—— (1993) ‘Malaysia: Neither Authoritarian Nor Democratic’, in K. Hewison,R. Robison and G. Rodan (eds) Southeast Asia in the 1990s: Authoritarianism,Democracy and Capitalism, Sydney: Allen & Unwin.
—— (1996) Government and Society in Malaysia, New York: Cornell University Press.Daim Zainuddin (1990) ‘The Malaysian Economy in 1990’, in Daim Zainuddin (1996)
Daim Speaks His Mind, Petaling Jaya: Pelanduk. —— (1996) Daim Speaks His Mind, Petaling Jaya: Pelanduk.Daniels, R. and Trebilcock, M. (2000) ‘An Organisational Analysis of the Public-
Private Privatization’, in P. Rosenau (ed) Public-Private Policy Partnerships,London: The MIT Press.
Davies, R.E.G. (1964) A History of the World’s Airlines, London: Oxford UniversityPress.
Doganis, R. (1991) Flying Off Course: The Economics of International Airlines,London: Harper Collins Academic.
Doner, R. (1991) Driving a Bargain: Automobile Industrialization and Japanese Firmsin Southeast Asia, Berkeley: University of California Press.
Dunn, J. Jr. (2000) ‘Transportation: Policy-Level Partnerships and Project BasedPartnerships’, in P. Rosenau (ed) Public-Private Policy Partnerships, London: TheMIT Press.
Edgren, G. (ed) The Growing Sector: Studies of Public Sector Employment in Asia,New Delhi: ILO-ARTEP.
Edwards, C. (1992) ‘Managing Structural Change and Industrialisation: ForeignInvestment and Industrialisation in Malaysia’, paper presented at the ISI-HIIDConference on the Malaysian Economy, June 1–13.
Estache, A. (2003) ‘Privatization in Latin America: The Good, The Ugly, and TheUnfair’ (first draft, August 14), The World Bank and ECARES, Université Libre deBruxelles.
Evans, P. (1994) ‘The State as Problem and Solution: Predatory Developmental, andOther Apparatuses: A Comparative Political Economy Perspective on the ThirdWorld State’, in A. Kincaid and A. Pates (eds) Comparative National Development,Society and Economy in the New Global Order, Chapel Hill: University of NorthCarolina Press.
—— (1995) Embedded Autonomy, Cambridge: Policy Press.Fayard, A. (1999), ‘Overview of the Scope and Limitations of Public-Private Partner-
ships’, Paris: Seminar on Public-Private Partnerships (PPPs) in Transport Infra-structure Financing, European Conference of Ministers of Transport.
210 References

Felker, G. (1993) ‘Political Economy and Malaysian Technology Policy’, in Jomo K.S.(ed) Industrialising Malaysia: Policy, Performance, Prospects, London: Routledge.
—— (1998) ‘Political Economy and Malaysian Technology Policy’, in Ishak Yussofand Abdul Ghafar Ismail (eds) Malaysian Industrialisation: Governance and theTechnical Change, Bangi: Penerbit Universiti Kebangsaan Malaysia.
—— (1999) ‘Malaysia’s Innovation System’, in Jomo K.S. and G. Felker (eds) Tech-nology, Competitiveness and The State: Malaysia’s Industrial Technology Policies,London: Routledge.
Fine, B. (1997) ‘Privatization: Theory and Lessons from the UK and South Africa,Seoul Journal of Economics, 10 (4), 373–414.
—— (2003) ‘Beyond the Developmental State: Towards a Political Economy ofDevelopment’, in Hirakawa, H, Noguchi, M. and Sano, M. (eds) Beyond Market-Driven Development: A New Stream of Political Economy of Development, Tokyo:Nihon Hyoron Sha.
Flyvbjerg, B., Holm, M.S. and Buhl, S. (2002) ‘Underestimating Costs in PublicWorks Projects: Error or Lie?’, APA Journal, 68 (3) Summer.
Galal, A. and Shirley, M. (1994) Does Privatization Deliver?: Highlights from a WorldBank Conference, Washington DC: World Bank.
Galal, A., Jones, L., Tandon, P. and Vogelsang, I. (1994a) Welfare Consequences ofSelling Public Enterprises, Washington DC: Oxford University Press (The WorldBank).
—— (1994b) ‘Divestiture: Questions and Answers’, in A. Galal, L. Jones, P. Tandonand I. Vogelsang Welfare Consequences of Selling Public Enterprises, Washington:Oxford University Press (The World Bank).
Gale, B. (1981) Politics and Public Enterprise in Malaysia, Singapore: Eastern Uni-versities Press.
Ghosh, B.N. (1999) ‘Privatization: The ASEAN Experience’, Indian Journal ofEconomics, January.
Goh C.T. (1971) The May Thirteenth Incident, Kuala Lumpur: Oxford University Press.Goh, W. and Jomo K.S. (1995). ‘Efficiency and Consumer Welfare’, in Jomo K.S. (ed)
Privatizing Malaysia: Rents, Rhetoric, Realities, Boulder: Westview Press.Gomez, E.T. (1990) Politics in Business: UMNO’s Corporate Investments, Kuala
Lumpur: Forum Enterprises.—— (1991) Money Politics in the Barisan Nasional, Kuala Lumpur: Forum.—— (1994) Political Business: Corporate Involvement in Malaysian Political Parties,
Queensland: James Cook University.—— (1997) ‘Privatised Patronage: The Economics and Politics of Privatisation in
Malaysia’, Journal of the Asia Pacific Economy, 2 (2): 178–200.—— (1999) Chinese Business in Malaysia, Surrey: Curzon Press.—— (ed) (2002a) Political Business in East Asia, London: Routledge.—— (2002b) ‘Introduction: Political Business in East Asia’, in E.T. Gomez (ed)
(2002a), Political Business in East Asia, London: Routledge.—— (2002c) ‘Political Business in Malaysia: Part Factionalism, Corporate Develop-
ment, and Economic Crisis’, in E.T. Gomez (ed) (2002a), Political Business in EastAsia, London: Routledge.
Gomez, E.T. and Jomo K.S. (1997) Malaysia’s Political Economy: Politics, Patronageand Profits, Cambridge: Cambridge University Press.
Gouri, G. (1991) Privatisation and Public Enterprises: The Asia-Pacific Experience,New Delhi: Oxford University Press and IBH Publishing.
References 211

Gouri, G., Sankar, T.L., Reddy, Y.V. and Shams, K. (1991) ‘Imperatives and Per-spectives’, in G. Gouri (ed) Privatisation and Public Enterprise: The Asia-PacificExperience, New Delhi: Oxford University Press and IBH Publishing.
Gwynne, R. (1991) ‘New Horizons? The Third World Motor Vehicle Industry in anInternational Framework’, in C.M. Law (ed) (1991a) Restructuring The GlobalAutomobile Industry, London: Routledge.
Haggard, S. (1997) ‘Democratic Institutions, Economic Policy, and Development’, inC. Clague (ed) Institutions and Economic Development, London: Johns HopkinsUniversity Press.
Haggard, S. and Maxfield, S. (1999) ‘Political Explanations of Financial Policy inDeveloping Countries’, in S. Haggard, Lee C.H. and S. Maxfield (eds) The Politicsof Finance in Developing Countries, London: Cornell University Press.
Haggard, S., Lee C.H. and Maxfield, S. (eds) (1999) The Politics of Finance in Develop-ing Countries, London: Cornell University Press.
Hakim, S., Seidenstat, P. and Bowman, G. (1996b) ‘Review and Analysis of Privatiza-tion Efforts in Transportation’, in S. Hakim, P. Seidenstat and G. Bowman (eds)Privatizing Transportation Systems, London: Praeger.
—— (eds) (1996a) Privatizing Transportation Systems, London: Praeger.Halcrow Consultants (1999) ‘Kuala Lumpur Public Transport Restructuring Final
Report’, Kuala Lumpur: Corporate Debt Restructuring Committee.Harriss, J., Hunter, J. and Lewis, C. (eds) The New Institutional Economics and Third
World Development, London: Routledge.Harris, N. (1999) ‘Competitive Strategies for Railways in the UK: A Corporate
Perspective’, Transport Reviews, 19 (2): 191–202.Heilman, J. and Johnson, G. (1992) The Politics and Economics of Privatization, Lon-
don: University of Alabama Press.Hemming, R. and Mansoor, A. (1988) ‘Privatization and Public Enterprises’, in
P. Cook and C. Kirkpatrick (eds) (2000a) Privatization in Developing CountriesVolume II, Cheltenham: Edward Elgar Publishing.
Henderson, J. and Applebaum, R. (1992b) ‘Situating the State in the East AsianDevelopment Process’, in R. Applebaum and J. Henderson (eds) States andDevelopment in the Asian Pacific Rim, London: Sage Publications.
—— (1992a) States and Development in the Asian Pacific Rim, London: SagePublications.
Hill, H. (ed) (2002) The Economic Development of Southeast Asia Volume IV,Cheltenham: Edward Elgar Publishing.
Hilmi Mohamad (2003) ‘Rail Transportation in Kuala Lumpur’, Japan Rail & Trans-port Review, July, 35.
Ho K.L. (1988) ‘Indigenizing the State: The NEP and the Bumiputra State in Pen-insular Malaysia’, PhD dissertation, Ohio State University.
Hochstein, A. (1996) ‘Strategies for Improving Port System Performance’, inS. Hakim, P. Seidenstat and G. Bowman (eds) Privatizing Transportation Systems,London: Praeger.
Hua W.Y. (1983) Class and Communalism in Malaysia: Politics in a DependentCapitalist State, London: Zed Books.
Huber, E., Rueschemeyer, D. and Stephens, J.D. (1993) ‘The Impact of Developmenton Democracy’, Journal of Economic Perspectives, 7 (3) Summer.
International Air Transport Association (IATA) (2001) World Air TransportStatistics, London: International Air Transport Association.
212 References
—— (2002) World Air Transport Statistics, London: International Air TransportAssociation.
International Civil Aviation Organization (ICAO) (1991) Civil Aviation Statistics ofthe World 1990, Montreal: International Civil Aviation Organization.
—— (1992) Civil Aviation Statistics of the World 1991, Montreal: International CivilAviation Organization.
—— (1993) Civil Aviation Statistics of the World 1992, Montreal: International CivilAviation Organization.
—— (1994) Civil Aviation Statistics of the World 1993, Montreal: International CivilAviation Organization.
—— (1995) Civil Aviation Statistics of the World 1994, Montreal: International CivilAviation Organization.
—— (1996) Civil Aviation Statistics of the World 1995, Montreal: International CivilAviation Organization.
—— (1997) Civil Aviation Statistics of the World 1996, Montreal: International CivilAviation Organization.
—— (1998) Civil Aviation Statistics of the World 1997, Montreal: International CivilAviation Organization.
—— (1999) Civil Aviation Statistics of the World 1998, Montreal: International CivilAviation Organization.
Ismail Salleh (1991) ‘The Privatisation of Public Enterprises: A Case Study ofMalaysia’, in G. Gouri (ed) Privatisation and Public Enterprise: The Asia-PacificExperience, New Delhi: Oxford University Press and IBH Publishing.
Ismail Salleh and Lee, T.H. (1990) ‘Privatisation: The Process So Far’, Kuala Lumpur:ISIS.
Ismail Salleh and Osman Rani (1991) ‘The Growth of the Public Sector in Malaysia’,Kuala Lumpur: ISIS.
Jacobsson, S. (1993) ‘The Length of the Infant Industry Period: Evidence from theEngineering Industry in South Korea’, World Development, 21 (3): 407–419.
Japan International Cooperation Agency (JICA) (1997) ‘Financial Analysis andPerspectives’, Integrated Urban Transportation Strategies for EnvironmentalImprovement in Kuala Lumpur (SMURT-KL).
—— (1998a) ‘Progress Report II’, Integrated Urban Transportation Strategies forEnvironmental Improvement in Kuala Lumpur (SMURT-KL), March.
—— (1998b) ‘Clues on Sources From Institutional Arrangements’, Integrated UrbanTransportation Strategies for Environmental Improvement in Kuala Lumpur(SMURT-KL).
Japan International Cooperation Agency (JICA) and Urusetia Perancang LembahKlang (1986) ‘Klang Valley Transportation Study Technical Report E-3 PublicTransport Study’, December.
Jesudason, J. (1989) Ethnicity and the Economy: The State, Chinese Business, andMultinationals in Malaysia, Singapore: Oxford University Press.
Johnson, C. (1982) MITI and the Japanese Miracle, Stanford: Stanford University Press.—— (1999) ‘The Developmental State: Odyssey of a Concept’, in M. Woo-Cummings
(ed) The Developmental State, London: Cornell University Press.Jomo K.S. (1986) A Question of Class: Capital, the State and Uneven Development in
Malaya, Singapore: Oxford University Press.—— (1990) ‘Whither Malaysia’s New Economic Policy?’, Pacific Affairs, 63 (4): 469–
499.
References 213
—— (1993a) ‘The Way Forward?: The Political Economy of Development PolicyReform in Malaysia’, Kuala Lumpur: University of Malaya.
—— (ed) (1993b) Industrializing Malaysia: Policy, Performance, Prospects, London:Routledge.
—— (1994) U-Turn? Malaysian Economic Development Policy After 1990, Queens-land: James Cook University.
—— (1995) Privatizing Malaysia: Rents, Rhetoric, Realities, London: Westview Press.—— (ed) (1999a) Rethinking Malaysia, Hong Kong: Asia 2000.—— (1999b), ‘A Malaysian Middle Class?: Some Preliminary Analytical Con-
siderations’, in Jomo K.S. (ed) Rethinking Malaysia, Hong Kong: Asia 2000.—— (ed) (2001) Malaysian Eclipse: Economic Crisis and Recovery, London: Zed
Books.—— (2002) ‘Privatization’s Distributional Impact in Malaysia’, New York: Initiative
for Policy Dialogue Task Force Working Paper. <http://www0.gsb.columbia.edu/ipd/programs/item.cfm?prid=22&iyid=13&itid=477> (accessed 13 February 2007).
Jomo K.S. and Edwards, C. (1993) ‘Growth and Structural Change in the MalaysianEconomy’, Development and Change, April 24 (2).
Jomo K.S. and Felker, G. (eds) (1999) Technology, Competitiveness and the State:Malaysia’s Industrial and Technology Policies, London: Routledge
Jomo K.S. and Gomez, E.T. (2000) ‘The Malaysian Development Dilemma’, inM.H. Khan and Jomo K.S. (eds) Rents, Rent Seeking and Economic Development,Cambridge: Cambridge University Press.
Jomo K.S. and Hamilton-Hart, N. (2001) ‘Financial Regulation, Crisis and PoliticalResponse’, in Jomo K.S. (ed) Malaysian Eclipse: Economic Crisis and Recovery,London: Zed Books.
Jomo K.S. and Tan K.W. (1999) Industrial Policy in East Asia: Lessons for Malaysia,Kuala Lumpur: University of Malaya Press.
Jomo K.S., Felker, G. and Rasiah, R. (eds) (1999) Industrial Technology Developmentin Malaysia: Industry and Firm Studies, London: Routledge.
Jones, L. (1994) ‘Malaysia’, in A. Galal and M. Shirley (eds) Does PrivatizationDeliver?: Highlights from a World Bank Conference, Washington DC: World Bank.
Jones, L. and Fadil Azim Abbas (1992) ‘Malaysia: Background, Malaysian Airlines,Kelang Container Terminal, Sports Toto’, paper presented at the World Bank Con-ference on The Welfare Consequences of Selling Public Enterprises, WashingtonDC, 11–12 June.
—— (1994) ‘Sports Toto’, in A. Galal, L. Jones, P. Tandon and I. Vogelsang (eds)Welfare Consequences of Selling Public Enterprises, Washington: Oxford UniversityPress (The World Bank).
Jones, L. and Mason, E. (1982) ‘Role of Economic Factors in Determining the Sizeand Structure of the Public Enterprise Sector in Less-Developed Countries WithMixed Economies’, in P. Cook and C. Kirkpatrick (eds) (2000a) Privatization inDeveloping Countries Volume I, Cheltenham: Edward Elgar Publishing.
Kamal Salih and Zainal Aznam Yusoff (1989): ‘Overview of the NEP and Frame-work for a Post-1990 National Economic Policy: Options’, Malaysian ManagementReview 24 (2): 13–61.
Kamal Salih (1989) ‘The Malaysian Economy in the 1990s: The AlternativeScenarios’, MIER [Malaysia Institute of Economic Research] Discussion Paper 27,August.
Kennedy, J.C. (2002) ‘National Economic Action Council Executive Director Dato’
214 References
Mustapa Mohamed on Economic Growth and Investment in Malaysia’, inAcademy of Management Executive, 16 (3).
Kessides, I. (2004) Reforming Infrastructure: Privatisation, Regulation and Com-petition, Washington DC: World Bank.
Khan, M.H. (1997) ‘State Failure in Weak States’, in J. Harriss, J. Hunter andC. Lewis (eds) The New Institutional Economics and Third World Development,London: Routledge.
—— (1998) ‘Patron-Client Networks and the Economic Effects of Corruption inAsia’, European Journal of Development Research, 10 (1): 15–39.
—— (2000a) ‘Rent-Seeking as Process’, in M.K. Khan and Jomo K.S. (eds) Rents,Rent-Seeking and Economic Development, Cambridge: Cambridge University Press.
—— (2000b) ‘Rents, Efficiency and Growth’, in M.H. Khan and Jomo K.S. (eds)Rents, Rent-Seeking and Economic Development, Cambridge: Cambridge Uni-versity Press.
—— (2000c) ‘The Political Economy of Industrial Policy in Pakistan 1947–1971’,SOAS Department of Economics Working Paper Series, 98.
—— (2004) ‘State Failure in Developing Countries and Strategies of InstitutionalReform’, in B. Tungodden, N. Stern and I. Kolstad (eds) Toward Pro-Poor Policies:Aid Institutions and Globalization, Proceedings of Annual World Bank Conferenceon Development Economics, Oxford: Oxford University Press and World Bank.
—— (forthcoming) ‘Analysing Corruption as Process: Competing Paradigms inEconomics and Political Economy’.
—— (undated) ‘The New Political Economy of Corruption’, Department ofEconomics SOAS.
Khan, M.H. and Jomo K.S. (eds) (2000) Rents, Rent-Seeking and Economic Develop-ment, Cambridge: Cambridge University Press.
Khoo B.T. (1995) Paradoxes of Mahathirism, Kuala Lumpur: Oxford UniversityPress.
Khoo K.J. (1992) ‘The Grand Vision: Mahathir and Modernisation’, in J. Kahn andF. Loh (eds) Fragmented Vision: Culture and Politics in Contemporary Malaysia,Sydney: Allen and Unwin.
Khor K.P. (1986) ‘Industrial Policy in Malaysia – Problems and Prospects’, KajianEkonomi Malaysia, 23 (1) June: 5–26.
Kikeri, S., Nellis, J. and Shirley, M. (1994) ‘Privatization: Lessons from MarketEconomies’, in P. Cook and C. Kirkpatrick (eds) (2000b) Privatization in Develop-ing Countries Volume II, Cheltenham: Edward Elgar Publishing.
Kim L. (2004) ‘The Multifaceted Evolution of Korean Technological Capabilitiesand its Implications for Contemporary Policy’, Oxford Development Studies,32 (3): 341–363.
KL Infrastructure Group (2006) Financial statements for the year ended 30 April2006.
Koo H. and Kim E.M. (1992) ‘The Developmental State and Capital Accumulationin South Korea’, in R. Applebaum and J. Henderson (eds) States and Developmentin the Asian Pacific Rim, London: Sage Publications.
Kraemer, A. (1998) ‘Public and Private Water Management in Europe’, in F. Correia(ed) Institutions for Water Resources Management in Europe Volume 1, Rotterdam:A.A. Balkema.
Krueger, A.O. (1974) ‘The Political Economy of Rent-Seeking Society’, AmericanEconomic Review, 64 (3): 291–303.
References 215

—— (1990) ‘Government Failures in Development’, Journal of Economic Perspec-tives, 4 (3) Summer: 9–23.
Kuo C.T. (2000) ‘New Financial Politics in Thailand and Malaysia’, Issues & Studies,36 (6): 139–176.
Lall, S. (1995) ‘Malaysia: Industrial Success and the Role of the Government’, inH. Hill (ed) (2002) The Economic Development of Southeast Asia Volume IV,Cheltenham: Edward Elgar Publishing.
—— (2003) ‘Symposium on Infant Industries: Roberts on Infant Industry Protection– Another Comment’, Oxford Development Studies, 31 (1): 14–17.
Law, C.M. (ed) (1991a) Restructuring the Global Automobile Industry, London:Routledge.
Leary, S. (1998) ‘Malaysia: Continuing Role in Economic Life’, Privatisation Inter-national Yearbook 1998.
Lee K.H. and Nagraj, S. (eds) (1991) The Malaysian Economy Beyond 1990, KualaLumpur: Persatuan Ekonomi Malaysia.
Lee, C. (2004) ‘Regulating Competition in Malaysia’, P. Cook, C. Kirkpatrick,M. Minogue and D. Parker (eds) Leading Issues in Competition, Regulation andDevelopment, Cheltenham: Edward Elgar Publishing.
Lee J. (1997) ‘The Maturation and Growth of Infant Industries: The Case of Korea’,World Development, 25 (8): 1271–1281.
Lee Y.F. (1997) ‘The Privatisation of Solid Waste Infrastructure and Services in Asia’,Third World Planning Review, 19 (2): 139–162.
Leftwich, A. (2002) ‘A Contradiction in the Politics of Economics’, New PoliticalEconomy, 7 (2): 269–273.
Leigh, M. (1992) ‘Politics, Bureaucracy, and Business in Malaysia: Realigning theEternal Triangle’, in A. McIntyre and J. Kanishka (eds) The Dynamics of EconomicPolicy Reform in Southeast Asia and South West Pacific, Singapore: Oxford Uni-versity Press.
Leong C.H. (1991) ‘Late Industrialisation Along with Democratic Politics inMalaysia’, PhD thesis, Harvard University.
Levy, B. and Spiller, P. (1993) ‘Regulation, Institutions and Commitment in Telecom-munications: A Comparative Analysis of Five Country Studies’, in P. Cook andC. Kirkpatrick (eds) (2000a) Privatization in Developing Countries Volume II,Cheltenham: Edward Elgar Publishing.
Light Rail Transit Association (UK Development Group) (1997) ‘Asia’s Urban RailCongress’, Fact Sheet 45.
Lim L.L. and Chee P.L. (eds) (1984) The Malaysian Economy at the Crossroads: PolicyAdjustment or Structural Transformation, Kuala Lumpur: Malaysian EconomicAssociation and Organisational Resources.
Lim M.H. (1981) Ownership and Control of the 100 Largest Corporations in Malaysia,Singapore: Oxford University Press.
—— (1985) ‘Contradictions in the Development of Malay Capital: State, Accumula-tion and Legitimation’, Journal of Contemporary Asia, 15 (1).
Linder, S. (2000) ‘Coming to Terms With Public-Private Partnerships’, in P. Rosenau(ed) Public-Private Policy Partnerships, London: The MIT Press.
Lubeck, P.M. (1992) ‘Malaysian Industrialisation, Ethnic Division and theNIC Model: The Limits of Replication’, in R. Applebaum and J. Henderson(eds) States and Development in the Asian Pacific Rim, London: Sage Pub-lications.
216 References
Lum W.K. (1994) ‘Privatisation of Sewerage Services in Malaysia: The Way Forward’,Kuala Lumpur: Department of Sewerage Services, Malaysia.
Mackie, J.A. (1995) ‘Economic Growth in the ASEAN Region: The Political Under-pinnings’, in J. Ravenhill (ed) Singapore, Indonesia, Malaysia, The Philippines andThailand Volume I, Aldershot: Edward Elgar Publishing.
Mahathir Mohamad (1986) The Challenge, Petaling Jaya: Pelanduk Publications.[Translated from Menghadapi Cabaran, Kuala Lumpur: Pustaka Antara, 1976].
—— (1998a) The Way Forward, London: Weidenfeld & Nicolson.—— (1998b) The Challenges of Turmoil, Subang Jaya: Pelanduk Publications.Malaysia (1981) Fourth Malaysia Plan, 1981–1985, Kuala Lumpur: Government
Printers.—— (1983a) Industrial Master Plan, Kuala Lumpur: Government Printers.—— (1983b) Malaysian Industrial Policy Study, Kuala Lumpur: Government
Printers.—— (1985) Guidelines on Privatization, Kuala Lumpur: Government Printers. —— (1986) Fifth Malaysia Plan, 1986–1990, Kuala Lumpur: Government Printers.—— (1989) Mid-Term Review of the Fifth Malaysia Plan, 1986–1990, Kuala Lumpur:
Government Printers.—— (1991a) Sixth Malaysia Plan, 1991–1995, Kuala Lumpur: Government Printers.—— (1991b) Privatization Master Plan, Kuala Lumpur: Government Printers.—— (1996) Seventh Malaysia Plan, 1996–2000, Kuala Lumpur: Government Printers.—— (2001a) Eighth Malaysia Plan, 2001–2005, Kuala Lumpur: Government
Printers.—— (2001b) ‘White Paper: Status of the Malaysian Economy’, Kuala Lumpur:
Economic Planning Unit, 30 November.—— (2002) Sewerage Services Act 1993 (Incorporating all Amendments up to
28 February 2002), Kuala Lumpur: The Commission of Law Revision, Malaysia.Malaysia Airlines (1991) Annual Report, Kuala Lumpur: Malaysia Airlines.—— (1992a) Annual Report, Kuala Lumpur: Malaysia Airlines.—— (1992b) ‘Circular to Shareholders in Relation to the Proposed Rights Issue of
350,000,000 New Ordinary Chares’, 5 August.—— (1993) Annual Report, Kuala Lumpur: Malaysia Airlines.—— (1994) Annual Report, Kuala Lumpur: Malaysia Airlines.—— (1995) Annual Report, Kuala Lumpur: Malaysia Airlines.—— (1996) Annual Report, Kuala Lumpur: Malaysia Airlines.—— (1997) Annual Report, Kuala Lumpur: Malaysia Airlines.—— (1998) Annual Report, Kuala Lumpur: Malaysia Airlines.—— (2002) ‘Reorganization of the Group Corporate Structure’, public announce-
ment, 30 July [prepared by Bina Fikir Consultants].Malek Merican (1986) ‘Review of the NEP from a Private Sector Perspective’, paper
presented at GEMAPUTRA, Kuala Lumpur.Mandell, R.W. (1979) Financing the Capital Requirements of the US Airline Industry in
the 1980s, Lexington: Gower Press.Martin, S. and Parker, D. (1997) The Impact of Privatisation: Ownership and Cor-
porate Performance in the UK, London: Routledge.Marx, K. (1979 [1867]) Capital Volume 1, Harmondsworth: Penguin Books.McVey, R. (1995) ‘The Southeast Asian Entrepreneur’, in J. Ravenhill (ed) Singapore,
Indonesia, Malaysia, The Philippines and Thailand Volume I, Aldershot: EdwardElgar Publishing.
References 217

Means, G. (1986) ‘Ethnic Preference Policies in Malaysia’, in N. Nevitte andC.H. Kennedy (eds) (1986) Ethnic Preference and Public Policy in Developing States,Colorado: Lynne Rienner Publishers.
Meerman, J. (1979) Public Expenditure in Malaysia, New York: Oxford UniversityPress.
Mehmet, O. (1988) Development in Malaysia: Poverty, Wealth and Trusteeship, KualaLumpur: Insan.
Melitz, M. (2005) ‘When and How Should Infant Industries Be Protected?’,Journal of International Economics, 66 (1): 177–196.Millward, R. and Parker, D. (1983) ‘Public and Private Enterprise: Comparative
Behaviour and Relative Efficiency’, in P. Cook and C. Kirkpatrick (eds) (2000a)Privatization in Developing Countries Volume I, Cheltenham: Edward ElgarPublishing.
Milne, R. and Mauzy, D. (1999) Malaysian Politics Under Mahathir, London:Routledge.
Mohamad Sheriff (1991) ‘Privatisations’, in Lee K.H. and S. Nagraj (eds) TheMalaysian Economy Beyond 1990, Kuala Lumpur: Persatuan Ekonomi Malaysia.
National Audit Department, Malaysia (2000) Laporan Ketua Audit Negara MengenaiPenyata Akaun Awam Serta Aktiviti-aktiviti Kementrian dan Agensi KerajaanPersekutuan [Report of the National Auditor General on the Accounts and Activitiesof Federal Government Ministries and Agencies], Putrajaya: GovernmentPrinters.
Neuman, S. (1971) ‘The Malay Political Elite: An Analysis of 134 Malay Legislators,Their Social Backgrounds and Attitudes’, PhD dissertation, New York University.
Nevitte, N. and Kennedy, C.H. (eds) (1986) Ethnic Preference and Public Policy inDeveloping States, Colorado: Lynne Rienner Publishers.
Nomura Asian Equity Research (2002) ‘Malaysian Airlines System’, stock analysis,29 November.
Odaka, K. (ed) (1983) The Motor Vehicle Industry in Asia, Singapore: SingaporeUniversity Press.
Olson, M. (1997) ‘The New Institutional Economics: The Collective ChoiceApproach to Economic Development’, in C. Clague (ed) Institutions and EconomicDevelopment, Baltimore: Johns Hopkins University Press.
—— (2000) ‘Dictatorship, Democracy and Development’, in M. Olson andS. Kahkonen (eds) A Not-So-Dismal Science, Oxford: Oxford University Press.
Olson, M. and Kahkonen, S. (2000) ‘Introduction: The Broader View’, in M. Olsonand S. Kahkonen (eds) A Not-So-Dismal Science, Oxford: Oxford University Press.
Oster Jr, C. and Strong, J. (2000) ‘Transport Restructuring and Reform in an Inter-national Context’, Transportation Journal, 39 (3) Spring: 18–32.
Paribas Capital Markets (1994) ‘Malaysian Airlines’, stock analysis.Parker, D. (2001) ‘Economic Regulation: A Preliminary Literature Review and
Summary of Research Questions Arising’, Manchester: Centre on Regulationand Competition Working Paper Series No. 6.
Parker, D. and Kirkpatrick, C. (2002) ‘Researching Economic Regulation in Develop-ing Countries: Developing a Methodology for Critical Analysis’, Manchester:Centre on Regulation and Competition Working Paper Series No. 34.
—— (2003) ‘Privatisation in Developing Countries: A Review of the Evidence andthe Policy Lessons’, Manchester: Centre on Regulation and Competition WorkingPaper Series No. 55.
218 References

Payson, W. and Steckler, S. (1996) ‘Developing Public-Private Partnerships in Infra-structure’, in S. Hakim, P. Seidenstat and G. Bowman (eds) Privatizing Transporta-tion Systems, London: Praeger.
Pempel, T.J. (1999) ‘The Development Regime in a Changing World Economy’, inM. Woo-Cummings (ed) The Developmental State, London: Cornell UniversityPress.
Plane, P. (1997) ‘Privatization and Economic Growth: An Empirical Investigationfrom a Sample of Developing Market Economies’ in P. Cook and C. Kirkpatrick(eds) (2000a) Privatization in Developing Countries Volume II, Cheltenham: EdwardElgar Publishing.
Pongsiri, N. (2001) ‘Regulation and Public-Private Partnerships’, Manchester: Centreon Regulation and Competition Working Paper Series No. 12.
Poole, R. (1996) ‘Privatisation for Economic Development’, in T. Anderson andP. Hill (eds) The Privatization Process, London: Rowman and LittlefieldPublishers.
Prime Utilities (1995) Annual Report, Kuala Lumpur: Prime Utilities Bhd.—— (1996) Annual Report, Kuala Lumpur: Prime Utilities Bhd.—— (1997) Annual Report, Kuala Lumpur: Prime Utilities Bhd.—— (1998) Annual Report, Kuala Lumpur: Prime Utilities Bhd.—— (1999) Annual Report, Kuala Lumpur: Prime Utilities Bhd.—— (2000) Annual Report, Kuala Lumpur: Prime Utilities Bhd.Proton (2001) Annual Report, Kuala Lumpur: Proton Bhd.Przeworski, A. and Limongi, F. (1993) ‘Political Regimes and Economic Growth’,
Journal of Economic Perspectives, 7 ( 3).Puthucheary, J. (1960) Ownership and Control in the Malaysian Economy, Singapore:
Eastern University Press.Puthucheary, M. (1984) ‘The Political Economy of Public Enterprise in Malaysia’, in
Lim L.L. and Chee P.L. (eds) The Malaysian Economy at the Crossroads: PolicyAdjustment or Structural Transformation, Kuala Lumpur: Malaysian EconomicAssociation and Organisational Resources.
Ranis, G. (2003) ‘Symposium on Infant Industries: A Comment’, Oxford DevelopmentStudies, 31 (1): 33–35.
Rasiah, R. (1998) ‘Capital Expansion, Cronyism and Contraction’, Journal of theAsia Pacific Economy, 3 (3): 358–378.
—— (2001) ‘Pre-Crisis Economic Weaknesses and Vulnerability’, in Jomo K.S. (ed)Malaysian Eclipse: Economic Crisis and Recovery, London: Zed Books.
Rasiah, R. and Ishak Shari (2001) ‘Market, Government and Malaysia’s NewEconomic Policy’, Cambridge Journal of Economics, 25: 57–78.
Ravenhill, J. (ed) (1995) Singapore, Indonesia, Malaysia, The Philippines and ThailandVolume I, Aldershot: Edward Elgar Publishing.
Rhys, D.C. (1972) The Motor Industry. An Economic Survey. London: Butterworths.Rodrik, D. (1995) ‘Getting Interventions Right: How South Korea and Taiwan Grew
Rich’, Economic Policy 20.Roland, G. (1994) ‘On the Speed and Sequencing of Privatisation and Restructuring’,
Economic Journal, Royal Economic Society, 104 (127): 1158–1168.Rosenau, P. (2000b) ‘The Strengths and Weaknesses of Public-Private Partnerships’,
in P. Rosenau (ed) Public-Private Policy Partnerships, London: The MIT Press.—— (ed) (2000a) Public-Private Policy Partnerships, London: The MIT Press.Rosli Nekmat and Ooi P.H. (1993) ‘Application of EMME/2 in Transit Forecasting
References 219

for Kuala Lumpur Light Rapid Transit (LRT) Project’, paper presented at the 8thInternational EMME/2 Users’ Conference, Seattle, Washington, November 3–5.
Rowthorn, B. and Chang, H.J. (1993) ‘Public Ownership and the Theory of the State’,in T. Clarke and C. Pitelis (eds) The Political Economy of Privatisation, London:Routledge.
Salleh I.M. and Meyanathan, S.D. (1993) ‘Malaysia: Growth, Equity and StructuralTransformation’, in D. Leipsiger and V. Thomas (eds) The Lessons of East Asia,Washington DC: World Bank.
SalomonSmithBarney (2002) ‘Malaysia Auto – Brave New World’, —— (2003) Proton Financial Data.Sappington, D. and Stiglitz, J. (1987a) ‘Privatisation, Information and Incentives’, in
E. Bailey and J. Pack (eds) The Political Economy of Privatization and Deregulation,Aldershot: Elgar Reference Collection.
—— (1987b) ‘Information and Regulation’, in P. Cook and C. Kirkpatrick (eds)(2000a) Privatization in Developing Countries Volume I, Cheltenham: Edward ElgarPublishing.
Schlossstein, S. (1991) Asia’s New Little Dragons, Chicago: Contemporary Books.Searle, P. (1999) The Riddle of Malaysian Capitalism, Honolulu: Allen & Unwin and
University of Hawai’i Press.Securities Commission, Malaysia (1999a) ‘Revised Requirements for Listing, Reverse
Take-Overs and Back-Door Listings and Flexibilities in the Issue Of ReplacementWarrants and Fixing of Exercise Prices’, press release, 30 April, Kuala Lumpur.
—— (1999b) ‘SC Allows Flexibilities for Variations to Profit Guarantee, SetsConditions to Protect Investors’, press release, 30 September, Kuala Lumpur.
Sewerage Services Department, Malaysia (1998) Sewerage Services Report 1994–1997,Kuala Lumpur: Percetakan Nasional Malaysia.
—— (2001) Sewerage Services Report 2001, Kuala Lumpur: Percetakan NasionalMalaysia.
Shamsul A.B. (1986) From British to Bumiputra Rule, Singapore: ISEAS.Shannon, R. and Lockshin, L. (2000) ‘Bangkok’s Skytrain: A Marketing Challenge’,
paper presented at the Australian and New Zealand Marketing AcademyConference.
Shaoul, J. (2004) ‘Railpolitik: The Financial Realities of Operating Britain’s NationalRailways’, Public Money & Management, January.
Shirley, M. (1997) ‘The Economics and Politics of Government Ownership’ inP. Cook and C. Kirkpatrick (eds) (2000a) Privatization in Developing CountriesVolume II, Cheltenham: Edward Elgar Publishing.
Shleifer, A. and Vishny, R. (1993) ‘Corruption’, The Quarterly Journal of Economics,108 (3): 599–617.
Shoji, K. (2001) ‘Lessons from Japanese Experiences of Roles of Public and PrivateSectors in Urban Transport’, Japan Railway & Transport Review, 29, December.
Singapore Airlines (1997) 1996/1997 Annual Report, Singapore: Singapore Airlines.—— (1998) 1997/1998 Annual Report, Singapore: Singapore Airlines.—— (1999) 1998/1999 Annual Report, Singapore: Singapore Airlines.—— (2000) 1999/2000 Annual Report, Singapore: Singapore Airlines.Singaravelloo, K. (1996) ‘Employees Perceptions of Privatisation: The Case of Kelang
Container Terminal Bhd’, Borneo Review, VII (1): 23–41.SMRT [Singapore Mass Rapid Transit] Corporation (2001) (SMRT) Annual Report,
Singapore: SMRT Corporation Ltd.
220 References

—— (2002) (SMRT) Annual Report, Singapore: SMRT Corporation Ltd.—— (2003) (SMRT) Annual Report, Singapore: SMRT Corporation Ltd.—— (2004) (SMRT) Annual Report, Singapore: SMRT Corporation Ltd.Stern, J. and Holder, S. (1999) ‘Regulatory Governance: Criteria for Assessing the
Performance of Regulatory Systems. An Application to Infrastructure Industries inthe Developing Countries of Asia’, Utilities Policy, 8: 33–50.
Stiglitz, J. (1971) ‘The Theory of Economic Regulation’, Bell Journal of Economic andManagement Science, 2 (1): 3–21.
—— (1996) Whither Socialism? Cambridge: The MIT Press.—— (1998) ‘Private Uses of Public Interests: Incentives and Institutions’, Journal of
Economic Perspectives, 12 (2): 3–22.Stittle, J. (2002) ‘Regulatory Control of the Track Access Charges of Railtrack plc’,
Public Money & Management, January–March.Stottmann, W. (2000) ‘The Role of the Private Sector in the Provision of Water and
Wastewater Services in Urban Areas’, in J. Uito and A. Biswas (eds) Water forUrban Areas: Challenges and Perspectives, New York: United Nations UniversityPress.
Supian Ali (1988) ‘Malaysia’, in G. Edgren (ed) The Growing Sector: Studies of PublicSector Employment in Asia, New Delhi: ILO-ARTEP.
TA Securities (1993) ‘Malaysia Airlines’, stock analysis.—— (1996) ‘Proton’, stock analysis, 9 February.—— (1998) ‘Proton’, company update, 11 June.Tan, C. (1996) Corporate Handbook Malaysia December 1996, Singapore: Thompson
Info (S.E. Asia).Tan C.H. (1991) ‘Privatization in Malaysia and Singapore: A Comparison’, Journal of
Southeast Asia Business, 7 (4) Fall: 12–25.Tan C.K. (1984) Without Fear or Favour, Petaling Jaya: Eastern Universities Press.Tan T.W. (1982) Income Distribution and Determination in West Malaysia, Kuala
Lumpur: Oxford University Press.Tatahi, M. (2003) ‘Privatisation Performance in Major European Countries
since 1980’, PhD thesis, School of Oriental and African Studies, University ofLondon.
Terry, F. (2001a) ‘The Nemesis of Privatization: Railway Policy in Retrospect’, PublicMoney & Management, January–March.
Terry, F. (2001b) ‘Privatization and Public Enterprise Reform: The New LabourAgenda for Pubic Management in the UK’, in A. Farazmand (ed) Privatization orPublic Enterprise Reform, London: Greenwood Press.
Thai Airways International (1998) Annual Report 1997/98, Bangkok: Thai AirwaysInternational Public Company Limited.
—— (1999) Annual Report 1998/99, Bangkok: Thai Airways International PublicCompany Limited.
—— (2000) Annual Report 1999/2000, Bangkok: Thai Airways International PublicCompany Limited.
Tharu T. Tharumagnanam (1994) The Making of The National Car, Kuala Lumpur:TASMAG Publishing.
Townsend, C. (2003) ‘In Whose Interest? A Critical Approach to Southeast Asia’sUrban Transport Dynamics’, PhD thesis, Western Australia: Murdoch University.
Tullock, G. (1967) ‘The Welfare Costs of Tariffs, Monopolies and Theft’, The WesternEconomic Journal, June.
References 221

Uito, J. and Biswas, A. (eds) (2000) Water for Urban Areas: Challenges and Perspec-tives, New York: United Nations University Press.
United Kingdom (2006) West Coast Main Line: Department of Transport ProgressReport (May), London: DfT Publications.
Vartiainen, J. (1999) ‘The Economics of Successful State Intervention in IndustrialTransformation’, in M. Woo-Cummings (ed) The Developmental State, London:Cornell University Press.
Vickers, J. and Wright, V. (1989) The Politics of Privatisation in Western Europe,London: Cass.
Vickers, J. and Yarrow, G. (1988) Privatization: An Economic Analysis, Cambridge,Mass; London: MIT Press.
—— (1991) ‘Economic Perspectives on Privatisation’, Journal of Economic Perspec-tives, 5 (2), 111–132.
—— (1995) Privatization: An Economic Analysis, London: The MIT Press.Wade, R. (1990) Governing the Market: Economic Theory and Role of Governance in
East Asian Industrialisation, Princeton: Princeton University Press.—— (2003) ‘Symposium on Infant Industries: Reply to John Roberts on Infant
Industry Protection’, Oxford Development Studies, 31 (1): 8–14.Warr, P.G. (1987) ‘Malaysia’s Industrial Enclaves: Benefits and Costs’, The Developing
Economies, 25 (1) March: 30–55.Weber, R. (2002) ‘Do Better Contracts Make Better Economic Incentives?’, APA
Journal, 68 (1): 43–55.Wedeman, A. (2002) ‘Development and Corruption: The East Asian Paradox’, in
E.T. Gomez (ed), Political Business in East Asia, London: Routledge.Weiss, L. (1998) The Myth of The Powerless State, Cambridge: Polity Press.Weiss, L. and Hobson, J.M. (1995) State and Economic Development: A Comparative
Historical Analysis, Cambridge: Polity Press.Whitehouse, L. (2003) ‘Railtrack is Dead – Long Live Network Rail? Nationalization
Under The Third Way’, Journal of Law & Society, 30 (2), June.Williamson, O. (2000) ‘Economic Institutions and Development’, in M. Olson and
S. Kahkonen (eds) A Not-So-Dismal Science, New York: Oxford University Press.Wilson, R. (1999) ‘The Political Economy of Financing Development in Malaysia’, in
B.N. Ghosh and Muhammad Syukri Salleh (eds) Political Economy of Developmentin Malaysia, Kuala Lumpur: Utusan Publications and Distributors.
Windsor, D. (1996) ‘Creative Financing Options for Urban Transport Privatization’,in S. Hakim, P. Seidenstat and G. Bowman (eds) Privatizing TransportationSystems, London: Praeger.
Woo-Cummings, M. (ed) (1999) The Developmental State, Ithaca: Cornell UniversityPress.
World Bank (1994) World Development Report 1994: Infrastructure for Development,New York: Oxford University Press/World Bank.
Yarrow, G. (1986) ‘Privatization in Theory and Practice’, Economic Policy, 2: 324–364.Yusoff, M. (1990) Time for Change, Kuala Lumpur: The Champ.Zeufack, A. (2004) ‘Assessing the Impact of Privatization: Lessons from International
Experiences’, ISIS, Kuala Lumpur, Malaysia, 19 February.
222 References

Newspapers, magazines, websites and other sources
Agence France Presse (AFP)Asian Business ReviewAsian Wall Street JournalAsiaweekAutoAsiaAutoTrader
<http://ces.autotrader.co.uk/ces/roadtest.do?usedCar=0&capcode=PRG216GSX5HPIM%20%20%20%20%20%20&rtid=211080&price=10406>(accessed 3 February 2007)
Automotive NewsAutozine
<http://autozine.kyul.net/Manufacturer/Korea.htm> (accessed 18 Dec 2005)Bernama.comBoeing Corporation
<http://active.boeing.com/commercial/orders/summaries.cfm> (accessed 2 June 2005)Business TimesCompanies Commission MalaysiaFar Eastern Economic ReviewGlobal Car Production Statistics Pages
<http://www.geocities.com/MotorCity/Speedway/4939/korea.html> (accessed 3February 2007)
International Herald TribuneInvestors DigestKowloon-Canton Railway Corporation
<http://www.kcrc.com/> (accessed 3 February 2007)Light Rail Transit Authority (Manila)
<http://www.lrta.gov.ph/index.htm> (accessed 3 February 2007)Malay MailMalaysiakini
<http://malaysiakini.com>Malaysian BusinessMalaysian IndustryNew Straits TimesPACIFIC Exchange Rate Service
<http://pacific.commerce.ubc.ca/xr/data.html>ReutersThe Automobile Association
<http://www.theaa.com/allaboutcars/carsearch/carsearch_cartest_reports.jsp?carTest=carTest&latestReports=n&modelID=A8&modelName=GEN-2&make Name=Proton> (accessed 3 February 2007)
The EconomistThe Edge
<http://www.theedgedaily.com>The StarThe SunWater & Environment International (March 2000, 9 [66])
<http://web.ebscohost.com/ehost/detail?vid=3&hid=120&sid=80dfd078–4901–4d34-a489–9ff0f8b01db2%40sessionmgr107> (accessed 7 February 2007)
References 223

Index
accountability 2, 8, 21, 23–4, 34, 110, 194Adtranz see TaylorWoodrow-AdtranzAFTA 173–4, 178, 183–4Ahmad Sebi Bakar 74, 97, 98, 100airlines: Asia Pacific 136, 138, 142, 156,
157; business model 135; debt 135,137; financial performance 136;industry characteristics 133–8;operating costs 137; overcapacity 135,137; profitability 135; subsidies 133–5,137
Alchian and Demsetz 11, 159Alliance Party 42, 44, 197Aminuddin Rouse 98Anwar Ibrahim 48, 71, 74, 98, 166,
197area road pricing 127–8, 202ARP see area road pricingASEAN 173, 183; ASEAN-assembled
cars 178Asian financial crisis 63–4, 108; effect on
LRT 113, 117; effect on MAS 135, 138,140, 144, 146–7, 152, 155; effect onProton 166–8, 171
Asian Free Trade Agreement see AFTAAssociation of Southeast Asian Nations
see ASEANasymmetric information see informationauthoritarianism (Malaysia) 57, 71–2automobile: industry challenges 160,
161, 162, 180; industry characteristics159, 161, 162; industry consolidation159, 162, 181; industry trends 159, 160,181; late-comer challenges 158, 163,180, 183; overcapacity 159, 161–2, 181
bail-outs: airlines 133, 135; auto industry162; Malaysia 5, 39, 40, 46, 59, 64, 190,197
balance of power: effect on institutions26–7, 29, 33, 77; effect on Malaysianstate capacity 38, 41; effect onprivatization 17, 29, 33; effect on statecapacity 4, 6, 10, 16, 27, 33, 67, 77,193; in the Malay middle class 5, 40,49; in UMNO 44–5, 49, 52, 66, 73
Bangkok Metro 108, 118–20Bangkok Skytrain 108, 114, 117,
119–20Bank Bumiputra 43Bank Negara Malaysia 133, 139, 157,
202Bank Rakyat 197BEC see Bumiputra Economic Congressbenchmarks 10, 25, 37, 155, 157, 204Berjaya: Berjaya Group 84, 90, 97–8,
198–9; Berjaya Industrial 84; BerjayaSouth Island 90, 97–8; see also PrimeUtilities Bhd
BNM see Bank Negara MalaysiaBO 53, 61, 198; BO contracts 198Boeing aircraft 137, 148, 150–3;
see also MAS fleet expansionBOO 11, 56–7, 111–12BOT 11, 35–6; in Malaysia 53, 56–7,
61–2, 72, 198; in urban rail 110; in theLRT 111, 113
bourgeoisie (Malay) 42, 50, 65–6;see also businesses, businessmen,capitalist class, capitalists,entrepreneurs, industrialists, Malaymiddle class
British Rail 108–110build-operate-own see BOObuild-operate-transfer see BOTbuild-own see BOBumiputra Economic Congress 43Bumiputra Malaysia Finance 197
Bumiputra National EconomicSymposium 197
bumiputra see Malay corporateownership, Malay middle class
bureaucracy: autonomous 30; Malaysia44–6, 49, 71, 186; meritocratic 30
bus (LRT): feeder bus services 111, 127,201; mergers 112, 123, 124, 127;operators/services 107, 111, 124, 127,201; streamlined bus operations 125–6,127–8, 132, 202; see also Singapore
businesses (Malay) 42–4, 47–8, 51, 66;see also businessmen
businessmen (Malay) 42–5, 47–52,66–68, 72, 74, 96–7; see alsobourgeoisie, businesses, capitalist class,capitalists, entrepreneurs,industrialists, Malay middle class
Campro engine see Protoncandidate choice see selection processcapacity utilization: MAS 142; Proton
162, 168capital accumulation: in Malaysia 40–1,
46, 53, 66, 135, 159, 182, 187–8 process7, 26, 30; state promotion of 30, 34;under privatization 8, 46
capital costs: and privatization 2, 7, 10;and privatization design 35, 40; forairlines 74, 133, 135, 137, 192; for IWK81, 83, 87, 92, 104; for Proton 159, 162,184, 186; subsidies for 13–14, 18, 25,33, 191;
capital formation 15; see also capitalaccumulation
capital gains (IWK) 64, 79, 97, 103capital intensive projects 12–14, 135, 162capital investment: for IWK 76, 78, 80,
84, 87, 90–1, 102–4, 191; for LRT 125,131; for MAS 139; for Proton 159, 161,182, 184, 186, 191; measuring theperformance of 5, 60; and privatisation7, 12, 35; and regulation 80–1;subsidies for 7, 12–13, 82, 107–9
capital works: for IWK 76, 79, 81, 84–8,90, 95, 97, 103, 199; for Proton 168
capitalist class: in developing countries3–4, 31, 193; Malay 6, 50, 57, 63–65,161, 187, 190; state development of 3;see also bourgeoisie, businesses,businessmen, entrepreneurs,industrialists, Malay middle class
capitalists: domestic 3, 7, 15, 17; Malay39–40, 43–5, 47, 186, 190; see also
bourgeoisie, businesses, businessmen,capitalist class, entrepreneurs,industrialists, Malay middle class
capitalization see stock marketcar pooling see high occupancy vehiclescatching up 3, 7, 13, 16, 33, 40, 158;
see also technologyCathay Pacific 138, 140–2, 144, 146, 153CDRC see Corporate Debt
Restructuring CommitteeCEPT 173, 205Citroën 162, 166, 174, 176City Hall see DBKLCKD 165–6, 173, 180clientelism 19, 29clientelist 71clientelistic 30clients 32, 72, 125Common Effective Preferential Tariff
see CEPTcompetition: for MAS 135, 150, 152; in
Malaysia 47–8, 52, 57, 65; for Proton162, 172, 179, 183–4, 186, 194;privatisation and 1–2, 20, 22, 194; forresources 26, 188, 190; regulation and3, 8, 18, 20, 24–5; for resources by theMalay middle class 5, 39, 45, 48–9, 58,68, 72, 75, 190; subsidies and 2; inUMNO 39, 45, 48, 58, 68, 72, 75, 190
competitive: bidding 22, 37, 68;environment/markets 1, 8, 15, 21, 24,54; pressures 21, 70, 137
competitiveness: Malaysia 47, 71; MAS149, 153; Proton 159–60, 163, 167, 171,174, 177, 181–3, 186–7; see alsoprotection
completely knocked down see CKDconcessionaires 22, 25, 33, 80–1, 106,
110; in Malaysia 74–5, 77, 200; IWK78–9, 84, 92, 95–7, 103–4, 191, 199;LRT 106–7, 113–14, 120, 125–6,131–2, 192–3
concessions: in Malaysia 66, 72; andprivatization 35–6, 81, 157; IWK 80–1,84–8, 90–1, 97, 99, 100–1, 199; LRT111–13, 117–18, 124–6, 132, 194; inurban rail 14, 22
conditional subsidies 3, 16, 33, 40, 70, 76,158, 163, 183, 187; see alsoconditionality, learning rents, rents,subsidies
conditionality: failure of 3, 190–1;importance of 33, 68, 189, 194; inMalaysia 40, 70, 73, 75; LRT 132, 183,
226 Index
193; MAS 134; privatization and 159;Proton 158, 160, 186–7, 193–4;see also discipline
conflict: intra-ethnic 66, see alsocompetition for resources by theMalay middle class; inMalaysia/UMNO 40, 48, 51, 57, 66,68–9, 71–3; from social relations 9;state management of 29
consumer preferences 35–6, 81, 91, 94contract 11, 13, 22–4, 34, 189; credible
commitment to 18–19; design 23, 34,36, 73, 80; enforcement 20, 24, 33, 79,194; for LRT 110, 112–13, 200; forProton 164, 177, 180, 185, 187; forwater and sewerage services 80, 92,198; government contracts in Malaysia43, 50, 66; incomplete 23; in MAS 134,152, 154, 202; renegotiation 23, 37;specification 21–4, 27, 33, 36
contracting out 110; in Malaysia 53,55–6, 61
contractors (Malay) 51, 90Corporate Debt Restructuring
Committee 121–2, 148, 203corruption: and development 26, 32; in
Malaysia 201; political context of 29,32; problems of 2, 5, 9, 18–21, 67, 73,194; reducing 21, 26–7, 67;
credible commitment 18–20credible sanctions: failure to enforce 110,
187, 195; importance of 7–8, 24, 28–9,68, 75, 159, 189; see also disciplinarycapacity
cross-subsidies: IWK 91, 104; MAS 137,149; for IWK 79, 91, 103–5
currency depreciation 147, 168, 182, 185
Daim Zainudin: and patronage 48, 71–2,74–5, 97, 192, 197; and Peremba 52;and the political leadership 48, 56, 133;and UMNO 51, 72
David Chew 83, 113DBKL 95, 111–12, 127, 129–130, 202debt: airlines 135, 137; IWK 105; LRT
113–14, 120–2, 125; MAS 140, 144–8,151–2, 156; Proton 166, 170, 184–5,192
debt burden 35, 74, 108; for LRT 106,122, 124, 130–2, 201; for MAS 134,146–8, 151–7, 192; see also debt
debt load see debt burdendebt relief 108, 110democracy 2, 20–1, 26
Department of Environment see DOEDepartment of Sewerage Services see
DSSdepreciation see currency depreciationdesludging (IWK) 87, 88, 95developmental state 4, 9, 29–30, 193–4,
196DGSS 84, 92, 95, 199Director General of Sewerage Services
see DGSSdisciplinary capacity 5, 40, 191; in
Malaysia 40, 65, 68–9, 75, 160–1, 183,187, 191–4
disciplinary constraints 4, 5, 22, 25, 31–3,41; in Malaysia 69, 71
discipline: failure to enforce 3–4, 9;failure to enforce in Malaysia 65, 68–9;failure to enforce on IWK 104; failureto enforce on LRT 110, 125, 194;failure to enforce on MAS 135, 147,151–2, 157; failure to enforce onProton 183, 187, 191, 193–4; failure toenforce under privatization inMalaysia 71–3, 75, 77; market 12, 25,40, 65; reasons to enforce 5, 25, 29, 77,194; see also credible sanctions, ex postpolitical capacity, disciplinarycapacity, disciplinary constraints, statecapacity, state intervention
diseconomies of scale (Proton) 167, 172;see also economies of scale
Diversified Resources Bhd see DRBdivestiture 11, 13–14, 35–6; in Malaysia
53, 55, 57, 139, 157, 190, 202; in MAS139, 157
DOE 83–4, 89, 198domestic parts manufacturers see local
contentDRB 166, 178; see also DRB-HICOMDRB-HICOM Group 185 see also DRB-
HICOMDRB-HICOM 166, 174, 179, 182, 184–6DSS 85–6, 94, 96, 199
Economic Planning Unit see EPUeconomies of scale 70, 76, 158; in Proton
160–4, 170, 179–182; see alsodiseconomies of scale
Edaran Otomobil Nasional see EONefficiency trade-off 39, 44, 192effluents quality/standards 79, 83, 87, 88,
89, 96; see also environmentalstandards
embedded autonomy 29, 30
Index 227

Employees Provident Fund see EPFenforcement see disciplineentrepreneurial capacity: developing 3–4,
7, 15–18, 27–8, 33, 188; Malay 44, 68,70, 84, 90, 133, 157, 190, 192; shortageof 7, 13, 15, 17, 22, 28, 37, 188–9
entrepreneurial class 26entrepreneurs (Malay) 39, 47, 52, 64, 71;
see also bourgeoisie, businesses,businessmen, capitalist class,capitalists, entrepreneurial capacity,industrialists, Malay middle class
Environmental Quality (Sewerage andIndustrial Effluents) Regulations 88
environmental standards (IWK) 76, 84,88–9, 96, 198; targets 78, 191; quality81; pollution 89; see also effluentquality/standards
EON 163, 164, 178–9, 185, 187EPF 200, 201, 203EPU 58, 95, 111–12, 128, 129–130,
197ethnic: considerations/motivations
(Malaysia) 46, 65, 66, 68–9, 73, 160,190; explanations (Malaysia) 66–7, 69;groups 5, 26, 66; imperative 39–40, 66;inequality see inter-ethnic inequality;redistribution 41, 65, 158, see alsoNEP
ex ante decisions 16, 27, 33, 39, 67–8; inMalaysia 65, 67–8
ex ante failure 3, 6, 21, 27–8, 189; IWK78–80, 90–1, 96, 104; LRT 106–7, 124,131–2; in Malaysia 6, 39, 65, 73–4, 76,190–1; MAS 134–5, 147, 149, 151, 157;Proton 159–160, 180, 182, 187; see alsoex ante decisions, institutional failure,state intervention
ex ante mistakes 9, 16, 18–19, 21, 23, 27,33, 38; in Malaysia 65–6, 68, 73, 77,189
ex ante political constraints 9, 195ex post bargaining 22ex post failure 3, 6, 9, 18, 25, 27–8; IWK
78–80, 90–1, 99, 104; LRT 107, 124–6,131; in Malaysia 65, 68–9, 73, 76,189–191; MAS 134–5, 147, 151–2, 157;Proton 159–160, 180, 182–3, 186
ex post political capacity 3, 6, 9, 28–9, 31,33, 38, 40, 194; LRT 107, 126; inMalaysia 65, 77, 79, 193; Proton 187
ex post political constraints: in Malaysia39, 40–1, 69; MAS 157
ex post renegotiation 23
ex post state intervention 16; LRT 125,132; in Malaysia 68, 74–5; MAS 149,156
excise duties see Protonexternalities 12–14, 24, 40
failure see ex ante failure, ex post failure,institutional failure, political failure,privatization failure, state failure
farebox ratios (LRT) 107, 109–10, 121–2,131
feeder bus see busfinancial impropriety (MAS) 149, 152,
157, 193; see also MASmismanagement
First Five Year Plan (Malaysia) 42
Gen-2 (Proton) see Protongolden share 55; in MAS 139–140, 147,
151, 155Gomez see political businessgood governance 21, 24, 26, 34governance 4, 8grants: infrastructure 14; sewerage
services 81–2; urban rail 106, 108–10;utilities 36
Heavy Industries Corporation ofMalaysia see HICOM
HICOM 70, 164–6, 180, 185;see also DRB-HICOM
high occupancy vehicles 127HOV see high occupancy vehiclesHyundai 167, 171–3, 181, 205
IATA 137, 141, 143ICA see Industrial Coordination ActICAO 136, 141, 143, 146, 203Idris Hydraulic Bhd 90, 97–8, 100import duties see Protonincentives: in airlines 133; in auto
industry 158–9; diluted 2, 7, 11, 13–14,18–20, 23–5, 27, 188; improved 2, 7,11–12; in LRT 125, 131–2, 192; inMalaysia (privatisation) 52, 68, 70, 74,105, 191; in MAS 133–4, 147–8, 154,157; perverse incentives see MAS; inProton 159, 163, 187; regulation 2, 18,20, 24, 28, 35, see also regulation; insewerage services 81, 105; in urban rail76, 106–8, 110; structure of 1, 9, 22, 28,30, 35, 38, 68
Indah Water Konsortium see IWKIndustrial Coordination Act 44, 48
228 Index
Industrial Master Plan 48Industrialists 68; Malay 135, 159; see also
bourgeoisie, businesses, businessmen,capitalist class, capitalists,entrepreneurs, industrialists, Malaymiddle class
industrialization 48, 70, 158; role ofProton 158–9, 164, 180; see also lateindustrialization
industry linkages 47–8, 70, 158,163–4
industry problems/challenges: IWK 76;LRT 76, 107, 109; MAS 74, 76, 133–8,157, 192–3; Proton 74, 76, 159–163,187, 192
inefficiency: in Malaysia (privatesector/Malay) 39, 41, 44, 46–7, 66, 75;in Malaysia (public sector) 39, 41, 44,45–6; in MAS 134, 138, 150, 153, 156;in Proton 160; in the private sector 25;in the public sector 1, 25, 80; subsidiesand 2, 25
inefficient: clients 32;enterprises/industries 11, 31, 69, 80,137; Malay bourgeoisie/vendors 66,160, 163, 182; rents 32; see alsoinefficiency
infant industry 3, 40; and Proton 158,163, 180, 183, 186; see also lateindustrialization
information: asymmetric 2–3, 10–11,22–3, 25, 37, 68; available 16, 22, 24,35, 70; constraints 19, 21–3, 27, 65, 74;exchange of 4; failure 21; imperfect 9,19, 21–5, 27, 65; incomplete 23–4, 27,36, 33; problems (IWK) 76, 78–80,90–2, 96, 102, 104, 191–2, 198;problems (LRT) 107, 124, 132
infrastructure 2, 11–15, 21, 24, 27–8, 37;IWK 80, 83, 85, 87; LRT 106, 108–110,117, 124, 128–130, 132; Malaysia 42,56, 60–2, 72, 188, 192
innovation see technology innovationand learning
institutional capacity 3, 10, 16, 18, 25,27–8, 33–4, 78, 189, 195; related toIWK 78, 104; related to LRT 107–8,123; in Malaysia 41, 77; related toProton 158, 183
institutional constraints/problems: IWK83, 90–1, 96; Malaysia 189, 195; MAS133–4, 138–9, 151; Proton 160, 182
institutional failure 3–4, 9, 18, 21, 28, 39;related to IWK 79–80, 83, 95–6, 104;
in Malaysia 39, 71–3, 76–7, 189, 194–5;related to MAS 151
institutional fragmentation: in LRT125–130, 132; in Malaysia 57
institutional:arrangements/design/structures 5, 8,10, 14, 20, 22, 27, 191, 195; change 9,26, 33; conditions for successfulprivatisation 34–8; conventionalinstitutional conditions 2, 8, 21, 24, 26;investors 57, 112, 116
institutions: compatibility of 9, 27, 29,33–4, 194; effectiveness of 8, 17;fragmentation of 32; good governance20, 26, 29, see also good governance,NIE; growth enhancing 28; historicaldevelopment of 8, 18, 26, 189; relatedto LRT 106, 108, 130; in Malaysia 39,41, 52, 57, 60, 73, 75, 189;strengthening of 2, 6, 8, 21, 27, 38, 194;weak 5, 8, 9–10, 18–20, 22, 27, 33, 194
inter-ethnic inequality 41–3, 89intermediate class 17, 31–2; see also
unproductive groups/classes, non-capitalist classes
internal rate of return: IWK 92; LRT 121International Air Transport Association
see IATAInternational Civil Aviation
Organization see ICAOintra-ethnic inequality see conflict: from
social relationsinvestment: in infrastructure 14, 188; in
IWK 78, 80–2, 84, 87, 90–1, 97, 102–4;in LRT 106–111, 120, 125, 131, 200; inMalaysia 42, 46, 48, 59–63, 75–6; inMAS 139, 147–8, 155, 202–3; inProton 158–9, 161, 165, 168, 182, 184,186–7, 191, 204; privatization and 11,14, 16, 18–19, 21, 23–4, 35–6; andregulation 21, 25, 37, 195; role of thestate 31, 193, 195, see also capitalinvestment, underinvestment
Ishak Ismail 74, 98–100, 199IWK: background 80–4; bill collection
79–80, 91, 101, 103, see also IWK non-payment of bills; charges/tariffs 78–9,81–2, see also IWK commercial tariffs,IWK industrial tariffs, IWK tariffrevisions; commercial customers 79,82, 91, 93–4, 104; commercial tariffs93–5, 99–102; financial performance91, 101–3; government loans 100–1;industrial customers 79, 82, 91, 93,
Index 229

99–100, 104; industrial tariffs 93–4,99–102; non-payment of bills 79, 82,91, 93–4, 96, 99, 101–2, 104; ownershipchanges 74, 79, 90, 97–8, 100, 103,see also concessionaires, ownership;performance 84–90; profit projections95–7, 101, 103, see also IWK financialperformance; profitability 90;refurbishment 85–8, 90, 92; tariffrevisions 90, 99, 100–2; servicecoverage 84–6, 90, 104
Japan 29; imported parts (Proton) 176–7,184; LRT 113, 200; urban railways108–110
Japanese: cars/manufacturers 164, 172,174, 180; director/management(Proton) 174, 181; loans (Proton)165; partner (Proton) 160, 180,205
JIT 171, 177, 204; see also Protonjust-in-time see JIT
Khazanah 165, 171, 184, 186, 200–201,205
KL Monorail: background 113–14;construction and delivery 117–18, 125,194; fares 120, 126; financialperformance 120, 122–3, 125;financing 115–16; ridership 120–1;state loans 114
KLSE 57, 62, 64, 165KLTG see Kuala Lumpur Transit GroupKuala Lumpur City Hall see DBKLKuala Lumpur Light Rail Transit
see LRTKuala Lumpur LRT see LRTKuala Lumpur Monorail see KL
MonorailKuala Lumpur Stock Exchange see
KLSEKuala Lumpur Transit Group 112KWAP 201, 203
late industrialization 3, 158; see also lateindustrializers, infant industry
late industrializers 26, 29, 161learning rents 8, 12–13, 16, 18, 22, 28, 31,
34–5, 38, 188–9, 194; in Malaysia 40–1,47, 52, 65–6, 68, 70–1, 190;management of 16, 27–9, 33;management of learning rents inMalaysia 74–6, 161, 182–3, 187, 192;for Proton 76, 158–9, 163, 180, 182–3,
191; under privatization in Malaysia53, 190–2, 194
learning-by-doing 3, 16; in Malaysia 47,70, 192
linkages: backward 158, 163–4; forward164; industry 47–8, 70; state-economic30; technological 70
loan maturity 13, 116local component cost/manufacture
(Proton) 163–5, 168, 178, 180;see also local content
local content (Proton) 76, 159, 161,164–5, 167, 176–178, 180, 182, 204; seealso Vendor Development Programme,local component cost/manufacture
local government authorities 85, 87,91–2, 102, 129–130, 199
local vendors (Proton) 163, 168, 177,181–2
Lotus 174, 176, 179,LRT System 1 see STARLRT System 2 see PUTRALRT System 3 see KL MonorailLRT see KL Monorail, PUTRA, STAR
Mahaleel see Tengku MahaleelMahathir Mohamad: background 48;
centralization of authority in UMNO49, 58, 67, 71, 73, 197; patron-clientrelationships 52, 71–72, 74, 98, 155,166, 192, 197; privatization 48, 57, 68,71, 197–8; role in Proton 164, 166, 173,180, 183–4, 198, 204–5
Malay corporate ownership 41–4, 47,50–3, 55, 63–4, 89–90, 190
Malay middle class 5, 6, 42; andeconomic redistribution 43–4, 49, 55;characteristics 47, 53, 55; composition43, 45, 49–50, 196; conflict 45, 49–50,73, 190; emergence 39–41, 43–4, 49, 73,190; size 39, 49
Malay share of capital see Malaycorporate ownership
Malaysia Airlines see MASMalaysian Chinese Association 42Malaysian Helicopter Services see MHSMalaysian Indian Congress 42Malaysian Industrial Development
Authority 180Malaysian Industrial Policy Study 69management contracts 35–6, 53, 57market failure 8, 18–20, 24MAS Cargo 134, 153–5, 193, 203MAS Catering 134, 153–5, 193
230 Index

MAS: background 133–4, 138–140;breach of duties 154; debtrestructuring 146–7; domestic sector134, 138, 141–3, 147, 149, 152, 156–7;financial performance 143–7, 149–150,152–4, 156, 158–9; fleet expansion 134,138, 142–4, 149–153, 155–6; 191;international sector 138, 141–3,149–150, 152; mismanagement 147,152, 155, 157, 193; operating efficiency141–3; passenger yield 140–3; perverseincentives 134, 154, 157; profit centres153, see also MAS Cargo, MASCatering; yield management 149, 152
MC see Mitsubishi CorporationMCA see Malaysian Chinese
AssociationMHS 139, 148, 155; see also NaluriMIC see Malaysian Indian CongressMIDA see Malaysian Industrial
Development Authoritymiddle classes 15, 26, 32; see also
intermediate class, Malay middle classMinistry of Entrepreneur Development
129Ministry of Finance see MoFMinistry of Transport see MOTMitsubishi Corporation 164Mitsubishi Motor Company 164–5Mitsubishi 163, 165, 174, 176, 180–1;
see also Mitsubishi Corporation,Mitsubishi Motor Company
MMC see Mitsubishi Motor CompanyMoF: and IWK 84, 89, 95, 98–100, 200;
and LRT 114, 120, 130, 200–1; andMAS 139, 140, 202–4; andprivatization 56–8; and Proton 204
monitoring: constraints to 14, 25; ofIWK 94, 96, 198; of LRT 107, 123,131; in Malaysia 46, 54, 69–70; ofMAS 134, 147, 151, 154; privatizationand monitoring 1, 7, 11, 35–6;regulation and monitoring 3, 25, seealso conditional subsidies, information
monopoly: environment 16, 24; pricing14; rents 75, 78, 96–7, 103, 106, 124–5
monorail see KL Monorailmoral hazard 5, 13, 25, 28; in Malaysia
41, 72, 75, 77; LRT 106–7, 110, 124,132; in MAS 133, 135, 147, 157; inProton 160, 187
MoT 111, 129–30
Naluri 139, 148–9, 154
national car project see Protonnational sewerage system see IWKNEP: inefficiencies 41, 45–8, 66–7, 73,
163, 180; institutions 52, 57; legacy 41,135, 180, 187, 192; and the Malaymiddle/capitalist class 6, 39–41, 43,48–52, 66, 73; objectives 41, 44, 84,181, 186; origins 42; and patronage65–6; and privatization 39–41, 46, 48,51–5, 190; programmes 44–5; andredistribution 39, 43, 49, 69, 73, 197–8;targets 45, 63–5, 89, 163
network coverage (LRT) 108, 109, 111New Economic Policy see NEPNew Institutional Economics see NIENIE 19non-capitalist classes/groups 26, 32, 194;
see also unproductive groups/classesnon-competitive sectors 27, 72, 161,
185–6, 192–3; see also non-tradablesectors
non-performing capitalists/privateowners 28, 31, 77; see also capitalistclass
non-performing loans see NPLsnon-tradable sectors 47, 53, 64, 72, 185;
see also non-competitive sectorsnon-transparent selection process
(Malaysia) 53, 57, 72–3, 190North West Water 83–4, 96, 198NPLs 59–60, 198NWW see North West Water
ownership: of IWK 74, 79–80, 84, 89–90,97–8, 100, 103–4; of LRT 114, 116,125; see also private ownership, Malaycorporate ownership; of MAS139–140, 147–8, 151, 155, 194; ofProton 165–7, 184, 186–7
patron see patronagepatronage: in Malaysia 5, 45, 49–51, 57,
65, 67–9, 73, 190, 194; in MAS 148; inProton 183, 187; problems of 2, 18, 21,194; see also patron–clientrelationships, patron–client networks
patron–client networks: in IWK 79; inLRT 124–5, 194; in Malaysia 39, 41,49, 53, 58, 69, 71–3, 75, 194; in MAS13, 194; in Proton 187; and resourceallocation 4, 26, 32, 189; see alsopatron–client relationships
patron–client relationships 32–3, 38; andresource allocation 33; in Malaysia 5,
Index 231
41, 50, 65, 71–2, 77, 191; in MAS 147,157; in Proton 160, 187; see alsopatron–client networks
Peremba 52, 74perverse incentives see incentivesPetronas 166, 171, 178political business 67, 69PPP see public–private partnershipPrime Utilities Bhd 84, 90, 97–8,
100–101, 200,primitive accumulation 7principal agent theories 10–11private ownership 1, 7, 10–12, 20, 27,
133, 159, 187; see also property rightsprivatization in Malaysia: background
53–58; beneficiaries 5, 41, 55, 67, 71–4;characteristics 52–3, 55, 57, 65, 72–3,127–8, 151, 159, 190; contracts 52, 53,55, 57, 72–3, 79, 112–13, 134, 198;failure 5; modes 53–55, 57, 61, 73;motivations for privatization 5, 41–52;performance 58–64
privatization: and the creation ofcapitalists 3, 8, 15, 17, 28, 31;conditions for successful privatization2, 3–4, 6, 8–10, 16, 18, 21–4, 27, 33–7;motivations for privatization 7–10,16–18, 26–7; reasons for failure 2, 3,7–10, 18–22, 24–5, 28–9; theoreticalproblems 13–15, 21–3, 25; theory 1, 2,7–12, 14, 17
profit guarantees 90, 98, 199Projek Usahasama Transit Ringan
Automatik see PUTRAproperty rights: absence of clearly
designated property rights 13–14, 18;allocation/reallocation of 3, 25–6, 28,31, 33, 40, 157, 194; clearly designated7; and efficiency 10–11, 13;safeguarding 19–20
protection 25, 70; under the NEP 46–8,69; in Malaysia 42; under privatizationin Malaysia 65, 190–1; for Proton 74,76, 159–161, 167–8, 173–4, 179–180,182–3, 187, 193–4, see alsocompetitiveness
Proton: background 76, 163–6; Camproengine 170, 174, 176, see also Gen-2;excise duties 163, 165, 168, 175, seealso import duties, protection; exports76, 160, 171–3, 179, 181, 186, see alsocompetitiveness; financialperformance 167–9, 172, 176, 185–6;Gen-2 174, 176, see also technology
acquisition and catching up; importduties 165, 173, 183, see also exciseduties; market share 161, 174, 176,178–9, 184–6; production 165, 167–8,170–2, 179–181, 185; profitabilitysee Proton financial performance;Saga 165, 181, 184; sales 164, 168, 170,179–180, 184–5, see also Protonexports; Satria 166, 174, 178; Waja174, 176, 178, 184
Proton City 171, 184; see also ProtonProton Edar 179, 185; see also USPDPUB see Prime Utilities Bhdpublic choice theories 10–11, 17, 66, 104public enterprises see SOEspublic–private partnership 14, 188PUTRA: background 76, 112–14;
construction and delivery 117–19;fares 118, 120; financial performance120–2; financing 115–16; ridership120–1; state loans 116
R&D see technologyrace riots 41, 66Railtrack 108–110rate of return: for IWK 79, 92; for LRT
108–9, 121redistributive policies (Malaysia) see
NEPregulation: broader definition of 2–4,
13–14, 18, 25, 27–8, 34; effectiveregulation 3, 6, 9, 18, 25, 34–7, 189,195; of IWK 76, 79–82, 95–6, 103–5;of LRT 111, 128–130; of MAS 138,141; under privatization 3, 8, 11–12,14–15, 19–22, 24–5, 194; ofprivatization in Malaysia 53, 57–8, 65,71–3, 75, 190; of Proton 76, 159, 183;of subsidies 8, 16, 18, 25, 28, 188–9,196; of urban rail 107–8; price capregulation 196; rate of returnregulation 196; regulatory capacity 9,18, 25, 27, 35–6, 189; regulatorycapture 19, 23, 29; regulatoryconstraints 17, 18, 27, 29, 33, 188;regulatory independence 19, 24, 34
regulatory see regulationrenationalization 28; of IWK 79, 104; of
LRT 107, 111, 113–14, 201; inMalaysia 5, 39, 53, 59; of MAS 134–5,140, 147, 149, 154–7, 193; of Proton161, 167, 176, 179, 182, 186
Renault 174, 176Renong 60, 112, 114, 116, 125, 200–1
232 Index
rentier: activities 67; behaviour 47;bourgeoisie 65; business cadre 52;managers 46; rewards 65; sectors 53
rents: and capital accumulation 26;construction rents (Malaysia) 106,110, 118, 124–5, 132, 193; dynamicrents 8; in Malaysia 51–2, 56, 65, 67,69, 70, 75, 192; inefficient rents 12, 32;management of rents 16, 25, 27, 31–3;management of rents (Malaysia) 159,160, 183, 187, 192, see also learningrents, conditional subsidies; monopolyrents (Malaysia) 78, 96–7, 103, 161;short-term rents (Malaysia) 154, 161,182, 185, 187, 192–3; unproductiverents 12
rents for learning 7; see also learningrents
rent-seeking 12; in Malaysia 45, 65,67
residual: claimant 13; control/returns 2,11, 13–14, 25, 158, 188; rights 12; value138
RIDA see Rural Industrial DevelopmentAuthority
ridership (urban rail): Bangkok Skytrain108, 111; challenges 107–110; LRT111, 114, 120–2, 125–8, 130, 191, 193
Roxy Electric Industries 148; see alsoTRI
Rural Industrial Development Authority43
Saga (Proton) see ProtonSaleh Sulong 166, 204–5sanctions see credible sanctionsSatria (Proton) see Protonselection process (transparent) 21–2,
26–27, 34, 37, 68; see also non-transparent selection process
sewerage services see IWKsewerage treatment plants see STPsSIA 138, 140, 143, 144, 146, 153signalling see stock market signallingSingapore: bus services 130; urban rail
107, 109–110, 113–14, 117–120, 123,125, 130–2, 192–3
Singapore International Airlines see SIASistem Transit Aliran Ringgan see STARsocial relations 4–6, 9, 26, 29; in Malaysia
39, 41, 48, 52, 65–6, 69, 73, 75, 77, 79,190, 193–5
SOEs 11–12, 14, 44–6, 48, 51, 54–5, 60–2,60, 71, 158, 190, 198
South Korea 26, 29, 31–2, 47, 68–9, 183;see also Hyundai
Sports Toto 60–1STAR: background 76, 112–14, 116;
construction and delivery 117–19;fares 118, 120; financial performance120–2; financing 114–16; ridership120–1; state loans 116
state autonomy 30, 66state capacity 4, 6, 10, 29–34, 67, 125,
193; ex post 3, 6, 9, 16, 23, 28–9, 33, 38;ex post (Malaysia) 40, 41, 69–70, 75,77; 79, 157, 187, 193–4; see alsoinstitutional capacity, politicalcapacity, disciplinary capacity
state failure 4, 8–9, 18, 29, 160, 189, 193;see also ex ante failure, ex post failure
state intervention: arguments against 2,7, 18, 20, 40; effective stateintervention 9, 31, 190, 194; ex ante16, 31, 33; necessity for 3–4, 7, 9, 13,16, 27, 33, 188–9; see also statecapacity, conditional subsidies,learning rents
state intervention in Malaysia: early stateintervention 42–3; ex post state 74; inrelation to IWK 79, 105; in relation toLRT 131–2; in relation to MAS 157;under NEP 51, 55, 65, 66, 69; underprivatization 190
state owned enterprises see SOEsstock market: listing 62; capitalization
61–2; signalling 62, 192; see also KLSESTPs 83–9, 92, 96, 104, 199subsidies: for learning 7–8, 16, 40, see
also learning rents; for LRT 106,108–111, 125, 131; for MAS 133–3,137, 149, see also cross-subsidies;management and regulation ofconditional subsidies 3–4, 8, 12–13, 16,18, 24–5, 27–9, 33, 36, 40, see alsosubsidies for learning; management ofsubsidies in Malaysia 40, 47, 65, 70, 75,77; necessity of subsidies 2–3, 7,12–16, 18, 35–6; for Proton 158, 159,161, 163, 167, 183, 187–191, 195
Tajudin Ramli 74, 139–140, 148–150,152–5, 203–4
TaylorWoodrow see TaylorWoodrow-Adtranz
TaylorWoodrow-Adtranz 112, 116, 200technical capacity (regulatory) 24–5, 37technological see technology
Index 233
technology: acquisition and catching up3, 7, 15–16, 33, 40, 158–9; acquisitionand catching up (Proton) 41, 76, 98,159–161, 163, 167, 174; andprivatization 71; challenges (IWK) 76,80, 84, 89; challenges (Proton) 74, 76,158–9, 161–4; innovation and learning70; performance (Proton) 159–161,167, 174, 176–7, 179–187; problems(NEP) 41, 46–8, 67, 70
Technology Resources Industries Bhdsee TRI
Telekom Malaysia 57, 60–3Tenaga Nasional Bhd 57Tengku Mahaleel 166, 179, 184, 186, 205Thai Airways 140–2, 144, 146–7, 173TOCs 108–9train operating companies see TOCstransaction costs 12, 19, 22, 110transparency 2, 8, 20–4, 26, 34, 194transparent selection process see
selection processTranswater 90, 97–8TRI 139, 148, 152
UDA 52, 197, 203UMNO: in business 49–50, 60, 112, 125;
centralization of power 51, 57–8, 73,190; changing balance of power 45,49–52, 66–7, 73; factions /factionalstruggles 50, 51; leaders 45, 50;membership 42–5, 49–50; the emergingmiddle class in UMNO 50, 66, 73, 190;patronage 49–50, 66; patron-clientrelationships 50, 72–3, 75, 97–8, 112,
194; political contestation 40, 50–1, 71,190, 192, 194
underinvestment 11, 14; in IWK 78United Malays National Organisation
see UMNOuniversal: access 78; coverage 82; service
obligations 2, 15, 109unproductive groups/classes 4, 7, 26–7,
31, 32, 34, 194; entrepreneurs 28Urban Development Authority see UDAurban rail: capital costs 73, 107–110,
131–2, 193; features 106; financing 107Usahasama Proton-DRB Sdn Bhd
see USPDuser pays principle 94–5, 109USPD 166, 178–9, 204–5
VDP see Vendor DevelopmentProgramme
Vendor Development Programme 160,177, 182
Vincent Tan 74, 84, 96–8, 113, 198
Waja (Proton) see ProtonWan Adli Wan Ibrahim 74, 90, 97–8, 100water quality see environmental
standardswelfare concerns/considerations 13, 18,
35, 188willingness to pay see consumer
preferences
Yahaya Ahmad 74, 166–8, 174, 177–8,204,
yield management (MAS) 149, 152–3,156
234 Index