pró- e-bike : eletric assist cargo bikes & trickes: boys` toys or business tools?
TRANSCRIPT
Jorge León ITENE - Packaging, Transport & Logistics Reseach Center
Valencia (Spain)
Electric assist cargo bikes & trikes: boys’ toys or business tools?
1. PRO-E-BIKE project2. Pilot projects:
§ Sweden§ Spain§ Netherlands§ Italy
3.PRO-E-BIKE Simulation Tool4.Conclusions
Index
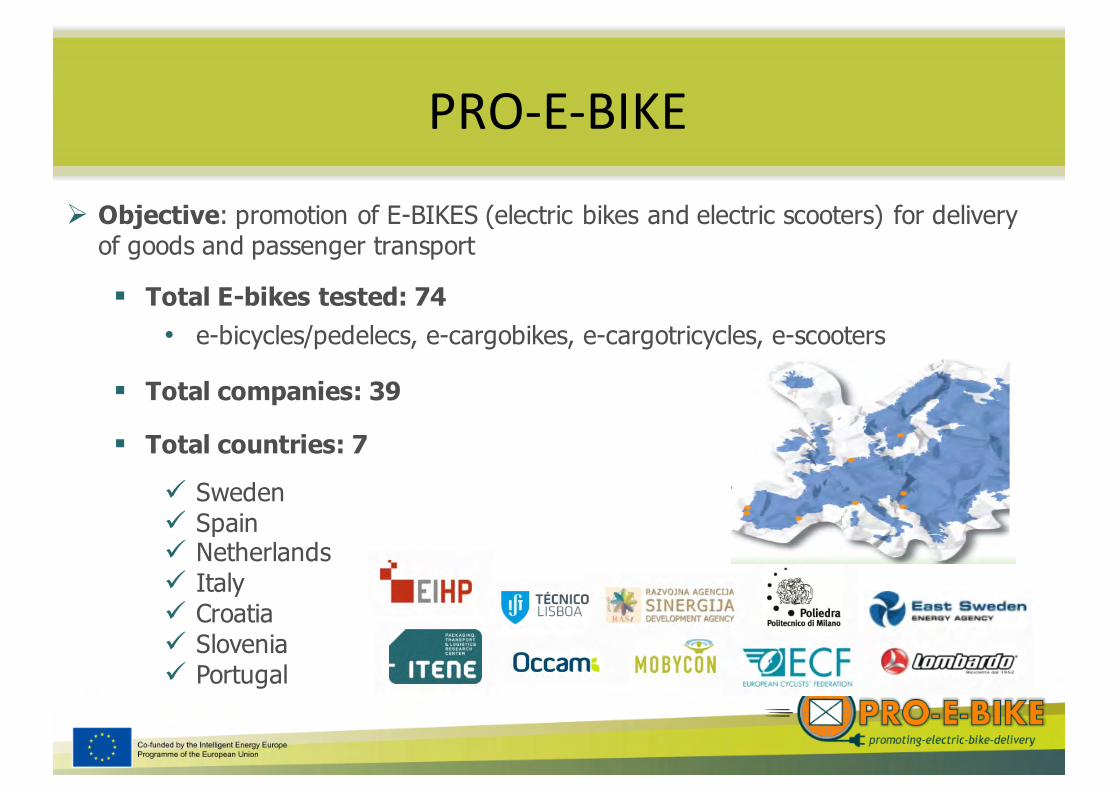
§ Total E-bikes tested: 74 • e-bicycles/pedelecs, e-cargobikes, e-cargotricycles, e-scooters
§ Total companies: 39
§ Total countries: 7
ü Swedenü Spainü Netherlandsü Italyü Croatiaü Sloveniaü Portugal
PRO-‐E-‐BIKE
Ø Objective: promotion of E-BIKES (electric bikes and electric scooters) for delivery of goods and passenger transport
Company profiles
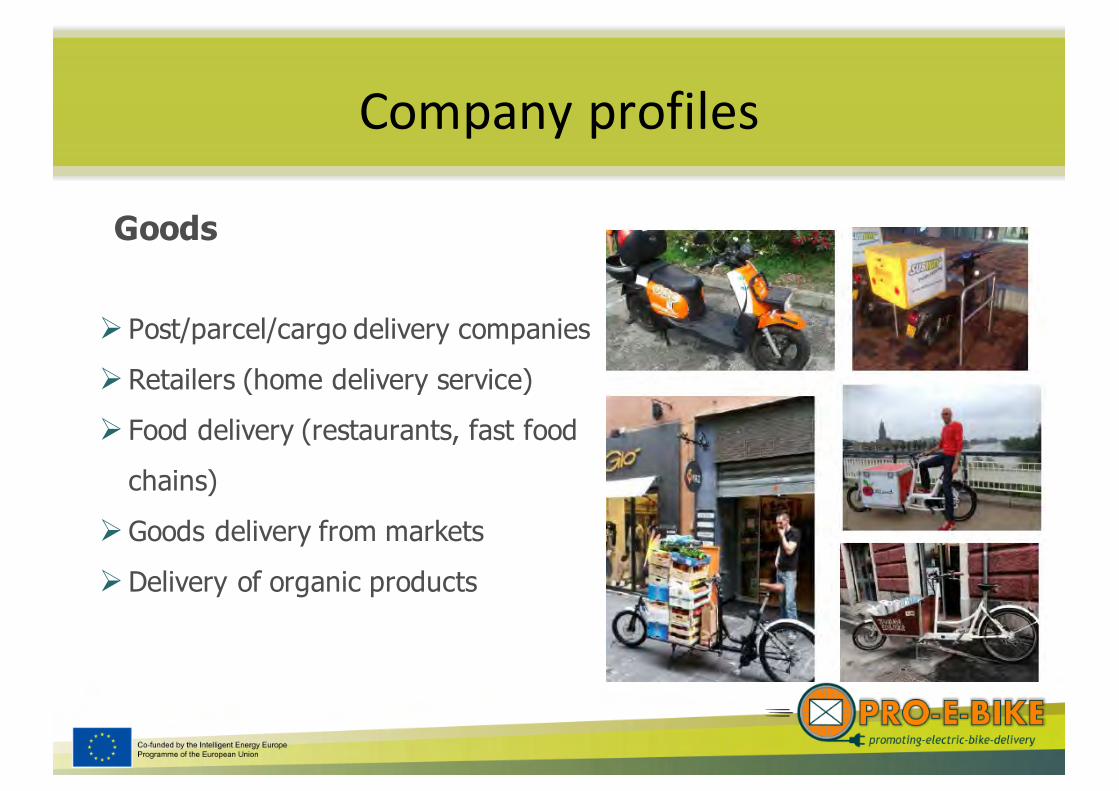
Ø Post/parcel/cargo delivery companiesØRetailers (home delivery service)Ø Food delivery (restaurants, fast foodchains)
ØGoods delivery from marketsØDelivery of organic products
Goods
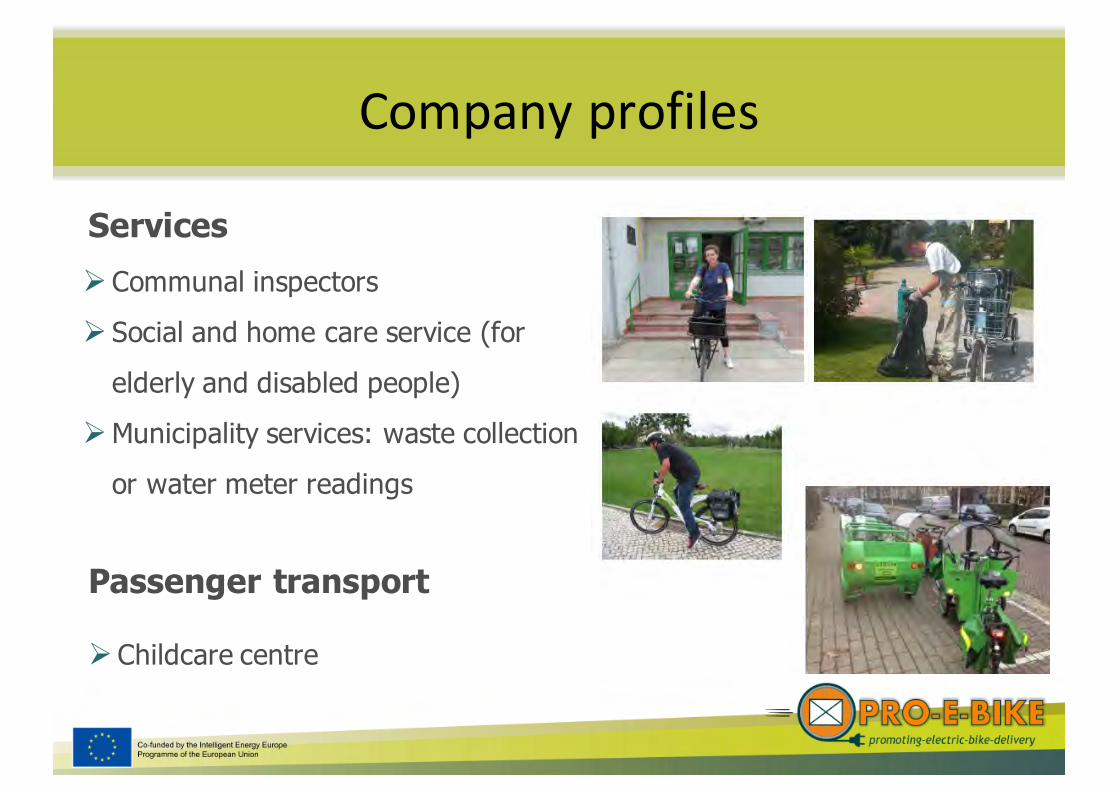
Company profiles
ØCommunal inspectorsØ Social and home care service (forelderly and disabled people)
ØMunicipality services: waste collectionor water meter readings
Services
Passenger transport
ØChildcare centre
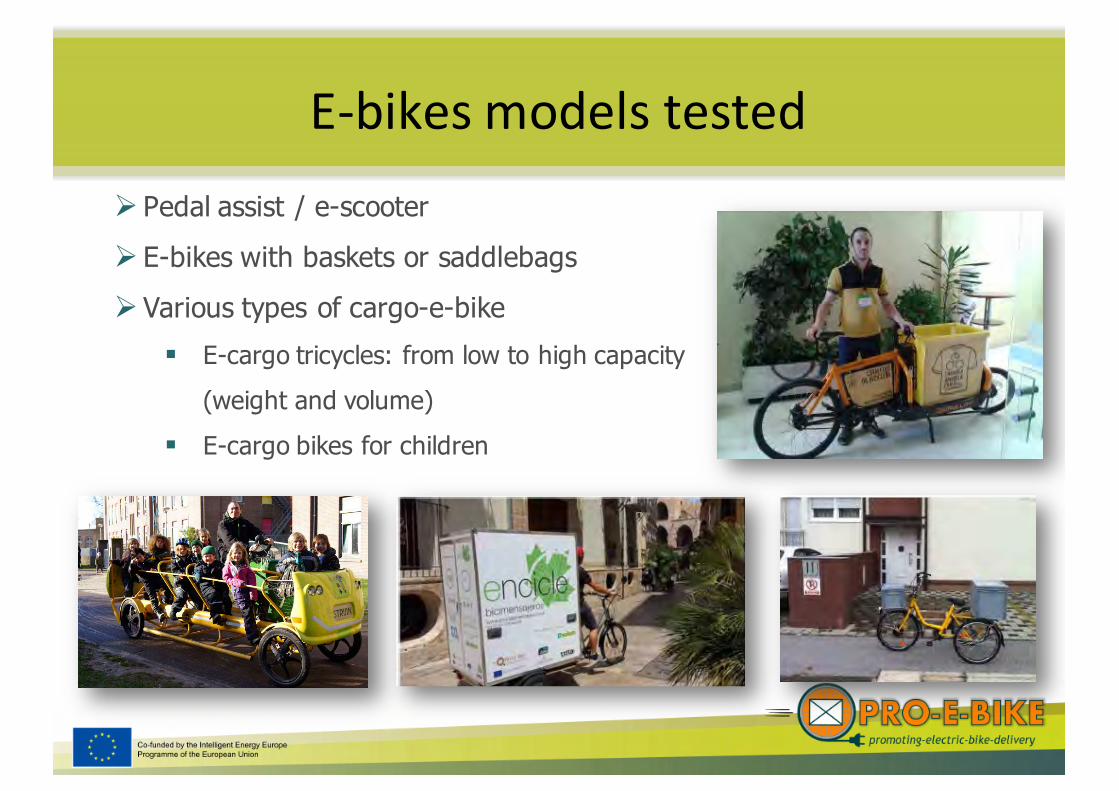
E-‐bikes models testedØ Pedal assist / e-scooterØ E-bikes with baskets or saddlebagsØVarious types of cargo-e-bike
§ E-cargo tricycles: from low to high capacity(weight and volume)
§ E-cargo bikes for children
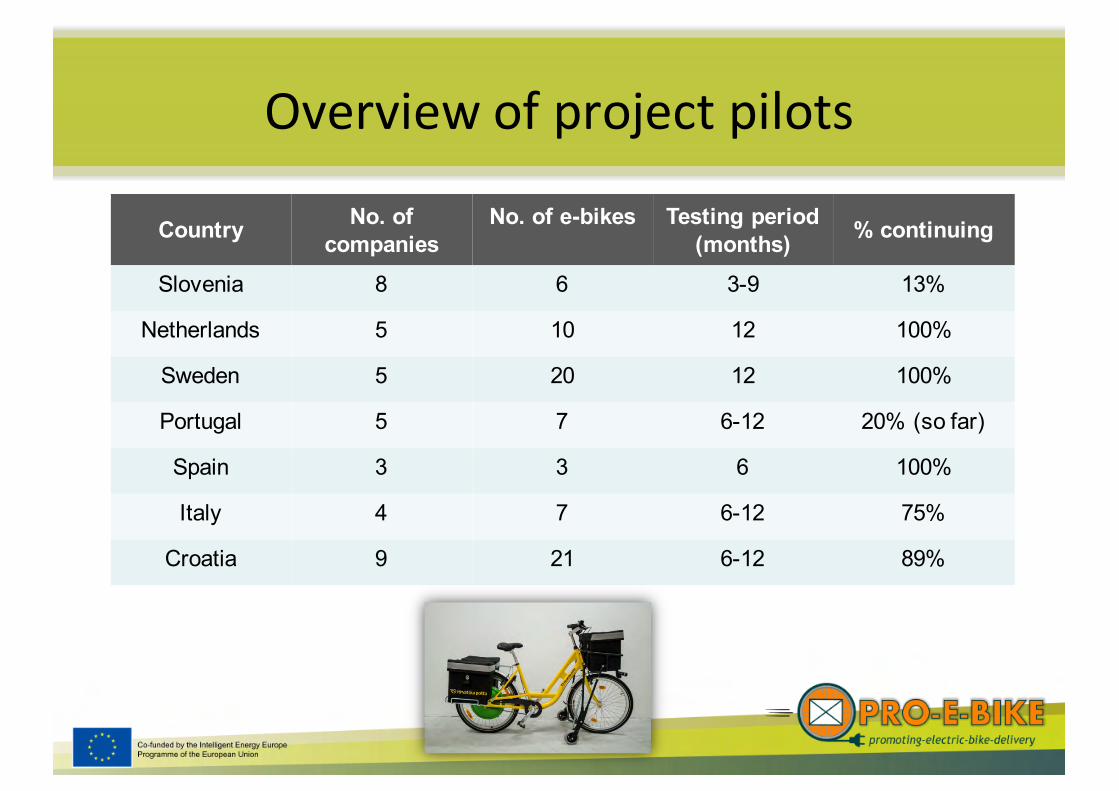
Overview of project pilots
Country No. of companies
No. of e-bikes Testing period (months) % continuing
Slovenia 8 6 3-9 13%
Netherlands 5 10 12 100%
Sweden 5 20 12 100%
Portugal 5 7 6-12 20% (so far)
Spain 3 3 6 100%
Italy 4 7 6-12 75%
Croatia 9 21 6-12 89%
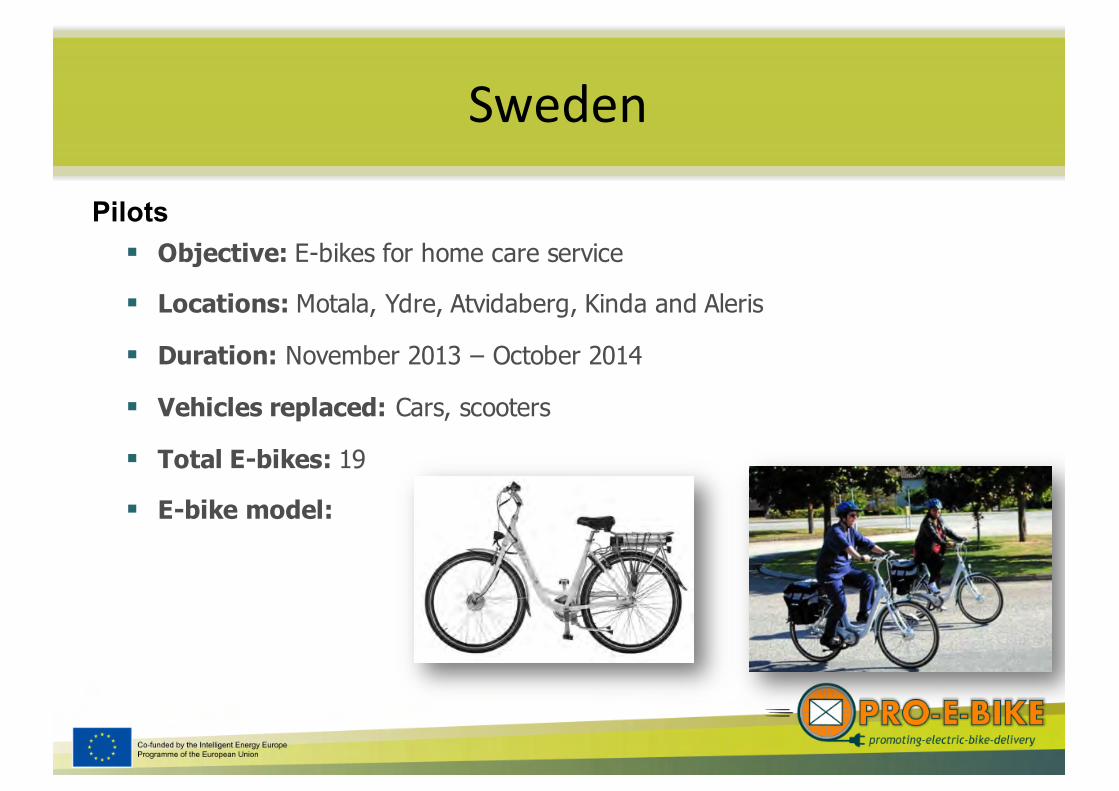
Sweden
§ Objective: E-bikes for home care service
§ Locations: Motala, Ydre, Atvidaberg, Kinda and Aleris
§ Duration: November 2013 – October 2014
§ Vehicles replaced: Cars, scooters
§ Total E-bikes: 19
§ E-bike model:
Pilots
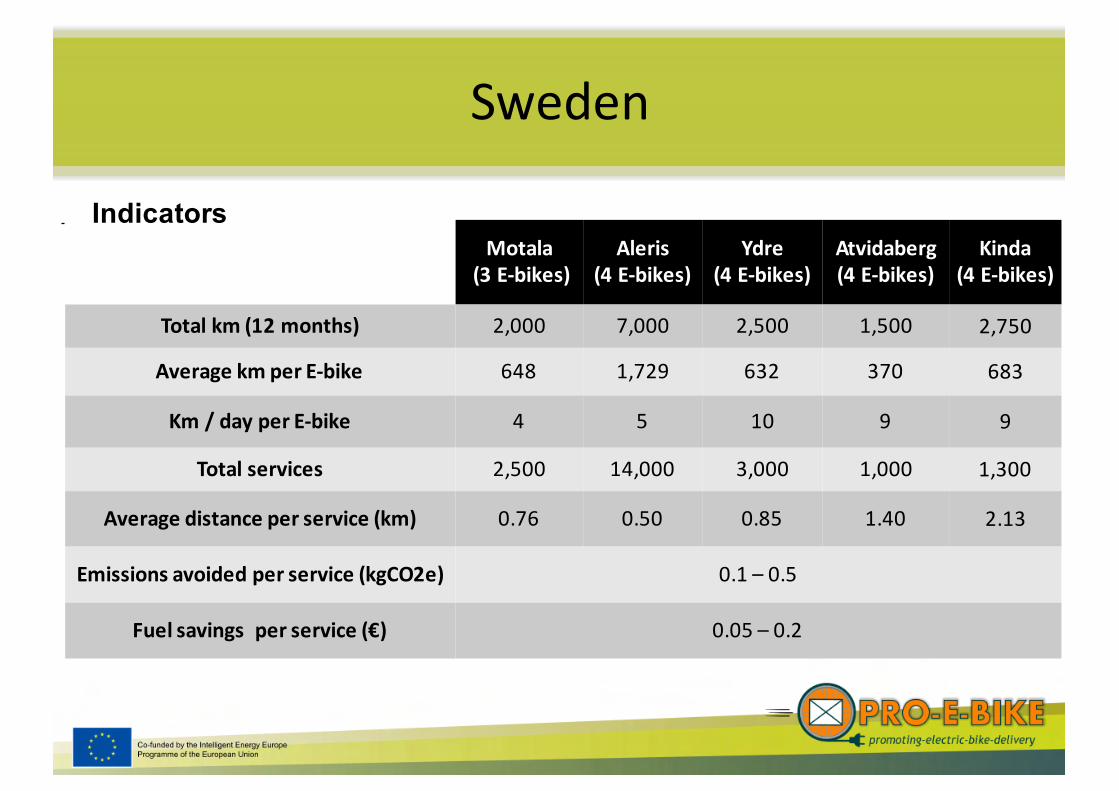
Sweden
Motala(3 E-‐bikes)
Aleris(4 E-‐bikes)
Ydre(4 E-‐bikes)
Atvidaberg(4 E-‐bikes)
Kinda(4 E-‐bikes)
Total km (12 months) 2,000 7,000 2,500 1,500 2,750
Average km per E-‐bike 648 1,729 632 370 683
Km / day per E-‐bike 4 5 10 9 9
Total services 2,500 14,000 3,000 1,000 1,300
Average distance per service (km) 0.76 0.50 0.85 1.40 2.13
Emissions avoided per service (kgCO2e) 0.1 – 0.5
Fuel savings per service (€) 0.05 – 0.2
Indicators
Sweden
Lessons learnt
§ Employees satisfied with the E-bikesØHealth (less stress) and environmental effects
§ Winter time: weather conditions affect the use of E-bikes ØProtective clothing needed in autumn / winter ØLoss of battery power
§ Maintenance deals: repairs / service § Organizational difficulties
Ø Hard to replace some car trips Ø Snow and cold
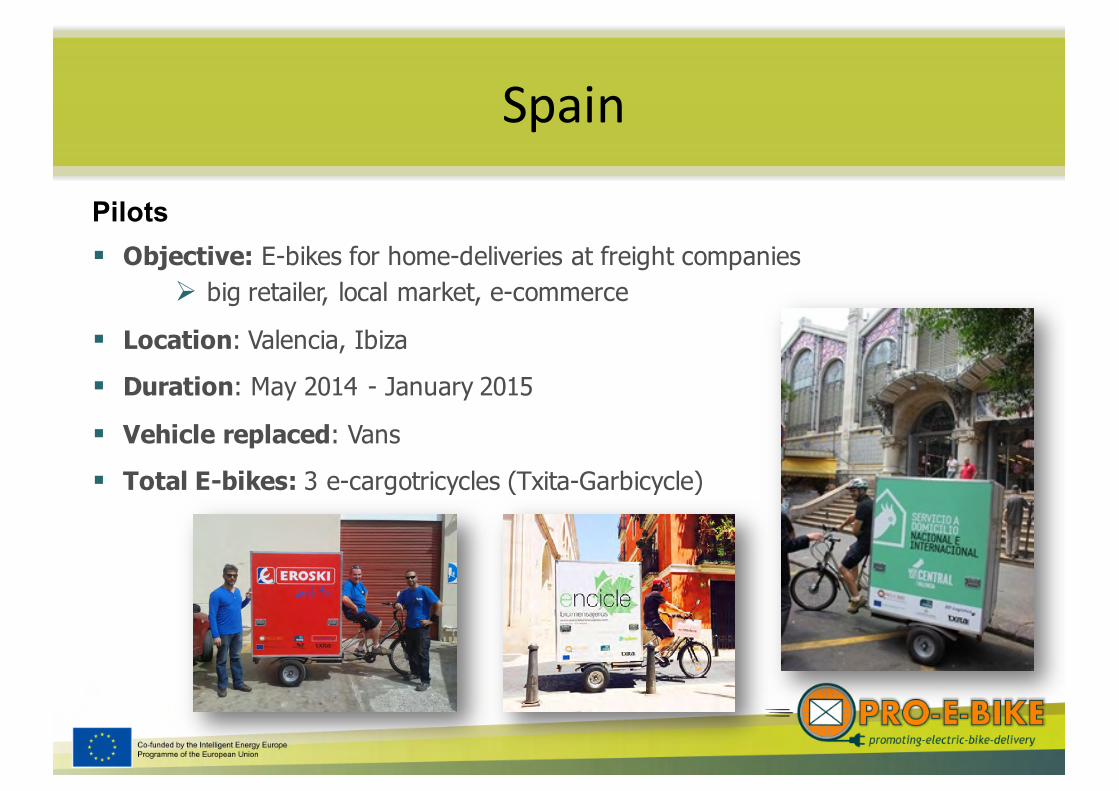
§ Objective: E-bikes for home-deliveries at freight companiesØ big retailer, local market, e-commerce
§ Location: Valencia, Ibiza§ Duration: May 2014 - January 2015
§ Vehicle replaced: Vans§ Total E-bikes: 3 e-cargotricycles (Txita-Garbicycle)
Spain
Pilots
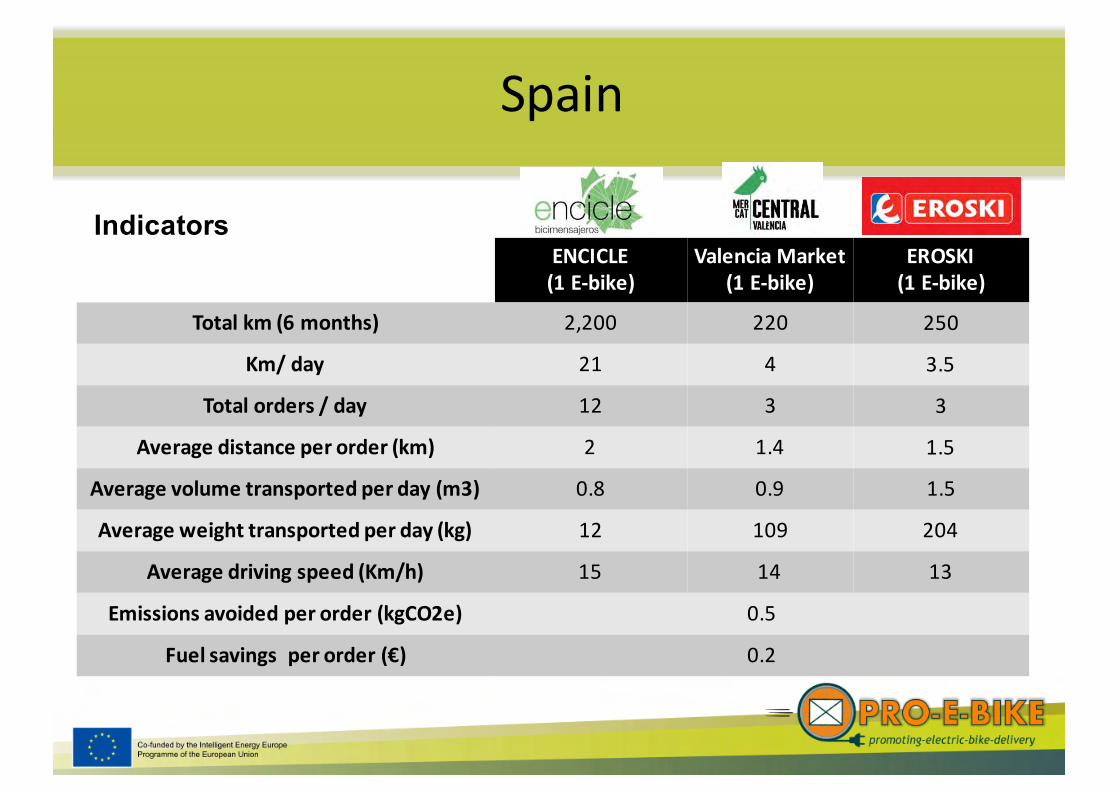
ENCICLE (1 E-‐bike)
Valencia Market (1 E-‐bike)
EROSKI (1 E-‐bike)
Total km (6 months) 2,200 220 250
Km/ day 21 4 3.5
Total orders / day 12 3 3
Average distance per order (km) 2 1.4 1.5
Average volume transported per day (m3) 0.8 0.9 1.5
Average weight transported per day (kg) 12 109 204
Average driving speed (Km/h) 15 14 13
Emissions avoided per order (kgCO2e) 0.5
Fuel savings per order (€) 0.2
Spain
Indicators
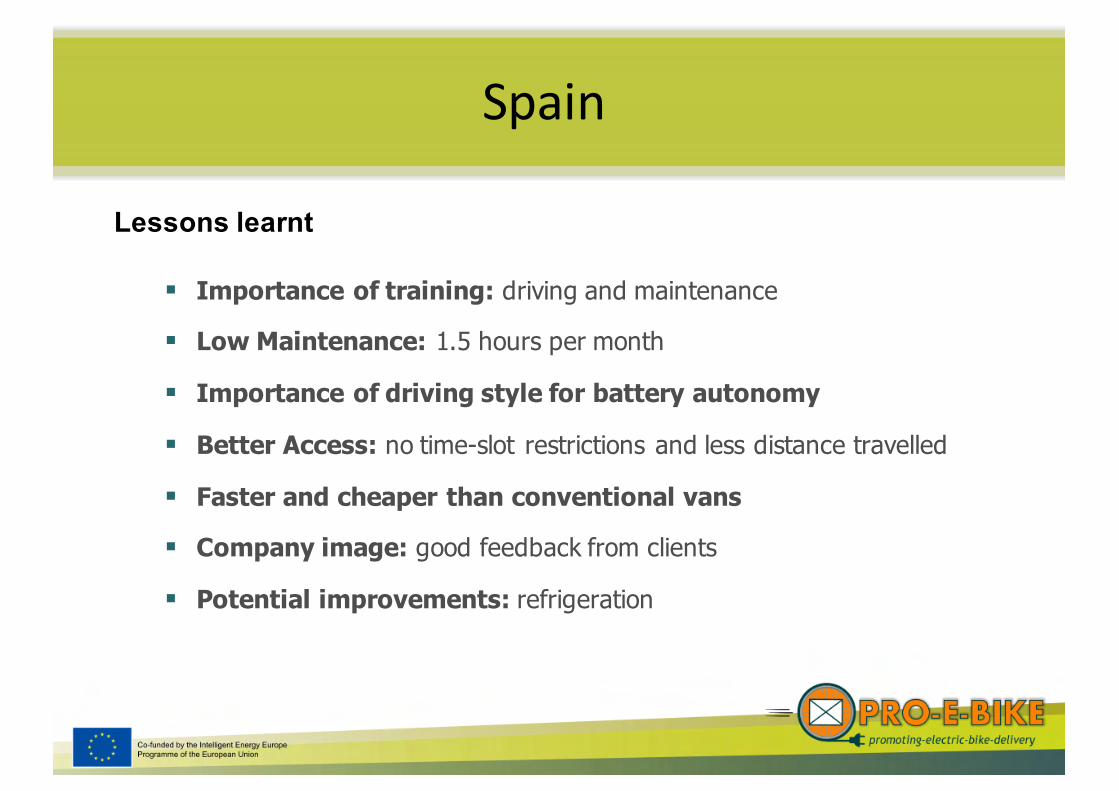
Spain
§ Importance of training: driving and maintenance
§ Low Maintenance: 1.5 hours per month
§ Importance of driving style for battery autonomy
§ Better Access: no time-slot restrictions and less distance travelled
§ Faster and cheaper than conventional vans
§ Company image: good feedback from clients
§ Potential improvements: refrigeration
Lessons learnt
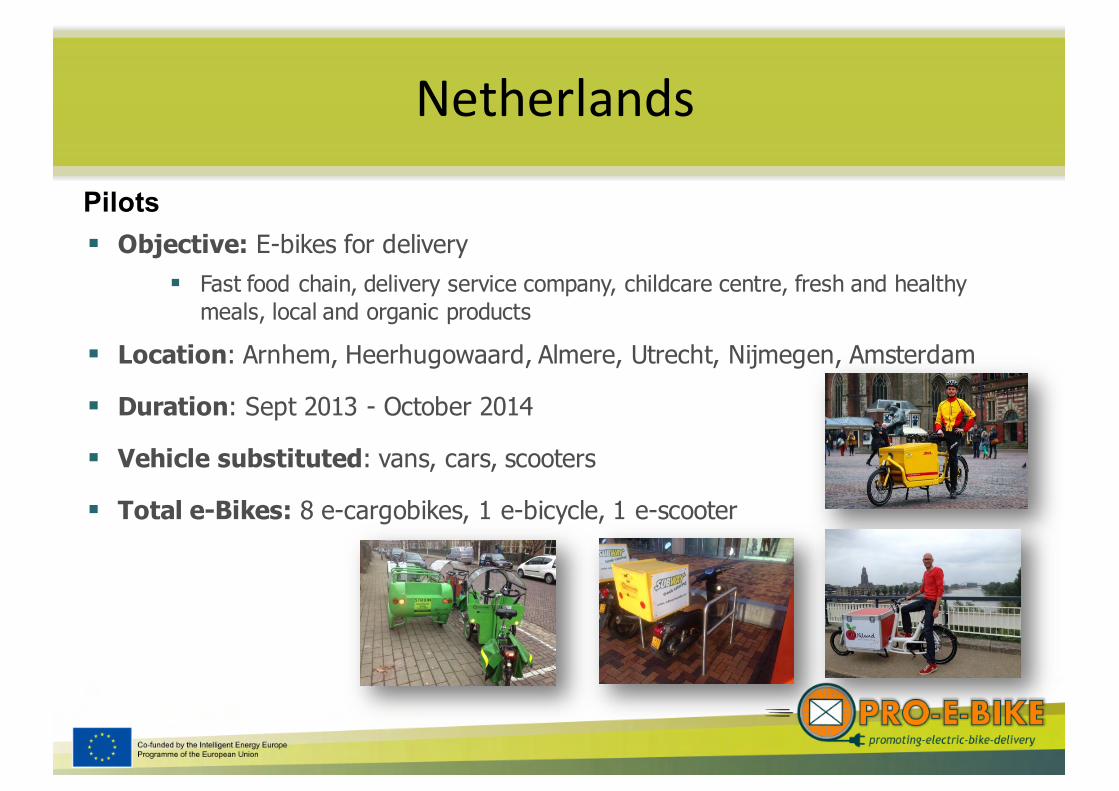
§ Objective: E-bikes for delivery§ Fast food chain, delivery service company, childcare centre, fresh and healthy meals, local and organic products
§ Location: Arnhem, Heerhugowaard, Almere, Utrecht, Nijmegen, Amsterdam
§ Duration: Sept 2013 - October 2014
§ Vehicle substituted: vans, cars, scooters
§ Total e-Bikes: 8 e-cargobikes, 1 e-bicycle, 1 e-scooter
Netherlands
Pilots
Netherlands
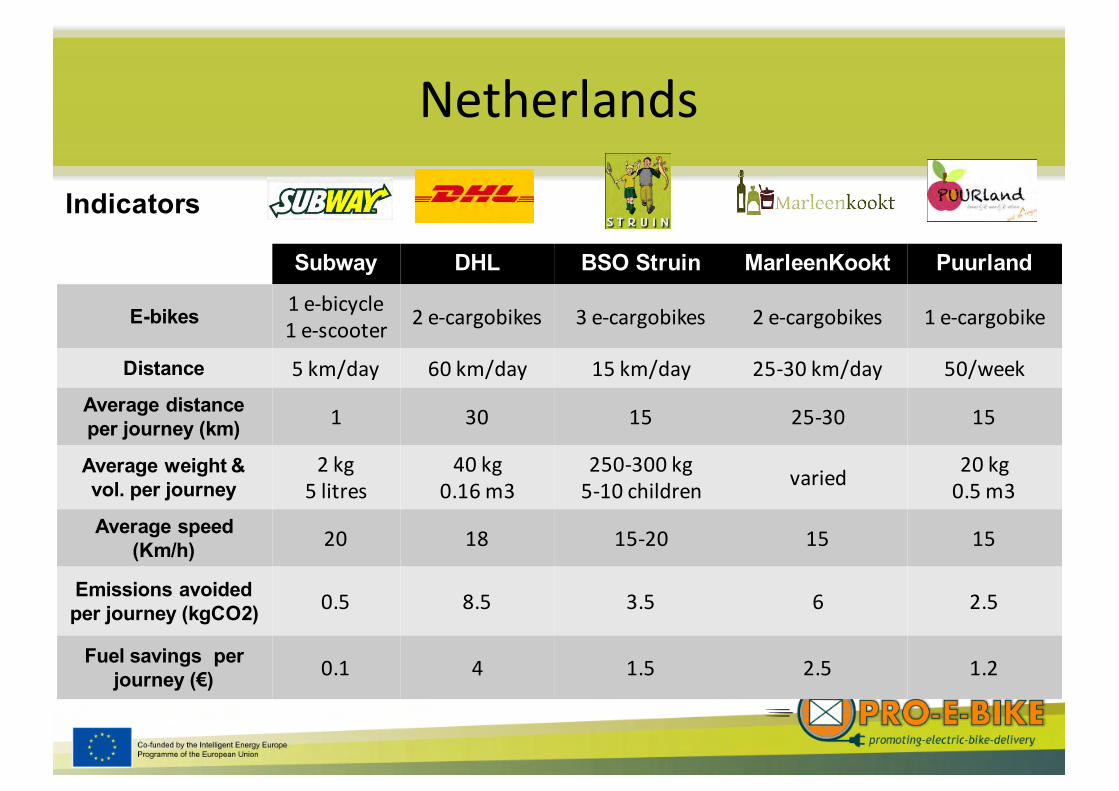
Subway DHL BSO Struin MarleenKookt Puurland
E-bikes 1 e-‐bicycle 1 e-‐scooter 2 e-‐cargobikes 3 e-‐cargobikes 2 e-‐cargobikes 1 e-‐cargobike
Distance 5 km/day 60 km/day 15 km/day 25-‐30 km/day 50/weekAverage distance per journey (km) 1 30 15 25-‐30 15
Average weight & vol. per journey
2 kg 5 litres
40 kg0.16 m3
250-‐300 kg5-‐10 children varied 20 kg
0.5 m3Average speed
(Km/h) 20 18 15-‐20 15 15
Emissions avoided per journey (kgCO2) 0.5 8.5 3.5 6 2.5
Fuel savings per journey (€) 0.1 4 1.5 2.5 1.2
Indicators
Netherlands
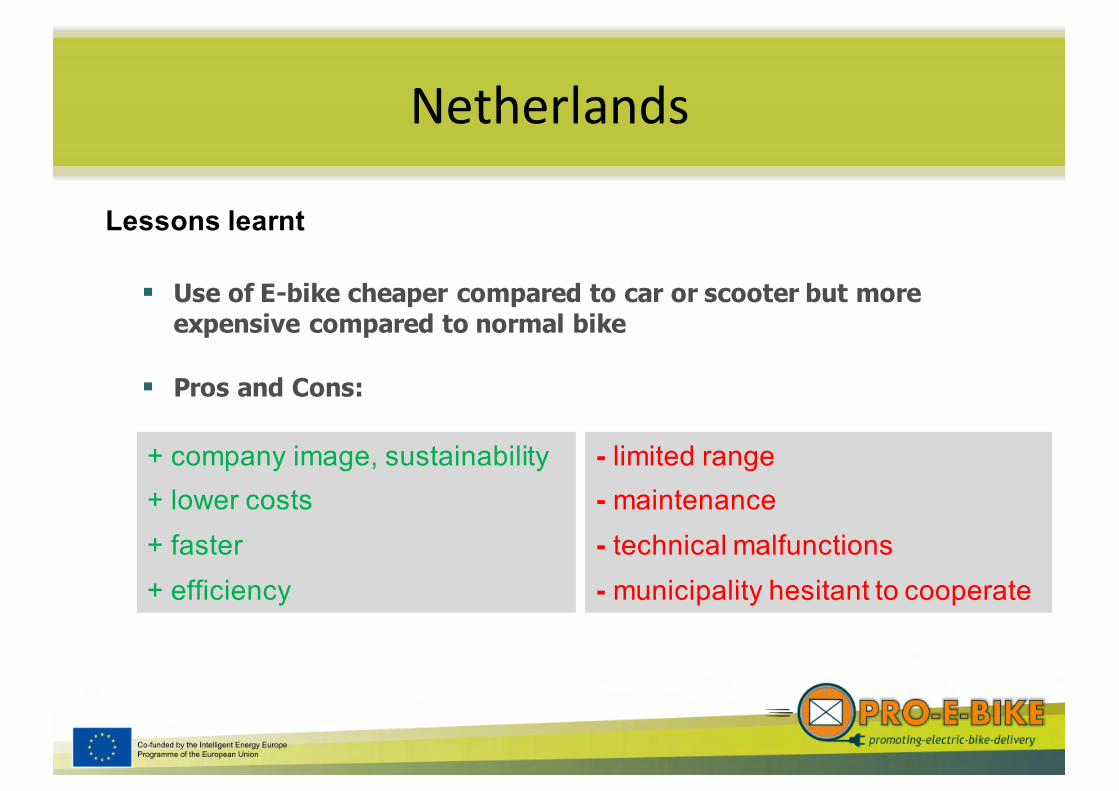
+ company image, sustainability+ lower costs+ faster+ efficiency
- limited range- maintenance- technical malfunctions- municipality hesitant to cooperate
Lessons learnt
§ Use of E-bike cheaper compared to car or scooter but more expensive compared to normal bike
§ Pros and Cons:
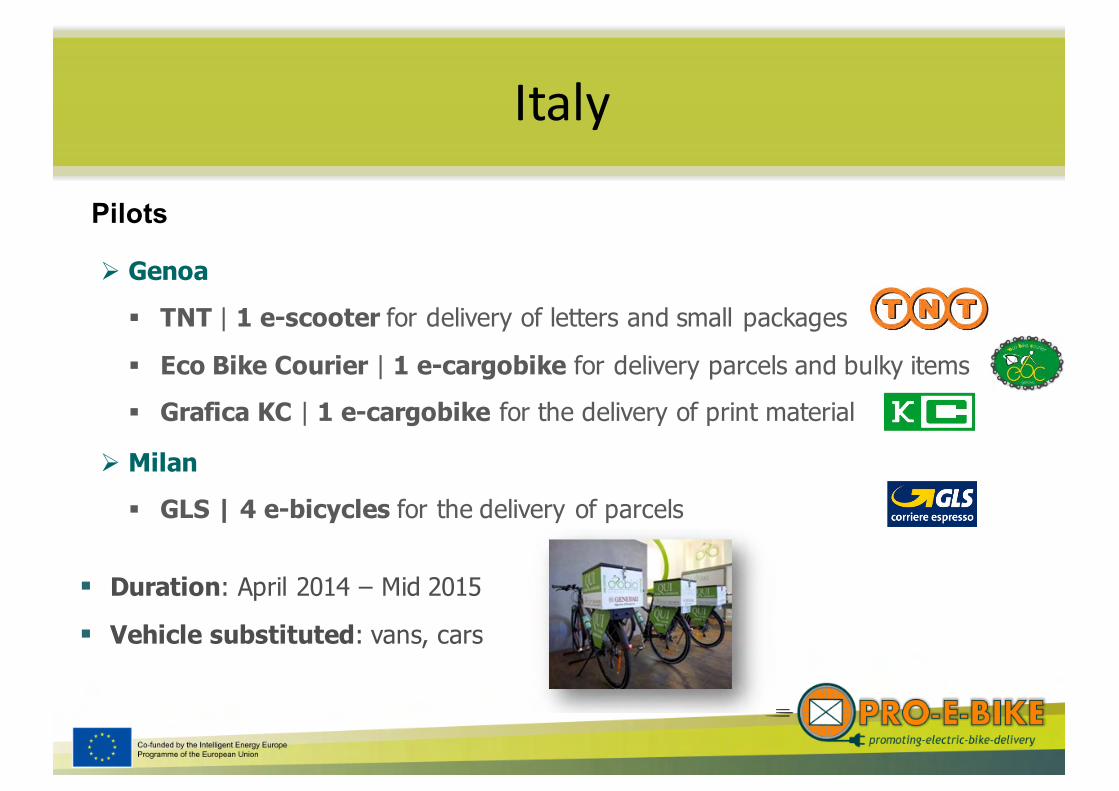
Ø Genoa§ TNT | 1 e-scooter for delivery of letters and small packages
§ Eco Bike Courier | 1 e-cargobike for delivery parcels and bulky items§ Grafica KC | 1 e-cargobike for the delivery of print material
Ø Milan§ GLS | 4 e-bicycles for the delivery of parcels
§ Duration: April 2014 – Mid 2015
§ Vehicle substituted: vans, cars
Italy
Pilots
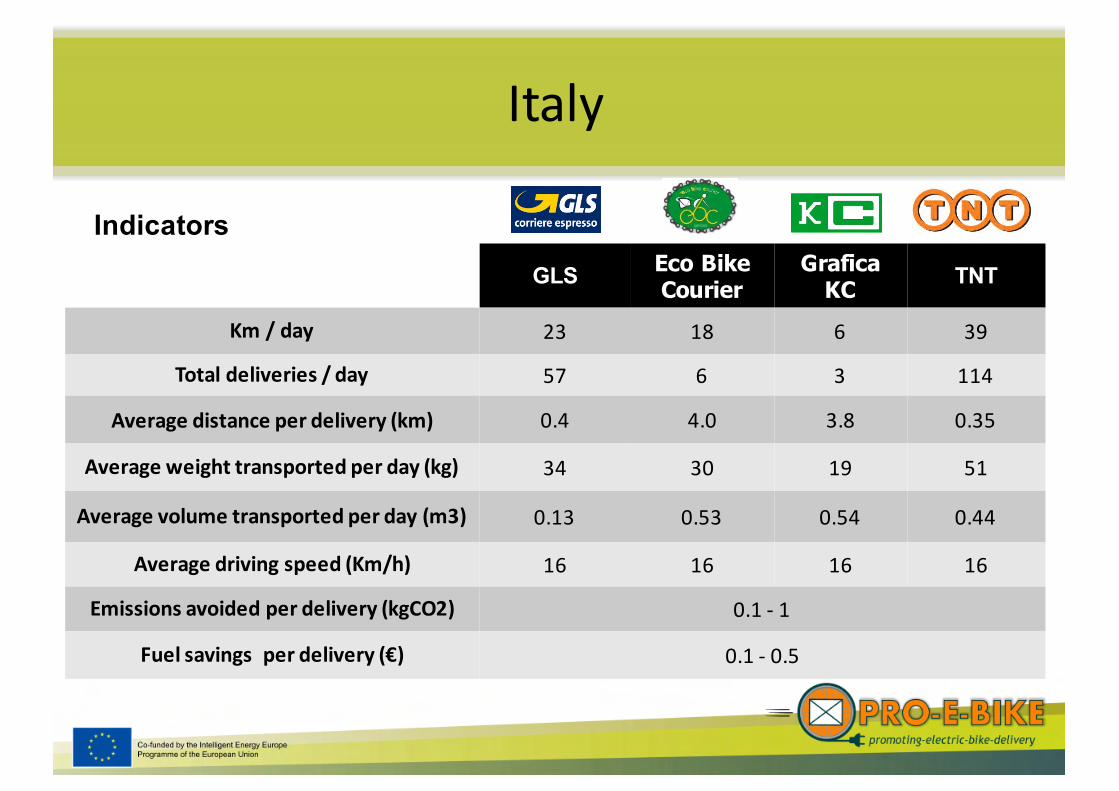
GLS Eco Bike Courier
Grafica KC TNT
Km / day 23 18 6 39
Total deliveries / day 57 6 3 114
Average distance per delivery (km) 0.4 4.0 3.8 0.35
Average weight transported per day (kg) 34 30 19 51
Average volume transported per day (m3) 0.13 0.53 0.54 0.44
Average driving speed (Km/h) 16 16 16 16
Emissions avoided per delivery (kgCO2) 0.1 -‐ 1
Fuel savings per delivery (€) 0.1 -‐ 0.5
Italy
Indicators
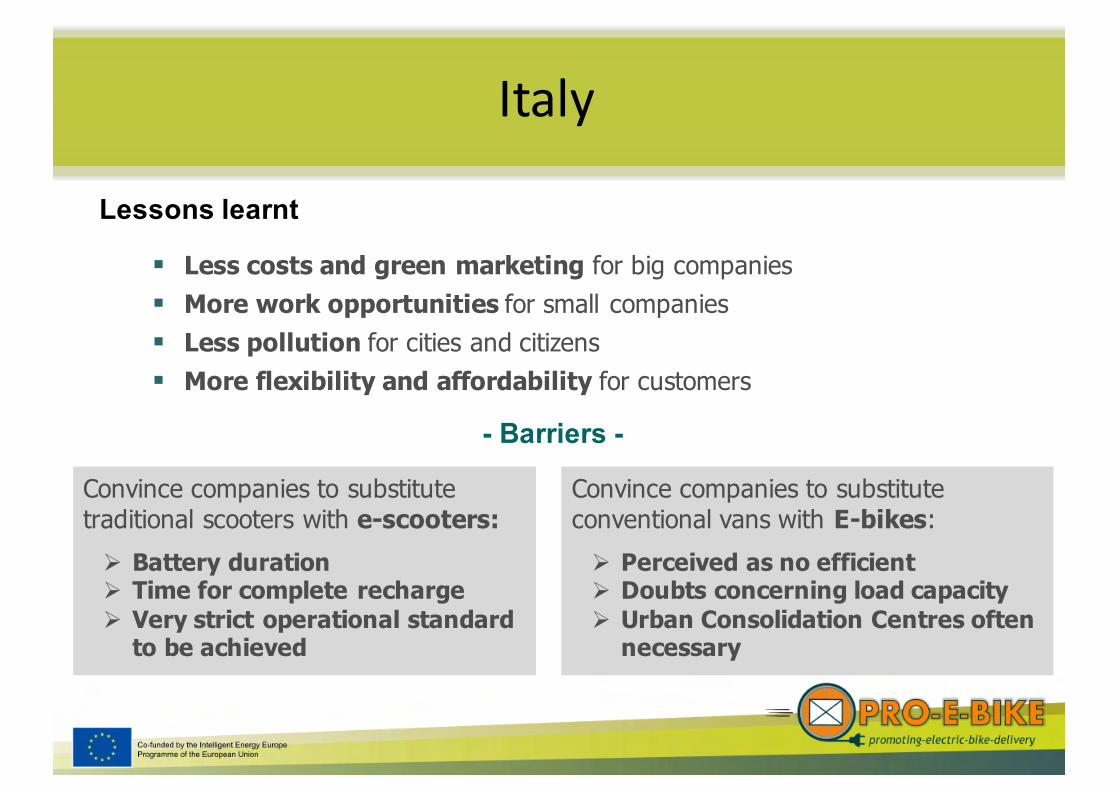
§ Less costs and green marketing for big companies§ More work opportunities for small companies§ Less pollution for cities and citizens§ More flexibility and affordability for customers
Italy
Lessons learnt
Convince companies to substitute traditional scooters with e-scooters:Ø Battery durationØ Time for complete rechargeØ Very strict operational standard to be achieved
Convince companies to substitute conventional vans with E-bikes:Ø Perceived as no efficient Ø Doubts concerning load capacityØ Urban Consolidation Centres often necessary
- Barriers -

PRO-‐E-‐BIKE Simulation Tool
§ Available in 8 languages & customized data for each country
www.pro-e-bike.org
Conclusions
§ Better Access: no time-slot restrictions and less distance travelled§ Faster for urban distribution in city center
§ Fuel savings compared to conventional vehicles (cars, vans, scooters)Øbutmore factors to be considered (vehicle maintenance, insurance, UCC…)
§ Environmental benefits: energy and emissions§ Improved company image & Corporate Social Responsibility
§ Market enlargement: offering new services
Conclusions
§ Concerns about:
Ø Range and battery durationØ Reliability / MaintenanceØ Load capacityØ Winter: battery performanceØ Need of Urban Consolidation Centres
Conclusions
Electric assist cargo bikes & trikes: boys’ toys or business tools?