pro-poor development and power asymmetries in global … · · 2017-09-272 organizational...
TRANSCRIPT

Pro-Poor Development and Power
Asymmetries in Global Value Chains
September 2015
Ajmal Abdulsamad
Stacey Frederick
Andrew Guinn
Gary Gereffi

This report was prepared on behalf of Oxfam America. The research draws primarily on the available
global value chain literature. Other data sources include a number of proprietary database, academic
journals, and reports on the respective industries for each case study. Errors of fact or interpretation
remain the exclusive responsibility of the authors. The opinions expressed in this report are not endorsed
by the sponsor.
The corresponding author may be contacted at: [email protected]
Duke University, Center on Globalization, Governance and Competitiveness (Duke CGGC)
The Duke University Center on Globalization, Governance & Competitiveness (Duke CGGC) is affiliated
with the Social Science Research Institute at Duke University. Duke CGGC is a center of excellence in
the United States that uses a global value chains methodology to study the effects of globalization in
terms of economic, social, and environmental upgrading, international competitiveness and innovation in
the knowledge economy. Duke CGGC works with a network of researchers and scholars around the world
in order to link the global with the local and to understand the effects of globalization on countries,
companies and the full range of development stakeholders.
www.cggc.duke.edu
Center on Globalization, Governance & Competitiveness, Duke University
© September 2015

Table of Contents
Part I: Summary Findings ............................................................................................................... 1 1.1. Global Value Chains: Asymmetries in Power Relations ................................................. 1 1.2. The Rise of Private Governance and Its Limitations ....................................................... 3 1.3. Global Value Chains and Public Governance .................................................................. 5
Part II: Case Studies ........................................................................................................................ 7 Case One: Pro-Poor Development and Power Asymmetries in the Apparel GVC .................... 7
Summary ......................................................................................................................................... 7 1. The Apparel Global Value Chain: Lead Actors and Power Asymmetries ............................. 8 2. The Rise of Private Governance and Its Limitations ............................................................ 17
3. Global Value Chains and Public Governance ....................................................................... 20 4. Conclusion ............................................................................................................................ 20
Case Two: Pro-Poor Development and Power Asymmetries in the Cocoa-Chocolate GVC ... 23 Summary ....................................................................................................................................... 23 1. The Cocoa-Chocolate Global Value Chain: Lead Actors and Power Asymmetries............. 25 2. The Rise of Private Governance and Its Limitations ............................................................ 35
3. Global Value Chains and Public Governance ....................................................................... 39 4. Conclusion ............................................................................................................................ 41
Case Three: Pro-Poor Development and Power Asymmetries in the Sugar-Soft Drinks GVC 42
Summary ....................................................................................................................................... 42 1. The Sugar-Soft Drinks Global Value Chains: Lead Actors and Power Asymmetries .......... 43
2. The Rise of Private Governance and Its Limitations ............................................................ 62 3. Global Value Chains and Public Governance ....................................................................... 65 4. Conclusion ............................................................................................................................ 67
References ..................................................................................................................................... 68
Appendix ....................................................................................................................................... 75
Figures
Figure 1: Key Actors and Relationships in Standard-Setting and Certification in GVCs .............. 3 Figure 2: Global Apparel Value Chain ........................................................................................... 9 Figure 3: The Cocoa-chocolate Value Chain ................................................................................ 25 Figure 4 The World's Top Three Cocoa Processors ..................................................................... 26
Figure 5: The Declining Trend and Volatility in Global Cocoa Prices ........................................ 33 Figure 6: Distribution of Value along the Cocoa-chocolate Value Chain .................................... 34 Figure 7: Trend in Cocoa Supply and Demand: Actual Figures for 1978-2011 ........................... 35 Figure 8: Certified Cocoa and Coffee Producers Compared to Uncertified Producers ................ 37 Figure 9: Price Structure of a Fairtrade Chocolate Bar ................................................................. 38
Figure 10: The sugar-soft drinks global value chain .................................................................... 43 Figure 11: Distribution of sugar demand, by industry (2011) ...................................................... 46
Figure 12: Sugar production by top producers, 2011 (million tonnes) ......................................... 48 Figure 13: Global sugar prices, 2000-2015................................................................................... 50 Figure 14: Sugar exports by top exporters, 2011 (million tonnes) ............................................... 51 Figure 15: Sugar imports by top importers, 2011 (million tonnes) .............................................. 52

Tables
Table 1: Private Governance Issues ................................................................................................ 5 Table 2: Apparel: Responsibility for Value-Adding Activities by Firm Type ............................... 9
Table 3: Apparel Lead Firm Types and Examples ....................................................................... 10 Table 4: Concentration at Individual Country Markets ................................................................ 26 Table 5: Cocoa Sector’s Footprint in the National and Rural Household Economies of Major
Producing Countries...................................................................................................................... 28 Table 6: Global Chocolate Confectionery Markets Controlled by a Handful of Brands.............. 30
Table 7: Volume of Certified Cocoa Produced and Sold by Certification Scheme, 2012............ 36 Table 8: Reinstatement of Public Governance in the Cocoa Sector in Cote d'Ivoire ................... 39 Table 9: Cote d'Ivoire's Cocoa Processing Industry ..................................................................... 40 Table 10: Global sugar production and exports ............................................................................ 48 Table 11: Top sugar producers in 2001 and 2011 ......................................................................... 49
Table 12: Importance of the sugar sector in major producing countries, 2011 ............................ 50
Table 13 Top sugar exporters in 2001 and 2011........................................................................... 52 Table 14: Top sugar importers in 2001 and 2011 ......................................................................... 53 Table 15: World soft drink market share (off-trade) 2004-2013, top 15 companies .................... 54
Table 16: Soft drink market shares of TCCC and PepsiCo Inc. across world regions, 2013 ....... 54 Table 17: Leading sugar milling companies, 2013 ....................................................................... 57
Table 18: Top sugar companies in Brazil, India and China, by market share .............................. 59 Table 19: Ratio of Sales to Production of Certified Sugar ........................................................... 63

1
Part I: Summary Findings
1.1. Global Value Chains: Asymmetries in Power Relations
Over the last three decades, the rise of global value chains (GVCs) has marked significant shifts
in the global organization of production, competition and trade. GVCs now account for an
estimated 80% of global trade, and 30% of value added in developing country economies
(UNCTAD, 2013). Domestic industries in both developed and developing countries no longer
stand alone or compete mainly through arms-length trade. Instead, they have become deeply
intertwined through complex, overlapping business networks created through recurrent waves of
foreign direct investment (FDI) and global sourcing. These shifts in the global distribution of
economic opportunity carry with them many challenges for government, business and society at
large.
As our case studies (in Section II) illustrate, GVCs represent organized industrial structures that
are governed by large traders, retailers and global brand manufacturers. The role played by these
firms is highlighted in various typologies of GVC governance that shape the different levels of
entry barriers and influence systems of division of labor, allocation of resources, and distribution
of gains among chain actors (Gereffi, 1994, 1999; Gereffi et al, 2005). While retailers and global
brands typically own few, if any, of their own production and processing plants, the volume they
purchase and the brands they retain afford them great power to govern their supply chains.
Concentration in downstream markets has been a major trend in food and beverages sectors in
which a handful of lead firms, i.e. brand manufacturers, now dominate the markets. In the
apparel sector, however, there is an exceptionally low level of concentration in the downstream
segment but still powerful brands. This fragmentation reflects highly segmented markets
differentiated by both product categories and price points. Apparel product categories are
distinguished in terms of fashions or styles, seasons, sizes and uses that are all gender and
geographic specific. Further, apparel retailers are highly divided by price points, for instance: big
discount retailers like Wal-Mart, Kmart and Target; specialty apparel retailers like The Gap,
Limited, Victoria's Secret, Macy's, JC Penney; and many apparel brands without their own retail
outlets, like Liz Claiborne and Donna Karan. Thus, it is not surprising to have low levels of lead
firm concentration in the apparel sector in contrast to fairly high levels of concentration in food
and beverages sectors.
Leveraging their power position, lead firms have rationalized their supply chains and favored
interaction with few large intermediaries that are expected to have strong capabilities and be
strategically located near consumer markets. This rationalization strategy has spurred
consolidation in mid-segments of the chains. Large intermediaries have emerged as “full
package” suppliers, such as: Li & Fung in the apparel value chains; Cargill, Archer Daniel
Midland/Olam International, and Barry Callebaut in the cocoa-chocolate value chain, and
bottlers like SABMiller in sugar-soft drink value chain. Intermediary firms now manage
production networks that are regional and/or global in scope. The key value chain activities they
manage include sourcing and financing of input purchases, coordinating production within their
networks and delivering the final product to the destination markets decided by the brand
owners.

2
Organizational rationalization has tended to reinforce power asymmetries in the chain because
small firms in developing countries do not have the scale or scope to move into and occupy high
value activities in the chain. GVCs are now characterized by an oligopolistic market structure
controlled by a handful of lead firms at the top and middle whereas the structure at the bottom of
the chain has remained highly competitive and fragmented. Upstream in producing countries,
large number of small firms and producers compete for market access and face oligopsonistic
markets that are governed and tightly coordinated by large buyers. They face enormous
challenges forming direct relationship with consumer markets. These small actors usually
function as subcontractors situated in captive relations.
Lead firms exercise power by virtue of their size, scope of involvement in international markets,
and the ability to set the terms of supply chain participation (e.g. lead time requirements, quality
standards, etc.). Unlike what the free market ideal suggests, transactions within the GVCs are
negotiated and the terms of those transactions reflect power asymmetries within the chain. Lead
firms determine what elements of the production process they will retain and which they will
outsource to suppliers. In setting the terms of those transactions, they influence where value is
created, how it is distributed, and who captures what share of the value. Such decisions,
however, are not made in a vacuum. The policies and programs of countries and multilateral
institutions set the context for corporate decision-making.
Lead firms seek to occupy those niches in which they can create barriers to entry important for
them to capture the major share of value for the final product. These entry barriers are
remarkable at the downstream end of the value chain and are low or non-existent at the upstream
segments. In addition to barriers from scale economies, branding is a significant barrier. Even the
emergence of large intermediaries has not cut significantly into the power of branding. In a world
of GVCs, it is even more difficult for small firms in developing country to develop their own
brands. The exception is when buyers themselves demand supplier reliability and there is the
need for high-reputation which creates the need for high-reputation intermediaries.
In general, lead firms maintain control of a series of high-value ‘intangible’ activities that in
addition to the tangible production-related steps in the GVCs add economic value to final
products. As intangible aspects of the value chain (such as marketing, brand development, and
design) have become more important for the profitability and power of lead firms, “tangibles”
(production and logistics) have increasingly become “commodities” and largely outsourced to
suppliers (Gereffi & Frederick, 2010). Because buyer–supplier contracts are negotiated in GVCs,
a lead firm with a multitude of potential suppliers is in a very strong position, specifically when
they face very low costs in switching suppliers, to dictate the terms of supply contracts.
The result is an unequal partition of the total value-added along the chain in favor of lead firms.
Approximately 70% of the total value added in cocoa-chocolate value chain accrues to retailers
and global brands (Dand, 2011; Euromonitor, 2014a). According to the World Bank (2008), the
share of value retained at upstream segments in cocoa producing countries has declined from
around 60% in 1970-72 to around 28% in 1998-2000. Similarly, in the apparel sector, value
added associated with intangible activities including product development, design, marketing,
branding and management contribute 60-75 percent of the final product price (Hester, 2013;
Newbury, 2013).

3
1.2. The Rise of Private Governance and Its Limitations
With the rise of GVCs, a broader trend has been the proliferation of corporate codes of conduct,
product certifications, process standards, and other voluntary non-governmental forms of private
governance (Mayer & Gereffi, 2010). The move towards private governance is best seen as a
response to societal pressures spawned by economic globalization and by the inadequacy of
public governance institutions in addressing them. In the wake of several targeted campaigns
involving high-profile cases of contaminated food, poor working conditions, or environmental
issues, retailers and global brands have been challenged concerning practices along their supply
chains. In response, voluntary standards and certification systems have emerged as a promising
means for addressing social and environmental issues in today’s complex global marketplace.
Although a compelling feature of these initiatives has since been their ability to create novel
governing regimes that reach across national jurisdictions, they appear unable to deliver on their
promised improvement in social and environmental conditions in GVCs.
Private governance initiatives are complex systems involving private, public, and civil society
actors whose interactions are broadly organized in three key sets of relationships (Figure 1). The
nature of these relationships then shapes the respective processes and outcomes of standard
setting, standard enforcement and standard compliance. The first category involves the
“horizontal” relationship between lead firms (retailers and global brands), civil society
organizations, and institutions in consumer countries where standards are generally constituted
and the scope for a specific set of standards is defined. This “horizontal” linkage is contrasted
with the “vertical” linkage, as the second category of relationship, between global lead firms and
their first-tier suppliers or large intermediaries that function as global supply chain managers.
Because intermediaries are in direct relationship with local suppliers in developing countries,
they are expected to enforce private standards throughout their supply chains.
Figure 1: Key Actors and Relationships in Standard-Setting and Certification in GVCs
Source: CGGC
Although standard setting results from the institutional embeddedness in consumer countries, the
quality of standard compliance is influenced by “horizontal” linkages, as the third category of
relationship, in producing countries. There, typically the developing countries, large
intermediaries (or their affiliates) interact with local firms, producers, and local level institutions.
At this compliance stage, a unique set of global standards, designed in consumer countries and

4
intended to address social and environmental standards in global supply chains, touches down
upon the production practices and strategies of producers situated in very diverse contexts across
the world.
The outcome of private governance initiatives is, thus, affected by the quality GVC-based rule
setting processes and the capability of local actors in producing countries. Often, the expectation
of global buyers and large intermediaries seem contradictory. Whereas brand firms commit to
standards trying to safeguard brand value and promote reputational gains, large intermediaries
focus on maximizing efficiency gains in their supply chains. The latter tend to have limited
commercial incentive to absorb the additional supply chain costs arising from enforcement of
social and environmental standards because they manage high-volume-low-margin business
models. Firms and producers in developing countries are, therefore, forced to squeeze costs.
Simultaneously, they have to comply with the buyers’ standard requirements with little or no
bargaining power for a cost-sharing arrangement. Most often, compliance issues emerge as the
standards are subjected to fit capabilities of local actors.
The quality of support by local institutions are also varies and is influenced by the extent of
local-global linkages in a sector. Very often, private standards are only applied to a small
subsection of firms or producers that are inserted in GVCs while a large majority of local firms
or producers, who are more vulnerable and not supplying GVCs, are excluded and not impacted
by the likely benefits of private governance initiatives. These dynamics call for a better
understanding of place-based social and institutional contexts and their interaction with private
governance initiatives.
The variation of these dynamics across different contexts is poorly understood. Our case studies
indicate that the sourcing strategies pursued by firms such as cocoa traders/processors or those
owning sugar mills, which are intermediaries rather than lead firms and which hold no brand,
determine the extent to which GVC outcomes are pro-poor. This finding suggests it is not just
lead firms that must drive pro-poor change in the chains, but other actors can and must change
irrespective of whether or not lead firms generate pressure upstream in the supply chain. Better
understanding these dynamics will require sector- and geographic-specific case studies aimed at
exploring questions, such as: Under what circumstances do private governance initiatives
promote sustainable practices? What are the distributive outcomes of private governance
initiatives for the different types of firms, producers and workers, and communities in host
countries? Which type of firms can catalyze more sustainable change across whole sectors?
Under which conditions can the regulatory measures by host governments effectively reinforce
private governance initiatives? Answering these questions is crucial to the missions of advocacy
campaigns and policy-makers.
In general, our case studies revealed that private governance initiatives have broadly suffered
from several shortcomings to deliver on their promised improvements in global supply chains
(Table 1).

5
Table 1: Private Governance Issues
Issue Apparel Cocoa-
Chocolate
Sugar-
Soft
Drinks
• Suppliers are generally burdened with the responsibility to bear the costs
associated with standard compliance whereas the standards fail to take
purchasing practices on the buyers’ side into account – even though a low
buying price or short lead times (only applicable to apparel) are often at the
root cause of poor working conditions in factories or in farms.
√ √ √
• The actual compliance requirements are often fairly low and in many
cases they do not address one of the primary concerns of workers regarding
“living” wages. Whereas private standards mandate compliance with
national policies on minimum wage, workers contest that those
requirements fall far below acceptable levels. In addition, local employers
can circumvent minimum wage requirements by hiring employees under
different titles (such as an apprentice) or as temporary employees that are
not mandated under national minimum wage policies.
√ × ×
• An additional problem is the sheer number of initiatives targeting a sector.
Having multiple private initiatives with relatively similar requirements
creates confusion and complexity. Additionally, multiple codes result in
higher costs in order to comply with multiple codes and increase
fragmentation rather than promote harmonization.
√ √ ×
• Whereas social pressure is typically placed on global brands,
intermediaries (millers & bottlers in sugar-soft drink and traders/processors
for cocoa-chocolate chains) have largely remained invisible and escaped
scrutiny for their interaction with local stakeholders in producing countries.
They are actually the type of firms that engage local stakeholder and also
have significant buying power in selecting their own suppliers and
managing sourcing and distribution networks.
√ √ √
• Beyond the above issues, the standard initiatives still account for a small
share of the global production base. They lack the broad industry coverage
at a scale needed to generate transformative outcomes. √ √ √
1.3. Global Value Chains and Public Governance
With the rise of GVCs, globally-dispersed supply chains and their associated production sites
escape the regulatory reach of developed country governments. In many cases, the developing
country governments either lack the institutional capacity or political will to regulate business
practices linked to global supply chains in their jurisdictions. They often fear losing these
sources of economic opportunity, employment and taxation. As the apparel case demonstrates,
the predominance of GVCs in the economies of many countries compel governments to avoid
mandating wage increases or implementing strict labor or environmental policies for fear of
losing contracts. This is exacerbated by the high level of global competition in apparel
manufacturing that enables buyers to switch from one supplier to another with relative ease,
especially for commodity-type, volume-oriented production. In practice, this means union
activity may be severely suppressed or legal minimum wages are set below the subsistence
minimum and are not revised in step with inflation (Labour Behind the Label, 2014).1
1 Source’s Source: Merk, J. (2009). “Stitching a Decent Wage across Borders”, CCC/AFW,
www.asiafloorwage.org/Resource-Reports.html, pp.30–35.
6
Besides, governments may also become locked in to extending generous incentives to foreign
investors that limit economic growth from the industry. Incentives such as corporate tax
holidays, zero tariffs on inputs for exports and machinery, and subsidies on industrial space or
utilities are common in export-oriented industries. Or, in some cases, countries actively lobby to
extend trade preferences that in actuality stifle the upgrading potential of the industry (i.e.
countries with market access agreements such as Nicaragua’s TPL, HOPE in Haiti or AGOA).
These scenarios however, create a somewhat paradoxical situation. Without low labor costs or
attractive incentive schemes it may be difficult or impossible to enter the GVC and attract
investors that can create employment opportunities and linkages with global markets. On the
other hand, these types of investments provide little benefit to the host country outside of low-
wage employment and limited upgrading opportunities beyond low value activities. Such
interface between global and local actors intrinsic to GVC realities means there is limited leeway
for public governance aimed at unilaterally intervening and improving the position of local
suppliers in GVCs.
Informed by a better understanding of GVC governance structure, public governance,
particularly in large economies, has illustrated scope for leverage. Brazilian labor inspectors and
government prosecutors have, since 2005, taken legal action against several sub-contracting
issues in sugarcane farms. Also, these regulatory efforts in Brazil were successful because they
were informed by a sophisticated understanding of the patterns of industrial organization and
private governance in the value chain, such that: 1) they targeted mills (the value chain segment
that is relatively concentrated) as responsible for legal compliance in their upstream supply
chain; 2) they were driven by an empowered team of labor inspectors; and 3) the large (and
growing) sugar-ethanol market and the role of public policy therein have served as a source of
stable demand for sugar mills in the face of volatile global prices. In many cases, this steady
demand creates certainty for both mills and farms and allows them to make investments in
improved production processes that enhance labor and environmental outcomes.
In general, the issue for public governance in GVCs is obviously related to quality of local
participation. Very specifically, it concentrates on leveraging the economic development
opportunities offered by GVCs and enhancing local capacity to simultaneously achieve social
and economic objectives. These concerns are rooted in the reality that private governance
(including standards) often reflect asymmetric power relations in GVCs, and that the
fundamental rationale for the rise of GVCs has been economic efficiency and competitive
advantage based on the transaction-cost-minimizing behavior of firms. Tailored public
governance is, therefore, essential, whether it is related to retaining maximum value within the
country, generating the most jobs, improving the quality of those jobs, or yet another
development objective related to social and/or environmental impact of GVCs.
Critically important for the effective public governance in GVCs are the process and the nature
of state interventions in terms of choices that governments might opt to engage in GVCs. Rule-
making through a public-private platform can provide the appropriate vehicle, as the nature and
characteristics of GVCs is constantly evolving and flexibility and reactivity are key ingredients
to efficient decision making. This public-private collaboration may, however, need to extend
beyond national borders, as local challenges call for international coordination from multiple
stakeholders in the context of GVCs.

7
Part II: Case Studies
Case One: Pro-Poor Development and Power Asymmetries in the Apparel GVC
Prepared by Stacey Frederick
Summary
The global apparel industry is a characteristic buyer-driven chain in which lead firms with
headquarters in the United States and the European Union control the highest value-adding
activities related to marketing, branding and design and outsource production to a network of
suppliers, largely based in Asia. Beyond lead firms, the other main segments of the supply chain
include apparel manufacturers/first tier suppliers, textile components (yarn and fabric) and trim
and machinery. Lead firms accrue the most “value” in the chain, accounting for at least 60-75
percent of the final retail price of apparel products.
Apparel is often one of the first formal industries to emerge in a country, and in the beginning
often accounts for a significant share of employment, particularly for women, exports and GDP.
This is the case for many regional U.S. suppliers in Central America and Haiti as well as some of
the more recent apparel suppliers in Asia including Bangladesh and Cambodia and to a lesser
extent Sri Lanka and Pakistan. The majority of apparel production however takes place in Asia,
particularly China. Regarding consumption, the largest geographic market is also Asia however
the most significant importers of apparel are the United States and the European Union. The
most growth of apparel retail is from emerging countries including BRICs (Brazil, Russia, India
and China).
At all levels of the chain the industry is quite disperse, particularly at the lead firm level in which
the largest firm accounts for less than five percent of the global market. At the level of apparel
manufacturing the industry is also not concentrated, but the structure is changing to a model in
which lead firms interact with a fewer number of core vendors/suppliers, who are often multi-
national manufacturers. These core vendors are responsible for providing a “full package” to the
buyer which includes sourcing and financing input purchases, coordinating assembly within their
production networks and delivering the final product to the buyers’ destination of choice.
Lead firms consider many factors when making sourcing decisions, but the most important are
all firm-related and include quality, price, full package capabilities, lead times and social and
environmental compliance. Whereas compliance is considered a top priority, the standards
required and the means of monitoring varies. Many larger buyers have internal codes of conduct
and also participate in one of the many private, voluntary schemes. These schemes have made
important advances in terms of establishing a framework to identify common workplace issues
and violations, but have had minimal impact on wage increases. This is largely due to the fact
that there is not an internationally agreed on level for “living wages” and minimum wages are set
and enforced by national governments.
8
In order for social conditions to improve in apparel factories, the distribution of value along the
chain needs to change or the overall price paid must increase. For this to happen, one or more of
the following could occur: consumer prices increase, lead firms reduce profit margins, apparel
factory owners distribute gains equitably to employees and/or cost savings are achieved via
improvements in productivity through process or labor efficiencies. Two key components needed
to facilitate this process include better information and education among all stakeholders
(manufacturing, national stakeholders and consumers) on the costs (including production time
estimates) and value distribution along the chain and internationally agreed upon, enforceable
standards for wages and worker benefits.
1. The Apparel Global Value Chain: Lead Actors and Power Asymmetries
1.1. Input-Output Structure and Value-Added
The global apparel supply chain can be broken up into four segments: lead firms (i.e., buyers;
global apparel brands and retailers), apparel manufacturers and intermediaries (first tier
suppliers), textile component suppliers (yarn and fabric) and raw material and other auxiliary
input suppliers (e.g., trim, machinery and chemicals/dyes). In addition to the tangible,
manufacturing-related steps in the textile-apparel supply chain there is also a series of
‘intangible’ activities that add economic value to apparel products. The apparel value chain
consists of seven main value adding activities including: consumer research and new product
development, design, textile sourcing, apparel assembly, final product distribution, branding and
retail. These activities are controlled by a combination of lead firms and apparel manufacturers
and intermediaries. Table 2 illustrates the activities brand owners, apparel manufacturers and
intermediaries are typically responsible for along the chain and Figure 2 depicts the main stages
and actors.

9
Figure 2: Global Apparel Value Chain
Source: Author (Frederick, S.)
Table 2: Apparel: Responsibility for Value-Adding Activities by Firm Type
Firm Types NPD Design Textile
Sourcing
Apparel
Assembly
Distribution
& Logistics to
Buyer
Branding Retail
Lead Firms
Retailer Y/N Y/N Y/N No Y/N Yes Yes
Apparel
"Manufacturer"
(OBM)
Brand
Marketer Y/N Y/N Y/N No Y/N Yes Y/N
Brand
Manufacturer Yes Yes Yes Yes Yes Yes Y/N
Apparel Manufacturers and Intermediaries
CMT No No No Yes No No No
Full Package No No Yes Y/N Yes No No
ODM Yes Yes Y/N Y/N Y/N No No
OBM (Marketer/Manufacturer) Y/N Y/N Y/N Y/N Y/N Yes Y/N
Intermediaries Y/N Y/N Y/N No Yes No No
Source: Author (Frederick, S.); see (Frederick & Gereffi, 2011) for an earlier version; NPD: New Product
Development; Yes/No (Y/N): indicates that the activity may or may not be the responsibility of the firm.
1.1.1. Lead Firms (Apparel Brand Owners; Buyers)
The apparel industry is an example of a buyer-driven chain common in labor-intensive consumer
goods industries marked by power asymmetries between producers and global buyers of final
products. Buyer-driven chains are composed of globally dispersed firm networks, in which lead
firms control the activities that add the most value to apparel products (e.g., branding, marketing,

10
design), and outsource all or most of the manufacturing process to a global network of suppliers
(Gereffi, 1994, 1999). Lead firms are set apart from the other firms in the chain because of their
market power that stems from control over the branding and marketing of where the final
product will be sold.
The majority of value-added in the apparel value chain can be attributed to lead firms. The share
of the retail selling price attributable to manufacturing an apparel item is typically less than 30
percent, of which raw material costs make up the largest share. Costs associated with intangible
activities including product development, design, marketing, branding and management
contribute the other 60-75 percent (Hester, 2013; Newbury, 2013) (Figure 2). These activities
primarily take place at the headquarter locations of global retailers and brands in the United
States and Western Europe. These figures are also supported by analyzing global retail and
manufacturing estimates. The value of the global apparel manufacturing industry in 2012 was
$525 billion (Marketline, 2013),2 approximately 60 percent of the retail value of the industry.
Apparel manufacturing is highly competitive and becoming more consolidated, with increasing
barriers to upgrading. Developing countries are in constant competition for foreign investments
and contracts with global brand owners, leaving many suppliers with little leverage in the chain.
The result is an unequal partition of the total value-added along the chain in favor of lead firms.
As intangible aspects of the value chain (such as marketing, brand development, and design)
have become more important for the profitability and power of lead firms, “tangibles”
(production and logistics) have increasingly become “commodities” (Gereffi & Frederick, 2010).
Four main types of lead firms exist in the apparel value chain: mass merchant retailers, specialty
retailers, brand marketers and brand manufacturers (Figure 2; Table 3).
Table 3: Apparel Lead Firm Types and Examples
Lead Firm Types & Sub-Types Description
Examples
United States European
Union
Retailers Mass
Merchants
Hypermarkets,
Discount
Stores
Similar to department stores, but
sell a wider variety of products
(often food). Rather than private-
label, the term "store brand" or
"generics" may be used.
Walmart,
Target
Asda
(Walmart),
Tesco,
Carrefour,
Metro,
Sainsbury
Department
Stores
Carry private label, exclusive or
licensed brands that are only
available in the retailers’ stores.
They also sell national brands
purchased from "apparel
manufacturers" below, but in this
case, they are not the lead firm in
the chain.
Sears, Macy’s,
JC Penney,
Dillard’s,
Kohl’s
Marks &
Spencer,
Karstadt, El
Corte Ingles,
Harrod's,
Debenhams
Specialty
Stores
Focus on a market segment that
includes apparel. Carry a mix of
REI, Dick's
Sporting Goods
2 The global manufacturing industry represents consumption, defined as domestic production plus imports minus
exports, all valued at manufacturers’ selling prices (MSP).

11
Specialty
Retailers
private and exclusive labels and
national brands.
Specialty
Apparel Stores
(Private Label)
Retailer develops/owns private
label brands only available in their
stores that commonly include the
store's name.
Gap, Victoria
Secret,
American
Eagle,
Abercrombie &
Fitch
H&M,
Mango, New
Look, NEXT,
C&A,
TopShop
PVH, Ralph
Lauren, Carter's Espirit
Brand
Marketer
Firm owns the brand name, but not
manufacturing, “manufacturers
without factories.” Products are
sold at mass merchant stores and
often through owned specialty store
outlets.
Non-
Retailers
Apparel
"Manu-
facturer"
(OBM)/
Brand
Owner
Nike, Levi’s adidas, Hugo
Boss, LVMH
VF,
Hanesbrands Inditex (Zara)
Firm owns brand name and
manufacturing; more likely to
coordinate supply of intermediate
inputs (CMT) to their production
networks often in countries with
reciprocal trade agreements
Brand
Manufacturer Gildan
Benetton,
Triumph
Source: Author (Frederick, S.); see Table 8 in (Gereffi & Frederick, 2010) for an earlier version.
In the case of brand marketers and brand manufacturers, the lead firm is also the firm recognized
as the apparel “manufacturer.” Brand manufacturers own apparel manufacturing plants,
coordinate textile sourcing, and control marketing and branding activities in the chain. Their
production networks are often set up in countries with reciprocal trade agreements. Brand
marketers, on the other hand, control the branding and marketing functions, but they do not own
manufacturing facilities (“manufacturers without factories”). From the consumer’s perspective,
there is no difference between apparel manufacturers and marketers. Both categories develop
brands that are sold at discount or department stores or through specialty retail outlets owned by
the manufacturer or marketer. In the 1970s and 1980s, the brand manufacturer category was
more significant, but it has declined over the past two decades as manufacturers have started
outsourcing production-related activities to focus on the higher-value segments of the chain
(Frederick & Staritz, 2012).
Brand owners may also license the use of their brand name to third parties in areas outside of the
core competence of the company (e.g., accessory type products). Licensing is distinct from
sourcing because the brand owner is not responsible for selling the final product to the retailer or
final customer. Rather the company receives a fee for the use of the brand name and the agent or
apparel manufacturer assumes responsibility for distribution. In licensing arrangements, the lead
firm licenses the use of their brand name to be produced and distributed by other manufacturers,
retailers, or agents
Retailers are involved with the branding and marketing of product lines developed for and sold
only via their retail locations. These products are often referred to as private label. Discount and
department store retailers are separated from specialty stores because the latter primarily sell
apparel-related merchandise and the majority of products in the store are private labels. Mass
merchants sell a diverse array of products representing their own private labels as well as

12
national brands in the same store. Similar to apparel marketers, retailers do not own
manufacturing facilities. Retailers either work directly with an apparel manufacturer or with an
agent who coordinates the supply chain. Retailers’ strengths are in marketing and branding, and
they tend to have relatively limited knowledge of how to make the products they are procuring.
Thus, retailers prefer suppliers (or agents) capable of bundling and selling the entire range of
manufacturing and logistics activities (“full package”). Over the past decade, the importance of
national brands has declined significantly as private label merchandise has expanded (Frederick
& Staritz, 2012).
1.1.2. Apparel Manufacturers (or First Tier Suppliers)
Apparel manufacturers are the companies or vendors responsible for cutting and sewing the final
garment into a final product and coordinating production. Apparel manufacturers can be
distinguished by the number of locations they have, end market buyers (domestic or export),
production model, ownership (foreign or domestic) and the value-adding activities they control
or perform. Apparel manufacturers that primarily supply volume, commodity-oriented products
face more global competition than suppliers of products that are more fashion-oriented and often
have shorter product cycles.
Value-adding activities include (1) assembly, (2a) shipping the final product to the buyer at an
agreed selling price (also referred to as FOB), (2b) input sourcing (or production), (2c) design
services, (3) new product development/design and (4) brand development. These value-adding
activities are associated with types of apparel manufacturers often used to describe functional
upgrading. Assembly is related to CMT, logistics and design services are types of full package
and three and four represent ODM and OBM respectively. In the case of licensees, the apparel
manufacturer (licensee) pays the lead firm a royalty to use the brand name. The firm is then
responsible for all other value-adding activities.
Transnational manufacturers are often ‘core suppliers’ to lead firms and have a more holistic
supply chain approach that allows a greater exchange of information between buyers and
manufacturers. It is important to note that the value-adding activities performed by the apparel
manufacturer (often referred to as the vendor) as a whole may be divided among factories within
the company. For example, head offices may be responsible for communicating with the apparel
brand owners or agents and arranging input logistics whereas branch plants are only responsible
for providing assembly activities. Large MNC factories are more dominant in the three main
product categories that constitute roughly 50 percent of apparel imports, which include trousers,
knit shirts and knitted sweaters and sweatshirts. Regional apparel manufacturers are a subset of
this category and include apparel firms that have foreign investments, but only within one
geographic region. Branch plants of regional manufacturers may have closer ties to the home
office and are thus better positioned to take on more higher-value activities. Transnational
apparel manufacturers are largely from South Korea (e.g., Sae-A, Hansae and Hansoll), Hong
Kong (Crystal Group, Esquel and TAL), Taiwan (Nien Hsing and Eclat) and China (Shenzhou
and Hongdou). Sri Lanka has several regional apparel investors including MAS Holdings,
Brandix and Hirdaramani.
Single country manufacturers range from large, volume production operations comprised of
multiple plants in one country to small, niche manufacturers supplying a specialized product or
service. Single country manufacturers are often domestically owned, although in some cases they

13
are owned and controlled by foreign investors that once had manufacturing in a higher wage
country, but closed the manufacturing facility for a lower-cost production location. Large single
country manufacturers include Vinatex in Vietnam, Gokaldas in India and Youngor Group in
China. A subtype of single country manufacturers are subcontractors. Subcontractors are often
associated with CMT activities, informal firms or even home work. Subcontractors do not deal
directly with the lead firm, but rather engage in assembly or finishing services via a relationship
with the primary vendor. Subcontractors typically operate on an order-by-order basis and often
have short-term or seasonal contracts.
In most cases in the U.S. and EU markets, the brand owner and the apparel manufacturer are not
the same company and the lead firm must purchase or ‘source’ apparel products from third-
parties. Brand owners do this by directly communicating with apparel manufacturers or
indirectly via an intermediary. Many buyers use multiple methods depending on the product and
the volume they need to purchase.
In direct sourcing, the lead firm directly interacts with the final product vendor, either through
the home country head office or via overseas/in-country buying offices. In some cases a “hybrid”
method is used in which the parent company of the brand owner also owns a sourcing company.
Buyers are more likely to directly interact with firms and countries that represent a sizeable share
of overall volume and as buyers develop expertise in assessing local capabilities, they establish
more direct sourcing relationships. Over the years retailers shifted more responsibilities to these
overseas offices, driven by cost and the skills of the staff based there. Many are also moving
product development and design offices closer to the manufacturing process (Gereffi &
Frederick, 2010).
Alternatively the lead firm may source indirectly through an intermediary or third party that is
not affiliated with the lead firm and does not own apparel factories. Terms used to describe
intermediaries include buying agents/houses, network providers, jobbers, domestic importers and
distributors. In cases where an intermediary is involved, the aforementioned value-adding
activities are divided three ways instead of two. Intermediaries are responsible for logistics, and
any other value-adding activity other than the actual assembly of the final product.
The traditional agent-sourcing model is most popular with buyers that require smaller volumes or
larger buyers that need small quantities of certain items. Benefits of using a third-party sourcing
agent include scale of operations, buying power, flexibility, and ability to spread risk among
suppliers. Sourcing agents charge clients 4-8 percent of the wholesale price as commission,
representing an area to realize savings if this step is eliminated (Gereffi & Frederick, 2010). Li &
Fung is the pioneer and maintains the largest market share of business based on the agent-
sourcing model. More recently, Li & Fung has expanded its role as an agent to an ODM or OBM
supplier for certain clients by providing product development, marketing and branding services
(see Appendix for a company profile).
Multinational intermediaries/agents work with apparel manufacturers based in multiple
countries and typically offer a wide range of services in addition to logistics based on the needs
of the buyer. Typical services include a providing a network of manufacturers to choose from,
quality assurance or compliance. National agents represent apparel manufacturers from one
country. Whereas they may not be able to provide the breadth of services of a MNC agent, they
do have in-depth knowledge of the range of suppliers and capabilities within a country. Domestic

14
importers are based in the same home country as the lead firm and are responsible for sourcing
from multiple countries on behalf of the buyer. The domestic importer may or may not be owned
or have an exclusive agreement with the buyer. At the least, the importer is responsible for
coordinating production and logistics, and may also help with design, product development, and
marketing. In some cases, the firm buys products and resells them to lead firms.
Based on surveys with global buyers in 2007 and 2008, approximately 55 percent of buyers
source more than half of their volume directly, 31 percent source over half indirectly (via an
agent/importer or distributor/wholesaler) and 14 percent own manufacturing facilities for over
half of their volume based on FOB value (Sauls, 2007, 2008).
1.1.3. Textile Components and Trim Suppliers
The textile segment of the chain includes fabrics, yarns and fibers and trim includes thread,
zippers, buttons, hangers, tags and other small accessories added to final products. Natural and
synthetic fibers are produced from raw materials such as cotton, wool, silk, flax and chemicals.
These fibers are spun into yarn which is used to produce woven or knitted fabric. Fabrics are
then finished, dyed or printed and cut into pieces that will be sewn together by apparel
manufacturers. In addition to apparel, textile components feed into other end markets including
home furnishings and industrial and technical textile products. Non-textile inputs required for
apparel production include trim (e.g., zippers, buttons, labels, hangers, etc.), equipment and
machinery (sewing machines, cutters, plotters, software) and chemicals for dyeing and finishing.
1.2. Geography of Supply and Demand
The value of the global apparel retail market was approximately $1.38 trillion in 2012
(Euromonitor/Passport, 2014b). 3 The Asia Pacific region is the largest market (32 percent of
world) at a value of $444 billion in 2012, followed by Western Europe and North America (25
percent and 23 percent respectively). The fastest growing markets since 2005 are the Asia Pacific
and Latin American regions (both had a CAGR of 10 percent), followed by Eastern Europe (7
percent), Middle East and Africa (6 percent) and Australasia (5 percent) (Euromonitor/Passport,
2014b). Global apparel brands and retailers are diversifying into new retail outlets and
introducing their brand names into new emerging international end markets for growth
opportunities, making them a driver of this strategy along with the growth of emerging regional
and national brand owners in their respective domestic markets.
The total value of apparel imports in 2012 was $355 billion. The three main import markets for
apparel (EU-15, USA and Japan) have remained the same since at least 2000. The two top
markets, the EU-15 and the USA, accounted for 63 percent of imports in 2012 and with Japan
the top three were 72 percent. Among these three, the EU-15 has increased its share of the global
market whereas the USA’s share has declined and Japan has remained relatively stable since
2000. The market share held by the top ten markets has declined by approximately six percent
over the last 12 years (UNSD, 2014).
Overall the global apparel industry is expanding in terms of the number of lead firms and
geographic end markets. The global apparel retail market is highly fragmented with the largest
3 Value is at retail selling prices using the average annual exchange rate for each year. The apparel market is defined
as womenswear, menswear, childrenswear, hosiery and accessories (does not include footwear).
15
company’s share estimated at only 3.7 percent in 2012 with the top ten company’s representing
an estimated 8.9 percent share of the market. This is up from 2005 when the top ten companies
represented approximately 7.2 percent, but only slightly (Euromonitor/Passport, 2014a).4 In
terms of geographic markets, the share of apparel imports going to the top ten countries has
steadily decreased over time. In 2000, the top 10 markets represented 93 percent of apparel
imports, but decreased to 87 percent in 2012 (UNSD, 2014) with growth in top import markets
including Russia, Poland, China, Rep. of Korea and Australia.
Apparel exports are primarily from Asia, and more specifically China. China increased its export
share since 2000 (from 24.8 in 2000 to 41.0 percent in 2012) and is by far the largest exporter of
apparel. Collectively the top 15 export countries increased their market share from 75.8 percent
to 86.8 percent from 2000 to 2012. The fastest growing apparel exporters over the last 12 years
include Vietnam, Bangladesh, Cambodia, Indonesia, China, Pakistan plus Sri Lanka, India and
Turkey however growth for the latter three has stagnated since 2005. These countries were all
among the top 15 apparel exporters in 2012 and the change in value of their apparel exports
increased faster than the world average between 2000 and 2012 (UNSD, 2014). The apparel
industry has (and continues) played an important role in the economic development process of a
number of countries over the last several decades (see Table A-2 in Appendix).
1.3. GVC Governance and Power Relationships
Given lead firms’ control over the highest value-adding activities in the chain, they are able to
exert influence and set minimum standards for suppliers (i.e. sourcing criteria). Lead firms take
into account an array of factors in their sourcing decisions which are specific to the supplier
country and firm. Despite variations among different types of lead firms, there are important
common trends in sourcing strategies of global buyers. The most important factors lead firms
consider when selecting a supplier firm are related to firm characteristics and include (1) cost
and quality; (2) full package services and (3) social and environmental compliance and (4) lead
time/reliability, including access to inputs (Birnbaum, 2013; Daher & Chmielewski, 2013;
Frederick, 2014; Nathan Associates, 2005; Shapiro & Thomas, 2013):
- Production costs and quality have always been important and have become even more
important in the context of increased competition through the MFA phase-out and the
global economic crisis. These two firm-specific criteria ranked the highest in all buyer
surveys reviewed over the last decade.
- Full package capabilities revolve around the importance of non-manufacturing
capabilities or value-adding services in addition to manufacturing capabilities. The buyer
surveys show that the most important services include input/material sourcing and
financing and product development (in terms of apparel services related to the ability to
work with patterns, grade patterns and manipulate computer-aided design CAD files).
The objective of buyers to concentrate on their core competencies and reduce the
complexity of their supply chains has spurred this shift from working with assembly
suppliers (CMT) to full package suppliers. Full package capabilities, customer service
and workers’ capabilities are closely related in that apparel manufacturers need to have
soft skills in terms of input sourcing and technology use. These skills are also related to
4 This slight trend towards consolidation should be taken with caution as some large apparel companies are privately
held, and as such, estimates are not available. See Appendix Table A-1 for the top 20 companies in 2012.

16
product mix and the know-how associated with being able to process fashion basic and
fashion apparel in addition to long-runs of volume, commodity products.
- Social compliance has increased in importance in buyers’ sourcing decisions in response
to pressure from corporate social responsibility (CSR) campaigns by NGOs, compliance-
conscious consumers and, more recently, the increase of disasters in apparel factories.
Social compliance has become a central criterion for entering and remaining in supply
chains. Poor compliance and bad occurrences does not only affect individual firms but
can affect the image of the whole country.
- The increasing importance of lead time is related to the shift to lean retailing and just-in-
time delivery, where buyers defray the inventory risks associated with supplying apparel
to fast-changing, volatile markets by replenishing items on their shelves in very short
cycles and minimizing inventories. Closely related to shorter lead time and increased
flexibility and control of supply chains is access to and availability of fabric inputs
locally or at least regionally. However, fabric production needs to be competitive in terms
of price, quality, lead time and variety. In this context, the possibility to import inputs
duty-free is crucial given the large variety of fabrics.
There has been a consolidation of the first tier supply base as buyers’ increasingly focus on
sourcing from larger and more capable vendors who offer consistent quality, reliable delivery,
short lead times, large-scale production, flexibility and competitive prices, as well as broader
non-manufacturing capabilities. Smaller firms focused on assembly activities face challenges
forming direct relationships with global buyers. Buyers prefer to have fewer suppliers because
identifying and maintaining relationships with many vendors adds unnecessary time and
transaction costs for the buyer whose core competencies are in the higher value activities related
to marketing and branding. It should be noted, however that this does not necessarily mean there
are fewer apparel manufacturers overall. Smaller firms still play a role as subcontractors to first
tier suppliers and as producers for domestic markets.
Global trade data supports the trend towards consolidation; in 2000 the top 15 apparel exporting
countries accounted for 76 percent of exports and by 2012 this increased to 87 percent. This
trend is further evidenced in the top five exporters, which increased their share from 55 to 71
percent between 2000 and 2012 (UNSD, 2014).
There are two key sets of relationships in the apparel value chain. The first division is between
the lead firm and the first tier supplier. Lead firms preference to work with fewer, more
capable core suppliers opened the door for large, multinational apparel manufacturers and
intermediaries/agents (e.g., Li & Fung) to take over the function of coordinating the supply
chain. Even though there are now two “tiers” in the chain, the most important division is still
between lead firms and non-lead firms (suppliers). Lead firms are set apart because of their
purchasing power and control over the activities that generate the most profitable returns
including brand names, product design, new technologies and consumer demand. The lead firm
sets the price to develop a final product and thus sets the final product margin, the difference
between the cost of manufacturing, and the price it will pay to purchase or manufacture the
product. This firm also determines the price the consumer will pay for the final product.
The second division is between the first tier supplier and his branch locations or
subcontractors and input suppliers. These relationships are important for production-related
17
decisions. First tier suppliers are responsible for coordinating the supply chain and thus make
decisions on which factories are included in the chain. Lead firms may or may not have a
relationship with these factories or suppliers farther upstream.
Large multinational first tier suppliers have a more modular, relational relationship with lead
firms and are often viewed as core suppliers. Larger apparel lead firms and those with a longer
history in the apparel market are more likely to work directly with large MNCs than firms with
lower sales volumes and market shares. In this case the lead firm has a direct relationship with
the first tier supplier. When a lead firm uses an intermediary their interaction with the actual
apparel manufacturers may be limited or even non-existent. Lead firms often set minimum
parameters for the mills that will make their products, but they may not actually interact with the
factories. Small to medium-sized lead firms are more likely to use an intermediaries as well as
mass merchant retailers responsible for developing private labels for multiple types of products.
Large brand marketers and specialty retailers typically only use intermediaries for smaller
product lines that are ancillary to their main focus (i.e., accessories).
The branch plants of MNC suppliers or subcontractors typically have market or captive
relationships with the parent firm. Even though they are part of the same company, the value and
skills at the factory level differ. Subcontractors are more likely to be smaller, more informal
firms that work on short term contracts.
2. The Rise of Private Governance and Its Limitations
Lead firms generally have limited involvement with upgrading apparel suppliers, but this varies
by type. For example, they influence upgrading in core suppliers, but have little if any
involvement with branch plants, subcontractors or intermediary-managed factories. Lead firms
are still not directly involved with upgrading (in terms of providing assistance), but they entrust
these suppliers with additional responsibilities and encourage them to acquire new skills.
For example, in Sri Lanka and Turkey, where there are direct relational linkages between buyers
and suppliers, pressure from global buyers to provide services in design and niche product
manufacturing led apparel firms to hire designers and specialists and develop training programs
specifically to provide employees with the new skills required. Similarly in Bangladesh, global
buyers urged local firms to establish training programs to increase productivity (Fernandez-
Stark, Frederick, & Gereffi, 2011). In contrast, in Central American and Sub-Saharan African
countries where the development of the apparel industry has been closely tied to preferential
market access, global buyers’ pressure to provide full-package services has not translated to skill
acquisition or functional upgrading. Factories in these countries are predominately branch plants
of transnational apparel manufacturers whose supply chains are coordinated at headquarters
locations in East Asia rather than in-country.
Given lead firms’ core competence in marketing, branding and design, apparel manufacturers’
ability to functionally upgrade to these activities is limited in global export markets. In order for
firms to acquire these skills it is often necessary to adopt a strategy in which firms operate under
one model for the export-oriented industry and another model for domestic or regional sales. In
the situation of MNC apparel manufacturers, the ability of their branch plants to upgrade is also

18
limited because these factories are locked into the activities they are assigned as part of the
firm’s global production strategy.
Furthermore, there are several challenges to increasing wage increases and improving working
conditions in the global apparel industry.
1. Consumer prices and import unit prices for apparel have remained the same or fallen over
the last two decades.5 This can be attributed to several factors, including (a) the global
“oversupply” of apparel manufacturers created during the MFA (which increased buyers’
power because it made it easier to request more from suppliers without increasing the
prices paid to manufacturers), (b) fragmentation and thus a high degree of competition at
the retail level, (c) the trend towards “fast fashion” encouraging consumers to purchase
apparel more frequently, but at a lower price point and quality, and (d) productivity
improvements by large MNC factories. If consumer prices do not increase, it is difficult
to justify increases in wages or other costs along the supply chain.
2. Buyers provide suppliers with order and design specifications and ultimately set the price
they are willing to pay for the item to be produced. Some buyers determine this price in
conjunction with suppliers or with core suppliers; in other situations this is set completely
by the buyer or suppliers may even bid on orders. Lead firms ability to set the price of the
final product limits all suppliers’ ability to make changes that could result in an increase
to manufacturing costs. This includes wages, working conditions as well as experimental
process or product improvements. As such, suppliers are often forced to keep labor costs
low (see Table A-3 in Appendix for wage trends).
3. Unit production time and cost standards are few and far between; those that do exist are
based on best practice in a ‘lab’ setting which may not translate to the shop floor.
Furthermore, the range of apparel styles is vast and varies by buyer, so estimates (should)
change frequently over time. In reality, minimal research is conducted on cost elements
when determining manufacturing cost (CMT).
4. Large MNC factories are more productive, have the resources to perform internal cost
analyses, and often have factories in multiple countries, which enable them to produce a
particular garment in the country that minimizes cost. As such, they can offer lower unit
prices and smaller factories have to find a way to meet these prices or find new buyers.6
5. SMEs often accept orders without determining if it is achievable for them at the stated
rate. This results in reduced profits for suppliers and an unachievable delivery schedule.
This leads to low wages and excessive overtime to protect reduced profit and to ensure
delivery is made on time, regardless of the social consequences of long working hours.
Why do factories accept orders they cannot fulfill? In some cases factories do this in
order to obtain or retain an important client. In other cases, this is due to a lack of
education and/or resources on how to determine the unit cost of a garment over time. The
ability to accurately cost a garment requires industrial engineering skills and accurate
record keeping that are often not common practices in single factory locations or SMEs.
5 See (Miller, 2013), p. 6 for data on declining UK import unit prices 6 Opportunities to form direct relationships with buyers and thus play a more active role in the costing process (if
resources are available) may be possible in smaller product categories less dominated by large MNCs such as
intimate apparel, athletic wear, formalwear, dresses/skirts, and other miscellaneous apparel. However entry into
these segments is also more difficult as these products tend to be more detail and fashion-oriented and require access
to a wider range of inputs and more-skilled sewing machine operators.

19
6. Buyers are face increased pressure from NGOs and consumers to take responsibility for
social and to a lesser extent environmental compliance in supplier factories. As such, a
number of private initiatives have emerged to monitor, certify and publicize CSR efforts.
Managing compliance adds an additional cost and monitoring at multiple factories adds
time and money. This encourages buyers to consolidate their supply base and form
relationships with “core suppliers” they can trust and invest in. This makes it more
difficult for new factories to enter the chain and discourages subcontracting relationships.
Given the labor intensive nature of the apparel industry, there have been a number of private
standard setting initiatives created to certify and/or monitor policies in the workplace of apparel
factories (see Table A-4 in Appendix). These multi-stakeholder initiatives are composed of lead
firms, NGOs, unions, government agencies and in some cases large MNC apparel suppliers.
Advocacy groups often state that private auditing schemes have fallen short of making needed
adjustments and have not promoted systematic change in the industry. “Commercial auditing
largely outsources the responsibility for social compliance to suppliers, and fails to take
purchasing practices on the buyers’ side into account – even though a low buying price or short
lead times are often at the root of excessive overtime and low wages at the factory level” (Labour
Behind the Label, 2014), p.10.
Another fallback of these initiatives is that they primarily target the supply chains of the largest
global lead firms which only account for a relatively small share of the global apparel
manufacturing base. An additional problem is the sheer number of initiatives. Having multiple
initiatives with similar requirements creates confusion and complexity and results in higher costs
in order to comply with multiple codes and increases fragmentation rather than promote
harmonization.
These initiatives are good at identifying compliance issues in factories, but do not represent a
means to address power asymmetry in the chain per se. The actual requirements to comply with
the codes and standards are often fairly low and in many cases they do not address one of the
primary concerns of workers regarding “living” wages. Furthermore, the definition of a “living
wage” is not universal nor is it legally binding. Estimates have been created as part of the Asian
Floor Wage, but they are not part of an internationally agreed upon convention or standard. The
FWF, WRC, ETI and SAI8000 mention living wages, but due to inability to clearly define a
living wage, provide no means of enforcement.7 Buyers all mandate that national minimum
wages are paid in suppliers’ factories, but labor unions contest that these wages fall far below
acceptable levels. In addition to the difficulties related to defining living wages, issues still exist
in meeting minimum wages. There are ways factory owners can circumvent minimum wages by
hiring employees under different titles (such as an apprentice) or as temporary employees that
are not mandated under national minimum wage policies.
Whereas pressure is typically placed on lead firms to increase payments to factories, it is also
probable that prices paid to factories are reasonable and the distribution of gains is not spread out
7 BSCI considers living wages ‘best practice’, i.e. factories only encouraged to pay a living wage. Other codes
mandate that national minimum wages are met.

20
fairly to workers and factory owners keep profits. In this situation, one suggestion would be to
mandate in private codes of conduct that accounting practices are audited at supplier factories.
Therefore, if wages (or other labor-related policies that would increase costs) are to increase for
apparel manufacturers, the cost must stem from one of the following: (1) factory owners cut their
own profit, (2) factory owners cut profit, but recoup the cost via productivity gains (which will
require investments in skill or technology upgrading), (3) lead firms pay higher prices to
factories and cut their own profit, (4) lead firms pay higher prices, but recoup lost income via
cuts in other areas, or (5) lead firms pay higher prices and pass the increase to consumers (the
CCC believes that consumers would pay more if they were aware of the wage situation).
3. Global Value Chains and Public Governance
Dependence (see Table A-2 in Appendix) on the apparel industry (or a particular lead firm), can
affect a government’s willingness to regulate economic activity. For example, countries highly
dependent on the apparel industry for employment or exports may be hesitant to mandate wage
increases or improve labor or environmental policies for fear of losing contracts. This is
exacerbated by the high level of global competition in apparel manufacturing enabling buyers’ to
switch manufacturers with relative ease, especially for commodity-type, volume-oriented
production. In practice, this means union activity may be severely suppressed or legal minimum
wages are set below the subsistence minimum and are not revised in step with inflation (Labour
Behind the Label, 2014).8
In many developing countries, governments may also become locked in to extending generous
incentives to foreign investors that limit economic growth from the industry. Incentives such as
corporate tax holidays, zero tariffs on inputs for exports and machinery, and subsidies on
industrial space or utilities are common in export-oriented industries. Or, in some cases,
countries actively lobby to extend trade preferences that in actuality stifle the upgrading potential
of the industry (i.e. countries with market access agreements such as Nicaragua’s TPL, HOPE in
Haiti or AGOA).
These scenarios however, create a somewhat paradoxical situation. Without low labor costs or
attractive incentive schemes it may be difficult or impossible to enter the value chain and attract
investors that can provide needed employment opportunities and already have hard to establish
links to global buyers. On the other hand, these types of investments provide little benefit to the
host country outside of employment and limited upgrading opportunities beyond assembly.
4. Conclusion
In order for social conditions to improve in apparel factories, the distribution of value along the
chain needs to change or the overall price paid must increase. For this to happen, one or more of
the following could occur: consumer prices increase, lead firms reduce profit margins, apparel
factory owners distribute gains equitably to employees and/or cost savings are achieved via
improvements in productivity through process or labor efficiencies. There are several key groups
of stakeholders involved.
8 Source’s Source: Merk, J. (2009). “Stitching a Decent Wage across Borders”, CCC/AFW,
www.asiafloorwage.org/Resource-Reports.html, pp.30–35.

21
Lead firms: In buyer driven chains such as apparel, ‘power’ is closely tied to brand ownership
and brands are the firm in the chain responsible for purchasing apparel products and thus setting
the price that will be paid to manufacturers. As such, the most common strategy has been to
target these firms to promote improvements at supplier factories. This strategy has been
successful in increasing the number of initiatives targeted to improving wages and working
conditions, but effectiveness is stifled by their voluntary nature and focus on the largest buyers.
As such, one strategy is to target the “second tier” of largest global buyers or brands emerging
in developing country markets. The leverage point in the apparel industry is typically focused on
the top ten to 25 most well-known apparel brands and retailers. All of these companies are
members or participants of multiple private standard organizations and/or have their own
minimum standards. However given the structure of the apparel industry, implementing changes
for the major global buyers only impacts a small share of the entire global industry. The top ten
apparel companies account for less than ten percent of global apparel sales. As such, this also
means that rules, certifications and standards mandated by these buyers only impact a similar
share of apparel manufacturers. Future campaigns could target the next largest tier of apparel
brands and retailers or a specific product category. These groups are more likely to use different
sourcing strategies than the largest global buyers and represent an opportunity to research
another level of apparel manufacturers (e.g., smaller buyers are more likely to use agents or
intermediaries).
Stated differently, small and medium-sized apparel factories, single country manufacturers
and subcontractors with limited global reach and direct access to buyers have the least power in
the chain and the least resources available in terms of capital and workforce to make the
productivity improvements necessary to compete with large multi-national manufacturers. They
also face educational constraints in terms of developing realistic cost estimates. These factories
need the most assistance in terms of improving wages and working conditions, but are often
missed in private standard setting initiatives because they are not directly supplying global
buyers.
Another top down strategy is to concentrate efforts on social and environmentally-focused
brand owners to push real changes that could result in spillovers to manufacturers in other
segments. Two groups that could be targeted using this strategy are European apparel retailers
and U.S. athletic companies. In the case of European retailers, there are more strict requirements
on meeting social criteria to receive tariff benefits and on restricted substances. In the case of
athletic or outdoor companies, consumers are perceived to be more environmentally conscious
and as such, brand owners have an incentive to market goods to consumers using an ethical
angle.
Owners of transnational manufacturers and agents have the next most power in the chain, and
hold some leverage vis-à-vis lead firms in situations where they have long term relationships and
hold tacit knowledge that is difficult to replace. For these firms providing research to highlight
cost benefits of improving wages and working strategies is a viable strategy. Firms are likely
unopposed to improving social conditions, but outside of personal morals, have no incentive to
improve working conditions if there is not a return on the investment. Both parties stand to gain
when economic and social upgrading is hand-in-hand.
22
Educating governments on the types of upgrading that can provide sustainable benefits is also
important. Keeping minimum wages low and targeting trade and industrial policies that attract
low value activities may employ workers, but in low-paying, low-skill jobs with little room to
upgrade. Another strategy is to target consumers; the only group in the chain that holds more
power than the brand owner is the ultimate consumer. If an apparel company cannot sell its
products, it doesn’t matter how much value can be attributed to the brand. As such, one strategy
is to increase efforts to educate consumers on social and environmental issues.
Multi-stakeholder initiatives have made important first steps towards providing the framework
to identify and address issues, but more could be done. One suggestion would be to mandate
wage increases across all Asian suppliers to avoid isolating a single country. Another suggestion
is to add clauses to codes of conduct and auditing procedures that require apparel manufacturers’
accounting practices to be evaluated to ensure profits are being distributed to workers in line
with the prices paid to the factory and operating costs.

23
Case Two: Pro-Poor Development and Power Asymmetries in the Cocoa-Chocolate GVC
Prepared by Ajmal Abdulsamad
Summary
The cocoa-chocolate global value Chain (GVC) has increasingly become concentrated over the
last decades. In a ‘bi-polar’ governance system, the chain is dominated by two groups of lead
firms that control how and where value is created and distributed along the value chain. Lead
firms in the consumer markets control high-value functions in brand manufacturing and
marketing. Their upstream counterparts in the processing segment dominate the global supply
chain of cocoa ingredients and are operational in both producer and consumer countries.
While several developing countries, particularly, in West Africa, heavily rely on income-derived
from cocoa production, the share of value retained by cocoa-producing countries has declined by
more than 50% over 1970s-1990s, marking the rise of concentration and asymmetric power
relationships in the chain. Small farmers, often depending on the sector for two-thirds of their
income, have experienced persistently falling market prices in real terms. In contrast, they have
simultaneously had to bear higher costs and risks in production driven by the dynamic global
markets.
These developments culminated in widespread deterioration of social and economic conditions
in producing countries. In return, the targeted campaigns by civil society organizations spurred a
proliferation of private governance initiatives. Although a compelling feature of the private
governance has since been its ability to reach across national jurisdictions, it faces a dubious
prospect and is considered less effective to redress the underlying challenges, including
pervasive poverty, surrounding cocoa farming now. A recent emerging alternative has been the
renewed emphasis on public governance and re-regulation of the cocoa sector in major cocoa
producing countries.
Key Findings are:
1. The global chocolate confectionery market is controlled by five global brand firms:
Mondelez International (15%), Mars Inc. (14%), Nestle (12%), Ferrero (8%), and
Hershey Co. (7%) (Euromonitor, 2014a). They rely on long-established brand recognition
and scale economies offered by their worldwide network of manufacturing and market
infrastructure. These firms have remarkable buyer power and own several brands that
each generates multi-billion dollar annual retail sales in global markets.
2. Three lead firms dominate the vertically-integrated global supply chains for cocoa
ingredients. Barry Callebaut9 (23%), Cargill (15.3%), and ADM10 (12.7%) control
approximately 51% of the cocoa processed worldwide (Statista, 2014). These firms draw
on their internal expertise and long-established capabilities in global supply chain
9 Market share reflects acquisition of Petra Foods in 2013. 10 Olam International, a global commodity trader, has agreed to acquire ADM’s cocoa business. The acquisition is
expected to complete in 2015.

24
management across multiple commodities. In the cocoa sector, they operate vertically-
integrated supply chains that span from the rural areas in cocoa producing countries to
major portal cities housing advanced processing facilities in Europe and North America.
3. An asymmetric relationship in market power mirrors an asymmetric distribution of
value along the chain. Smallholder farmers facing an oligopsonistic market have
experienced persistently declining cocoa prices from the 1980s to 2008. They currently
receive just 4-6% of the final consumer price. Overall, the share of value retained by
cocoa-producing countries declined from around 60% in 1970-72 to around 28% in 1998-
2000 (World Bank, 2008). Branding and marketing accrue the most value, an estimated
70-72% of the final price.
4. Income derived from cocoa farming is far lower than the amount needed to help
smallholder farmers escape poverty. Besides the declining real prices, small farmers
have experienced increasingly higher costs and risks in production, particularly, in fully
liberalized markets. Whereas they have to bear the costs of certifications, the promised
premium price is not guaranteed. Nearly one-third of the certified cocoa production is
still sold in the mainstream commodity markets. Regardless, the effective global market
share of certified cocoa remains very small, just 7% of the estimated 4.1 million ton
cocoa produced in 2012.
5. Fueled by the growing fears about the future shortages of cocoa supply, the cocoa
sector experiences a return of the regulatory state. The International Monitory Fund
(IMF) and World Bank (WB) now undo their past policy prescriptions. The Heavily
Indebted Poor Countries (HIPC) scheme of the IMF/WB that once were used as a tool to
roll out market liberalization in the 1980s have pre-conditioned debt-relief to re-
regulation in the cocoa sector in Cote d’Ivoire. As part of the agreement to a US$4billion
debt-relief deal, the Cote d’Ivoire government has reinstated regulatory measures in its
cocoa sector since 2011.

25
1. The Cocoa-Chocolate Global Value Chain: Lead Actors and Power Asymmetries
1.1. Input-Output Structure
The cocoa-chocolate global value chain (GVC) encompasses the full range of activities related to
cocoa production, cocoa trade and processing, chocolate manufacturing, marketing and retail
(Figure 3).
Figure 3: The Cocoa-chocolate Value Chain
Source: CGGC
1.2. Lead Actors and the Growing Concentrated Markets
Two group of lead firms control the cocoa-chocolate GVC: the global brand manufacturers and
the vertically-integrated cocoa processors. The latter primarily function as the global supply
chain managers of cocoa ingredients. Their vertically-integrated operations cover global cocoa
sourcing, trade and processing. They are further sub-divided into those with historical trading
interests in a wide portfolio of commodity products, e.g. Cargill, Archer Daniel Midland (ADM)
and Olam International, against Barry Callebaut, which has traditionally concentrated on the
cocoa industry. Overall, as large intermediary firms, the global processors have no consumer-
faced marketing activities, which is predominantly controlled by the leading brand
manufacturers.
These leading chain actors, whether in the processing or branding manufacturing segment, have
strategically pursued market expansion by frequent acquisition of competitors, rather than
organic business growth. More than 200 acquisitions occurred in chocolate manufacturing
industry between the 1970s and 1990s (Dand, 1999). The result has been rapid concentration in
the chain, with 17 firms controlling 50% of the global markets in late 1990s (Dand, 1999; Fold,
2001). Over 2000-13, this number has further shrunk by more two-thirds, namely, more than
50% of the global market is now controlled by five firms: Mondelez International (15%), Mars
Inc. (14%), Nestle (12%), Ferrero (8%), and Hershey Co. (7%) (Euromonitor, 2014a). Even
though at a global level the five lead firms control 56% of the chocolate market, market
concentration is much higher at the individual country level. The top three large firms control
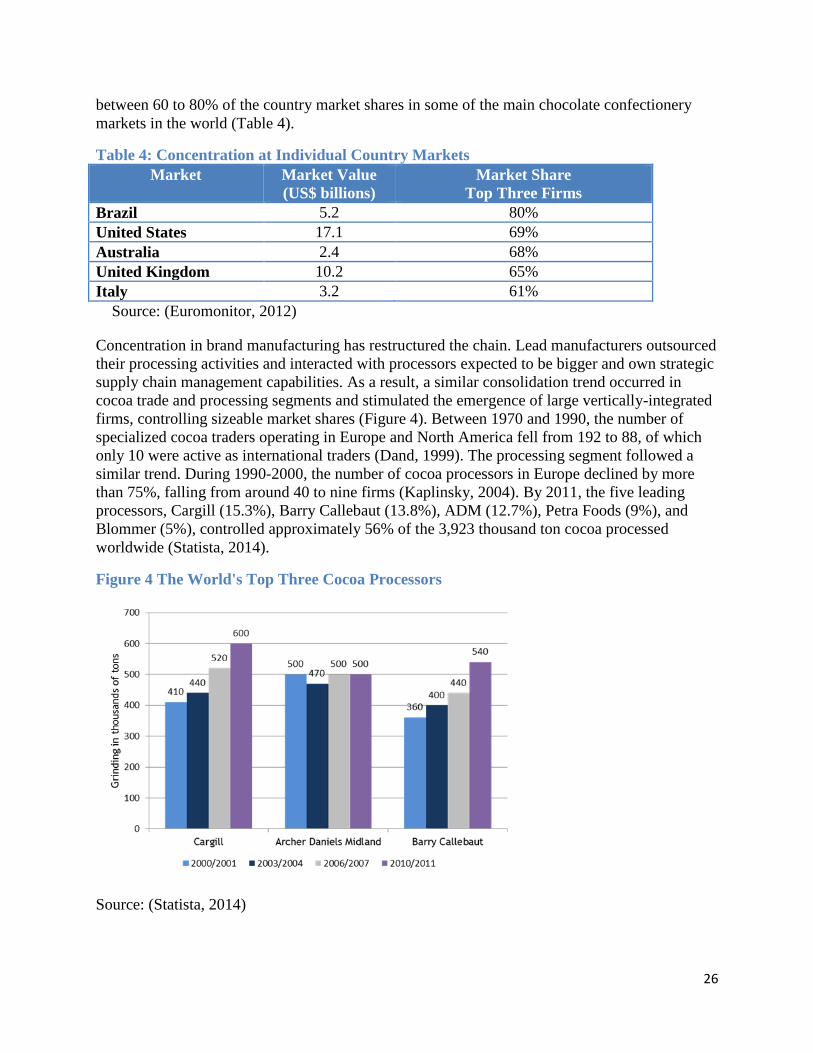
26
between 60 to 80% of the country market shares in some of the main chocolate confectionery
markets in the world (Table 4).
Table 4: Concentration at Individual Country Markets
Market Market Value
(US$ billions)
Market Share
Top Three Firms
Brazil 5.2 80%
United States 17.1 69%
Australia 2.4 68%
United Kingdom 10.2 65%
Italy 3.2 61%
Source: (Euromonitor, 2012)
Concentration in brand manufacturing has restructured the chain. Lead manufacturers outsourced
their processing activities and interacted with processors expected to be bigger and own strategic
supply chain management capabilities. As a result, a similar consolidation trend occurred in
cocoa trade and processing segments and stimulated the emergence of large vertically-integrated
firms, controlling sizeable market shares (Figure 4). Between 1970 and 1990, the number of
specialized cocoa traders operating in Europe and North America fell from 192 to 88, of which
only 10 were active as international traders (Dand, 1999). The processing segment followed a
similar trend. During 1990-2000, the number of cocoa processors in Europe declined by more
than 75%, falling from around 40 to nine firms (Kaplinsky, 2004). By 2011, the five leading
processors, Cargill (15.3%), Barry Callebaut (13.8%), ADM (12.7%), Petra Foods (9%), and
Blommer (5%), controlled approximately 56% of the 3,923 thousand ton cocoa processed
worldwide (Statista, 2014).
Figure 4 The World's Top Three Cocoa Processors
Source: (Statista, 2014)

27
Two recent developments will lead to further consolidation and the rise of new lead firms in the
processing segment. In 2013, Barry Callebaut completed its acquisition of Petra Foods, which
was the world’s fourth largest cocoa processor (Euromonitor, 2014a). Similarly, Olam
International, a global commodity trader, announced its agreement, in December 2014, to buy
ADM’s cocoa business for US$1.3 billion (Madden, 2014). The acquisition, which is expected to
close in the second quarter of 2015, will position Olam to become one of the top three global
cocoa processers. This deal came just three months after Cargill announced the company would
buy ADM’s industrial chocolate business for US$440 million (Euromonitor, 2014c).
At the local level in producing countries, the upstream segment of the cocoa-chocolate GVC has
a highly fragmented market structure. Cocoa production occurs on an estimated five million
small farms, producing cocoa on plots of 1-3 ha of land (ICCO, 2012). Local cocoa trade also
involves large number of local collectors or local buying agents, often situated in captive
relations or working on commission for large traders or subsidiaries of multinational
corporations (MNCs). These local actor compete fiercely among to secure supply, driving down
farmgate prices received by local farmers. Total employment in the sector reaches approximately
14 million workers worldwide, with its three-quarter concentrated in Africa (Table 5).
At the country level, cocoa production is geographically concentrated in a handful of countries in
West Africa, which heavily depend on cocoa-derived revenue both for their macro and rural
household economies. As the important source of global supply, West African countries -- Cote
d’Ivoire, Ghana, Nigeria and Cameroon-- account for approximately 70% of production and 75%
of total exports worldwide (FAOSTAT, 2014). The sector makes sizeable contribution to
agricultural gross domestic product (GDP) of leading producers in West Africa, such as: Cote
d’Ivoire (44%), Ghana (14%), and Cameroon (7%) (Table 5). As an export-oriented sector, it
contributes even higher share of their annual export earnings. In 2011, cocoa derived export
earnings for Cote d’Ivoire and Ghana, respectively, were estimated at US$3.91 billion and
US$2.41 billion, accounting for 31% of total merchandize exports for the former (FAOSTAT,
2014).

28
Table 5: Cocoa Sector’s Footprint in the National and Rural Household Economies of Major Producing Countries
Country
Total
Employmen
t
(millions)
Number of
smallholder
s
(‘000)
2012
Production
Quantity
(‘000 tons)
2012 Gross
Value of
Cocoa Bean
Produced
(US$
million)
2012
Agricultura
l GDP
(US$
million)
2012
Cocoa
Production
as a Share
of
Agricultur
al (GDP)
(%)
2011
Value of
Cocoa
Derived
Exports
(US$
million)
2011
Percentage of
Cocoa Derived
Export
Earnings as
Share of Total
Merchandize
Exports*
Africa 10.5 2,919
Cote d’Ivoire 3.6 800 1,486 3,192 7,209 44 3,904 31%
Ghana 3.2 720 879 1,297 10,027 14 2,413 20%
Cameron 1.6 500 207 600 4,027* 7 592 13%
Others 2.1
Asia-Pacific 2.11 511
Indonesia 1.6 1,400 440 1,826 127,143 1 1,290 0.6%
Others 0.51
Latin
America
1.39 655
Ecuador 0.28 N/A 198 230 8,572 3 564 2.5%
Brazil 0.21 N/A 220 92 119,613 <1 289 0.11%
Others 0.9
World Total 14 5,500 4,085
*Derived from f.o.b. value of exports of cocoa beans and cocoa products and total country merchandise exports published by the
(FAOSTAT, 2014)
Sources: (FAOSTAT, 2014; ICCO, 2012; World Bank, 2014b)
29
1.3. Asymmetric Power Relationships
Since the 1990s, the structure of cocoa-chocolate GVC has significantly transformed. Key
features of this shift were characterized by the rising horizontal concentration in the chocolate
manufacturing segment, the emergence of vertically-integrated cocoa processors, and the
liberalization of the cocoa sector in producing countries in West and Central Africa (Fold, 2001;
UNCTAD, 2008). This rapid structural transformation gave rise to asymmetric power
relationship as well as growing control by the lead firms over how and where value is created
and distributed along the chain (Fold, 2001, 2002)
As the “gatekeepers” to consumer markets, brand manufacturers have exhibited significant
market power in controlling the higher value-added functions in the cocoa-chocolate GVC. This
market power draws on brand recognition and scale economies offered by their worldwide
network of manufacturing and marketing infrastructure. Several of the global chocolate brands
generate over US$1 billion annual revenue (Euromonitor, 2014a). The popular global brand,
Cadbury, owned by Mondelez International, is marketed in 41 countries and accounts for an
estimated US$6 billion annual global retail value (Euromonitor, 2014a). It controls a remarkable
share of the chocolate confectionery markets in both developed and developing countries, such
as: India (52%), New Zealand (48%), South Africa (40%), Australia (36%), and United
Kingdom (24%) (Euromonitor, 2014a). Chocolate products manufactured by Mars, the second
largest brand manufacturer, are marketed in 80 countries under 29 brand names, including five of
the billion-dollar global brands, namely, M&M’s, Snickers, Galaxy/Dove, Mars, and Twix
(OneSource, 2014). Kit-Kat, a major brand of Nestle, is distributed in 62 countries and annually
generates nearly US$2 billion retail sales (Euromonitor, 2014a).
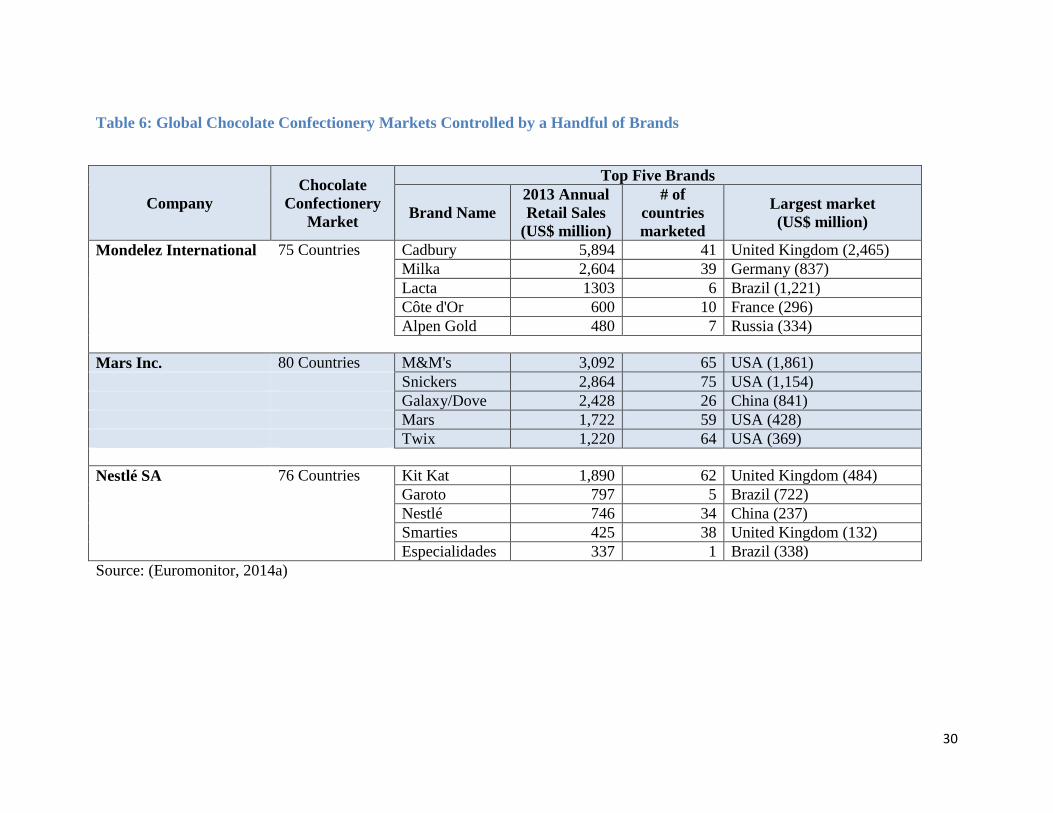
30
Table 6: Global Chocolate Confectionery Markets Controlled by a Handful of Brands
Company
Chocolate
Confectionery
Market
Top Five Brands
Brand Name
2013 Annual
Retail Sales
(US$ million)
# of
countries
marketed
Largest market
(US$ million)
Mondelez International 75 Countries Cadbury 5,894 41 United Kingdom (2,465)
Milka 2,604 39 Germany (837)
Lacta 1303 6 Brazil (1,221)
Côte d'Or 600 10 France (296)
Alpen Gold 480 7 Russia (334)
Mars Inc. 80 Countries M&M's 3,092 65 USA (1,861)
Snickers 2,864 75 USA (1,154)
Galaxy/Dove 2,428 26 China (841)
Mars 1,722 59 USA (428)
Twix 1,220 64 USA (369)
Nestlé SA 76 Countries Kit Kat 1,890 62 United Kingdom (484)
Garoto 797 5 Brazil (722)
Nestlé 746 34 China (237)
Smarties 425 38 United Kingdom (132)
Especialidades 337 1 Brazil (338)
Source: (Euromonitor, 2014a)

31
Given their overall business portfolio in food and beverages, brand manufacturers also draw on
large-scale cost efficiencies offered by economies of scope. They typically operate across many
adjacent categories, such as biscuits, bakery, beverages alongside chocolate confectionery. For
Nestle, as the world’s largest food and beverage manufacturer, chocolate confectionery only
constitutes less than 10% of its US$96 billion annual revenue (OneSource, 2014). Its product
portfolio is supported by an extensive global presence, including 461 production facilities in 83
countries (IBISWorld, 2014). Similarly, Mondelez International, operating across five consumer
products, manages a global network production and marketing infrastructure that incorporate 171
manufacturing facilities in 58 countries (OneSource, 2014). Besides the physical infrastructure,
brand manufacturers have mobilized remarkable workforce capabilities and sizeable annual
research budgets. Mondelez International’s research and development activities are carried out
by 2,750 food scientists, chemists, and engineers and was financed by a US$471 million budget
in 2013 (OneSource, 2014). These scale economies remarkably lower average cost and create
entry barriers in these segments controlled by lead firms.
In addition, the dominant market presence, buttressed by customer loyalty of brands, provides
chocolate manufacturers various options to retain higher profit margins. In 2011, they have used
various mechanisms to manage the rising cost of raw materials. The commonly adopted
approach was to directly pass on the rising costs to consumers. The US brand manufacturer,
Hershey Co., increased prices by 9.7% in 2011(Euromonitor, 2012, 2014c). Alternatively, Kraft
(now Mondelez International) reduced the size of Cadbury Dairy Milk in the United Kingdom
from 140 to 120 grams but marketed the resized product at the full price (Euromonitor, 2014c).
The other alternatives pursued by chocolate manufacturers included expanding or contracting
particular recipes, e.g., a typical countline recipe contains 16.3% cocoa ingredients compared
with 35.6% in tablets, or even substituting more of the cocoa butter with cheaper vegetable fats
(if regulations allow) (Euromonitor, 2014c).
In their interaction with large processors, brand manufacturers are also in a relatively better
price-negotiating position. Notwithstanding their enormous buyer power, they have inherent
knowledge of the cost structure of cocoa processing (FLA, 2012). They generally require
processors to report detailed information under specific supply contracts. ‘The Nestle Cocoa
Plan’ (TNCP) contracts, representing 20% of cocoa volume Nestle sources from Cote d’Ivoire,
requires contract suppliers to report on the volume, quality, and costs, as well as the number of
farmers trained (FLA, 2012).
Cocoa processors are actually the global supply chain managers of cocoa ingredients. In a ‘bi-
polar’ governance structure, they wield considerable market power in structuring the cocoa
markets in producing countries. They manage a vertically-integrating business that spans both
producer and consumer countries. They, however, lack consumer-faced brands and the presence
of ADM and Cargill, two of the world’s biggest commodity traders, is very recent in the cocoa-
chocolate GVC. Cargill entered cocoa business in the late 1980s through the acquisition of a
cocoa trading company, General Cocoa and its processing subsidiary, Gerkens (OneSource,
2014). ADM’s involvement only goes back to 1997 when it took over the cocoa interests of
Grace Corporation (OneSource, 2014). They, however, been able to rapidly consolidate market
share through a series of acquisitions in downstream processing functions and simultaneous
backward integration of cocoa sourcing within producing countries (UNCTAD, 2008).

32
Cocoa processors now have strong presence in the cocoa processing and increasingly in
industrial chocolate manufacturing. Barry Callebaute (40%) and Cargill (30%) --after Cargill
acquired ADM’s (8%) chocolate business in 2014-- together control 70% of the industrial
chocolate production in the open market (Statista, 2014). The open market represents 49% of the
total 6.4 million ton global industrial chocolate (couverture) production whereas the 51% balance
is still retained in-house by brand manufacturers (Barry Callebaut, 2007). Under the popular
global business brands, for instance, Barry Callebaut (Cacao Barry and other six brands), Cargill
(Gerken Cacao), and ADM (deZaan), cocoa processors supply industrial chocolate, also cocoa
powder, to business customers such as specialty manufacturers, and artisanal producers,
including bakers, pastry chefs, hotels, restaurants and caterers (Euromonitor, 2012).
After liberalization in producing countries, which was engendered by the Heavily Indebted Poor
Countries (HIPC) scheme of the International Monetary Fund (IMF) and World Bank (WB),
large cocoa processors integrated backward and established supply chain operations within cocoa
producing countries. While Ghana partially resisted this trend, Nigeria, Cameroon, and Cote
d’Ivoire have embraced full liberalization, although implementing it at different speeds, since the
1980s (UNCTAD, 2008). The resulting backward integration by large cocoa processors has
culminated into a structural imbalance, characterized by an oligopsonistic market, upstream in
the chain, between large number of smallholder farmers and a handful of large buyers in
producing countries (Fold, 2001; UNCTAD, 2008).
Large cocoa processors have since rapidly consolidated their cocoa sourcing operations within
origin countries. In Cameroon, where liberalization started in 1991 and completed in 1994, over
600 companies initially sought registration for cocoa exports, but only two international firms
accounted for 80-90% of total exports by 1997 (Dand, 1999). Similarly, in the other fully
liberalized markets, these firms have since established their own local sourcing networks, often
involving local intermediaries through whom they control the farmgate prices received by cocoa
farmers (Fold, 2001; UNCTAD, 2008). The primacy of asymmetric power relationship, together
with the emergence of major new producing countries (Indonesia and Malaysia since the 1980s),
has led to a secular decline of the cocoa prices between 1980s and mid-2000s (Figure 5). Cocoa
farmers have since become directly exposed, without any protection measures, to international
price fluctuations and cost-cutting pressures that increasingly suppressed cocoa-derived income
to smallholders.
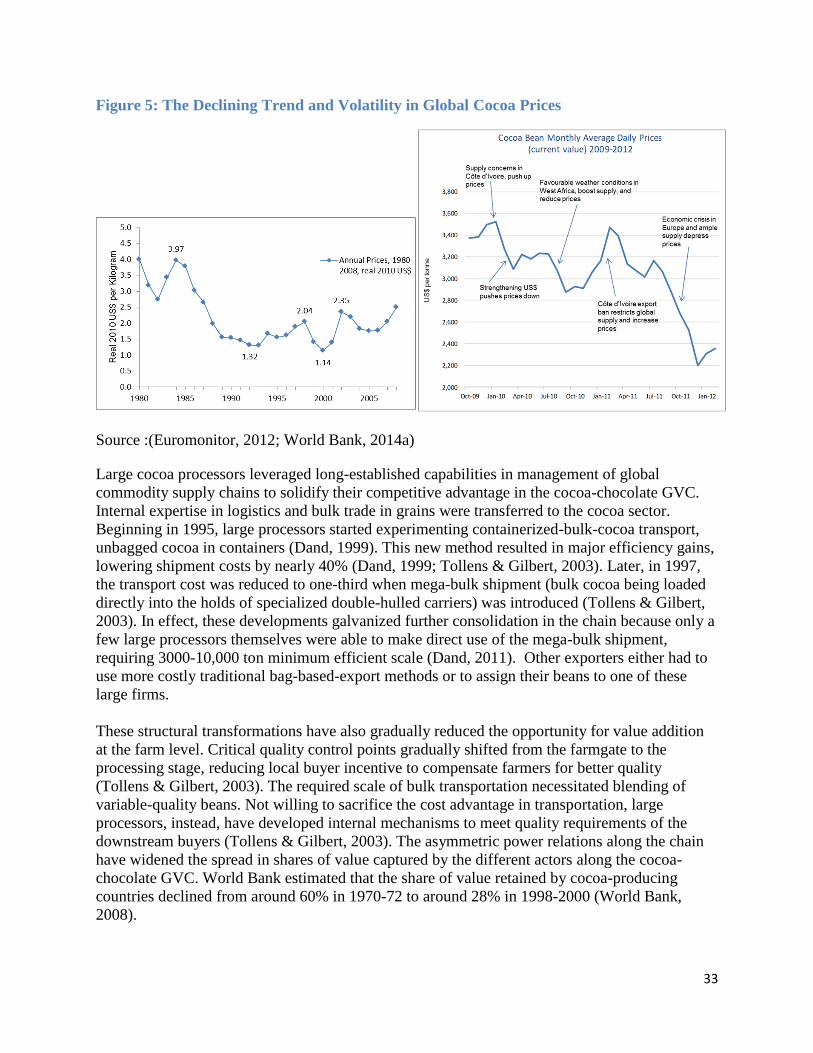
33
Figure 5: The Declining Trend and Volatility in Global Cocoa Prices
Source :(Euromonitor, 2012; World Bank, 2014a)
Large cocoa processors leveraged long-established capabilities in management of global
commodity supply chains to solidify their competitive advantage in the cocoa-chocolate GVC.
Internal expertise in logistics and bulk trade in grains were transferred to the cocoa sector.
Beginning in 1995, large processors started experimenting containerized-bulk-cocoa transport,
unbagged cocoa in containers (Dand, 1999). This new method resulted in major efficiency gains,
lowering shipment costs by nearly 40% (Dand, 1999; Tollens & Gilbert, 2003). Later, in 1997,
the transport cost was reduced to one-third when mega-bulk shipment (bulk cocoa being loaded
directly into the holds of specialized double-hulled carriers) was introduced (Tollens & Gilbert,
2003). In effect, these developments galvanized further consolidation in the chain because only a
few large processors themselves were able to make direct use of the mega-bulk shipment,
requiring 3000-10,000 ton minimum efficient scale (Dand, 2011). Other exporters either had to
use more costly traditional bag-based-export methods or to assign their beans to one of these
large firms.
These structural transformations have also gradually reduced the opportunity for value addition
at the farm level. Critical quality control points gradually shifted from the farmgate to the
processing stage, reducing local buyer incentive to compensate farmers for better quality
(Tollens & Gilbert, 2003). The required scale of bulk transportation necessitated blending of
variable-quality beans. Not willing to sacrifice the cost advantage in transportation, large
processors, instead, have developed internal mechanisms to meet quality requirements of the
downstream buyers (Tollens & Gilbert, 2003). The asymmetric power relations along the chain
have widened the spread in shares of value captured by the different actors along the cocoa-
chocolate GVC. World Bank estimated that the share of value retained by cocoa-producing
countries declined from around 60% in 1970-72 to around 28% in 1998-2000 (World Bank,
2008).

34
Figure 6 presents the value distribution as per price data related to a chocolate bar between two
periods, 2001 and 2013. The share of value that accrues to smallholder farmers is just about 4-
6% of the final consumer price. In 2001, an estimated 71% of the total price a chocolate bar was
captured by global brands and retailers and almost 18% of the value is captured by traders and
processors. Although these figures cannot be representative of the various brands and the
associated different prices in the market, Figure 6 two-thirds of the value in cocoa-chocolate
GVC is created and captured at the branding and marketing segments of the chain.
Figure 6: Distribution of Value along the Cocoa-chocolate Value Chain
Source: (Dand, 2011; Euromonitor, 2014a)
Income from cocoa farming is now far lower than the amount needed to help smallholder
farmers escape poverty. While cocoa production accounts for a large share of household income,
an estimated two-third in Ghana, the average income from cocoa production was estimated to be
approximately US$0.42/capita/day in Ghana in 2008 (Barrientos & Asenso-Okyere, 2008).
Besides facing a protracted decline in real prices of cocoa (Figure 5), smallholder farmers have
since liberalization been compelled to bear the increasing costs and risks of production. The
commodity boards were dismantled and farmers lost access to subsidized input and services,
including credit, extension, quality control and marketing. Expectation was that removing the
state would free the market for private actors to take over these functions— reducing costs,
improving quality, and eliminating inefficiencies. Too often, that didn’t happen, mainly leaving
majority of the smallholders exposed to extensive market failures, high transaction costs and

35
risks, and service gaps (World Bank, 2008). In return, cocoa farm have since entered a period of
perpetual underinvestment, decreasing productivity, and increased incidences of pests and
diseases. The future of chocolate industry is threatened as it is project that cocoa supply will not
keep up with rising demand (Figure 7).
Figure 7: Trend in Cocoa Supply and Demand: Actual Figures for 1978-2011
(Projected Figures at 3% Demand Growth and Stagnant Supply for 2012-2025)
Source: Blommer, 2011
2. The Rise of Private Governance and Its Limitations
After a long period of neglect, two distinct developments, since the early 2000s, have triggered a
burst of private governance responses which took many forms, including: industry codes of
conduct, standard & certification schemes, and multi-stakeholder initiatives (Bitzer et al., 2012).
First, the industry became the target of global campaigns by nongovernmental organizations
(NGOs) and the media that made allegations of child labor and child trafficking on cocoa
plantations in West Africa (Schrempf-Stirling & Palazzo, 2013). The connection of valuable
brands with child exploitation posed serious threat to corporate reputation and sales (Schrage &
Ewing, 2005). Second, the internal threat to the sector in the form of low productivity, old farms
and a high incidence of pests and diseases fuelled concerns over the future shortages of cocoa
supply (Barrientos, 2014; Barrientos & Asenso-Okyere, 2008). While a compelling feature of the
private governance has since been its ability to create novel governing regimes that reach across
national jurisdictions, its future prospect in the cocoa sector remains dubious at best, partly,
because of the underlying challenges facing the sector in producing countries.

36
The future of private governance mechanisms, particularly, standards & third-party certification
schemes, are tied to brands and the ability to compete for value in consumer markets. A market-
based approach, however, gave rise to the emergence of multiple competing schemes, currently
four in the cocoa-chocolate GVC, namely, Fairtrade, Rainforest Alliance, Organic, and UTZ
Certified (Potts et al., 2014). While many of the leading brands have made certification
commitments, often targeting a specific percentage of cocoa-sourcing by 2020, the full market
potential of certified cocoa is not known. The future growth trajectory of certified production
depends on demand by brand manufacturers. In this connection, much will depend on the
dynamic interactions between consumer demand, capability to monitor enforcement of brand
commitments, and the costs and benefits of certifications to smallholder cocoa producers over
the coming years.
The current market-based approach, at least up to now, has illustrated considerable constraints in
market demand. The supply of certified cocoa has expanded dramatically over the past five
years. Starting from a small base, mainly Organic and Fairtrade, that accounted for less than one
percent of global production in 2008 (KPMG, 2013; Potts et al., 2014), the net volume of
certified cocoa supply reached 22% of total production11 worldwide (Potts et al., 2014), an
estimated 4.1 million tons in 2012 (FAOSTAT, 2014). The rapid growth was fueled by the
industry supported UTZ certified and Rainforest Alliance, which expanded, respectively, at
compound annual growth rates of 363% and 223% during 2008-12 (Potts et al., 2014). The
astonishing growth rate in supply would have recorded more than twenty-fold increase in volume
of certified cocoa only if market uptake was growing as fast.
The global demand for certified cocoa, however, trailed far behind the available supply in 2012.
Just one-third of the certified supply was actually sold as certified (Table 7). Even if the gap
between production and market-uptake of certified cocoa were transitional, the effective global
market share of certified cocoa still remains marginal, just 7.3% of the estimated 4.1 million ton
cocoa produced worldwide in 2012 (Potts et al., 2014).
Table 7: Volume of Certified Cocoa Produced and Sold by Certification Scheme, 2012
Certification Scheme Production Sale % Sold as Certified
UTZ certified 534,614 118,641 22%
Rainforest Alliance 405,000 205,784 51%
Fairtrade International 175,900 68,300 39%
Organic* 103,554 77,539 75%
Total 1,219,068 470,264
Total Certified (Adjusted for
multiple certifications)**
890,000 300,000 33%
*Figures for 2011
**Almost one-third of total certified production represented overlapping certification. As reported by the individual
certification schemes, certified production approximately accounted for 30% of global cocoa production. Adjusted
production levels of certified cocoa amounted to 22% of global production.
Source: (Potts et al., 2014)
11 This volume accounts for total certified production after adjustment for overlapping & multiple certifications that together represented one-third of the total reported certified volume by the related organizations in 2012.

37
Concerning economic aspects, the standard & certification schemes can potentially lead to
increased farmer productivity. Training to farmers, a required criterion by certifying agencies,
can help improve yields, given the absence of, or dysfunctional, extension services (Kessler et
al., 2012). A recent study by Committee on Sustainability Assessment reported on the
differences observed across a number of indicators between certified and non-certified cocoa and
coffee farmers in 12 countries (COSA, 2013). Drawing on data points derived from 3,500 to
16,000 farm surveys, the study noted that certified famers demonstrated better training in
farming techniques, improved farm practices (soil and water conservation, conserving
biodiversity), higher yield (+14%) and a modest difference in net income (+7%) (Figure 8).
Figure 8: Certified Cocoa and Coffee Producers Compared to Uncertified Producers
Source: (COSA, 2013)
While moderate income improvement is possible, only when certified farmers receive price
premiums, it is often not guaranteed. This is partly because one-third of the certified cocoa
supply is marketed in the mainstream commodity markets. This goes against the general belief,
underlying the market-based approach, that economic benefits will follow automatically upon
reaching compliance requirements. Additional, the asymmetric value distribution along the chain
remains unaffected by the certification schemes. According to a literature review by International
Trade Center (ITC), even additional revenue, for the certified products, were distributed
unevenly along the value chain and mainly captured by brand manufactures (ITC, 2011). The
share of consumer price that accrues to a certified cocoa producer is still marginally small, not
much different from conventional cocoa. Figure 9 presents the price structure of a Tony
Chocolonely Fairtrade chocolate bar, which suggests that the farmgate price, including the
premium, still adds up to just 6% of the final price. This is just about a tenth of the gross margin
for brand and retailers.

38
Figure 9: Price Structure of a Fairtrade Chocolate Bar
Source: (Tony Chocolonely, 2014)
Beyond the market issues, the expansion, and the eventual full mainstreaming, of standard &
certification schemes is undermined by the major structural challenges surrounding cocoa
production. Smallholders are not homogeneous and not all cocoa producers can access
certification, perhaps a key reason for the pervasive overlapping certified status of the easily
accessible farmers. While about 90-95% of cocoa producers in West Africa are smallholders and
relatively poor, they were classified into four segments in terms of their ability to participate in
certification schemes (KPMG, 2011). The first is a small segment which is already certified. The
second segment, also relatively small, which is not yet certified, but they can be certified if they
make the required capital investment. A third, yet, larger segment, who are settled in remote
areas and not yet organized, is difficult to reach and include in certification schemes. For this
group, certification will require larger investment costs. A fourth, perhaps, the largest segment
cannot be reached at all with certification: farmers live too remote and produce very small
quantities, too little to cover the annual costs for certification (KPMG, 2011).
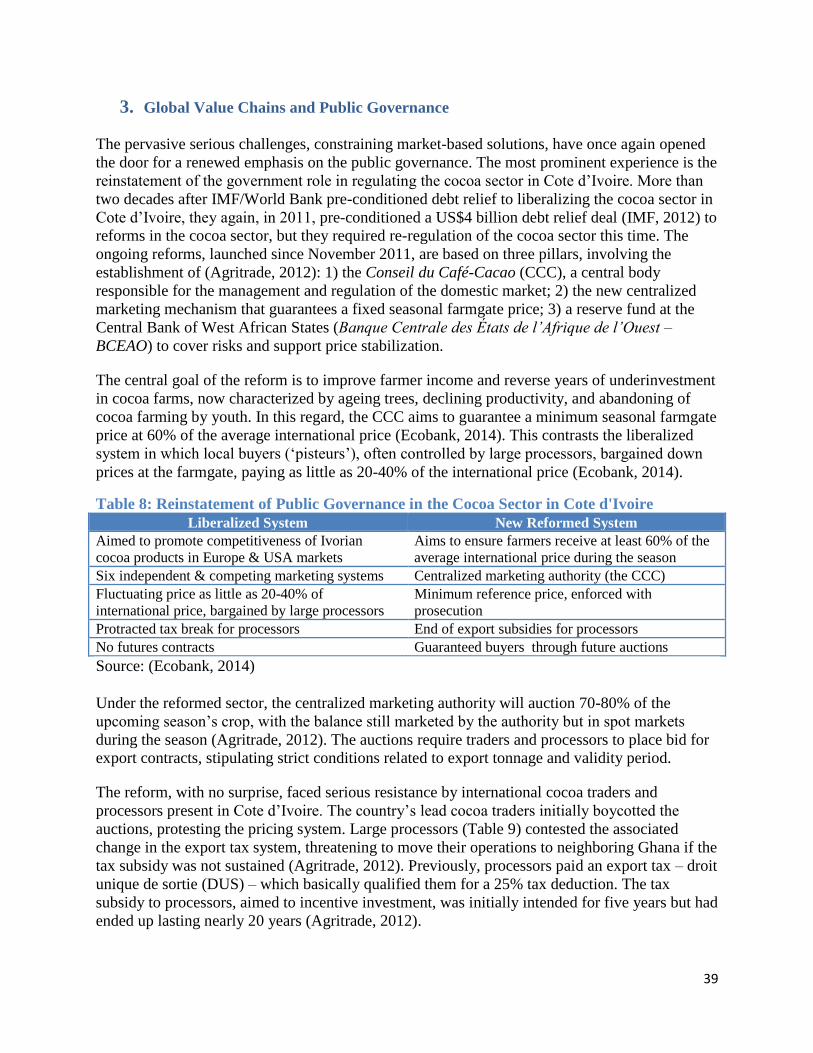
39
3. Global Value Chains and Public Governance
The pervasive serious challenges, constraining market-based solutions, have once again opened
the door for a renewed emphasis on the public governance. The most prominent experience is the
reinstatement of the government role in regulating the cocoa sector in Cote d’Ivoire. More than
two decades after IMF/World Bank pre-conditioned debt relief to liberalizing the cocoa sector in
Cote d’Ivoire, they again, in 2011, pre-conditioned a US$4 billion debt relief deal (IMF, 2012) to
reforms in the cocoa sector, but they required re-regulation of the cocoa sector this time. The
ongoing reforms, launched since November 2011, are based on three pillars, involving the
establishment of (Agritrade, 2012): 1) the Conseil du Café-Cacao (CCC), a central body
responsible for the management and regulation of the domestic market; 2) the new centralized
marketing mechanism that guarantees a fixed seasonal farmgate price; 3) a reserve fund at the
Central Bank of West African States (Banque Centrale des États de l’Afrique de l’Ouest –
BCEAO) to cover risks and support price stabilization.
The central goal of the reform is to improve farmer income and reverse years of underinvestment
in cocoa farms, now characterized by ageing trees, declining productivity, and abandoning of
cocoa farming by youth. In this regard, the CCC aims to guarantee a minimum seasonal farmgate
price at 60% of the average international price (Ecobank, 2014). This contrasts the liberalized
system in which local buyers (‘pisteurs’), often controlled by large processors, bargained down
prices at the farmgate, paying as little as 20-40% of the international price (Ecobank, 2014).
Table 8: Reinstatement of Public Governance in the Cocoa Sector in Cote d'Ivoire
Liberalized System New Reformed System
Aimed to promote competitiveness of Ivorian
cocoa products in Europe & USA markets
Aims to ensure farmers receive at least 60% of the
average international price during the season
Six independent & competing marketing systems Centralized marketing authority (the CCC)
Fluctuating price as little as 20-40% of
international price, bargained by large processors
Minimum reference price, enforced with
prosecution
Protracted tax break for processors End of export subsidies for processors
No futures contracts Guaranteed buyers through future auctions
Source: (Ecobank, 2014)
Under the reformed sector, the centralized marketing authority will auction 70-80% of the
upcoming season’s crop, with the balance still marketed by the authority but in spot markets
during the season (Agritrade, 2012). The auctions require traders and processors to place bid for
export contracts, stipulating strict conditions related to export tonnage and validity period.
The reform, with no surprise, faced serious resistance by international cocoa traders and
processors present in Cote d’Ivoire. The country’s lead cocoa traders initially boycotted the
auctions, protesting the pricing system. Large processors (Table 9) contested the associated
change in the export tax system, threatening to move their operations to neighboring Ghana if the
tax subsidy was not sustained (Agritrade, 2012). Previously, processors paid an export tax – droit
unique de sortie (DUS) – which basically qualified them for a 25% tax deduction. The tax
subsidy to processors, aimed to incentive investment, was initially intended for five years but had
ended up lasting nearly 20 years (Agritrade, 2012).

40
Table 9: Cote d'Ivoire's Cocoa Processing Industry
Company Capacity (‘000 tons) Market Share
Barry Callebaut (Saco) 190 28%
Cargill (Micao) 120 18%
Cemoi 100 15%
ADM (Uncao) 86 13%
Olam International 70 10%
Choco Ivoire (Saf Cacao) 32 5%
Ivory Cocoa Products 25 4%
Sucso 24 4%
Condicaf 15 2%
Tafi 8 1%
Total 670 100%
Source: (Ecobank, 2014)
Despite the initial resistance, the affected cocoa traders/processors had obviously no real
alternatives and inevitably participated in the newly regulated market. The important underlying
reasons for this early success were suggested to be: the inherent characteristics of global cocoa
production and the evidence-based policy decision by the newly elected government in the
country. As described earlier under the Section 1.3, cocoa production is geographically
concentrated and Cote d’Ivoire is the world’s large cocoa producer and exporter. This global
dominance elevates the country’s bargaining power to effectively negotiate with industry
players. Nevertheless, due to the enormous political and economic implications of the reforms,
the government viewed the threats seriously and hired PricewaterhouseCoopers to carry out an
audit and make recommendations on the future of the 20-year-old tax subsidy, which was
abolished (Agritrade, 2012).
There is a growing trend towards increased public governance in cocoa producing countries. In
Ghana, where the sector was never fully liberalized, the industry has directly sought government
leadership in coordinating the often scattered private initiatives. The Ghana Cocoa Platform
(GCP), partly sponsored by Mondelez International and World Cocoa Foundation, is now hosted
and chaired by the COCOBOD. The GCP initiative was launched to strengthen public
governance required to coordinate planning and implementation of programs in the cocoa sector
(GCP, 2014). It has already spearheaded a country-wide round of farmer consultation sessions
across the seven cocoa growing regions (Wireko-Brobby, 2014). The assessments were aimed to
directly solicit farmer views on challenges and issues facing the sector.
Such coordinated initiatives, championed by the producing country governments, offer the
potential to concentrate on synergies between growth in the cocoa sector and farmer livelihoods.
Nevertheless, it is too early to assess the outcome of the recent reforms and the associated
stronger role for the public governance. In Cote d’Ivoire, the outcome of reforms is
overshadowed by the recent decline in international cocoa prices. Average annual international
prices have decreased from a high of US$3,133/ton in 2010 to US$2,440/ton in 2013 (World
Bank, 2014a). Such a downward trend can diminish the basis for increased revenue both to the
newly established regulatory institutions and to smallholder cocoa farmers.

41
4. Conclusion
The future growth of the cocoa-chocolate GVC is increasingly tied to whether it can fulfill a
commensurate growth function to livelihoods of smallholders. Over the last decades, small
farmers have experienced a persistent decline in real prices of cocoa and downfall in their cocoa-
derived income. Lack of economic incentives at the farmgate, old trees, declining productivity,
and the aging demographics now threaten the future supply of cocoa and the global chocolate
confectionery industry. The remedial but scattered, often competing, initiatives sponsored by the
industry stakeholders, have reached an impasse. In this connection, a complete reliance on the
market-based solutions has illustrated its remarkable constraints to growth.
The industry stakeholders and international institutions are returning to a stronger role for public
governance and state leadership in planning and coordinating implementation of sectoral
initiatives. This is a step in the right direction and can potentially enhance the bargaining
position of smallholders in market, currently characterized by an oligopsonistic structure. Unless
the public and private actors collaborate in supporting the cocoa sector, the producing countries
will, however, continue to faces the challenge of dealing with the highly concentrated and
increasingly complex global markets. Driven by the profit-seeking interest, which is inherently
positive, lead firms have undoubtedly introduced remarkable efficiency in modus operandi of the
cocoa-chocolate GVC over the last decades. But, their market power has effectively blocked
transmission of the generated value upstream to producing countries. Instead, smallholders have
even lost value-addition opportunity that traditionally was embedded in farm level activities of
cocoa production.
Thus, for the ongoing efforts, their effectiveness, under the best possible scenario, is constrained
by the regulatory jurisdiction of governments in producing countries. Under the reformed
markets, smallholder will receive a higher share of the global price. But, the cocoa price itself is
still going to be determined by buyer power in the concentrated global markets. Lowering prices
can quickly erode the gains. The reforms in Cote d’Ivoire is overshadowed by the recent decline
in global market prices, that constitute the basis for domestic price received by small farmers and
is fundamental to revenue for the newly established regulatory institutions.

42
Case Three: Pro-Poor Development and Power Asymmetries in the Sugar-Soft Drinks GVC
Prepared by Andrew Guinn
Summary
Sugar-soft drink global value chains span two heterogeneous industries – the sugar industry and
the sweetened soft drink industry – which are each dominated by different sets of lead firms.
Whereas global commodities traders and sugar milling groups play leading roles in the sugar
industry, branded soft drink companies lead the bottling, distribution and marketing activities of
these chains. Since sugar is almost entirely produced and traded as an undifferentiated
commodity and faces high competition from multiple substitutes (beet sugar, corn syrup and a
growing array of artificial and natural sweeteners), linkages between mills and their buyers
(including soft drink bottlers) generally occurs through market transactions, with neither party
exercising substantially more power than the other.
Whereas the soft drink industry is relatively concentrated within two corporate players, The Coca
Cola Company (TCCC) and PepsiCo Inc., the global sugar industry is relatively diffuse, covering
millions of farmworkers, tens of thousands of farms, and thousands of sugar mills. The largest
sugarcane milling group, the Brazilian company Raizen, accounts for only about 2.5% of global
sugarcane production.
Nevertheless, the global production and export of sugar is geographically very much
concentrated within a small handful of players. Brazil is, by leaps and bounds, the largest sugar
producer and exporter in the world. India is the second largest producer, though most of the
country’s production is destined for the domestic market. Thailand is the world’s second largest
exporter of sugar. These countries have each increased their share of global sugarcane production
since 2001, indicating growing geographic concentration.
The global sugar industry has grown rapidly since 2001, with production expanding by 22% and
total exports growing by 46%. Nevertheless, this expansion has been accompanied by growing
reports of labor violations, environmental degradation and “land grabs” associated with
sugarcane production. There have been a handful of private governance initiatives to reverse
these trends, including the proliferation of supplier codes of conduct among lead firms, the
emergence of a multi-stakeholder roundtable initiative (Bonsucro) and the growth of a small
number of certification programs. While these initiatives have expanded farmer and farmworker
incomes and eliminated environmentally damaging production practices in a handful of cases,
they remain piecemeal efforts and, combined, cover less than 5% of global sugar production.
Furthermore, adverse labor practices are commonly associated with informal labor
subcontractors, whose activities can be difficult for private stakeholders to monitor. Evidence
from Brazil, India and Thailand shows that illegal labor subcontracting relationships, child labor
practices and land grabs can undermine the potential benefits of participation in sugar GVCs.
Thus, there is growing interest in the role of public governance to promote improved
developmental outcomes in sugar value chains. In recent years, the most important efforts to roll

43
back labor exploitation and environmental degradation, while few in number, have typically
originated in the governance activities of public, rather than private, actors.
1. The Sugar-Soft Drinks Global Value Chains: Lead Actors and Power Asymmetries
1.1. Input-output structure of global industry
The sugar-soft drink value chain includes all of the activities required to manufacture sugar-
based soft drinks. These activities include sugar cane production (on farms), the processing of
sugar cane (in mills), the production and bottling of soft drinks, distribution and retail. Figure 10
indicates Farming and milling activities are always carried out proximately to one another, given
the perishability of harvested cane. Bottling, distribution and retail are also activities that occur
near each other, due to the licensing practices of lead firms in the soft drink sector.
Figure 10: The sugar-soft drinks global value chain
Rather than directly engaging in all parts of the supply chain, lead firms in the soft drink
industry, including TCCC and Pepsi, use a franchise model to orchestrate their value chain and
manage their brand. That is, these firms do not produce soft drinks themselves but rather manage
and support a network of bottlers. Some bottlers are owned, in whole or in part, by TCCC or
Pepsi, but it is more common that bottling is outsourced to other large (typically multinational)
beverage companies, such as SAB Miller, or to smaller nationally based companies. While
TCCC and Pepsi provide some technical assistance and insist that their bottlers comply with
corporate codes of conduct, bottlers are responsible for selecting their own suppliers and
managing their own sourcing and distribution networks. The only physical input provided by the
parent company to bottlers is the unique flavoring syrup that differentiates specific soft drinks
from one another.
The soft drink industry accounted for the use of roughly 25.4 million tonnes of sugar in 2011, or
12.5%12 of the sugar produced globally in that year (Euromonitor, 2014; FAOStat, 2014).
Considering the substantial market share of TCCC and PepsiCo, these companies can be tied to
significant flows within sugar GVCs. TCCC alone accounted for 3.2% of sugar produced in
12 This figure is based on Euromonitor’s (2014) estimate of the amount of sweeteners purchased by the soft drink
industry, divided by the FAO’s estimate of total raw sugar equivalents produced globally.

44
2011, while PepsiCo’s beverage products accounted for 1.4%.13 Similar data is not available for
biofuels producers, so market power over the sugar sector cannot be compared across soft drink
and biofuels companies.
Sugarcane farming: Sugarcane is a species of grass that grows in tropical and subtropical
regions. It requires 12-18 months to mature and is a perennial plant (unlike sugar beets), meaning
that it regrows from the roots after cutting. Though sugarcane cultivation requires several
months, harvesting is a relatively quick process, which must be completed within a few days of
the plants reaching peak maturity.
Typically, harvesting is carried out manually, though some farms (especially in Brazil) have
been increasingly shifting to mechanized methods (Deininger & Byerlee, 2011). Manual cane
harvesting is a difficult job, and it is associated with adverse working conditions for sugar cane
harvesters as well as negative environmental consequences. It is at this stage in the chain that the
negative development consequences of the sugar-soft drinks value chain (and the sugar industry
more broadly) may be found. These are described in more detail on p. 16. The alternative is to
use mechanized harvesting practices. However, introducing mechanized harvesting requires a
change in the organization of production not only on sugar farms, but also at mills. Farms must
resize their tracts, realign rows of cane, eliminate terraces, remove rocks and tree stumps, and
plant specific varieties of cane. Mills must also adapt their practices under mechanized
harvesting methods because cane harvested by machines contains a higher proportion of organic
matter and therefore depreciates more quickly than manually harvested cane (Coslovsky &
Locke, 2013; Doner & Ramsay, 2010).
The cultivation and harvesting of sugar may occur on large or small farms. Large farms may be
owned by mills and serve as a source of raw material for milling activities, or they may be
owned by independent landowners. Small farms which grow sugarcane typically sell cane to a
nearby mill on an outgrowing contract basis. In Brazil roughly half of the country’s total sugar
yield produced by small- to medium-sized farms of less than 50 hectares, and half is produced in
large, vertically integrated farms which have a mill on-site. Similarly, in Thailand and India,
production is also distributed across a mix of large and small farms. In the United States and
Australia, on the other hand, production occurs primarily on large, mechanized estates. In several
Sub-Saharan African countries, including Tanzania, Kenya and South Africa, production more
typically occurs on small farms, which develop supplier relationships will mills on an out-grower
basis (Chisanga et al., 2014). There may be technological pressure towards the further
concentration of sugarcane farms within vertically integrated enterprises, as mills are increasing
the scale at which they operate. Whereas a new mill in 2000 processed about 20,000 hectares
worth of sugar cane, by 2011 new mills were able to produce as much as 70,000 hectares. The
expansion of environmental standards has also promoted the consolidation of farmland within
large farms. This is because environmental best practices prohibit the burning of cane after
harvest, which produces substantial carbon emissions, essentially ruling out manual harvest. As
only larger, more capital-intensive operations can afford to introduce mechanical harvesting
methods, these are favored by the expansion of environmental standards (Coslovsky & Locke,
2013; Deininger & Byerlee, 2011).
13 These figures are based on Euromonitor (2014) estimates that TCCC controlled a 25.9% market share of the soft
drinks market in 2011. In that year, PepsiCo controlled 11.5% of the market.
45
Milling: Once sugarcane is harvested, it must be transported to a mill within a couple of days of
cutting. At the milling stage of the value chain, fresh cane is first chopped, shredded, mixed with
water and crushed in order to create a juice of sucrose and water.14 This juice is then evaporated
until it forms a thick syrup, which is then placed in a centrifuge and then dried until it forms
crystals of “raw sugar”, which are chemically stable but still contain some molasses. Raw sugar
may be sold as-is, or it may be further refined into white sugar, which has a higher concentration
of sucrose. Sugar refineries may be collocated with mills, but not necessarily. Raw sugar is the
commodity that is most typically traded internationally, though refined white sugar is what is
used by bottlers for soft drink manufacturing (Bouckley, 2013).
Bottling: The bottling stage of the value chain entails the production of soft drinks from sugar
and other inputs and the packaging of the soft drinks within bottles. Aside from sugar (which is
supplied by mills) and the flavor concentrate (which is supplied by the parent company), key
inputs for bottlers include water, carbon dioxide and other chemicals, as well as bottles and
labels (Oxfam, 2011). Bottling is a highly capital-intensive process, and it tends to be located
close to major centers of product demand, i.e. large cities. Bottling plants may produce multiple
brands or types of soft drink, simply substituting one flavor concentrate for another on their
filling lines and shifting other ingredient levels accordingly. However their activities are
governed by non-compete clauses and licensing agreements issued by the parent companies who
own the brands under which bottling companies produce.
Distribution and retail: Distribution comprises the logistical activities necessary to bring
bottled soft drinks from the bottling plant to retail outlets. Typically, it is bottling companies
(rather than parent companies) that are responsible for distribution. As a part of their licensing
contract with the parent company, bottlers are granted licenses to distribute branded soft drinks
within a particular geographic area. As such, bottlers must negotiate distribution deals with retail
outlets and other points-of-sale. Typical distribution arrangements include direct store delivery,
delivery to customer warehouses, and delivery to foodservice businesses (including both the
delivery of bottled drinks as well as the installation and maintenance of soda fountains), and
delivery to vending machines. Distribution practices may vary according to customer needs,
product characteristics and local business norms (PepsiCo, 2011).
Other markets for sugar: The soft drink industry accounts for a greater share of global sugar
demand than any other consumer-facing industry. Soft drinks use more sugar than the bakery and
confectionary (candy) industries combined. Nevertheless, industrial uses – particularly the
production of ethanol – represent an even larger share of global demand for sugar. This implies
that soft drink companies have substantial market power with respect to the sugar industry, their
influence is limited.
Figure 11 shows the top sugar-using industries. With respect to consumer products, sugar is,
unsurprisingly, primarily found in food and drinks. Of these, soft drinks represent the largest
source of global demand for sugar (12.5%). The next three largest consumer categories –
alcoholic drinks, bakery products and confectionary – each account for between 4.5% and 5% of
global demand. The dairy industry, which produces ice creams and yogurts that incorporate
sugar, represents a slightly smaller share of sugar demand (3.3%). Other consumer products
14 The remaining cane stalks, known as bagasse, are usually burned for the cogeneration of electrical energy at the
mill.

46
(canned foods, dried foods, ready-made meals, etc.) account for a further 5.7% of sugar demand.
In total, consumer-facing products account for 35.7% of global sugar demand.
Figure 11: Distribution of sugar demand, by industry (2011)
Source: Euromonitor 2014, OECD 2014 FAOState 2014
Nevertheless, the single largest source of demand for sugar is the production of ethanol. Though
sugar has been used to produce ethanol for decades, this source of demand for sugar has grown
in importance since 2000. As of 2010, roughly 28% of the sugar that was produced globally was
used to manufacture ethanol biofuel (OECD, 2014). Thus, biofuels already constitutes a larger
market for sugar than soft drink manufacturing, and nearly as much as all consumer-facing
products combined. The countries where most sugar ethanol production occurs are Brazil, China
and Thailand. Trade in biofuels remains a small share (7%) of global production, though this
figure is growing, driven almost entirely by growing Brazilian exports of ethanol biofuel
(OECD, 2014). By 2020, the ethanol industry will account for an estimated 33% of global sugar
cane production.
The use of sugar for ethanol production is especially important in Brazil, which is, by far, the
world’s leading sugar grower. In Brazil, more than half of the sugarcane that is grown is used for
the production of ethanol fuel. Ethanol use in Brazil is higher than in other countries because the
government mandates that ethanol fuel be blended with gasoline for use in motor vehicles. In
fact, the dynamics of the global sugar industry can be affected by institutional changes in the
Brazilian ethanol blending mandate, as a moderate increase in the share of ethanol blended into
gasoline in Brazil can have large implications in terms of global demand for sugar-based ethanol.
Consequently, there is a fierce political lobbying in Brazil among sugar ethanol refineries and oil
companies over the level at which ethanol fuel mandates should be set (Doner & Ramsay, 2010).

47
In response to the dynamic growth of the Brazilian ethanol industry (and the subsidies which
support it), there have been several investments by international players in the Brazilian sugar
ethanol industry. For example, in 2010 Dutch Royal Shell formed a joint venture with Cosan,
one of the Brazil’s largest sugar processing and ethanol distilling companies, to form a joint
venture called Raizen. Louis Dreyfus Commodities (LDC) has long been a major player in
Brazil’s ethanol market, owning a full stake in 13 mills. In 2008, BP formed a joint venture with
LDC and the Brazil-based Maeda and began acquiring mills in the country. The commodities
trader Bunge has full or partial ownership of nine mills, producing both ethanol and sugar.
Similarly, commodities traders ADM, Cargill and Glencore each own mills in Brazil. Other
global trading companies, including the Hong Kong-based Nobel Group and the Japanese Sojitz
also have ownership stakes in ethanol-producing mills in Brazil (ISO, 2012).
Finally, a new end-market for sugar is emerging in plastic polymers. That is, one of the chemical
inputs (mono-ethylene glycol, or MEG) used in the creation of PET bottles can be replaced by
resins made from sugar-based ethanol. In fact, TCCC has recently begun introducing plant-based
resins to the PET bottles used by some of the company’s bottlers (TCCC, 2012). It is not clear
how much of global sugar demand is accounted for by the plastics or other chemicals industries,
nor how quickly this source of demand is growing.
The diversity of end-markets for sugar indicates that a variety of tactics may be required of civil
society organizations who are interested in promoting improved social and environmental
standards in the sugar industry. That is, soft drink companies and other branded food and drink
manufacturers may have relatively less power over sugar markets, as new, highly capitalized
energy companies such as Shell and BP expand their interest in the sugar industry. However,
energy companies and plastics manufacturers are more difficult targets for naming-and-shaming
campaigns. As these firms expand their share of the sugar market, will they also feel compelled,
as TCCC and PepsiCo have, to engage in certification programs as a means of protecting their
brand?
1.2. Geographic concentration of sugar cane production and trade
In recent decades, sugar has been increasingly cultivated for its potential as an export crop. This
trend has been facilitated by growing international demand for sugar, including in countries
where sugarcane is not produced commercially, as well as the introduction of mechanized
harvesting and milling technologies which enable strong economies of scale in the sugar sector
(Coslovsky & Locke, 2013; Doner & Ramsay, 2010; Valdes, 2011). Whereas in 1991, only
23.6% of all sugar produced was exported to world markets (rather than consumed in the country
of origin), in 2011 35.8% of sugar was traded internationally (Table 10). This section will
explain how the sugar production and exports have grown increasingly concentrated within a
small set of countries since 2000.

48
Table 10: Global sugar production and exports
Year Production* Exports*
Share
traded
1981 115.5 30.8 26.6%
1991 140.1 33.1 23.6%
2001 166.8 49.6 29.7%
2011 203.5 72.9 35.8%
*Production and exports are expressed in millions of tonnes
Source: FAOStat 2014
1.2.1. Production
Total global sugar production in 2011 was 170.7 million metric tons. Though 121 countries are
engaged in the cultivation of sugarcane, sugar production is largely concentrated within just a
few countries. Brazil is the world’s largest producer of sugar, accounting for 37.6 million tonnes
of sugar production in 2011, or 22% of the world total (FAOStat, 2014).15 The Brazilian sugar
industry has 413 mills and 80,000 farms. It employs 1.3 million workers and generate US$20
billion in annual revenues, or 2.3% of national GDP (Coslovsky & Locke, 2013).
Other large producers of sugar include India (16% or global production), China (7%) and
Thailand (6%). Though India is a major producer of sugar, it is also a massive source of demand;
the vast majority of sugar which is produced in India is consumed domestically, so the country
does not participate heavily on the export market.
Figure 12: Sugar production by top producers, 2011 (million tonnes)
Source: FAOStat 2014
15 This share (22%) is taken with respect to total world production of raw sugar equivalents. This includes beet
sugar, but not corn syrup.
0.0
5.0
10.0
15.0
20.0
25.0
30.0
35.0
40.0

49
The concentration of sugar production within a handful of countries is a trend which has
intensified since 2001. Table 11 shows how much sugar, by volume, the largest ten sugar
producers grew in 2001 and 2011, as well as the share of world production that each country
accounted for in both years. All of the top ten producers captured a larger share of global
production in 2011 than they did in 2001, indicating that sugar production grew more
geographically concentrated during the decade. Brazil increased its share more than any other
country. Whereas other countries increased their share of global production by one or (in the case
of Thailand) two percentage points, Brazil expanded its share by seven percentage points. The
rapid growth of the global export market during the last decade as well as the growing
concentration of production has occurred in the context of a historic spike in the price of sugar
(Figure 13).16 During this time also, prices have grown increasingly volatile due to a combination
of demand and supply factors (McConnell et al., 2010). On the demand side, rapid economic
expansion developing countries in recent years, particularly in South and Southeast Asia, has
generated volatile demand cycles for internationally traded sugar. On the supply side, changing
policies in major sugar producers have led to swings in the price of sugar on global markets. For
example, India and Thailand have shifted their policies surrounding export subsidies for sugar;
these affect the quantity and thus the price of sugar in global markets (Agarwal, 2014). In
addition, Brazil’s large presence in the export market means that small fluctuations in Brazilian
production, due to either climactic fluctuations or policy change (such as shifting mandates for
ethanol fuel blending) can have an outsized effect on global prices.
Table 11: Top sugar producers in 2001 and 2011
Country
Production
(million tonnes)
Share of world
production
2001 2011 2001 2011
Brazil 20.4 37.6 15% 22%
India 20.5 26.6 15% 16%
China 9.5 12.6 7% 7%
Thailand 5.4 9.9 4% 6%
USA 7.2 7.7 5% 5%
Mexico 5.6 5.2 4% 3%
Germany 4.1 4.8 3% 3%
Russia 1.7 4.8 1% 3%
France 4.0 4.7 3% 3%
Pakistan 3.2 4.5 2% 3%
TOTAL 133.6 170.7 100% 100%
Source: FAOStat 2014
16 The data contained in Figure 13 shows the average daily future position for sugar (#11 contracts) on the Coffee
Sugar and Cocoa Exchange (CSCE) of the New York Stock Exchange. Sugar #11 is the most common type of
futures contract for sugar, differing from #14 primarily in the shipping terms of the contract, rather than the quality
specifications of the sugar.

50
Figure 13: Global sugar prices, 2000-2015
Source: IndexMundi
The importance of the sugar sector across these ten major producing countries can be felt in
different ways. As sugar’s share of a total output, exports and/or employment grows within a
given country, the sugar industry gains political leverage, so with respect to understanding
sources of private power over sugar governance, it is important to identify in which countries’
economies sugar plays the greatest role. Table 12 compares the top ten sugar producing countries
in terms of the sugar industry’s share of each country’s total output, exports and employment.
Measured in these terms, the sugar industry is not terribly important in overall national
economies of the US, Germany, Russia or France. However it accounts for a large share of total
employment in India, China, Mexico, Pakistan and Mexico due to the prevalence of labor-
intensive harvesting practices in these countries. Sugar is an important export sector and
accounts for a substantial share of national GDP in Brazil and Thailand, and to a lesser extent
India.
Table 12: Importance of the sugar sector in major producing countries, 2011
Gross
production
(USD
billions)
Production
as % GDP
Exports of
sugar (USD
billions)
Exports of
sugar as %
total exports
Employment in
sugar sector
(million
workers)
Employment in
sugar as % total
employment
Brazil 22.8 0.9% 14.9 5.8% 1.1 1.0%
India 6.1 0.3% 1.9 0.6% 45 9.4%
China 3.7 0.1% 0.3 0.0% 40 5.0%
Thailand 3.1 0.9% 3.7 1.6% 1 2.5%
USA 2 0.0% 0.3 0.0% 0.14 0.1%
Mexico 2.4 0.2% 1.2 0.3% 0.93 1.7%
Germany 6.1 0.2% 0.8 0.1% 0.03 0.1%
Russia 2.6 0.1% 0 0.0% 0.2 0.3%
France 1.8 0.1% 1.8 0.3% 0.03 0.1%
Pakistan 0.9 0.4% 0 0.0% 4.2 6.4%
Sources: FAOStat, UNComtrade, World Bank, USDA Gain Reports

51
1.2.2. Trade
Roughly 30% of sugar that is produced is traded internationally; the rest is consumed in the
country where is it grown. Sugar cane exports are, unsurprisingly, even more concentrated than
production. Brazil is, far and away, the leading exporter of sugar, accounting for 25.9 million
tonnes of sugar exports, or 44% of the world export market in 2011 (FAOStat, 2014). During
that year, the country exported 70% of the sugar that it produced. Brazil is followed by Thailand
(11%), India (5%) and France (5%).17
Even as the total export market has grown worldwide in recent years, the production of sugar for
export has become increasingly concentrated geographically since 2001 (Table 13). Whereas the
top three exporters of sugar in 2001 (Brazil, Thailand and Australia) accounted for 41% of global
sugar exports, the top three exporters in 2011 (Brazil, Thailand and India) accounted for 56%.
Most of this growth can be accounted for by the expansion of Brazilian exports, which more than
doubled between 2001 and 2011 from 11.6 to 25.9 million tonnes. As of 2011, Brazil alone
accounted for 44%, or nearly half, of the world export market, indicating that the country’s sugar
industry has substantial influence over the global sugar trade.
Figure 14: Sugar exports by top exporters, 2011 (million tonnes)
Source: FAOStat 2014
17 Though France is not geographically suitable for the production of sugarcane, the country nevertheless has a
substantial sugar industry based on the cultivation and processing of sugar beets and on the processing of imported
sugarcane.
0.0
5.0
10.0
15.0
20.0
25.0
30.0

52
Table 13 Top sugar exporters in 2001 and 2011
Country
Exports
(million tonnes)
Share of world
exports
2001 2011 2001 2011
Brazil 11.6 25.9 26% 44%
Thailand 3.4 6.9 8% 12%
India 1.5 2.9 3% 5%
France 3.1 2.6 7% 4%
Australia 3.2 2.0 7% 3%
Germany 1.9 1.3 4% 2%
Guatemala 1.1 1.3 3% 2%
Colombia 1.0 1.0 2% 2%
Belgium 1.5 0.8 3% 1%
Cuba 2.9 0.6 7% 1%
TOTAL 44.5 59.3 100% 100%
Source: FAOStat 2014
The global import market is far less concentrated than that for exports (Figure 15). Though
Russia was the world’s leading importer in 2001, representing 14% of global sugar imports,
today no country accounts for more than 6% of global sugar imports (Figure 15). Today, the top
importers of sugar are China (importing 6% of internationally traded sugar), USA (6%),
Indonesia (4%) and Russia (4%). As the global export market is far more concentrated within a
small number of countries as compared to the global import market, exporting countries have
relatively more bargaining power in international sugar markets.
Figure 15: Sugar imports by top importers, 2011 (million tonnes)
Source: FAOStat 2014
0.0
0.5
1.0
1.5
2.0
2.5
3.0
3.5
4.0
4.5

53
Table 14: Top sugar importers in 2001 and 2011
Country
Imports
(million tonnes)
Share of world
imports
2001 2011 2001 2011
China 1.9 3.9 5% 6%
USA 1.5 3.8 4% 6%
Indonesia 1.4 2.5 3% 4%
Russia 5.6 2.4 14% 4%
UAE 1.1 2.0 3% 3%
Malaysia 1.3 1.8 3% 3%
Italy 0.5 1.8 1% 3%
South Korea 1.5 1.7 4% 3%
Algeria 1.0 1.6 3% 3%
Japan 1.6 1.5 4% 2%
TOTAL 41.2 62.3 100% 100%
Source: FAOStat 2014
1.3.Key actors and power in sugar value chains
Large MNCs can be found among soft drink companies, bottling companies, sugar traders and
sugar milling companies. This section of the report will describe the specific lead actors that are
involved in the various segments of the sugar-soft drinks value chain, examine the extent of
market concentration among these companies, and consider how power dynamics lead to adverse
development outcomes further down the chain. Finally, it will examine the participation of
MNCs in Bonsucro, a certification initiative intended to improve the economic, social and
environmental sustainability of global sugar production.
1.3.1. Soft drink companies
TCCC and Pepsi, both headquartered in the United States, are the world’s largest soft drink
companies. These companies are known as “parent companies” in the soft drink industry, as they
do not directly produce soft drinks but rather manage a network of bottlers, some of which are
partially or fully owned as subsidiaries. Though these firms do not directly own manufacturing
plants or engage directly in the manufacturing process, they are able to exert power over their
bottling network through their control of highly desirable brands and the advertising campaigns
which support these. Thus, bottling companies are willing to pay substantial licensing fees in
order to gain the permission to manufacture and distribute branded Coca Cola or Pepsi products
to consumers.
TCCC, in particular, has a commanding share of the global market, representing 20.9% of global
soft-drink sales. Pepsi’s global market share (9.6%) is roughly half of that of TCCC’s. The next
largest soft drink manufacturer, Danone, controls 4.7% of global soft drink sales, followed by
Nestlé (3.9%) and Ting Hsin (1.8%).18
18 Note that Pepsi, Danone and Nestlé are highly diversified corporations which manufacture products for several
different consumer markets, including packaged foods, confectionary, dairy and coffee.

54
However, TCCC and Pepsi have lost world market share over the last ten years (Table 15). This
appears to be attributable to the rise of regional and national soft drink brands in emerging
markets, particularly in East Asia, such as Ting Hsin. This indicates that the world soft drink
industry may be growing less concentrated at this juncture.
Table 15: World soft drink market share (off-trade) 2004-2013, top 15 companies
There is substantial regional variation in TCCC’s and Pepsi’s shares of the soft drink market
(Table 16). TCCC’s position is especially strong in Australasia, Latin America and North
America. Pepsi’s market share is relatively strong in Eastern Europe, Latin America and North
America. Both countries have a below-average market share in the Asia Pacific region and in
Western Europe.
Table 16: Soft drink market shares of TCCC and PepsiCo Inc. across world regions, 2013
How much of global sugar consumption do products marketed by TCCC and Pepsi represent?
The soft drink industry accounted for the use of roughly 25.4 million tonnes of sugar in 2011, or
Rank Company Name 2004 2005 2006 2007 2008 2009 2010 2011 2012 2013
1 Coca-Cola Co, The 22.2 22.3 22.1 22.1 22.1 22.1 21.8 21.6 21.4 20.9
2 PepsiCo Inc 11.9 11.9 11.7 11.5 11.3 10.8 10.4 10.3 9.9 9.6
3 Danone, Groupe 4.9 4.6 4.7 4.9 4.8 4.1 4.3 4.5 4.5 4.7
4 Nestlé SA 3.4 3.6 3.8 4.0 3.9 3.8 3.9 4.0 4.0 3.9
5 Ting Hsin International Group 0.3 0.5 0.8 1.1 1.1 1.4 1.8 1.8 1.6 1.8
6 Dr Pepper Snapple Group Inc 0.0 0.0 0.0 0.0 1.7 1.6 1.6 1.6 1.5 1.4
7 Suntory Holdings Ltd - - - - - 1.0 1.0 1.0 1.0 1.1
8 Hangzhou Wahaha Group Co Ltd - - - - - 0.9 0.9 0.9 0.9 0.9
9 Yangshengtang Co Ltd 0.3 0.3 0.3 0.4 0.5 0.5 0.6 0.7 0.8 0.8
10 Uni-President Enterprises Corp 0.4 0.5 0.5 0.5 0.5 0.5 0.6 0.6 0.7 0.8
11 Acqua Minerale San Benedetto SpA 0.7 0.7 0.7 0.7 0.7 0.6 0.6 0.6 0.6 0.6
12 Kirin Holdings Co Ltd 0.4 0.3 0.4 0.5 0.5 0.4 0.4 0.4 0.6 0.6
13 Aje Group 0.0 0.3 0.3 0.4 0.5 0.5 0.5 0.5 0.5 0.5
14 China Resources Enterprise Ltd 0.1 0.1 0.1 0.2 0.2 0.2 0.3 0.3 0.4 0.5
15 Parle Bisleri Ltd 0.1 0.1 0.1 0.2 0.2 0.3 0.3 0.4 0.4 0.5
Source: Datamonitor 2014
Volume
(mn liters)
Market
Share (%)
Volume
(mn liters)
Market
Share (%)
World 111,394.0 20.9 51,175.6 9.6
Asia Pacific 25,828.5 16.1 8,538.1 5.3
Australasia 1,656.1 40.3 329.5 8.0
Eastern Europe 6,022.9 17.5 4,069.0 11.8
Latin America 34,395.3 36.1 11,210.8 11.8
Middle East and Africa 9,831.5 16.1 5,925.1 9.7
North America 20,172.6 22.5 17,482.5 19.5
Western Europe 13,623.0 15.7 3,620.6 4.2
The Coca-Cola Co. PepsiCo Inc.
Source: Datamonitor 2014

55
12.5%19 of the sugar produced globally in that year (Euromonitor, 2014; FAOStat, 2014).
Considering the substantial market share of TCCC and PepsiCo, these companies can be tied to
measurable flows within sugar GVCs. TCCC alone accounted for 3.2% of sugar produced in
2011, while PepsiCo’s beverage products accounted for 1.4%.20 Similar data is not available for
biofuels producers, so market power over the sugar sector cannot be compared across soft drink
and biofuels companies.
1.3.2. Bottlers
Though bottling plants produce branded products for TCCC and Pepsi, due to the franchise
model that guides both parent companies, bottlers are in fact separate corporate entities.
Nevertheless, parent companies maintain a close relationship with their bottlers by providing
technical assistance including marketing support, financial assistance, and capacity building.
Bottlers must pay a licensing agreement to the parent company in exchange for the right to
produce soft drinks under their brand, and they are typically required to engage in non-compete
agreements, so that bottlers may not produce competing products under multiple brands at the
same time (Lefevre, 2013).
There are multiple ownership models by which parent companies may take a stake in their
bottlers. Bottlers may be fully or partially owned by the parent company, or they may operate as
completely independent businesses. There is substantial geographic variation with respect to the
models which are favored in different countries, and some countries may feature multiple
ownership models. For example, in USA, Europe, Brazil, Philippines and some of Sub-Saharan
Africa, there are many bottlers which operate under a “shared investment model”; that is, they
are jointly owned by TCCC and other corporate entities. In India bottlers are either fully owned
by Coca Cola’s bottling arm, Hindustan Coca Cola Bottling, or operate as independent
franchisees (Bhushan, 2010). Similarly, TCCC does not pursue a shared investment model in
China.
The cornerstone of both companies bottling networks are a handful of relatively large bottling
operations that feature full or partial ownership of the parent company. These are known as
“anchor bottlers.” TCCC’s anchor bottlers include: Coca-Cola Refreshments (North America),
Coca Cola Enterprises (Western Europe), Coca Cola Helenic (Eastern Europe and Africa), Coca
Cola Amatil (Australia and Southeast Asia), and Coca Cola FEMSA (Mexico and Latin
America). Pepsi has three anchor bottlers – Pepsi Bottling Group, Pepsi Americas Inc. and Pepsi
Beverage Ventures – all of which are located in North America.
SAB Miller and AmBev, the two largest beverage companies in the world, operate several
independent bottling facilities throughout the world that license with either TCCC or Pepsi. SAB
Miller, the South Africa-based beverages MNC, is a major TCCC-licensed bottler in Brazil, El
Salvador, Honduras, Angola, Botswana, Lesotho, Swaziland, Zambia and South Africa
(SABMiller, 2007). AmBev, the Brazilian-based beverages MNC, has exclusive franchise rights
for a range of Pepsi-branded soft drinks in several Latin American countries, including Brazil,
Argentina, Bolivia, Uruguay, Peru and the Dominican Republic (Ambev, 2014).
19 This figure is based on Euromonitor’s (2014) estimate of the amount of sweeteners purchased by the soft drink
industry, divided by the FAO’s estimate of total raw sugar equivalents produced globally. 20 These figures are based on Euromonitor (2014) estimates that TCCC controlled a 25.9% market share of the soft
drinks market in 2011. In that year, PepsiCo controlled 11.5% of the market.

56
In the last several years, both TCCC and Pepsi have consolidated their control over leading
bottlers by purchasing shares or outright acquiring bottling companies that form major parts of
their networks. These moves signal a reversal of the companies’ previous strategy of keeping
bottlers at arm’s length, a practice which was based in the belief that a looser relationship with
the parent company would foster entrepreneurship among its bottlers (Financial Times, 2009).In
2009, Pepsi purchased a larger stake in its largest bottlers in the Americas, Pepsi Bottling Group
and PepsiAmericas (Financial Times, 2009). Coke followed suit in 2010, buying its largest
bottler, Coca Cola Enterprises, and using this entity to gain further control over bottling
operations in Norway, Sweden and Germany (Burrit & Stanford, 2010). Nevertheless, declining
returns from soft drink sales could lead TCCC and Pepsi to reverse these investments in the the
coming years (Jakab, 2015).
In addition to this move towards greater parent company control over bottling groups, there has
been consolidation within the bottling segments of both the TCCC and Pepsi value chains since
2010. Though systematic global data about ownership patterns across bottling companies, the
following stories provide evidence that the bottling segment of the chain is facing ongoing
consolidation.
FEMSA purchased a 51% share of Coke’s largest Philippine bottler in 2012, its first
acquisition outside of Latin America: (Fenner & Case, 2012)
FEMSA has acquired several bottlers in Brazil in recent years. In the wake of the
bottler’s most recent acquisition of a company called Spaipa in 2013, FEMSA now
controls the distribution of roughly 40% of the Coca Cola sold in Brazil.
SAB Miller, Sabco (Coca Cola’s largest South African bottler) and TCCC have agreed to
merge their operations across more than 30 bottling plants in Sub-Saharan Africa
(Financial Times, 2014).
PepsiCo entered a joint venture with Tingyi-Asahi Holdings, a major Chinese bottling
company, in 2011, granting the newly formed company exclusive rights to manufacture
and distribute Pepsi soft drinks in China. There has also been consolidation among
independent bottlers in India, where RJ Corp has emerged as the country’s leading Pepsi
bottler (Bhushan, 2013)
1.3.3. Traders
A handful of commodity trading companies are involved in the international trade of sugar.
Commodity traders are involved in the sugar industry through the ownership (full or partial) of
mills, participating in futures markets for sugar, physically shipping raw sugar internationally,
and engaging in the production and sale of ethanol fuel. Though a comprehensive list of
commodity traders involved in the sugar industry is not available, a review of news articles and
industry sources finds that the following eleven global commodity traders are involved in the
international sugar trade:
1. Bunge
2. ADM
3. Wilmar
4. Noble Group
5. Louis Dreyfus
6. Czarnikow

57
7. Sucden (Sucres & Denrées)
8. Cargill21
9. ED&F Man
10. Armajaro Trading
11. Vitol
12. Dangote
Unfortunately, data regarding the scale of international flows of sugar controlled by the various
commodity traders or the revenues that they realize from the sugar trade is not available, so it is
impossible to rigorously assess the market power of these firms in a quantitative fashion.
Nevertheless, a review of news articles reveals that in recent years these companies have made
substantial investments in global sugar and ethanol production, investing billions of dollars in
sugar mills and, especially, ethanol distilling capabilities in Brazil (see p. 4).
1.3.4. Sugar milling companies
Globally, sugar milling companies are not very concentrated; no single milling company controls
a commanding share of the global market – though some companies may control large shares of
particular domestic markets. Table 17 shows the world’s twenty leading sugar milling
companies, as well as their output in 2013 and their corresponding share of the global market.22
The top five sugar producers globally are Sudzucker, Raizen (a joint venture between BP and
Cosan), Tereos and Mitr Phol. This figure shows that no single milling company controls more
than 3% of the global market, and the combined market share of the top ten companies is 18.5%,
indicating that (at the global level), mills do not have substantial market power with respect to
their buyers.
Table 17: Leading sugar milling companies, 2013
Rank Company Headquarters
Production,
2012/13
(million
tonnes)
Market
share*
1 Sudzucker Germany 4.9 2.7%
2 AB Sugar UK 4.4 2.4%
3 Raizen (Cosan/Shell) Brazil 4.3 2.4%
4 Tereos France 3.9 2.2%
5 Mitr Phol Thailand 3.7 2.1%
6 Nordzucker Germany 3.1 1.7%
7 Biosev (Louis Dreyfus) Brazil 2.1 1.2%
8 Wilmar Australia 1.9 1.1%
9 Pfeifer & Langen Germany 1.7 0.9%
21 Cargill’s sugar trading business formed a joint venture with Copersucar, the largest cooperative of mill owners in
Brazil, in 2014. The new business is called Alvean. 22 Note that Copersucar, Brazil’s largest marketer of sugar, is not included in this list. This is because Copersucar is
organized as a cooperative of 88 independently owned mills, rather than a single group which directly owns mills. If
Copersucar operated as a single entity, it would be the largest sugar milling company in the world. During the
2012/2013 season, it produced 7.8 million tonnes of sugar (Copersucar, 2014). 6.1 million tonnes of this was
exported.

58
10 Thai Roong Ruang Thailand 1.7 0.9%
11 Feesa Mexico 1.6 0.9%
12 American Crystal USA 1.5 0.8%
13 Santa Terezinha Brazil 1.5 0.8%
14 Turkseker Turkey 1.4 0.8%
15 Guanxi Nanhua China 1.4 0.8%
16 Bajaj Hindusthan India 1.4 0.8%
17 Shree Renuka India 1.3 0.7%
18 Cristal Union France 1.3 0.7%
19 Tongaat South Africa 1.3 0.7%
20 Cosun India 1.2 0.7%
Source: Kuhlman 2014, FAOStat 2014
Some of the twenty largest milling companies are state-owned, national companies. Turkseker, a
company that refines cane sugar and produces beet sugar, is owned by the Turkish government.
Guanxi Nanhua is a state-owned milling group in the southern Chinese province of Guanxi. And
Feesa is owned by the Mexican government, though the company has been gradually privatizing
its mills since 2012 (USDA, 2012). States may decide to invest directly in sugar cultivation for
several reasons. For example, sugar is considered a staple food item in many cultures, so
governments have an interest in keeping domestic prices below the market rate. In addition,
sugar cultivation represents an important source of employment generation, so governments may
choose to invest in sugar milling in order to generate demand for cane within the agricultural
sector.
Though global time-series data is not available to assess changing patterns of market
concentration among leading milling companies, recent country-level data for Brazil, China and
India is shown below in Table 18. The data indicate that milling is growing more concentrated in
Brazil, but less concentrated in the other countries. Nevertheless, in late 2014, prices for sugar
had fallen as a result of overinvestment in recent years. There is much speculation in the
financial press that this could lead to further consolidation among sugar milling companies in the
coming months (Brough & Ewing, 2014).
In response to pressure from Oxfam and other civil society organizations that they make their
supply chain practices more transparent, both TCCC and Pepsi agreed to announce their top
three suppliers of sugar in 2014. The top three suppliers of sugar to TCCC were Copersucar (a
Brazilian cooperative made up of sugar mill owners), Mitr Phol (a Thai sugar and bioenergy
producer) and Dangote (a Nigeria-based commodities trader, which sources most of its sugar
from Brazil). Copersucar and Mitr Phol are leading sugar milling groups which each control
more than 2% of the global sugar market. Dangote is not on the list of the top 20 milling
companies, though it is the largest private enterprise in Nigeria. The top three suppliers of sugar
to Pepsi are Sucden (a global commodities and financial futures trader), Savola (a Saudi
diversified food manufacturer), and TRR (a Thai milling company).

59
Table 18: Top sugar companies in Brazil, India and China, by market share
1.4.Power asymmetries and governance in sugar GVCs
Sugarcane milling companies, including commodity traders that have investments in mills, have
limited power with respect to their buyers. Since sugar is a globally traded commodity that is
difficult to differentiate based on quality standards, bottlers and other buyers of sugar face very
low switching costs with respect to the mills which supply them. Thus, sugar mills face a highly
elastic (horizontal) demand curve, such that they cannot transfer costs onto buyers. Buyers, on
the other hand, may choose between multiple mills when buying sugar, so they are able to
negotiate low prices.
Mills do have substantial power over farms, however. Though many mills own plantations,
which serve as a source of raw material for milling activities, many mills also buy cane from
surrounding small and medium farms, typically on an outgrower (contract) basis. Mills have
monopsony power over surrounding farms; since cut sugar deteriorates rapidly after being
harvested, farms have no choice but to send it to the nearest mill for processing. Thus, farms
cannot negotiate with multiple mills in the way that bottlers and other buyers can. In other words,
farms are “captive” suppliers to nearby mills. As a result, the pressures of low and fluctuating
sugar prices are pushed onto farms and the labor that they employ. However high levels of
structural unemployment in rural areas provide a ready supply of farmworkers, either workers
from nearby farms or migrant workers from greater distances, who are prepared to harvest
sugarcane under adverse conditions, including contractual arrangements that do not meet
national legal requirements regarding the minimum wage, worker health and safety laws, and the
right to collectively bargain. Finally, due to the capital-intensity and scale requirements
2010 2011 2012
Copersucar SA 13.4 16.1 16.1
Cosan Ltd - 9.0 9.6
Biosev SA 6.5 6.3 7.3
Tereos Internacional SA 4.8 5.4 5.4
São Martinho SA 2.6 2.5 2.9
Cosan SA Açúcar e Álcool 8.6 - -
Others 64.2 60.8 58.8
Total 100.0 100.0 100.0
Shree Renuka Sugars Ltd 5.9 5.2 5.9
Bajaj Hindustan Ltd 5.5 3.7 3.7
Balrampur Chini Mills Ltd 3.1 2.1 3.0
Triveni Engineering & Industries Ltd 2.0 1.8 1.8
Sakthi Sugars Ltd 2.1 0.9 0.9
Others 81.4 86.3 84.7
Total 100.0 100.0 100.0
Guangxi Nanning East Asia Sugar Group 8.5 8.5 8.5
Nanning Sugar Industry Co Ltd 3.6 3.2 2.3
Liuzhou Fengshan Sugar Group Co Ltd 2.0 2.0 2.0
Dongguan Sugar Factory Co Ltd 1.1 1.1 1.1
Guangxi Guitang Group Co Ltd 1.2 1.0 0.7
Others 83.6 84.2 85.4
Total 100.0 100.0 100.0
Brazil
China
India
Source: Datamonitor

60
associated with milling, it is uncommon for farms to enter into this segment of the chain; this
barrier to upgrading among farms helps to sustain the market power of mills vis-à-vis upstream
actors such as farms and farmworkers.
The precarious situation of sugar farms has led to adverse outcomes in a number of areas,
including poor labor and environmental practices and a tendency towards “land grabs”, or the
acquisition of land rights without providing former users with free, prior and informed consent.
Given the difficulties that sugar farms face with respect to upgrading into milling or other value-
added activities, the main options available to farmers in order to expand profits and/or deal with
falling prices is to reduce the cost of operation or expand production onto new land. As the main
source of cost with respect to sugar harvesting is labor (particularly where manual harvesting is
used), farms thus face an incentive to pay less for farm labor, for example by turning to labor
contractors employing informal workers. Conversely, farms may expand their revenues by
growing sugar on larger land areas. This situation creates an incentive for farms to engage in
land grabs as a means of acquiring additional land for sugar cultivation or to expand cultivation
in such a way that it produces environmentally harmful runoff onto neighboring farms.
1.5. Challenges for pro-poor development in sugar GVCs: Labor and land
Since the era when slaves harvested sugarcane, sugar farms have been the site of egregious labor
violations. Though sugarcane is usually harvested by wage laborers today, working conditions
remain generally poor, particularly in areas where sugar cane is harvested manually rather than
by machine. This is because most of the sucrose is concentrated near the base of the stalk, so
harvesters must bend low and use significant force when cutting the cane. When the farms hiring
laborers do not invest in the proper trainings and safety equipment, workers can easily become
injured (Coslovsky, 2013). Also, given the tight profit margins faced by sugar farms, farmers
sometimes seek to reduce labor costs by outsourcing labor-intensive harvesting activities to
third-party labor contractors, who charge based on production and are able to provide a labor
force on demand. Labor contractors serving the sugar industry have been found to violate labor
standards – such as child labor laws, minimum wage laws, the right to free association,
regulations limiting the length of the workday, and regulations mandating the use of adequate
health and safety equipment – in multiple countries including Brazil (Coslovsky, 2013),
Nicaragua (STR, 2009b), Honduras (STR, 2009a), India (Chisanga et al., 2014), and Thailand
(DOL, 2014a), among others. The US Department of Labor has documented child labor in the
sugar sectors of seventeen countries: Belize, Bolivia, Burma, Colombia, El Salvador, Dominican
Republic, Ghana, Guatemala, India, Kenya, Mexico, Pakistan, Panama, Paraguay, Philippines,
Thailand, and Uganda (DOL, 2014b). Labor contractors in the sugar sector are also commonly
reported to withhold pay from workers and to rely on migrant and unregistered labor (Coslovsky
& Locke, 2013). Since farms so often outsource harvesting activities, it can be legally difficult to
detect labor violations and hold these farms accountable for the labor violations that occur on
their land.
Efforts to improve labor standards on sugar farms are scarce, however those that have occurred
have typically been undertaken as a result of actions taken by the state, rather than through the
use of “buyer power” by major buyers like TCCC and Pepsi. For example, Brazilian labor
inspectors and government prosecutors have, since 2005, taken legal action against several farms
which have subcontracted harvesting activities to unscrupulous labor contractors. As a result,
there has been a substantial decline in labor violations and reports of “slave-like” conditions on

61
Brazilian sugar farms (Coslovsky & Locke, 2013).23 Similarly, Thai labor inspectors have
recently partnered with the US Department of Labor in order to promote compliance with labor
laws on sugar farms (DOL, 2014a).
In addition to violations of labor standards, sugar cane farms are also frequently the cause of
various forms of environmental degradation. Since most of the sugar produced globally is grown
in monocultures that depend on the application of chemical fertilizers, sugarcane production has
been tied to chemical runoffs into streams, lakes and oceans (Davis et al., 2011). In addition,
under manual harvesting methods, farms burn their fields immediately before workers move in to
cut the cane in order to eliminate extraneous foliage, which allows the workers to move more
quickly. Although this practice nearly doubles labor productivity, it also creates air pollution,
increases the incidence of respiratory diseases in neighboring towns, and kills wildlife
(Coslovsky & Locke, 2013; IISD, 2014).
Finally, as indicated on p. 5, there has been pressure towards the consolidation of larger and
larger tracts of land for sugar farms. There are multiple reasons for this, including the ability of
larger, mill-owned farms to more easily plan supply and demand for milling activities than
multiple small farms. In addition, large farms are more easily able to finance the investments in
mechanization, training and environmental compliance that lead to improved productivity and
minimize legal liabilities. However, the expansion of large sugarcane farms qualifies as a land
grab if it occurs in the absence of free, prior and informed consent. In 2013, Oxfam showed that
Usina Trapiche, a mill owned by the commodity trader Bunge, sourced sugar from a farm that
had engaged in land grabbing (Oxfam, 2013). This sugar was eventually purchased by a local
Coca Cola bottler, implicating the global soft drink brand in the practice of land grabs. Also in
2013, a Cambodian sugar farm supplying Tate & Lyle, which is itself a supplier to Coca Cola,
was shown to have engaged in land grabbing (Hodal, 2013). This episode eventually precipitated
in Tate & Lyle’s expulsion from the Bonsucro initiative. Mitr Phol, which is Thailand’s largest
sugar company and also a supplier to Coca Cola, has also been accused of engaging in land grabs
in Cambodia (Heimkhemra, 2014).
While it is of course critical to hold TCCC and Pepsi to account for legal and human rights
violations in their supply chains, it is also important to consider the broader dynamics of the
market system in which these adverse practices are embedded. While poor labor and
environmental outcomes have long been characteristic of sugarcane harvesting, the recent uptick
in the number of land grabs occurred during a period of extraordinary expansion in the global
production and trade of sugar. Much of this has been driven not by growth in the consumption of
sugary soft drinks, but rather by rising demand for sugar-based ethanol as a renewable source of
energy. Given the overlaying patterns of ownership and exchange that link together multiple
actors across the farming, milling, trading and energy segments of the sugar value chain as well
as the diffuse set of end-markets into which sugar is sold, however, it is the responsibility of all
actors in sugar value chains to ensure that harvesting may occur in compliance with prevailing
labor, environmental and social standards.
23 This improvement in labor standards was facilitated by auditors from TCCC, who trained large farms on the
business practices necessary to introduce mechanized harvesting methods. Such methods increase labor productivity
and decrease demand for unskilled contract labor, thus indirectly promoting improved labor practices.

62
2. The Rise of Private Governance and Its Limitations
There are three main sources of private governance to promote improved labor, environmental
and social standards in sugar-soft drink value chains. These are: corporate codes of conduct
(covering the supply chains of major buyers like TCCC and PepsiCo), multi-stakeholder
governance (Bonsucro), and third-party certifications (Fairtrade, Rainforest Alliance and
Organic). However even as these initiatives set specific and meaningful standards for labor and
environmental practices for actors in the supply chain, each covers such a small share of global
sugar production that it has a very limited impact on the organization of the entire industry.
2.1.Coca Cola and Pepsi: Corporate Codes of Conduct
Before 2000, bottlers within the Coca Cola network were tasked with verifying that their
suppliers complied with food safety and other standards. After substantial negative publicity in
the late 1990s and early 2000s, including an incidence of food poisoning in Europe and reports
of flagrant labor violations in the Americas, TCCC decided to take charge of monitoring
suppliers within the franchise’s value chain. In 2000, the company introduced the T1
Compliance Audit to rate the reliability and quality of bottlers’ suppliers. In 2002, it unveiled a
code of conduct known as the Supplier’s Guiding Principles (SGP). These efforts were aimed at
ensuring product quality and protecting the firm’s brand from allegations of labor violations at
bottling plants (Coslovsky & Locke, 2013). Shortly afterwards, Pepsi followed TCCC in creating
a supplier code of conduct. TCCC most recently updated their code of conduct in 2011 to
emphasize the International Labor Organization’s Decent Work standards (TCCC, 2011). Pepsi
most recently updated its supplier code of conduct in 2013 (PepsiCo, 2013). Though both codes
of conduct feature strong language against labor and environmental violations and states that all
suppliers to TCCC and PepsiCo bottlers must obey local laws, enforcement mechanisms remain
dependent upon third-party providers and leave room for non-compliant sugar mills to slip
through the cracks. Audits are performed through self-assessments using third-party service
providers such as SEDEX (Supplier Ethical Data Exchange) or directly by third-party
organizations.
2.2.Bonsucro: A private, multi-stakeholder governance initiative
More recently, both companies have become members of Bonsucro, which grew out of the
World Wildlife Fund-supported Better Sugarcane Initiative (BSI) in 2008. Bonsucro is a
organized as a roundtable, meaning that it draws on members from across the sugar value chain,
including farms, mills, commodity traders, buyers (in the confectionary, soft drinks and energy
industries) and civil society organizations. Both TCCC and Pepsi are member of Bonsucro and
have committed to buying 100% Bonsucro-certified sugar by 2020. Prominent members include
BP,Bunge, Cargill, ED&F Man, General Mills, Mondelez, Nestle, Odebrecht, Petrobras,
Rabobank, SAB Miller, Shell Energy, Syngenta, Unilever and the World Wildlife Fund
(Bonsucro, 2014a). Due to the fact that certification efforts began in Brazil, the vast majority of
Bonsucro members are found in Brazil.24 Most of these are mills and farming organizations
(such as co-ops), though a handful of Brazilian lead firms and large agro-business entities are
also involved.
24 Certification has also commenced in Australia, and there are plans to begin certification in India and Thailand
soon.

63
The Bonsucro standard is awarded at the mill-level, rather than to farms. To be certified by
Bonsucro, sugar must be produced under conditions in which auditors have found that producers
comply with the initiative’s guiding principles.25 The initiative began certification efforts in
2011. The first Bonsucro-certified sugar was produced in 2011 by a mill in São Paulo and sold to
a Coca Cola bottler in Brazil (TCCC, 2013). Bonsucro currently covers 3.74% of the sugarcane
produced in the world (Bonsucro, 2014a). However, Bonsucro CEO Nick Goodall had expected
that by the end of 2014 5% of the world’s sugarcane would be certified by Bonsucro, so the
organization is already falling behind its goals (The Guardian, 2014). Bonsucro’s target is to
certify 20% of world sugarcane production by 2017. As of late 2014, it appears unlikely that
Bonsucro will meet this goal.
2.3.Third-party certifications
In addition to Bonsucro, there is a handful of other, third-party certification programs. Whereas
Bonsucro is governed by a set of members who are industry stakeholders and who pay a
membership fee to participate in the organization, these certification programs are overseen by
non-profit organizations which do not have a direct stake in the sugar industry. Outside of
Bonsucro, the main certification initiatives with programs in sugar are Fairtrade, Rainforest
Alliance and IFOAM/Organic. Table 19 displays all four certification initiatives as well as their
annual production in 2012. Not all sugar which is produced under certified processes are
necessarily sold as “certified” sugar; as with certified cocoa and other certified commodities,
some is sold into commodity markets. The ratio of sales to production of sugars produced under
the various certification initiatives is also indicated in Table 19.
Table 19: Ratio of Sales to Production of Certified Sugar
Production
(MT)
Share of
global
production
Share of
global
exports
Ratio of sales
to production
Bonsucro
2,960,000
2% 6% n/a
Fairtrade
450,000
0% 1% 64%
Rainforest Alliance
69,788
0% 0% n/a
Organic
339,133
0% 1% 90%
Source: IISD 2014
Fairtrade: The Fairtrade certification program for sugar is monitored by the Fairtrade Labeling
Organizations (FLO). As with other Fairtrade certification programs, the FLO initiative in sugar
provided a “premium” of $60 per tonne in addition to the negotiated price and offer some funds
for producer organizations to finance inputs (FLO, 2013). In order to participate in Fairtrade,
producers must work in small, democratic producer organizations, eliminate forced and child
labor and comply with environmental requirements. FLO is currently focusing its sugar program
25 These are: Obey the Law, Respect Human Rights and Labor Standards, Manage input, production and processing
efficiencies to enhance sustainability, Actively manage biodiversity and ecosystem services, Continuously improve
key areas of the business, Meet additional mandatory requirements for biofuels under the EU Renewable Energy
Directive and revised Fuel Quality Directive (Bonsucro, 2014b).

64
on small producer countries in Central America, South America and Africa, rather than major
global producers. The organization currently has the largest programs in the following countries:
Belize (accounting for 38 % of global Fairtrade production), Fiji (22%), Zambia (16%),
Paraguay (11%) and Malawi (5%) (IISD, 2014). Almost all Fairtrade sugar is sold on the EU
market.
Rainforest Alliance: Rainforest Alliance launched a sugar program in 2009, introducing a set of
standards that cover both environmental as well as social/labor issues. This program is still in its
pilot stage. The organization began certification efforts in 2011 and as of 2013 had only certified
one farm in Brazil and one farm in El Salvador, representing a total of 70,000MT of production
(IISD, 2014), or less than 0.05% of global sugar production.
IFOAM/Organic: In contrast to Fairtrade, certified organic sugar is sourced from traditionally
larger exporting countries. The top source countries for organic sugar account for 68 per cent of
global Organic sugar supply (IISD, 2014). While major producing countries may matter a lot for
IFOAM/Organic, it is not follow that organic production methods are important to these
countries. For example Brazil was the largest producer of Organic sugar, at 94,000 MT, in 2011
but this represents only 0.5% of Brazilian exports. Thailand produced 51,700 MT of organic
sugar, accounting for 1.3% of the country’s exports (IISD, 2014).
2.4.The Limitations of Private Governance
While all of the three types of private governance serve to promote improved labor and
environmental standards along sugar value chains, each covers only a very small share of global
sugar production. Thus, private governance initiatives lack the broad industry coverage
necessary to have a transformative impact across the multiple countries and firms involved in
sugar GVCs. For example, TCCC’s code of conduct covers only up to 3.2% or global sugar
production, and PepsiCo’s only 1.4%. Bonsucro represents roughly 2% of global production (and
nearly 6% of exports). And the various non-profit third-party certifications each cover far less
than 1% of global production. Among the three types of private governance in the sugar industry,
the multi-stakeholder approach, Bonsucro, has the greatest likelihood of expanding its market
share substantially; however the organization’s slow progress thus far indicates that for the
foreseeable future the vast majority of world sugar production and trade will be processed
through commodity channels with minimal oversight from certifying bodies.
Beyond the small market share that they provide, private initiatives are ultimately not well suited
to address the power asymmetries that lie at the heart of adverse outcomes at the farm-level in
sugar value chains. These power asymmetries are rooted in the commoditized nature of sugar
and the monopsony power that mills hold over nearby farms, due to the high perishability of
newly harvested sugarcane. As raw sugar (the output of milling) is an undifferentiated
commodity, mills are price-takers on national and global markets. Since mills have substantial
market power with respect to farms, however, they are able to push the costs of adjustment to
low or volatile prices onto farmers, who in turn displace these onto farmworkers. Given the
weakness of labor markets – particularly rural labor markets – in the major sugar producing
countries, farms seem to have little trouble identifying local or migrant workers willing to
harvest sugarcane, even under conditions that do not meet national labor laws. In short, the
power of sugar mills over upstream actors is the key source of negative development outcomes

65
in the sugar sector, and this power asymmetry is simply not addressed by the existing menu of
private initiatives.
Ultimately, these challenges are particularly difficult to address through private initiatives, given
the nature of sugar as a product, namely its status as an undifferentiated, globally traded
commodity that is used in multiple final goods, from soft drinks to ethanol to plastics. Since
there are so many buyers for sugar scattered across so many different industries, buyers
interested in promoting private governance initiatives face important challenges with respect to
generating the critical mass of lead firms that would be necessary to drive collective action.
Furthermore, not all buyers of sugar, either in domestic or international markets, have a strong
incentive to promote new governance arrangements in sugar value chains. Manufacturers of
sugar-based plastics or ethanol, for example, do not market a branded, consumer-facing product
and thus do not face substantial reputational threats from being associated with adverse
conditions in their supply chain. Furthermore, demand for sugar is growing most quickly among
developing countries, where calls for pro-worker governance are weaker than in traditional
leading markets like the US and the EU. Finally, most (65%) of the sugar produced globally is
consumed within the country where it was grown. Thus, the pressure created by private
initiatives, which relies crucially on lead firms’ market power on the demand side, is not
sufficient to drive system-wide transformation of sugar harvesting. Other channels to promote
change include the introduction of new production technologies (e.g. mechanization)26 and
improving the capacity of government actors to successfully engage in private governance,
particularly by holding mills and farms accountable for labor violations that occur on their land.
3. Global Value Chains and Public Governance
A solid understanding of private governance, in terms of both the direct value chain relations as
well as broad certification initiatives that are described above, is important to understanding
value chain dynamics. However public governance activities also shape sugar value chain
activities in important ways, such as subsidy and trade policies, biofuel mandates, and labor and
environmental laws. Public policies, particularly those regulating labor practices and land
transactions, have an important role to play in determining whether or not participation in sugar
value chains has pro-poor development outcomes, but such policies are not always well
enforced. Indeed, ensuring compliance with labor laws in the sugar sector is a vexing challenge,
even for regulatory agencies that are serious about enforcement. Teams of sugarcane harvesters
move quickly through the fields, so tracking them can be challenging, particularly when they are
not using mechanized harvesting technologies. Furthermore, as indicated above, farms may
26 Evidence drawn from the South-Central Brazilian sugar sector suggests that one way to improve environmental
and working conditions in the sugar sector is to shift to mechanized harvesting, (see Coslovsky, 2014; Coslovsky and Locke, 2013). While mechanization reduces overall number of jobs available to sugarcane harvesters (by increasing labor productivity), it also removes health and safety hazards associated with manual harvesting, such as repetitive motion injuries, accidents with machetes and inhalation of soot from burning sugarcane fields. In Brazil, the shift to mechanized production was initially resisted by farms, so the government needed to encourage the adoption of mechanized harvesting. It did so by creating a national roundtable, which put a spotlight on the plight of the sugar worker and generated popular pressure for improved working conditions, and through loans provided by the National Economic and Social Development Bank (BNDES) to mills and farms in order that they mechanize production (Ramos, 2011).

66
attempt to elide responsibility for the conditions of farmworkers by relying on third-party labor
contractors for workers.
Public policies that generate demand or guarantee minimum prices to producers act to support
sugar production in most of the leading sugar producing countries. These policy efforts are
usually targeted at mills, in order to help them manage fluctuations in demand (international
price) and supply conditions. In Brazil, this support is largely managed through the country’s
ethanol policy. Brazilian law mandates that fuel be sold as a 25% ethanol / 75% gasoline blend,
and Brazil has a large fleet of flex-fuel vehicles. The large (and growing) sugar-ethanol market
has served as a source of stable demand for sugar mills in the face of volatile global prices. In
some cases, this steady demand creates certainty for mills and allows them to make investments
in mechanization and improved production processes that improve labor and environmental
outcomes (Coslovsky and Locke 2013). In India, the world’s second largest sugar producer,
sugar mills also benefit from public governance activities. The Indian government periodically
introduces export subsidies and uses a minimum price program to support sugar mills (Agarwal,
2015). In addition, the Thai government implemented a sugar price support program in order to
encourage increased production and investment in productivity improvements (USDA 2014).
Public governance aimed at improving development outcomes takes the form of labor and
environmental regulations. Labor practices are a particular area of concern because 1) sugar cane
harvesting is notoriously physically difficulty work (Coslovsky and Locke 2013) and 2) farms
and mills often contract out harvesting activities to labor contractors, which are difficult to
regulate. Public action in this area is necessary, because private governance efforts (including
Bonsucro) do not include strong guidelines about labor and environmental practices, other than
that participants follow the law.
Brazil, particularly around the state of São Paulo, has been a leader in creating and enforcing
pro-labor and –environmental legislation in the sugar sector. After a roundtable hosted by the
federal government, state officials and industry mills moved to implement mechanized
production methods that minimize the need for burning harvested cane, a practice that generates
large amounts of air pollution and harms the health of workers (Coslovsky and Locke, 2013).
They also moved to more tightly regulate labor contractors in order to improve safety conditions
and ensure that laborers received legal protections, including a minimum wage and the right to
due process (Coslovsky 2013). These regulatory efforts were successful because 1) they held
mills (the value chain segment that is relatively concentrated) responsible for legal compliance in
their upstream supply chain and 2) they were driven by an aggressive and empowered team of
labor inspectors.
Thailand has recently come under scrutiny for illegal labor practices, including child labor and
slave-like conditions, among labor contractors in its sugar value chain. The government, under
pressure from the US Department of Labor, has committed to better monitoring and regulating
labor practices on sugar farms, including more tightly regulating the activities of labor
contractors and eliminating all forms of forced labor and child labor from sugarcane production
(DOL, 2014a).
Public governance of sugar GVCs in the areas of land tenure and land transactions also have
implications for development outcomes. When rights to land tenure are weak or ambiguous,
sugar mills may extend sugar cultivation onto land owned by marginal groups, either because
67
land rights are legally ambiguous and/or because the large farmer believes that land disputes will
be settled in his favor or will not be brought before the courts at all. In addition, sugar mills may
lease land under exploitative terms from small farmers, including beneficiaries of land reform,
under terms which are not consistent with the principles of fair prior and informed consent
(FPIC). Such practices are commonly referred to as “land grabbing”. Such practices have been
widely documented in Brazil (Bernardo Mançano Fernandes et al, 2010) and Cambodia
(Heimkhemra, 2014), two countries in which sugar cane production has expanded in the last
decade (many Cambodian sugar farms sell sugar to Thai-owned milling groups). A farm
supplying Bunge in Brazil, for example, was found to have expropriated land from indigenous
groups in order to expand production (Oxfam, 2013). These examples illustrate the challenges
for pro-poor development that are associated with a lack of strong public governance over land
tenure systems.
4. Conclusion
Since 2000, there has been a significant expansion in the global sugar industry, driven by trends
such as the advance of sugar-ethanol biofuel technologies and the growth of middle class
consumers in emerging economies who are consuming larger quantities of artificially sweetened
foods and drinks. While the growth of demand for sugar has yielded important benefits for
economic development, including the creation of a large number of on- and off-farm
employments, labor violations, environmental degradation and a growing incidence of “land
grabs” have in many places undermined the pro-developmental impacts, particularly among rural
communities and sugar cane harvesters.
Addressing these negative outcomes in the areas of labor, land and the environment is difficult,
because the sugar industry is extremely diffuse, involving millions of workers, tens of thousands
of farms and thousands of mills across the globe. Improving labor practices in particular is all the
more problematic because labor violations are often hidden behind informal labor contracting
arrangements. Furthermore, sugar is a commodity-grade product characterized by tight
competition based on price, with few opportunities for product differentiation and value-addition
before it is sold from mills to buyers such as soft drink bottlers, ethanol companies, and food
manufacturers, so mills face low profit margins and few incentives to pass these on to farms or to
laborers. Though a handful of private governance efforts have arisen in order to increase farmer
incomes or promote the environmental sustainability of sugar production, these initiatives remain
very piecemeal in nature and unlikely to have a systematic effect on the global sugar industry.
In light of the limitations with respect to private actors’ ability to promote pro-poor outcomes in
sugar GVCs, efforts to improve working conditions, environmental standards and land tenure in
should refocus on the role of the state. A focus on strengthening public governance is particularly
important at this moment due to the prevalence of informal (unregulated) labor subcontractors in
driving down wages for sugarcane farmworkers in the main sugarcane producing countries,
particularly Brazil and Thailand. Public governance has had a handful of important successes,
including the strict enforcement of labor and environmental standards in by the state-level labor
inspectorate in São Paulo, Brazil. Expanding pro-poor public governance initiatives in sugar
GVCs will require the active participation of national policy-makers, who may be disinclined to
draw attention to illegal or unethical behavior in the supply chains of their most important export
crops.

68
References
Abernathy, F., Volpe, A., & Weil, D. (2005). The Future of the Apparel and Textile Industries:
Prospects and Choices for Public and Private Actors. Cambridge, MA: Harvard Center
for Textile and Apparel Research (HCTAR).
---. (2006). The future of the apparel and textile industries: prospects and choices for public and
private actors. Environment and Planning A, 38(12), 2207-2232.
Agarwal, Vibhuti. (2015). India Considering Financial Incentives for Sugar Exports. The Wall
Street Journal. 11 Feb 2015. From http://www.wsj.com/articles/india-considering-
financial-incentives-for-sugar-exports-1423659157
Agritrade. (2012). Cote d'Ivoire's Cocoa Sector Reforms 2011-2012: Special Report: Technical
Centre for Agricultural and Rural Cooperation
Ambev. (2014). History. Retrieved 12/12/2014 from
http://ri.ambev.com.br/conteudo_en.asp?idioma=1&conta=44&tipo=43355.
Barrientos, Stephanie and Kwadwo Asenso-Okyere. (2008). Mapping Sustainable Production in
Ghanian Cocoa: Institute of Development Studies and The University of Ghana.
Barrientos, Stephanie. (2014). "Gendered Global Production Networks: Analysis of Cocoa–
Chocolate Sourcing." Regional Studies, 48(5): 791-803.
Barry Callebaut. (2007). Helvea Swiss Equities Conference. Conference: Helvea Conference,
Bad Ragaz. January 12, 2007.
Bhushan, Ratna. (2010). Coke proposes Chinese model to its bottlers. The Economic Times.
9/7/2010 from http://articles.economictimes.indiatimes.com/2010-09-
07/news/27602229_1_bottlers-coca-cola-india-hindustan-coca-cola-beverages.
---. (2013). Ravi Jaipuria joins PepsiCo's top three franchise bottlers in the world. The Economic
Times. from http://articles.economictimes.indiatimes.com/2013-02-
05/news/36764549_1_rj-corp-varun-beverages-pepsico-beverages.
Birnbaum, D. (2013). Competitiveness of India’s Apparel Export (pp. 340): Apparel Export
Promotion Council (APEC).
Bitzer, Verena, Pieter Glasbergen and Pieter Leroy. (2012). "Partnerships of a feather flock
together? An analysis of the emergence of networks of partnerships in the global cocoa
sector." Global Networks, 12(3): 355-374.
Bonsucro. (2014a). Bonsucro home page. from http://www.bonsucro.com/.
---. (2014b). Bonsucro Production Standard Version 4.0. London: Bonsucro.
http://bonsucro.com/site/wp-content/uploads/2013/02/Bonsucro-Production-Standard-
v4.pdf.
Bouckley, Ben. (2013). 'Scrap harmful sugar quota extension plan': EU soft drinks industry cries.
BeverageDaily.com. 1/24/2013 from http://www.beveragedaily.com/Regulation-
Safety/Scrap-harmful-sugar-quota-extension-plan-EU-soft-drinks-industry-cries.
Brough, David and Reese Ewing. (2014). Global sugar mills retrench as depressed prices take
toll. Reuters. from http://www.cnbc.com/id/102070911#.
Burrit, Chris and Duane Stanford. (2010). Coca-Cola to Purchase Bottler in $12.3 Billion deal.
Bloomberg. 2/25/2010 from
http://www.bloomberg.com/apps/news?pid=newsarchive&sid=ayIm0dQClBNA.
Chisanga, Brian, John Gathiaka, George Nguruse, Stellah Onyancha, and Thando Vilakazi.
(2014). Competition in the regional sugar sector: the case of Kenya, South Africa,
Tanzania and Zambia. Geneva: UNCTAD.
http://unctad.org/meetings/en/Contribution/CCPB_RPP2014_Study_Sugar_ACF_en.pdf.

69
Copersucar. (2014). Dados Economicos. from http://www.copersucar.com.br/.
COSA. (2013). The COSA Measuring Sustainability Report: Coffee and Cocoa in 12 Countries:
Committee On Sustainable Assessment.
Coslovsky, Salo and Richard Locke. (2013). "Parallel paths to enforcement: Private compliance,
public regulation and labor standards in the Brazilian sugar sector." Politics & Society,
41(4).
Coslovsky, Salo. (2013). "Enforcing Food Quality and Safety Standards in Brazil: The Case of
COBRACANA." The ANNALS of the American Academy of Political and Social Science,
649(1): 122-138.
Daher, M., & Chmielewski, J. (2013). Private Label Sourcing Strategies to differentiate and
defend: Insights from the 2012-2013 Private Label Sourcing Survey: Deloitte Consulting
LLP.
Dand, Robin. (1999). The international cocoa trade. Boca Raton, FL; Cambridge, England: CRC
Press; Woodhead Pub.
---. (2011). The international cocoa trade. Cambridge, UK ; Philadelphia, PA: Woodhead Pub.
Datamonitor. (2008). Li & Fung Limited (pp. 27). New York, NY: Datamonitor.
Davis, AM, PJ Thorburn, SE Lewis, ZT Bainbridge, SJ Attard, R Milla, and JE Brodie. (2011).
"Environmental impacts of irrigated sugarcane production: Herbicide run-off dynamics
from farms and associated drainage systems." Agriculture, Ecosystems & Environment.
Deininger, Klaus and Derek Byerlee. (2011). The Rise of Large Farms in Land Abundant
Countries: Do They Have a Future? Washington, DC: World Bank.
https://openknowledge.worldbank.org/bitstream/handle/10986/3355/WPS5588.pdf?seque
nce=1.
DOL. (2014a). The Actions of the Concerned Parties to Solve the Problem of Child Labour and
Forced Labour in the Shrimp, Garment, Sugar Cane, and Fish Products in Thailand in
2013. Washington, DC: Department of Labor.
http://www.dol.gov/ilab/submissions/pdf/Thailand20140504a.pdf.
---. (2014b). List of Goods Produced by Child Labor or Forced Labor. Washington, DC: United
States Department of Labor Bureau of International Labor Affairs: Office of Child Labor,
Forced Labor, and Human Trafficking.
http://www.dol.gov/ilab/reports/pdf/TVPRA_Report2014.pdf.
Doner, Richard F. and Ansil Ramsay. (2010). Explaining Divergence in Sugar: The Philippines
and Brazil. In R. F. Doner (Ed.), Explaining Institutional Innovation. Brooklyn: SSRC.
Driscoll, M., & Wang, P. (2009). Industry Surveys: Apparel & Footwear: Retailers & Brands
(September). New York, NY: Standard & Poor's.
Ecobank (2014). Cote d'Ivoire's Cocoa Grinders: At the Crossroads. Retrieved November 2014,
from Ecobank International Incorporated
Einhorn, B. (2009, May 14). Li & Fung: A Factory Sourcer Shines. BusinessWeek.
Euromonitor. (2014a). Euromonitor Global Market Information Database. Retrieved September
2014, from Euromonitor International.
---. (2012). Cocoa Ingredients: Difficult Times for These Prized Ingredients: Euromonitor
International.
---. (2014). Euromonitor Passport. Chicago: Euromonitor International.
---. (2014b). Global Confectionery Overview: Key Categories, Countries and Trends to 2019.
---.. (2014c). Global Trends and Developments in Cocoa Ingredients (World): Euromonitor
International.
70
---. (2014a). World Apparel Market Company Shares (by Global Brand Owner): 2004-2013.
Retrieved June 3, 2014, from Euromonitor International
---. (2014b). World Apparel Market Statistics: 1999-2013. Retrieved March 24, 2014, from
Euromonitor International
FAOSTAT. (2014). Food and Agricultural Organization of the United Nations, Statistics
Division.
---. (2014). Food Balance Data. Retrieved Nov. 2014, from Food and Agriculture
Organizationfrom http://faostat3.fao.org/download/FB/BC/E.
Fenner, Robert and Brendan Case. (2012). Coca-Cola Femsa to Buy 51% of Coke Bottler in
Philippines. Bloomberg. 12/14/2012 from http://www.bloomberg.com/news/2012-12-
14/coca-cola-femsa-to-pay-689-million-for-51-in-philippines-firm.html.
Fernandez-Stark, K., Frederick, S., & Gereffi, G. (2011). The Apparel Global Value Chain:
Economic Upgrading and Workforce Development. Durham, NC: Duke University,
Center on Globalization, Governance & Competitiveness (CGGC).
Financial Times. (2009). Pepsi bottles it. Financial Times. from
http://www.ft.com/intl/cms/s/2/6cc01f6e-2d83-11de-9eba-
00144feabdc0.html#axzz3NPWvdkgS.
---. (2014). SABMiller, Coca-Cola merge African bottling arms. Financial Times. from
http://www.ft.com/intl/fastft/242272/sabmiller-coca-cola-merge-african-bottling-arms.
FLA. (2012). Sustainable Management of Nestlé’s Cocoa Supply Chain in the Ivory Coast—
Focus on Labor Standards: Fair Labor Association.
---. (2013). Monitoring the scope and benefits of Fairtrade. London: Fairtrade Labeling
Organizations.
Fold, Niels. (2001). "Restructuring of the European chocolate industry and its impact on cocoa
production in West Africa." Journal of Economic Geography, 1(4): 405-420.
---. (2002). "Lead Firms and Competition in ‘Bi-polar’ Commodity Chains: Grinders and
Branders in the Global Cocoa-chocolate Industry." Journal of Agrarian Change, 2(2):
228-247.
Frederick, S., & Gereffi, G. (2011). Upgrading and Restructuring in the Global Apparel Value
Chain: Why China and Asia are Outperforming Mexico and Central America.
International Journal of Technological Learning, Innovation and Development, 4(1/2/3),
67 - 95.
Frederick, S., & Staritz, C. (2012). Developments in the Global Apparel Industry after the MFA
Phaseout. In G. Lopez-Acevedo & R. Robertson (Eds.), Sewing Sucess? Employment,
Wages and Poverty following the End of the Multi-fibre Arrangment (pp. 41-86).
Washington, DC: The World Bank.
Frederick, S. (2014). Benchmarking South Asia in the Global Apparel Industry Report prepared
for the World Bank.
Fung, V., Fung, W., & Wind, Y. (2008). Competing in a Flat World. Upper Saddle River, NJ:
Wharton School Publishing.
GCP. (2014). Ghana Cocoa Platform. Retrieved November 2014 from
http://ghanacocoaplatform.org/about-us.
Gereffi, G. (1994). The Organization of Buyer-Driven Global Commodity Chains: How U.S.
Retailers Shape Overseas Production Networks. In G. Gereffi & M. Korzeniewicz (Eds.),
Commodity Chains and Global Capitalism (pp. 95-122). West Port, CT: Praeger.
71
---. (1999). International trade and industrial upgrading in the apparel commodity chain. Journal
of International Economics, 48, 37–70.
Gereffi, G., & Frederick, S. (2010). Chapter 5: The Global Apparel Value Chain, Trade and the
Crisis: Challenges and Opportunities for Developing Countries. In O. Cattaneo, G.
Gereffi, & C. Staritz (Eds.), Global Value Chains in a Postcrisis World (pp. 157-208).
Washington, DC: The World Bank.
Gereffi, G., Humphrey, J., & Sturgeon, T. (2005). The governance of global value chains.
Review of international political economy, 12(1), 78-104.
Heimkhemra, Suy. (2014). Thai Sugar Company Accused of Rights Abuse in Cambodia. Voice
of America Cambodia. 8/13/2014 from http://www.voacambodia.com/content/thai-sugar-
company-accused-of-rights-abuse-in-cambodia/2411955.html.
Hester, S. (2013). Analyzing the Value Chain for Apparel Designed in the United States and
Manufactured Overseas Commissioned by the TPP Apparel Caucus. Seattle, Washington:
Moongate Associates.
Hodal, Kate. (2013). Cambodia's sugar rush leaves farmers feeling bitter at 'land grab'. The
Guardian. 7/9/2013 from http://www.theguardian.com/world/2013/jul/09/cambodia-
sugar-land-grab-claims.
IBISWorld. (2014). Global Candy & Chocolate Manufacturing: IBISWorld Global Industry
Report.
ICCO. (2012). How Many Smallholders Are There Worldwide Producing Cocoa? Retrieved
September 2014 from International Cocoa Organization.
IISD. (2014). Sugar Market, The State of Sustainability Initiatives Review 2014: International
Institute for Sustainable Development.
IMF. (2012). IMF, World Bank Back US$4 Billion Cote d'Ivoire Debt Relief. International
Monetary Fund Retrieved November 2014 from
http://www.imf.org/external/pubs/ft/survey/so/2012/car062612a.htm.
ISO. (2012). Outlook of Sugar and Ethanol Production in Brazil. London: International sugar
Organization.
http://www.isosugar.org/Members%20documents/2012/MECAS(12)05%20-
%20Outlook%20of%20Sugar%20and%20Ethanol%20Production%20in%20Brazil%20-
%20English.pdf.
ITC. (2011). The Impacts of Private Standards on Global VAlue Chains - Part I: International
Trade Center.
Jakab, Spencer. (2015). Coca-Cola's Watered-Down Performance. Wall Street Journal. from
http://www.wsj.com/articles/coca-colas-watered-down-performance-ahead-of-the-tape-
1423514424.
Jassin-O’Rourke Group. (2008). Global Apparel Manufacturing Labor Cost Analysis 2008. New
York, NY.
just-style.com. (2009, March 24). Analysis: will others follow Liz Claiborne's sourcing shift?
just-style.com.
Kaplinsky, Raphael. (2004). Competition Policy and the Global Coffee and Cocoa Value Chains:
Institute of Development Studies University of Sussex, and Center for Research in
Innovation Management, University of Brighton.
Kapner, S. (2009, December 8). Unstoppable Fung Brothers. CNN Money, p. 5.
72
Kessler, Jan Joost, Johan Brons, Lenneke Braam, Marijke van Kuijk, and Pim Pelders. (2012).
Social & Economic Effects of Value Chains of Tropical Agro-commodities &
Sustainability Initiatives: Final Repor: Aidenvironment.
KPMG. (2013). Moving the Bars: Sustainability Brought to the Forefront in the Cocoa Chain:
KPMG Evaluation of the 2008-2012 Cocoa Invetment Program.
---. (2011). Sustainable Cocoa Fund Study. Section II - Segmentation and Intervention Options.
Labour Behind the Label. (2014). Tailored Wages UK - Are the big brands paying the people
who make our clothes enough to live on? (pp. 98): Clean Clothes Campaign (CCC),
Labour Behind the Label.
Lefevre, Amy Sawitta. (2013). Pepsi suddenly scarce in Thailand after bottler breakup. Reuters.
2/22/2013 from http://www.reuters.com/article/2013/02/22/us-sodawars-thailand-
idUSBRE91L08620130222.
Li & Fung Ltd. (2009). Annual Report 2008. http://www.lifung.com/wp-
content/uploads/2014/06/ar2008.pdf
---. (2014a). 2013 Annual Results & Three-Year Plan 2014-2016 Announcement.
http://www.lifung.com/wp-content/themes/lifung_new/pdf-dl.php?file=/wp-
content/uploads/2014/06/pre140320.pdf
---. (2014b). Analyst Presentation Global Brands Group Spin-off. www.lifung.com/wp-
content/themes/lifung_new/pdf-dl.php?file=/wp-
content/uploads/2014/05/pre1405221.pdf
---. (2014c). Annual Report 2013. http://www.lifung.com/wp-
content/uploads/2014/03/ar2013.pdf
Madden, John (2014). Olam to Become One of the Top Three Global Cocoa Processors.
Retrieved December 2014, from Euromonitor International
Marketline. (2013). Global Apparel and Non-Apparel Manufacturing.
McConnell, Michael, E Dohlmann and Stephen Haley. (2010). "World Sugar Price Volatility
Intensified by Market and Policy Factors." Amber Waves, 8(3): 28-35.
Mayer, Frederick, & Gereffi, Gary. (2010). Regulation and economic globalization: Prospects
and limits of private governance. Business and Politics, 12(3).
Miller, D. (2013). Towards sustainable labour costing in UK fashion retail Capturing the Gains
Working Paper 2012/14 (pp. 45). Manchester, UK.
Nathan Associates. (2005). Survey of U.S. Apparel Buyers: Sourcing from Sub-Saharan Africa
in the Post-quota Era University of Sussex.
Newbury, M. (2013). Tomorrow’s apparel industry: products, markets, sourcing and influences -
forecasts to 2019 Just-Style Management Briefing (June). United Kingdom: Aroq
Limited.
OECD. (2014). Biofuels. Agricultural Outlook from http://www.oecd.org/site/oecd-
faoagriculturaloutlook/biofuels.htm.
OneSource. (2014). OneSource Global Business Browser. Retrieved September 2014, from
OneSource.
O'Rourke Group Partners. (2014). Global Sourcing Trends. Paper presented at the AAPN Annual
Conference, Miami, FL.
Oxfam. (2013). Brazilian State prosecutor to investigate land grab highlighted by Oxfam. Oxfam
International. 10/29/2013 from http://www.oxfam.org/en/pressroom/pressreleases/2013-
10-29/brazilian-state-prosecutor-investigate-land-grab-highlighted.

73
---. (2011). "Exploring the Links Between International Business and Poverty Reduction: The
Coca-Cola/SABMiller value chain impacts in Zambia and El Salvador." Oxfam Policy
and Practice: Private Sector.
Patton, D. (2009, January 27). Speaking with style: Bruce Rockowitz, president, Li & Fung
Trading. just-style.com, p. 3. Retrieved from http://www.just-style.com/interview/bruce-
rockowitz-president-li-fung-trading_id103083.aspx
PepsiCo. (2011). Annual Report. Purchase, NY: PepsiCo.
http://www.pepsico.com/annual11/financials/mda/our-business.html.
---. (2013). Global Supplier Code of Conduct: PepsiCo.
http://www.pepsico.com/Assets/Download/supplier_code_of_conduct/ENGLISH_SCOC
_2013.pdf.
Platt, G. (2007). Profile of Oxford Industries. Textile Outlook International(127), 10-18.
Potts, Jason, Mattew Lynch, Ann Wilkings, Gabriel Huppé, Maxine Cunningham, and Vivek
Voora. (2014). The State of Sustainability Initiatives Review 2014: Standards and the
Green Economy: International Institute for Sustainable Development and the
International Institute for Environment and Development.
SABMiller. (2007). Our soft drinks business. London. http://www.sabmiller.com/docs/default-
source/investor-documents/reports/2007/other-reports/soft-drink-report.pdf?sfvrsn=2.
Saheed, H. (2014). Prospects for the Textile and Clothing Industry in China. Textile Outlook
International(168), 79-133.
Samaraweera, D. (2007, June 20). Sri Lanka: Li & Fung vows to source clothing closer to home.
just-style.com, p. 1. Retrieved from http://www.just-style.com/news/li-fung-vows-to-
source-clothing-closer-to-home_id97696.aspx
Sauls, J. (2007). Excellence in Sourcing First Annual Apparel Research Study & Analysis: Kurt
Salmon Associates (KSA).
---. (2008). Excellence in Sourcing Second Annual Apparel Research Study & Analysis: Apparel
Magazine.
Schrage, Elliot J. and Anthony P. Ewing. (2005). "The Cocoa Industry and Child Labour."
Journal of Corporate Citizenship, 2005(18): 99-112.
Schrempf-Stirling, Judith and Guido Palazzo. (2013). "Upstream Corporate Social
Responsibility: The Evolution From Contract Responsibility to Full Producer
Responsibility." Business & Society.
Shapiro, J., & Thomas, C. (2013). Excellence in Global Sourcing Seventh Annual Apparel
Research Study & Analysis: Kurt Salmon Associates.
Sri Lanka DCS. (2014). Annual Survey of Industries 2012. Colombo: Sri Lanka Department of
Census and Statistics (DCS).
Statista. (2014). Global Statistical Platform Retrieved September 2014, from Statista Inc.
STR. (2009a). Honduras: A Macro View of Today's Industry: Specialized Technology
Resources. http://assets.coca-
colacompany.com/de/c3/657978d9459c99dbaf53f02cbd32/Honduras_Sugar_Industry_M
acro_Level_Report.pdf.
---. (2009b). Nicaraguan Sugar: A Macro View of Today's Industry: Specialized Technology
Resources. http://assets.coca-
colacompany.com/10/58/7b94d83d4c25a4a3bb5eb919649e/NicaraguaSugarIndustry-
AMacroLevelReport012309.pdf.

74
TCCC. (2012). PlantBottle: Frequently Asked Questions. Retrieved 12/12/2014, 2014, from
http://www.coca-colacompany.com/plantbottle-technology/plantbottle-frequently-asked-
questions.
---. (2011). Supplier Guiding Principles. Atlanta: The Coca Cola Company. http://assets.coca-
colacompany.com/1b/d5/9c8554554fd29678c97791e27c83/SGP_Brochure_ENG.pdf.
---. (2013). Sourcing Sustainably: Coke Takes Leadership Role to Protect Land Rights of
Farmers and Communities. from http://www.coca-colacompany.com/stories/sourcing-
sustainably-coke-takes-leadership-role-to-protect-land-rights-of-farmers-and-
communities.
Telegraph. (2008, June 1). Li & Fung-the made in China giant you have never heard of The
Telegraph. Retrieved from
http://www.telegraph.co.uk/finance/newsbysector/retailandconsumer/2790870/Li-and-
Fung-the-Made-in-China-giant-you-have-never-heard-of.html
The Guardian. (2014). Sustainable sugar: Coca-Cola and BP signed up but will it go
mainstream? The Guardian. September 15, 2014 from
http://www.theguardian.com/sustainable-business/2014/sep/15/sustainable-sugar-can-
coca-cola-bp-shell-bonsucro.
Tollens, Eric F. and Christopher L. Gilbert. (2003). "Does Market Liberalisation Jeopardise
Export Quality? Cameroonian Cocoa, 1988–2000." Journal of African Economies, 12(3):
303-342.
Tony Chocolonely. (2014). Annual Report 2013. Amsterdam.
UNCTAD. (2013). Global Value Chains: Investment and Trade for Development: United
Nations Conference on Trade and Development.
---. (2008). Cocoa Study: Industry Structures and Competition: United Nations Conference on
Trade and Development.
UNSD. (2014). World Apparel (HS1992 61+62) Imports (1990-2012) Retrieved March 3-6,
2014, from United Nations Statistics Division (UNSD)
USDA. (2012). Mexico Takes Steps to Privatize State-Owned Sugar Mills. Washington, DC:
United States Department of Agriculture Global Agricultural Information Network
(GAIN).
http://gain.fas.usda.gov/Recent%20GAIN%20Publications/Mexico%20Takes%20Steps%
20to%20Privatize%20State-Owned%20Sugar%20Mills_Mexico_Mexico_8-1-2012.pdf.
Valdes, Constanza. (2011). Brazil's Ethanol Industry: Looking Forward. Washington, DC:
United States Department of Agriculture.
http://www.ers.usda.gov/media/126865/bio02.pdf.
Wireko-Brobby, Bright. (2014). Report on Regional Plenaries for Cocoa Farmers: Ghana Cocoa
Platform.
World Bank. (2014a). World Bank Commodity Price Data (the Pink Sheet). Retrieved
November 2014, from http://data.worldbank.org/data-catalog/commodity-price-data.
---. (2014b). World Development Indicators. Retrieved October 2014, from World Bank.
---. (2008). World Development Report: Agriculture for Development: World Bank.

75
Appendix
Li & Fung Ltd. Profile
Li & Fung (L&F) Limited is a Hong Kong-based trading and brand marketing company for hard and soft
goods with $20.7 billion in sales in 2013 (ending December 31) (Li & Fung Ltd., 2014c). In 2008, apparel
represented 2/3 of total sales, the largest product category (Kapner, 2009). In 2009 L&F represented an
estimated 6 percent of the U.S. apparel market (Patton, 2009).
L&F does not own production facilities, yet their size is one of their main advantages. The company
maintains a larger network of buying offices than any clothing firm (just-style.com, 2009). Li & Fung
has 65 global trading offices, 66 distribution offices and 49 logistics offices. The company has
approximately 15,000 suppliers in over 40 economies, up from only 13 countries in 1994 (Kapner, 2009;
Li & Fung Ltd., 2014a). In 2008, 49 percent of softgoods were sourced from China, followed by Vietnam
and Bangladesh (Li & Fung Ltd., 2014c).
Geographically the U.S. is the largest market for L&F, representing 62 percent of the Group’s sales in
2013, followed by Europe at 19 percent and Asia (12 percent)(Li & Fung Ltd., 2014a). In the mid-2000s,
L&F’s largest customer was Kohl's, accounting for approximately 12 percent of sales (Li & Fung Ltd.,
2009; Patton, 2009).
Li & Fung has a multi-faceted business model with operations organized into three business networks:
trading, distribution and logistics. For fiscal year 2013, the trading group accounted for over three-
quarters of sales, followed by distribution and logistics (Li & Fung Ltd., 2014c).
Intermediary/Trading Company
Li & Fung began as a trading company, and is still primarily known a buying agent responsible for
sourcing products from its global network of suppliers on behalf of retailers and brands. In 2008,
Gymboree, The Limited Stores, Ecko Unlimited, Kohl’s, Timberland, American Eagle, Carter’s
(Oshkosh), Hudson Bay Trading (Lord & Taylor), Mervyn’s and Goodies (before bankruptcy in 2008)
and about 30 percent of UK retailers are customers of Li & Fung (Einhorn, 2009; Fung, Fung, & Wind,
2008; Kapner, 2009; Samaraweera, 2007; Telegraph, 2008). Recently L&F has also been purchasing the
sourcing operations from retailers (just-style.com, 2009). Li & Fung has taken over sourcing and the
sourcing operations of: Tommy Hilfiger, KarstadtQuelle (Germany), Liz Claiborne and Talbot’s
(Datamonitor, 2008; Kapner, 2009).
New: Brand Marketer via Licensing and Exclusive Brands: Global Brands Group
In 2014, L&F announced plans to spin-off its Global Brands Group (GBG) into a separate company.
GBG is primarily from the distribution group and sales were approximately $3.3 billion in 2013 (Li &
Fung Ltd., 2014b). This group represents operations related to “brand marketing” and includes sales from
licenses and controlled brands.
Related to the GBG was a shift for the company to "on-shoring." Instead of sending container-loads of
products to the U.S. from China as an exporter, the company opens a base in the U.S. and becomes an
importer instead. This has the advantage of allowing Li & Fung to be geographically closer to its
customers (Telegraph, 2008). As part of this movement, Li & Fung has also been buying and licensing
brands to increase market share and expand skills and services. In 2004, L&F established a U.S. licensing
agreement for the Levi Strauss Signature label for tops (Abernathy, Volpe, & Weil, 2006; Datamonitor,
2008). In 2005, L&F acquired Briefly Stated Holdings (U.S.), an apparel group with a portfolio of over
40 character brand licenses and Young Stuff Apparel, an apparel group focused on supplying private label
products to mass-market retailers. In 2006 and 2007, Li & Fung acquired Oxford Womenswear Group
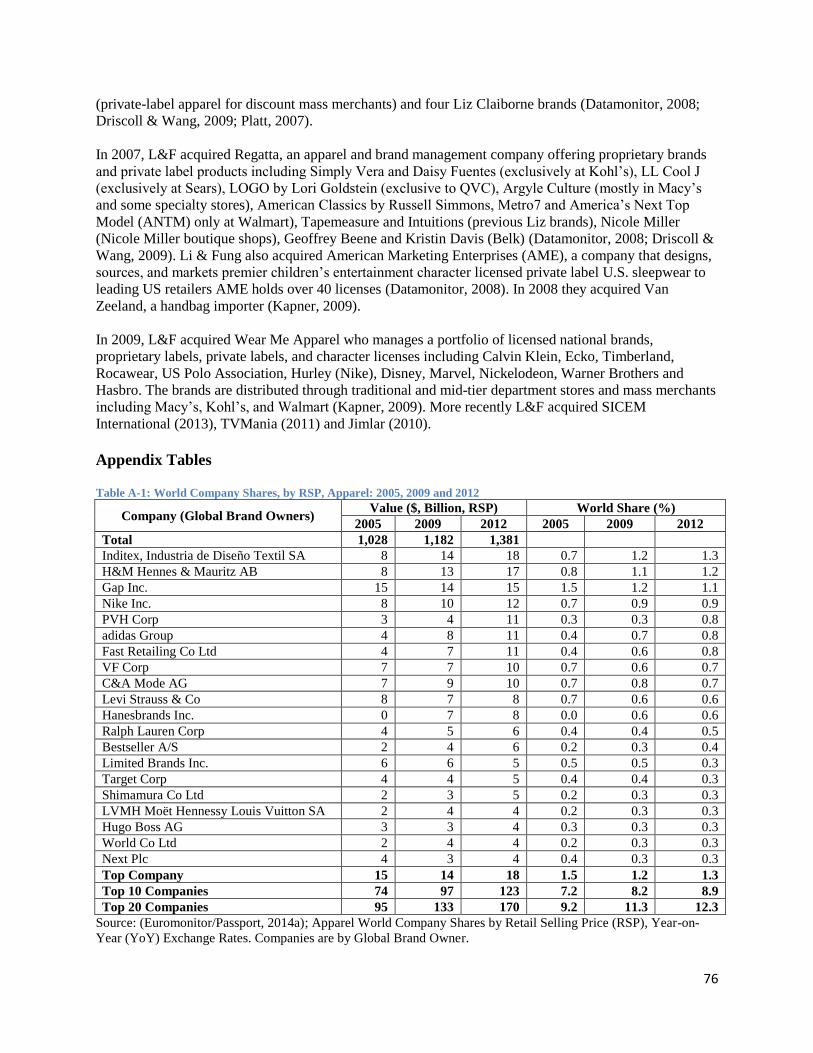
76
(private-label apparel for discount mass merchants) and four Liz Claiborne brands (Datamonitor, 2008;
Driscoll & Wang, 2009; Platt, 2007).
In 2007, L&F acquired Regatta, an apparel and brand management company offering proprietary brands
and private label products including Simply Vera and Daisy Fuentes (exclusively at Kohl’s), LL Cool J
(exclusively at Sears), LOGO by Lori Goldstein (exclusive to QVC), Argyle Culture (mostly in Macy’s
and some specialty stores), American Classics by Russell Simmons, Metro7 and America’s Next Top
Model (ANTM) only at Walmart), Tapemeasure and Intuitions (previous Liz brands), Nicole Miller
(Nicole Miller boutique shops), Geoffrey Beene and Kristin Davis (Belk) (Datamonitor, 2008; Driscoll &
Wang, 2009). Li & Fung also acquired American Marketing Enterprises (AME), a company that designs,
sources, and markets premier children’s entertainment character licensed private label U.S. sleepwear to
leading US retailers AME holds over 40 licenses (Datamonitor, 2008). In 2008 they acquired Van
Zeeland, a handbag importer (Kapner, 2009).
In 2009, L&F acquired Wear Me Apparel who manages a portfolio of licensed national brands,
proprietary labels, private labels, and character licenses including Calvin Klein, Ecko, Timberland,
Rocawear, US Polo Association, Hurley (Nike), Disney, Marvel, Nickelodeon, Warner Brothers and
Hasbro. The brands are distributed through traditional and mid-tier department stores and mass merchants
including Macy’s, Kohl’s, and Walmart (Kapner, 2009). More recently L&F acquired SICEM
International (2013), TVMania (2011) and Jimlar (2010).
Appendix Tables Table A-1: World Company Shares, by RSP, Apparel: 2005, 2009 and 2012
Company (Global Brand Owners) Value ($, Billion, RSP) World Share (%)
2005 2009 2012 2005 2009 2012
Total 1,028 1,182 1,381
Inditex, Industria de Diseño Textil SA 8 14 18 0.7 1.2 1.3
H&M Hennes & Mauritz AB 8 13 17 0.8 1.1 1.2
Gap Inc. 15 14 15 1.5 1.2 1.1
Nike Inc. 8 10 12 0.7 0.9 0.9
PVH Corp 3 4 11 0.3 0.3 0.8
adidas Group 4 8 11 0.4 0.7 0.8
Fast Retailing Co Ltd 4 7 11 0.4 0.6 0.8
VF Corp 7 7 10 0.7 0.6 0.7
C&A Mode AG 7 9 10 0.7 0.8 0.7
Levi Strauss & Co 8 7 8 0.7 0.6 0.6
Hanesbrands Inc. 0 7 8 0.0 0.6 0.6
Ralph Lauren Corp 4 5 6 0.4 0.4 0.5
Bestseller A/S 2 4 6 0.2 0.3 0.4
Limited Brands Inc. 6 6 5 0.5 0.5 0.3
Target Corp 4 4 5 0.4 0.4 0.3
Shimamura Co Ltd 2 3 5 0.2 0.3 0.3
LVMH Moët Hennessy Louis Vuitton SA 2 4 4 0.2 0.3 0.3
Hugo Boss AG 3 3 4 0.3 0.3 0.3
World Co Ltd 2 4 4 0.2 0.3 0.3
Next Plc 4 3 4 0.4 0.3 0.3
Top Company 15 14 18 1.5 1.2 1.3
Top 10 Companies 74 97 123 7.2 8.2 8.9
Top 20 Companies 95 133 170 9.2 11.3 12.3
Source: (Euromonitor/Passport, 2014a); Apparel World Company Shares by Retail Selling Price (RSP), Year-on-
Year (YoY) Exchange Rates. Companies are by Global Brand Owner.
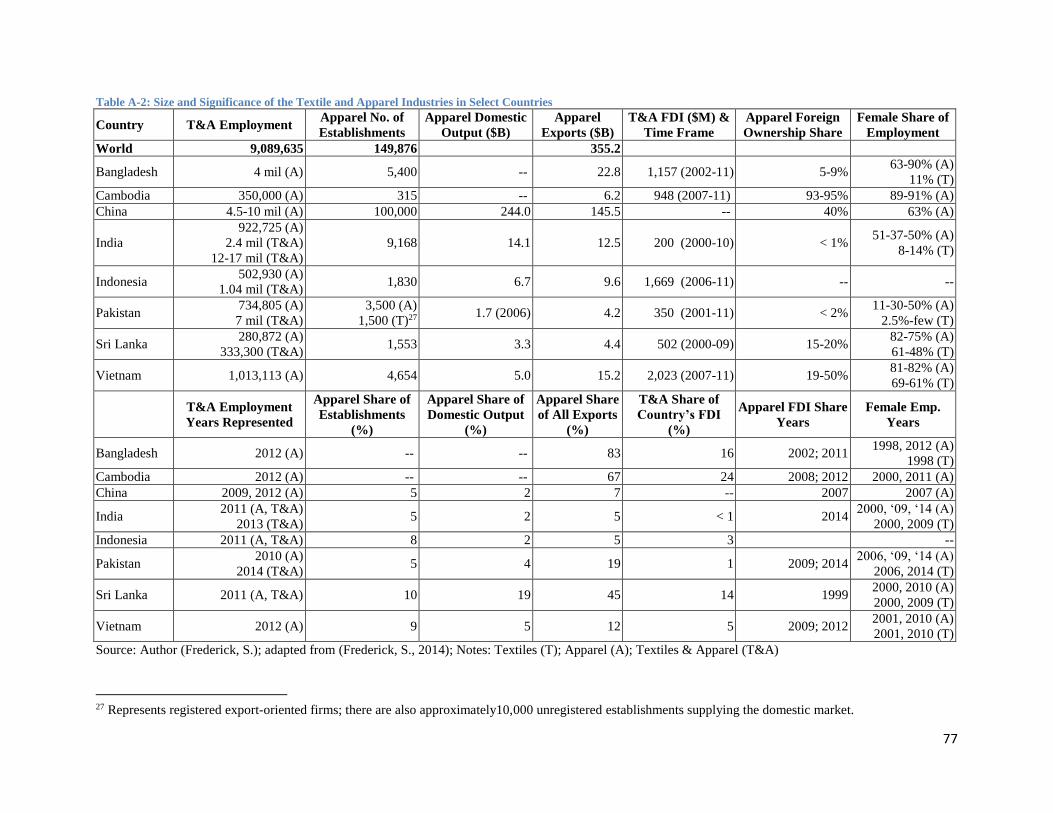
77
Table A-2: Size and Significance of the Textile and Apparel Industries in Select Countries
Country T&A Employment Apparel No. of
Establishments
Apparel Domestic
Output ($B)
Apparel
Exports ($B)
T&A FDI ($M) &
Time Frame
Apparel Foreign
Ownership Share
Female Share of
Employment
World 9,089,635 149,876 355.2
Bangladesh 4 mil (A) 5,400 -- 22.8 1,157 (2002-11) 5-9% 63-90% (A)
11% (T)
Cambodia 350,000 (A) 315 -- 6.2 948 (2007-11) 93-95% 89-91% (A)
China 4.5-10 mil (A) 100,000 244.0 145.5 -- 40% 63% (A)
India
922,725 (A)
2.4 mil (T&A)
12-17 mil (T&A)
9,168 14.1 12.5 200 (2000-10) < 1% 51-37-50% (A)
8-14% (T)
Indonesia 502,930 (A)
1.04 mil (T&A) 1,830 6.7 9.6 1,669 (2006-11) -- --
Pakistan 734,805 (A)
7 mil (T&A)
3,500 (A)
1,500 (T)27 1.7 (2006) 4.2 350 (2001-11) < 2%
11-30-50% (A)
2.5%-few (T)
Sri Lanka 280,872 (A)
333,300 (T&A) 1,553 3.3 4.4 502 (2000-09) 15-20%
82-75% (A)
61-48% (T)
Vietnam 1,013,113 (A) 4,654 5.0 15.2 2,023 (2007-11) 19-50% 81-82% (A)
69-61% (T)
T&A Employment
Years Represented
Apparel Share of
Establishments
(%)
Apparel Share of
Domestic Output
(%)
Apparel Share
of All Exports
(%)
T&A Share of
Country’s FDI
(%)
Apparel FDI Share
Years
Female Emp.
Years
Bangladesh 2012 (A) -- -- 83 16 2002; 2011 1998, 2012 (A)
1998 (T)
Cambodia 2012 (A) -- -- 67 24 2008; 2012 2000, 2011 (A)
China 2009, 2012 (A) 5 2 7 -- 2007 2007 (A)
India 2011 (A, T&A)
2013 (T&A) 5 2 5 < 1 2014
2000, ‘09, ‘14 (A)
2000, 2009 (T)
Indonesia 2011 (A, T&A) 8 2 5 3 --
Pakistan 2010 (A)
2014 (T&A) 5 4 19 1 2009; 2014
2006, ‘09, ‘14 (A)
2006, 2014 (T)
Sri Lanka 2011 (A, T&A) 10 19 45 14 1999 2000, 2010 (A)
2000, 2009 (T)
Vietnam 2012 (A) 9 5 12 5 2009; 2012 2001, 2010 (A)
2001, 2010 (T)
Source: Author (Frederick, S.); adapted from (Frederick, S., 2014); Notes: Textiles (T); Apparel (A); Textiles & Apparel (T&A)
27 Represents registered export-oriented firms; there are also approximately10,000 unregistered establishments supplying the domestic market.
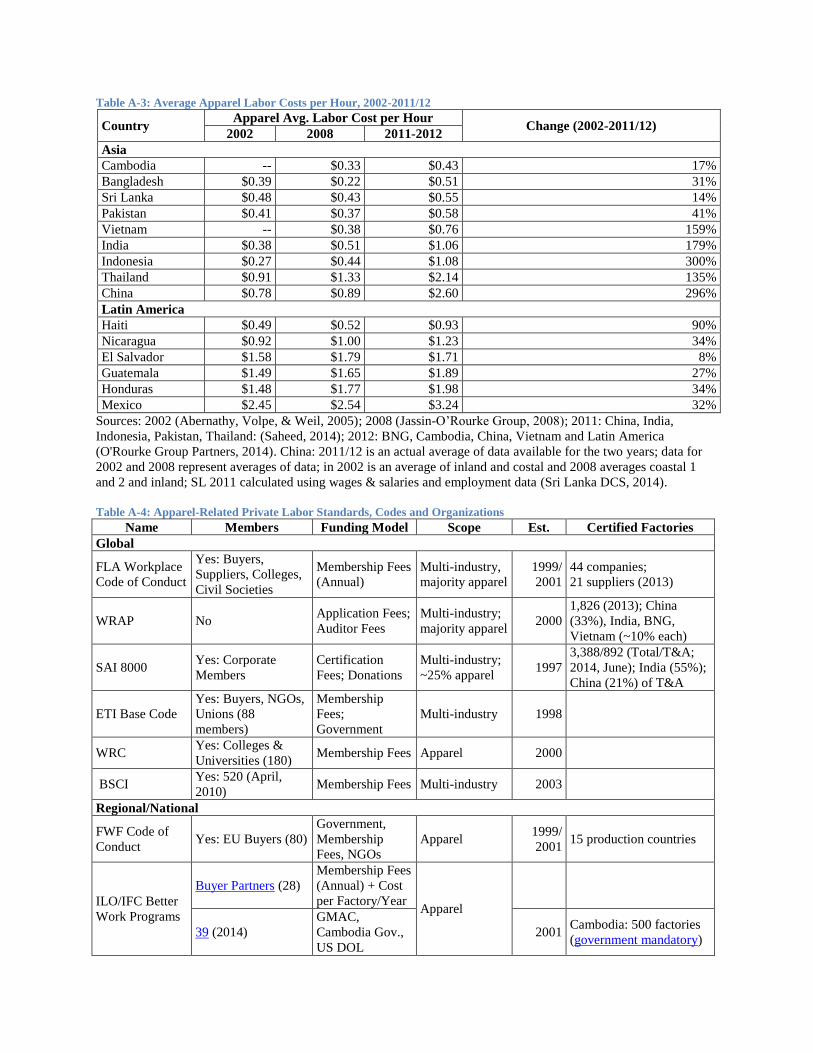
Table A-3: Average Apparel Labor Costs per Hour, 2002-2011/12
Country Apparel Avg. Labor Cost per Hour
Change (2002-2011/12) 2002 2008 2011-2012
Asia
Cambodia -- $0.33 $0.43 17%
Bangladesh $0.39 $0.22 $0.51 31%
Sri Lanka $0.48 $0.43 $0.55 14%
Pakistan $0.41 $0.37 $0.58 41%
Vietnam -- $0.38 $0.76 159%
India $0.38 $0.51 $1.06 179%
Indonesia $0.27 $0.44 $1.08 300%
Thailand $0.91 $1.33 $2.14 135%
China $0.78 $0.89 $2.60 296%
Latin America
Haiti $0.49 $0.52 $0.93 90%
Nicaragua $0.92 $1.00 $1.23 34%
El Salvador $1.58 $1.79 $1.71 8%
Guatemala $1.49 $1.65 $1.89 27%
Honduras $1.48 $1.77 $1.98 34%
Mexico $2.45 $2.54 $3.24 32%
Sources: 2002 (Abernathy, Volpe, & Weil, 2005); 2008 (Jassin-O’Rourke Group, 2008); 2011: China, India,
Indonesia, Pakistan, Thailand: (Saheed, 2014); 2012: BNG, Cambodia, China, Vietnam and Latin America
(O'Rourke Group Partners, 2014). China: 2011/12 is an actual average of data available for the two years; data for
2002 and 2008 represent averages of data; in 2002 is an average of inland and costal and 2008 averages coastal 1
and 2 and inland; SL 2011 calculated using wages & salaries and employment data (Sri Lanka DCS, 2014).
Table A-4: Apparel-Related Private Labor Standards, Codes and Organizations
Name Members Funding Model Scope Est. Certified Factories
Global
FLA Workplace
Code of Conduct
Yes: Buyers,
Suppliers, Colleges,
Civil Societies
Membership Fees
(Annual)
Multi-industry,
majority apparel
1999/
2001
44 companies;
21 suppliers (2013)
WRAP No Application Fees;
Auditor Fees
Multi-industry;
majority apparel 2000
1,826 (2013); China
(33%), India, BNG,
Vietnam (~10% each)
SAI 8000 Yes: Corporate
Members
Certification
Fees; Donations
Multi-industry;
~25% apparel 1997
3,388/892 (Total/T&A;
2014, June); India (55%);
China (21%) of T&A
ETI Base Code
Yes: Buyers, NGOs,
Unions (88
members)
Membership
Fees;
Government
Multi-industry 1998
WRC Yes: Colleges &
Universities (180) Membership Fees Apparel 2000
BSCI Yes: 520 (April,
2010) Membership Fees Multi-industry 2003
Regional/National
FWF Code of
Conduct Yes: EU Buyers (80)
Government,
Membership
Fees, NGOs
Apparel 1999/
2001 15 production countries
ILO/IFC Better
Work Programs
Buyer Partners (28)
Membership Fees
(Annual) + Cost
per Factory/Year Apparel
39 (2014)
GMAC,
Cambodia Gov.,
US DOL
2001 Cambodia: 500 factories
(government mandatory)
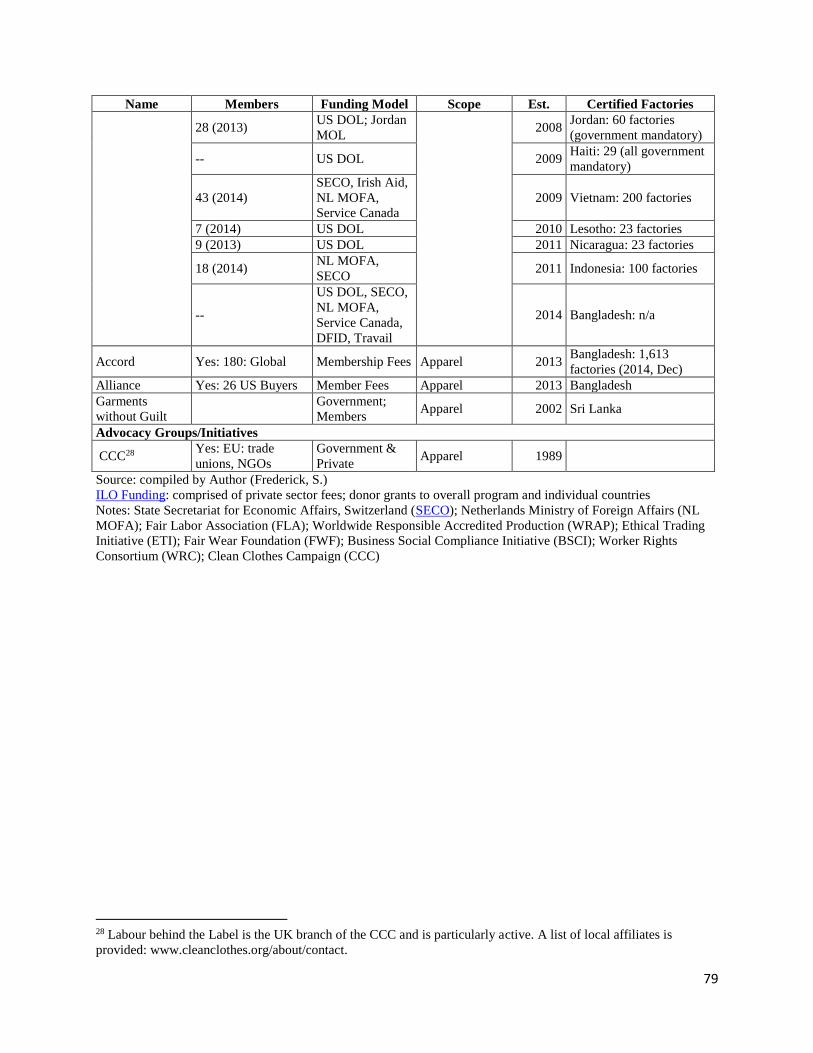
79
Name Members Funding Model Scope Est. Certified Factories
28 (2013) US DOL; Jordan
MOL 2008
Jordan: 60 factories
(government mandatory)
-- US DOL 2009 Haiti: 29 (all government
mandatory)
43 (2014)
SECO, Irish Aid,
NL MOFA,
Service Canada
2009 Vietnam: 200 factories
7 (2014) US DOL 2010 Lesotho: 23 factories
9 (2013) US DOL 2011 Nicaragua: 23 factories
18 (2014) NL MOFA,
SECO 2011 Indonesia: 100 factories
--
US DOL, SECO,
NL MOFA,
Service Canada,
DFID, Travail
2014 Bangladesh: n/a
Accord Yes: 180: Global Membership Fees Apparel 2013 Bangladesh: 1,613
factories (2014, Dec)
Alliance Yes: 26 US Buyers Member Fees Apparel 2013 Bangladesh
Garments
without Guilt
Government;
Members Apparel 2002 Sri Lanka
Advocacy Groups/Initiatives
CCC28 Yes: EU: trade
unions, NGOs
Government &
Private Apparel 1989
Source: compiled by Author (Frederick, S.)
ILO Funding: comprised of private sector fees; donor grants to overall program and individual countries
Notes: State Secretariat for Economic Affairs, Switzerland (SECO); Netherlands Ministry of Foreign Affairs (NL
MOFA); Fair Labor Association (FLA); Worldwide Responsible Accredited Production (WRAP); Ethical Trading
Initiative (ETI); Fair Wear Foundation (FWF); Business Social Compliance Initiative (BSCI); Worker Rights
Consortium (WRC); Clean Clothes Campaign (CCC)
28 Labour behind the Label is the UK branch of the CCC and is particularly active. A list of local affiliates is
provided: www.cleanclothes.org/about/contact.