faculty.bemidjistate.edufaculty.bemidjistate.edu/grichgels/projects/2017 probabili… · web...
TRANSCRIPT

Probability Unit For Grades 5 and 6
Julie Cook - Century Middle School, Park Rapids, [email protected]
Gabe Sturtz - Century Middle School, Park Rapids, MN
Alison Tisdell - Northern Elementary, Bemidji, [email protected]
Amy Zimmerman – St. Philips, Bemidji [email protected]
Executive Summary:Unit Goal: Students will work with a variety of manipulatives and in a number of situations to practice, explore, and understand many different examples of probability. Students will be introduced to various probability terms and will be able to apply them to their everyday lives. Students will start to build a broader knowledge of the importance of understanding why probability is important. They will do this by completing tasks that allow them the chance to figure out if activities are fair or unfair. Some of the lessons included in this unit will take different amounts of time, or would be better used as interventions rather than whole group activities. It is all dependent upon the level of your students.Teaching Strategies: Students will work as individuals, in small groups and as a whole class to discover and explore how probability can be used in the world around us.
Minnesota Standards:Use probabilities to solve real-world and mathematical problems; represent probabilities using fractions, decimals and percents. 6.4.1.1 Determine the sample space (set of possible outcomes) for a given experiment and determine which members of the sample space are related to certain events. Sample space may be determined by the use of tree diagrams, tables or pictorial representations. 6.4.1.2 Determine the probability of an event using the ratio between the size of the event and the size of the sample space; represent probabilities as percents, fractions and decimals between 0 and 1 inclusive. Understand that probabilities measure likelihood. ▲6.4.1.3 Perform experiments for situations in which the probabilities are known, compare the resulting relative frequencies with the known probabilities; know that there may be differences. 6.4.1.4 Calculate experimental probabilities from experiments; represent them as percents, fractions and decimals between 0 and 1 inclusive. Use experimental probabilities to make predictions when actual probabilities are unknown .
NCTM Standards:
Grades 3–5 Expectations: In grades 3–5 each and every student should– describe events as likely or unlikely and discuss the degree of likelihood using
such words as certain, equally likely, and impossible;
predict the probability of outcomes of simple experiments and test the predictions;
understand that the measure of the likelihood of an event can be represented by a number from 0 to 1.
Grades 6–8 Expectations: In grades 6–8 each and every student should– understand and use appropriate terminology to describe complementary and
mutually exclusive events; use proportionality and a basic understanding of probability to make and
test conjectures about the results of experiments and simulations; compute probabilities for simple compound events, using such methods as
organized lists, tree diagrams, and area models.

Table of ContentsPre-test Color by Number Day 1- Roll The DiceDay 2- Number TilesDay 3- Playing CardsDay 4- Colored CubesDay 5- SpinnersDay 6-Trash Can TossDay 7- Here’s the ScoopDay 8- The Fab FiveDay 9- Flipping Two CoinsDay 10- Rock, Paper, Scissors - 2 playerDay 11- Rock, Paper, Scissors - 3 player and class tournamentDay 12- Maze (Day 1)Day 13- Maze (Day 2)Day 14- Scoring Options Game w/ Spinners (Day 1)Day 15- Scoring Options Game w/ Spinners (Day 2)Day 16- Mystery Candy GameDay 17- Probability Scavenger Hunt (Day 1)Day 18- Probability Scavenger Hunt (Day 2)Day 19- Balancing on One Foot (Day 1)Day 20- Balancing on One Foot (Day 2)Day 21 - Post-test Color by Number

Pre-test and Posttest will be a color by number. In this activity students will solve 20 problems that require them to find the probabilities, decide if events are likely, as likely as not, or unlikely. They will find the theoretical probabilities of events, and will express probabilities mostly as fractions. Students will find the number of possible outcomes in a sample space. Students then find the answer number on the coloring page and color it with the color indicated in the box for that problem. The pre and posttest are found at https://www.teacherspayteachers.com/Product/Probability-Color-by-Number-2096136.

Activity 1: Roll the Dicehttps://www.teacherspayteachers.com/Product/Probability-Stations-
1183489Launch:Break students into groups of 3-5. Have one set of materials for each group. Tell students they will be working through a variety of lesson throughout the next 6 days that cover some important probability items. Have students double check their list of materials needed and the materials they were given to ensure they have everything they need. Students need to make some observations about the pair of dice they were given. What are some things they notice about the dice? Explore:Read through the instructions on the instruction card with students. Instructions:· Completes Tasks 1 and 2 on the recording sheets.· Use the dice to help you determine the probability of each outcome.· If you have times left, test your theories by rolling the dice and recording your results.Students will use the recording sheets to makes lists of all of the possible outcomes when rolling just one die. They will also find the probability of each number on the die. They will use terms like more likely, equally likely, and less likely to determine certain numbers on the die. Students will then conduct a test to see if their predictions are correct. They will roll one die 36 times and record their data in the chart provided. Once they have completed the questions they will move into task 2 of this activity. In task 2 students will practice making lists of possible outcomes when they roll 2 dice. They will find all combinations that they can get when they roll both dice. Students will record their data in a chart they create on their own for this activity. Share:Once students have completed both tasks they will record their data on the board for the rest of the class to look at. We will then start a discussion about the probability of rolling certain things on one die and what the difference is when we roll both dice. Students should come up with similar solutions.Summarize:Students will start to learn some of the vocabulary that goes with the probability unit. They will be able to create charts and lists of their possible outcomes. The goal for this activity was to get students thinking about the terms they will see throughout this unit.
Activity 2: Number Tiles

https://www.teacherspayteachers.com/Product/Probability-Stations-1183489
Launch:Break students into groups of 3-5. Have one set of materials for each group. Tell students they will be working through a variety of lessons throughout the next 6 days that cover some important probability items. Have students double check their list of materials needed and the materials they were given to ensure they have everything they need. Students need to make some observations about the bag of number tiles they were given. What are some things they notice about the tiles? Explore:Read through the instructions on the instruction card with students. Instructions:· Follow the instructions to complete each task on your recording sheet.· Use the number tiles in the bag to help you.· You may take all the tiles out of the bag to help you determine probability.Students will start this activity by thinking about what the outcomes could be from this activity. They will answer questions like the following:· If you reach into the bag and choose 1 tile, what will it most likely be? Why?· What is the probability of choosing a 7?· What is the probability of choosing a 4?Once they have finished answering these questions they will make a prediction for the following question:· If you were to choose tiles from the bag 40 times, how many of each number would you draw? Why?After their prediction is written in pen they can start to test it out! They need to record their finding in the chart given on the recording sheet. Once they have all of their trials done they need to answer the questions about their data. Share:Students will put their data up on the board for the class to analyze. Students will answer questions their classmates have about the data they show. We will then start a discussion about the probability of drawing certain numbers from the bag. Students should come up with similar solutions.Summarize:Students will start to learn some of the vocabulary that goes with the probability unit. They will be able to create charts and lists of their possible outcomes. The goal for this activity was to get students thinking about the terms they will see throughout this unit and continue practicing theoretical probability.
Activity 3: Playing Cards

https://www.teacherspayteachers.com/Product/Probability-Stations-1183489
Launch:Break students into groups of 3-5. Have one set of materials for each group. Tell students they will be working through a variety of lessons throughout the next 6 days that cover some important probability items. Have students double check their list of materials needed and the materials they were given to ensure they have everything they need. Students need to make some observations about the deck of cards they were given. What are some things they notice about the cards?Explore:Read through the instructions on the instruction card with students. Instructions:· Follow the instructions to complete each task on your recording sheet.· Use the playing cards and the information card to help you.Students will start this activity by thinking about what the outcomes could be from this activity. They will answer questions like the following:· What is the probability of drawing a red card?· What is the probability of drawing a 6?· What is the probability of drawing a spade?Once they have finished answering these questions they will make a prediction for the following question:· If you were to draw 24 cards, putting them back into the deck each time, how many of each color would you draw? Why?After their prediction is written in pen they can start to test it out! They need to record their finding in the chart given on the recording sheet. Once they have all of their trials done they need to answer the questions about their data. Share:Students will put their data up on the board for the class to analyze. Students will answer questions their classmates have about the data they show. We will then start a discussion about the probability of drawing certain numbers, colors, etc. from the deck of cards. Students should come up with similar solutions.Summarize:Students will start to learn some of the vocabulary that goes with the probability unit. They will be able to create charts and lists of their possible outcomes. The goal for this activity was to get students thinking about the terms they will see throughout this unit and continue practicing theoretical probability.
Activity 4: Colored Cubes

https://www.teacherspayteachers.com/Product/Probability-Stations-1183489
Launch:Break students into groups of 3-5. Have one set of materials for each group. Tell students they will be working through a variety of lessons throughout the next 6 days that cover some important probability items. Have students double check their list of materials needed and the materials they were given to ensure they have everything they need. Students need to make some observations about the bag of colored cubes they were given. What are some things they notice about the cubes? Explore:Read through the instructions on the instruction card with students. Instructions:· Follow the instructions to complete each task on your recording sheet.· You may take all the cubes out of the bag to help you determine probability.Students will start this activity by thinking about what the outcomes could be from this activity. They will answer questions like the following:· If you reach into the bag and choose 1 cube, what color is it most likely to be? Why?· What color is least likely to be drawn?· What is the probability of drawing a cube that is not yellow?Once they have finished answering these questions they will make a prediction for the following question:· If you were to randomly draw a cube from the bag 20 times, what color would you draw most often? Why?· What color would you draw least often?After their prediction is written in pen they can start to test it out! They need to record their finding in the chart given on the recording sheet. Once they have all of their trials done they need to answer the questions about their data. Share:Students will put their data up on the board for the class to analyze. Students will answer questions their classmates have about the data they show. We will then start a discussion about the probability of drawing certain colors from the bag. Students should come up with similar solutions.Summarize:Students will start to learn some of the vocabulary that goes with the probability unit. They will be able to create charts and lists of their possible outcomes. The goal for this activity was to get students thinking about the terms they will see throughout this unit and continue practicing theoretical probability.
Activity 5: Spinners

https://www.teacherspayteachers.com/Product/Probability-Stations-1183489
Launch:Break students into groups of 3-5. Have one set of materials for each group. Tell students they will be working through a variety of lessons throughout the next 6 days that cover some important probability items. Have students double check their list of materials needed and the materials they were given to ensure they have everything they need. Students need to make some observations about the spinners they were given. What are some things they notice about the spinners? Explore:Read through the instructions on the instruction card with students. Instructions:· Follow the instructions to complete each task on your recording sheet.· Be sure you are using the correct spinner number for each question!Students will start this activity by thinking about what the outcomes could be from this activity. They will answer questions like the following:· On Spinner 1, what is the probability of spinning any of the colors?· On spinner 2, what is the probability of spinning blue? Red? Green? Purple?· On which 2 spinners is your probability of spinning green equal?Once they have finished answering these questions they will make a prediction for the following question:· Choose a spinner to use. Each group member should choose a different spinner. · If you were to spin 12 times, how many of each color do you predict you will spin? Why?After their prediction is written in pen they can start to test it out! They need to record their finding in the chart given on the recording sheet. Once they have all of their trials done they need to answer the questions about their data. Share:Students will put their data up on the board for the class to analyze. Students will answer questions their classmates have about the data they show. We will then start a discussion about the probability of spinning certain colors on each spinner. Students should come up with similar solutions.Summarize:Students will start to learn some of the vocabulary that goes with the probability unit. They will be able to create charts and lists of their possible outcomes. The goal for this activity was to get students thinking about the terms they will see throughout this unit and continue practicing theoretical probability.
Activity 6: Trash Can Toss

https://www.teacherspayteachers.com/Product/Probability-Stations-1183489
Launch:Break students into groups of 3-5. Have one set of materials for each group. Tell students they will be working through a variety of lessons throughout the next 6 days that cover some important probability items. Have students double check their list of materials needed and the materials they were given to ensure they have everything they need. Students need to make some observations about the small softball and trash can they were given. What are some things they notice about these two things? Explore:Read through the instructions on the instruction card with students. Instructions:· Follow the instructions to complete each task on your recording sheet.· Watch where you are throwing.· Be sure to clean up any messes you make!Students will start this activity by thinking about what the outcomes could be from this activity. They will make predictions like:· If you were to throw the ball at the trash can 15 times, how many times would you make the basket?· Use this number to determine your probable accuracy rate. __ of 15.· How did you make this prediction?After they have made this set of predictions they will test it out. Once they have recorded their data for this first part they will answers the questions that go with their first prediction.Students need to make a revised prediction once they have answered the questions about their first prediction. · Based on your results, if you were to throw the ball 30 times, how many baskets do you think you would make?· Write this as a prediction of probability.· How did you make this prediction?After their prediction is written in pen they can start to test it out! They need to record their finding in the chart given on the recording sheet. Once they have all of their trials done they need to answer the questions about their data. Share:Students will put their data up on the board for the class to analyze. Students will answer questions their classmates have about the data they show. We will then start a discussion about the probability of making a basket in the trash can. Students should come up with similar solutions.Summarize:Students will start to learn some of the vocabulary that goes with the probability unit. They will be able to create charts and lists of their possible outcomes. The goal for this activity was to get students thinking about the terms they will see throughout this unit and continue practicing theoretical probability.
Activity 7: Here’s the Scoop

Launch:Read the following scenero to the students.It’s a hot day, and you’re thinking it would be nice to have an ice cream cone. Then, what do you see? Dippity Dan’s Ice Cream Parlor and Game Emporium. You order a triple-scoop cone made with chocolate, strawberry, and vanilla ice cream.“Excellent,” says Dippity Dan. “If you can tell me what the probability is that I will arrange the scoops in the order you like to eat them, the cone is free.Explore:Students will work with a partner use the print out included to create ice cones that show all the possible order of scoops. They will need multiple (at least 6 sheets per group) available to create the possible order. Share:Once students have determined the probability, they will record their data on the board for the rest of the class to look view. We will then start a discussion about the how they determined all the different orders. Also extend with determining how many triple-scoop cones can be made if we repeat flavors such as one scoop strawberry and two scoops chocolate.Summarize:Students will think about sample size. Once sample size is determined, students will be able to determine the probability of that outcome. The use of manipulatives will help students determine sample size concretely.
Activity 8: The Fab Five
Launch:Read the following scenario to the students.It is time for the rock ‘n’ roll quintet, the Fab Five, to have their photo taken for the newest CD cover. The leader of the band tells the photographer, “Hey, let’s get started! I want to see every possible arrangement of the group before I decide on the final cover shot.”Explore:Students will work in groups to determine all the possible arrangements the band members can be arranged if they are standing shoulder to shoulder. Students will be encouraged to use drawings, different colored blocks, or other manipulatives to help them determine the sample space. Share:Once students have determined the sample size, they will record their data on the board for the rest of the class to look view. We will then start a discussion about the how they determined all the different orders. Students will start to think about whether or not there a mathematical way to determine the sample sizeSummarize:Students will think about sample size larger than three items. They will also start determining if a mathematical approach is possible or if using manipulatives, drawings, or list making is the only way.
Activity 9 – Flipping Two Coins

Math Trailblazers: Grade 5 - Kendall/Hunt PublishingLaunch :
As a group discuss possible outcomes of flipping a coin. Discuss what could happen if you flip two coins. Tell the class that today they will play a game and will do an experimentto explore what can happen when you flip two coins.Explore:
Split the class into groups of three. One person is the 0-Heads player, the second is the 1-Heads player, and the third is the 2-Heads player. Each group will need two coins and a How Many Heads? table like the one below.
Player Points
Tallies Total
0-Heads Player
1-Head Player
2- Heads Player
Rules: Flip 2 coins.If 0 heads show, then the 0-Heads player gets a point.If 1 heads show, then the 1-Heads player gets a point.If 2 heads show, then the 2-Heads player gets a point.The first player to score 10 points is the winner.As students finish have students have them discuss these questions in their group.
1. If you could play the game again, which player would you choose to be and why?
2. Mathematicians say that a game is fair if all players have an equal chance of winning. Tell whether this is a mathematically fair game and why or why not.
After students have played the game and reported data to the teacher they should do part two of the activity, an experiment of flipping two coins. In this experiment each group will flip two coins, a penny and a nickel, 100 times. For each time they flip two coins, they will count how many heads show. Before they conduct the experiment the groups should predict how many times each number of heads will show in their 100 trials. They should put their predictions in a table similar to this.
Number of Heads Predicted Number of Trials
0
1
2
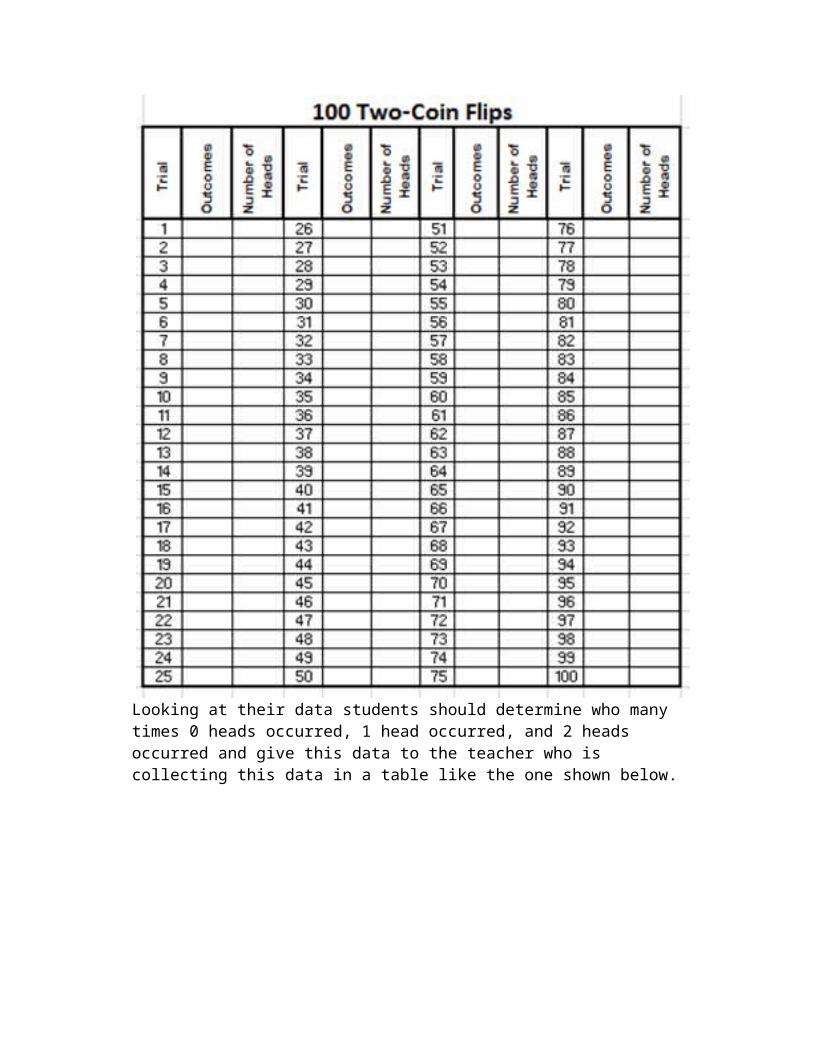
After making their predictions students should flip the penny and the nickel 100 times, recording each trial. Write the outcome of the penny first and the nickel second. For example, it you got a tails on the penny and a heads on the nickel it would be recorded as a TH in the outcome column, writing a 1 in the number of heads column since only the nickel showed a heads. This data should be recorded on their 100 Two-Coin Flips worksheet, shown below.
Looking at their data students should determine who many times 0 heads occurred, 1 head occurred, and 2 heads occurred and give this data to the teacher who is collecting this data in a table like the one shown below.

Share:
After completing the experiment and looking over the class data have students discuss these the following questions within their groups and as a large group.
1. How is the data from each “number of heads” similar?2. How does the data for each “number of heads” differ?3. What are the possible outcomes when you flip 2 coins? List them.4. How many ways can 0 heads come up? List the way(s).5. How many ways can 1 heads come up? List the way(s).6. How many ways can 2 heads come up? List the way(s).7. Do the results of your experiment match your predictions made earlier?
Why or why not?8. After seeing the entire class’ Two-Coin Flip data, if you could play the How
Many Heads game again, which player would you choose to be and why?After a few minutes of discussing it within the group, have students share what they found and why they determined their answers.
Summarize :
Knowing the number of ways the coins can land can help us understand why the game and experiment turned out the way they did. Knowing probability can help you determine how often we can expect an event to occur when an experiment is repeated many times.
Activity 10 – Rock, Paper, ScissorsDigitalLessons.com – Statistics, Data Analysis, and Probability Activities
Launch:Introduce the lesson by giving students examples of situations (like who gets the last piece of pizza, who gets to ride in the front seat, etc.) that require a decision to be made. Ask students how they make decisions. Lead them into a discussion of Rock, Paper, Scissors (RPS) as a method of making decisions that some people use. Ask students to give examples of where they’ve used RPS. Tell the students that we will be playing and analyzing the game of RPS. As a large group discuss the rules and how a person wins playing RPS.Explore:Day 1: In groups of three students should work together to list out the possible outcomes of playing RPS. Fill this out on the worksheet given. As a group try to determine the theoretical probability of player A winning, player B winning, and of a tie.Students should then split into groups of two and play 30 (or more) rounds of RPS, keeping track of how many times player A wins, player B wins, and of the ties. When done playing their 30 (or more) games, students should report their data to the teacher. In their groups of students should see if they can determine the experimental probability for each person winning as well as a tie.Day 2: Today we are going to explore a three-person game of RPS. New rules for winning RPS for the three-person version.
Player A wins if all three players have the same sign. Player B wins if all three players have different signs. Player C wins if two players have the same sign.
In groups of three play RPS using the new rules and keep track of how many times each person wins. Share that data with the teacher.Share:As a large group discuss the results. Why would this have happened? Working in small groups the students should list out the possible outcomes when a three-person version of RPS is played and see if they can find the theoretical probability of each player winning. Share these with the class. Discuss if this game is fair. Again, in the small groups see if groups can come up with a way to make the game fair.Summarize : Students will come back together to discuss why the first game was fair and to answer any questions that remain. To finish out the lesson the class will have RPS tournament.

Activity 11: The Maze (Day 1)Objective: 6.4.1.2 Determine the probability of an event using the ratio between the size of the event and the size of the sample space; represent probabilities as percents, fractions and decimals between 0 and 1 inclusive. Understand that probabilities measure likelihood.
Launch:Read the following scenario to the students.Mr. Sturtz is going to make you a deal: if you can find the hidden path leading to the prize, you will not have to do homework for today. If you cannot find the hidden path, this class must take out Mr. Sturtz’s trash for the rest of the week. Explore:Students, in their groups of 3 or 4, will be given this following diagram:
Directions to students: You must find all the possible paths you are able to take. You must start on the top yellow, from there you can go to either red or light blue, then depending on which path you took, you can only go to a 3rd row color that is touching the color you are currently on. Example:

Explain to the students how you can take this path because all the colors you chose are touching each other. You would not be able to go from red to purple because purple is too far away from red.
Students need to figure out how many different paths are possible. From there, they need to figure out the probability of them finding the prize on their first time walking the maze. Have them find all the paths, then tell them which color is holding the prize. Share:Give groups enough time to collect their probabilities, and then have them record their findings up on the board for others to see. If there are different answers, have students discuss how they found the numbers they did until there is consensus for our final answer.Summarize:To exit the classroom, students must write on an exit slip if they would take this challenge or if they would rather just do the homework. Students must explain why by using the probability we found as a class.

Activity 11: The Maze (Day 2)Objective: 6.4.1.2 Determine the probability of an event using the ratio between the size of the event and the size of the sample space; represent probabilities as percents, fractions and decimals between 0 and 1 inclusive. Understand that probabilities measure likelihood.
Launch:Review the deal that was presented to students yesterday. Go through the probability that was concluded by the class, and go through some exit slip responses.Explore:Students, in their groups of 3 or 4, will be given this following diagram:
Directions to students: You must find all the possible paths you are able to take. You must start on the top yellow, from there you can go to either red or light blue, then you can go to any color on the third row, and then any color on the fourth row. Example:
Explain to the students how you can take this path today, so it is different than yesterday.
Students need to figure out how many different paths are possible. From there, they need to figure out the probability of them finding the prize on their first time walking the maze. Have them find all the paths, then tell them which color is holding the prize. Share:Give groups enough time to collect their probabilities, and then have them record their findings up on the board for others to see. If there are different answers, have students discuss how they found the numbers they did until there is consensus for our final answer.
Have students explain how this is different from yesterday. Have students discuss which maze would be the better deal to take, yesterday’s or today’s?
**Important Question: Do students need to find the correct path or just the final destination?** Groups with extra time, should explore both!Summarize:To exit the classroom, students must write on an exit slip which challenge they would rather do. Students must explain why by using the probability we found as a class.

Activity 12: Scoring Options with Spinners (Day 1)
Launch:Present students with page 1 of 2 of the Scoring Options Game. Explain the rules of the game, and review: multiples, factors, odd, and one-digit meanings. Then with a partner, have students choose 2 scoring options.Explore 1:As a whole class, spin the spinner and record the results. Share 1:Have students share who won the most number of times, but don’t allow them to share why!
Explore 2:Give partners pg 84 and 85, have them choose their winning outcomes, and then record their results.
Summarize:Students are going to do a quick write to tell why they chose the outcomes they did.

Activity 12: Scoring Options with Spinners (Day 2)
Launch:Have students take out their results from yesterday’s experiments, go through their chosen outcomes, and why they chose those outcomes.
Now, give partners pg 87, the blank spinners, and explain they are going to create their own game to where they must create the winning outcomes and the numbers on the spinners.Explore 1:Partners will create their spinner games. Share 1:Partners will exchange their game with a different group for them to play.
Explore 2:Partners play the spinner game from the other group.
Share 2:
Have the two groups meet together and discuss how the experiment went and how they made the decisions they made.
Summarize:Students are going to do a quick write to tell why they chose the outcomes they did.
Activity 13: Mystery Candy Game
Launch:
Problem: Mr. Sturtz went on a field trip to where students could buy candy. Mr. Sturtz got the bags mixed up and did not have names on the bags. The only thing he knows is that Ashley and Alyssa bought the exact same candy. So, Mr. Sturtz needs to find the two bags with the same candy.
Students in groups of 3 will receive 5 different brown paper bags. Students must not look in the bags! Tell students they are going to draw out of each bag for a number of trials of their choosing. Students will draw a colored block out of a bag and then put it back in. They need to decide which 2 bags have the exact same color blocks within the bag. Only 2 bags have the same amount of candy.Explore:Students will get about 10-15 minutes to record their data from the trials. Students will not receive a data recording sheet for these trials. Share:Have students present their data on the board and then their conclusion for which bags have the same candy.
Summarize:Share with students which bags had the same candy. Have the groups discuss and do a quick write about why they think their data did or did not support the conclusion of the same bags.
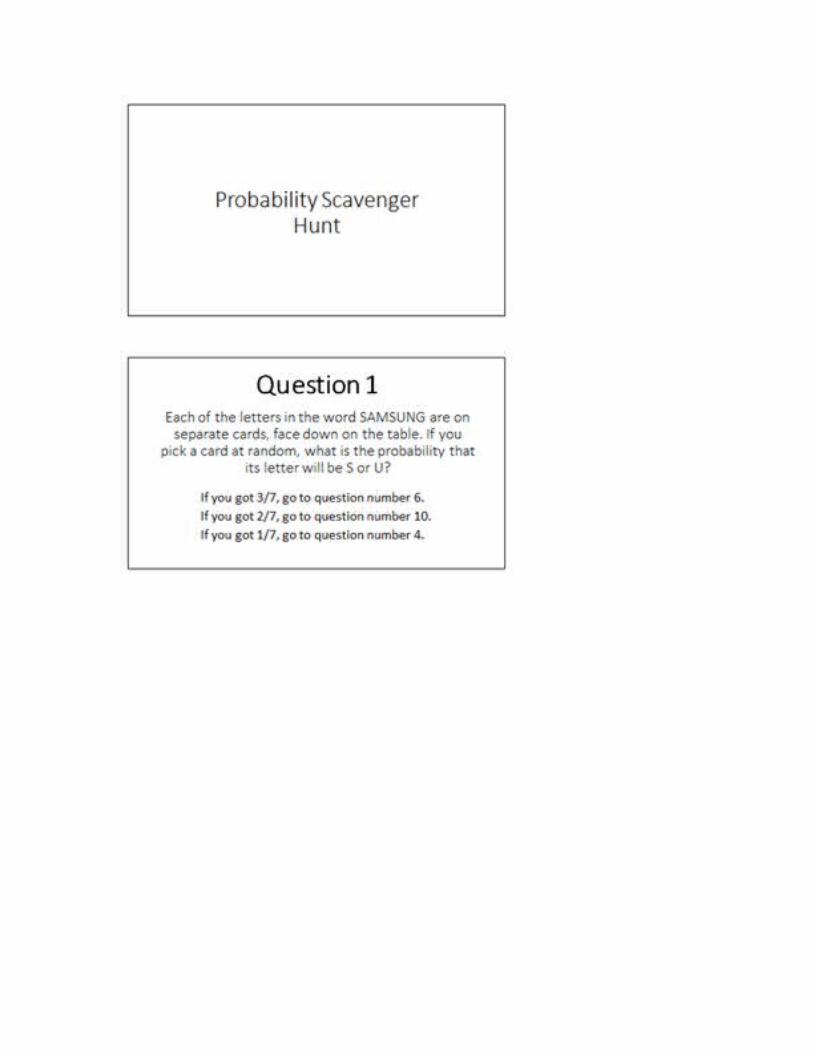
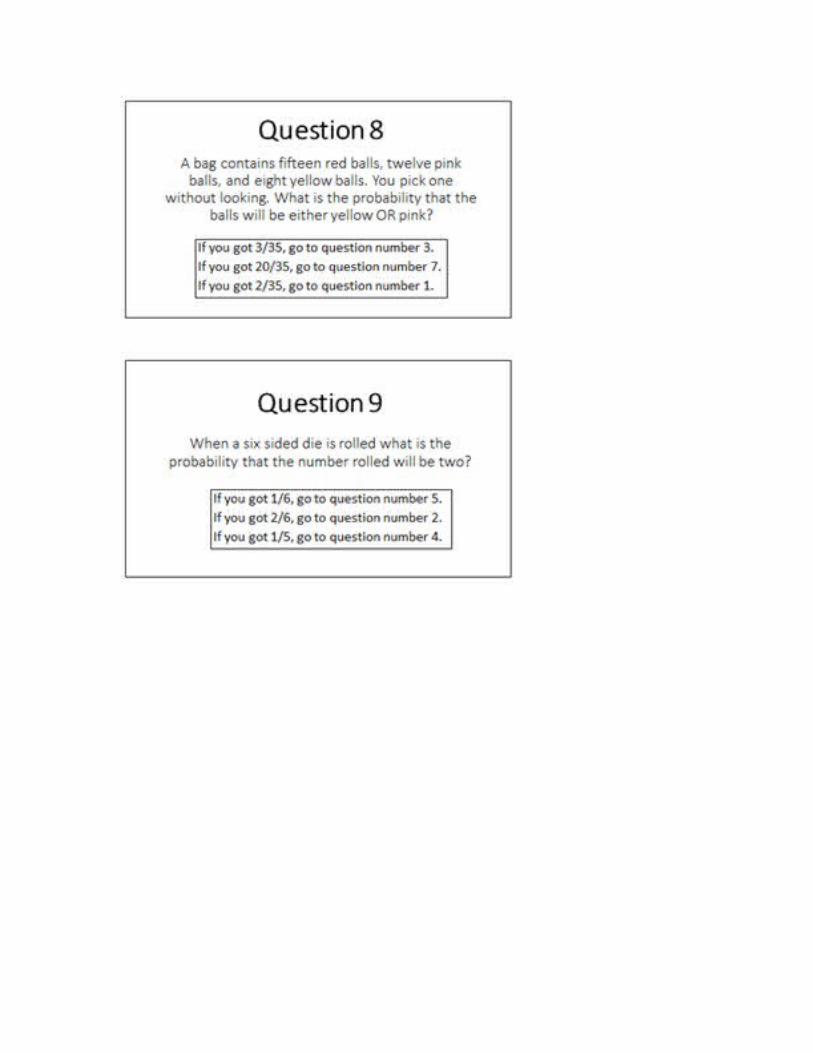
Activity 14 - Probability Scavenger HuntLaunch : For this lesson students will be reviewing probability. The students will be doing a scavenger hunt around the room (or pod). Break students into groups of 3. Each person in each group will need a piece of paper and pencil to show their work.Explore:Students will start at the problem that corresponds to their group number. They will work together answering each probability question and then moving to the next problem that their answer sends them to.Share:When all groups have completed their scavenger hunt, one person from each group should write their path on the board. Together everyone can check to see if each group got each answer correct, but seeing if everyone’s path works out to be the same. If there are any questions groups can help each other answer questions and make clarifications.Summarize : Together the class can review over the main idea of probability and the teacher can clear up anything that confused the students as they were working.


Balancing on One Foot(Day 1)
Launch:How long do you think you can balance on one foot? How do you think you will compare to the students in the class? Do you think you will have a difference between how long you balance on your right foot and how long you can balance on your left foot?Explore:Students will make predictions on how long they will balance on each foot in their journal. Students can also make a chart with their predictions.Go over the directions on collecting the data on the next page. Have a student or two demonstrate the experiment. Have one of them end the test with their foot down or opening their eyes so the class practices watching for those test enders.Draw popsicle sticks for groups of three. One person is the balancer, one is the timer, and the third watches for test enders.Share:Students will share their results on the chart in the front of class. The results will be reviewed the next day.Summarize:Students will practice gathering data. Students will need to be precise and have attention to detail while they collect the data.

Balancing on One FootDay 2
Launch:Yesterday we collected data to see how which foot we balanced better on – left or the right. Today, we are going to organize our data into line plots and discuss our results.Explore:Students will plot the data on the line plot attached for both the right foot and the left foot as a group. Remind students that they can count by fives or tens instead of ones to make all the numbers fit.Once their line plots are completed, groups should have a discussion.· What do you notice about the data for how long students in this class balanced on their right foot? Write at least three things that you have noticed.· What do you notice about the data for how long students in this class balanced on their left foot? Write at least three things that you have noticed.Students should think about the range, how spread out or close together the data is, any clumps of data, or if there are any outliers.Then groups should compare the two sets of data. How are they the same? How are they different?Share:Once groups have enough time to discuss, bring the class together to share their observations. As a class, we can determine the significance of the data and our observations. Hopefully our data can answer the question: What foot does our class balance best on?Summarize:Students will practice conducting experiments and analyzing data. This will prepare them for conducting experiments with probability and then analyzing the data to determine the likely outcome.

