probabilistic seismic demand assessment of steel moment
TRANSCRIPT

Scientia Iranica A (2019) 26(3), 1156{1168
Sharif University of TechnologyScientia Iranica
Transactions A: Civil Engineeringhttp://scientiairanica.sharif.edu
Probabilistic seismic demand assessment of steelmoment-resisting frames with mass irregularity inheight
N. Fanaiea;� and M.S. Kolbadib
a. Department of Civil Engineering, K. N. Toosi University of Technology, Tehran, Iran.b. Department of Civil Engineering, Isfahan (Khorasgan) Branch, Islamic Azad University, Isfahan, Iran.
Received 11 January 2017; received in revised form 26 June 2017; accepted 11 September 2017
KEYWORDSSteel moment-resisting frame;Mass irregularity;Response modi�cationfactor;Incremental dynamicanalysis;Probabilistic seismicdemand analysis.
Abstract. Ductility with direct e�ect on the response modi�cation factor of buildings canin uence their seismic performance. Moreover, some factors, such as geometry and di�erenttypes of irregularity, can a�ect the ductility and seismic performance of structures. In thisstudy, the e�ects of mass irregularity in height on the overstrength, ductility, responsemodi�cation factors, and probabilistic seismic performance in steel Moment-ResistingFrames (MRFs) are assessed. Then, the obtained results are compared with those ofregular structures. For this purpose, Incremental Dynamic Analysis (IDA) is implementedusing ten records out of past worldwide earthquakes. The location of mass concentration inheight is studied by assessing 8-, 12-, and 16-storey buildings with their mass concentratedat the �rst oor, mid-height and roof. Then, the probabilistic seismic responses of thesestructures are evaluated using the outputs of IDA. In this regard, probabilistic seismicdemand analysis is conducted on each model. The obtained results are used to plotthe seismic fragility and demand curves for both regular and irregular models. Based onthe �ndings, mass irregularity causes the reduction of ductility and response modi�cationfactors. This e�ect increases when the heavier storey is located either in the �rst oor orin the roof. Moreover, mass irregularity brings about an increase in probability of damageoccurrence or its exceeding a certain level.© 2019 Sharif University of Technology. All rights reserved.
1. Introduction
ATC-3-06 [1] has established a basis in EarthquakeEngineering in the United States and introduced newconcepts, such as applying response modi�cation factor(R) to the seismic codes. This factor is used toreduce the values of design forces recommended withrespect to the risk evaluation and nonlinear behaviour
*. Corresponding author.E-mail addresses: [email protected] (N. Fanaie);[email protected] (M.S. Kolbadi)
doi: 10.24200/sci.2017.4468
of the structure [2]. In fact, response modi�cationfactor includes inelastic performance of the structure,indicating its hidden strength in inelastic stage. Thisfactor has been de�ned for the �rst time in ATC-3-06 [1] based on the concepts, such as ductility factor,overstrength factor, and degree of uncertainty, andthen has been modi�ed in ATC-19 [1] and ATC-34 [3]. Response modi�cation factor of the buildingis a�ected by the ductility in uential factors, suchas lateral load-resisting system and structure's geom-etry. However, the e�ects of the mentioned in uen-tial factors have not been considered in the seismiccodes. Therefore, the geometry of structure shouldbe scienti�cally investigated so as to consider its e�ect

N. Fanaie and M.S. Kolbadi/Scientia Iranica, Transactions A: Civil Engineering 26 (2019) 1156{1168 1157
on the determination of response modi�cation factor.The existing buildings have been constructed withrespect to di�erent objectives and applications. Allthese factors may cause irregularities in the structures.According to the seismic codes, the structures areclassi�ed into regular and irregular ones in terms ofheight and plan. Non-geometric vertical irregularitycan occur in the buildings with irregular distributionof mass, strength, or lateral sti�ness [4]. The empiricalrelationships presented to determine the fundamentalperiod of structure depend upon the type and heightof structure. The irregularity e�ects are not consideredin the mentioned relations. Weak parts of structuresvery often experience the aftermath of earthquakes dueto rapid changes of sti�ness, strength or ductility [5].The e�ects of earthquakes on such vulnerable pointsbecome more prominent in the irregular distribution ofe�ective masses [4]. The irregular structures, comparedto regular ones, received more damages in the pastearthquakes [6].
This study focuses on the e�ects of mass irregular-ity as well as irregular distribution of mass in height onthe response modi�cation, ductility, and overstrengthfactors. Moreover, probabilistic seismic demand anal-ysis of the irregular buildings is conducted to evaluatereliability of their behaviors with respect to the inher-ent uncertainties in the earthquake. For this purpose,the fragility curves are plotted for regular and irregularstructures to identify the occurrence probability of thelimit states, de�ned in seismic code for intensity indexlevels. So far, various studies have been carried out onthe performance of irregular buildings in height. Val-mudsson and Nau [7] investigated mass, sti�ness, andstrength irregularities, and found that the responsesof irregular structures might be estimated incorrectlyby the equivalent lateral force procedure. Al-Ali andKrawinkler [8] studied the e�ects of mass, sti�ness, andstrength irregularities on the performance of 10-storeybuildings. According to their results, the performanceof structure was a�ected more signi�cantly by the ir-regularity of strength, as compared to that of sti�ness.Moreover, the combination of these two irregularitiesis still more e�ective than mass irregularity. Tremblayand Poncet [9] evaluated seismic responses of theframes with vertical mass irregularities. They designedthe frames according to NBCC provisions using staticand dynamic analyses. Similar values were obtainedfrom static and dynamic analyses for storey drifts (asprescribed by NBCC provisions), indicating that theyhave no consequential role in predicting the e�ectsof mass irregularity. Kim and Hong [10] investigatedcollapse-resisting capacity in the building models withthe sti�ness and strength irregularities. The irregular-ities were created by removing the column from theintermediate storey. According to the obtained results,collapse potential of regular structure was slightly
di�erent from that of irregular one. Pirizadeh andShakib [4] assessed the e�ects of non-geometric verti-cal irregularities on the seismic performance of steelMRFs. They considered their limit-state capacitiesand used probabilistic performance-based approach.According to their research, non-uniform distributionof lateral load-resisting properties in the height hassigni�cant e�ect on the seismic performance of thestructure, especially at the limit-states close to collapseup to global dynamic instability. Vertical irregularitiesmay a�ect seismic intensity and/or ductility capacityof structures, considering their types and positions.Moreover, mean annual frequency of global dynamicinstability performance increases by 5-30% owing tothe vertical irregularities.
2. The Studied structures
2.1. Reference regular structuresIn this study, 8-, 12-, and 16-storey regular steelstructures with intermediate MRFs are considered asbenchmarks. The structures are three dimensionallydesigned according to Iranian Seismic Code [11] andIranian National Building Code (part 10) [12], basedon the provisions which are very similar to those ofAISC [13] and FEMA 350 [14]. They are designedwith the response modi�cation factor (R) of 7 [11] fora very high seismic zone with a site-speci�c earthquakeacceleration of 0.35 g (Tehran), according to theIranian Seismic Code [11]. Buildings are located onsoil type II based on Iranian Seismic Code [11] siteclassi�cation, in which the average shear wave velocityto a depth of 30 m is 360-750 m/s.
Figure 1 presents the plan of the studied struc-tures. The height of 3 m is considered for each storey;each frame has 3 spans with the length of 5 m; theapplied steel is ST-37-1 (equivalent to the steel S235of standard EN10025) with a yield stress of 235 MPa.The dead and live loads of all oors are 600 kg/m2 and
Figure 1. Plan of studied models (3 spans in eachdirection).
1158 N. Fanaie and M.S. Kolbadi/Scientia Iranica, Transactions A: Civil Engineering 26 (2019) 1156{1168
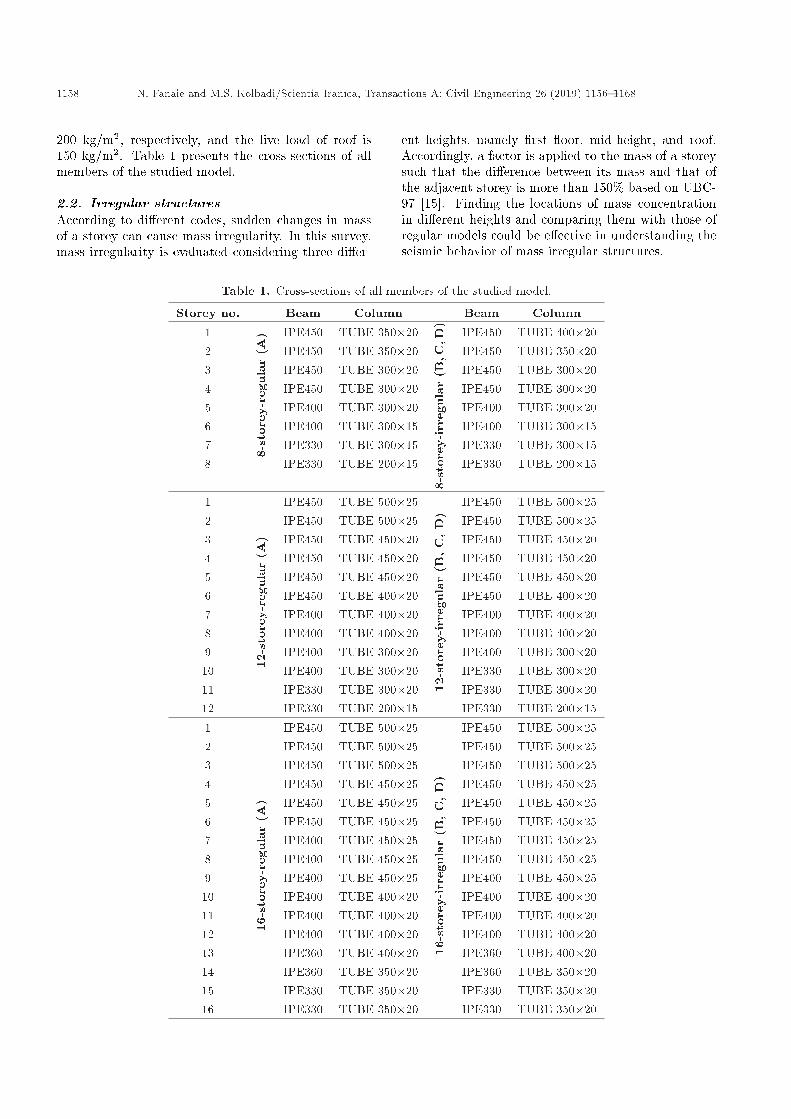
200 kg/m2, respectively, and the live load of roof is150 kg/m2. Table 1 presents the cross-sections of allmembers of the studied model.
2.2. Irregular structuresAccording to di�erent codes, sudden changes in massof a storey can cause mass irregularity. In this survey,mass irregularity is evaluated considering three di�er-
ent heights, namely �rst oor, mid-height, and roof.Accordingly, a factor is applied to the mass of a storeysuch that the di�erence between its mass and that ofthe adjacent storey is more than 150% based on UBC-97 [15]. Finding the locations of mass concentrationin di�erent heights and comparing them with those ofregular models could be e�ective in understanding theseismic behavior of mass irregular structures.
Table 1. Cross-sections of all members of the studied model.
Storey no. Beam Column Beam Column1
8-st
orey
-reg
ula
r(A
) IPE450 TUBE 350�20
8-st
orey
-irr
egula
r(B
,C,D
)
IPE450 TUBE 400�202 IPE450 TUBE 350�20 IPE450 TUBE 350�203 IPE450 TUBE 300�20 IPE450 TUBE 300�204 IPE450 TUBE 300�20 IPE450 TUBE 300�205 IPE400 TUBE 300�20 IPE400 TUBE 300�206 IPE400 TUBE 300�15 IPE400 TUBE 300�157 IPE330 TUBE 300�15 IPE330 TUBE 300�158 IPE330 TUBE 200�15 IPE330 TUBE 200�15
1
12-s
tore
y-re
gula
r(A
)
IPE450 TUBE 500�25
12-s
tore
y-ir
regu
lar
(B,
C,
D)
IPE450 TUBE 500�252 IPE450 TUBE 500�25 IPE450 TUBE 500�253 IPE450 TUBE 450�20 IPE450 TUBE 450�204 IPE450 TUBE 450�20 IPE450 TUBE 450�205 IPE450 TUBE 450�20 IPE450 TUBE 450�206 IPE450 TUBE 400�20 IPE450 TUBE 400�207 IPE400 TUBE 400�20 IPE400 TUBE 400�208 IPE400 TUBE 400�20 IPE400 TUBE 400�209 IPE400 TUBE 300�20 IPE400 TUBE 300�2010 IPE400 TUBE 300�20 IPE330 TUBE 300�2011 IPE330 TUBE 300�20 IPE330 TUBE 300�2012 IPE330 TUBE 200�15 IPE330 TUBE 200�151
16-s
tore
y-re
gula
r(A
)
IPE450 TUBE 500�25
16-s
tore
y-ir
regu
lar
(B,
C,
D)
IPE450 TUBE 500�252 IPE450 TUBE 500�25 IPE450 TUBE 500�253 IPE450 TUBE 500�25 IPE450 TUBE 500�254 IPE450 TUBE 450�25 IPE450 TUBE 450�255 IPE450 TUBE 450�25 IPE450 TUBE 450�256 IPE450 TUBE 450�25 IPE450 TUBE 450�257 IPE400 TUBE 450�25 IPE450 TUBE 450�258 IPE400 TUBE 450�25 IPE450 TUBE 450�259 IPE400 TUBE 450�25 IPE400 TUBE 450�2510 IPE400 TUBE 400�20 IPE400 TUBE 400�2011 IPE400 TUBE 400�20 IPE400 TUBE 400�2012 IPE400 TUBE 400�20 IPE400 TUBE 400�2013 IPE360 TUBE 400�20 IPE360 TUBE 400�2014 IPE360 TUBE 350�20 IPE360 TUBE 350�2015 IPE330 TUBE 350�20 IPE330 TUBE 350�2016 IPE330 TUBE 350�20 IPE330 TUBE 350�20

N. Fanaie and M.S. Kolbadi/Scientia Iranica, Transactions A: Civil Engineering 26 (2019) 1156{1168 1159
2.3. ModelingA central frame of each structure is modelled two-dimensionally in OpenSees program (frame A in Fig-ure 1). It should be mentioned that torsional e�ectscaused by the earthquakes are out of the scope of thisresearch. Meanwhile, much less time is needed forthe analysis, and a two-dimensional model can presentsu�ciently accurate results of regular and irregularMRFs with and without torsional e�ects. Figure 2(a)and (b) illustrates regular and irregular 2D frames aswell as di�erent positions of irregular storey. Nonlinearbeam column element is employed to model the beamand column in the nonlinear deformation range. Thiselement is used to consider the e�ects of P � � and
Figure 2. 2D studied models: (a) Regular storey, and (b)di�erent positions of irregular storey.
large deformations and, subsequently, the geometricalnonlinear e�ects of the model. Each element, includingbeam and column, is divided into several �bres alongtheir sections and several segments along their lengthsto model distributed plasticity in their lengths (seeFigure 3(a) and (b) [16].
This study used one force-based element with 10Lobito integration scheme points and P � � trans-formation for each beam/column member. Each boxsection is discretized into 30 �bers. Both types ofnonlinearities, namely geometrical and material, aredealt with in this research. Furthermore, to take intoaccount the P � � e�ects of the gravity frames onseismic response of the frames, a dummy column ismodeled. In other words, half of total gravity load ofeach oor is applied to the dummy column.
Behavior of the beam-to-column connections hasa signi�cant role in the structural response of steelMRFs. To design a structure to withstand certainearthquake load, the optimum system of beam-to-column connections is the best option so that the struc-ture can develop the minimum possible base shear aswell as small lateral deformations. Nader and AstanehAsl [17] studied experimentally the behavior of simpleand semi-rigid structures under dynamic loading andcompared their response to that of the rigid structuresubjected to similar earthquakes. They observed thatmoment capacity of the semi-rigid connections washigher than expected. Based on Nader and AstanehAsl research [17], exible and semi-rigid structuresdemonstrated remarkable potential to resist earthquakeloading.
In spite of providing cost-e�ectiveness, Partially-Restrained (PR) connection systems are not currentlycerti�ed to be utilized for steel MRFs. Two partially-restrained bolted connections of beam to column (withangle and T-stub) were studied numerically, and theirpotential uses in the steel MRFs were studied byBrunesi et al. [18,19]. Failure mechanisms, the dis-placement ductility capacity, and dissipation energycapabilities of these partially-restrained connectionsare studied, and it is concluded that these types ofconnections can be conspicuously applicable to steelMRFs [18,19].
Figure 3. Dividing the element and section in OpenSees: (a) Dividing the element into several segments and (b) dividingthe section into �bers [14].
1160 N. Fanaie and M.S. Kolbadi/Scientia Iranica, Transactions A: Civil Engineering 26 (2019) 1156{1168
3. Methodology
The values of overstrength, ductility, and responsemodi�cation factors are calculated for regular and ir-regular structures using Incremental Dynamic Analysis(IDA). Besides, the probabilistic seismic behaviors ofthe structures are assessed through Probabilistic Seis-mic Demand Analysis (PSDA). IDA is one of the mostpowerful methods capable of covering the behavior ofstructure from elastic limit to collapse state. In thismethod, which includes nonlinear dynamic analysis,the accelerograms are scaled to assess the behavior ofstructure from linearly elastic to collapse state. In thisregard, an appropriate number of earthquake recordsshould be used to study the uncertainty existing in thefrequency content and spectral shapes of earthquakes.Each earthquake record is scaled so that it can includea considerable range of seismic intensities and thebehavior of the structure from elastic limit to collapsestate [20]. It is essential to select the appropri-ate parameters of Intensity Measure (IM) as well asDamage Measure (DM) for IDA analysis. Besidesthe scalability of the selected intensity measure, dy-namic characteristics of the records, frequency content,energy, etc. should also be considered in choosingsuch IM. A couple of scalable parameters are PeakGround Acceleration (PGA), Peak Ground Velocity(PGV) and spectral acceleration corresponding to the�rst mode (Sa (T1)) [20]. The latter is used as theintensity measure in this study. Damage Measure(DM) is derived from the output of nonlinear dynamicanalysis. Maximum base shear, node rotation, inter-storey drift, and axial deformation of the elementscan be considered as the damage measure criteria.The selection of damage measure depends on theapplication of structure. In this study, maximum inter-storey drift ratio (�max) is used as DM to meet the bestbehavior of structure [20].
4. Choosing and scaling the accelerograms
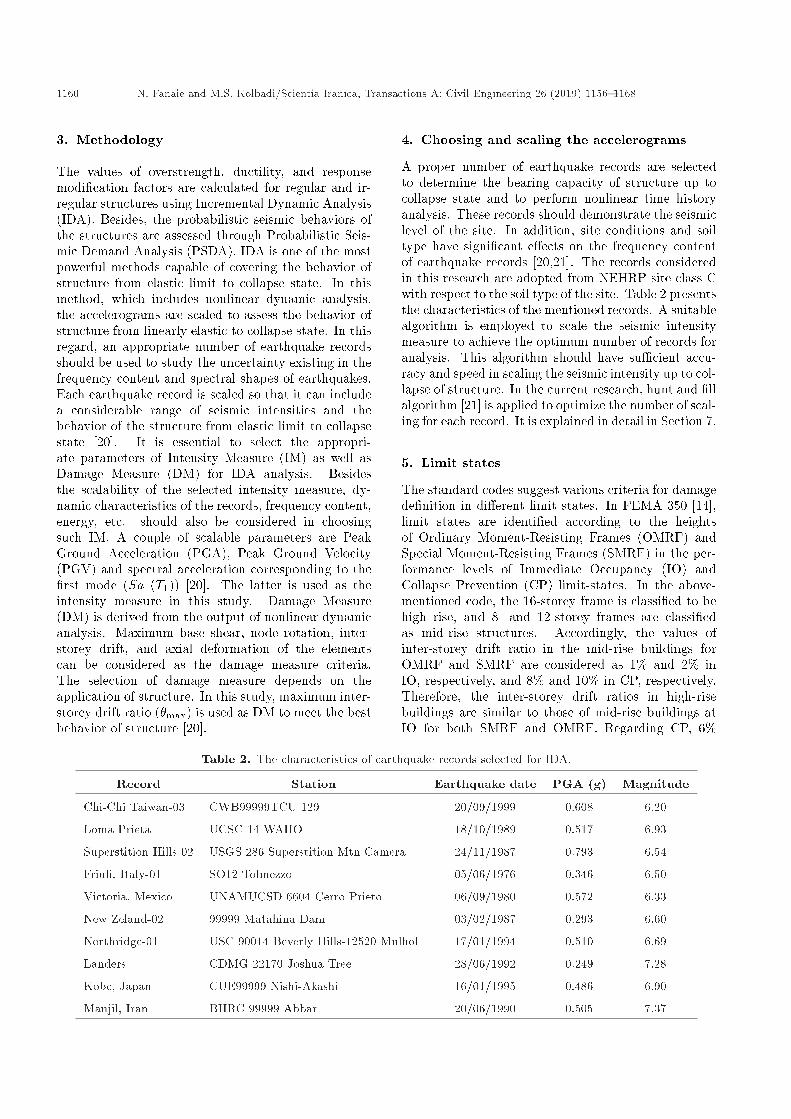
A proper number of earthquake records are selectedto determine the bearing capacity of structure up tocollapse state and to perform nonlinear time historyanalysis. These records should demonstrate the seismiclevel of the site. In addition, site conditions and soiltype have signi�cant e�ects on the frequency contentof earthquake records [20,21]. The records consideredin this research are adopted from NEHRP site class Cwith respect to the soil type of the site. Table 2 presentsthe characteristics of the mentioned records. A suitablealgorithm is employed to scale the seismic intensitymeasure to achieve the optimum number of records foranalysis. This algorithm should have su�cient accu-racy and speed in scaling the seismic intensity up to col-lapse of structure. In the current research, hunt and �llalgorithm [21] is applied to optimize the number of scal-ing for each record. It is explained in detail in Section 7.
5. Limit states
The standard codes suggest various criteria for damagede�nition in di�erent limit states. In FEMA 350 [14],limit states are identi�ed according to the heightsof Ordinary Moment-Resisting Frames (OMRF) andSpecial Moment-Resisting Frames (SMRF) in the per-formance levels of Immediate Occupancy (IO) andCollapse Prevention (CP) limit-states. In the above-mentioned code, the 16-storey frame is classi�ed to behigh rise, and 8- and 12-storey frames are classi�edas mid-rise structures. Accordingly, the values ofinter-storey drift ratio in the mid-rise buildings forOMRF and SMRF are considered as 1% and 2% inIO, respectively, and 8% and 10% in CP, respectively.Therefore, the inter-storey drift ratios in high-risebuildings are similar to those of mid-rise buildings atIO for both SMRF and OMRF. Regarding CP, 6%
Table 2. The characteristics of earthquake records selected for IDA.
Record Station Earthquake date PGA (g) Magnitude
Chi-Chi Taiwan-03 CWB99999TCU 129 20/09/1999 0.608 6.20
Loma Prieta UCSC 14 WAHO 18/10/1989 0.517 6.93
Superstition Hills-02 USGS 286 Superstition Mtn Camera 24/11/1987 0.793 6.54
Friuli, Italy-01 SO12 Tolmezzo 05/06/1976 0.346 6.50
Victoria, Mexico UNAMUCSD 6604 Cerro Prieto 06/09/1980 0.572 6.33
New Zeland-02 99999 Matahina Dam 03/02/1987 0.293 6.60
Northridge-01 USC 90014 Beverly Hills-12520 Mulhol 17/01/1994 0.510 6.69
Landers CDMG 22170 Joshua Tree 28/06/1992 0.249 7.28
Kobe, Japan CUE99999 Nishi-Akashi 16/01/1995 0.486 6.90
Manjil, Iran BHRC 99999 Abbar 20/06/1990 0.505 7.37

N. Fanaie and M.S. Kolbadi/Scientia Iranica, Transactions A: Civil Engineering 26 (2019) 1156{1168 1161
Table 3. Inter-storey drift angle for IMF [22].
Interstorey drift angle for IMF
Building height Interstorey drift angle(IO)
Interstorey Drift Angle(CP)
Mid rise (4-12 storeys) 0.015 0.09High rise (> 12 storeys) 0.015 0.07
and 8.5% of inter-storey drift ratios are considered forSMRF and OMRF, respectively in high-rise buildings.No information is mentioned in the relevant codesconcerning the Intermediate Moment-Resisting Frames(IMRF) of limit states. Therefore, the values calculatedby linear interpolation between inter-storey drift ratiosof OMRF and SMRF are assigned to IMRF and arepresented in Table 3 [22].
6. Calculating the response modi�cation factor
Response modi�cation factor is calculated using incre-mental dynamic analysis and applying nonlinear staticanalysis.
6.1. Basis of calculating Responsemodi�cation factor
Uang's method, also known as ductility factor method,is one of the most common methods used for calculatingthe values of response modi�cation factor [23]. In thementioned method, nonlinear behavior of structure ismodelled with a bilinear relationship and is presentedin Figure 4. In this �gure, Vy and Ve are yielding forceand maximum base shear, respectively, assuming linearbehavior of structures during an earthquake. In Uang'smethod, Ve is reduced to Vy because of the ductility andnonlinear behavior of structure. Force reduction factordue to ductility is de�ned as follows [24]:
R� = Ve=Vy: (1)
Overstrength factor is the ratio of base shear of mech-anism (Vy) to the base shear of the �rst plastic hinge(Vs) de�ned as follows:
Rs = Vy=Vs: (2)
Based on the design codes, Vs decreases to Vw in theallowable stress design method. The allowable stressfactor is de�ned as follows:
= Vs=Vw: (3)
In this study, the value of allowable stress factor isconsidered as 1.44 with respect to the recommendationsof UBC-97 [23,24].
Response modi�cation factor is used to convertthe linear force applied to the structures into the design
Figure 4. Nonlinear behavior of structure [24].
force, considering the aforementioned discussion. Thisfactor is de�ned with respect to the ultimate strengthand allowable stress design methods and is calculatedby Eqs. (4) and (5), respectively [23,24]:
R = (Ve=Vs) = (Ve=Vy)� (Vy=Vs) = R� �Rs; (4)
R = (Ve=Vw) = (Ve=Vy)� (Vy=Vs)� (Vs=Vw)
= R� �Rs � : (5)
6.2. Non-linear static analysisNonlinear static analysis is conducted on the models toassess the base shear corresponding to the �rst plastichinge (Vs) and nonlinear behavior of structures. Ta-ble 4 presents the values of static base shear equivalentto the �rst plastic hinge of the structures. Figure 5 alsodepicts the pushover curves of regular and irregular 16-storey frames. In this study, letter A indicates regularreference frames, and letters B, C, and D denote theirregular frames with mass irregularities located in the�rst storey, mid-height and roof, respectively.
7. Calculating the response modi�cation factorusing IDA
Incremental Dynamic Analysis (IDA) is an in uen-tial method to predict the capacity and demand ofstructures. In this technique, the intensity of groundmotion measured by IM incrementally increases ineach analysis. Drift ratio, an Engineering Demand

1162 N. Fanaie and M.S. Kolbadi/Scientia Iranica, Transactions A: Civil Engineering 26 (2019) 1156{1168
Table 4. Base shears of the �rst hinge in the regular andirregular models.
No. of storeys Vs (ton)A B C D
8 74.56 77.28 76.68 75.8512 87.75 85.60 86.38 86.3816 88.24 88.24 86.92 90.69
Figure 5. Pushover curves of regular and irregular16-storey frames.
Parameter (EDP), is monitored during each analysis.Regarding IM scaling, hunt and �ll algorithm was usedto optimize the number of scaling of each record basedon Eq. (6) [20]:
Sa(T1)i = Sa(T1)i�1 + �� (i� 1); (6)
where Sa (T1) is spectral acceleration corresponding tothe �rst mode; i is the number of steps; � is a factor.In this research, � = 0:05.
Figure 6 presents the IDA curves plotted forregular and irregular models with respect to the afore-mentioned explanations.
7.1. Overstrength factorOverstrength factor is de�ned as the ratio of ultimatebase shear (Vb(Dyn;y)) to the base shear of the �rstyielding. This method was suggested by Mwafy andElnashai [25] to obtain maximum base shear throughincremental nonlinear dynamic analysis. The method
is modi�ed according to the results presented by Mas-sumi et al. [26] and is expressed as follows:
Rs = Vb(Dyn;y)=Vb(st;s); (7)
where Vb(Dyn;y) is the ultimate base shear; Vb(st;s)is base shear of the �rst yielding. Vb(Dyn;y) is thebase shear which causes the formation of one plastichinge in one point of the whole structure. In thisresearch, Vb(st;s) is used instead of Vb(Dyn;y). If spectralacceleration increases gradually, then only one plastichinge might be formed in the structure at a time. Whileonly one plastic hinge exists in the whole structure,spectral acceleration may increase up to the initialformation of the second hinge. In this case, the extentof spectral acceleration of the �rst mode cannot beaccurately presented, causing the creation of the �rstyielding in the structure; besides, its correspondingbase shear cannot be calculated. The base shearcorresponding to the �rst plastic hinge formation isderived from nonlinear static analysis and consideredas base shear of the �rst yield for computing theoverstrength factor [25,26].
7.2. Ductility factorSpectral acceleration resulting from the formationof mechanism or considered damage is used to ob-tain maximum nonlinear base shear of the structure(Vb(Dyn;e)). It is calculated through dynamic analysisassuming the elastic behavior under the same spectralacceleration. Then, ductility factor is calculated asfollows [25,26]:
R� = Vb(Dyn;e)=Vb(Dyn;y): (8)
7.3. Response modi�cation factorOverstrength, ductility, and response modi�cation fac-tors are calculated for regular and irregular models withrespect to the above discussion and are presented inTable 5 and Figure 7.
Overstrength factor increases by 5-10% if theheavier storey is located in the �rst oor of thebuilding (B) compared to that of regular mode (A).The ductility factor decreases by 5-18% in the case oflocating the heavier storey at the �rst oor (B) androof level of the building (D), compared to that of(A). Response modi�cation factor generally decreasesby 1-21% in the buildings with mass irregularities,
Table 5. Overstrength, ductility and response modi�cation factors of regular and irregular models.
Model8-A 8-B 8-C 8-D 12-A 12-B 12-C 12-D 16-A 16-B 16-C 16-D
Rs 1.97 2.06 2.04 2.17 2.09 2.26 2.08 1.84 2.17 2.38 2.41 2.15R� 2.27 2.14 2.30 1.86 2.01 1.73 1.99 1.80 1.63 1.47 1.65 1.51
RLRFD 4.47 4.41 4.69 4.04 4.20 3.91 4.14 3.31 3.54 3.50 3.98 3.25RASD 6.44 6.35 6.76 5.81 6.05 5.63 5.96 4.77 5.09 5.04 5.73 4.67

N. Fanaie and M.S. Kolbadi/Scientia Iranica, Transactions A: Civil Engineering 26 (2019) 1156{1168 1163
Figure 6. IDA curves of regular and irregular frames: (a) 8-storey-A, (b) 8-storey-B, (c) 8-storey-C, (d) 8-storey-D, (e)12-storey-A, (f) 12-storey-B, (g) 12-storey-C, (h) 12-storey-D, (i) 16-storey-A, (j) 16-storey-B, (k) 16-storey-C, and (l)16-storey-D.
in comparison to that of regular mode. The highestdecline rate in the response modi�cation factor occursin the case where the heavier storey is located at theroof oor. The decrease of ductility is higher in thestructures with mass irregularities in the roof oor,compared to the other modes. Regarding a decreasein response modi�cation factor, the ductility capacitycan be reduced in such structures with too much massconcentration at a level and, particularly, at the roof oor due to its higher acceleration. While responsemodi�cation factor of 7 has been suggested in the codesfor IMRF, it is reduced with an increase in height inregular and irregular models.
Figure 7. Overstrength, ductility, and responsemodi�cation factors of the studied models.

1164 N. Fanaie and M.S. Kolbadi/Scientia Iranica, Transactions A: Civil Engineering 26 (2019) 1156{1168
8. Estimating the probability of occurrencecorresponding to the limit states
In this study, response modi�cation factor is calcu-lated for the structures with mass irregularities in theheights. Then, probabilistic seismicity of any massirregularity modes is evaluated in di�erent heights.Fragility curves are used to extract the probabilityoccurrence of the limit states from IDA curves. In thisway, the probability of occurrence of limit states can bedetermined at any performance level of the structurefor each IM level without considering the seismichazard, on the condition of the intensity limited tothe desired level. Seismic fragility curve, illustrated inEq. (9), is the conditional probability of exceedance ofengineering demand parameter related to the capacityof structure at each damage state under an IM levelof ground motion. The researchers suggested di�erentnumerical scales, such as PGA, PGV, and Sa (T1),for earthquake intensity [27,28]. While the latter isthe most ordinarily used scale, PGA and PGV areindependent of the structure [29,30]:
Fragility = P (D � CjIM): (9)
Fragility curves are generally de�ned by lognormalcumulative distribution function [31,32]:
P (DS � dsijSa(T1)) = ��
lnX � �ln
�ln
�; (10)
where P (DS � dsijSa(T1)) is the probability of ex-periencing or exceeding the damage state i; � isthe cumulative standard normal distribution; X islognormal distribution of spectral acceleration; �ln isthe mean variable natural logarithm given by:
�ln = ln(m)� �2ln2; (11)
where m is the mean non-logarithmic variables, and �lnis the standard deviation of variable natural logarithm,de�ned as follows:
�ln =r
ln(1 +s2
m2 ); (12)
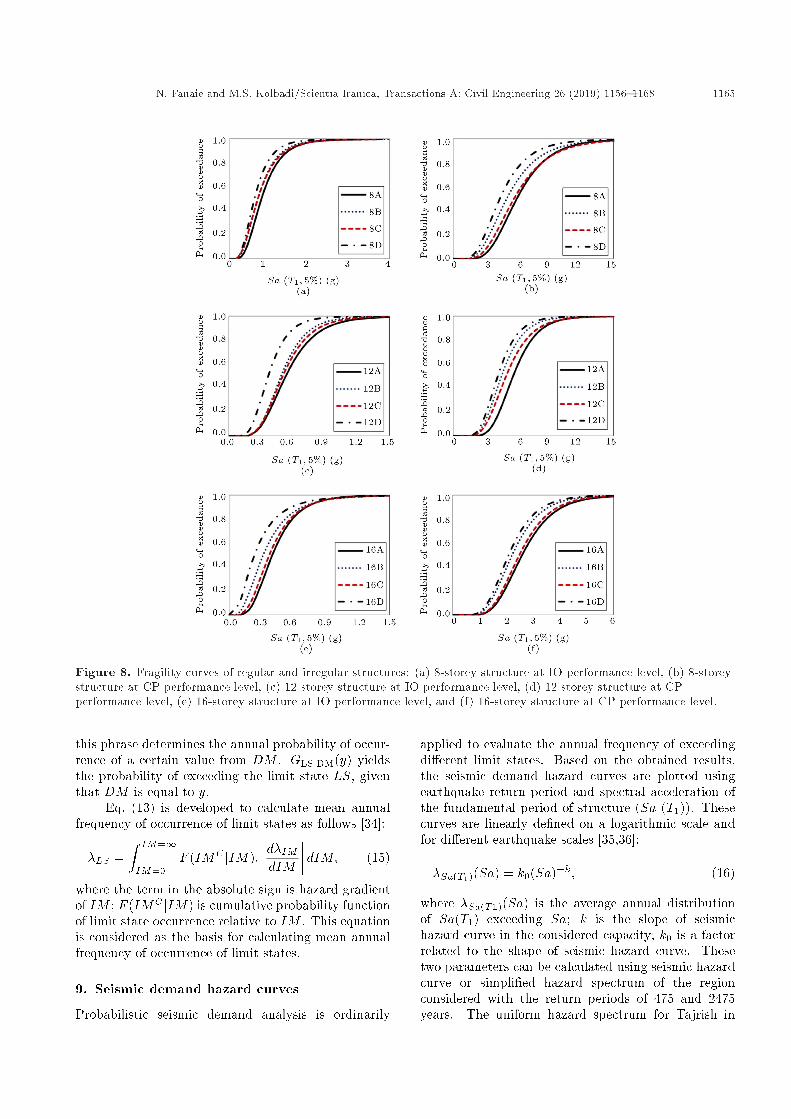
where s is standard deviation of non-logarithmic vari-ables. In this research study, earthquake intensity scale(Sa (T1)) is selected as the elastic spectral accelera-tion with 5% damping in the fundamental period ofstructure. Figure 8 presents the fragility curves ofregular and irregular structures for both IO and CPperformance levels.
The discussion presented in Section 5 has beenconsidered to �nd the degree of collapse prevention andimmediate occupancy states of the structures. Table 6presents the values of Sa corresponding to 16%, 50%,
Table 6. Sa values corresponding to probability ofdi�erent failures.
Failure probability (%)
Model (Sa(T1;5%))IO(g) (Sa(T1;5%))CP (g)16% 50% 84% 16% 50% 84%
8-A 0.50 0.80 1.28 4.00 5.92 8.768-B 0.42 0.71 1.17 3.64 4.98 7.898-C 0.43 0.71 1.20 5.12 5.66 8.808-D 0.38 0.63 1.01 2.74 4.34 6.8612-A 0.35 0.53 0.80 3.27 4.47 6.1112-B 0.33 0.49 0.70 2.53 3.60 5.1312-C 0.33 0.50 0.75 2.73 3.95 5.7212-D 0.24 0.37 0.55 2.34 3.33 4.7216-A 0.25 0.40 0.63 1.82 2.59 3.6816-B 0.17 0.32 0.58 1.53 2.21 3.2116-C 0.22 0.38 0.61 1.74 2.48 3.5416-D 0.12 0.24 0.48 1.44 2.09 3.02
and 84% failures for IO and CP performance levels.According to Figure 8 and Table 6, the capacity ofstructures decreases, and the probability of occurrencefrom a certain damage level augments for both IOand CP performance levels in the irregular buildings,compared to those of regular ones. This fact is moreobvious when mass irregularity is located in the �rst oor and roof levels.
8.1. Probabilistic Seismic Demand Analysis(PSDA)
Probabilistic Seismic Demand Analysis (PSDA) is usedto calculate the mean annual frequency of exceeding theseismic demand from a certain level in a given structureand designated site [33]. If DM indicates structuraldemand and IM denotes seismic intensity, probabilisticseismic demand analysis is expressed as follows:
�DM (y) =ZGDM jIM (yjx): jd�IM (x)j ; (13)
where �DM (y) is average annual frequency of exceedingDM from y value (i.e., MAF); �IM (x) is the value ofseismic hazard function at point x relative to IM orannual probability of occurrence of certain earthquakeintensity; GDM jIM (yjx) is the probability of DM ex-ceeding y, where IM is equal to x. The results ofprobabilistic seismic demand analysis can be used forcalculating mean annual frequency, exceeding a certainlimit state, usually called �LS , de�ned as follows:
�LS =ZGLSjDM (y): jd�DM (y)j ; (14)
where d�DM (y) accounts for the di�erential of seismicdemand hazard with respect to DM ; in other words,
N. Fanaie and M.S. Kolbadi/Scientia Iranica, Transactions A: Civil Engineering 26 (2019) 1156{1168 1165
Figure 8. Fragility curves of regular and irregular structures: (a) 8-storey structure at IO performance level, (b) 8-storeystructure at CP performance level, (c) 12-storey structure at IO performance level, (d) 12-storey structure at CPperformance level, (e) 16-storey structure at IO performance level, and (f) 16-storey structure at CP performance level.
this phrase determines the annual probability of occur-rence of a certain value from DM . GLSjDM(y) yieldsthe probability of exceeding the limit state LS, giventhat DM is equal to y.
Eq. (13) is developed to calculate mean annualfrequency of occurrence of limit states as follows [34]:
�LS =Z IM=1
IM=0F (IMC jIM):
����d�IMdIM
���� dIM; (15)
where the term in the absolute sign is hazard gradientof IM ; F (IMC jIM) is cumulative probability functionof limit state occurrence relative to IM . This equationis considered as the basis for calculating mean annualfrequency of occurrence of limit states.
9. Seismic demand hazard curves
Probabilistic seismic demand analysis is ordinarily
applied to evaluate the annual frequency of exceedingdi�erent limit states. Based on the obtained results,the seismic demand hazard curves are plotted usingearthquake return period and spectral acceleration ofthe fundamental period of structure (Sa (T1)). Thesecurves are linearly de�ned on a logarithmic scale andfor di�erent earthquake scales [35,36]:
�Sa(T1)(Sa) = k0(Sa)�k; (16)
where �Sa(T1)(Sa) is the average annual distributionof Sa(T1) exceeding Sa; k is the slope of seismichazard curve in the considered capacity; k0 is a factorrelated to the shape of seismic hazard curve. Thesetwo parameters can be calculated using seismic hazardcurve or simpli�ed hazard spectrum of the regionconsidered with the return periods of 475 and 2475years. The uniform hazard spectrum for Tajrish in

1166 N. Fanaie and M.S. Kolbadi/Scientia Iranica, Transactions A: Civil Engineering 26 (2019) 1156{1168
Figure 9. Seismic demand hazard curves of regular and irregular structures: (a) 8-storey structure, (b) 12-storeystructure, and (c) 16-storey structure.
Table 7. Mean Annual Frequency (MAF), return period and probability of once occurrence for all frames at IO and CPperformance levels.
CP performance level IO Performance level
Model MAF Tr (year) �Probability of
exceedance of 2%in 50 years (%)
MAF Tr (year) �Probability of
exceedance of 2%in 50 years (%)
8-A 3.7E-05 27304 0.0018 0.18 3.7E-03 271 0.18 15.338-B 6.0E-05 16660 0.0030 0.30 4.8E-03 210 0.24 18.788-C 4.6E-05 21780 0.0023 0.23 4.3E-03 233 0.21 17.328-D 6.9E-05 14498 0.0034 0.34 5.8E-03 173 0.29 21.6112-A 2.1E-05 48600 0.0010 0.10 2.7E-03 376 0.13 11.6512-B 2.5E-05 40101 0.0012 0.12 3.2E-03 313 0.16 13.6212-C 2.1E-05 46917 0.0011 0.11 2.9E-03 346 0.14 12.4912-D 2.7E-05 36450 0.0014 0.14 7.6E-03 132 0.38 25.9416-A 1.7E-05 59533 0.0008 0.08 3.5E-03 283 0.18 14.7916-B 2.3E-05 44132 0.0011 0.11 7.9E-03 127 0.39 26.5916-C 1.9E-05 52465 0.0010 0.10 4.6E-03 219 0.23 18.1816-D 3.0E-05 33714 0.0015 0.15 1.3E-02 79 0.63 33.57
the north of Tehran, with the latitude of 35:8�N andlongitude of 51:42�E, has been used to evaluate theprobabilistic seismic demand of the studied models.Seismic demand hazard curves are plotted for eachirregular structure and are compared with those ofreference regular ones (see Figure 9).
Poisson probability distribution formula has beenapplied to calculate the return period (Tr) of earth-quake corresponding to its probability of occurrencein limit states as well as its probability of occurrenceonce in 50 years. The obtained results presentedin Table 7 are compared with those of Design BaseEarthquake (DBE) and Maximum Probable Earth-quake (MPE) [37]. If mass irregularities are locatedin the �rst oor and roof, the probability of occurrenceof one event in 50 years of life expectancy of structures,corresponding to IO performance level, is higher (10%)than that of DBE with the return period of 475 years.In general, this probability value is higher when the
mass is concentrated at the roof oor, compared to thatof other states. Therefore, the buildings with the massconcentrated at the roofs have insu�cient reliabilityat IO performance level. Moreover, the probability of`once occurrence' corresponding to the CP performancelevel in 50-year life time of structure is lower (2%) thanthat of MPE with the return period of 2475 years,which is equal to the probability of 2% in 50 years.However, this probability increases in the irregularreference structures, compared with regular ones.
10. Conclusion
This study focused on the e�ects of mass irregularityand its location in height on the behavior of steelMRFs. For this purpose, overstrength, ductility, andresponse modi�cation factors were calculated throughIDA analysis for the structures with mass irregularities.The obtained results were then compared with those of
N. Fanaie and M.S. Kolbadi/Scientia Iranica, Transactions A: Civil Engineering 26 (2019) 1156{1168 1167
reference structures in the regular state. Consideringthe conditions and soil type of the site, 10 well-knownglobal earthquake records were used to assess thee�ects of mass irregularity on the seismic performanceof steel MRFs through probabilistic seismic demandanalysis. Finally, fragility curves and seismic demandhazard curves are plotted for regular and mass irregularstructures. Overstrength factor experienced changesin the irregular structures, considering the locationof mass irregularity and the concentration of mass inheight. The �ndings are brie y summarized as follows:
1. Overstrength factor increases by 5% to 10% in thecases with the mass irregularity in the �rst oor;
2. No signi�cant change is observed in the over-strength factor in the cases with irregularities inheight other than the �rst oor;
3. Ductility factor decreases by 5% to 18% in the caseswith the mass irregularity in the �rst oor and roof;
4. Response modi�cation factor of irregular structuresdecreases by 1% to 21%, compared to that ofregular ones. This is due to the reduction ofductility factor;
5. The highest decrease in response modi�cation fac-tor occurs when the heavier oor is located at theroof level. Ductility and response modi�cation fac-tors of structure are reduced owing to the excessivemass concentrated at the height, especially at the�rst oor and roof;
6. The capacity of the irregular structures is reducedin comparison to that of regular ones;
7. The probability of damage is higher in the irregularstructures compared to that of the regular ones,considering the fragility curves and Sa values cor-responding to 16%, 50% and 84% collapse proba-bilities for IO and CP performance levels;
8. The probability of damage is higher in the caseswith the heavier oor at the roof level. This factis highly intensi�ed with an increase in height ofstructure;
9. The probability of collapse increases in the struc-tures with the heavier oor at the roof level,considering the seismic hazard curves;
10. For both seismic hazard levels of Design BasedEarthquake (DBE) and Maximum Probable Earth-quake (MPE), poor performance and insu�cientreliability of irregular structures at IO performancelevel are indicated.
References
1. ATC-3-06, Tentative Provisions for the Development ofSeismic Regulations for Buildings, Applied TechnologyCouncil (1978).
2. ATC-19, Structural Response Modi�cation Factor, Ap-plied Technology Council (1995).
3. ATC-34, A Critical Review of Current Approachesto Earthquake-Resistant Design, Applied TechnologyCouncil (1995).
4. Pirizadeh, M. and Shakib, H. \Probabilistic seismicperformance evaluation of non-geometric verticallyirregular steel buildings", Journal of ConstructionalSteel Research, 82, pp. 88-98 (2013).
5. Li, W., Xu, P., Wang, H., and Lu, X. \A new methodfor calculating the thermal e�ects of irregular internalmass in buildings under demand response", Energy andBuildings, 130, pp. 761-772 (2016).
6. Sang, W.H., Tae-O, Kim., Dong, H.K., and Seong-Jin,B. \Seismic collapse performance of special momentsteel frames with torsional irregularities", EngineeringStructures, 141, pp. 482-494 (2017).
7. Valmundsson, E.V. and Nau, J.M. \Seismic response ofbuilding frames with vertical structural engineering",ASCE Journal, 123(1),pp. 30-41 (1997).
8. Al-Ali, A. and Krawinkler, H. \E�ects of vertical irreg-ularities on seismic behavior of building structures",PhD Thesis, Blume Earthquake Engineering Center,Stanford University, Stanford, CA (1998).
9. Tremblay, R. and Poncet, L. \Seismic performanceof concentrically braced steel frames in multistorybuildings with mass irregularity", Journal of StructuralEngineering, 131(1), pp. 1363-1375 (2005).
10. Kim, J. and Hong, S. \Progressive collapse perfor-mance of irregular buildings", The Structural Designof Tall Special Buildings, 20(6), pp. 721-734 (2011).
11. BHRC, Iranian Code of Practice for Seismic Resis-tance Design of Buildings, Standard No. 2800-5, 3rdEdition. Building and Housing Research Center (2005).
12. MHUD, Iranian National Building Code, Part 10,Steel Structure Design, Ministry of Housing and UrbanDevelopment (2008).
13. AISC-360, Speci�cation for Structural Steel Buildings,American institute of steel construction (2010).
14. FEMA-350, Recommended Seismic Design Criteria forNew Steel Moment Frame Buildings, Federal Emer-gency Management Agency (2000).
15. UBC-97, International Conference of Building O�-cials, Uniform building Code (1997).
16. Mazzoni, S., McKenna, F., Scott, M.H., Fenves,G.L., and Jeremic, B. OpenSees Command LanguageManual, Berkely, CA: Paci�c Earthquake EngineeringCenter, Univ, California at Berkely (2007).
17. Nader, M.N. and Astaneh Asl, A. \Dynamic behaviorof exible, semi-rigid and rigid steel frames", Journalof Constructional Steel Research, 18, pp. 179-192(1991).
18. Brunesi, E., Nascimbene, R., and Rassati, G.A. \Re-sponse of partially-restrained bolted beam-to-columnconnections under cyclic loads", Journal of Construc-tional Steel Research, 97, pp. 24-38 (2014).

1168 N. Fanaie and M.S. Kolbadi/Scientia Iranica, Transactions A: Civil Engineering 26 (2019) 1156{1168
19. Brunesi, E., Nascimbene, R., and Rassati, G.A. \Seis-mic response of MRFs with partially-restrained boltedbeam-to-column connections through FE analyses",Journal of Constructional Steel Research, 107, pp. 37-49 (2015).
20. Vamvatsikos, D. and Cornell, C.A. \Incremental dy-namic analysis", Earthquake Engineering and Struc-tural Dynamics, 31(3), pp. 491-514 (2002).
21. Stewart, J.P., Chiou, S.J., Bray, J.D., Garves, R.W.,Somerville, P.G., and Abrahamson, N.A. \Groundmotion evaluation procedures for performance baseddesign", Soil Dynamics and Earthquake Engineering,22, pp. 765-772 (2002).
22. Asgarian, B., Sadrinezhad, A., and Alanjari, P. \Seis-mic performance evaluation of steel moment resistingframes through incremental dynamic analysis", Jour-nal of Constructional Steel Research, 66, pp. 178-190(2010).
23. Uang, C.M. \Establishing R or (Rw) and Cd factorbuilding seismic provision", Structural Engineering,117(1), pp. 19-28 (1991).
24. Fanaie, N. and Ezzatshoar, S. \Studying the seismicbehavior of gate braced frames by incremental dynamicanalysis (IDA)", Journal of Constructional Steel Re-search, 99, pp. 111-120 (2014).
25. Mwafy, A.M. and Elnashai, A.S. \Calibration of forcereduction factors of RC buildings", Journal of Earth-quake Engineering, 6(2), pp. 239-273 (2002).
26. Massumi, A., Tasnimi, A.A., and Saatcioglu, M.\Prediction of seismic overstrength in concrete mo-ment resisting frames using incremental static anddynamic analysis", 13th World. Conf. on EarthquakeEngineering, Vancouver, B.C, Canada (2004).
27. Cordova, P.P., Deierlein, G.G., Mehanny, S.S.F., andCornell, C.A. \Development of two-parameter seismicintensity measure and probabilistic assessment proce-dure", 2nd U.S. - Japan Workshop on Performance-based Earthquake Engineering Methodology for Rein-forced Concrete Building Structures, Sapporo, Japan,pp. 187-206 (2001).
28. Hutchinson, T.C., Chai, Y.H., Boulanger, R.W., andIdriss, I.M. \Inelastic seismic response of extendedpile-shaft-supported bridge structures", EarthquakeSpectra, 20(4), pp. 1057-1080 (2004).
29. Shome, N., Cornell, C.A., Bazzurro, P., and Eduardo,C.J. \Earthquakes, records and nonlinear responses",Earthquake Spectra, 14(3), pp. 469-500 (1998).
30. Luco, N. and Cornell, C.A. \Structure-speci�c scalarintensity measures for near-source and ordinary earth-quake ground motions", Earthquake Spectra, 23(3),pp. 357-392 (2007).
31. Aslani, H. \Probabilistic earthquake loss estimationand loss disaggregation in buildings", PhD Thesis,Department of Civil and Environmental Engineering,Stanford University, Stanford, CA (2005).
32. Wen, Y.K. and Ellingwood, B.R. \The role of fragilityassessment in consequence-based engineering", Earth-quake Spectra, 21(3), pp. 861-877 (2005).
33. Luco, N., Mai, P.M., Cornell, C.A., and Beroza,G.C. \Probabilistic seismic demand analysis at a nearfault site using ground motion simulations based ona stochastic kinematic earthquake source model", 7thInt. Conf. on Earthquake Engineering, Boston, Mas-sachusetts (2002).
34. Porter, K.A. \An overview of peer's performance-based earthquake engineering methodology", 9th Int.Conf. on Applications of Statistics and ProbabilityCivil Engineering (ICASP9), Civil Engineering Riskand Reliability Association (CERRA), San Francisco,CA (2003).
35. Sewell, R.T., Toro, G.R., and McGuire, R.K. \Impactof ground motion characterization on conservatismand variability in seismic risk estimates", ReportNUREG/CR-6467, U.S. Nuclear Regulatory Commis-sion, Washington, D.C. (1991).
36. Jalayer, F. and Cornell, C. \A technical framework forprobability-based demand and capacity factor design(DCFD) seismic formats", PEER Report 2003/08,Paci�c Earthquake Engineering Research Center, Uni-versity of California, Berkeley (2003).
37. FEMA-356, Prestandard and Commentary for theSeismic Rehabilitation of Buildings, Federal Emer-gency Management Agency (2000).
Biographies
Nader Fanaie obtained his BS, MS, and PhD de-grees in Civil Engineering from the Department ofCivil Engineering at Sharif University of Technology,Tehran, Iran. He graduated in 2008 and, at present,is a faculty member of K. N. Toosi University ofTechnology, Tehran, Iran. He has supervised 31 MStheses up to now. His �eld of research includes seismichazard analysis, earthquake simulation, seismic designand IDA. He has published 40 journal and conferencepapers, and also 10 books. He received the thirdplace in the �rst mathematical competition, held atSharif University of Technology in 1996 and a GoldMedal in \The 4th Iranian Civil Engineering Scienti�cOlympiad" in 1999. In 2001, he achieved the �rstrank in the exam of PhD scholarship abroad. He hasalso been acknowledged as an innovative engineer on`Engineering Day' in 2008.
Mohammad Sadegh Kolbadi was born in 1986. Hereceived his MSc degree in Earthquake Engineeringfrom Islamic Azad University, Isfahan (Khorasgan)Branch, Iran in 2015. His �eld of study is base isolationsystems and his research interests include earthquakeengineering, seismic evaluation, and retro�tting ofbuilding.