probability of failure of the trudock crane … · crane system at the waste isolation ......
TRANSCRIPT

EEG-74
PROBABILITY OF FAILURE OF THE TRUDOCKCRANE SYSTEM AT THE WASTE ISOLATIONPILOT PLANT (WIPP)
Moses A. GreenfieldThomas J. Sargent
Environmental Evaluation GroupNew Mexico
May 2000


iii
EEG-74DOE/AL/58309
PROBABILITY OF FAILURE OF THE TRUDOCK CRANE SYSTEM AT THE
WASTE ISOLATION PILOT PLANT (WIPP)
Moses A. Greenfield, Ph.DConsultant to Environmental Evaluation Group
Professor Emeritus, University of California, Los Angeles
Thomas J. Sargent, Ph.D.Professor of Economics, Stanford University
Senior Fellow, Hoover Institution
Environmental Evaluation Group7007 Wyoming Blvd., NE, Suite F-2Albuquerque, New Mexico 87109
and
505 North Main Street, P.O. Box 3149Carlsbad, New Mexico 88221-3149
May 2000


iii
FOREWORD
The purpose of the New Mexico Environmental Evaluation Group (EEG) is to conduct an
independent technical evaluation of the Waste Isolation Pilot Plant (WIPP) Project to ensure the
protection of the public health and safety and the environment. The WIPP Project, located in
southeastern New Mexico, became operational in March 1999 for the disposal of transuranic
(TRU) radioactive wastes generated by the national defense programs. The EEG was established
in 1978 with funds provided by the U. S. Department of Energy (DOE) to the State of New
Mexico. Public Law 100-456, the National Defense Authorization Act, Fiscal Year 1989, Section
1433, assigned EEG to the New Mexico Institute of Mining and Technology and continued the
original contract DE-AC04-79AL10752 through DOE contract DE-ACO4-89AL58309. The
National Defense Authorization Act for Fiscal Year 1994, Public Law 103-160, and the National
Defense Authorization Act for Fiscal Year 2000, Public Law 106-65, continued the authorization.
EEG performs independent technical analyses of the suitability of the proposed site; the design of
the repository, its planned operation, and its long-term integrity; suitability and safety of the
transportation systems; suitability of the Waste Acceptance Criteria and the compliance of the
generator sites with them; and related subjects. These analyses include assessments of reports
issued by the DOE and its contractors, other federal agencies and organizations, as they relate to
the potential health, safety and environmental impacts from WIPP. Another important function of
EEG is the independent environmental monitoring of background radioactivity in air, water, and
soil, both on-site and off-site.
Robert H. Neill Director
iv
EEG STAFF
Sally C. Ballard, B.S., Radiochemical Analyst
William T. Bartlett, Ph.D., Health Physicist
Radene Bradley, Secretary III
James K. Channell, Ph.D., Environmental Engineer/Health Physicist
Lokesh Chaturvedi, Ph.D., Deputy Director & Engineering Geologist
Patricia D. Fairchild, Secretary III
Donald H. Gray, M.A., Laboratory Manager
Linda P. Kennedy, M.L.S., Librarian
Jim W. Kenney, M.S., Environmental Scientist/Supervisor
Lanny W. King, Assistant Environmental Technician
Robert H. Neill, M.S., Director
Dale Rucker, M.S., Environmental Engineer
Jill Shortencarier, Executive Assistant
Matthew K. Silva, Ph.D., Chemical Engineer
Susan Stokum, Administrative Secretary
Ben A. Walker, B.A., Quality Assurance Specialist
Brenda J. West, B.A., Administrative Officer

v
ACKNOWLEDGMENTS
The authors wish to thank Jill Shortencarier for expert preparation of the manuscript. We thank
our colleague Dale Rucker for helpful reviews and suggestions, and for contributing basic
information. We also thank our colleague Robert H. Neill for helpful suggestions. The authors
are also grateful to their colleagues at EEG (James K. Channell, Lokesh Chaturvedi, Ben Walker,
William Bartlett) for reviews and suggestions. Special thanks are due to Matthew Silva for a
valuable addition. We also thank Linda Kennedy for her expertise in improving the report and its
references.

vi

vii
TABLE OF CONTENTS
FOREWORD . . . . . . . . . . . . . . . . . . . . . . . . . . . . . . . . . . . . . . . . . . . . . . . . . . . . . . . . . . . . . iii
EEG STAFF . . . . . . . . . . . . . . . . . . . . . . . . . . . . . . . . . . . . . . . . . . . . . . . . . . . . . . . . . . . . . . iv
ACKNOWLEDGMENTS . . . . . . . . . . . . . . . . . . . . . . . . . . . . . . . . . . . . . . . . . . . . . . . . . . . . . v
SUMMARY . . . . . . . . . . . . . . . . . . . . . . . . . . . . . . . . . . . . . . . . . . . . . . . . . . . . . . . . . . . . . . ix
1. INTRODUCTION . . . . . . . . . . . . . . . . . . . . . . . . . . . . . . . . . . . . . . . . . . . . . . . . . . . . . . . . 1
2. CALCULATIONS . . . . . . . . . . . . . . . . . . . . . . . . . . . . . . . . . . . . . . . . . . . . . . . . . . . . . . . . 4
2.1 Operator Errors . . . . . . . . . . . . . . . . . . . . . . . . . . . . . . . . . . . . . . . . . . . . . . . . . . . . 4
2.2 Crane System Cutset Descriptions . . . . . . . . . . . . . . . . . . . . . . . . . . . . . . . . . . . . . . 5
2.3 Use of Confidence Levels . . . . . . . . . . . . . . . . . . . . . . . . . . . . . . . . . . . . . . . . . . . . 6
2.4 Lognormal Calculations . . . . . . . . . . . . . . . . . . . . . . . . . . . . . . . . . . . . . . . . . . . . . . 8
3. DISCUSSION . . . . . . . . . . . . . . . . . . . . . . . . . . . . . . . . . . . . . . . . . . . . . . . . . . . . . . . . . . 11
REFERENCES . . . . . . . . . . . . . . . . . . . . . . . . . . . . . . . . . . . . . . . . . . . . . . . . . . . . . . . . . . . . 13
LIST OF ACRONYMS . . . . . . . . . . . . . . . . . . . . . . . . . . . . . . . . . . . . . . . . . . . . . . . . . . . . . . 14
APPENDIX . . . . . . . . . . . . . . . . . . . . . . . . . . . . . . . . . . . . . . . . . . . . . . . . . . . . . . . . . . . . . . A-1
LIST OF EEG REPORTS . . . . . . . . . . . . . . . . . . . . . . . . . . . . . . . . . . . . . . . . . . . . . . . . . . . B-1

viii
LIST OF TABLES
TABLE 1. Frequencies of Navy Crane Incidents . . . . . . . . . . . . . . . . . . . . . . . . . . . . . . . . . . . . 3
TABLE 2 . . . . . . . . . . . . . . . . . . . . . . . . . . . . . . . . . . . . . . . . . . . . . . . . . . . . . . . . . . . . . . . . . 4
TABLE 3. Cutset Probabilities . . . . . . . . . . . . . . . . . . . . . . . . . . . . . . . . . . . . . . . . . . . . . . . . .5
TABLE 4. Calculations of the Values of µ . . . . . . . . . . . . . . . . . . . . . . . . . . . . . . . . . . . . . . . . 9
TABLE 5. Values of the Parameters µ, F . . . . . . . . . . . . . . . . . . . . . . . . . . . . . . . . . . . . . . . . . 9
TABLE 6. Percentiles and Probability Values of the Grand Total of the Four
Random Variables . . . . . . . . . . . . . . . . . . . . . . . . . . . . . . . . . . . . . . . . . . . . . . . . 10
TABLE 7. Comparison of Means and Variance . . . . . . . . . . . . . . . . . . . . . . . . . . . . . . . . . . . 10
LIST OF FIGURES
Figure 1. Lifting drums . . . . . . . . . . . . . . . . . . . . . . . . . . . . . . . . . . . . . . . . . . . . . . . . . . . . . . . 1
Figure 2. Cumulative distribution function for probability of failure of the TRUDOCK
crane system . . . . . . . . . . . . . . . . . . . . . . . . . . . . . . . . . . . . . . . . . . . . . . . . . . . . . . 12
ix
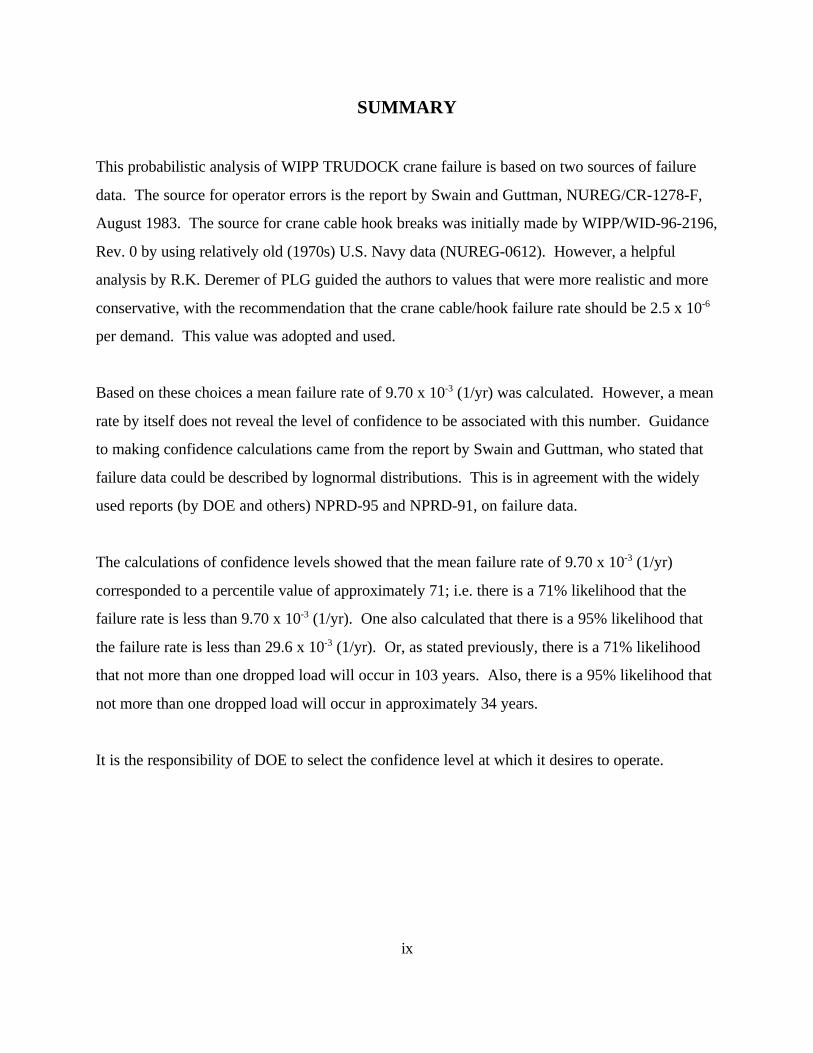
SUMMARY
This probabilistic analysis of WIPP TRUDOCK crane failure is based on two sources of failure
data. The source for operator errors is the report by Swain and Guttman, NUREG/CR-1278-F,
August 1983. The source for crane cable hook breaks was initially made by WIPP/WID-96-2196,
Rev. 0 by using relatively old (1970s) U.S. Navy data (NUREG-0612). However, a helpful
analysis by R.K. Deremer of PLG guided the authors to values that were more realistic and more
conservative, with the recommendation that the crane cable/hook failure rate should be 2.5 x 10⁻⁶
per demand. This value was adopted and used.
Based on these choices a mean failure rate of 9.70 x 10 (1/yr) was calculated. However, a mean-3
rate by itself does not reveal the level of confidence to be associated with this number. Guidance
to making confidence calculations came from the report by Swain and Guttman, who stated that
failure data could be described by lognormal distributions. This is in agreement with the widely
used reports (by DOE and others) NPRD-95 and NPRD-91, on failure data.
The calculations of confidence levels showed that the mean failure rate of 9.70 x 10 (1/yr)-3
corresponded to a percentile value of approximately 71; i.e. there is a 71% likelihood that the
failure rate is less than 9.70 x 10 (1/yr). One also calculated that there is a 95% likelihood that-3
the failure rate is less than 29.6 x 10 (1/yr). Or, as stated previously, there is a 71% likelihood-3
that not more than one dropped load will occur in 103 years. Also, there is a 95% likelihood that
not more than one dropped load will occur in approximately 34 years.
It is the responsibility of DOE to select the confidence level at which it desires to operate.

1
Figure 1. Lifting drums.
PROBABILITY OF FAILURE OF THE TRUDOCK CRANE SYSTEMAT THE WASTE ISOLATION PILOT PLANT (WIPP)
1. INTRODUCTION
In March 1999, the Department of Energy began emplacing transuranic waste into the Waste
Isolation Pilot Plant (WIPP). The facility is located in southeast New Mexico in bedded salt at a
depth of 650 meters. The repository is designed to contain 176,000 cubic meters (850,000 drum
equivalents) of contact-handled transuranic (CH TRU) waste and 7,100 cubic meters (8,000
canisters) of remote handled transuranic (RH TRU) waste. The contact handled waste will be
shipped from various defense generator and storage sites throughout the nation in an NRC
certified container called a TRUPACT II or in a shorter version called a HALFPACK. In
preparation for shipping, fourteen drums of waste, two standard waste boxes, or eight overpack
drums are lowered into each TRUPACT-II. An inner lid and an outer lid secure the top of the
shipping container.
Upon arrival at the WIPP, the drums or boxes need to be
unloaded from the shipping container. This will be done in
the Waste Handling Building where there are two
TRUDOCK cranes. The two cranes are six-ton overhead
bridge cranes, and are capable of operating alone or in
parallel. To unload each shipping container, the outer lid
needs to be lifted (3520 lbs.) and the inner lid needs to be
lifted (895 lbs.). Each is set to the side. Figure 1 shows that
two seven drum arrays can be lifted and handled as a single
unit. The lift is over two meters and the payload can weigh
as much as 7,265 lbs. Assuming at least three lifting
operations for each TRUPACT there would be 182,000
lifting operations to unload 850,000 drum equivalents of
CH TRU waste or about 5200 lifting operations per year
(1500 crane transfers/year x 3 lifts/TRUPACT-II) for the 35
year operational life of the facility.

2
The DOE report, WIPP-WID-96-2196, Rev. 0, published in October 1996, studies and evaluates
the possible frequency of failure of the TRUDOCK crane system, resulting in a dropped load and
the loss of the drums’ containment. The report turned to NUREG-0612 (July 1980) for failure
data based on experience with U.S. Navy cranes in the 1970s.
However, the authors of WIPP-WID-96-2196, Rev. 0, 10/25/96, apparently had some concerns
about using the data directly from NUREG-0612. The authors evidently turned for help to an
independent source, Mr. R. Kenneth Deremer of PLG, an engineering consulting firm. Mr.
Deremer’s report is contained as Appendix A5 in WID-96-2196. According to Deremer’s report,
a preliminary version of the DOE report listed a failure “rate” of “2.0E(-5) per demand for crane
cable/hook failures and cites NUREG-0612 as the basis for this value”. Mr. Deremer is critical of
that value, and then proceeded to his evaluation of a more realistic and more conservative value
and he states that, “the crane cable/hook failure rate should be less than approximately 2.5E(-6)
per demand”; that is a reduction of almost a factor of 10. Mr. Deremer makes the point that the
NUREG-0612 data were compiled in the 1970s; and he states that the operating environment at
WIPP is much less demanding than those for Navy cranes. He also mentions the aggressive
inspection and maintenance programs at WIPP, “to assure the continuing reliability of the cranes”.
He believes that the failure rates could even be lowered, but states that “it is difficult to quantify
this additional improvement”.
In his summary Mr. Deremer strongly restates his recommendation of a choice in the data base for
the crane cable/hook contribution “of the order of 2.5E(-6) per demand”. Mr. Deremer’s
recommendation was adopted by the authors of WIPP-WID-96-2196. In the key table of that
report, on the Crane System Cutset Descriptions, page A2-5, the Event Probability for the Crane
Cable/Hook Breaks is listed as 2.5E(-6).
Support for the critical view by Mr. Deremer of the operating experience of Navy cranes may be
seen by noting the relative frequencies of equipment failures vs. operator failures reported in
“Navy Crane Incidents” (reports obtained from the U.S. Navy), for the recent years 1996, 1997
and 1998 (Table 1). The number of incidents associated with operator failure is an astonishing 90
to 95%.

3
TABLE 1Frequencies of Navy Crane Incidents
Year 1998 1997 1996
Total no. of incidents 196 167 154
No. due to equipment failure/percentage 11/5.6% 16/9.6% 7/4.6%
No. due to operator failure/percentage 185/94.4% 151/90.4% 147/95.4%
Another source of information of hoisting and rigging incidents comes from a recent report by the
Office of Oversight, U.S. Department of Energy, Washington, DC, 20585. The report is
“Independent Oversight Special Study of Hoisting and Rigging Incidents within the Department
of Energy”, October 1996. The report covers a 30 month interval, from October 1, 1993 to
March 31, 1996. The report states that “Human error is the major cause of hoisting and rigging
incidents” (page 8).
This is similar to the data in the “Navy Crane Incidents” reports, with major causes of incidents
due to operator rather than equipment failures.
In sharp contrast, in WIPP-WID-96-2196, for WIPP crane system experience, the operators are
not the major cause of incidents. As the report states, “Crane operators and load spotters are
required to be trained in safe crane operation; therefore it is felt that the WIPP crane performance
will exceed the data presented in NUREG-0612, and the estimated failure frequency is felt to be
conservative.”

4
2. CALCULATIONS
2.1 Operator Errors
Operator errors are described in the table on page A4-6, of WIPP-WID-96-2196, Rev. 0. For
convenience this table is reproduced (as Table 2) in this report, with some additions.
TABLE 2Symbol HEP Explanation of Error Source of HEP Page*
A 3.7 x 10 Improperly mate a connector, including failure to test the Table 20-12.* Item (13), mean value. 20-281-3
locking feature for engagement
B 0.75 The operator repeating the action is modeled to have a high Table 20-21.* Item (4)(a), high 20-371
dependency for making the same error again. It is not dependence for different pins. Twocomplete dependence, because the operator moves to the opportunities (the second and third pins)second lifting leg and must physically push the locking balls to repeat error is modeled as 0.5+(1-to insert the pins. 0.5)*0.5=0.75.
C 1.2 x 10 Checker fails to verify the proper insertion of the connector Table 20-22.* Item (9), mean value. 20-381-3
pins, and that status affects safety when performing tasks.
D 0.15 Checker fails to verify the proper insertion of the connector Table 20-21.* Item (3)(a), moderate 20-371
pins at a later step, given the initial failure to recognize the dependence for second check.error. Sufficient separation in time and additional cues towarrant moderate rather than total or high dependence.
F 4.99 x 10 Failure rate if first pin improperly connected. Product of above HEPs.1-7
a 0.996 Given the first pin was properly connected. 1-F1 1
A 3.7 x 10 Improperly mate a connector, including failure to test the Table 20-12.* Item (13), mean value. 20-282-3
locking feature for engagement.
B 0.5 The operator repeating the action is modeled to have a high Table 20-21.* Item (4)(a), high 20-372
dependency for making the same error again. It is not dependence for different pins. Only onecomplete dependence, because the operator moves to the opportunity for error (the third pin).second lifting leg and must physically push the locking ballsto insert pins.
C 1.2 x 10 Checker fails to verify the proper insertion of the connector Table 20-22.* Item (9), mean value. 20-382-3
pins, and that status affects safety when performing tasks.
D 0.15 Checker fails to verify the proper insertion of the connector Table 20-21.* Item (3)(a), moderate 20-372
pins at a later step, given the initial failure to recognize the dependence for second check.error. Sufficient separation in time and additional cues towarrant moderate rather than total or high dependence.
F 3.32 x 10 Failure rate if first pin improperly connected. Product of above HEPs.2-7
F 8.31 x 10 Total failure rate due to human error. F + FT-7
1 2
* HEP stands for Human Error Probability.* The source of the data is in a report by Swain and Guttman, “Handbook of Human Reliability Analysis with Emphasis on Nuclear Power Plant Applications”, August 1983, NUREG/CR-1278-F.
P ' j4
1E.P.
5
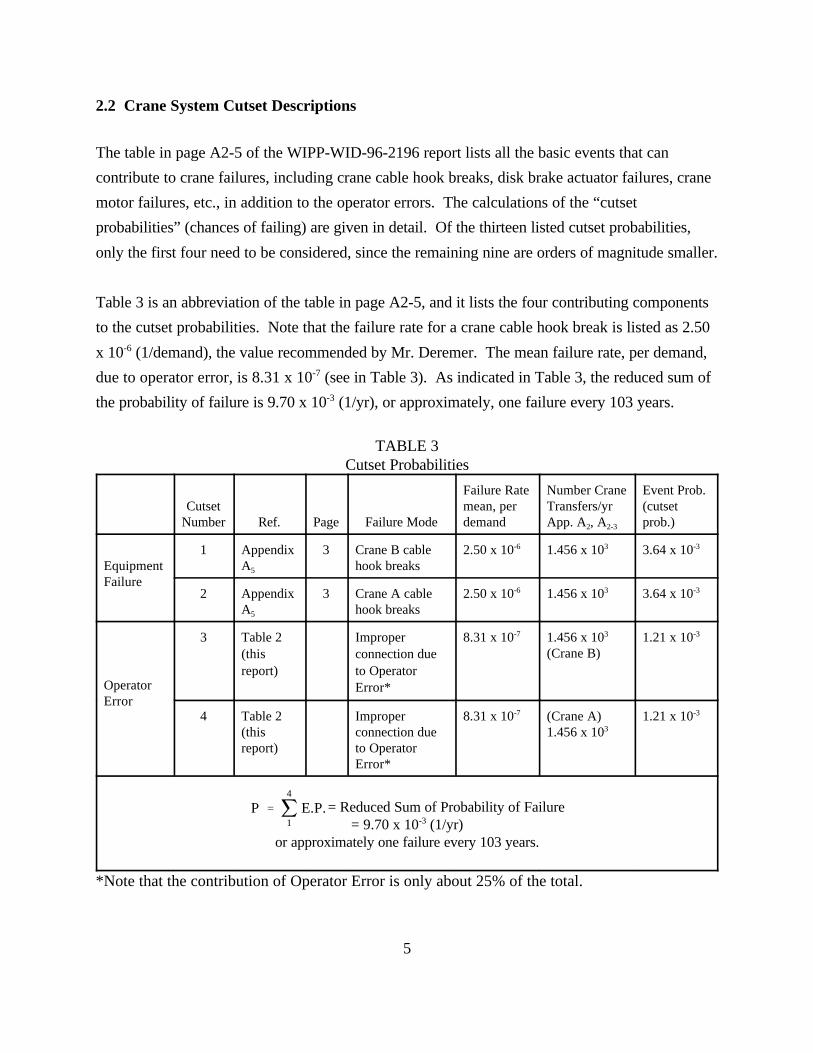
2.2 Crane System Cutset Descriptions
The table in page A2-5 of the WIPP-WID-96-2196 report lists all the basic events that can
contribute to crane failures, including crane cable hook breaks, disk brake actuator failures, crane
motor failures, etc., in addition to the operator errors. The calculations of the “cutset
probabilities” (chances of failing) are given in detail. Of the thirteen listed cutset probabilities,
only the first four need to be considered, since the remaining nine are orders of magnitude smaller.
Table 3 is an abbreviation of the table in page A2-5, and it lists the four contributing components
to the cutset probabilities. Note that the failure rate for a crane cable hook break is listed as 2.50
x 10 (1/demand), the value recommended by Mr. Deremer. The mean failure rate, per demand,-6
due to operator error, is 8.31 x 10 (see in Table 3). As indicated in Table 3, the reduced sum of-7
the probability of failure is 9.70 x 10 (1/yr), or approximately, one failure every 103 years.-3
TABLE 3Cutset Probabilities
Cutset mean, per Transfers/yr (cutsetNumber Ref. Page Failure Mode demand App. A , A prob.)
Failure Rate Number Crane Event Prob.
2 2-3
Equipment A hook breaksFailure
1 Appendix 3 Crane B cable 2.50 x 10 1.456 x 10 3.64 x 10
5
-6 3 -3
2 Appendix 3 Crane A cable 2.50 x 10 1.456 x 10 3.64 x 10A hook breaks5
-6 3 -3
OperatorError
3 8.31 x 10 1.456 x 10 1.21 x 10Table 2 Improper(this connection duereport) to Operator
Error*
-7 3
(Crane B)
-3
4 Table 2 Improper 8.31 x 10 (Crane A) 1.21 x 10(this connection due 1.456 x 10report) to Operator
Error*
-7
3
-3
= Reduced Sum of Probability of Failure= 9.70 x 10 (1/yr)-3
or approximately one failure every 103 years.
*Note that the contribution of Operator Error is only about 25% of the total.

6
2.3 Use of Confidence Levels
The calculation in Table 3 of the probability of failure doesn’t tell the whole story. One also
wishes to know the confidence level that is associated with the failure rate of 9.70 x 10 (1/yr). It-3
is helpful to follow the recommendations of the Nuclear Regulatory Commission to include mean
estimates and to “take into account the potential uncertainties that exist so that an estimate can be
made on the confidence level to be ascribed to the quantitative results.” This quotation is taken
from the Nuclear Regulatory Commission (NRC 1986). EEG makes the same recommendation,
and a calculation of confidence levels is made in this report.
A suggestion of the distribution of HEPs (see Table 2) is made by Swain and Guttman
(NUREG/CR-1278-F, page 7-1, page 2-18) to use lognormal distributions. Another helpful
source on this matter are the reports NPRD-91 and the more recent NPRD-95, by Denson,
Chandler, Crowell, Clark and Jaworski, 1994, “Nonelectronic Parts Reliability Data.” Both
reports NPRD-91 and NPRD-95 have been used as sources of failure data by DOE in their recent
reports: WIPP/WID-96-2178, Rev. 0, July 1996 and WCAP-13800, February 1994 (Preliminary
Draft Report).
Both NPRD-91 and NPRD-95 state that all listed failure rates “estimate” the expected failure
rates, and that the “true” values lie in some confidence intervals about these estimates. The
following statement is a quote from NPRD-91 (Denson et al. 1991), page 1-6:
“To give NPRD-91 users a better understanding of the confidence they can
place in the presented failure rates, an analysis was performed on the variation
in observed failure rates. It was concluded that, for a given generic part type,
the natural logarithm of the observed failure rate is normally distributed with a
sigma (F) = 1.5. This indicates that 68 percent of actual failure rates will be
between 0.22 and 4.5 times the mean value. Similarly, 90% of actual failure
rates will be between 0.08 and 11.9 times the presented value.”

11.90.08
' 148
7
This is to state that if one wishes to include 90% of all the failure rates, one must include a range
of values that somewhat exceeds two orders of magnitude . Under these
circumstances, representing the failure rate by a mean value alone disregards relevant information.

d7(x) '1
(xF 2B)exp &
1
2F2(log x&µ)2 dx
xmd ' e µ
xmn ' eµ %
12
F2
µ ' ln e&
12
F2
• xmn
F ' 1.5; e&
12
F2
' e &1.125 ' 0.3247
µ ' ln [0.3247 • xmn]
8
2.4 Lognormal Calculations
A general form for the lognormal distribution with the two parameters, µ, F is given by (Aitchison
and Brown, 1969):
where 7 is the cumulative distribution function (CDF).
The median of the distribution is given by:
(1)
The mean is given by: (2)
According to the NPRDs (Denson et al., 1991, 1994) F is taken as equal to 1.5.
from (2):
since
thus: (3)
The values of (EP), the Cutset Event Probabilities, are listed in the right most column of Table 3.
Let x = 10 • (EP); the values of x are listed in Table 4.mn mm3

P ' 10&3 ji' 4
i' 1
Pi
d Pi(x) '1
x Fi 2Bexp &
1
2F 2i
(log x & µ i)2 dx
xmn ' 103 • (EP) ' eµ% 1
2F2
e µ ' (0.3247 xmn)
9
TABLE 4Calculations of the Values of µ
(From Table 3) (From Equation 3)Cutset Number µ
1 3.64 1.1819 0.1671
2 3.64 1.1819 0.1671
3 1.21 0.3929 -0.9342
4 1.21 0.3929 -0.9342
Table 4 can be summarized as follows:
TABLE 5Values of the Parameters µ, F
P µ Fi i i
1 0.1671 1.5
2 0.1671 1.5
3 -0.9342 1.5
4 -0.9342 1.5
The failure distribution, P, can be expressed as follows:
(4)
(5)
The failure distribution, P, has been expressed as the sum of four lognormal random variables, P . i
The factor 10 is introduced to cancel the 10 used in the columns of Table 4. The methods used-3 +3
to compute the failure distribution functions are described in detail in the Appendix.

10
Table 6 lists the percentile values for the approximating probability distribution of the grand total
of the four random variables.
TABLE 6Percentiles and Probability Values of the Grand
Total of the Four Random Variables
Percentile Probability x 10 (1/yr)3
0.5 0.651. 0.85. 1.4
10. 1.8520. 2.850. 5.8
Mean = 71 9.7080 12.890 20.95 29.699 65.599.5 89.5
TABLE 7Comparison of Means and Variance
True Mean 9.701Approximating Mean 9.698True Variance 249.83Approximating Variance 246.51
For the grand total of the four random variables the approximating and true means and variance
are listed in Table 7 without the factor (10 ). The values of the approximations are close to the-3
true values. This indicates that the approximations for the probability values listed in Table 6 have
relatively small errors.

11
3. DISCUSSION
The data in Table 6 for the probability and the percentiles have been plotted on “probability-log”
graph paper; see Figure 2. Some statements may be made, based on Figure 2 or Table 6.
(a) The mean failure rate is 9.70 x 10 (1/yr), and corresponds to a percentile-3
value of approximately 71, i.e. there is a 71% likelihood that the failure
rate is less than 9.70 x 10 (1/yr).-3
(b) At the 95 percentile, the probability is slightly less than 30 x 10 (1/yr) (actually-3
29.6 from Table 6); i.e. there is a 95% likelihood that the failure rate is less than
29.6 x 10 (1/yr).-3
(c) The above statements may be recast in another way:
There is a 71% likelihood that not more than one dropped load will
occur in 103 years. Also, there is a 95% likelihood that not more
than one dropped load will occur in approximately 34 years. One
may calculate the corresponding time intervals for lower and higher
levels of likelihood. Which level of likelihood does one select? That
choice is the responsibility of DOE to make.

0.5 1 5 10 20 50 70 80 90 95 99 99.8 99.990.01
0.1
10-4
10-3
10-2
0.3
Percentiles
Freq
uenc
y (y
ear
)-1
Mean
Figure 2. Cumulative distribution function for probability of failure of the TRUDOCK crane system
12
13
REFERENCES
Aitchison, J. and Brown, J.A.C., 1969. The lognormal distribution. Cambridge University Press,NY, NY.
Denson, W., Chandler, G., Crowell, W. and Wanner, R., 1991. Nonelectric Parts Reliability Data. NPRD-91, Griffis A.F.B., NY.
Denson, W., Chandler, G., Crowell, W., Clark, A. and Jaworski, P., 1994. Nonelectronic PartsReliability Data. NPRD -95, Griffis, A.F.B., NY.
Nuclear Regulatory Commission, 10 CFR 50. “Safety Goals for the Operation of Nuclear PowerPlants, Policy Statement, Correction and Republication.” Federal Register 51, No. 162,21 August 1986, p. 30028-30033.
Nuclear Regulatory Commission, “Control of Heavy Loads at Nuclear Power Plants,” NUREG-0612, July 1980.
Swain, A.D. and Guttman, H.E., 1983. Handbook of Human Reliability Analysis with Emphasison Nuclear Power Plant Applications. NUREG/CR-1278-F, U.S. Nuclear RegulatoryCommission.
U.S. Department of Energy. Office of Environment, Safety and Health. Office of Oversight. Independent Oversight Special Study of Hoisting and Rigging Incidents within theDepartment of Energy. Washington, D.C., October 1996. <http://www.tis-hq.eh.doe.gov/oversight/reviews/hoist_rig.html>. (Accessed April 12, 2000).
Westinghouse Electric Corporation, Waste Isolation Division, 1996. Waste Isolation Pilot Plant,Trudock Crane System Analysis. WIPP/WID-96-2196, Rev. 0.
Westinghouse Electric Corporation, Waste Isolation Division, 1994. Waste Isolation Pilot Plant,Waste Hoist Brake System Analysis (preliminary draft report). WCAP-13800,Westinghouse Electric Corporation.

14
LIST OF ACRONYMS
EEG Environmental Evaluation Group
EP Event Probabilities
NPRD Nonelectronic Parts Reliability Data
NRC Nuclear Regulatory Commission
DOE United States Department of Energy
WID Waste Isolation Division
WIPP Waste Isolation Pilot Plant


APPENDIX


h (z) ' m f (u) g (z&u) du
x'j4i'1 xi ,
The mathematical theorems can be found in many books on operational mathematics. For1
example, see R.A. Gabel and R.A. Roberts, Signals and Linear Systems, Wiley, 1973.
A-1
APPENDIX
This appendix describes how we numerically approximated the density of the random variable
where each x is distributed independently of x , j … i and is log normal withi j
parameters µ , F . The distribution of a sum of two independent random variables is thei i
convolution of the two distributions. But convolution in the time domain corresponds to
multiplication in the frequency domain. This allows us to compute the distribution that we want
by taking the Fourier transform of each density, multiplying them, and then inverse Fourier
transforming.
Transform Methods
We want to compute the density function for a random variable that is the sum of two
independently distributed random variables with known densities. We use the following theorem:1
Theorem: Let x be a continuously distributed random variable with density f(x), and let y be a
continuously distributed random variable with density g(y). Let x and y be independently
distributed. Then the random variable z = x + y is distributed with density h(z) given by the
convolution of f and g, which is defined by
A related theorem governs discrete approximations to continuously distributed random variables.
Theorem: Let x be a random variable that takes values on the set X = [x , x ,...,x ], with0 1 T-1
density f = Prob[x = x ]. Let y be another random variable that takes values on the same set X,t t

ht 'jk
fk gt&k ,
x(Tj)'jT&1
t'0
xte&iTj t
xt'T &1jT&1
j'0x(Tj)e
iTj t.
xtt'T&1t'0
x(Tj )
A-2
with density g = Prob[y = x ]. Let z be the random variable z = x + y, and let x and y bet t
distributed independently. Then z has density h with
where h = Prob[z = z ], and where z resides in the discrete set Z = [2x ,...,2x ].t t 0 T-1
The next useful result is that the Fourier transform of a convolution is the product of the
Fourier transforms of the two sequences being convoluted. The Fourier transform of a
sequence is defined as the sequence of complex numbers given by
(1)
where T = 2Bj/T and j = 0,1,...,T -1. The inverse Fourier transform is given byj
(2)
Equations (1) and (2) constitute the basic Fourier transform pair. Notice that the inverse Fourier
transform of the Fourier transform is the original sequence.
The key theorem for us is:
Theorem: The Fourier transform of the convolution of two sequences {x } and {y } is thet t
product of their Fourier transforms x(T ) y(T ).j j
We apply this theorem as follows. For each of two continuous distributions, (f, g), the probability
laws for (x ,y), respectively, we put down a discrete ‘grid’ of points X = [x ,...,x ] on the real0 T-1

h (Tj)' f (Tj) g (Tj).
ht ' T &1jT&1
t'0h (Tj) e
iTj t.
f t gt
ht
ht
A-3
line, with the points spaced close enough together and over a sufficiently large set to approximate
each continuous distribution well. Then we used (f, g) to generate approximating discrete
probability distributions for (x, y). For computational consistency, we used the same grid for each
random variable under study. We chose the grid carefully to make sure that each random variable
as well as the relevant sums were well approximated by the procedure. For each approximating
distribution and , we computed the Fourier transform f (T ) and g(T ). Then we computedj j
the Fourier transform of { }, the approximating distribution of the sum x + y, as
To compute the approximate density of x + y, , we then inverse Fourier transformed h (T ):j
Computational Details
We implemented these calculations using the Fast Fourier Transform (FFT) and the associated
inverse transform, the IFFT. We used the computer language MATLAB on a Dell 450 MHz PC
with 128 x 3 K of memory. This permitted us to put down very large and fine grids. We used
one (inconsequential) approximation: each time a convolution is computed, the FFT in effect
truncates the grid on which the relevant sum is distributed, and restricts it to the same domain on
which the original two distributions are defined. In particular, the density of the sum is computed
only on the same domain X = [x ,x ,...,x ], rather than on the true domain Z = 0 1 T-1
[2x ,...,2x ]. To control the error resulting from this approximation, we select the grid set X0 T-1
very carefully to make sure that it covers the region where the pertinent x, y, and sum z = x + y
have appreciable positive probability.


LIST OF EEG REPORTS

B-1
LIST OF EEG REPORTS
EEG-1 Goad, Donna, A Compilation of Site Selection Criteria Considerations and ConcernsAppearing in the Literature on the Deep Disposal of Radioactive Wastes, June 1979.
EEG-2 Review Comments on Geological Characterization Report, Waste Isolation Pilot Plant (WIPP)Site, Southeastern New Mexico SAND 78-1596, Volume I and II, December 1978.
EEG-3 Neill, Robert H., James K. Channell, Carla Wofsy, Moses A. Greenfield (eds.) RadiologicalHealth Review of the Draft Environmental Impact Statement (DOE/EIS-0026-D) WasteIsolation Pilot Plant, U.S. Department of Energy, August 1979.
EEG-4 Little, Marshall S., Review Comments on the Report of the Steering Committee on WasteAcceptance Criteria for the Waste Isolation Pilot Plant, February 1980.
EEG-5 Channell, James K., Calculated Radiation Doses From Deposition of Material Released inHypothetical Transportation Accidents Involving WIPP-Related Radioactive Wastes, October1980.
EEG-6 Geotechnical Considerations for Radiological Hazard Assessment of WIPP. A Report of aMeeting Held on January 17-18, 1980, April 1980.
EEG-7 Chaturvedi, Lokesh, WIPP Site and Vicinity Geological Field Trip. A Report of a Field Tripto the Proposed Waste Isolation Pilot Plant Project in Southeastern New Mexico, June 16 to18, 1980, October 1980.
EEG-8 Wofsy, Carla, The Significance of Certain Rustler Aquifer Parameters for Predicting Long-Term Radiation Doses from WIPP, September 1980.
EEG-9 Spiegler, Peter, An Approach to Calculating Upper Bounds on Maximum Individual DosesFrom the Use of Contaminated Well Water Following a WIPP Repository Breach, September1981.
EEG-10 Radiological Health Review of the Final Environmental Impact Statement (DOE/EIS-0026)Waste Isolation Pilot Plant, U. S. Department of Energy, January 1981.
EEG-11 Channell, James K., Calculated Radiation Doses From Radionuclides Brought to the Surface ifFuture Drilling Intercepts the WIPP Repository and Pressurized Brine, January 1982.
EEG-12 Little, Marshall S., Potential Release Scenario and Radiological Consequence Evaluation ofMineral Resources at WIPP, May 1982.
EEG-13 Spiegler, Peter, Analysis of the Potential Formation of a Breccia Chimney Beneath the WIPPRepository, May 1982.
EEG-14 Not published.

LIST OF EEG REPORTS (CONTINUED)
B-2
EEG-15 Bard, Stephen T., Estimated Radiation Doses Resulting if an Exploratory Borehole Penetratesa Pressurized Brine Reservoir Assumed to Exist Below the WIPP Repository Horizon - ASingle Hole Scenario, March 1982.
EEG-16 Radionuclide Release, Transport and Consequence Modeling for WIPP. A Report of aWorkshop Held on September 16-17, 1981, February 1982.
EEG-17 Spiegler, Peter, Hydrologic Analyses of Two Brine Encounters in the Vicinity of the WasteIsolation Pilot Plant (WIPP) Site, December 1982.
EEG-18 Spiegler, Peter and Dave Updegraff, Origin of the Brines Near WIPP from the Drill HolesERDA-6 and WIPP-12 Based on Stable Isotope Concentration of Hydrogen and Oxygen,March 1983.
EEG-19 Channell, James K., Review Comments on Environmental Analysis Cost Reduction Proposals(WIPP/DOE-136) July 1982, November 1982.
EEG-20 Baca, Thomas E., An Evaluation of the Non-Radiological Environmental Problems Relating tothe WIPP, February 1983.
EEG-21 Faith, Stuart, Peter Spiegler, Kenneth R. Rehfeldt, The Geochemistry of Two PressurizedBrines From the Castile Formation in the Vicinity of the Waste Isolation Pilot Plant (WIPP)Site, April 1983.
EEG-22 EEG Review Comments on the Geotechnical Reports Provided by DOE to EEG Under theStipulated Agreement Through March 1, 1983, April 1983.
EEG-23 Neill, Robert H., James K. Channell, Lokesh Chaturvedi, Marshall S. Little, Kenneth Rehfeldt,Peter Spiegler, Evaluation of the Suitability of the WIPP Site, May 1983.
EEG-24 Neill, Robert H. and James K. Channell, Potential Problems From Shipment of High-CurieContent Contact-Handled Transuranic (CH-TRU) Waste to WIPP, August 1983.
EEG-25 Chaturvedi, Lokesh, Occurrence of Gases in the Salado Formation, March 1984.
EEG-26 Spiegler, Peter, Proposed Preoperational Environmental Monitoring Program for WIPP,November 1984.
EEG-27 Rehfeldt, Kenneth, Sensitivity Analysis of Solute Transport in Fractures and Determination ofAnisotropy Within the Culebra Dolomite, September 1984.
EEG-28 Knowles, H. B., Radiation Shielding in the Hot Cell Facility at the Waste Isolation Pilot Plant:A Review, November 1984.
EEG-29 Little, Marshall S., Evaluation of the Safety Analysis Report for the Waste Isolation PilotPlant Project, May 1985.
EEG-30 Dougherty, Frank, Tenera Corporation, Evaluation of the Waste Isolation Pilot PlantClassification of Systems, Structures and Components, July 1985.

LIST OF EEG REPORTS (CONTINUED)
B-3
EEG-31 Ramey, Dan, Chemistry of the Rustler Fluids, July 1985.
EEG-32 Chaturvedi, Lokesh and James K. Channell, The Rustler Formation as a Transport Mediumfor Contaminated Groundwater, December 1985.
EEG-33 Channell, James K., John C. Rodgers, Robert H. Neill, Adequacy of TRUPACT-I Design forTransporting Contact-Handled Transuranic Wastes to WIPP, June 1986.
EEG-34 Chaturvedi, Lokesh, (ed.), The Rustler Formation at the WIPP Site, Report of a Workshop onthe Geology and Hydrology of the Rustler Formation as it Relates to the WIPP Project,February 1987.
EEG-35 Chapman, Jenny B., Stable Isotopes in Southeastern New Mexico Groundwater: Implicationsfor Dating Recharge in the WIPP Area, October 1986.
EEG-36 Lowenstein, Tim K., Post Burial Alteration of the Permian Rustler Formation Evaporites,WIPP Site, New Mexico, April 1987.
EEG-37 Rodgers, John C., Exhaust Stack Monitoring Issues at the Waste Isolation Pilot Plant,November 1987.
EEG-38 Rodgers, John C. and Jim W. Kenney, A Critical Assessment of Continuous Air MonitoringSystems at the Waste Isolation Pilot Plant, March 1988.
EEG-39 Chapman, Jenny B., Chemical and Radiochemical Characteristics of Groundwater in theCulebra Dolomite, Southeastern New Mexico, March 1988.
EEG-40 Review of the Final Safety Analyses Report (Draft), DOE Waste Isolation Pilot Plant,December 1988, May 1989.
EEG-41 Review of the Draft Supplement Environmental Impact Statement, DOE Waste Isolation PilotPlant, July 1989.
EEG-42 Chaturvedi, Lokesh, Evaluation of the DOE Plans for Radioactive Experiments andOperational Demonstration at WIPP, September 1989.
EEG-43 Kenney, Jim W., John Rodgers, Jenny Chapman, Kevin Shenk, Preoperational RadiationSurveillance of the WIPP Project by EEG 1985-1988, January 1990.
EEG-44 Greenfield, Moses A., Probabilities of a Catastrophic Waste Hoist Accident at the WasteIsolation Pilot Plant, January 1990.
EEG-45 Silva, Matthew K., Preliminary Investigation into the Explosion Potential of Volatile OrganicCompounds in WIPP CH-TRU Waste, June 1990.
EEG-46 Gallegos, Anthony F. and James K. Channell, Risk Analysis of the Transport of ContactHandled Transuranic (CH-TRU) Wastes to WIPP Along Selected Highway Routes in NewMexico Using RADTRAN IV, August 1990.

LIST OF EEG REPORTS (CONTINUED)
B-4
EEG-47 Kenney, Jim W. and Sally C. Ballard, Preoperational Radiation Surveillance of the WIPPProject by EEG During 1989, December 1990.
EEG-48 Silva, Matthew, An Assessment of the Flammability and Explosion Potential of TransuranicWaste, June 1991.
EEG-49 Kenney, Jim, Preoperational Radiation Surveillance of the WIPP Project by EEG During1990, November 1991.
EEG-50 Silva, Matthew K. and James K. Channell, Implications of Oil and Gas Leases at the WIPP onCompliance with EPA TRU Waste Disposal Standards, June 1992.
EEG-51 Kenney, Jim W., Preoperational Radiation Surveillance of the WIPP Project by EEG During1991, October 1992.
EEG-52 Bartlett, William T., An Evaluation of Air Effluent and Workplace Radioactivity Monitoringat the Waste Isolation Pilot Plant, February 1993.
EEG-53 Greenfield, Moses A. and Thomas J. Sargent, A Probabilistic Analysis of a CatastrophicTransuranic Waste Hoist Accident at the WIPP, June 1993.
EEG-54 Kenney, Jim W., Preoperational Radiation Surveillance of the WIPP Project by EEG During1992, February 1994.
EEG-55 Silva, Matthew K., Implications of the Presence of Petroleum Resources on the Integrity of theWIPP, June 1994.
EEG-56 Silva, Matthew K. and Robert H. Neill, Unresolved Issues for the Disposal of Remote-HandledTransuranic Waste in the Waste isolation Pilot Plant, September 1994.
EEG-57 Lee, William W.-L, Lokesh Chaturvedi, Matthew K. Silva, Ruth Weiner, and Robert H. Neill,An Appraisal of the 1992 Preliminary Performance Assessment for the Waste Isolation PilotPlant, September 1994.
EEG-58 Kenney, Jim W., Paula S. Downes, Donald H. Gray, Sally C. Ballard, Radionuclide Baselinein Soil Near Project Gnome and the Waste Isolation Pilot Plant, June 1995.
EEG-59 Greenfield, Moses A. and Thomas J. Sargent, An Analysis of the Annual Probability of Failureof the Waste Hoist Brake System at the Waste Isolation Pilot Plant (WIPP), November 1995.
EEG-60 Bartlett, William T. and Ben A. Walker, The Influence of Salt Aerosol on Alpha RadiationDetection by WIPP Continuous Air Monitors, January 1996.
EEG-61 Neill, Robert, Lokesh Chaturvedi, William W.-L. Lee, Thomas M. Clemo, Matthew K. Silva,Jim W. Kenney, William T. Bartlett, and Ben A. Walker, Review of the WIPP DraftApplication to Show Compliance with EPA Transuranic Waste Disposal Standards, March1996.

LIST OF EEG REPORTS (CONTINUED)
B-5
EEG-62 Silva, Matthew K., Fluid Injection for Salt Water Disposal and Enhanced Oil Recovery as aPotential Problem for the WIPP: Proceedings of a June 1995 Workshop and Analysis, August1996.
EEG-63 Maleki, Hamid and Lokesh Chaturvedi, Stability Evaluation of the Panel 1 Rooms and theE140 Drift at WIPP, August 1996.
EEG-64 Neill, Robert H., James K. Channell, Peter Spiegler, Lokesh Chaturvedi, Review of the DraftSupplement to the WIPP Environmental Impact Statement, DOE/EIS-0026-S-2, April 1997.
EEG-65 Greenfield, Moses A. and Thomas J. Sargent, Probability of Failure of the Waste Hoist BrakeSystem at the Waste Isolation Pilot Plant (WIPP), January 1998.
EEG-66 Channell, James K. and Robert H. Neill, Individual Radiation Doses From Transuranic WasteBrought to the Surface by Human Intrusion at the WIPP, February 1998.
EEG-67 Kenney, Jim W., Donald H. Gray, and Sally C. Ballard, Preoperational Radiation Surveillanceof the WIPP Project by EEG During 1993 Though 1995, March 1998.
EEG-68 Neill, Robert H., Lokesh Chaturvedi, Dale F. Rucker, Matthew K. Silva, Ben A. Walker,James K. Channell, Thomas M. Clemo, Evaluation of the WIPP Project’s Compliance with theEPA Radiation Protection Standards for Disposal of Transuranic Waste, March 1998.
EEG-69 Rucker, Dale, Sensitivity Analysis of Performance Parameters Used In Modeling the WasteIsolation Pilot Plant, May 1998.
EEG-70 Bartlett, William T. and Jim W. Kenney, EEG Observations of the March 1998 WIPPOperational Readiness Review Audit, May 1998.
EEG-71 Maleki, Hamid, Mine Stability Evaluation of Panel 1 During Waste Emplacement Operationsat WIPP, July 1998.
EEG-72 Channell, James K. and Robert H. Neill, A Comparison of the Risks from the HazardousWaste and Radioactive Waste Portions of the WIPP Inventory, July 1999.
EEG-73 Kenney, Jim W., Donald H. Gray, Sally C. Ballard, and Lokesh Chaturvedi, PreoperationalRadiation Surveillance of the WIPP Project by EEG from 1996 - 1998, October 1999.
EEG-74 Greenfield, Moses A. and Thomas J. Sargent, Probability of Failure of the TRUDOCK CraneSystem at the Waste Isolation Pilot Plant (WIPP), April 2000.