probationary admit students: an exploratory … admit students: an exploratory study of first-year...
TRANSCRIPT
Probationary Admit Students: An Exploratory Study of First-Year Retention
by
Tara R. Warne, Associate Research Analyst, Institutional Research and Planning, University of Missouri System, 573-884-6674, [email protected]
Study submitted for presentation at the Association of Institutional Research International Forum, San Diego, California
1:50 Monday, May 30, 2005 ______________________________________________________________________________

1
Introduction
This study was conducted in response to a request from the Provost, Vice-
Provost for Undergraduate Studies and Vice-Provost for Enrollment Management. They
asked our office to examine first-year success and retention patterns among first-time-
college freshmen admitted to the university on academic probation. Specifically, they
wanted to know if this group of students earned lower grades and if they are retained at
lower rates than students who do meet the university’s admission requirements, with a
goal of establishing some guidelines to assist Admissions with making offers of
admission to students in this population who were more likely to succeed and be
retained.
The admissions requirements at the university exceed those established by the
state. In particular, the university requires more high school credits in math, English,
and science than the minimum state requirements. The university requires a minimum
ACT composite score of 24. Both state and university policies allow institutions to admit
10% of each entering class with deficiencies vis á vis the admissions requirements.
Students admitted to the university on academic probation are required to maintain a
2.0 GPA in 12 graded credit hours in order to remain at school.
It was not apparent from this first phase of the study how best to conceptualize
deficiencies in the high school core coursework in order to better understand its
relationship to retention and success. This study develops and tests three different ways
of measuring this weakness in college preparation, and does so in the context of

2
regression models accounting for demographic, pre-college, and first-year experience
variables.
Research Questions
• What factors contribute to and detract from the likelihood of probationary admit
students being retained?
• What factors best predict first-year GPAs of probationary admit students?
• Which, if any, measures of high school core coursework deficiency best
contribute to our understanding of which probationary admit students are
retained or are successful?
Literature Review
This study finds itself uncomfortably located at the intersection of two literatures.
The first is the student departure literature pioneered by Tinto’s (1975, 1993)
interactionalist model, arguing that initial characteristics, precollege schooling
experiences, as well as the academic affect student departure and normative structures
of the institution students choose to attend. A vast literature has evolved in response to
Tinto’s original work. Some have suggested the need to incorporate economic and
financial variables into models of persistence (St. John et al., 2000; St. John, 1994 and
Cabrera, Nora, and Castañeda, 1993). Stage and Rushin (1993) linked an examination
of college choice with persistence. These studies suggest, with varying degrees of
success, that increasing integration within both the academic and social life of the
university increases student persistence in college (Braxton, Sullivan and Johnson,
1997).

3
Stodt (1987) traces two key components of student retention. The first, echoing
Tinto (1975), deals with intra-student processes. These processes include student
satisfaction with his or her involvement with their institution. Satisfaction is measured in
a variety of ways such as interaction with faculty, both quality and quantity and
friendship with fellow students. Importantly, another feature of intra-student processes is
the balance between the need for challenge and the availability of adequate support for
students. Students must also perceive that their efforts will result in a desired outcome.
Institutional factors are the second component playing a role in student retention,
According to Stodt (1987), the ways in which an institution uses its resources impacts its
ability to incite student satisfaction. Colleges and universities must provide adequate
support for faculty teaching development in order to meet students’ in-class and out of
class needs (Pascarella & Terenzini, 1991, 1998). Baldridge, Kemerer, and Green
(1982) also maintain the importance of learning support centers to assist students with
studying. Financial aid policies and other administrative policies can significantly impact
retention as well. Finally, the institution must provide many opportunities for non-
academic student involvement to promote integration to campus life (Stodt, 1987).
The second, enrollment management, literature certainly concerns itself with
retention albeit from a different perspective than that done by scholars working on
student departure. Enrollment management concerns itself with maintaining the pipeline
of students flowing into the institution from the recruitment phase through graduation
(Kroc and Hanson, 2001). Ingersoll (1988) argues that institutions must admit and enroll
students who possess characteristics that fit with their institutional goals. When there is
a poor fit, institutions find it difficult to maintain retention rates let alone improve them.
4
Levitz, Noel, and Richter (1999) argue that an emphasis on first-year retention
can be of most use to enrollment managers, as most attrition occurs at this point. They
contend that affective measures contribute a great deal more to retention that has been
previously credited. First-year experiences are key to setting students on a successful
path through the institution. Listing five key reasons for attrition—personal, social,
academic, life issues, and institutional issues, these authors make several
recommendations for lowering attrition rates. First, approaches to students must be
sufficiently individualized. These mirror, albeit in a more nuanced fashion, those
developed by Ewell (1984) and Adelman (1998) Second, campus strategies must be
systematically linked with each other to foment long-term cultural change in the campus
climate. Dunphy, Miller, Woodruff, and Nelson (1987) also argued in favor of an
emphasis on first-year experiences. They contend that a series of seminars aimed at
addressing college survival skills, easing the freshman transition, and major and career
exploration can help students acclimate to the institution and find a success path for
themselves. Dunphy et al. also outlined an aggressive and intervention based advising
program for students who had experienced some academic success prior to college but
find themselves struggling with the challenges of college-level work and living. They
specifically did not target students who entered the institution with known academic
deficiencies.
Valverde (1987) and Moore and Carpenter (1987) develop different ways of
accounting for students’ preparation for college when discussing retention. Adelman
(1998) develops a notion of academic risk as well. For Valverde (1987) the most salient
aspects of preparation lie in a student’s socioeconomic status measure by income and
5
experience as a first-generation college student. Moore and Carpenter (1987) use
socioeconomic indicators, but note that students who aren’t financially underprivileged
can be academically unprepared as well. However, they emphasize cognitive factors
and exclude students who have performed poorly in high school. They look for those
who are more ephemerally underprepared. Adelman (1998), on the other hand,
develops measures of the degree of instability in high school preparation, middle-school
grades, in addition to more traditional socioeconomic and engagement variables.
Most public institutions admit students who, at the outset, it acknowledges are a
poor fit as determined by stated admissions requirements. There are few studies
examining this population of students—those who are admitted with significant and
obvious academic deficiencies. Rather it seems to be an unstated presumption that
relatively high attrition rates are to be expected from this group of students. Moreover,
these students are not the voluntary school leavers emphasized in the departure
literature. The students in the population examined for this study at any rate by and
large left the institution after experiencing significant academic difficulty resulting in
probation or dismissal. The constructs advanced by this literature, however, are useful
for developing models that can assist admissions offices in their admission decisions for
students who don’t fit the mold outlined by admissions requirement. Furthermore, these
constructs can assist those working in student services in better assisting students who
enter with a high degree of acknowledged academic risk.

6
Study Population
The population for this study consists of 1511 first-time-college freshmen
admitted to the university on academic probation from Fall 1999 to Fall 2003.
Table 1: Characteristics of Probationary Admit Students
Population Characteristics
Ethnicity Gender First-Generation College IncomeCaucasian 78% Male 55% Yes 32% < $20,000 9%Underrepresented Minority 16% Female 45% No 68% $20,000-$40,000 11%Other 6% $40,000-$60,000 11%
$60,000-$80,000 9%$80,000-$100,000 8%>$100,000 9%No FAFSA 44%
H.S. Setting Major Academic Unit
Urban 22% Declared 48% Arts & Science 41%Suburban 41% Undeclared 52% Business 20%
Rural 14%Ag/Natural Resources 11%
Out of State 18% Education 7%GED 2% Engineering 4%
Home Schooled 3%
Human Environmental Sciences 3%Journalism 10%Nursing 2%Health Professions 2%
An initial analysis of the data indicated that the retention rates of probationary
admit students lagged behind those of the general population of FTC freshmen by about
15%. Students admitted on academic probation also exhibited 21% lower success
rates, success being defined as earning a 2.0 cumulative GPA after their first-year at

7
the university. Underrepresented minority students admitted on probation were retained
at the same rate as probationary admits as a whole, and at the same rates as
Caucasian students admitted on probation. Female students admitted on probation
were retained at slightly higher rates, 5% more, than male students. First-generation
college students admitted on probation were retained at 9% lower rates than students
whose families had some college education. Students whose families earned less than
$20,000 per year were retained at 15% lower rates than the population of probationary
admits as a whole. Furthermore, they were retained at 20% lower rates than students
whose families earned more than $100,000 per year. Urban students admitted on
probation were retained at the highest rates (72%) among the various high school
settings. Rural students, on the other hand, were retained 61% of the time. Home
schooled and GED students were retained at the lowest rates, only 41%.
There was a slight difference in retention rates between students who had
chosen a major and those who were undecided. Students with a declared degree
program were retained at a 66% rate, while undeclared students were retained at a 71%
rate. There were some differences in retention rates among students in different
academic divisions. The colleges of Business, Agriculture & Natural Resources,
Education, Nursing, and Journalism all had retention rates higher than for the population
of probationary admits as a whole. Arts & Science, Human Environmental Sciences,
and Health Professions retained students at about the same rate as the overall
population, while Engineering retained students at an 18% lower rate than the group of
probationary admits as a whole.

8
The major finding from the initial descriptive analysis indicated that students
granted admission despite deficiencies in their high school core courses exhibited lower
success and retention rates than did students admitted with only deficient ACT scores.
Specifically, students with deficiencies in ACT composite scores had a 75% retention
rate, somewhat better than the group of probationary admits as a whole. Students with
deficiencies in their high school coursework and those with both ACT and high school
coursework weaknesses were 16% less likely to be retained than those with only an
ACT score deficiency.
Methodology
The study was conducted at large residential research institution with just over
25,000 students, admitting approximately 4500 new freshmen each fall. Three methods
of data analysis were used to address the research questions posed above. First,
additional exploration of the descriptive statistics such as frequency tables and cross
tabs took place to aid in the development of the explanatory models. Interactions
between all of the variables were examined. Second, a linear (OLS) model was created
to determine which characteristics and course-taking behaviors contributed to higher
GPAs among probationary admit students at this institution. Finally, a logistic regression
model was used to explore the relationships between these same variables, to be
outlined below) and the likelihood of retention. Both the linear and logistic models were
run three times. Each iteration substituted a different measure of high school core
course deficiency. All of the other independent variables remained the same throughout
the various analyses. All categorical independent variables were dummy coded.
9
Models
The models outlined here draw upon two competing sub-literatures within the
larger body of scholarship addressing student retention. One body of work contends
that high school preparation and demographic characteristics are more important
predictors, while the second literature argues that institutional factors and student
behaviors in their first-year exert greater influence on retention and success. The
models developed for this study use variables from both pre-college and first-year
characteristics and experiences. The variables measuring first year course taking were
developed through conversations with the Director of Academic Advising and the Vice-
Provost for Undergraduate Studies.
It should be noted, however, that measures of student self-perceptions,
perceptions about the institution, and measures of satisfaction and motivation etcetera
are not available for this institution. The analysis is limited by fact in that in some ways
we know very little about the students making up this population beyond general
demographic descriptors, their academic performance, and course-taking habits.
10
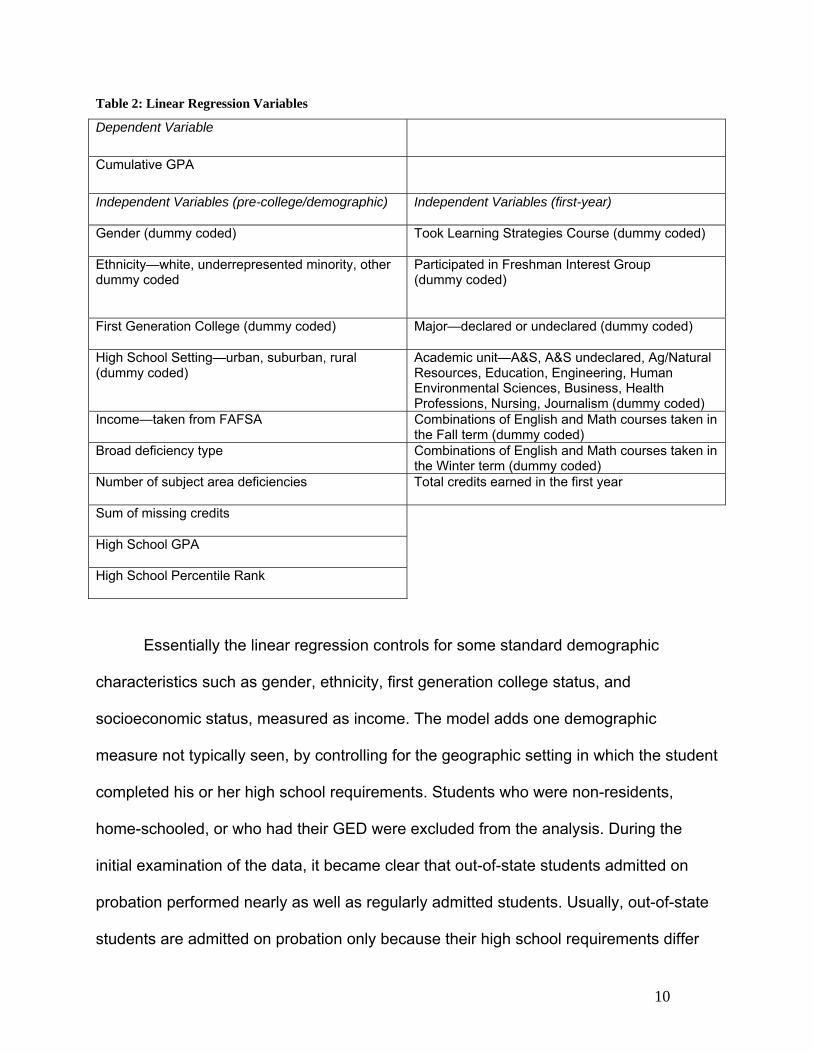
Table 2: Linear Regression Variables
Dependent Variable
Cumulative GPA
Independent Variables (pre-college/demographic) Independent Variables (first-year)
Gender (dummy coded) Took Learning Strategies Course (dummy coded)
Ethnicity—white, underrepresented minority, other dummy coded
Participated in Freshman Interest Group (dummy coded)
First Generation College (dummy coded) Major—declared or undeclared (dummy coded)
High School Setting—urban, suburban, rural (dummy coded)
Academic unit—A&S, A&S undeclared, Ag/Natural Resources, Education, Engineering, Human Environmental Sciences, Business, Health Professions, Nursing, Journalism (dummy coded)
Income—taken from FAFSA Combinations of English and Math courses taken in the Fall term (dummy coded)
Broad deficiency type Combinations of English and Math courses taken in the Winter term (dummy coded)
Number of subject area deficiencies Total credits earned in the first year
Sum of missing credits
High School GPA
High School Percentile Rank
Essentially the linear regression controls for some standard demographic
characteristics such as gender, ethnicity, first generation college status, and
socioeconomic status, measured as income. The model adds one demographic
measure not typically seen, by controlling for the geographic setting in which the student
completed his or her high school requirements. Students who were non-residents,
home-schooled, or who had their GED were excluded from the analysis. During the
initial examination of the data, it became clear that out-of-state students admitted on
probation performed nearly as well as regularly admitted students. Usually, out-of-state
students are admitted on probation only because their high school requirements differ
11
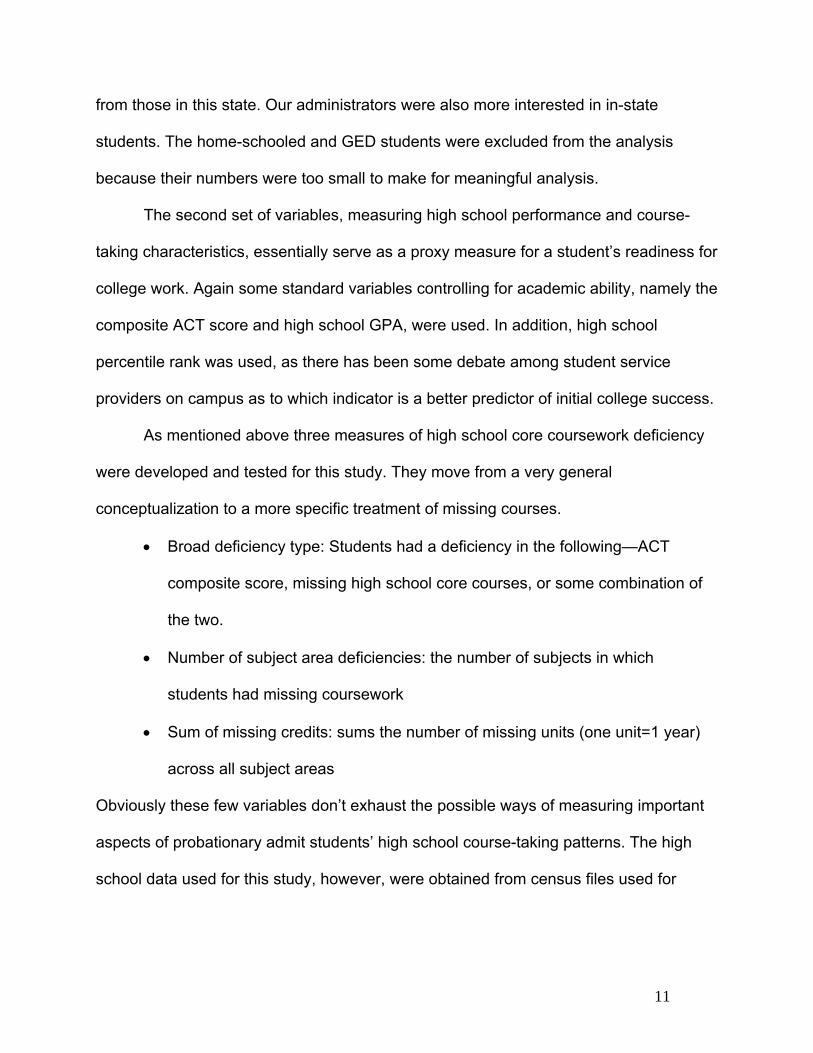
from those in this state. Our administrators were also more interested in in-state
students. The home-schooled and GED students were excluded from the analysis
because their numbers were too small to make for meaningful analysis.
The second set of variables, measuring high school performance and course-
taking characteristics, essentially serve as a proxy measure for a student’s readiness for
college work. Again some standard variables controlling for academic ability, namely the
composite ACT score and high school GPA, were used. In addition, high school
percentile rank was used, as there has been some debate among student service
providers on campus as to which indicator is a better predictor of initial college success.
As mentioned above three measures of high school core coursework deficiency
were developed and tested for this study. They move from a very general
conceptualization to a more specific treatment of missing courses.
• Broad deficiency type: Students had a deficiency in the following—ACT
composite score, missing high school core courses, or some combination of
the two.
• Number of subject area deficiencies: the number of subjects in which
students had missing coursework
• Sum of missing credits: sums the number of missing units (one unit=1 year)
across all subject areas
Obviously these few variables don’t exhaust the possible ways of measuring important
aspects of probationary admit students’ high school course-taking patterns. The high
school data used for this study, however, were obtained from census files used for
12
statewide reporting. These datasets don’t include information about grades in individual
high school courses, nor do they indicate which specific courses were taken.
Finally, variables measuring first-year course taking were included. The
university offers three types of first-year-experience (FYE) courses for which students
may earn academic credit. A learning strategies course helps students learn how to
navigate their coursework, deal effectively with faculty, plan their course of study, and
effectively complete assignments and prepare for exams. The Freshman Interest Group
(FIG) program combines coenrollment in 3 courses, common living areas, and a
proseminar course. Students may also take major-orientation courses that provide
broad overviews of the programs offered by some of the academic units on campus.
None of the FYE courses are required, although students, particularly those deemed to
be at academic risk are strongly encouraged to take either the learning strategies
course, or participate in a FIG.
A variable indicating whether or not each student had decided on an academic
program and indicating each student’s initial academic unit were also included. While
each student’s major was available, many degree programs simply had too few
students (admitted on probation) to make for meaningful analysis. At the request of the
Director of Advising, variables measuring whether or not students took English
composition and a math together in either the fall or winter of their first year were also
included. Common wisdom on campus holds that taking these two courses together
significantly disadvantages students, particularly those with weak academic preparation.
A variable indicating how many credit hours students earned over the course of their
first year were included as well.
13
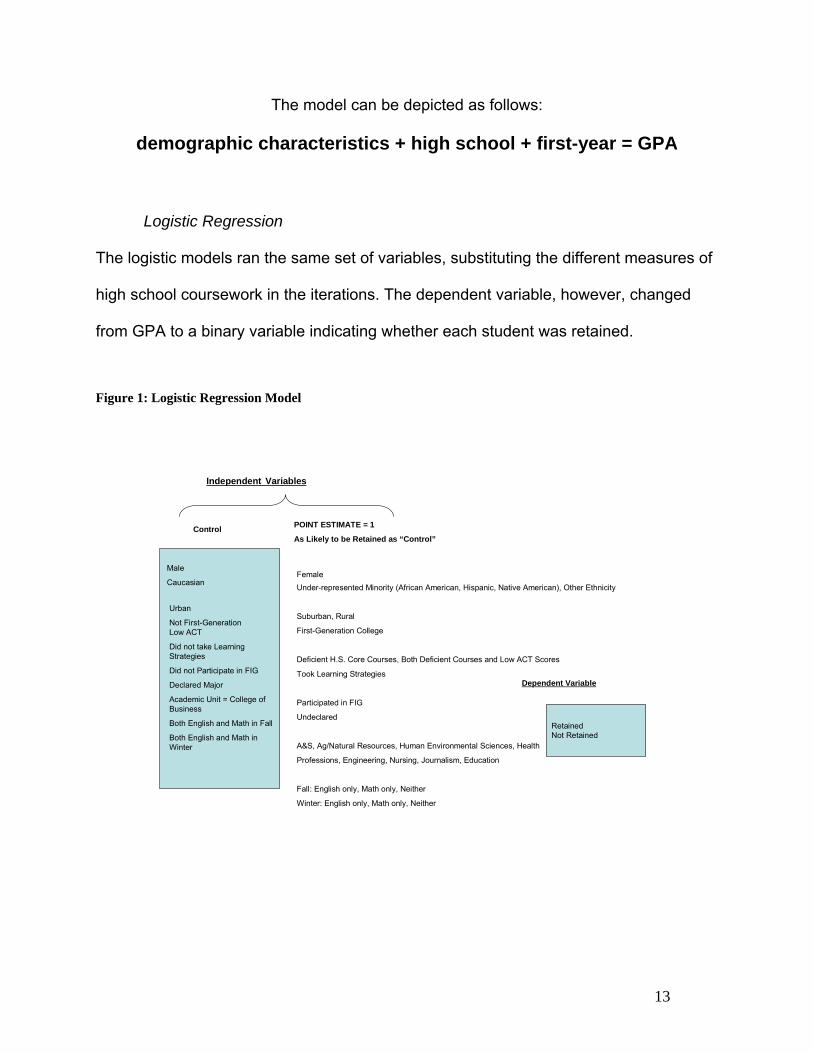
The model can be depicted as follows:
demographic characteristics + high school + first-year = GPA
Logistic Regression
The logistic models ran the same set of variables, substituting the different measures of
high school coursework in the iterations. The dependent variable, however, changed
from GPA to a binary variable indicating whether each student was retained.
Figure 1: Logistic Regression Model
Control
Independent Variables
Male
CaucasianFemaleUnder-represented Minority (African American, Hispanic, Native American), Other Ethnicity
Suburban, Rural
First-Generation College
Deficient H.S. Core Courses, Both Deficient Courses and Low ACT Scores
Took Learning Strategies
Participated in FIG
Undeclared
A&S, Ag/Natural Resources, Human Environmental Sciences, Health
Professions, Engineering, Nursing, Journalism, Education
Fall: English only, Math only, Neither
Winter: English only, Math only, Neither
Urban
Not First-GenerationLow ACT
Did not take Learning Strategies
Did not Participate in FIG
Declared Major
Academic Unit = College of Business
Both English and Math in Fall
Both English and Math in Winter
POINT ESTIMATE = 1
As Likely to be Retained as “Control”
Dependent Variable
RetainedNot Retained

14
Findings
Table 3: Three Linear Models Compared Linear RegressionModel 1 (Broad Deficiency) Model 2 (Subject Area Deficiency) Model 3 (Sum of Missing Credits)
IV Point Estimate IV Point Estimate IV Point EstimateExcept = H.S. Core Not Significant Subject Deficiencies 0.00678 Sum of Missing Credits -0.04523Except = ACT 0.10054Ethnicity = Minority -0.2278 -0.23001 -0.21721Setting = Rural -0.23257 -0.23441 -0.23384H.S. GPA 0.17416 0.20049 0.17483H.S. % Rank 0.00523 0.00532 0.00623
Learning Strategies = Yes -0.12477 -0.12287 -0.12235Math only in Fall -0.10738 -0.10214 -0.11457
Academic Unit = Ag/Natural Resources 0.20468 0.19245 0.23588Academic Unit = Engineering -0.31175 -0.32481 -0.29647Academic Unit = Nursing 0.3107 0.30418 0.30233
Academic Unit = Human Environmental Sciences 0.28345 0.28218 0.29649Credit 0.03137 0.03212 0.0312Intercept 1.04175 0.91435 0.82051n 1263 1263 1263R2 0.1381 0.1356 0.1386F Test 6.81 6.91 7.09Variables significant at the .10 level or better.
Table 3 compares nearly identical models designed to predict first-year GPA for
students admitted to the university on academic probation. As mentioned above, all of
the independent variables are the same in each model, save for the variable measuring
weaknesses in students’ high school coursework. All three models were significant at
the .0001 level. Each model accounted for similar amounts of variance in probationary
admit students’ first-year GPAs, with the R2s ranging from .1356 to .1386. While this is
certainly a modest degree of variance explained, it’s not inconsequential given the
limitations of the data available for this analysis. With the exception of the variables

15
measuring high school coursework, the same set of independent variables was
significant across the three models.
Seven of the independent variables were statistically significant (p<.10) and
positive. Specifically, having only an ACT composite score deficiency, the number of
high school subject area deficiencies, high school GPA, high school class rank; and
enrollment in Agriculture & Natural Resources, Nursing, and Human Environmental
Sciences all combined to produce higher first year GPAs. In addition, taking higher
credit hours throughout the first year also produced better academic performance.
The direction of most of these coefficients is as anticipated. Although, this author
was somewhat surprised by the magnitude of the academic unit coefficients. They were
larger than anticipated. More importantly, the direction of the coefficient for the number
of subject area deficiencies was surprising. To reiterate, the number of subject area
deficiencies refers to how many required subjects a student had failed to take the
required number of credits. For example, a student missing credits in both high school
English and social studies would have two subject area deficiencies. The positive
direction of this coefficient, despite its tiny magnitude, is puzzling.
Six of the independent variables were statistically significant (p<.10) and
negative. Being an underrepresented minority, from a rural high school, having a higher
number of missing high school credits, taking learning strategies, taking a math course
in the fall, and enrollment in the College of Engineering are all associated with lower first
year GPAs. The direction of most of these coefficients makes sense, save for the
direction of the learning strategies coefficient. Designed to improve students’ study

16
habits and improve engagement, the negative impact on probationary admit GPAs is
very surprising.
A closer examination of the descriptive statistics, however, sheds some light on
this surprising finding. Only 233 students in the population analyzed here took learning
strategies. According to advisors on campus only the students perceived to be most at-
risk are encouraged to take the course as it has limited capacity. Moreover, they report
that students frequently fail to take the course seriously. Looking at the small group of
students who took the course reveals that underrepresented minority students,
particularly males, were the only group to be significantly advantaged by taking the
course. Importantly, taking the course improved this subgroup’s chances of being
retained, but did not lead to higher first-year GPAs.
Table 4: Three Logistic Models Compared
Logistic RegressionModel 1 (Broad Deficiency) Model 2 (Subject Area Deficiency) Model 3 (Sum of Missing Credits)
IV Point Estimate Effect IV Point Estimate Effect IV Point Estimate EffectFemale 1.511 Positive (p<.1) 1.508 Positive (p<.1) 1.539 Positive (p<.1)First-Generation College 0.671 Negative (p<.1) 0.679 Negative (p<.1) Not significantH.S. Rank Not significant 1.016 Positive (p<.1) Not significant
H.S. Core Not significantSubject
Deficiencies Not significantSum of Missing
Credits Not significantBoth Core & ACT Not significant
Took Learning Strategies 0.616 Negative (p<.1) 0.613 Negative (p<.1) 0.643 Negative (p<.1)Credit 1.325 Positive (p<.05) 1.328 Positive (p<.05) 1.317 Positive (p<.05)n 673 673 673
Χ2 258.6655 30 df p<.0001 255.6584 29 df p<.0001 247.3125 29 df p<.0001
% Correct 80.50% 79.90% 80.30%
Again, all three logistic models were significant at the p<.0001 level. The models
yielded similar levels of correct predictions at roughly 80% for each model. Identical sets
of independent variables were used in each model, mimicking the process employed in
the linear regression; only here the dependent variable is first-year retention. A point

17
estimate of 1 indicates that the tested value was as likely to be retained as the control
group. The magnitudes of the odds-ratios were nearly identical across the three logistic
models.
Interestingly the set of statistically significant variables changed from one model
to the next, as the measure of high school coursework deficiency was altered. Only
female and credit were both statistically significant and positive across all three models.
Females were .511 more likely to be retained than males, while students with more
credit hours completed in the first year were .325 more likely to be retained. On
average, retained students earned 27 credit hours in their first year, while probationary
admits who left school took only 20 hours in their first year. High school class rank was
significant and ever so slightly positive only in the model testing the number of subject
area deficiencies.
Only the learning strategies course was statistically significant and negative
across the three models. Students taking the learning strategies course were less likely
to be retained than students who did not take the course, the odds-ratios ranged from
.613 to .643. In the model testing the broad high school course deficiency, first-
generation college students were .671 less likely to be retained. First-generation college
students in the model testing the number of subject area deficiencies were .679 as likely
to be retained as those from families with some experience in college.
None of the measures of high school coursework deficiencies were significant
contributors to a student’s likelihood of being retained. This finding is perplexing given
that the initial analysis of the data indicated something in the high school core
coursework was associated with lower retention rates. When the data are explored
18
more closely, however, there are only small differences in the number of missing credits
between those who are and those who are not retained.
Discussion
While the results of the linear and logistic regression analyses presented here do
not provide definitive answers to the research questions posed at the outset of this
paper, they do offer some direction for admissions and student service personnel
working directly with this population of student. First, an effective measure of a student’s
high school coursework as an indicator of college preparedness remains elusive. The
variables introduced here performed adequately in the linear models, but failed to
register as significant in the logistic models. A portion of the weakness of the measures
can be attributed to the relatively small numbers in the different categories used in the
analysis. Still, it is likely that a better measure, maybe something akin to Adelman’s
(1998) use of the number of Cs and Bs in analyzing middle school transcripts would
prove to be more salient than the measures used here.
The most important finding, however, is that students admitted with
acknowledged academic weaknesses should not be written off as beyond hope, as is
implied in some of the retention literature. While students admitted on academic
probation are certainly at greater risk for both low performance and for leaving school,
nearly 70% of them do manage to remain enrolled. Moreover, there is not a single, nor
is there a systematic constellation of factors identifying the students most at-risk for
departure. It may well be that the inclusion of some of the cognitive and affective

19
variables, were it available, and might make the creation of a more definitive profile
possible.
As it stands, I think the data demonstrate that the Admissions Office does a fairly
good job of screening academically underprepared students. The challenge on this
campus seems to reside more with student service personnel working in academic
advising, the learning center and other support services, and residential life to more
effectively address the needs this population of students have when they arrive on
campus. Specifically, the findings tentatively suggest the need for a more aggressive
program targeting students who can benefit from the various services already offered on
campus, while strengthening the learning strategies component1. Most of the services
available to students on campus are reserved, due grant contract constraints, to ethnic
minorities, first-generation college students, and students from low income families.
These groups do not make up the bulk of students admitted on probation. Adjustments
should be made to make study assistance and similar programs more widely available.
1 The learning strategies course entered an intensive period of redesign starting in Fall 2003. The outcome of these changes cannot be addressed with the data used for this study.

20
References Adelman, C. (Project Officer). (1998, June). Toward resiliency: At-risk students who make it to
college (Office of Educational Research and Improvement). Washington D.C.: U.S. Department of Education02.
Braxton, J., Sullivan, A., & Johnson, R. (1997). Appraising Tinto's theory of college student departure. In J. C. Smart (Ed.), Higher education: A handbook of theory and research (pp. 107-164). New York: Agathon Press.
Cabrera, A. F., Nora, A., & Castenda, M. B. (1993, March/April). College persistence: Structural equations modeling test of an integrated model of student retention. The Journal of Higher Education, 64(2), 123-139.
Dunphy, L., Miller, T. E., Woodruff, T., & Nelson, J. E. (1987). Exemplary retention strategies for the freshman year. In M. M. G. Stodt & W. M. Klepper (Eds.), Increasing retention: Academic and student affairs administrators in partnership (pp. 39-60). New directions for higher education, 60. San Francisco: Jossey-Bass.
Ewell, P. T. (Author). (1984). Conducting student retention studies (National Center for Higher Education Management Systems). Boulder: The College Board.
Ingersoll, R. J. (1988). The enrollment problem: Proven management techniques. New York: Macmillan Publishing Company.
Kemerer, F. R., Baldridge, J., & Green, K. (1982). Enrollment in the eighties: Factors, actors, and impacts (American Association for Education--Educational Resources Information Center/Higher Education Report No. 3). Washington D.C.: American Association for Higher Education.
Kroc, R., & Hanson, G. (2001). Enrollment management and student affairs. In R. Howard (Ed.), Institutional research: Decision support in higher education (pp. 1-40). New directions for institutional research. Tallahassee: Association for Institutional Research.
Levitz, R. S., Noel, L., & Richter, B. J. (1999). Strategic moves for retention success. In G. H. Gaither (Ed.), Promising practices in recruitment, remediation, and retention (pp. 31-50). New directions for higher education, 108. San Francisco: Jossey-Bass.
Moore, W. J., & Carpenter, L. (1987). Academically underprepared students. In L. Noel, R. Levitz & D. Saluri (Eds.), Increasing student retention (pp. 95-115). San Francisco: Jossey-Bass.
Pascarella, E. T., & Terenzini, P. (1991). How college effects students and insights from twenty years of research. San Francisco: Jossey-Bass.
Pascarella, E. T., & Terenzini, P. (1998). Studying college students in the new century: Meeting new challenges. Review of Higher Education, 21, 262-165.
St. John, E. P., Cabrera, A. F., Nora, A., & Asker, E. H. (2002). Economic influences on persistence reconsidered: How can finance research inform the reconceptualization of persistence models? In J. Braxton (Ed.), Reworking the student departure puzzle (pp. 29-47). Memphis: Vanderbilt University Press.
Stage, F. K., & Rushin, P. (1993). A combined model of student predisposition to college and persistence in college. Journal of College Student Development, 34, 276-281.

21
Stodt, M. M. G. (1987). Intentional student development and retention. In M. M. G. Stodt & W. M. Klepper (Eds.), Increasing retention: Academic and student affairs administrators in partnership (pp. 15-37). New directions for higher education, 60. San Francisco: Jossey-Bass.
Tinto, V. (1975). Dropout from higher education: A theoretical synthesis of recent research. Review of Educational Research, 45, 89-125.
Tinto, V. (1993). Leaving college: Rethinking the causes and cures of student attrition. Chicago: University of Chicago Press.
Valverde, L. A. (1987). Low-income students. In L. Noel, R. Levitz & D. Saluri (Eds.), Increasing student retention (pp. 78-94). San Francisco: Jossey-Bass.