problem described incorrectly
TRANSCRIPT

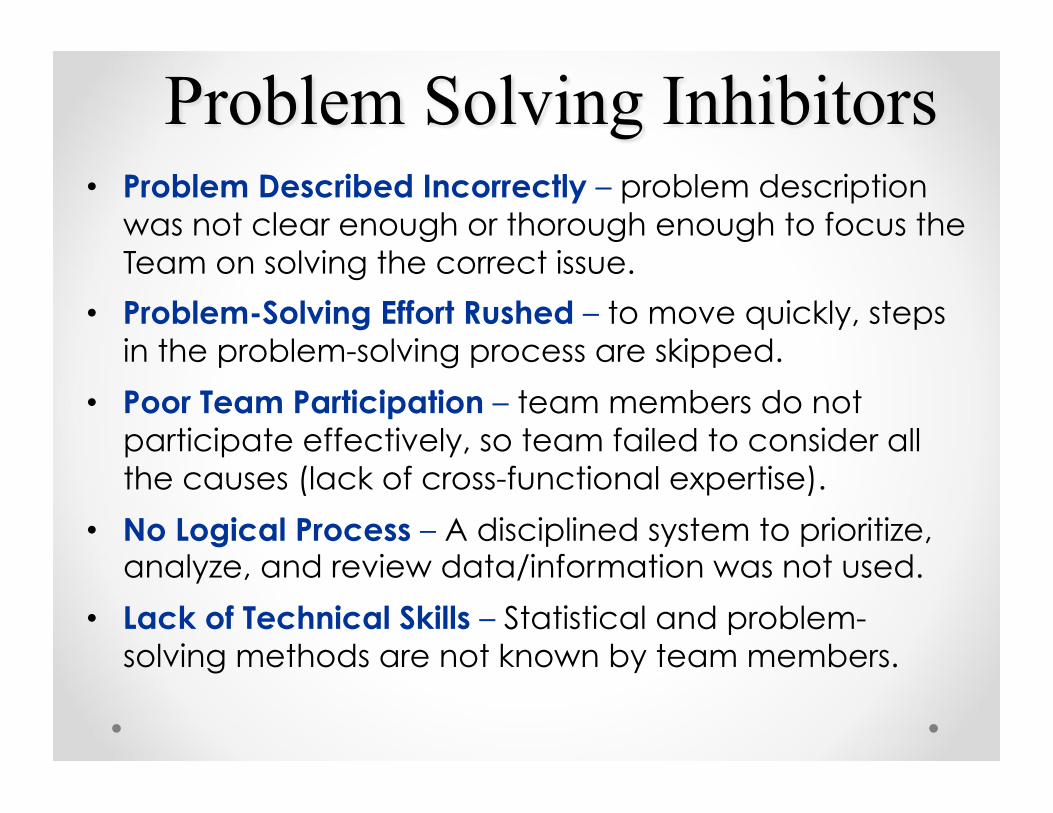
• Problem Described Incorrectly – problem description was not clear enough or thorough enough to focus the Team on solving the correct issue.
• Problem-Solving Effort Rushed – to move quickly, steps in the problem-solving process are skipped.
• Poor Team Participation – team members do not participate effectively, so team failed to consider all the causes (lack of cross-functional expertise).
• No Logical Process – A disciplined system to prioritize, analyze, and review data/information was not used.
• Lack of Technical Skills – Statistical and problem-solving methods are not known by team members.
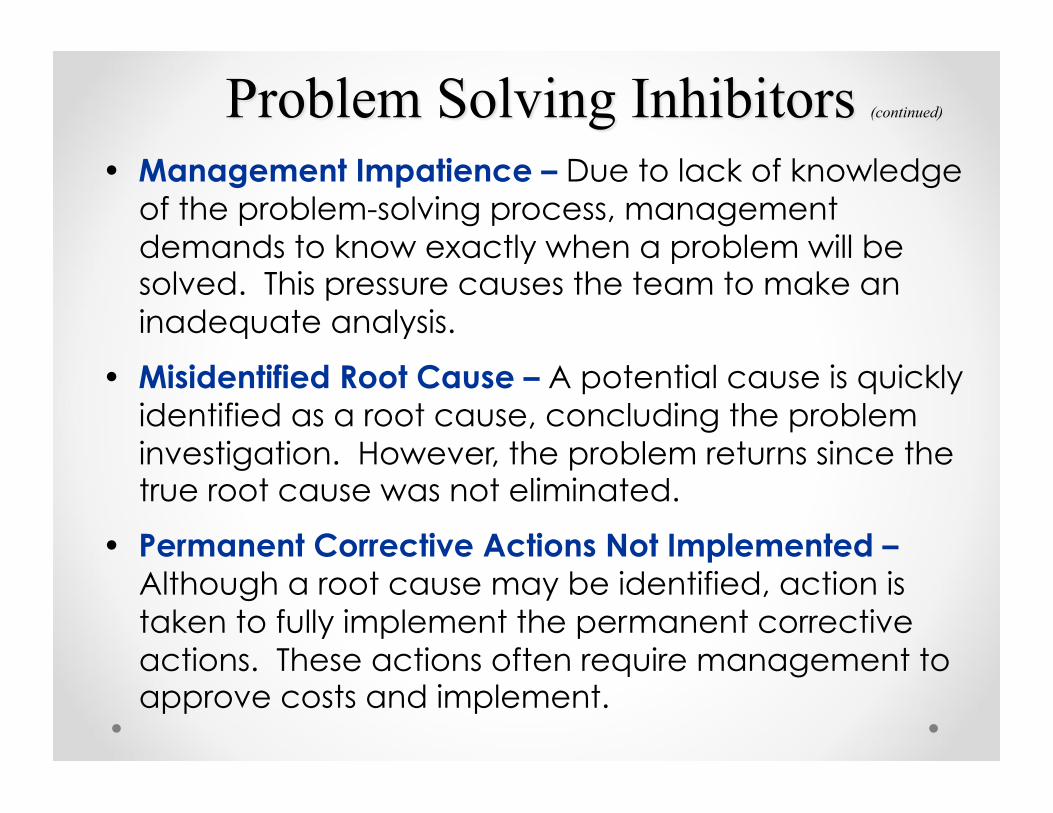
• Management Impatience – Due to lack of knowledge of the problem-solving process, management demands to know exactly when a problem will be solved. This pressure causes the team to make an inadequate analysis.
• Misidentified Root Cause – A potential cause is quickly identified as a root cause, concluding the problem investigation. However, the problem returns since the true root cause was not eliminated.
• Permanent Corrective Actions Not Implemented – Although a root cause may be identified, action is taken to fully implement the permanent corrective actions. These actions often require management to approve costs and implement.
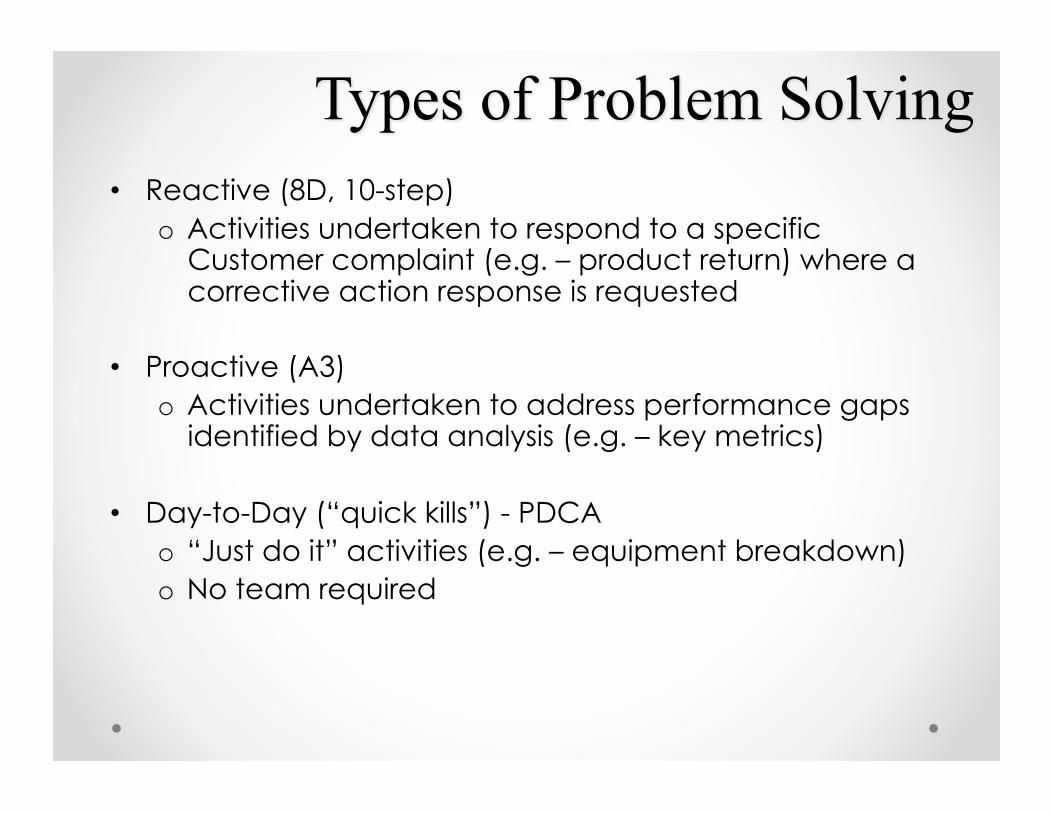
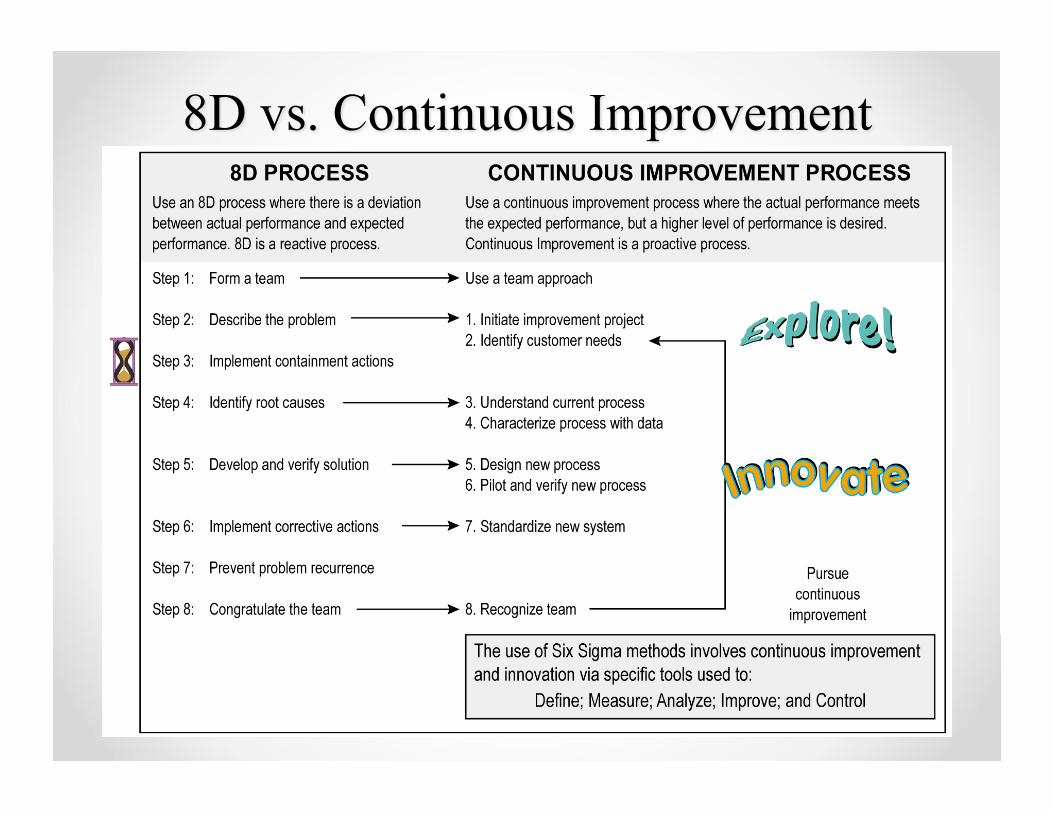
• Reactive (8D, 10-step) o Activities undertaken to respond to a specific
Customer complaint (e.g. – product return) where a corrective action response is requested
• Proactive (A3) o Activities undertaken to address performance gaps
identified by data analysis (e.g. – key metrics)
• Day-to-Day (“quick kills”) - PDCA o “Just do it” activities (e.g. – equipment breakdown) o No team required
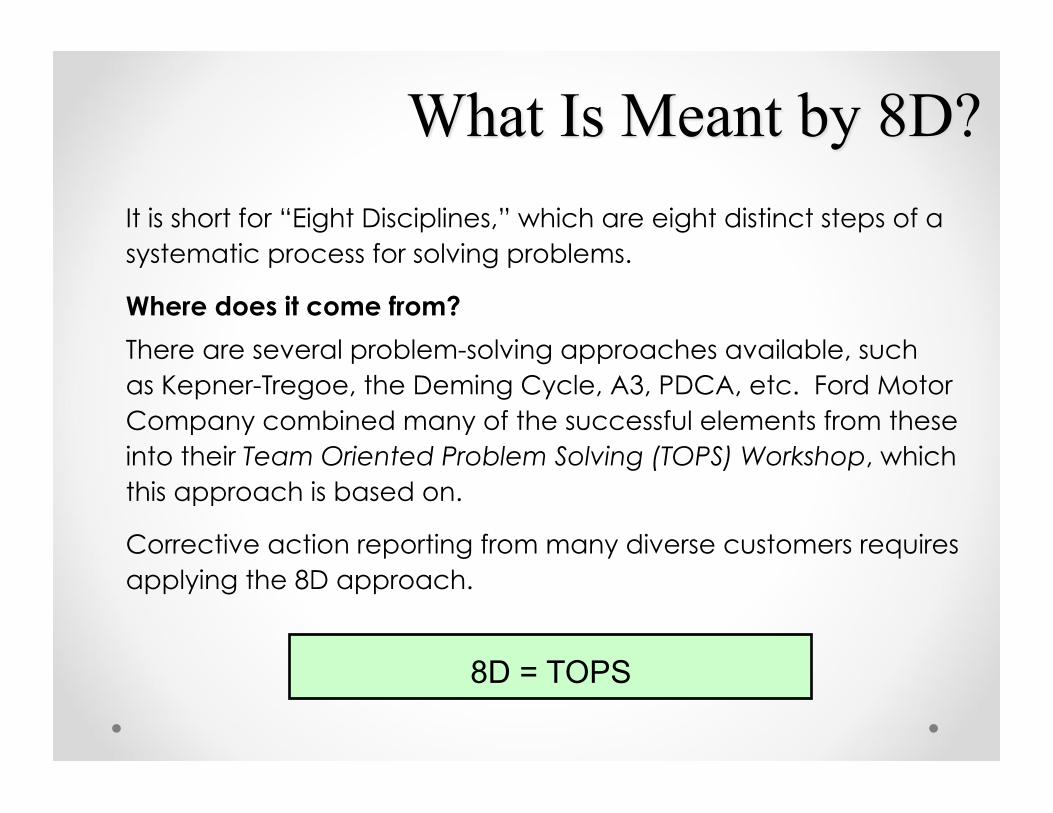
It is short for “Eight Disciplines,” which are eight distinct steps of a systematic process for solving problems.
Where does it come from?
There are several problem-solving approaches available, such as Kepner-Tregoe, the Deming Cycle, A3, PDCA, etc. Ford Motor Company combined many of the successful elements from these into their Team Oriented Problem Solving (TOPS) Workshop, which this approach is based on.
Corrective action reporting from many diverse customers requires applying the 8D approach.
8D = TOPS

• Predicated on team approach.
• Use for a cause-unknown situation (all significant problems, not just Customer Returns)
• Fact-based, data-driven decision making. “If you can’t prove it, don’t say it!”
• Eliminate the Problem, not the Symptom
• Requires action planning and documentation for each step of the process.
• Focus on effectively using the process, NOT on writing the report.
• Keep an open mind – facts/data will guide us
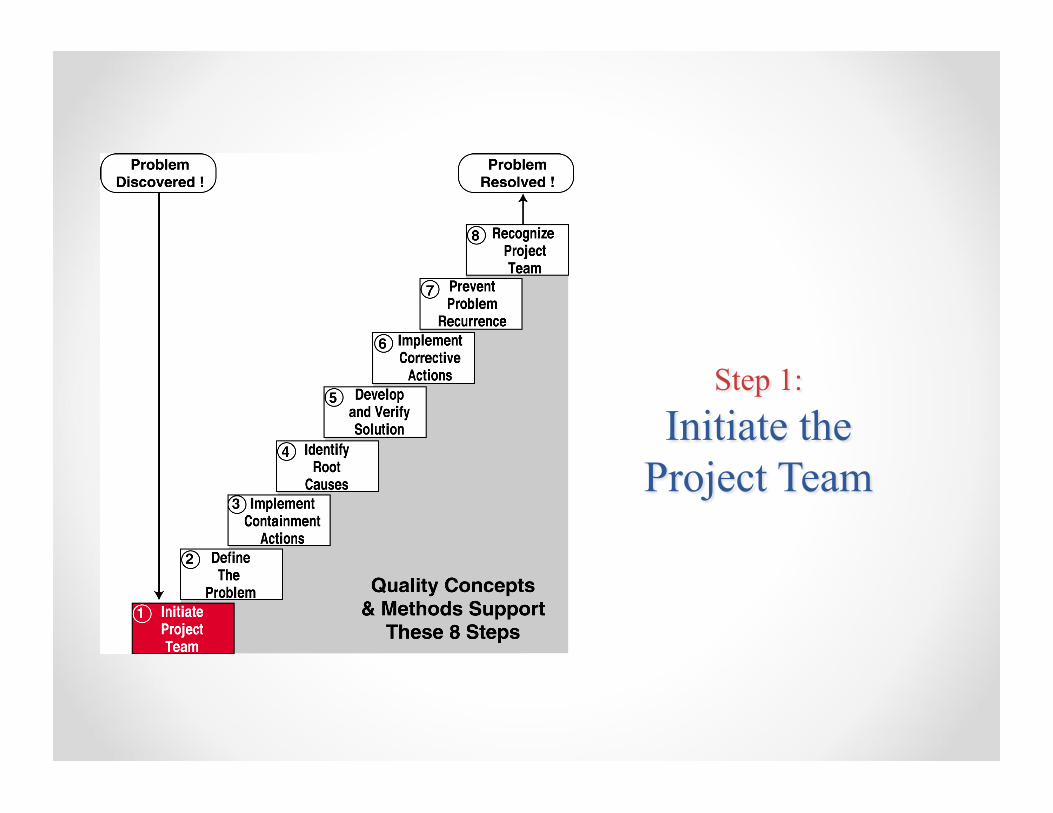
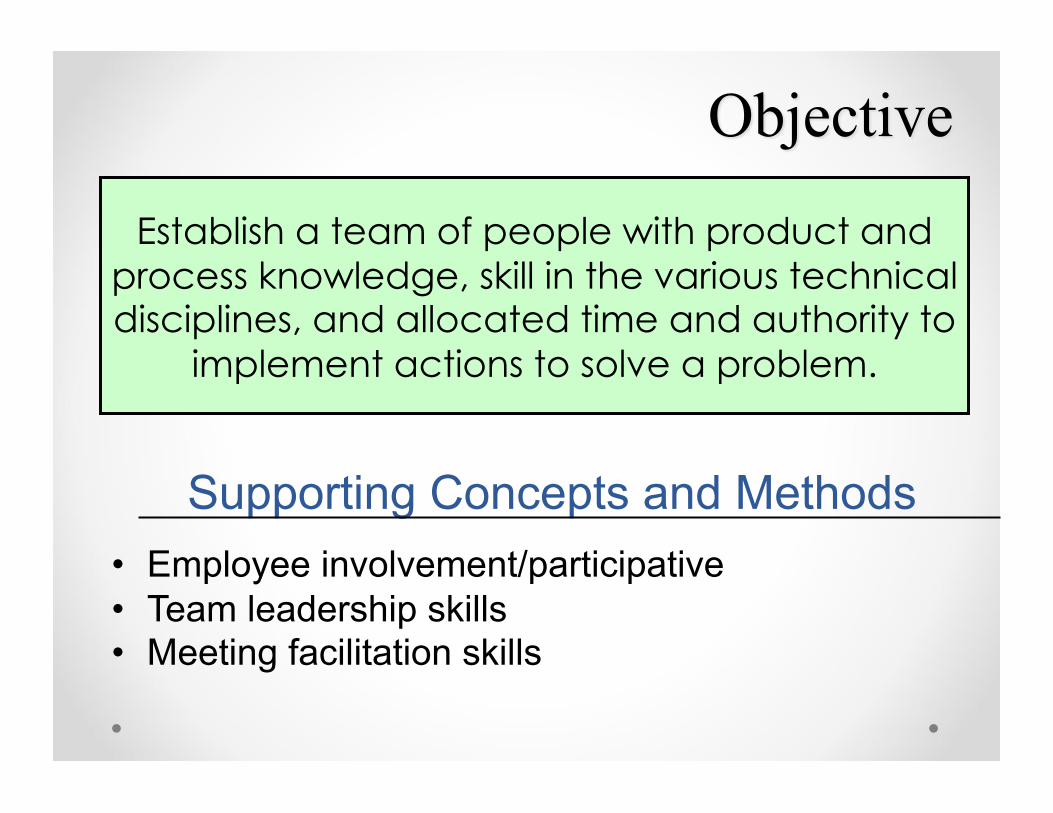
Establish a team of people with product and process knowledge, skill in the various technical disciplines, and allocated time and authority to
implement actions to solve a problem.
Supporting Concepts and Methods • Employee involvement/participative • Team leadership skills • Meeting facilitation skills
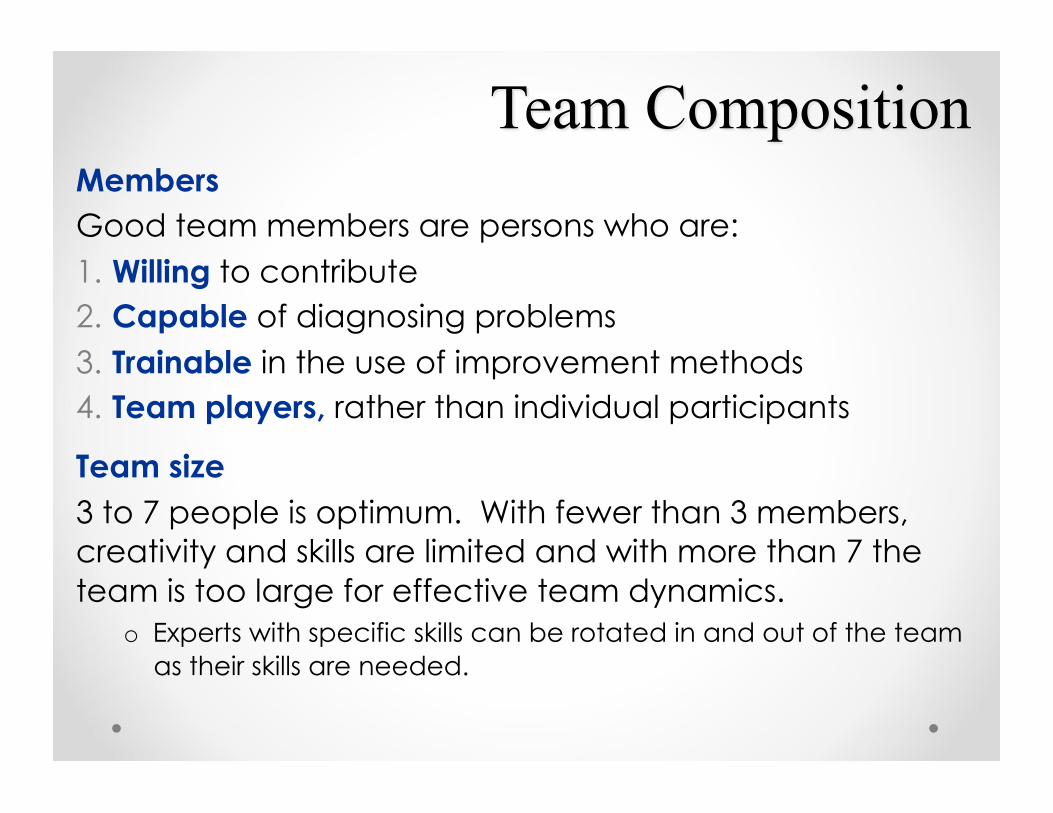
Members Good team members are persons who are: 1. Willing to contribute 2. Capable of diagnosing problems 3. Trainable in the use of improvement methods 4. Team players, rather than individual participants
Team size 3 to 7 people is optimum. With fewer than 3 members, creativity and skills are limited and with more than 7 the team is too large for effective team dynamics.
o Experts with specific skills can be rotated in and out of the team as their skills are needed.
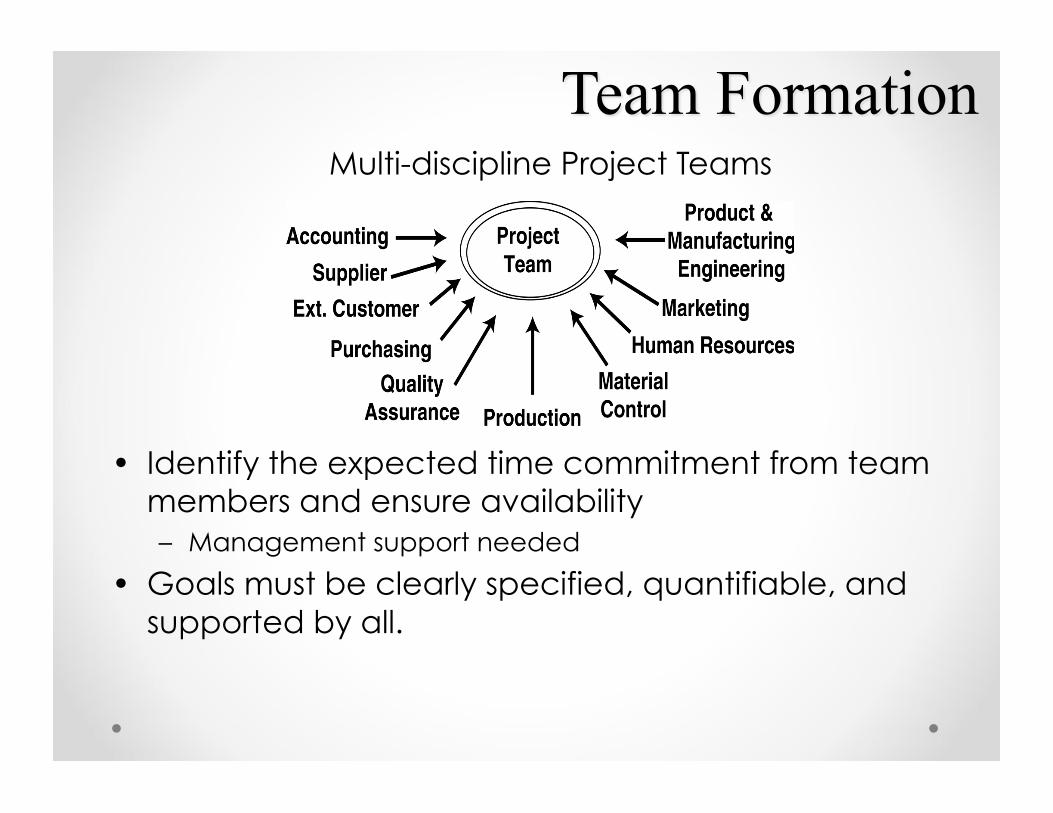
Multi-discipline Project Teams
• Identify the expected time commitment from team members and ensure availability – Management support needed
• Goals must be clearly specified, quantifiable, and supported by all.
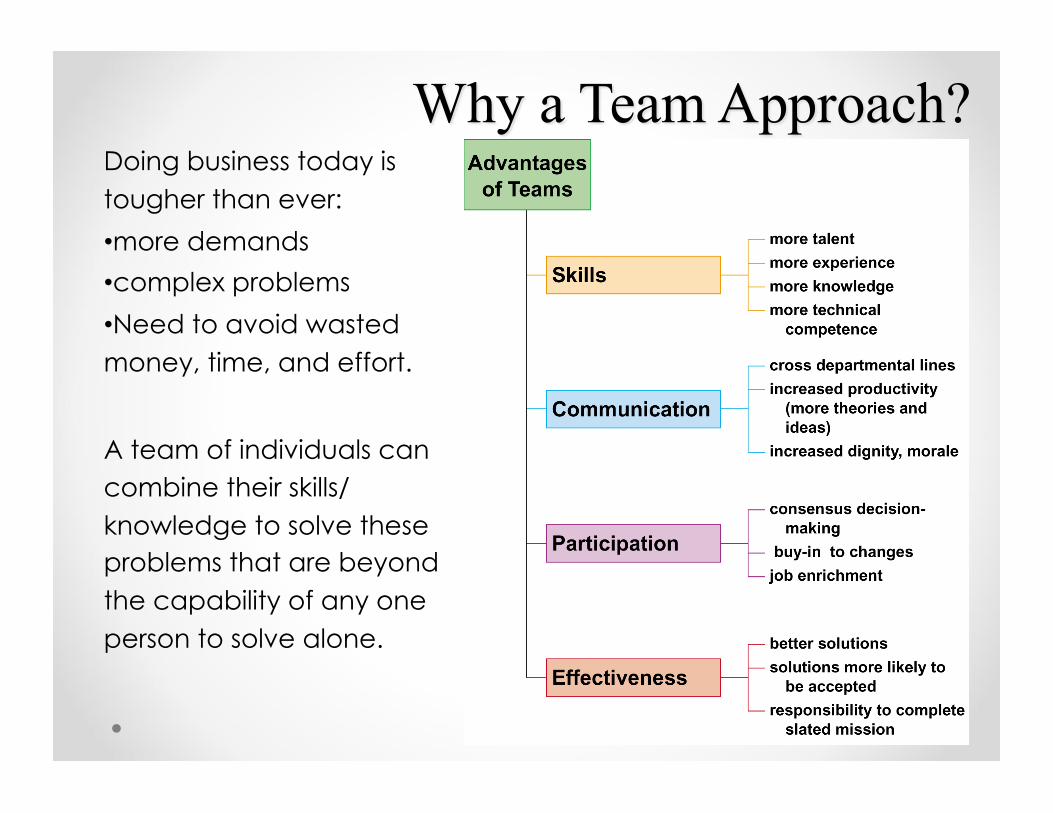
Doing business today is tougher than ever:
• more demands
• complex problems
• Need to avoid wasted money, time, and effort.
A team of individuals can combine their skills/ knowledge to solve these problems that are beyond the capability of any one person to solve alone.
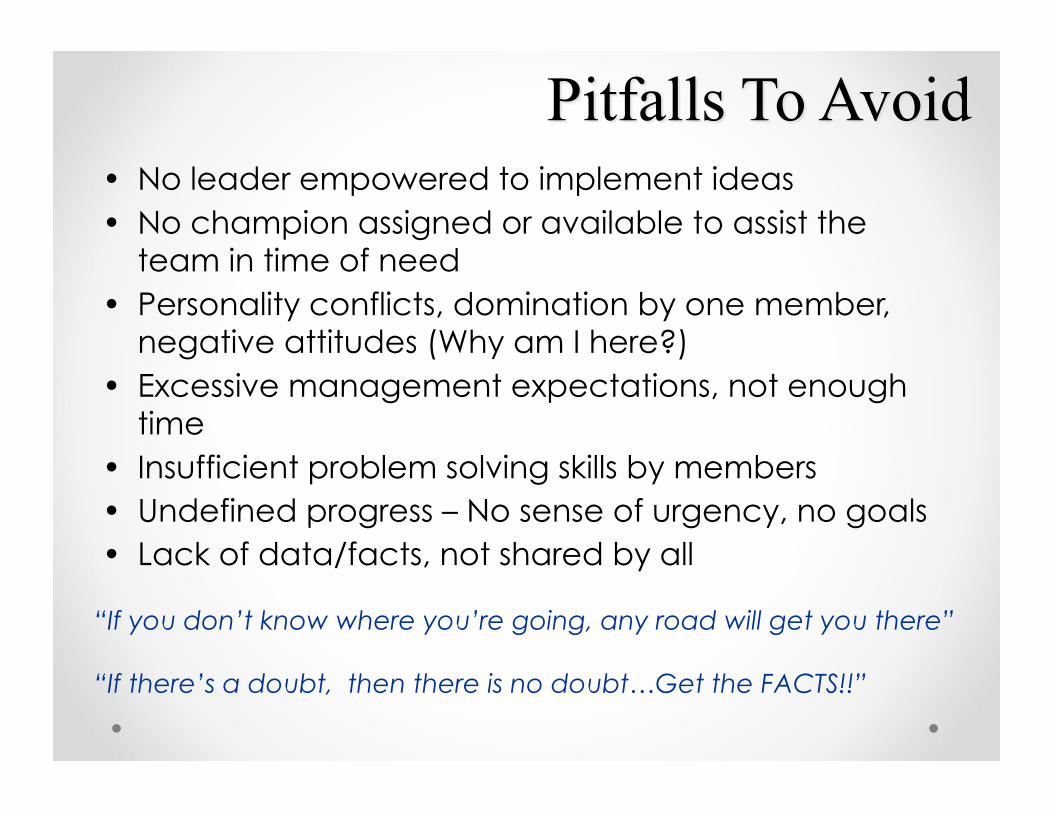
“If you don’t know where you’re going, any road will get you there”
“If there’s a doubt, then there is no doubt…Get the FACTS!!”
• No leader empowered to implement ideas • No champion assigned or available to assist the
team in time of need • Personality conflicts, domination by one member,
negative attitudes (Why am I here?) • Excessive management expectations, not enough
time • Insufficient problem solving skills by members • Undefined progress – No sense of urgency, no goals • Lack of data/facts, not shared by all
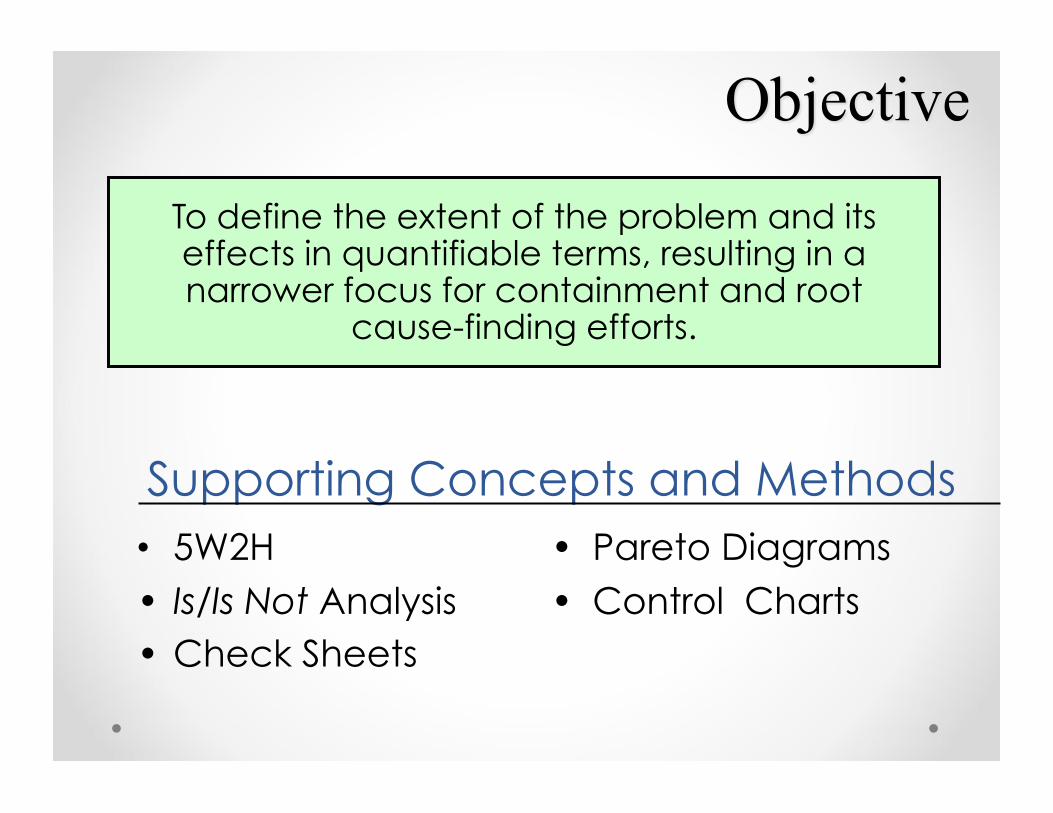
To define the extent of the problem and its effects in quantifiable terms, resulting in a narrower focus for containment and root
cause-finding efforts.
Supporting Concepts and Methods • 5W2H • Pareto Diagrams • Is/Is Not Analysis • Control Charts • Check Sheets
“A problem well stated is a problem half-solved.” Charles Kettering
• Rarely will a problem description be complete/final at the beginning of the 8D process
• Problem cannot be completely described until it is well understood
– Problem Description should be revised and updated to incorporate new facts/data
• Quantify the gap between what “is” and what “should be”
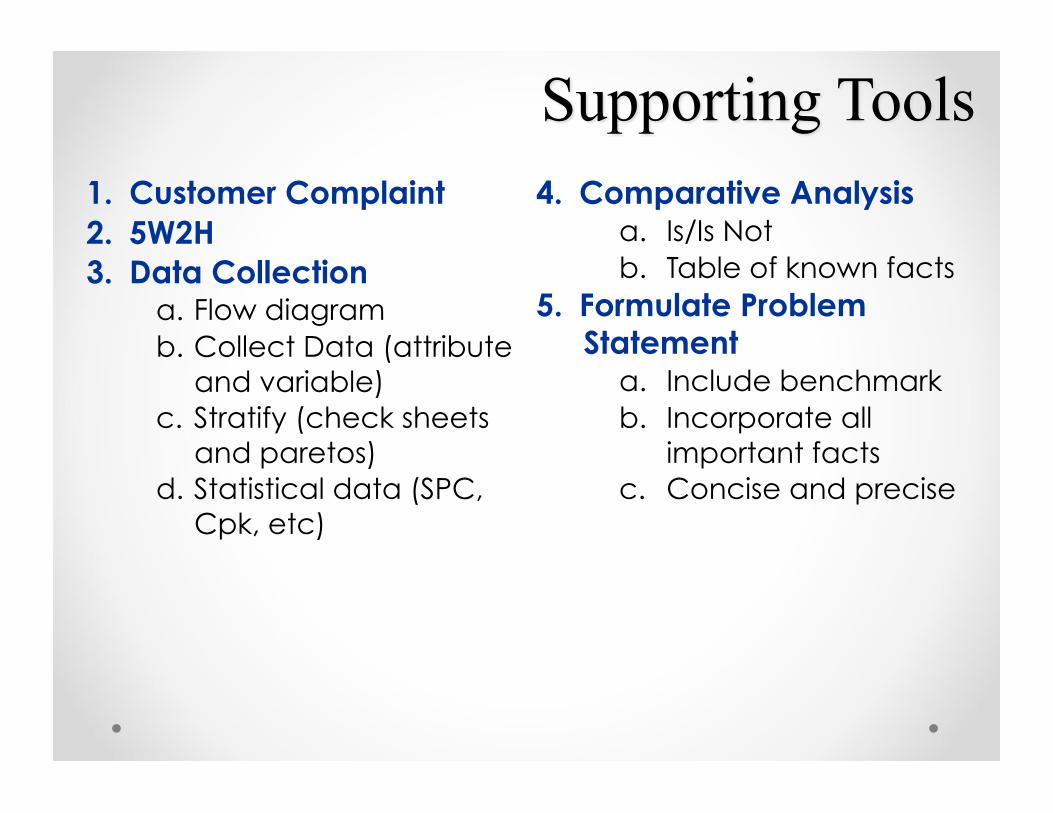
1. Customer Complaint 2. 5W2H 3. Data Collection
a. Flow diagram b. Collect Data (attribute
and variable) c. Stratify (check sheets
and paretos) d. Statistical data (SPC,
Cpk, etc)
4. Comparative Analysis a. Is/Is Not b. Table of known facts
5. Formulate Problem Statement
a. Include benchmark b. Incorporate all
important facts c. Concise and precise
• Describe the symptoms experienced by the customer (user) in their terms.
• Ensure the complaint is clearly and fully understood
o Direct customer contact (ask clarifying questions)
o Customer representatives may be on the team
o Understand the problem from the customers’ viewpoint
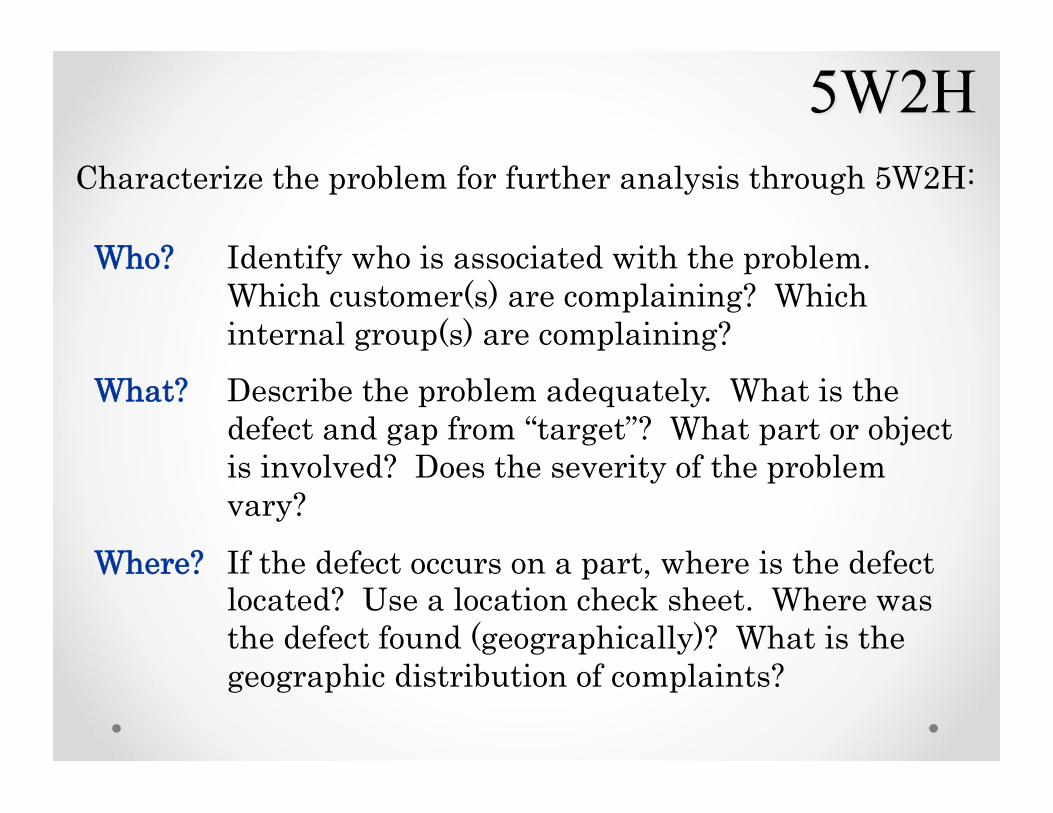
Who? Identify who is associated with the problem. Which customer(s) are complaining? Which internal group(s) are complaining?
What? Describe the problem adequately. What is the defect and gap from “target”? What part or object is involved? Does the severity of the problem vary?
Where? If the defect occurs on a part, where is the defect located? Use a location check sheet. Where was the defect found (geographically)? What is the geographic distribution of complaints?
Characterize the problem for further analysis through 5W2H:
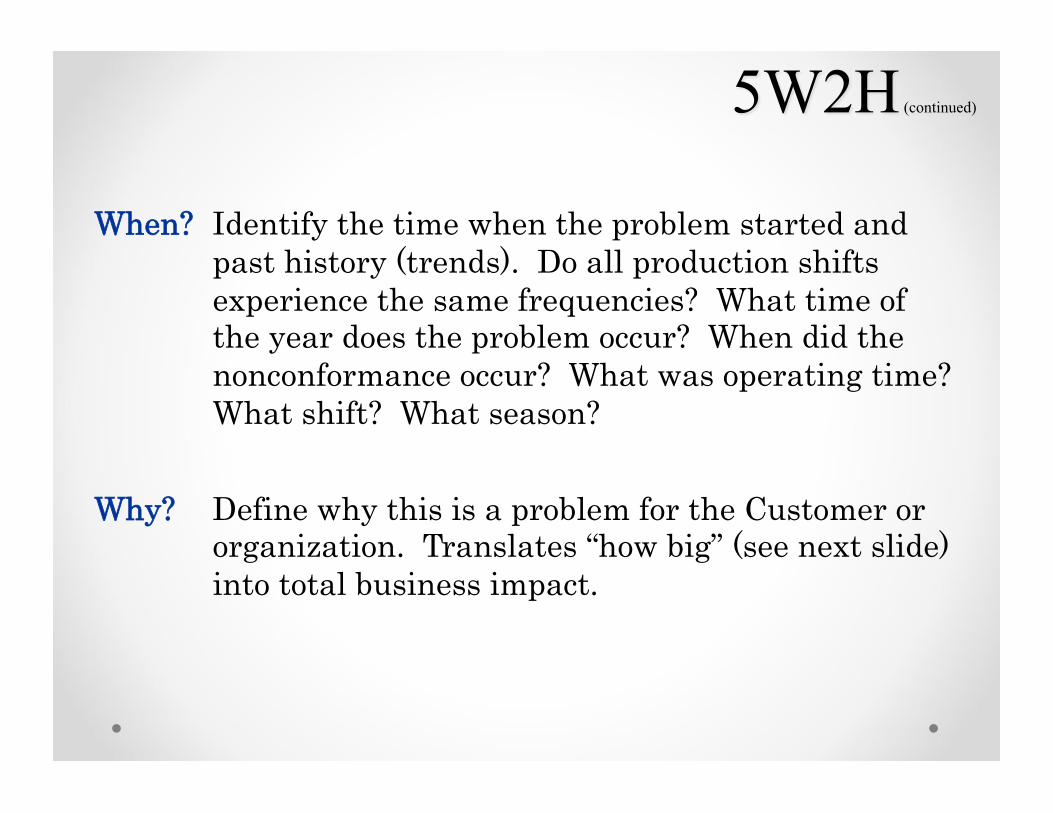
When? Identify the time when the problem started and past history (trends). Do all production shifts experience the same frequencies? What time of the year does the problem occur? When did the nonconformance occur? What was operating time? What shift? What season?
Why? Define why this is a problem for the Customer or organization. Translates “how big” (see next slide) into total business impact.
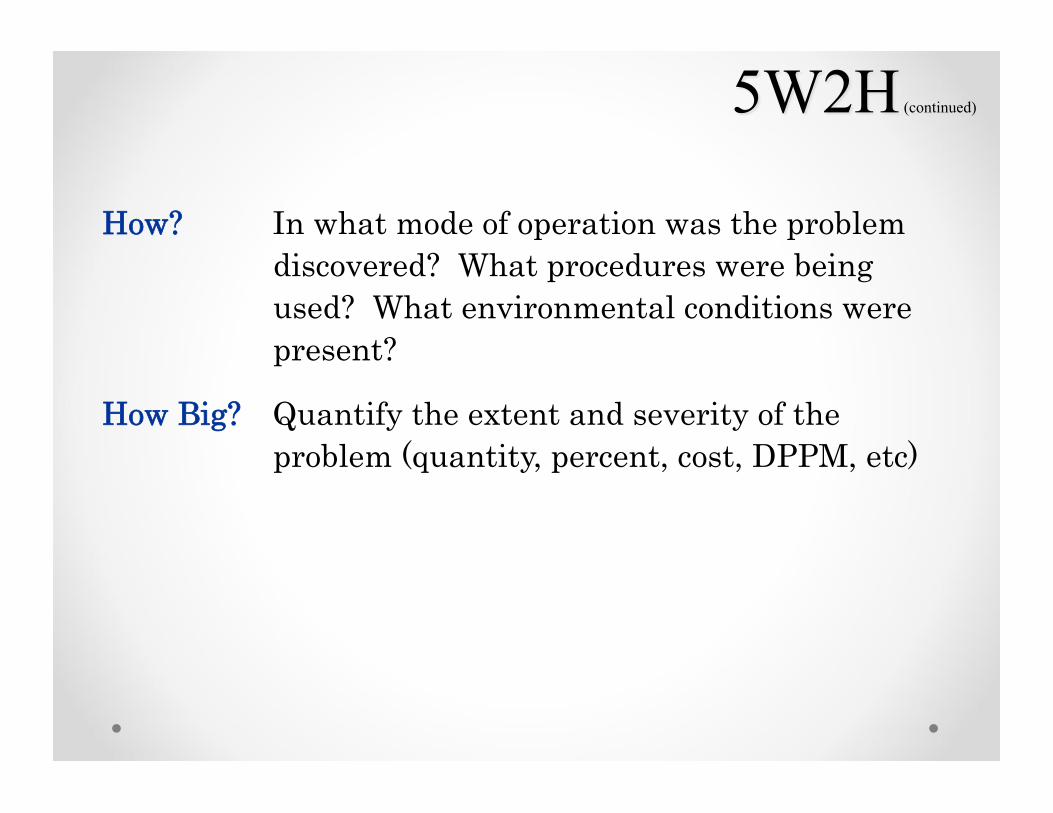
How? In what mode of operation was the problem discovered? What procedures were being used? What environmental conditions were present?
How Big? Quantify the extent and severity of the problem (quantity, percent, cost, DPPM, etc)
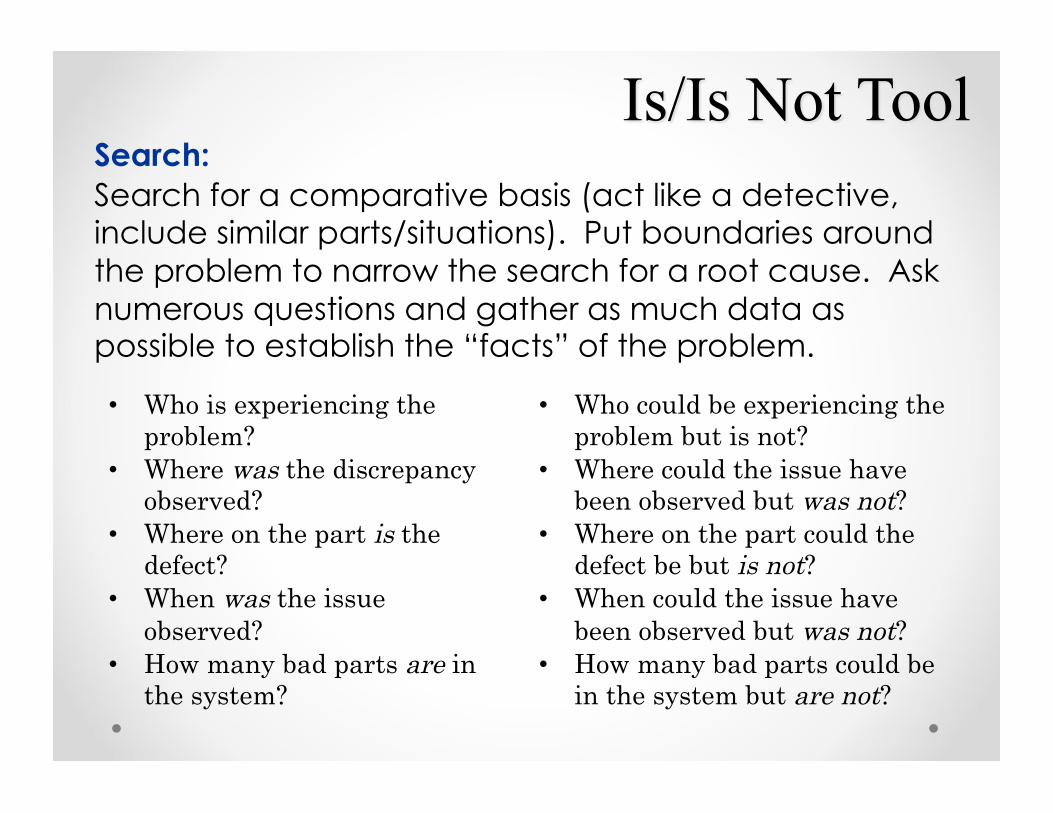
Search: Search for a comparative basis (act like a detective, include similar parts/situations). Put boundaries around the problem to narrow the search for a root cause. Ask numerous questions and gather as much data as possible to establish the “facts” of the problem.
• Who is experiencing the problem?
• Where was the discrepancy observed?
• Where on the part is the defect?
• When was the issue observed?
• How many bad parts are in the system?
• Who could be experiencing the problem but is not?
• Where could the issue have been observed but was not?
• Where on the part could the defect be but is not?
• When could the issue have been observed but was not?
• How many bad parts could be in the system but are not?
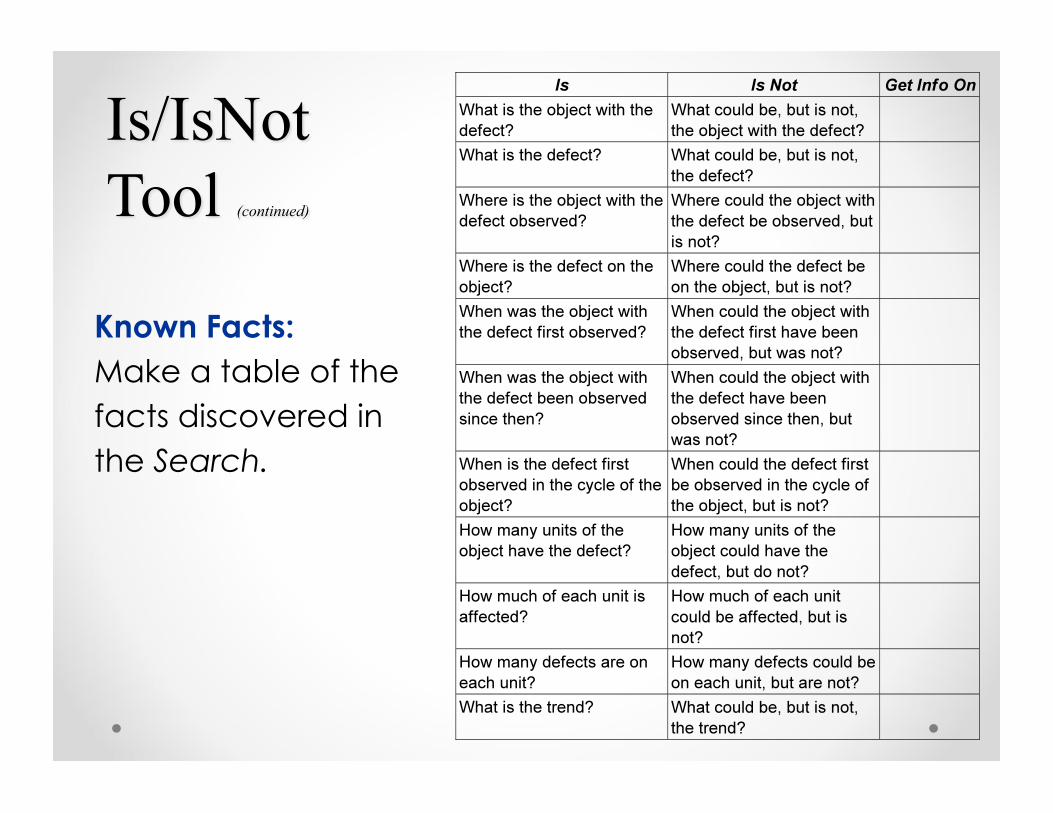
Known Facts: Make a table of the facts discovered in the Search.
Ask questions to understand what is different between the “Is” and “Is Not” conditions:
o Helps to focus the thoughts towards the specific problem area
o Avoids trying to “boil the ocean” by making problem scope more manageable
o Important, but often overlooked step in process
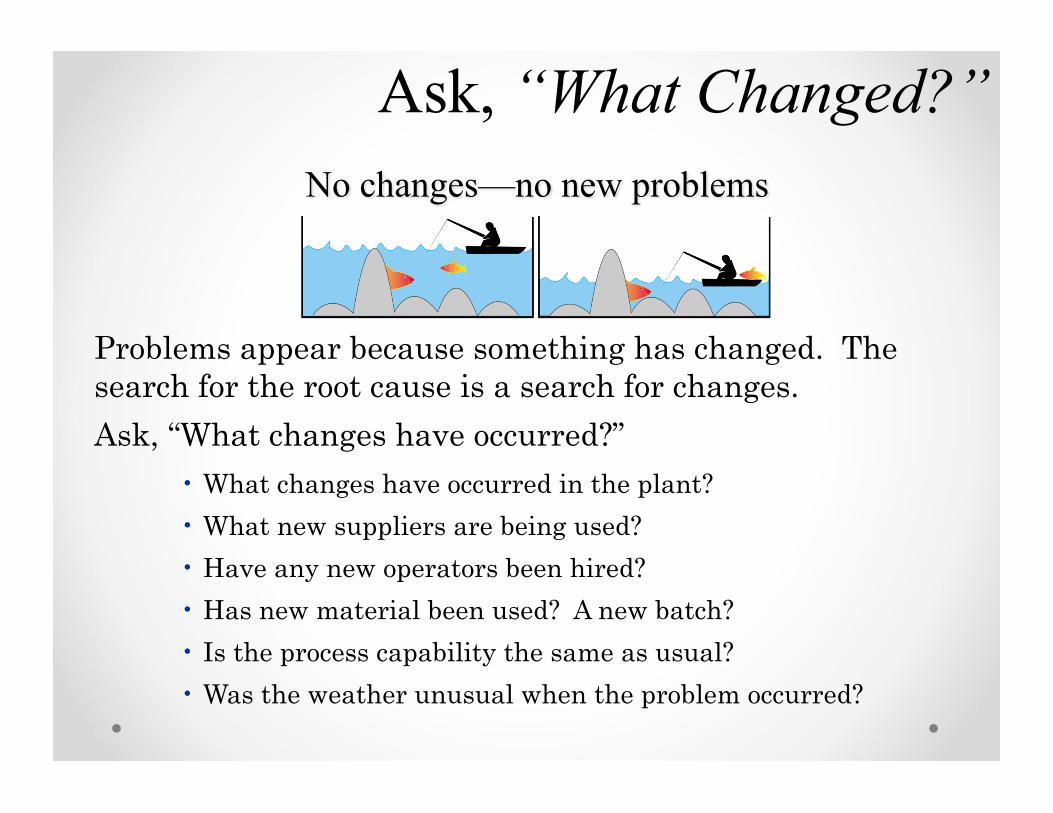
Problems appear because something has changed. The search for the root cause is a search for changes. Ask, “What changes have occurred?”
• What changes have occurred in the plant? • What new suppliers are being used? • Have any new operators been hired? • Has new material been used? A new batch? • Is the process capability the same as usual? • Was the weather unusual when the problem occurred?
Ask, “What Changed?”
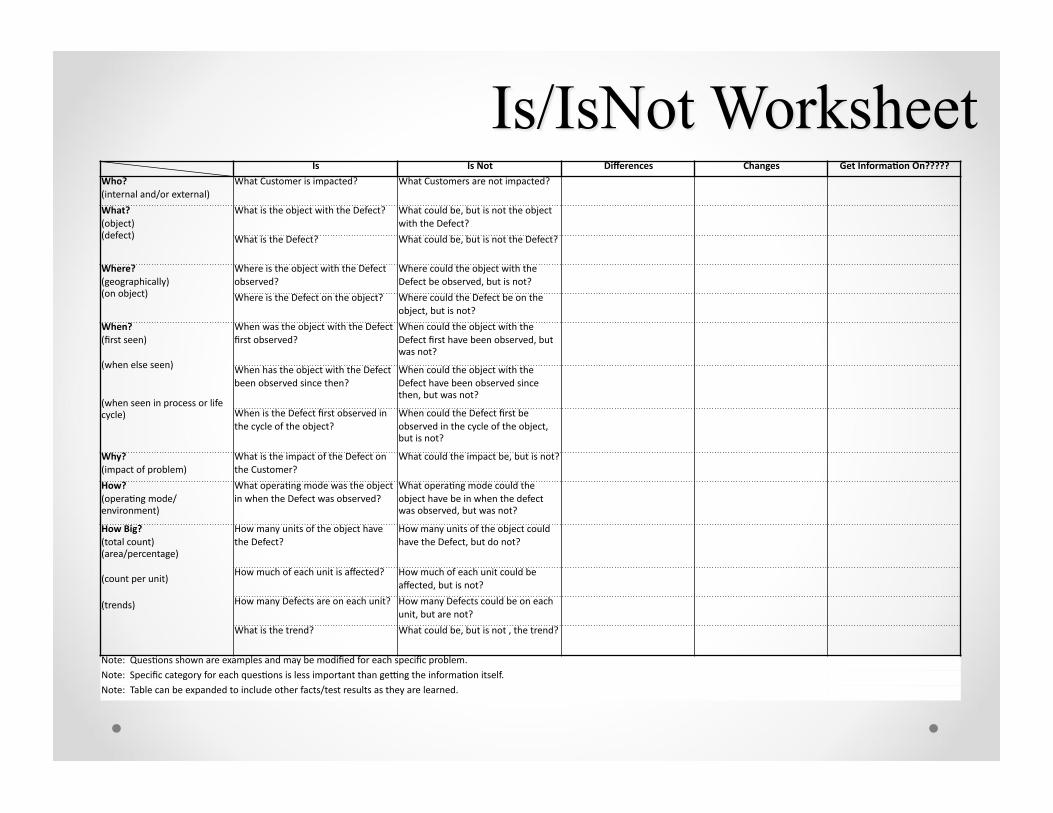
Is Is Not Differences Changes Get Informa5on On?????
Who? (internal and/or external)
What Customer is impacted? What Customers are not impacted?
What? (object) (defect)
What is the object with the Defect? What could be, but is not the object with the Defect?
What is the Defect? What could be, but is not the Defect?
Where? (geographically) (on object)
Where is the object with the Defect observed?
Where could the object with the Defect be observed, but is not?
Where is the Defect on the object? Where could the Defect be on the object, but is not?
When? (first seen)
(when else seen)
(when seen in process or life cycle)
When was the object with the Defect first observed?
When could the object with the Defect first have been observed, but was not?
When has the object with the Defect been observed since then?
When could the object with the Defect have been observed since then, but was not?
When is the Defect first observed in the cycle of the object?
When could the Defect first be observed in the cycle of the object, but is not?
Why? (impact of problem)
What is the impact of the Defect on the Customer?
What could the impact be, but is not?
How? (operaBng mode/ environment)
What operaBng mode was the object in when the Defect was observed?
What operaBng mode could the object have be in when the defect was observed, but was not?
How Big? (total count) (area/percentage)
(count per unit)
(trends)
How many units of the object have the Defect?
How many units of the object could have the Defect, but do not?
How much of each unit is affected? How much of each unit could be affected, but is not?
How many Defects are on each unit? How many Defects could be on each unit, but are not?
What is the trend? What could be, but is not , the trend?
Note: QuesBons shown are examples and may be modified for each specific problem. Note: Specific category for each quesBons is less important than geKng the informaBon itself. Note: Table can be expanded to include other facts/test results as they are learned.
The Problem Statement is the expression of the difference between what should have happened and what actually happened
o Includes the baseline or benchmark for good performance
o Contains reference to one problem only
• Each problem is unique and need to be clearly understood in order to be solved
o Should include information from all of the 5W2H sections
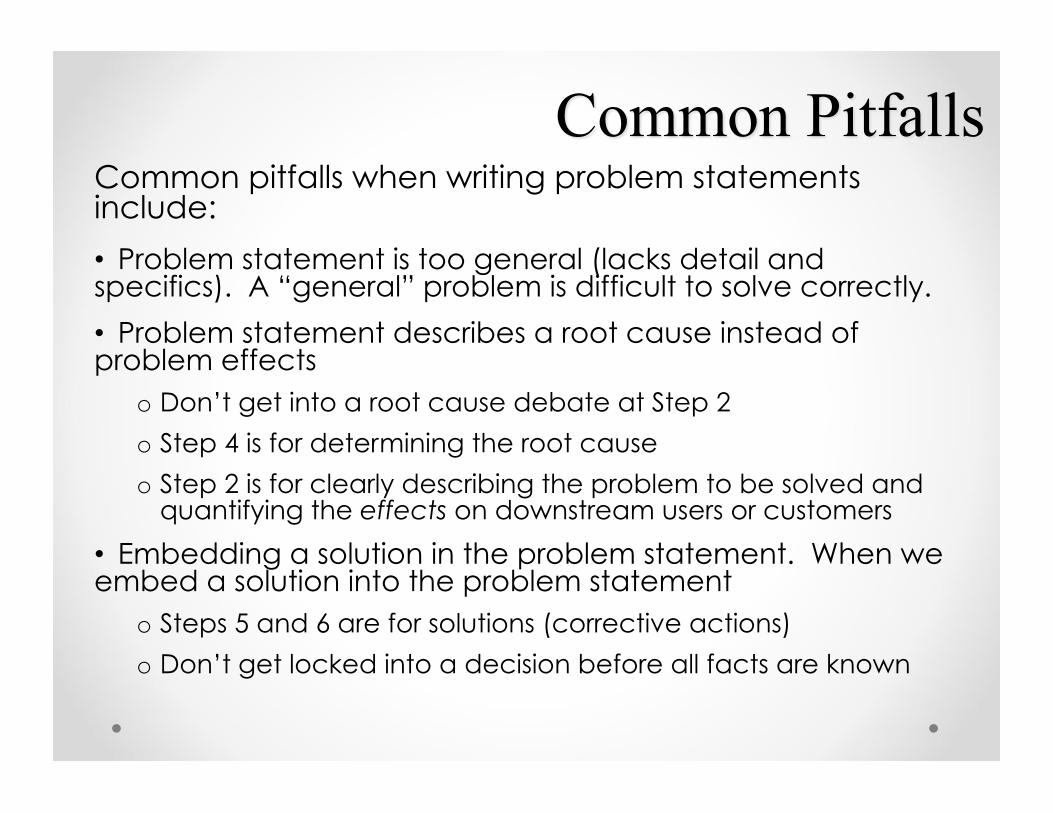
Common pitfalls when writing problem statements include:
• Problem statement is too general (lacks detail and specifics). A “general” problem is difficult to solve correctly.
• Problem statement describes a root cause instead of problem effects
o Don’t get into a root cause debate at Step 2
o Step 4 is for determining the root cause
o Step 2 is for clearly describing the problem to be solved and quantifying the effects on downstream users or customers
• Embedding a solution in the problem statement. When we embed a solution into the problem statement
o Steps 5 and 6 are for solutions (corrective actions)
o Don’t get locked into a decision before all facts are known
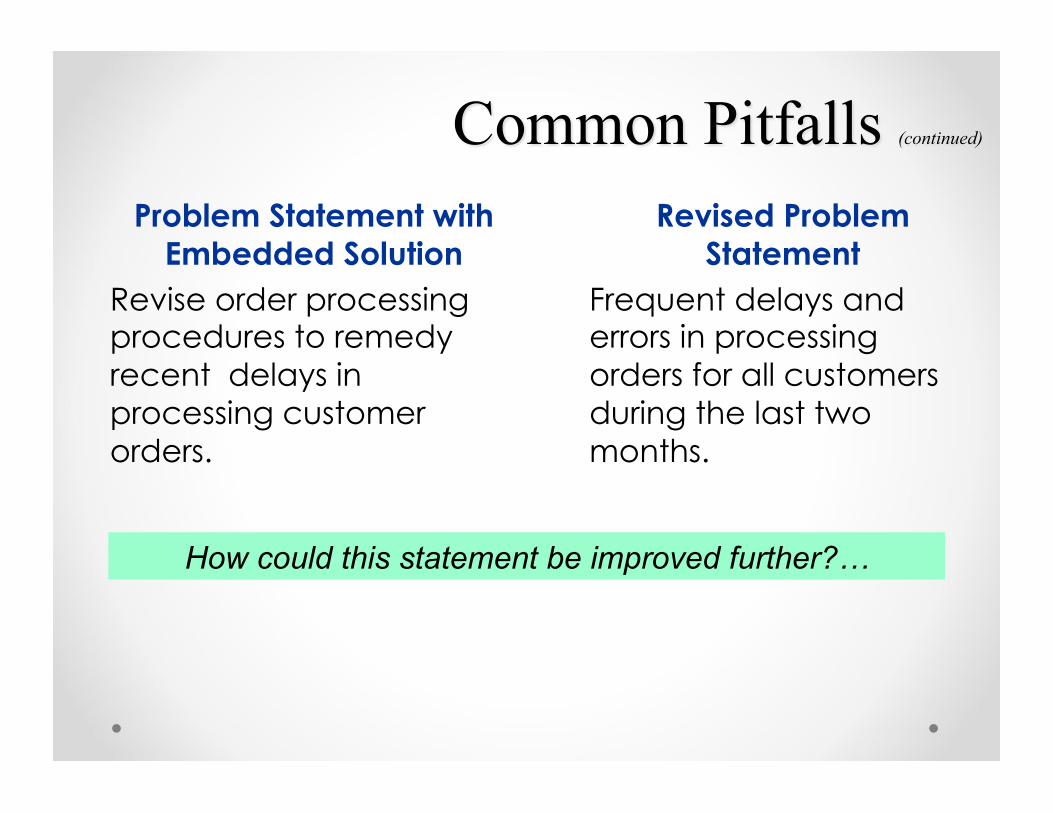
Problem Statement with Embedded Solution
Revise order processing procedures to remedy recent delays in processing customer orders.
Revised Problem Statement
Frequent delays and errors in processing orders for all customers during the last two months.
How could this statement be improved further?…
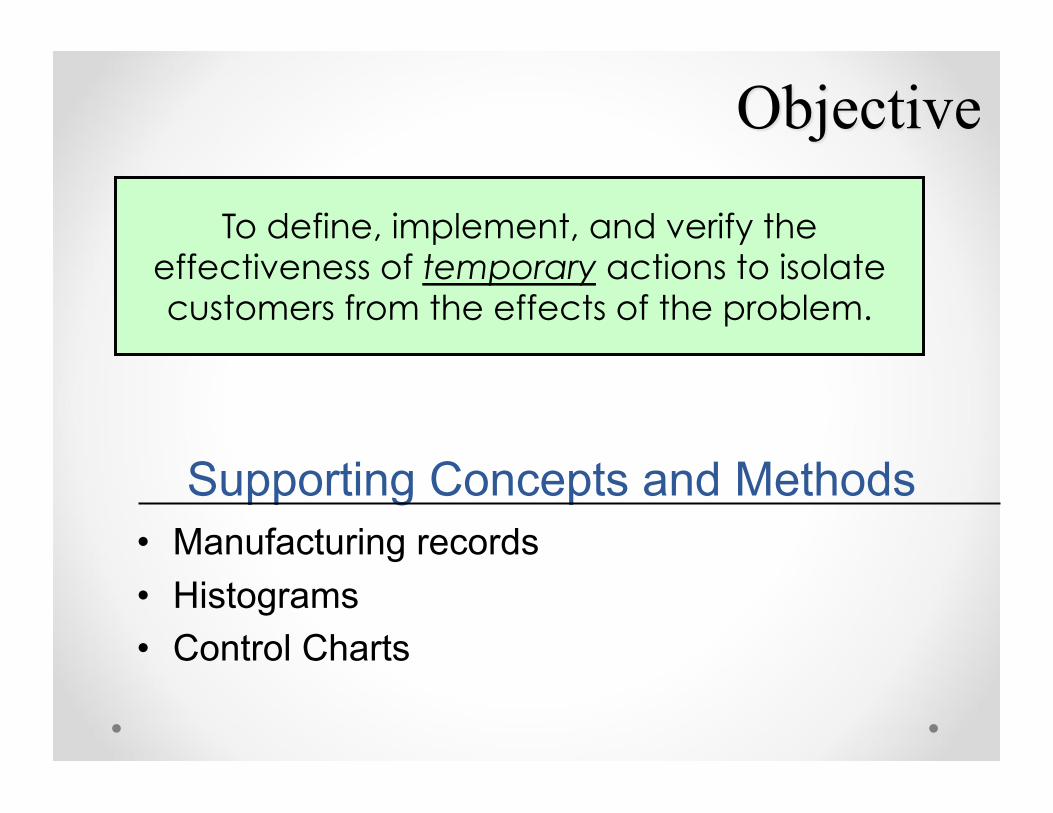
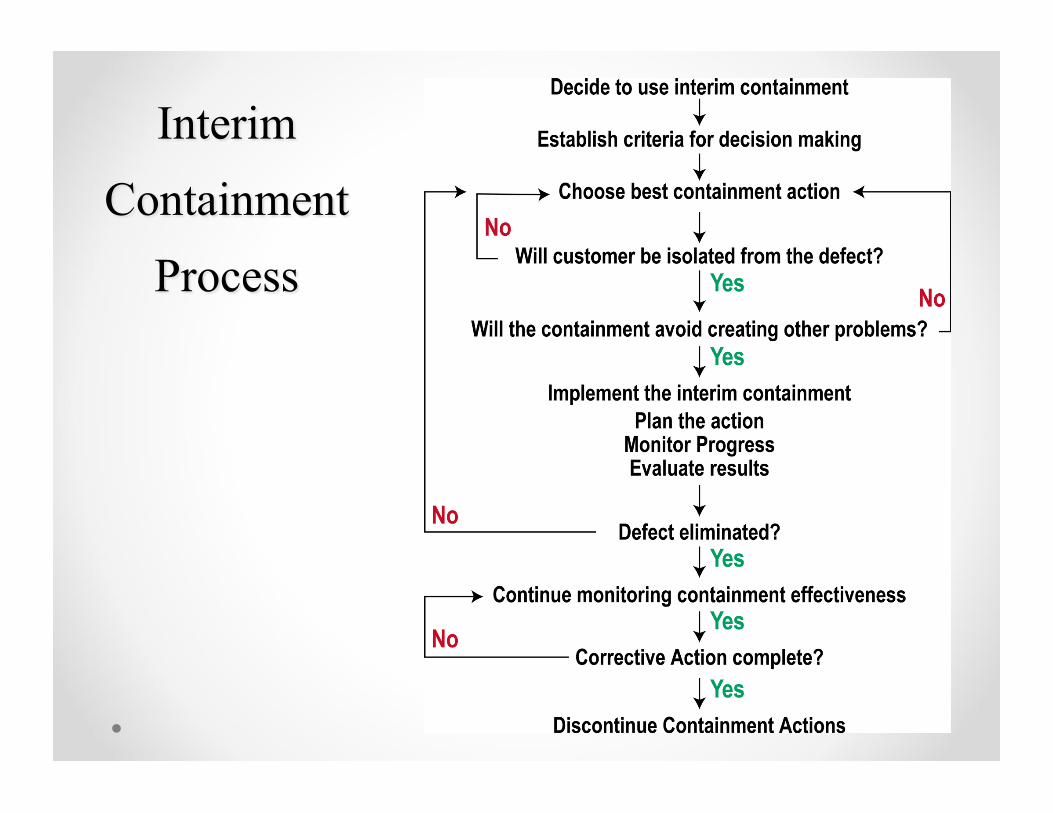
To define, implement, and verify the effectiveness of temporary actions to isolate customers from the effects of the problem.
• Manufacturing records • Histograms • Control Charts
Supporting Concepts and Methods
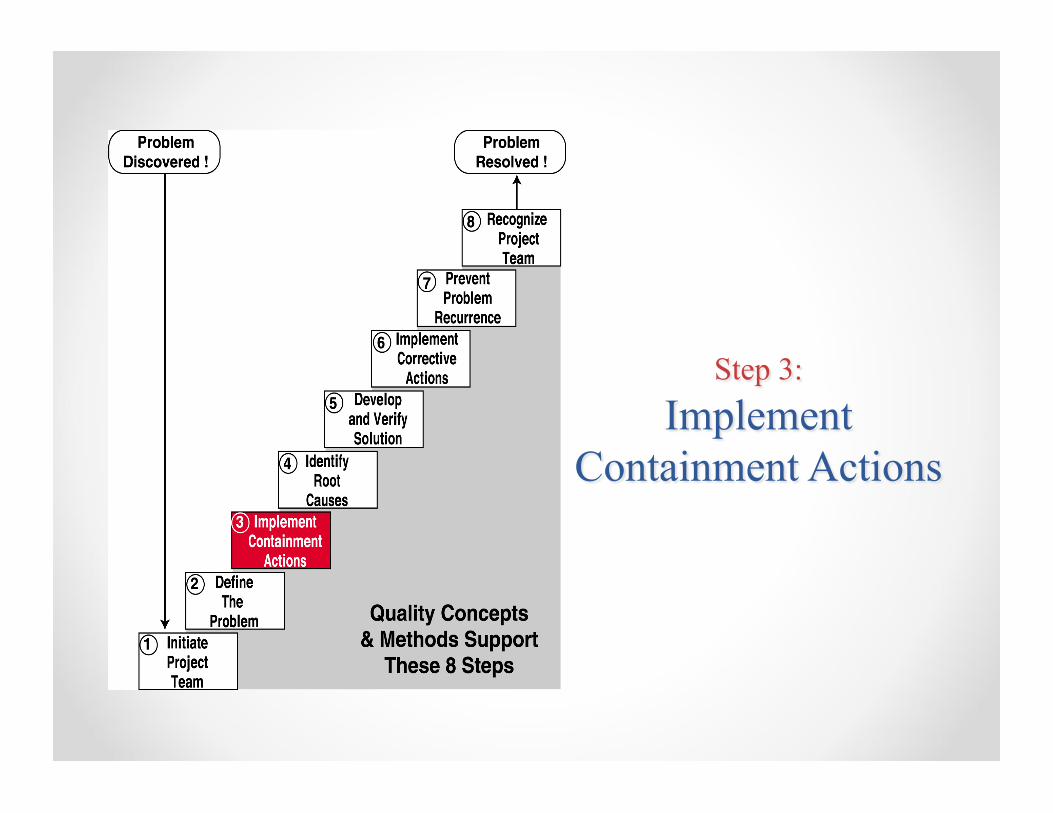
Containment Actions are:
• Intended to protect a Customer from effects of a problem
• A temporary fix to buy time for root cause analysis and C/A implementation (“stop the bleeding”)
• Not cost effective (use good business sense and judgement when choosing)
• Quick fixes designed only to address the effect of a problem (usually detection-based)
• Must remain in place until permanent C/A implemented
• Must include a review of product at all phases (see next slide for details)
– Step applies to all Quality issues, not just Product Returns
Material/Product Locations (containment)
• Raw Material • Semi-finished Goods (WIP) • Finished Goods • At Customer • At Supplier • In transit (from Supplier or to Customer) • Shipping and/or Receiving Dock • Materials on order (future shipments from
Supplier)
Common Containment Actions: • 100% inspection to sort out defects • Stop production from a known source of the problem • Purchase parts rather than make in-house • Single source to one rather than multiple suppliers • Use back-up tooling (fewer cavities/nests) • Others?
Do not consider containment action
a permanent solution to a problem!
After implementing containment actions, verify their effectiveness by measuring effects in quantifiable terms.
• The effectiveness of the Containment Action must be monitored to ensure proper protection of the customer is maintained.
• The benefit of a Containment Action must last until the root cause is identified and permanent corrective action is implemented.
• Decision making tools are used in this step to ensure proper thought is given when choosing the actions
• Risk assessment is an important step during the decision-making process
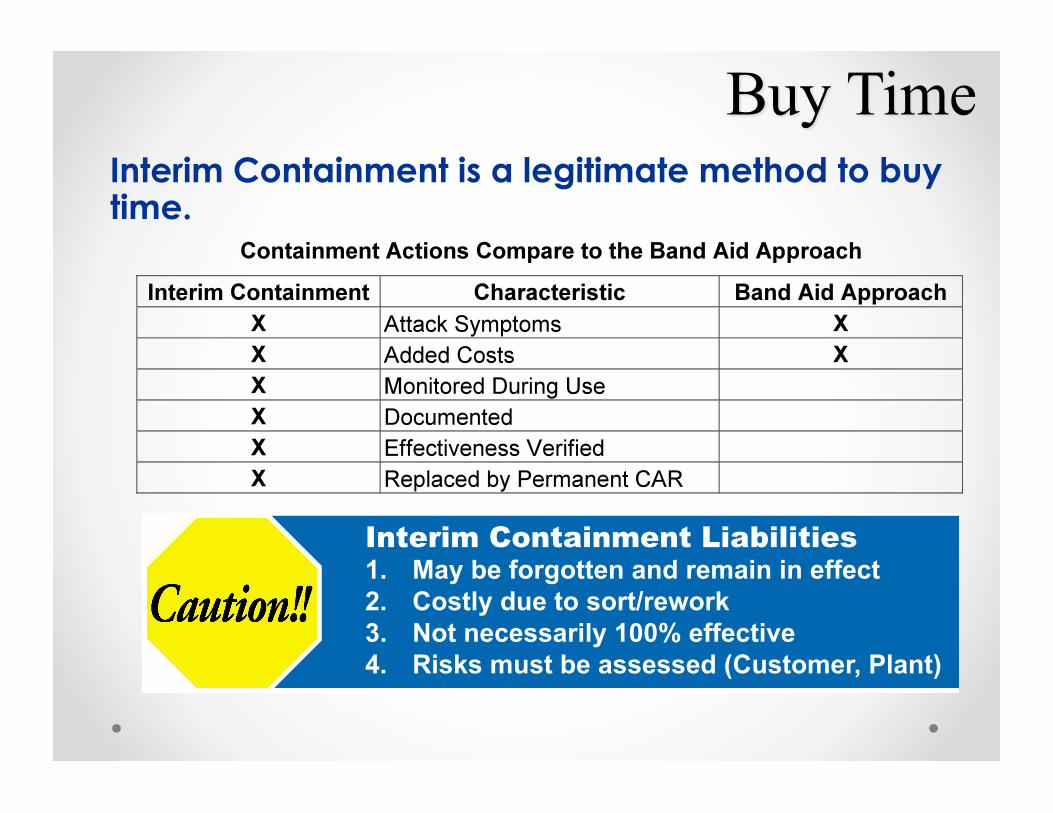
Interim Containment is a legitimate method to buy time.
Interim Containment Liabilities 1. May be forgotten and remain in effect 2. Costly due to sort/rework 3. Not necessarily 100% effective 4. Risks must be assessed (Customer, Plant)
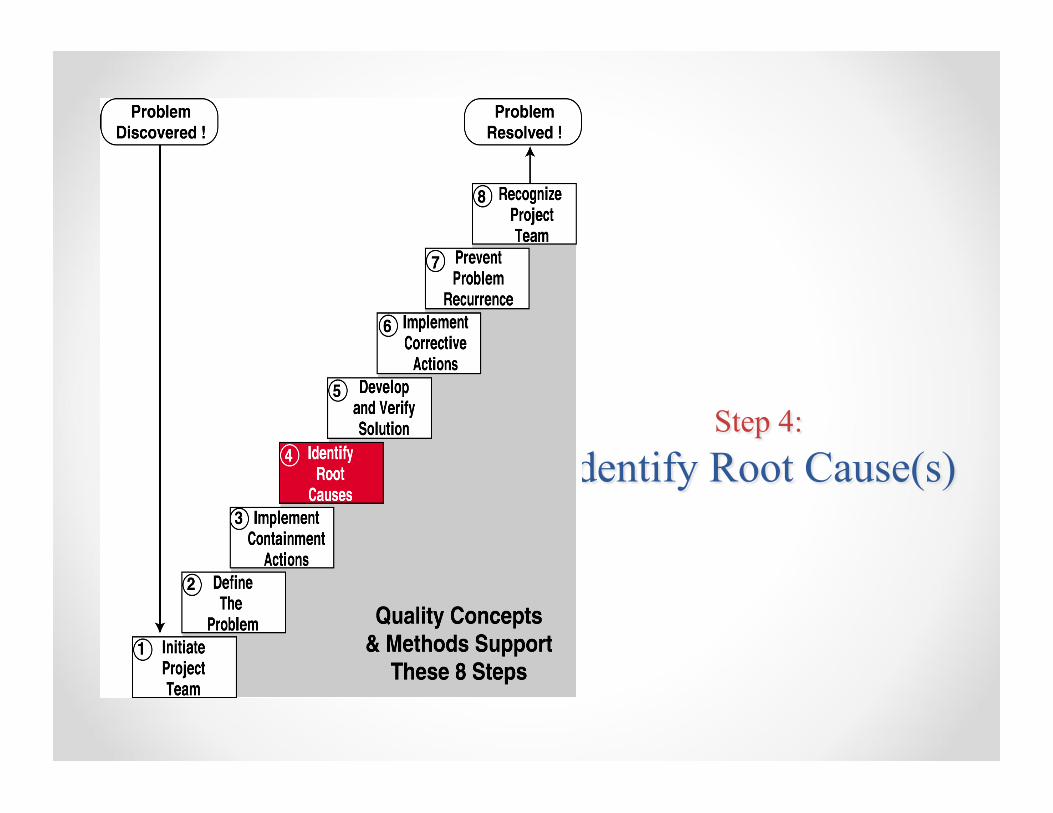
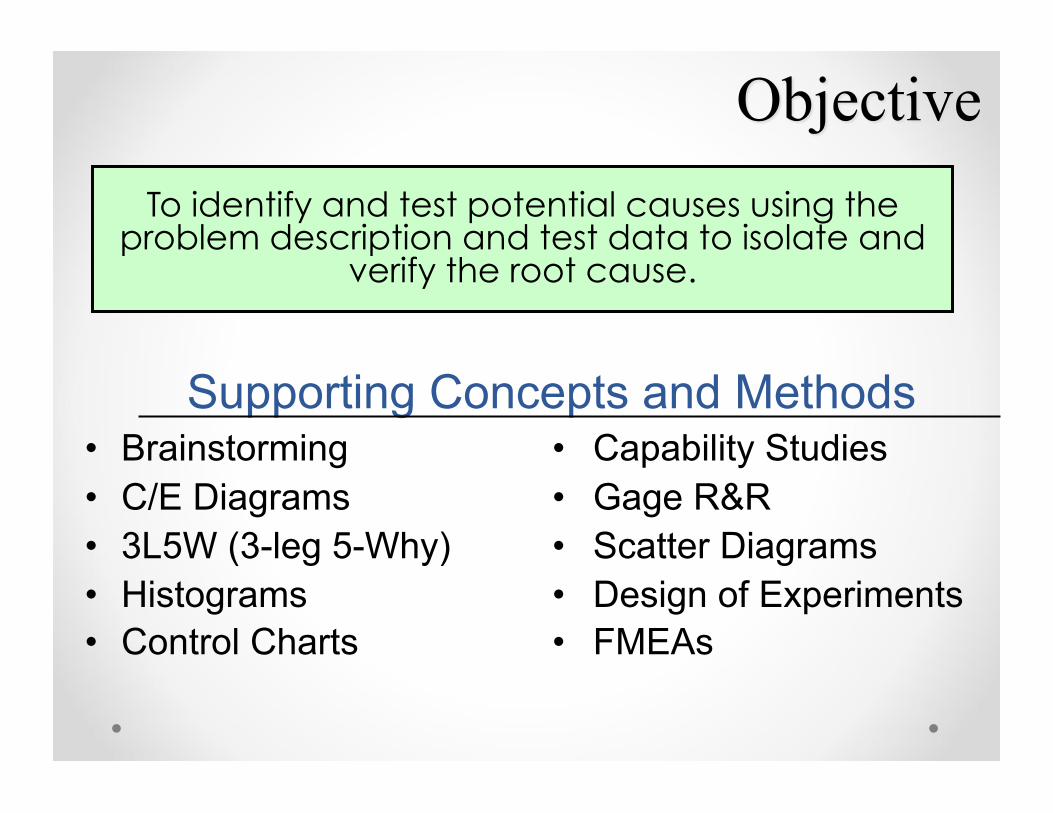
To identify and test potential causes using the problem description and test data to isolate and
verify the root cause.
• Brainstorming • Capability Studies • C/E Diagrams • Gage R&R • 3L5W (3-leg 5-Why) • Scatter Diagrams • Histograms • Design of Experiments • Control Charts • FMEAs
Supporting Concepts and Methods
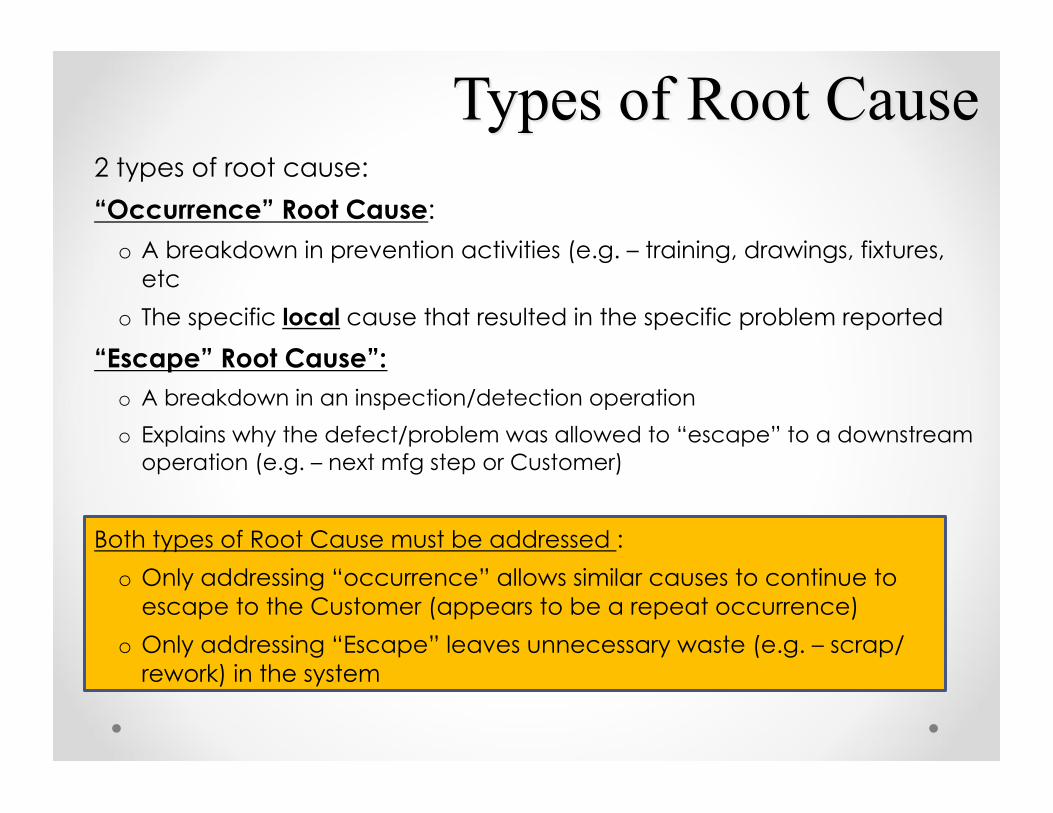
2 types of root cause:
“Occurrence” Root Cause:
o A breakdown in prevention activities (e.g. – training, drawings, fixtures, etc
o The specific local cause that resulted in the specific problem reported
“Escape” Root Cause”: o A breakdown in an inspection/detection operation
o Explains why the defect/problem was allowed to “escape” to a downstream operation (e.g. – next mfg step or Customer)
Both types of Root Cause must be addressed :
o Only addressing “occurrence” allows similar causes to continue to escape to the Customer (appears to be a repeat occurrence)
o Only addressing “Escape” leaves unnecessary waste (e.g. – scrap/rework) in the system
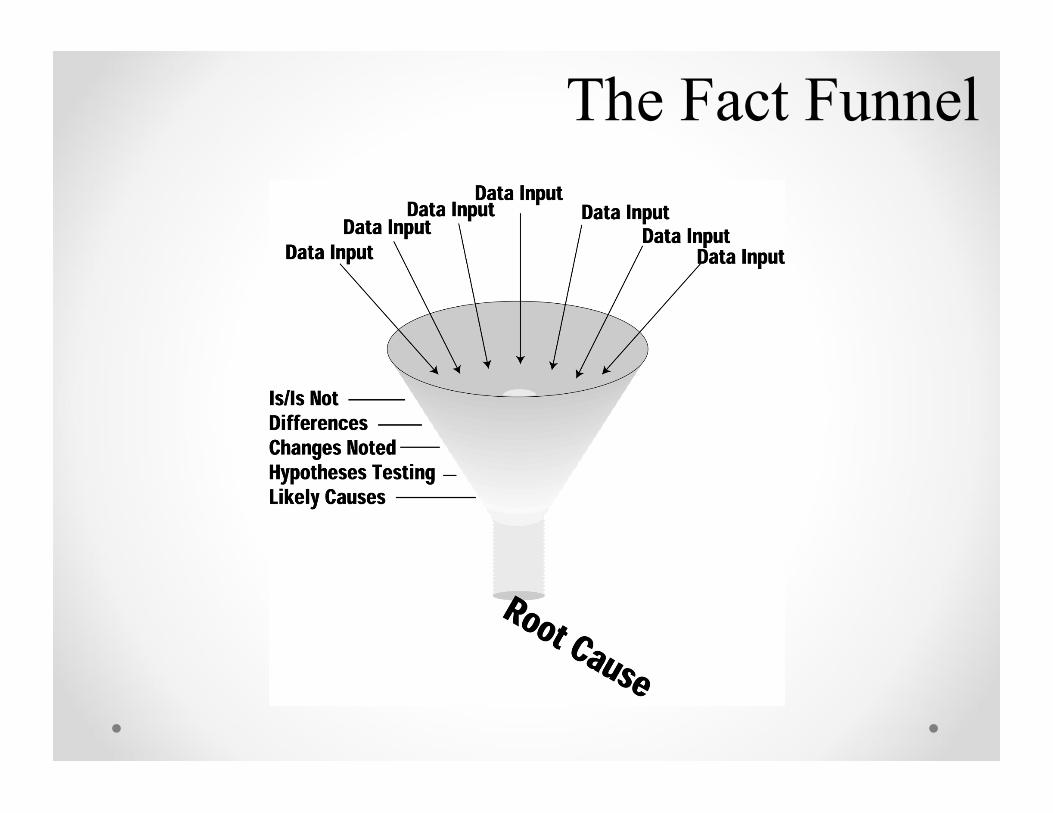
The Fact Funnel
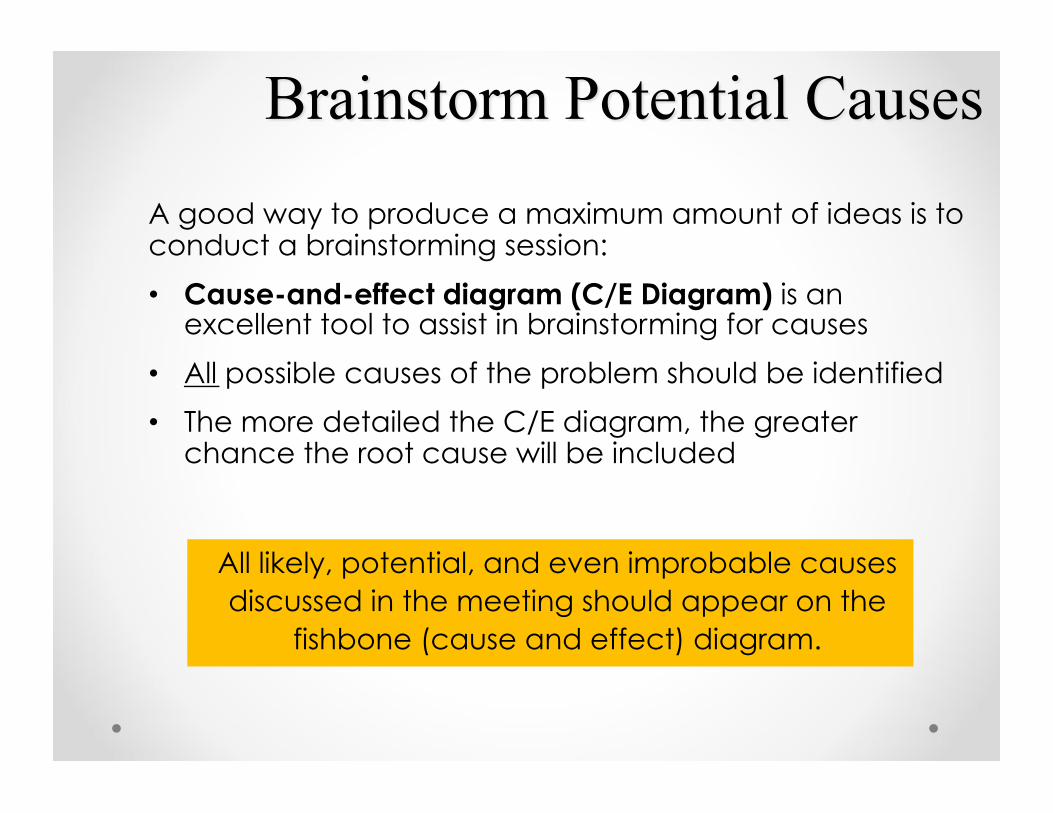
All likely, potential, and even improbable causes discussed in the meeting should appear on the
fishbone (cause and effect) diagram.
A good way to produce a maximum amount of ideas is to conduct a brainstorming session:
• Cause-and-effect diagram (C/E Diagram) is an excellent tool to assist in brainstorming for causes
• All possible causes of the problem should be identified
• The more detailed the C/E diagram, the greater chance the root cause will be included
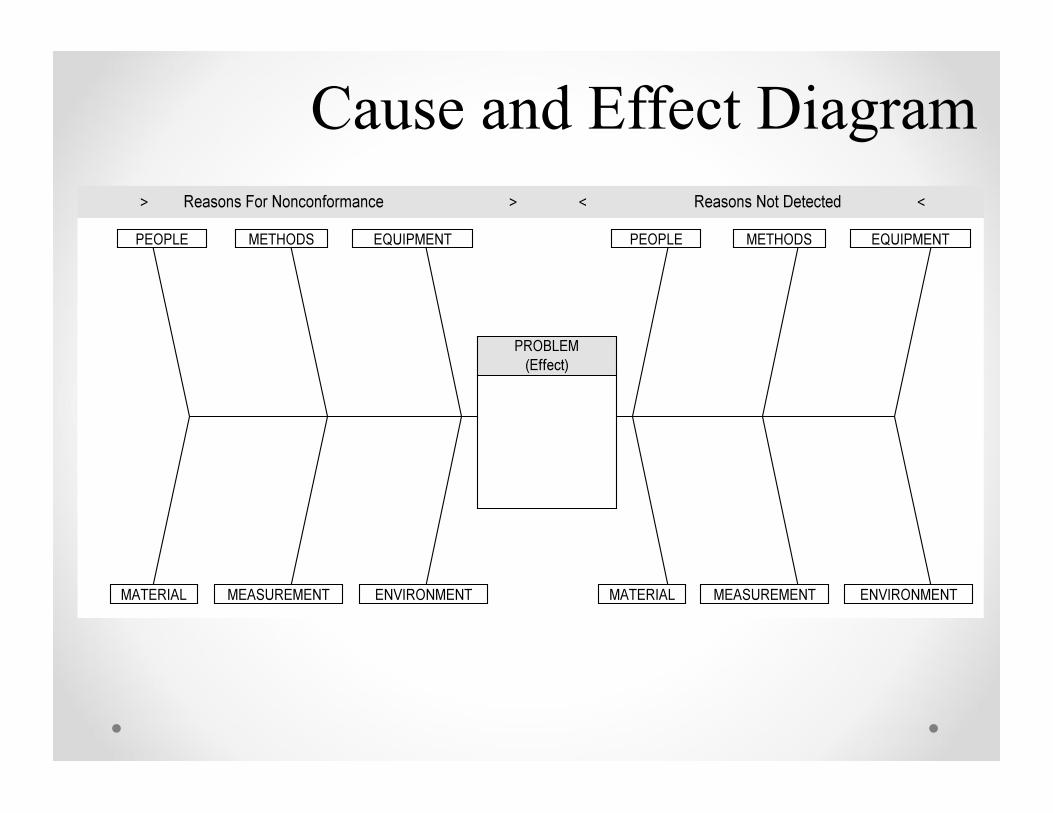
Cause and Effect Diagram
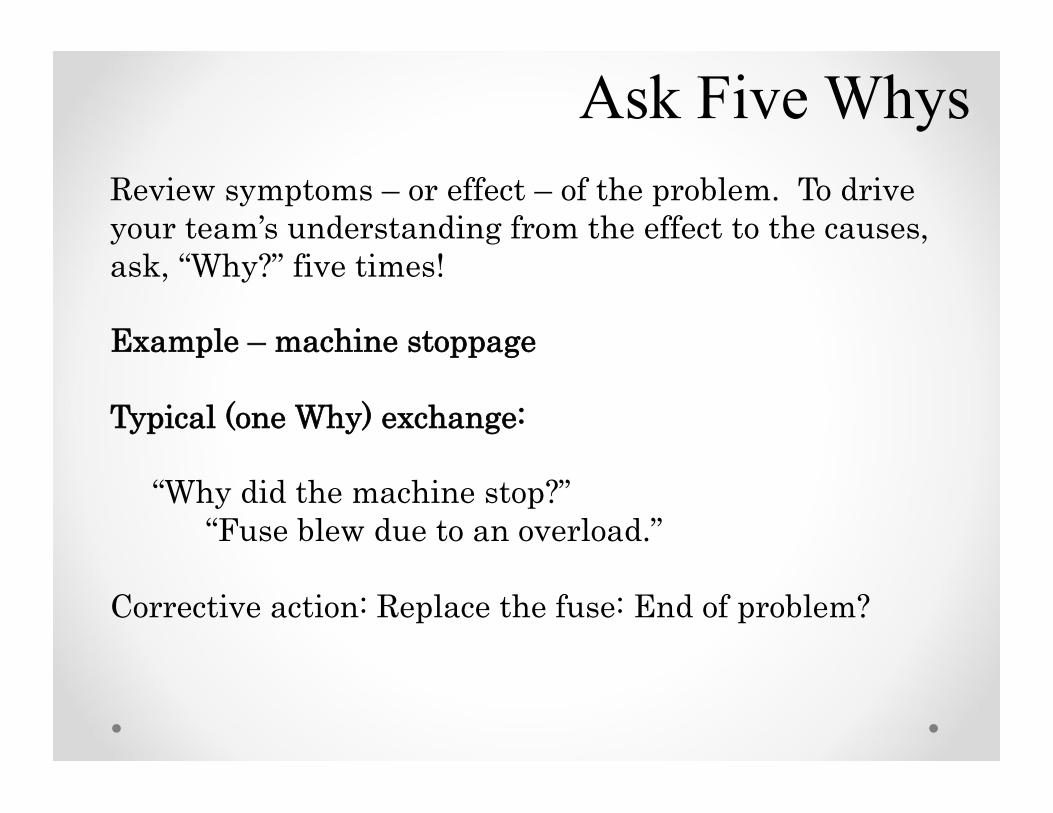
Ask Five Whys Review symptoms – or effect – of the problem. To drive your team’s understanding from the effect to the causes, ask, “Why?” five times!
Example – machine stoppage
Typical (one Why) exchange:
“Why did the machine stop?” “Fuse blew due to an overload.”
Corrective action: Replace the fuse: End of problem?
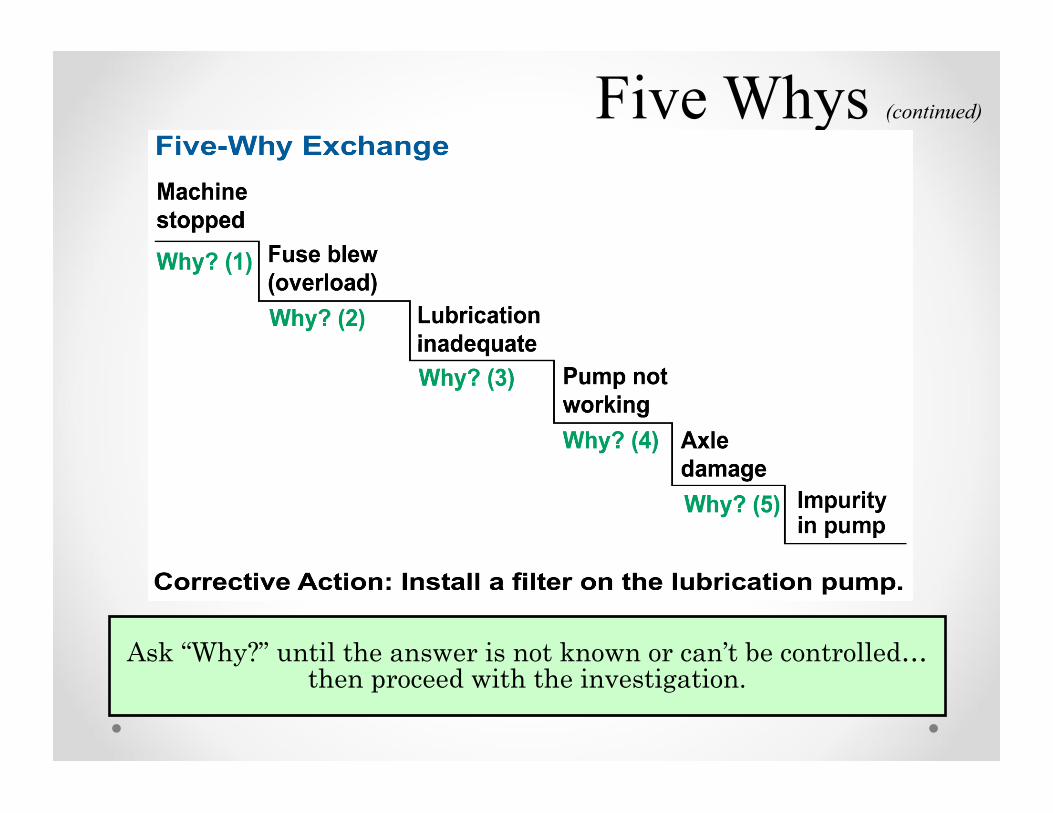
Five Whys (continued)
Ask “Why?” until the answer is not known or can’t be controlled… then proceed with the investigation.
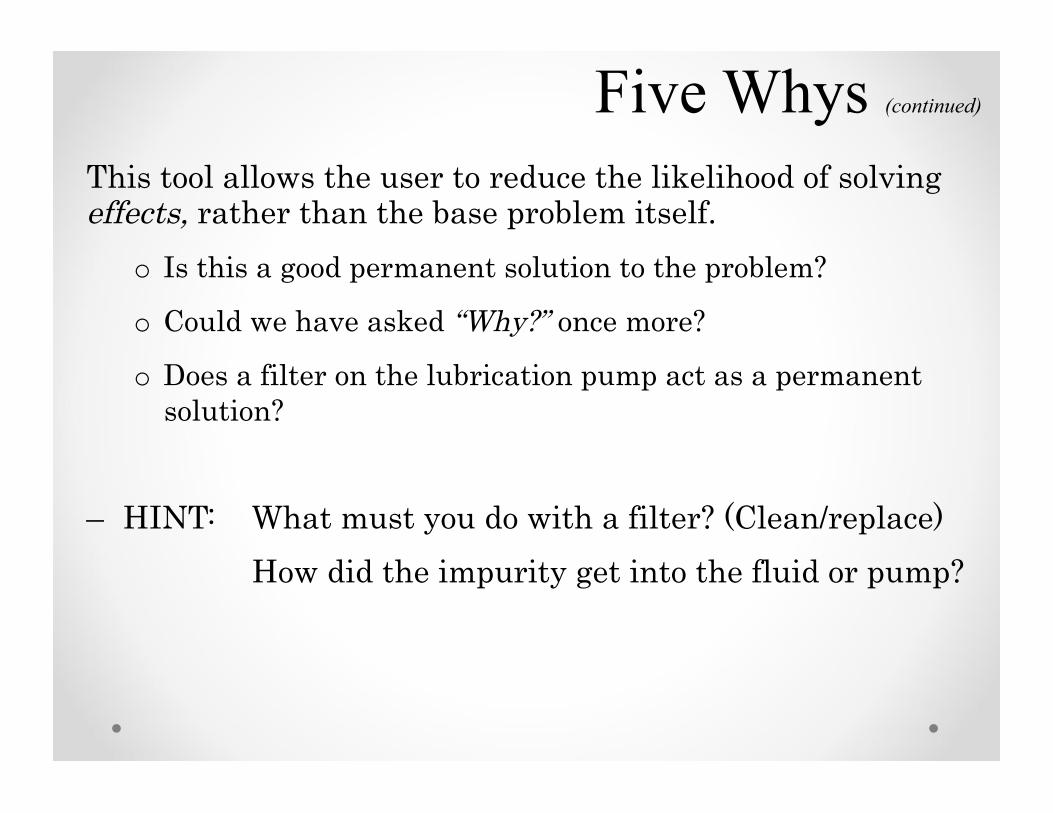
Five Whys (continued)
This tool allows the user to reduce the likelihood of solving effects, rather than the base problem itself.
o Is this a good permanent solution to the problem?
o Could we have asked “Why?” once more?
o Does a filter on the lubrication pump act as a permanent solution?
– HINT: What must you do with a filter? (Clean/replace) How did the impurity get into the fluid or pump?

3-Leg 5-Why Analysis Work Sheet
Systemic
System:
Escape:
Occurrence:
The Problem:
Why?
Why?
Why?
Why?
Why?
Escape
Why?
Why?
Why?
Why?
Occurrence
Why?
Why?
Why?
Why?
Root Cause
Corrective Action:
• It initiates and causes the event we are seeking to explain. • It is directly controllable. • The elimination of that root cause will result in the elimination or
reduction of the problem.
Enhances basic 5-Why tool. Use all (3) paths to thoroughly investigate why the specific nonconformance occurred, why it was not detected by process controls, as well as why the overall governing system, policies,
procedures, or process allowed this nonconformance (and perhaps others like it) to occur. Check continuity of logic by reading back using the
“Therefore” test.
Verification Criteria: The underlying root cause has been reached only when the final why satisfies this criteria:
Because…
Therefore…
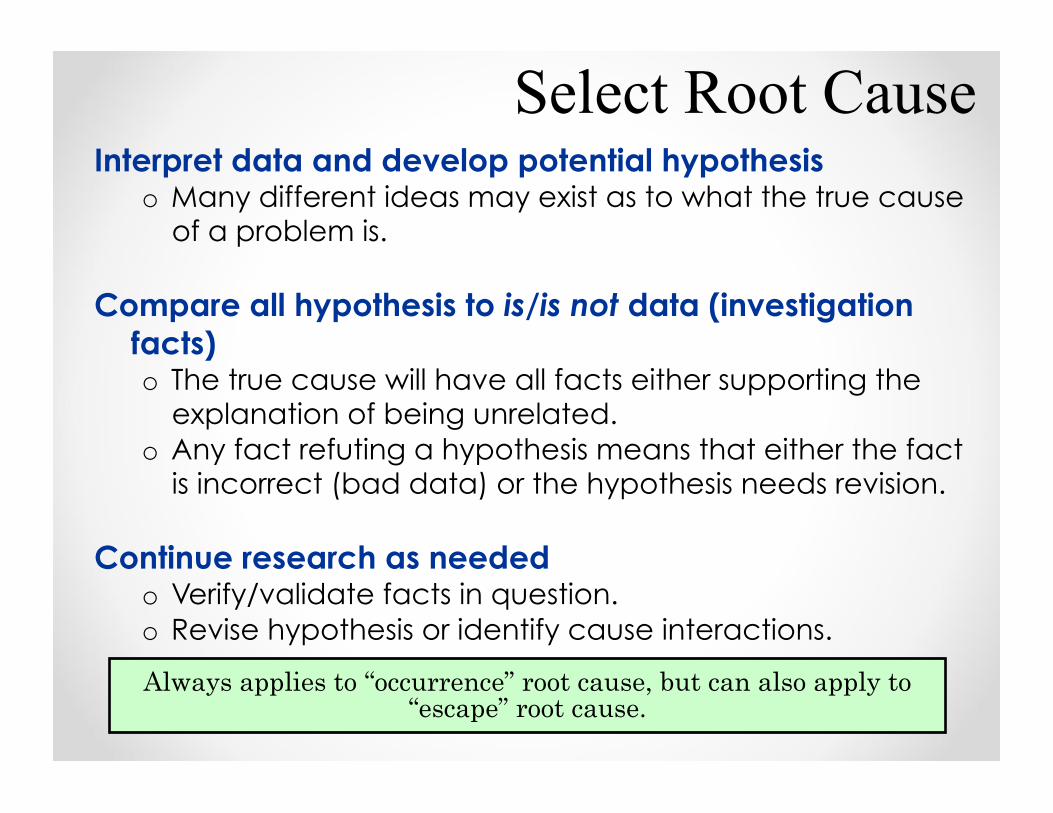
Select Root Cause
Interpret data and develop potential hypothesis o Many different ideas may exist as to what the true cause
of a problem is.
Compare all hypothesis to is/is not data (investigation facts) o The true cause will have all facts either supporting the
explanation of being unrelated. o Any fact refuting a hypothesis means that either the fact
is incorrect (bad data) or the hypothesis needs revision.
Continue research as needed o Verify/validate facts in question. o Revise hypothesis or identify cause interactions.
Always applies to “occurrence” root cause, but can also apply to “escape” root cause.
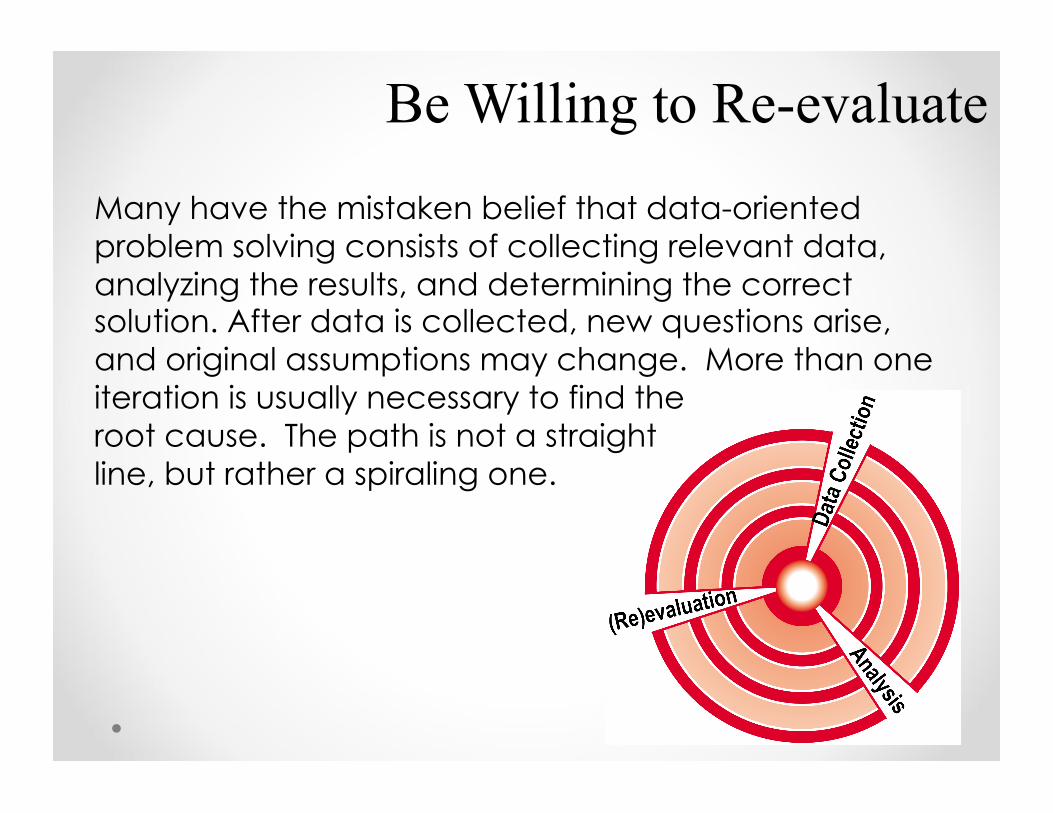
Be Willing to Re-evaluate
Many have the mistaken belief that data-oriented problem solving consists of collecting relevant data, analyzing the results, and determining the correct solution. After data is collected, new questions arise, and original assumptions may change. More than one iteration is usually necessary to find the root cause. The path is not a straight line, but rather a spiraling one.
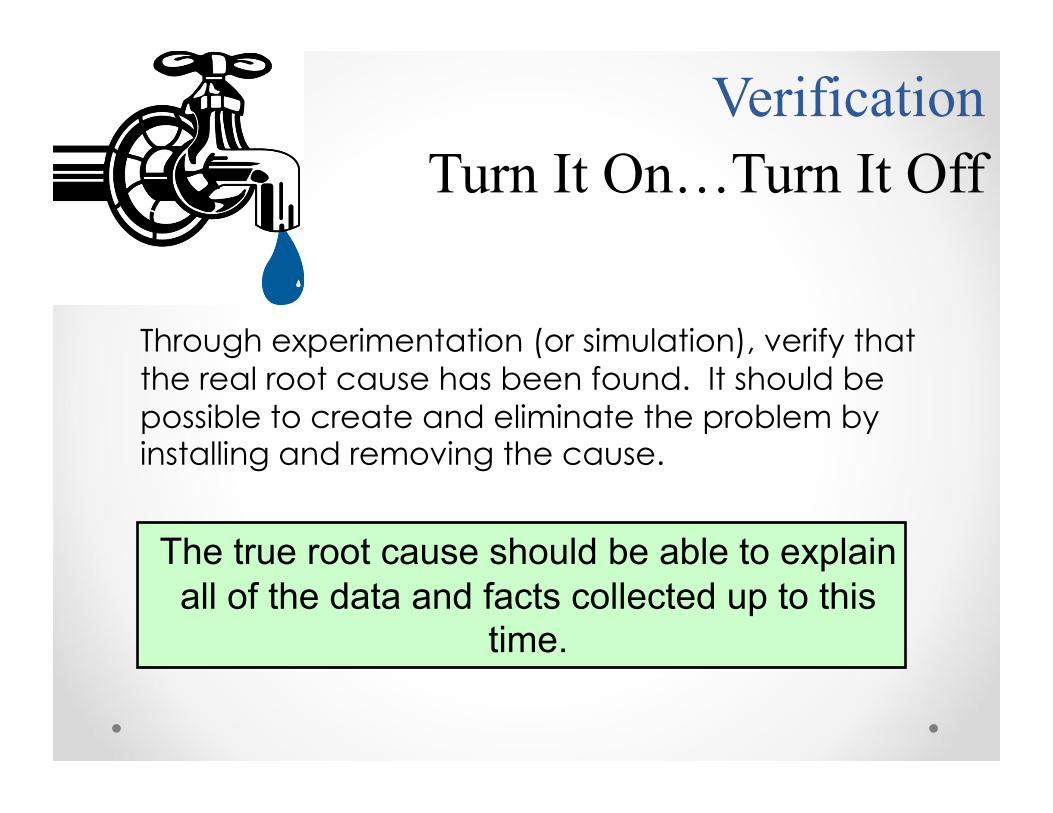
Verification Turn It On…Turn It Off
The true root cause should be able to explain all of the data and facts collected up to this
time.
Through experimentation (or simulation), verify that the real root cause has been found. It should be possible to create and eliminate the problem by installing and removing the cause.

Objective
To select from alternative solutions to the problem and verify that the problem causes are
eliminated, without introducing new problems.
• Brainstorming • Decision Matrix • Risk Assessment • Gage R&R • Capability Studies • Control Charts
Supporting Concepts and Methods
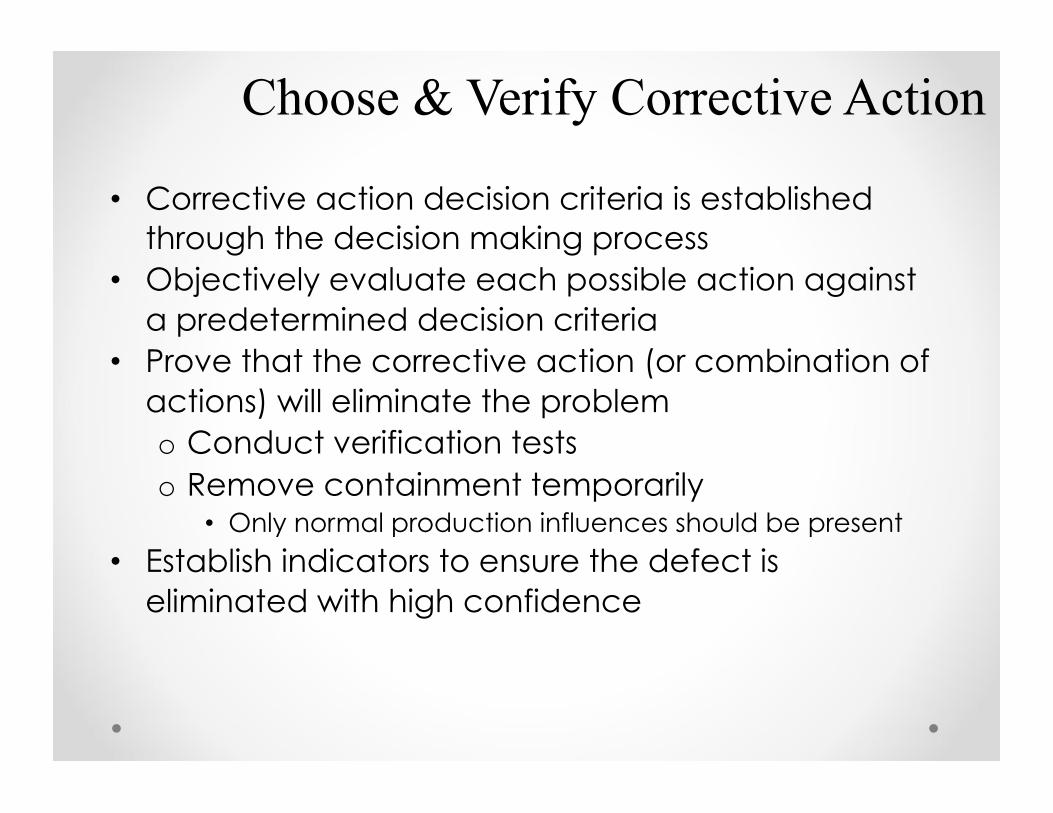
Choose & Verify Corrective Action
• Corrective action decision criteria is established through the decision making process
• Objectively evaluate each possible action against a predetermined decision criteria
• Prove that the corrective action (or combination of actions) will eliminate the problem o Conduct verification tests o Remove containment temporarily
• Only normal production influences should be present
• Establish indicators to ensure the defect is eliminated with high confidence
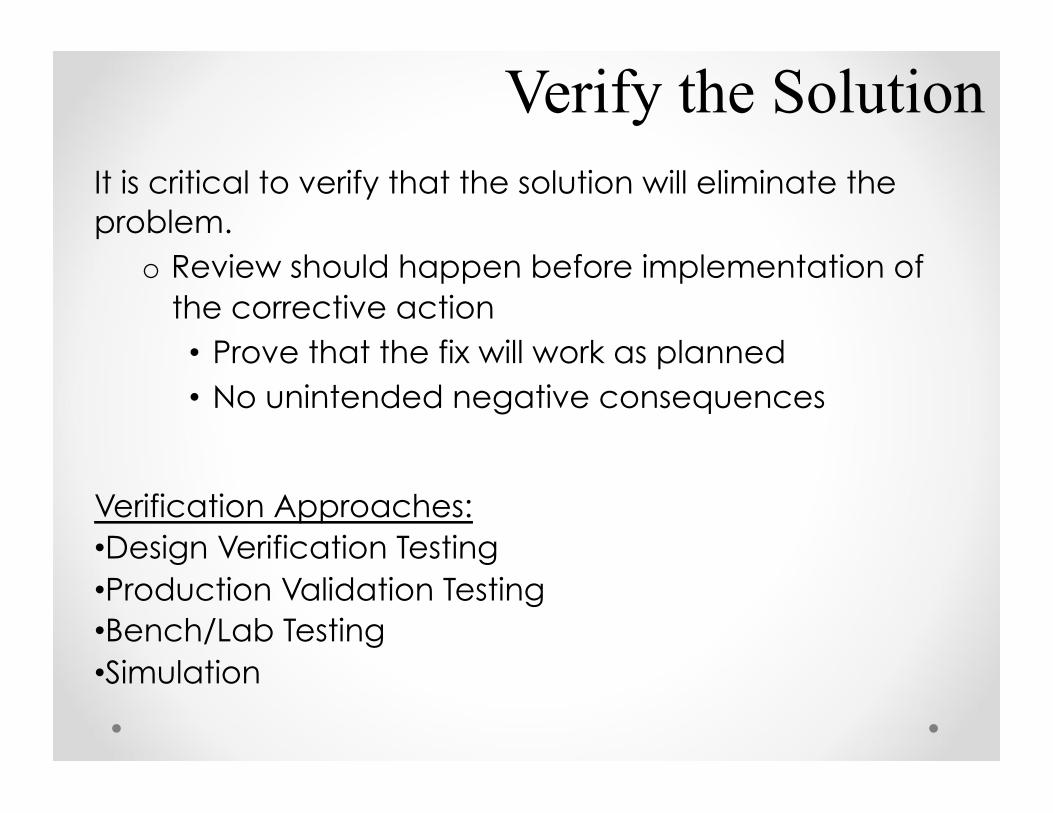
Verify the Solution It is critical to verify that the solution will eliminate the problem.
o Review should happen before implementation of the corrective action • Prove that the fix will work as planned • No unintended negative consequences
Verification Approaches: • Design Verification Testing • Production Validation Testing • Bench/Lab Testing • Simulation

Decision Making Details 1. Describe the end result
o What is the overall objective that must be achieved? 2. List the decision criteria
o Differentiate between “needs” and “wants” o Pros and Cons must be measurable and realistic o Make sure you cover all the bases and your Criteria
represent all areas (time, money, law, people, production, etc)
3. Identify the potential Solutions o Identify all the choices you have that may work o Make certain all ideas are included. o Balance reactive (inspection-based) and preventive (error-
proofing) activities
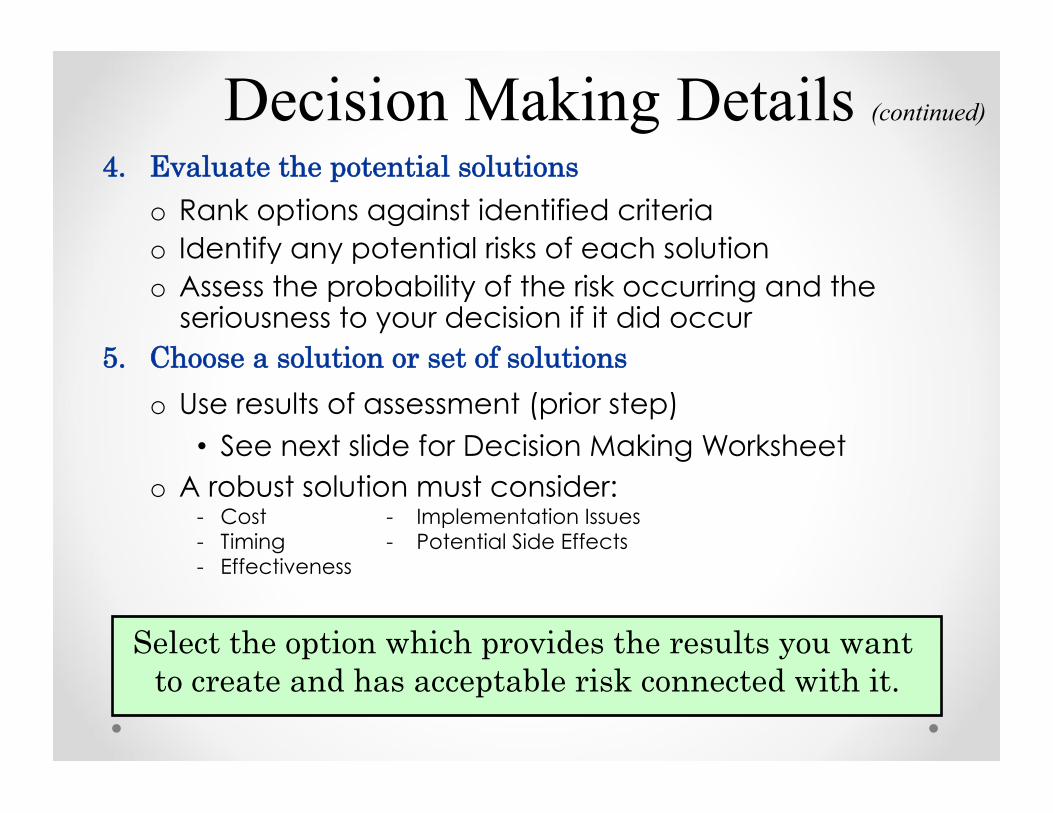
Decision Making Details (continued) 4. Evaluate the potential solutions
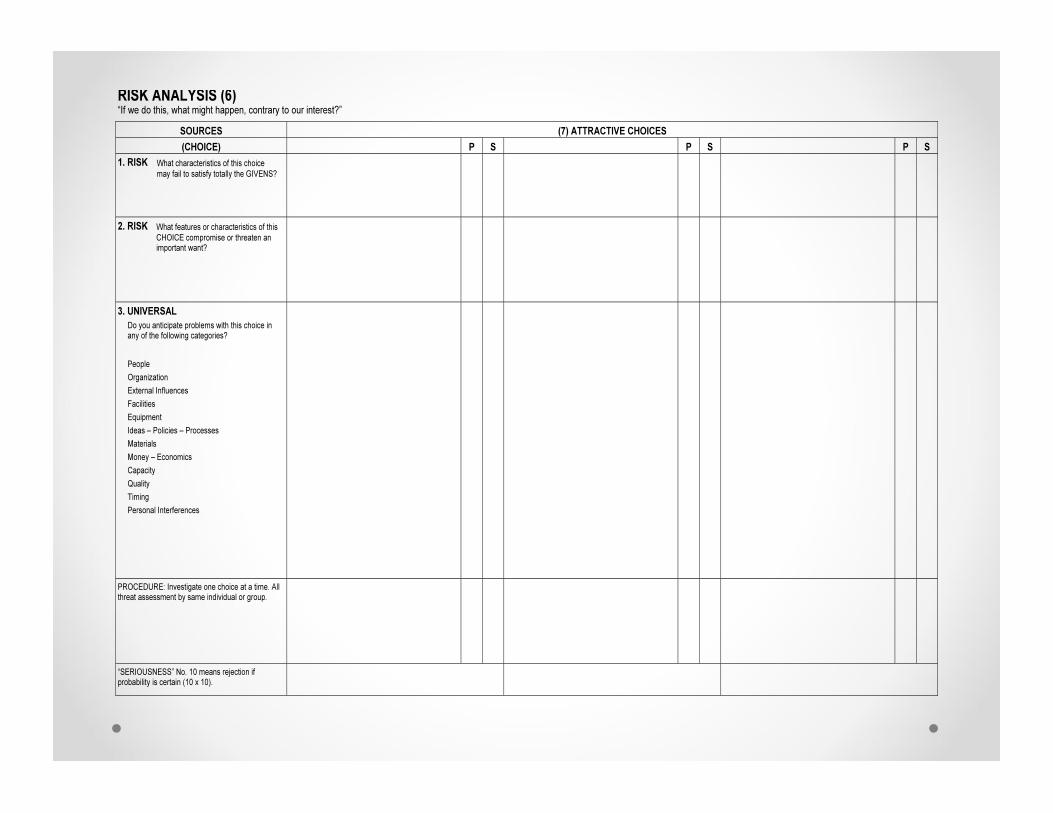
o Rank options against identified criteria o Identify any potential risks of each solution o Assess the probability of the risk occurring and the
seriousness to your decision if it did occur 5. Choose a solution or set of solutions
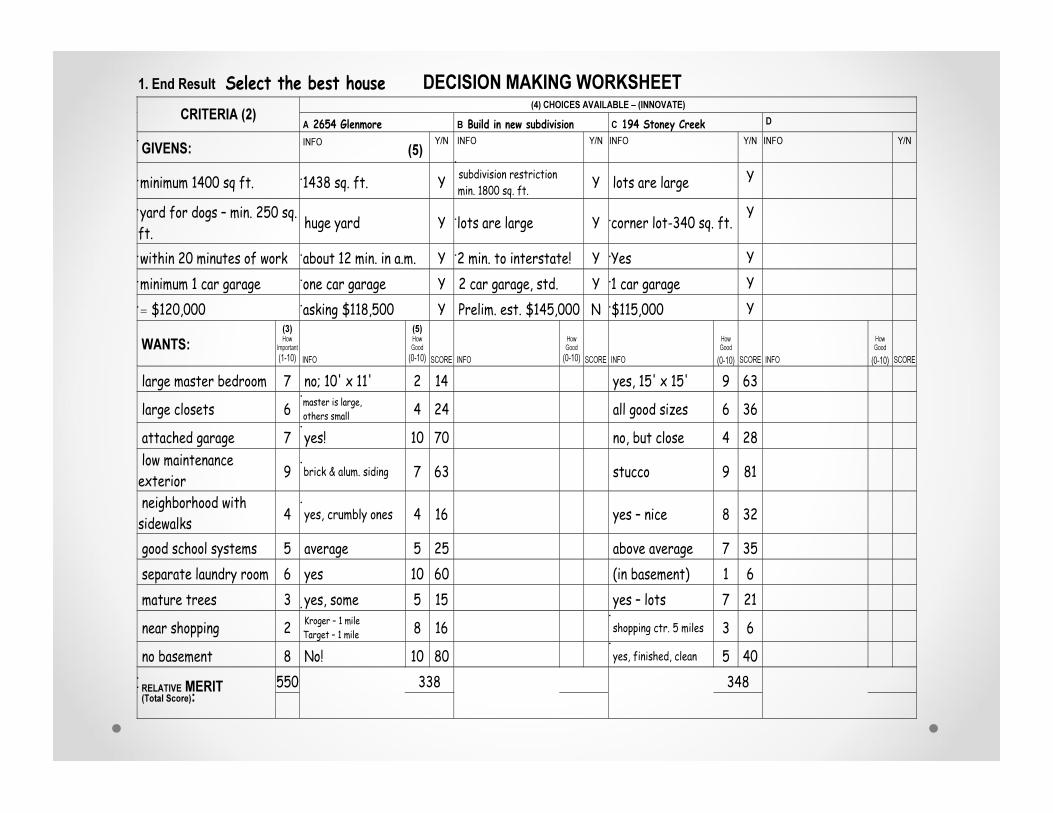
o Use results of assessment (prior step) • See next slide for Decision Making Worksheet
o A robust solution must consider: - Cost - Implementation Issues - Timing - Potential Side Effects - Effectiveness
Select the option which provides the results you want to create and has acceptable risk connected with it.
Objective
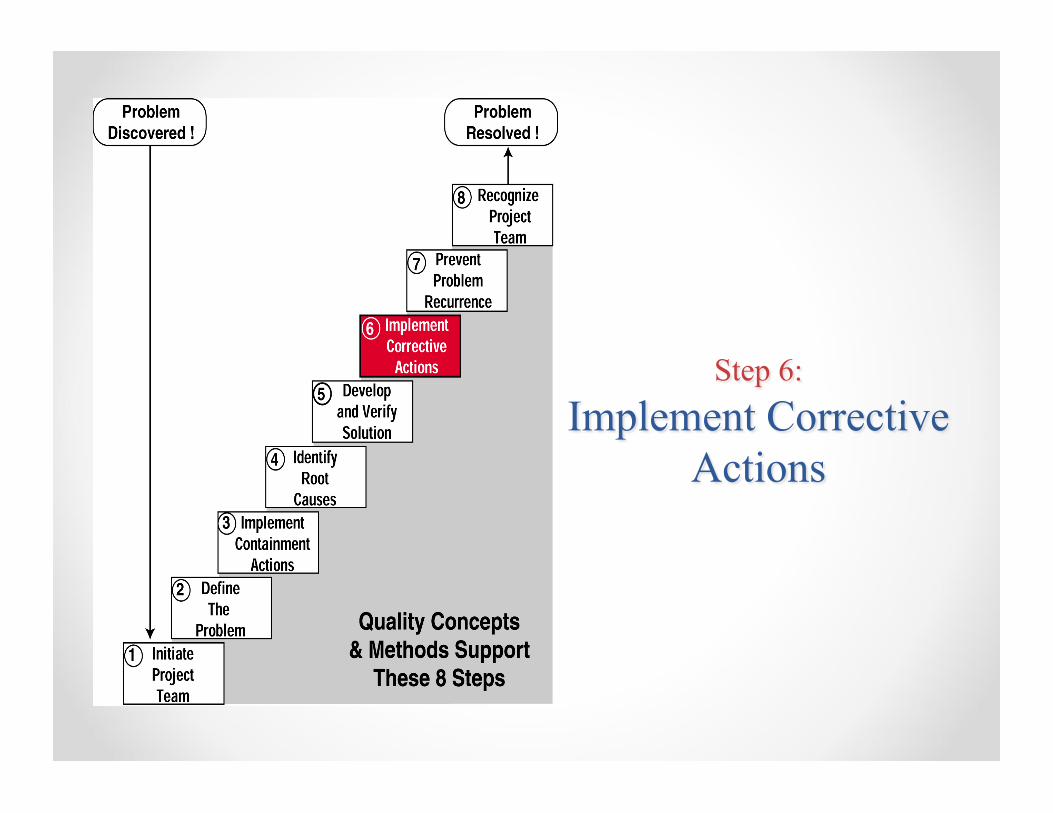
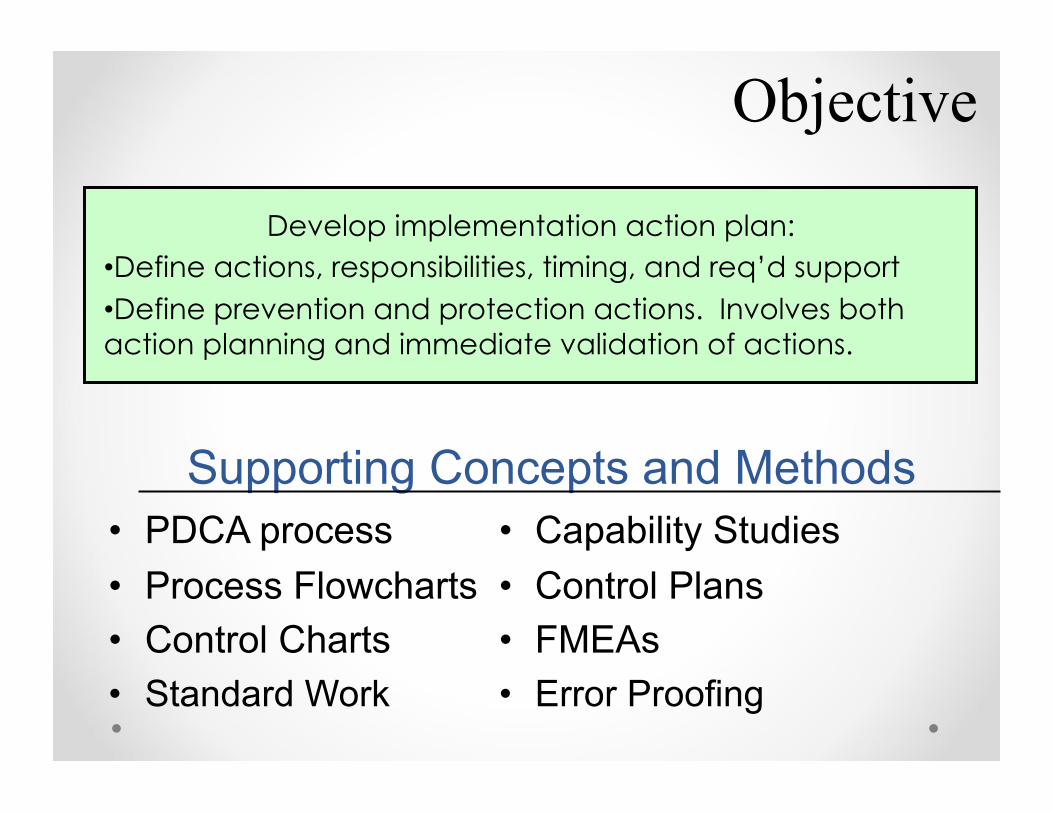
Develop implementation action plan: • Define actions, responsibilities, timing, and req’d support • Define prevention and protection actions. Involves both action planning and immediate validation of actions.
• PDCA process • Capability Studies • Process Flowcharts • Control Plans • Control Charts • FMEAs • Standard Work • Error Proofing
Supporting Concepts and Methods
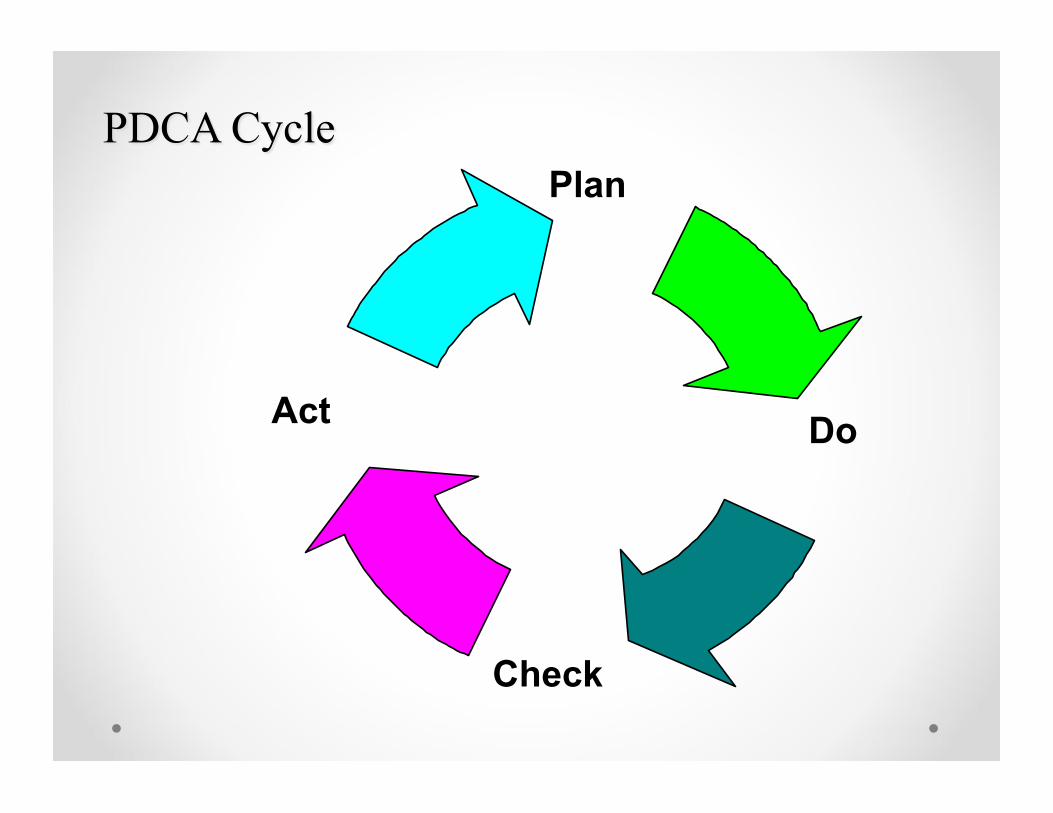
Plan
Check
Act Do
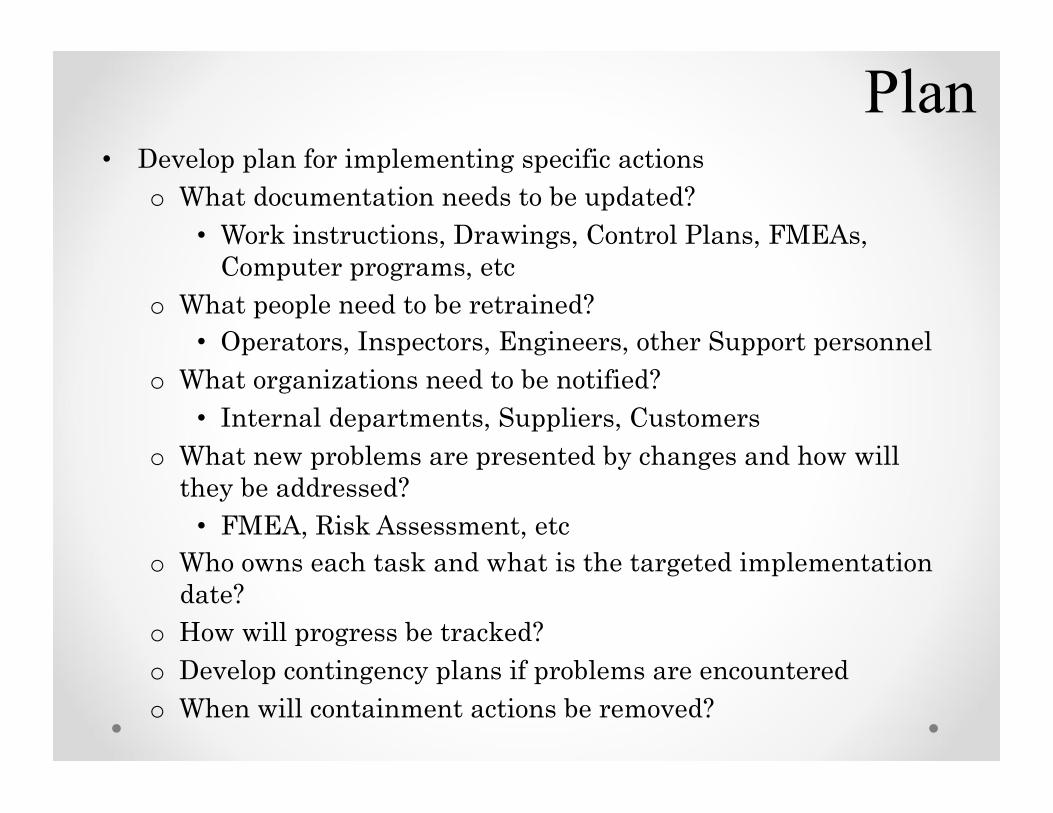
Plan • Develop plan for implementing specific actions
o What documentation needs to be updated? • Work instructions, Drawings, Control Plans, FMEAs,
Computer programs, etc o What people need to be retrained?
• Operators, Inspectors, Engineers, other Support personnel o What organizations need to be notified?
• Internal departments, Suppliers, Customers o What new problems are presented by changes and how will
they be addressed? • FMEA, Risk Assessment, etc
o Who owns each task and what is the targeted implementation date?
o How will progress be tracked? o Develop contingency plans if problems are encountered o When will containment actions be removed?
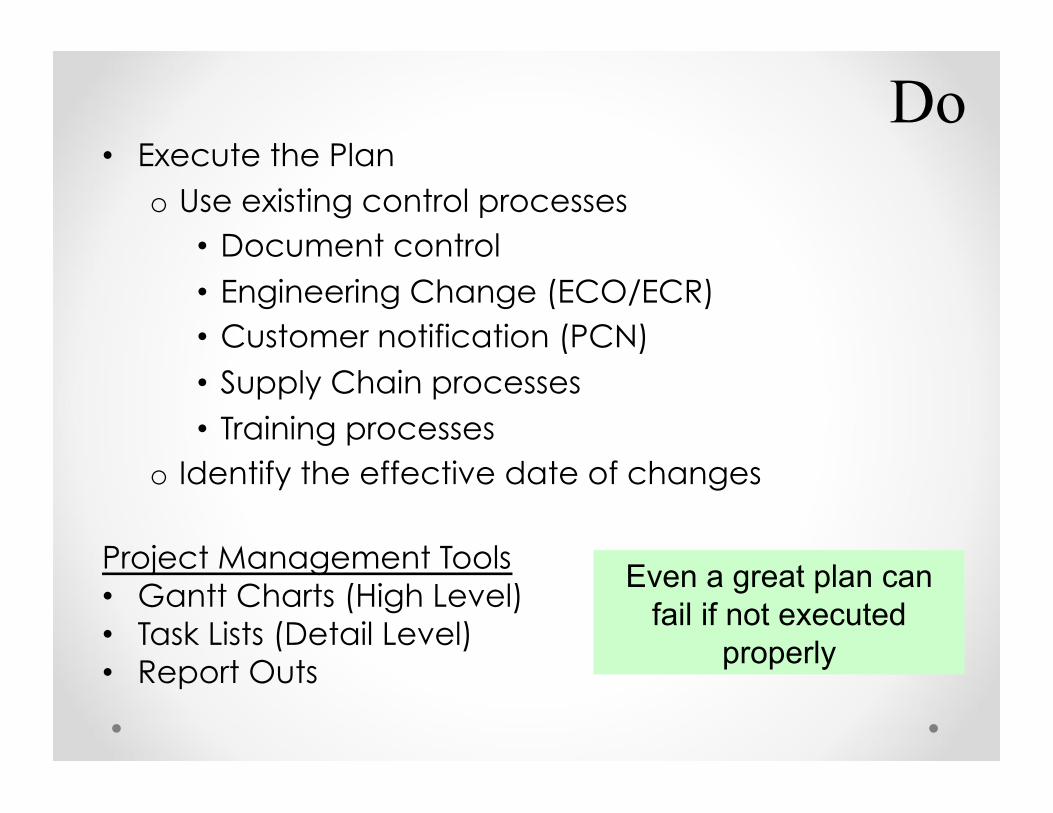
Do • Execute the Plan
o Use existing control processes • Document control • Engineering Change (ECO/ECR) • Customer notification (PCN) • Supply Chain processes • Training processes
o Identify the effective date of changes
Project Management Tools • Gantt Charts (High Level) • Task Lists (Detail Level) • Report Outs
Even a great plan can fail if not executed
properly
Check
• Review process to ensure things are working according to Plan o Track progress and determine resources needed
to meet commitment dates o Review performance results to ensure
improvements are being realized o Review costs to ensure financial impacts are in
line with expectations o Ensure that no unintended consequences are
happening (quality, efficiency, safety, etc)
Act
• Make necessary adjustments as needed o Reapply containment actions if problems still
present and revise corrective actions (back to problem solving and “Plan” phase)
o Deploy resources in different way to get execution back on track
o Move on to next opportunity if everything is complete and achieving desired results
Remember
Corrective actions remove the root cause of the problem, not just the effect. Corrective
actions are permanent. The problem should not be able to return.
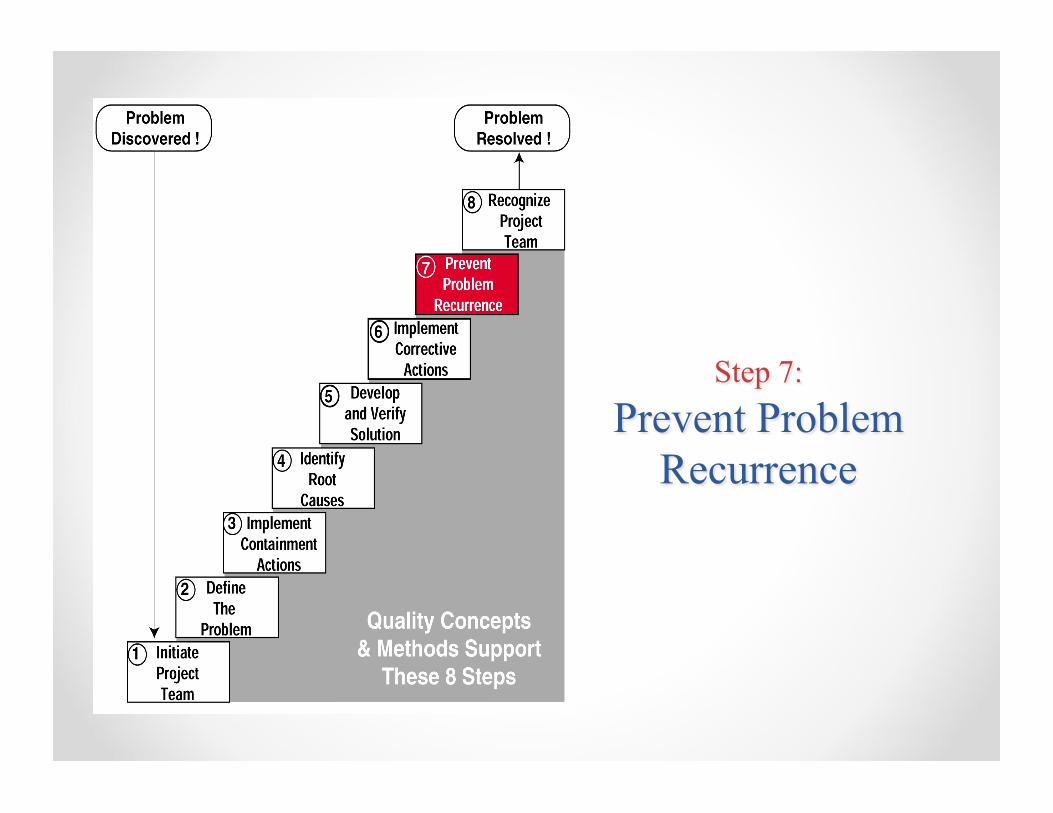
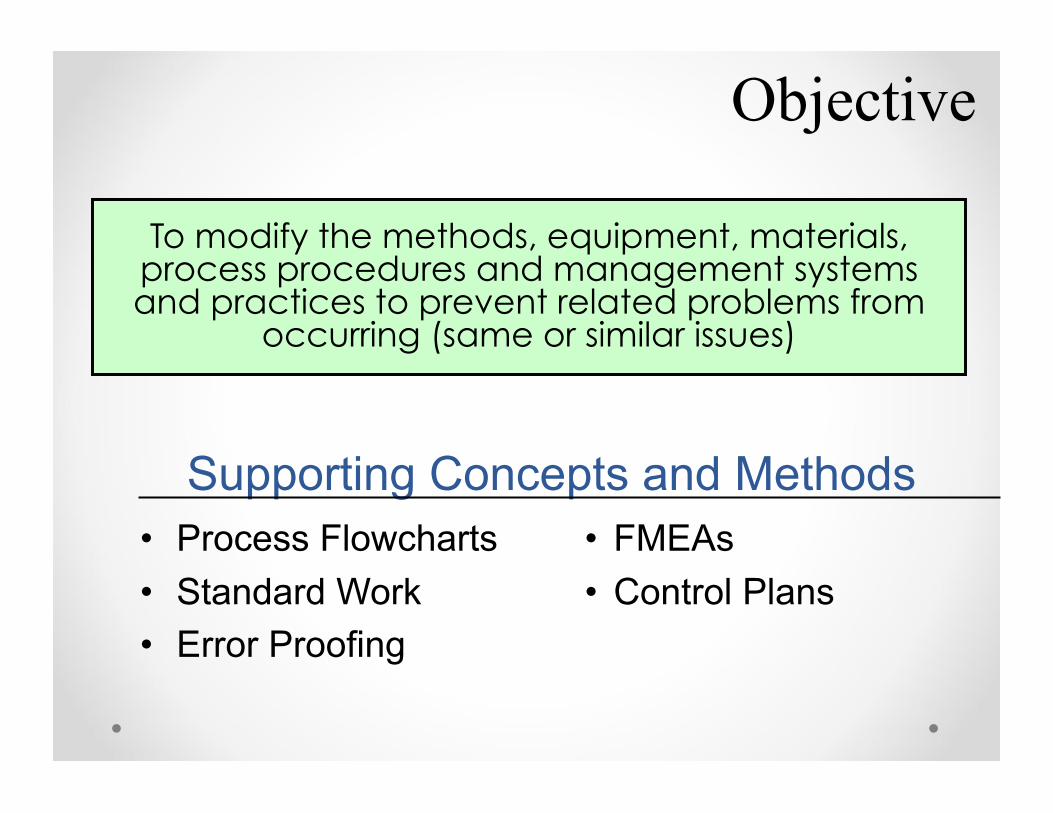
Objective
To modify the methods, equipment, materials, process procedures and management systems and practices to prevent related problems from
occurring (same or similar issues)
• Process Flowcharts • FMEAs • Standard Work • Control Plans • Error Proofing
Supporting Concepts and Methods
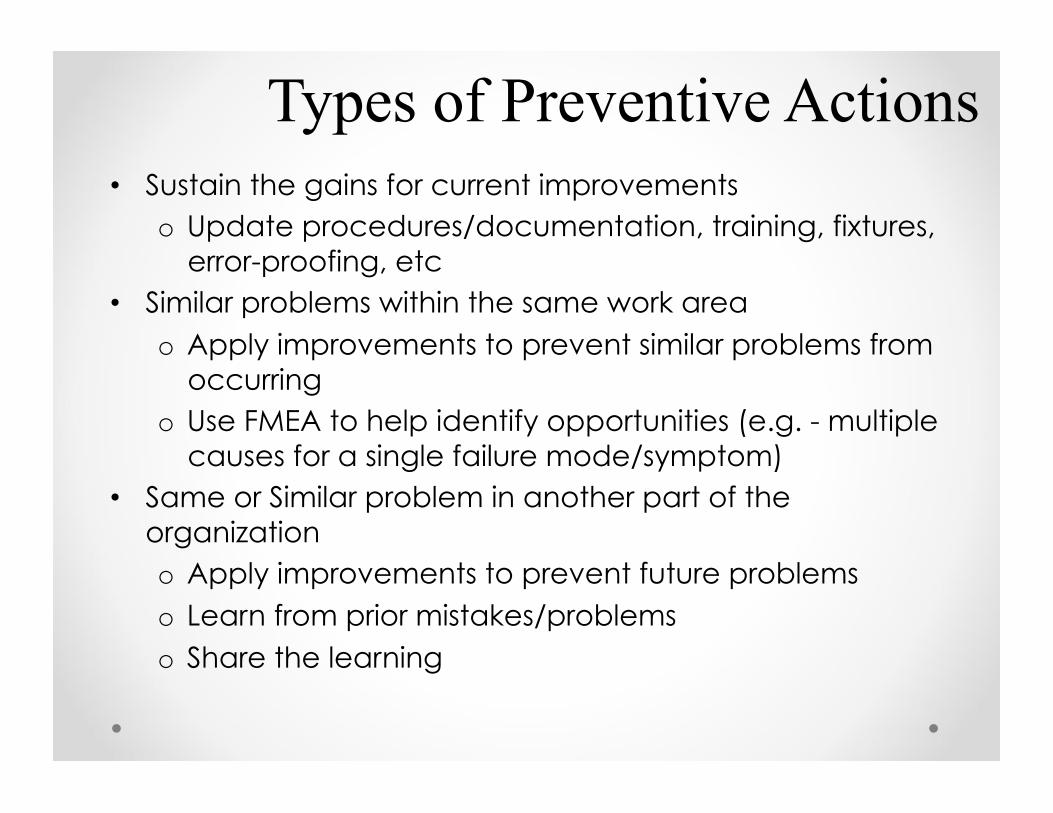
Types of Preventive Actions • Sustain the gains for current improvements
o Update procedures/documentation, training, fixtures, error-proofing, etc
• Similar problems within the same work area o Apply improvements to prevent similar problems from
occurring o Use FMEA to help identify opportunities (e.g. - multiple
causes for a single failure mode/symptom) • Same or Similar problem in another part of the
organization o Apply improvements to prevent future problems o Learn from prior mistakes/problems o Share the learning
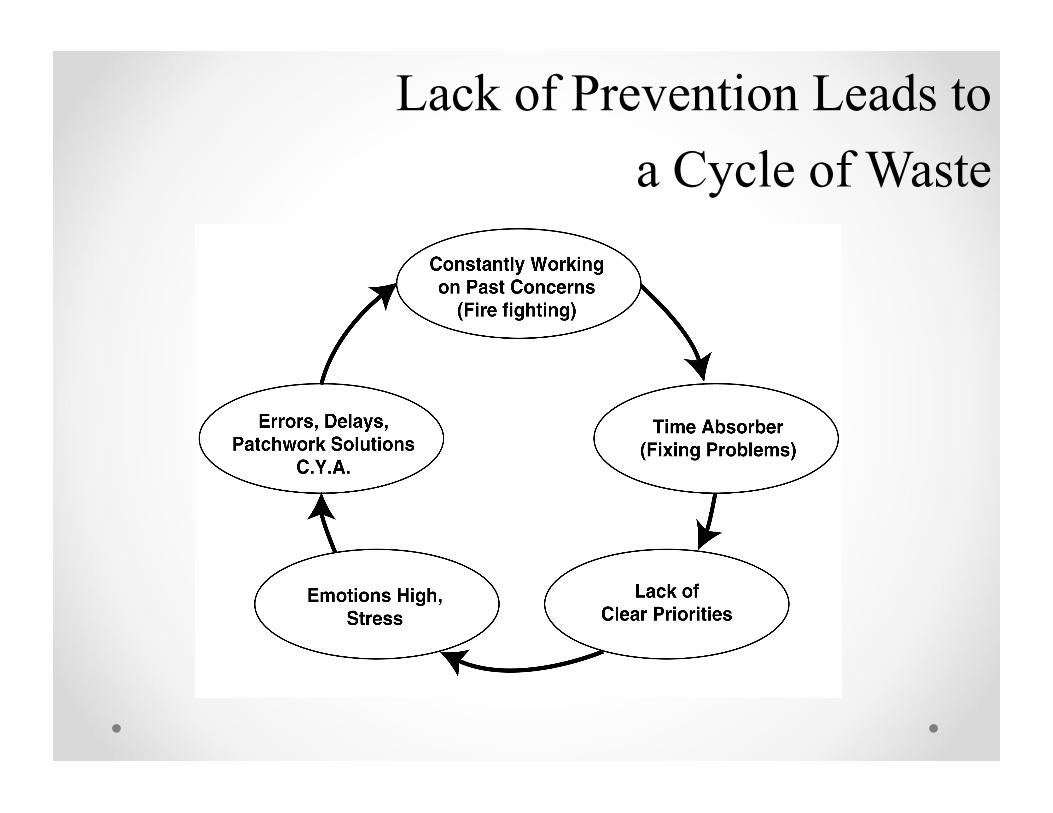
Lack of Prevention Leads to a Cycle of Waste

Objective
To recognize all the team members for their individual and collective efforts and develop
a climate for ongoing improvements.
• Employee Involvement/Participative Management • Interpersonal Communication Skills
Supporting Concepts and Methods
Recognize the Team If recognition is not given, team members are less willing to participate and are likely to become discouraged. Recognition and feedback is the most effective method available to shape behavior.
• Be specific on facts of each individual’s input
• Sincerity in both public and private recognition is required to make it acceptable to the recipient
• If you don't believe it, the team member won’t either
“You get what you expect.”
Congratulate Your Team
Recognize the team’s collective efforts (both past and present) in solving the problem and show appreciation for individual contributions. Team members are in the best position to begin this process.
• People respond favorably to sincere, thoughtful recognition.
• Recognition makes people “feel good” about themselves, their achievements, and the organization that took the time to acknowledge them.
• Recognition provides very positive reasons for team members to participate in future efforts.
Forms of Recognition Top Management Letter • Deliver at home (Family) • Post on bulletin board (Co-workers) • Place in personnel file (Management)
Performance Review • Include as major contribution
Plaque • For outstanding contribution • Personal, and specific to problem solved.
Recognition needs can differ greatly from person to person.