problem of green building construction local technology ... · problem of green building...
TRANSCRIPT

Problem of Green Building Construction
Local Technology and Material in Indonesia
Krishna Mochtar, PhD Affiliation:
INDONESIA CONSTRUCTION EXPERTS ASSOCIATION
Presented at th
e FIG W
orking Week 2017,
May 29 - June 2, 2
017 in Helsinki, F
inland

Indonesian Construction Experts Association (ATAKI)
The largest Construction Experts Association in Indonesia
Founded in 1999 to answer deficit of certified construction experts in Indonesia and equity with foreign construction experts
34 provinces (all Indonesia) Branch Office
Members: 5,000 construction experts in Architecture, Civil, Environmental, and Mechanical Engineering
40,000 Construction experts certification since 2005
• INDONESIA CONSTRUCTION EXPERTS ASSOCIATION

Institut Teknologi Indonesia (ITI)
One of very few technology university in Indonesia
Founded in 1984 by Prof Habibie (Indonesian Technology Top Figure) from Indonesia Engineers Association (PII) to answer deficit of Engineers in Indonesia
Student Body: 5,000 students in 10 study program including in Civil Engineering, Industrial Engineering, and Agricultural Engineering Programs
10,000 Engineering Graduates since 1990
CONTENTS
Background
Literature Review
Methodology
Discussion and Policy Implication
Conclusion

BACKGROUND
Implementation of green building construction project in Indonesia is not optimal
A subject of attention of the Government of
Indonesia is how important and strategic application
of technology and the level of use of the product in
the country in the implementation of green building
projects

OBJECTIVES
to discover the problem on green building construction local technology and material in Indonesia

LITERATURE REVIEW
Green building certification process in Indonesia began only in the year of 2011 in line with the Regulation of Minister of Environment Number 8/2010 on Criteria and Certification of Green Building.
Green building experts, consultants, and contractors are still very few in Indonesia (arround 20-30 persons/institutions).
Green buildings in Indonesia: been certified are 28 buildings
in certification process is as many as 79 buildings
the total is (only) 107 buildings

LITERATURE REVIEW
GREEN BUILDING MAP IN INDONESIA
CERTIFIED 28 BUILDINGS
IN PROCESS 79 BUILDINGS
TOTAL 107 BUILDINGS
KALIMANTAN
1 BUILDING (1%)
SUMATERA
6 BUILDINGS (5,6%)
JABODETABEK
84 BUILDINGS (78,5%) JAVA NON- JABODETABEK
14 BUILDINGS (5,6%)
P BALI
1 BUILDING (1%)
SULAWESI
1 BUILDING (1 %)

COMPARISON WITH OTHERS
When compared with the development of green building in Asean countries
particularly Singapore (2155 buildings began in 2005)
Malaysia (976 buildings began in 2009), (Mochtar et. al., 2015)
the number of green building in Indonesia is very small.

Table 1. Green Building Technology and Material
No Description of Technology and Material
A Civil
1. Precast/prefab
2. Steel pile
3. Concrete pile
4. Reinforcement steel bar
5. Steel profile
6. Steel Bolt
7. Ready Mix Concrete
8. Portland Cement
9. Concrete Chemical Additive
10. Concrete Formwork
B Architecture
1. Natural Water (river, rain) Technology Utilization
2. Optimum Natural Illumation (lay out, building orientation, facade)
3. Waste water recycle technology
4. Optimum soil water absorption
5. Bricks
6. Non toxic wall paint
7. Non toxic wood paint
8. Heat insulation glass
9. Non toxic ceiling
10. Certified wood product
11. Certified plywood product
12. Water saving urinoir
13. Water saving squatting water closet
14. Water save sitting water closet
15. Water saving sink
16. Water saving kitchen sink
17. Environmental friendly ceramic tiles product
18. Environmental friendly roof cover product
19. Non toxic wall finish
20. Environmental friendly door/window hanger
21. Environmental friendly bathroom tiles
22. Water saving bathroom shower
C Mechanical
1. Water saving water sprayer
2. Water recycle technology
3. Mechanized and electrified natural ventilation technology
4. Non toxic plumbing system product
5. Water saving automated tap
6. Energy saving and environmental friendly air condition
7. Energy saving lift
8. Energy saving escalator
9. Energy saving pump system
10. Environmental friendly waste water recycle system
11. Environmental friendly waterproofing system
D Electrical
1. Solar panel technology
2. CO2 air content detector technology
3. Smart building (computer, software, automated equipment) technology
4. Energy saving water heater
5. Automated light switch with light and movement detector
6. Energy saving light

METHODOLOGY
The Survey The study was by conducting survey in Jakarta, the central area of
green buildings in Indonesia. The primary data is collected from experts, consultant, and contractors
of green building projects based on their experience, to confirm the level of usage of the technology and material in their projects in terms of percentage of local technology and material, the reason (availability, price, and quality) when the level nof usage is lower than 50%, and finally the solution to increase its usage in green building construction
Data Analysis The level of usage of the technology and material in their projects in
terms of percentage of local technology and material is analyzed using simple statistic analysis, namely mean score analysis of each technology and material.
By using this analysis, both the percentage of the usage and locality of the green building construction technology and material is found, and then interpreted.
.

RESEARCH FINDINGS

Table 2. Percentage of Local Technology and Material
No Description of Technology and Material Level of Usage
(%)
Local
Perentage A Civil
1. Precast/prefab 83 73
2. Steel pile 50 65
3. Concrete pile 100 100
4. Reinforcement steel bar 83 98
5. Steel profile 83 79
6. Steel Bolt 83 95
7. Ready Mix Concrete 100 95
8. Portland Cement 100 95
9. Concrete Chemical Additive 83 5
10. Concrete Formwork 67 100
Mean Percentage of Civil 83 81
B Architecture
1. Natural Water (river, rain) Technology Utilization 67 55
2. Optimum Natural Illumation (lay out, building orientation, facade) 100 62,5
3. Waste water recycle technology 83 52,5
4. Optimum soil water absorption 100 55
5. Bricks 83 80
6. Non toxic wall paint 100 5
7. Non toxic wood paint 100 1
8. Heat insulation glass 83 17,5
9. Non toxic ceiling 83 5
10. Certified wood product 67 85
11. Certified plywood product 67 30
12. Water save urinoir 83 1
13. Water save squatting water closet 67 0
14. Water save sitting water closet 100 10
15. Water save sink 100 5
16. Water save kitchen sink 83 0
17. Environmental friendly ceramic tiles product 83 80
18. Environmental friendly roof cover product 83 60
19. Non toxic wall finish 100 30
20. Environmental friendly door/window hanger 83 30
21. Environmental friendly bathroom tiles 83 80
22. Water save bathroom shower 100 5
Mean Percentage of Architecture 86 34
C Mechanical
1. Water save water sprayer 83 3
2. Water recycle technology 100 5
3. Mechanized natural ventilation technology 67 40
4. Non toxic plumbing system product 83 75
5. Water save automated tap 100 10
6. Energy save and environmental friendly air condition 100 2
7. Energy save lift 83 0
8. Energy save escalator 67 0
9. Energy save pump system 83 60
10. Environmental friendly waste water recycle system 83 20
11. Environmental friendly waterproofing system 100 10
Mean Percentage of Mechanical 86 20
D Electrical
1. Solar panel technology 33 30
2. CO2 air content detector technology 67 0
3. Smart building (computer, software, automated equipment) technology 83 30
4. Energy save water heater 33 70
5. Automated light switch with light and movement detector 100 20
6. Energy save light 100 80
Mean Percentage of Electrical 74 36
Table 2. Percentage of Local Technology and Material

Findings and Discussion
The green building technology and material with low (lower than 50%) local mean percentage use is in architecture (34%), mechanical (20%), and electrical (36%), with level of usage is between 33-100%
The lowest (0-1%) local percentages are non toxic wood paint, water saving squatting closet and kitchen sink.
Green building construction technology and material in these catagories is relatively new, and thus it is not well developed in Indonesia.
Findings and Discussion
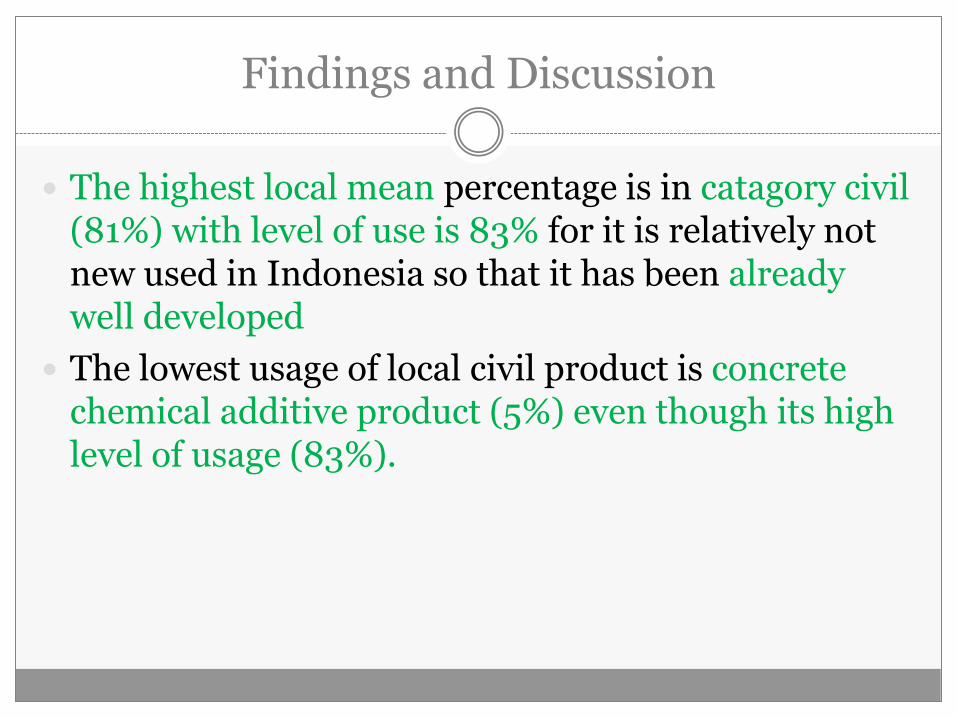
The highest local mean percentage is in catagory civil (81%) with level of use is 83% for it is relatively not new used in Indonesia so that it has been already well developed
The lowest usage of local civil product is concrete chemical additive product (5%) even though its high level of usage (83%).

Table 3. Reason and Solution for the Low Usage of Local Technology and Material

Table 3. Reason and Solution for the Low Usage of Local Technology and Material

Findings and Discussion
Availability problem: solved by socialization/marketing for the technology and material
actually exists however the users do not know their existence
Civil: concrete chemical additive
Architecture: heat insulation glass, non toxic ceiling, water saving urinoir, and water saving bathroom shower
Mechanical: water saving water sprayer, water recycle technology, energy saving and environmental friendly air condition, environmental friendly waste water recycle system
Electrical: automated light switch with light and movement detector (electrical).
solved by technology development of the material.
Architecture: Water saving squatting closet
Electrical: CO2 air content detector technology (electrical).

Findings and Discussion
Price problem: solved by socialization/marketing for the technology and material
actually with competitive price however the users do not know it.
Architecture: water saving urinoir, water saving sitting closet, water saving kitcehn sink, non toxic wall finish, water saving bathroom shower
Mechanical: water saving water sprayer, and water saving automated tap
Electrical: smart building (computer, software, automated equipment) technology
Solved by developing more competition atmosphere
Electrical: solar panel technology

Findings and Discussion
Quality problem: Solved by socialization/marketing for the technology and material actually in
good quality however the users do not know it Civil: concrete chemical additive Electrical: energy saving and environmental friendly air condition, energy saving
lift, energy saving escalator
solved by showing level of green Architecture: non toxic wall paint (VOC content), non toxic wood paint
(formaldehid content), water saving urinoir (percentage of water saving), water saving squatting closet (percentage of water saving), water saving sitting closet (percentage of water saving), water saving sink (percentage of water saving), water saving kitchen sink (percentage of water saving), water saving bathroom shower
Mechanical: water saving tap (percentage of water saving) (mechanical)
solved by development of quality certification Mechanical: environmental friendly waterproofing system Electrical: smart building (computer, software, automated equipment) technology
(electrical).

CONCLUSION

CONCLUSION
There is problem with green building technology and material such as low (lower than 50%) local mean percentage usage as in catagories of architecture (34%), mechanical (20%), and electrical (36%), with level of usage is between 33-100%. On the other hand, the local mean percentage of civil catagory is relatively better than other catagories; it is 81% with level of usage is 83%.
There are reasons for the low local technology and material usage that can be devided into three reasons: availability, price, and quality of the local technology and material product in green building project.

CONCLUSION
The solution proposed for these problems include social/marketing, developing local technology, enhancing competition atmosphere, implementing quality certification, and finally showing the level of green of the construction technology and material in green building
As the implication, some policies are necessary to solve these problems: To develop and implement the improvement program of
socialization/marketing to the local technology and material product for green building that already exists with competitive price and quality by enhancing competition atmosphere.
To push local technology development of technology and material product that is in high usage but not yet existing.
To encourage quality certification and product quality equalization by showing the level of green of the technology and material product.

THANK YOU TERIMA KASIH
Krishna Mochtar, PhD
INDONESIA CONSTRUCTION EXPERTS ASSOCIATION