problem solving steps 3 and 4 plan development, progress ... rti ps overview part c... · plan...
TRANSCRIPT

Problem Solving Steps 3 and 4
Plan Development, Progress
Monitoring and Plan Evaluation
Fall, 2010
Terry Schuster/Jennifer Derricks
RtI Partnership CoachesThanks to
Janice Miller, Ph.D.

Intended Outcomes
• Know the decisions to be made at each stage of the problem solving process.
• Know how to set and write goals.
• Know how to write an intervention plan
• Know how to plan and ensure the integrity of interventions.
• Know how to implement the components of a progress monitoring plan.
• Know how to make decisions about student progress and outcomes.

Big Ideas About Plan Development, (PD)
Progress Monitoring (PM) and Plan
Evaluation (PE)
1. Effective interventions are scientifically based and implemented with integrity.
2. Writing a well-defined goal is crucial to achieving the desired outcome (for non-special education and special education students).
3. One of the most powerful tools that schools can use is systematic and frequent progress monitoring.

4. Analysis of progress monitoring data is
the basis of Plan Evaluation
5. There are a variety of goal and outcome
decisions that can occur during Plan
Evaluation.
6. Information about interventions and
student’s response is essential for
entitlement decisions for LD determination.

Review: Steps 1 and 2 of the
Problem Solving Model

Step 1: Problem Identification
Question: What is the discrepancy between what is expected and what is occurring?
List problem behaviors and prioritize.
Collect baseline data on primary area of concern (screening/benchmarking data, diagnostic data, observations, etc.) Record Review
Interview
Observe
Testing
State the discrepancy between target performance and peer performance by writing a measurable problem statement

Step 2: Problem Analysis
Question: Why is the problem occurring?
Review RIOT data, think about why the problem is occurring, and determine appropriate additional RIOT data you need to collect to:Differentiate between skill problem and performance
problem (e.g. can’t do vs. won’t do)
Determine situations in which the problem behavior is most likely and least likely to occur.
Examine hypotheses for why a problem is occurring.
Narrow down to the most validated and alterablehypothesis.

CURRICULUM
• Content of materials
• Difficulty level of materials
• Sequencing
• Organization
• Perceived relevance
INSTRUCTION
• Instructional philosophy• Instructional approach or
method(s)• Expectations/objectives• Clarity & organization• Pace• Opportunities for practice• Duration of continuous
instruction• Nature & frequency of
feedback• Academic engaged time• Classroom Management
Content of Domains

ENVIRONMENT
• Arrangement of the room
• Furniture/equipment
• Rules
• Management plans
• Routines
• Expectations
• Peer context
• Peer and family influence
• Task pressure
LEARNER
• Appropriateness of
curriculum and instruction
• Perception of learning
environment
• Academic skills
• Social/behavioral skills
• Adaptive behavior skills
• Motivation
• Medical Issues
Reality Check
• Problem ID and Problem Analysis may not be discrete steps.
• When collecting data you may realize you targeted the wrong problem.
• You may realize you collected inappropriate baseline data.
• You may not have collected enough data to support a hypothesis.
• You may have targeted the problem at an inappropriate tier.
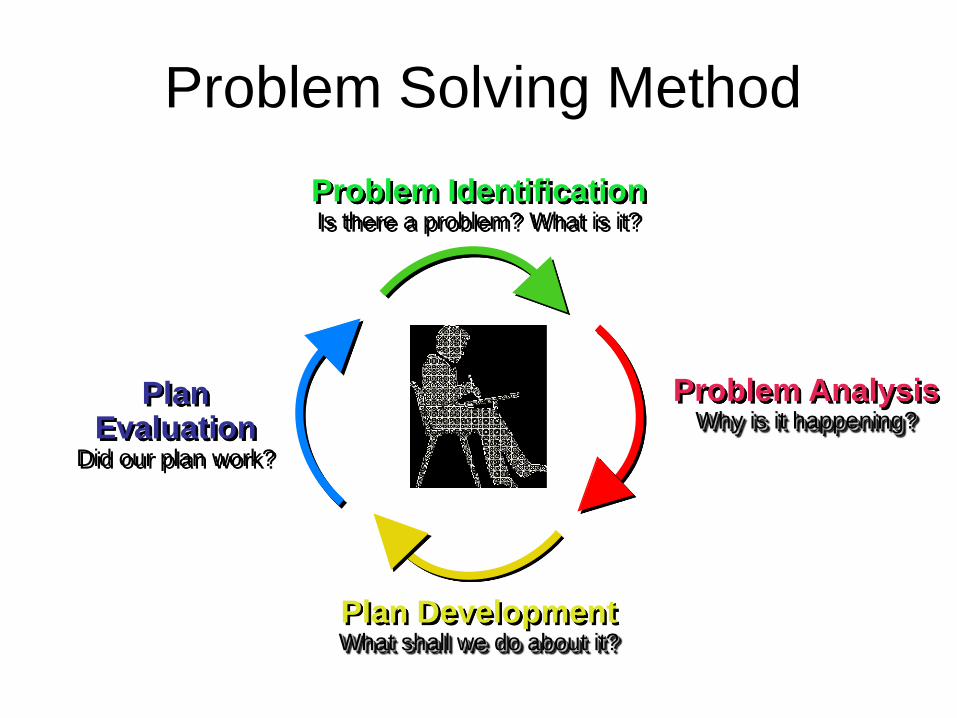
Problem Solving Method
Plan Evaluation
Did our plan work?
Problem AnalysisWhy is it happening?
Problem IdentificationIs there a problem? What is it?
Plan DevelopmentWhat shall we do about it?

Plan Development and Evaluation
are part of all Tiers
• Methods learned today can be applied to
looking at core curriculum as well as small
group intervention programs.
– i.e. writing your SIP plan
– Using triangle data to develop a plan an
evaluate in
– Evaluating your Tier 2 intervention programs

Today’s discussion is focused
on goal setting and plan
development for students at the
level of Individual Problem
Solving (Gen. Ed. Tier III and
Sp. Ed. IEP’s)

How is this different from goal
setting at Tier II?
- Student goals in Tier II are set
in the context of grade level
benchmarks. EVERYONE in
the group has the same goal.

Step 3: Plan Development
Question: What is the goal? Write the goal, a measurable statement of expected outcomes.
Question: What is the intervention plan to address the goal? Define logistics (e.g., what strategies/procedures will be used,
when and how often the intervention will occur, who will implement the intervention, where will it be implemented, and when will it begin.)
Question: How will progress be monitored? Define logistics (e.g., what materials are used, when and how often
data is collected, where data will be collected, and who is responsible.)
Decide on decision-making rule for plan evaluation.

Formative Evaluation is Impossible without Clear Goals

Goals Make Progress Decisions Easier

Writing the Goal
– Specify desired behavior
– Specify measurement conditions
– Specify criterion for success and timeline
– Check: Could you graph this goal?

Template
In (number) weeks, when (condition) occurs, (learner) will (behavior) to a (criterion).
Nonexample:
– Katrina will read more fluently and accurately in age appropriate materials.
What’s missing??????????

I’d also add more specific
conditions for success…
On average (over a period of time)
On a certain date (1x)
On (#) consecutive trials
On (#) out of (#) trials

Goals should be…
• Related to the discrepancy statement
• Focused on what you want the student to do
• Clear and precise
• Ambitious
• Long-term
• Developed through a collaborative process
• Evaluated continuously

Anna’s Goal
Anna will complete constructed response
items (recall items i.e short answer, fill in
he blank, short essays) on independent
seatwork and homework assignments in
reading and math with an average of 85%
accuracy or with a 4 point rating within 8
weeks of initiation of intervention.

Kori’s Goal
Kori will orally read 2nd grade passages
using AIMSweb probes with 88 WRC and
2 or fewer errors on three consecutive
occasions by May 30, 2010.

Activity # 1
Write a goal for this example:
Who: Jerome, 5th grader
Current Level: Fall Benchmark 7 RC on
5th grade MAZE CBM
Time Period: 8 weeks
Desired Outcome: 16 RC on 5th grade
MAZE CBM probe

Calculating the Rate to Reach Goal
Goal WRC = 16
Current WRC = 7
Difference: 16-7=9
9/8 weeks = 1.1 WRC/week

Template for Using CBM Measures to Write Goals
Reading In (#) weeks (Student name) will read (#)
Words Correctly in 1 minute from randomly
selected Grade (#) passages.
Spelling In (#) weeks (Student name) will write (#)
Correct Letter Sequences and (#) Correct
Words in 2 minutes from randomly selected
Grade (#) spelling lists.
Math Computation In (#) weeks (Student name) will write (#)
Correct Digits in 2 minutes from randomly
selected Grade (#) math problems.
Written Expression In (#) weeks (Student name) will write (#) Total
Words and (#) Correct Writing Sequences when
presented with randomly selected Grade (#)
story starters.

Reading Survey Level
Assessment: Tool for Goal
Setting for Discrepant Students

Data collection decisions
If using CBM, determine level of “success” using
Survey Level Assessment
– Initiate assessment at current grade placement
– Continue to test downward through successive levels
of the GE curriculum until student is successful
– “Success” is defined as “the level of the general
education curriculum in which the student performs
within the average range - between the 25th and 75th
%tile”.

Conducting a Survey Level Assessment: Kate, a 3rd Grader
Reading Survey-Level Assessment for Kate, A Third-Grader
Grade Reading Assessment
Passages
Passage 1 (WRC/E)
Passage 2 (WRC/E)
Passage 3 (WRC/E)
Median (WRC/E)
Fall Performance
Level
3 35/6 37/5 50/8 37/6 At Risk Reader
2 60/4 58/3 42/7 58/4 Average Reader

Ways to determine
Instructional Level?

Determining the Criterion for Success
National Norms
Normative Growth Rates
Linkage to High Stakes Tests
Local Norms

Determining Criteria for Non-
Academic data
“Talk about”
How do you define “tardy”,
“homework completion”, “attention
to task”

Examples of Percentile Rank
Norms

Normative Growth Rates in
ReadingSubject Grade 50th%tile:Realistic 84th%tile: Ambitious
Reading
(WRC)
1
2
3
4
5
6-8
2
1.5
1
.85
.5
.3
3
2
1.5
1.1
.8
.65
Spelling
(CLS)
2
3
4
5 & 6
1
.65
.45
.3
1.5
1
.85
.65
Math (CD) 1-3
4 & 5
.3
.7
.5
1.15
(3)

New ISAT Correlates Chart
• From www.measuredeffects.com
• Should be used for
program evaluation
purposes
• Adds Spring
“Confidently Proficient”
area
• See larger handout in
packet

Computing Goal based on Normative Growth Rates: An ExampleCriterion for Success = Score on Survey
Level Assessment (SLA) + (Grade Growth
Rate X # of Weeks) = goal
Score on SLA (30 WRC)+ (Ambitious Grade
Growth Rate (2.0 WRC-Grade 2) times # of
Weeks (32)
Or
30 + (2.0 X 32) or 30 + 64 = Goal of 94 WRC

Let’s Use Kate’s Results

Conducting a Survey Level Assessment: Kate, a 3rd Grader
Reading Survey-Level Assessm ent for Kate, A Third-Grader
Grade Reading
Assessment
Passage s
Passage 1
(WRC/E)
Passage 2
(WRC/E)
Passage 3
(WRC/E)
Median
(WRC/E)
Fall
Performance
Level
3 35/6 37/5 50/8 37/6 At Risk
Reader
2 60/4 58/3 42/7 58/4 Average
Reader

Kate
Grade 3 Median WRC = 37 (Current performance level)
Amount of time = 35 Weeks
Grade 3 Ambitious Rate = 1.5 WRC/Week
35 weeks X 1.5 WRC = 52.5 WRC
37 WRC + 52.5 WRC = 89.5 WRC
Achieving this criterion of success would place Kate above the 25th%tile in spring on Gr. 3 probes.
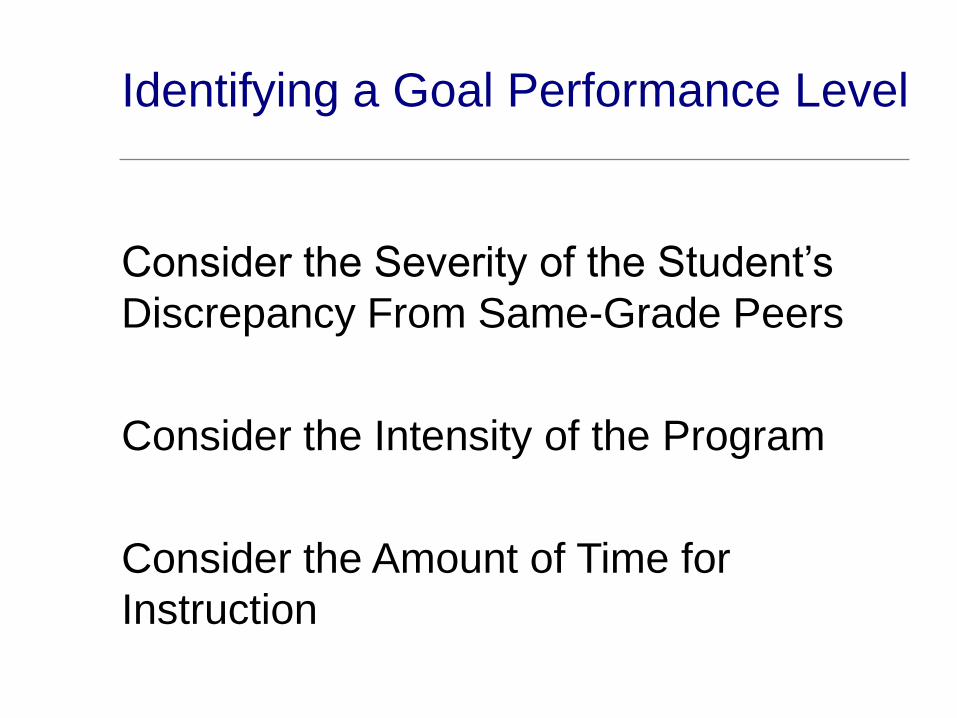
Identifying a Goal Performance Level
Consider the Severity of the Student’s
Discrepancy From Same-Grade Peers
Consider the Intensity of the Program
Consider the Amount of Time for
Instruction

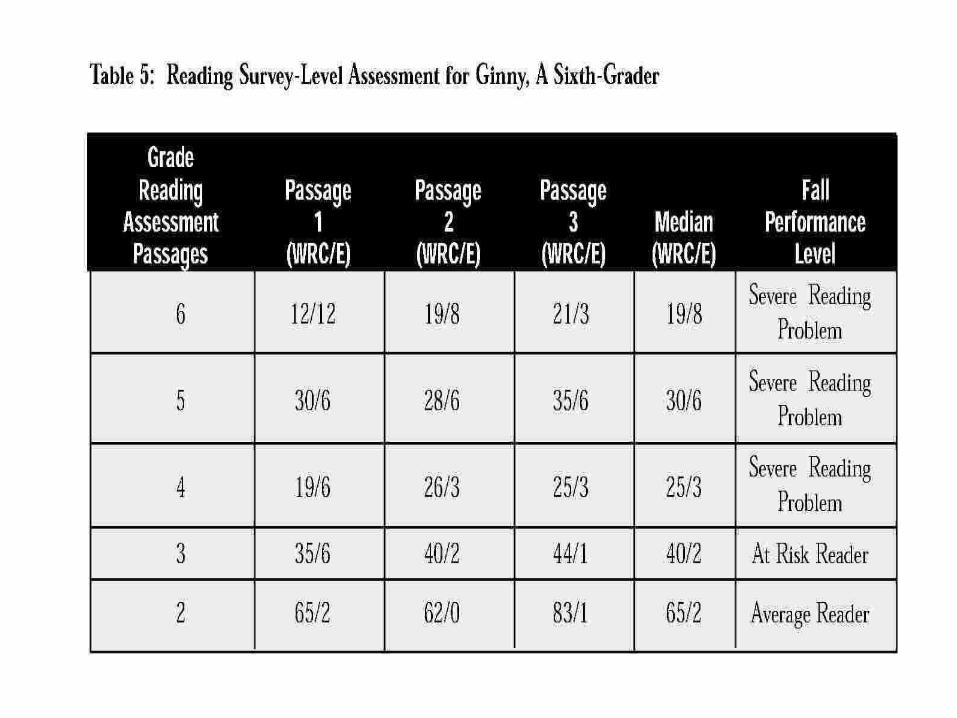
Activity 2
Compute the goal for Ginny in 35 weeks,
given the baseline data below.
1. Use the 3rd and 4th grade information to
determine what her end goal would be.
2. Compare that goal to the AIMsweb
norms to determine grade level for
progress monitoring.


Ginny: Setting an Appropriate
Success CriterionROI Guidelines
2nd 65 WRC 2 WRC x 35 weeks = 70 WRC
70 WRC + 65 WRC = 135 WRC (>75th percentile-spring)
3rd 40 WRC 1.5 WRC x 35 weeks = 52.9 WRC
52.9 WRC + 40 WRC = 92.9 WRC (>25th percentile-spring)
4th 25 WRC 1.1 WRC x 35 weeks = 38.5 WRC 38.5 WRC+ 25 WRC = 63.5 WRC (<10th
percentile-spring)

Step 3: Plan Development
• Question: What is the goal?A. Write the goal, a measurable statement of expected
outcomes.
• Question: What is the intervention plan to address the goal?B. Define logistics (e.g., what strategies/procedures will be
used, when and how often the intervention will occur, who will implement the intervention and where it will be implemented, and when it will begin).
Interventions: Big Picture Ideas
• The hypothesis leads you to the
intervention
• Consider needs vs. resources
• Select research-based interventions
• Implement comprehensive interventions

The hypothesis leads you to the
intervention.
Discrepancy Hypothesis Intervention
J turns in his homework on time
20% of the time, while peers
turn in homework 80% of the
time
BECAUSE he does not have the
reading skills to do the
homework independently at
home.
J will receive additional
supplemental reading skill
instruction from his classroom
teacher during individual silent
reading.
K averages 50% on math
classroom tests, while peers
average 90%
BECAUSE she lacks fluency in
basic facts.
K wil be given additional
practice in math fact fluency
twoce weekly with the media
center specialist.
A is getting in 2 fights per week
on the playground, while peers
get into 0 fights per week.
BECAUSE he is gaining
attention from peers.
A will be given small-group
social skill instruction and will be
coached on the playground to
encourage appropriate
interactions by the social
worker.
G is 2.5 times discrepant from
his 4th grade peers on a reading
CBM Maze passage
BECAUSE he lacks reading
comprehension strategies
G will receive additional reading
comprehension strategy
instruction twice weekly from the
reading specialist.
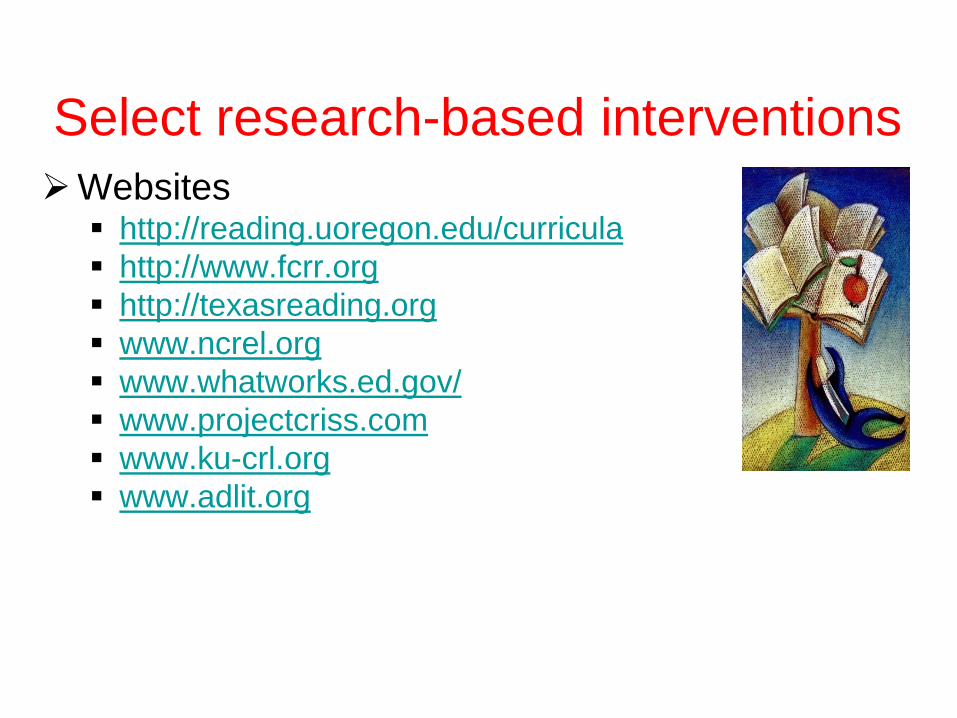
Websites http://reading.uoregon.edu/curricula
http://www.fcrr.org
http://texasreading.org
www.ncrel.org
www.whatworks.ed.gov/
www.projectcriss.com
www.ku-crl.org
www.adlit.org
Select research-based interventions

Best Practices in Reading
AND…National Math Panel
(www.ed.gov/mathpanel)

• Set the stage for desired behaviors by making adjustments to instruction, environment, and curriculum. (change what you can change)– E.g., change instructional level of materials, provide
student opportunities to gain attention appropriately, change group size, professional development/training, increase time of instruction.
• Teach the desired replacement behavior or skill. This is the most important! – E.g., phonics instruction, social skills training
• Motivate the student to perform the desired behavior or skill.– E.g., positive verbal feedback, homework pass
Implement comprehensive interventions

What?Include Strategies for Setting the Stage, Teaching, and
Motivating
When?
Where?
Who?
Start
Date?
Define Intervention Plan Logistics

Anna’s Intervention Plan
What? •Set the Stage: Select reading and math materials at
Anna’s instructional level Teach: Use the Desk
Organization Game to teach organizational skills to
the whole class including Anna. Motivate: Set goals
with the class and develop reinforcement plan for
achieving goal.
When? •Teach game for three days; * Last 10 minutes of the
day check desks. Intervention will occur daily.
Where? •Classroom
Who? •Classroom teacher.
Start Date? •10/03/09

Kori’s Intervention PlanWhat? •Set the Stage: Kori will use the Read Naturally
program at the primer level. Teach: Kori will
practice key sight words and certain phonetic
words each day; she will reread each passage 3
times. Motivate: Kori will graph progress and
receive a certificate when goal achieved.
When? •Daily for 30 minutes
Where? • Title 1 room; Classroom
Who? • Title 1 teacher and teaching assistant in classroom
Start
Date?
•In 1 week

Intervention Integrity Checklist
1. Intervention is focused on area of
concern.
2. Interventions have high probability of
success
* empirically supported
* easy
* positive
* at instructional level

Intervention Integrity Checklist
(cont.)
3. Treatment integrity checks are employed
* participant reports (interviews)
* outside sources (observations)
* permanent products (work samples, behavior records)
* intervention script (how-to directions)
* modeling (by instructional coach)
4. Coaching support identified

Example: Integrity Checklist
Did I provide written cues at the
beginning of each activity?
all the time sometimes never
Did I give a star if Molly followed
directions?
all the time sometimes never
Did I review the chart with Molly at the
end of the day?
all the time sometimes never
Molly is now able to follow directions…. most of the time sometimes never
This plan is effective……. most of the time sometimes never

Step 3: Plan Development• Question: What is the goal?
A. Write the goal, a measurable statement of expected outcomes.
• Question: What is the intervention plan to address the goal?B. Define logistics (e.g., what strategies/procedures will be
used, when and how often the intervention will occur, who will implement the intervention and where it will be implemented, and when it will begin).
• Question: How will progress be monitored?C. Define logistics (e.g., what materials are used, when and
how often data will be collected, where data will be collected, and who is responsible).
D. Decide on decision-making rules for plan evaluation.

How?
What?
Where?
When?
Who?
Define Progress Monitoring Logistics
Define method of data collection.
Identify materials needed to collect
the data.
Identify location of data collection.
Determine frequency of data
collection (e.g., at least weekly) and
time of day.
Select a person who knows how to
use the progress monitoring tool.

How? Calculate accuracy or use rubric and
graph cumulative # of assignments
that meet criteria.
What? Assess quality of constructed
response independent and
homework assignments.
Where? Classroom
When? Daily
Who? Classroom teacher; School
Psychologist or School Social
Worker will graph progress.
Anna’s Progress Monitoring Plan

How? Oral reading fluency
What? Gr. 2 AIMSweb Probes
Where? Classroom
When? Weekly during independent reading
time
Who? Reading Specialist
Kori’s Progress Monitoring Plan

What is progress monitoring?• Scientifically-based, ongoing process
• Repeated direct measurement of student
behavior
– Increases reliability of observation
– Reveals trends in student performance
– Supports fast responses to influence
outcomes
• Time-series analysis, e.g., graphing
– Presents student performance over time
– Visual
– Easily interpreted/understood

What is progress monitoring?
Designed to answer 3 questions…
– Is the intervention successful?
– Is the student making sufficient progress?
– Does the intervention need to be modified?
**** Has been linked to important gains in
student achievement (L. Fuchs, 1986) with
effect sizes of .7 and greater.

Challenges in progress
monitoringTraditional reliance on published,
nationally-normed assessment
instruments
– Problematic technical adequacy (validity)
– Lack of repeatability
– Inability to provide information that measures
success of instructional interventions
– Lack of sensitivity to student gains
– Concerns about inadequate curriculum-test
overlap

… SO, WHAT’S THE “MORAL” OF THIS STORY ?!? …
Do Not use published norm-
referenced tests for progress
monitoring !!!

Evaluate potential tools using
some decision-making criteria:
– Is it skill specific?
– Is it sensitive to small amounts of student growth?
– Is it standardized (i.e., given the same way each time)?
– Can it be given repeatedly?
– Is it easy to administer?
– Is it time efficient?
– Can you compare the scores to the performance of other students?
– Does it provide you with data useful for instructional planning?

We Should Use Scientifically Based
Progress Monitoring Tools
www.studentprogress.org

Area Measure Comment
Reading Maze CBM; 3 minute silent reading
multiple-choice cloze test using from
Standard Passages
No. of Items
Correct
Best for Intermediate Grades
and Older; Corroborative Tool
Written
Expression
Written Expression CBM- WE CBM; 3
minutes writing, given a standard
story starter
Total Words
Written;
Correct Writing
Sequences
Useful for Screening and
Progress Monitoring of Basic
Writing Skills
Spelling Spelling CBM S-CBM; 2 minutes
writing orally dictated words from
standard grade-level spelling lists
Correct Letter
Sequences
Very Sensitive to Between
Person Differences and
Among Persons
Math Math Computation CBM (M-CBM)
Students write answers to standard
computational problems for 2-4
minutes
Correct Digits Useful for Screening and
Progress Monitoring of Basic
Math Computation Skills
Math Math Application CBM (CBM-Apps)
Students write answers to standard
application problems for 4 minutes
Correct
Problems
Useful for Screening and
Progress Monitoring of Math
Application
CBM And RTI Requires MORE than Just Oral Reading and Early
Literacy Assessment

Remember These Things about “WHY”
CBM
• It’s Doable with Efficient and Short Accurate Tests
• It’s Standardized
• We Can Have Confidence in What is Measured
• It’s Curriculum-Independent
• Give Us Qualitative in Addition to Quantitative
Information
• It’s Reasonably Authentic
• It’s Sensitive to Differences Among Individuals and
Student Improvement in Short Periods of Time

•Displaying Data
•Interpreting and Using the Data
PROGRESS MONITORING

Representing the results
visually• Components of a
progress monitoring graph
– Baseline data• Level of performance
just prior to intervention and monitoring, established by survey level assessment
• Best practice is to plot the three scores that were used to establish the monitoring level B Week of
S
c
o
r
e
s

Representing the results
visually• Components of a
progress monitoring
graph
– Aimline
• A line connecting
the median
baseline score with
the target
performance
criterion
B Week of
S
c
o
r
e
s
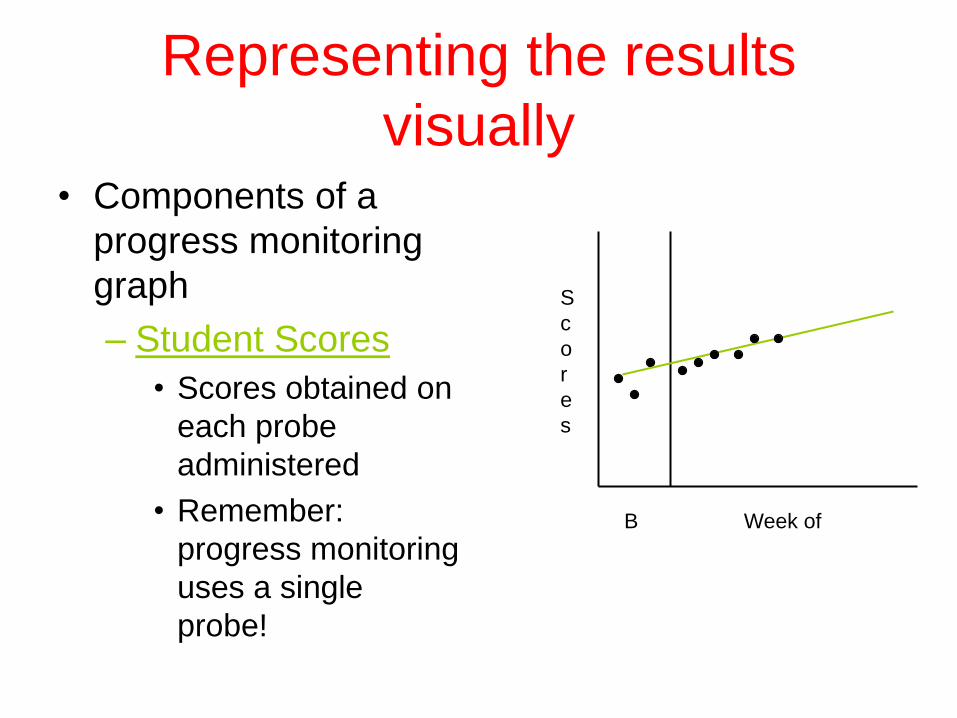
Representing the results
visually• Components of a
progress monitoring
graph
– Student Scores
• Scores obtained on
each probe
administered
• Remember:
progress monitoring
uses a single
probe!
B Week of
S
c
o
r
e
s

Representing the results
visually• Components of a
progress monitoring
graph
– Trendline:
A line reflecting
actual student
growth
How?
*AimsWeb
*Intervention Central
*Excel
B Week of
S
c
o
r
e
s

Representing the results
visually• Components of a
progress monitoring
graph
– Instructional
Change
• Indicates point at
which a change
was made in either
the type of
instruction or the
frequency
B Week of
S
c
o
r
e
s

Representing the results
visually
Aimline
Trendline
B
Baseline
Data
Monitoring weeks
Amount of
Behavior
Observed
Instructional
change

Long Term Goal: In 30 weeks, when given a randomly selected passage from Level 2-
2 of the ABC Reading Series, Collin will read at a rate if 90 words correct per minute
with 3 or fewer errors.
0
10
20
30
40
50
60
70
80
90
100
110
120
Week
Wo
rd R
ead
Co
rrectl
y
WRC 66 59 72 87 73 67 71 80 54 75 70 79
Errors 6 4 3 3 4 2 1 3 0 3 2 3
1 2 3 4 5 6 7 8 9 10 11 12 13 14 15 16 17 18 19 20 21 22 23 24 25 26 27 28 29 30
Baseline
Aim line

Activity 3
Put in the baseline data as Weeks 1, 2 and 3. Find the median score. Mark it with an X. Find goal number and mark with X.
Draw an intervention line.
Draw an aimline from median score to the goal.
Enter the scores for Weeks 4-12:
What observation can you make about the student’s progress?


Decision-making rules
Aimline-trendline comparison
• If slope of trendline is equal to slope of
aimline, continue with intervention
TL
AL

Decision-making rulesAimline-trendline comparison
• If slope of trendline is less than the slope of aimline,
consider an instructional change
• More direct or intensive instruction
• Re-teach prerequisite skills
• Increase opportunities to practice and respond
TL
AL

Decision-making rules
Aimline-trendline comparison
• If slope of trendline is greater than the
slope of aimline, consider raising the goalTL
AL

Decision-making rulesLast 3 data points
• If the last three data points are just above,
or both above and below the aimline, no
changes are indicated
AL

Decision-making rulesLast 3 data points
• If the last three data points are below the
aimline, consider instructional changes
AL

Decision-making rules
Last 3 data points
• If the last three data points are above the
aimline, consider increasing the goal
AL

Monitoring a Specific Student’s RTI

Monitoring
A Specific Student’s RTI

Goal Attainment Decisions
Goal met or exceeded
Goal not met but performance improved
Goal not met and performance did not
improve

Outcome/Action Decisions
Continue problem solving on current area
of concern
Discontinue problem solving
Target another area of concern
Continue intervention without meeting
Refer for special education eligibility
consideration

Activity # 4
Write down two things that you
or school/district will do as a
result of attending this
workshop.
1.
2.

Thank You!!!