proc surveyfreq: why do a three way table in sas when … · page 1 of 14 proc surveyfreq: why do a...
TRANSCRIPT
Page 1 of 14
Proc Surveyfreq: Why Do a Three Way Table in SAS When We Want Two
Way Table Information?
Hemalkumar B. Mehta, Michael L. Johnson
Department of Clinical Sciences and Administration, College of Pharmacy,
University of Houston, Houston, TX 77030
ABSTRACT:
A Proc Surveyfreq procedure in SAS® has an advantage over Proc Freq in that it incorporates
multi-stage probability sampling design into the analyses. Several nationally representative data
have multi-stage probability sampling design. Most of the time we need two way table
information for the group of our interest, e.g.: patients with a certain disease. There are two
ways to get group specific results in Proc Surveyfreq: (i) use “by statement” (ii) do “three way
tabulation.” “By statement” will provide group specific results but it will not give valid domain
analysis and it will not preserve the sampling design. Hence, the results will not be
generalizable to the population level. “Three way tables” will provide group specific results with
valid domain analysis while preserving the sampling design. In the current paper, using Medical
Expenditure Panel Survey (MEPS) data, we show that three way tables should be requested
when we need two way table information primarily for valid domain analysis and extrapolating
results at population level. This paper can serve as a guide to researchers who deal with single
stage or multi-stage probability survey data which uses clustering, stratification and weighting.
Key words: Proc surveyfreq, Three way tables, By statement
Page 2 of 14
INTRODUCTION:
Use of complex multi-stage probability survey design is highly prevalent in US for data collection.
As a result, several nationally representative datasets do not employ a simple random sample design but
instead incorporate multi-stage probability survey design elements, such as stratification, clustering and
weighting. Conventional SAS procedures such as Proc Freq are not appropriate to analyze data with
complex multi-stage sampling design.1 SAS survey procedure gives power and flexibility to analyze data
from complex samples because it incorporates complex sampling design into analysis.2
Five Survey procedures are available for data analysis - Proc Surveymeans, Proc Surveyfreq, Proc
Surveylogistic, Proc Surveyreg, Proc Surveyphreg. Out of these 5 procedures, Proc Surveyfreq is the only
one which does not have domain statement in its syntax. However domain specific analysis can be
obtained using Proc Surveyfreq by incorporating domain category in the table statement. The following
how – to – do example shows how to get domain specific results using Proc Surveyfreq.
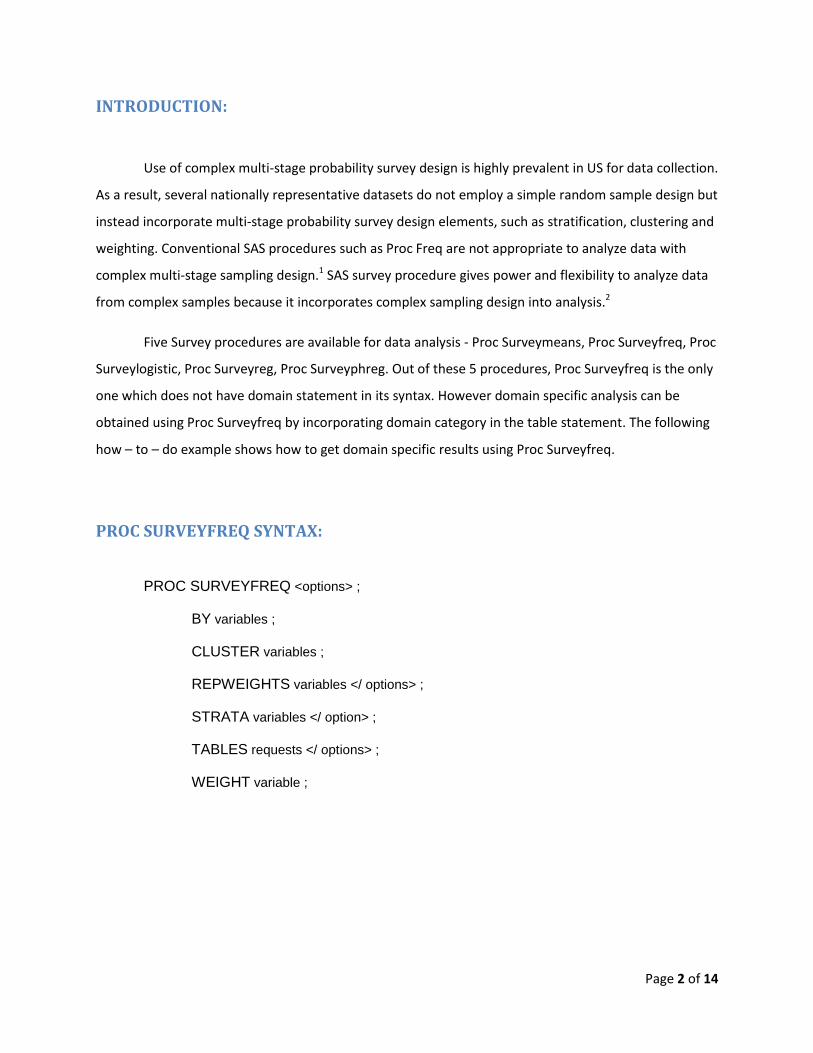
PROC SURVEYFREQ SYNTAX:
PROC SURVEYFREQ <options> ;
BY variables ;
CLUSTER variables ;
REPWEIGHTS variables </ options> ;
STRATA variables </ option> ;
TABLES requests </ options> ;
WEIGHT variable ;
Page 3 of 14
HOW – TO – DO EXAMPLE:
Overview:
The objective is to find percentages of males and females having diabetes among obese
patients.
To get results for the abovementioned objective, we have to cross-tabulate diabetes and sex
among obese patients. The population of interest (cohort) is obese people.
The Medical Expenditure Panel Survey (MEPS) – 2008 full year consolidated data file was used
for the analysis. The file can be downloaded free of charge from the following website -
http://www.meps.ahrq.gov/mepsweb/data_stats/download_data_files.jsp. The MEPS is not a simple
random sample; it utilizes complex multistage probability design employing clustering, stratification and
weighting which enables researchers to extrapolate results at the national level.
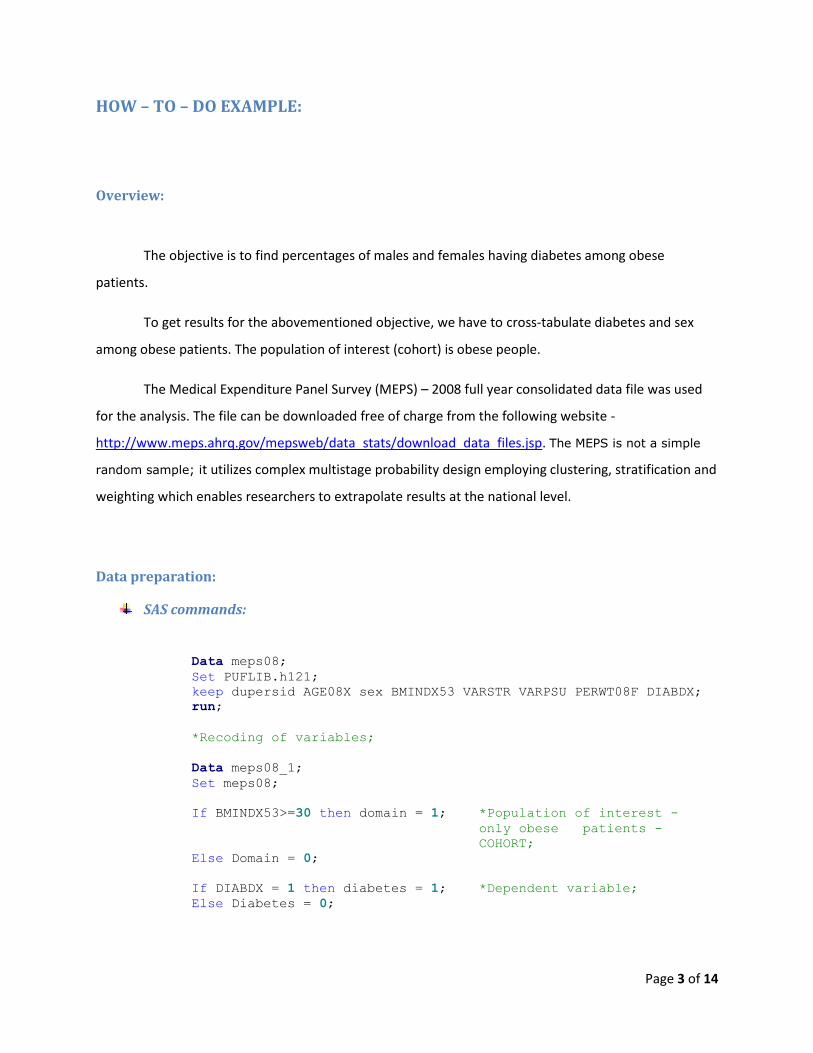
Data preparation:
SAS commands:
Data meps08;
Set PUFLIB.h121;
keep dupersid AGE08X sex BMINDX53 VARSTR VARPSU PERWT08F DIABDX;
run;
*Recoding of variables;
Data meps08_1;
Set meps08;
If BMINDX53>=30 then domain = 1; *Population of interest -
only obese patients -
COHORT;
Else Domain = 0;
If DIABDX = 1 then diabetes = 1; *Dependent variable;
Else Diabetes = 0;

Page 4 of 14
*Independent variable;
If Sex = 1 then Male = 1; *Male= 1: Male;
Else Male = 0; *Male= 0: Female;
run;
Analyses:
Since MEPS is a multi-stage probability sampling design, SAS survey procedure was used. In Proc
Surveyfreq, two types of analyses can be performed to get cross-tabulation of diabetes by sex for the
population of interest, i.e. obese patients.
First, “By statement” was used to cross tabulate Diabetes * Sex. By statement separately
requests results for obese and non-obese patients.
Second, “Three way tabulation” was used where population of interest was added as a variable
in the table statement. This also gives separate results for obese and non-obese patients.
1. By statement:
SAS commands:
/*Getting 2x2 table with BY statement in Proc Surveyfreq*/
Proc sort data = meps08_1; by domain; run;
Title "By statement";
Proc Surveyfreq data = meps08_1;
by domain;
Strata VARSTR;
Cluster VARPSU;
Weight PERWT08F;
Table Diabetes*Male / or;
Run;
SAS LOG:
NOTE: The BY statement provides completely separate analyses of the BY groups. It
does not provide a statistically valid subpopulation or domain analysis, where
the total number of units in the subpopulation is not known with certainty. If
you want a domain analysis, you should include the domain variables in your
TABLES request.
Page 5 of 14
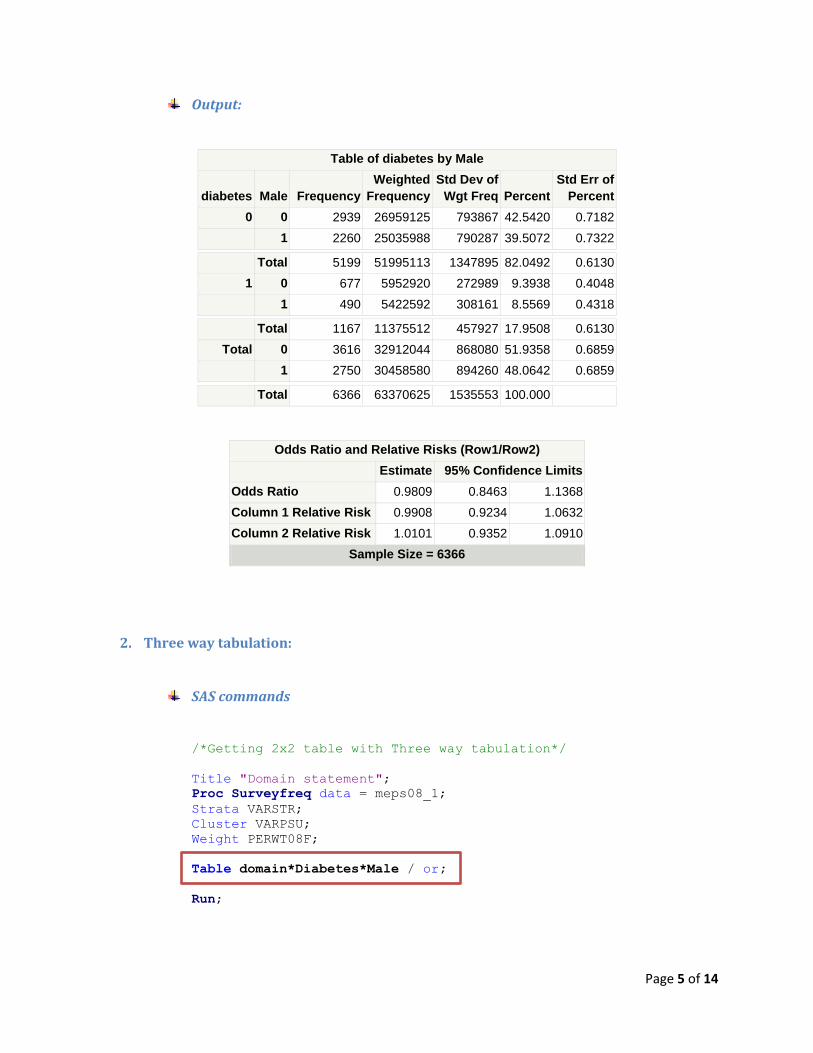
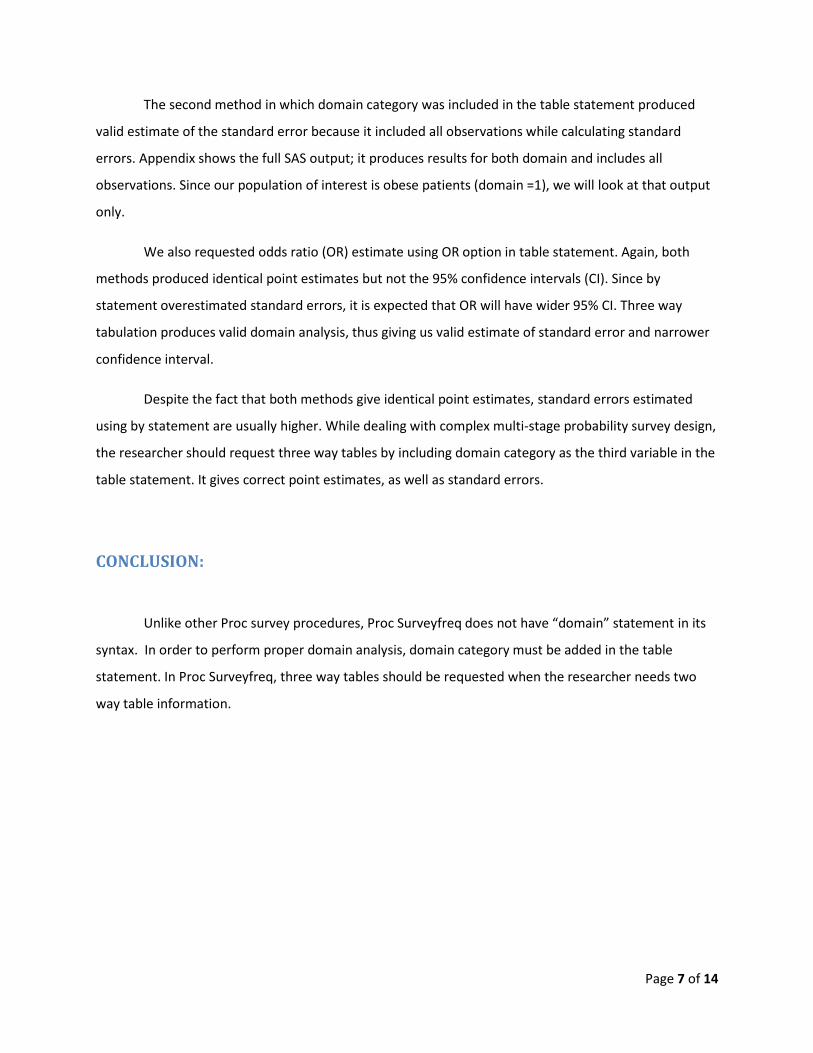
Output:
Table of diabetes by Male
diabetes Male Frequency
Weighted
Frequency
Std Dev of
Wgt Freq Percent
Std Err of
Percent
0 0 2939 26959125 793867 42.5420 0.7182
1 2260 25035988 790287 39.5072 0.7322
Total 5199 51995113 1347895 82.0492 0.6130
1 0 677 5952920 272989 9.3938 0.4048
1 490 5422592 308161 8.5569 0.4318
Total 1167 11375512 457927 17.9508 0.6130
Total 0 3616 32912044 868080 51.9358 0.6859
1 2750 30458580 894260 48.0642 0.6859
Total 6366 63370625 1535553 100.000
Odds Ratio and Relative Risks (Row1/Row2)
Estimate 95% Confidence Limits
Odds Ratio 0.9809 0.8463 1.1368
Column 1 Relative Risk 0.9908 0.9234 1.0632
Column 2 Relative Risk 1.0101 0.9352 1.0910
Sample Size = 6366
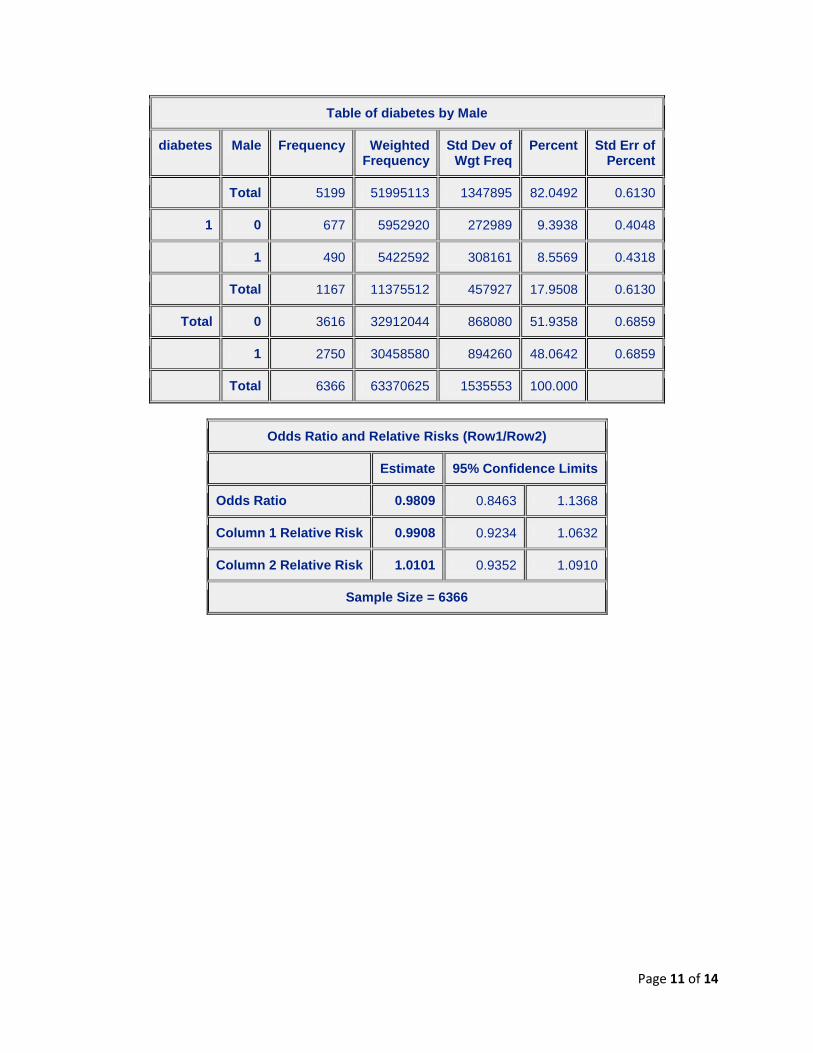
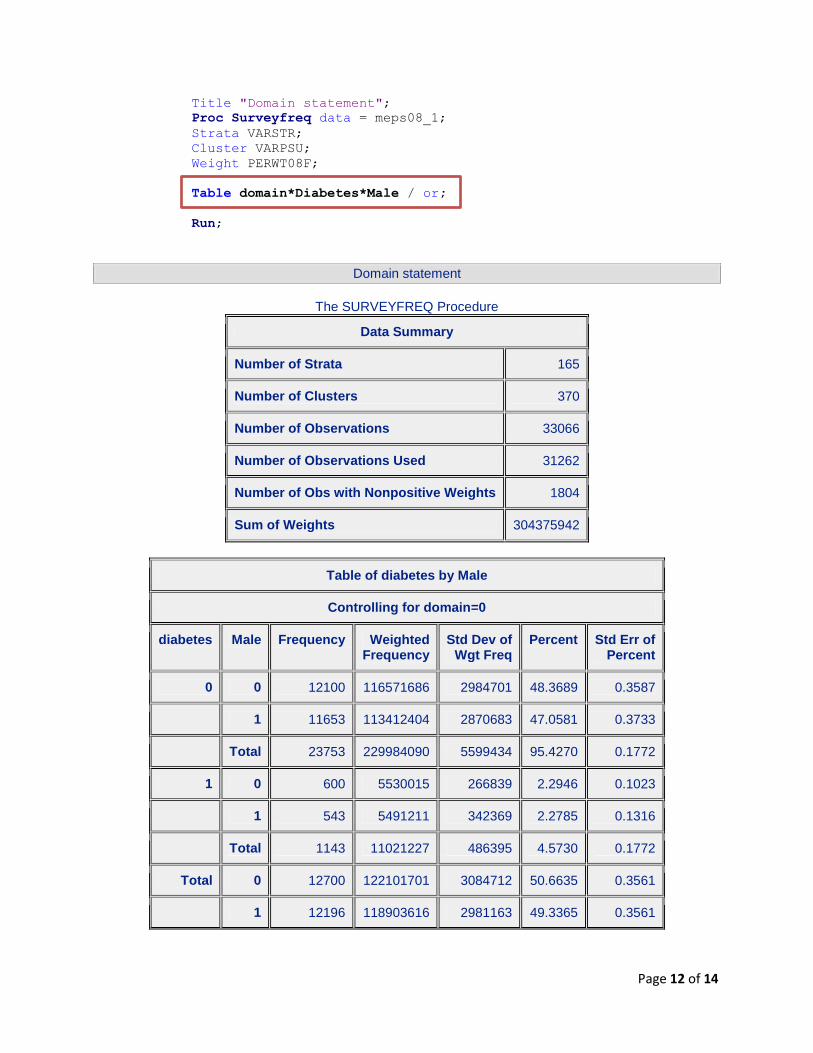
2. Three way tabulation:
SAS commands
/*Getting 2x2 table with Three way tabulation*/
Title "Domain statement";
Proc Surveyfreq data = meps08_1;
Strata VARSTR;
Cluster VARPSU;
Weight PERWT08F;
Table domain*Diabetes*Male / or;
Run;
Page 6 of 14
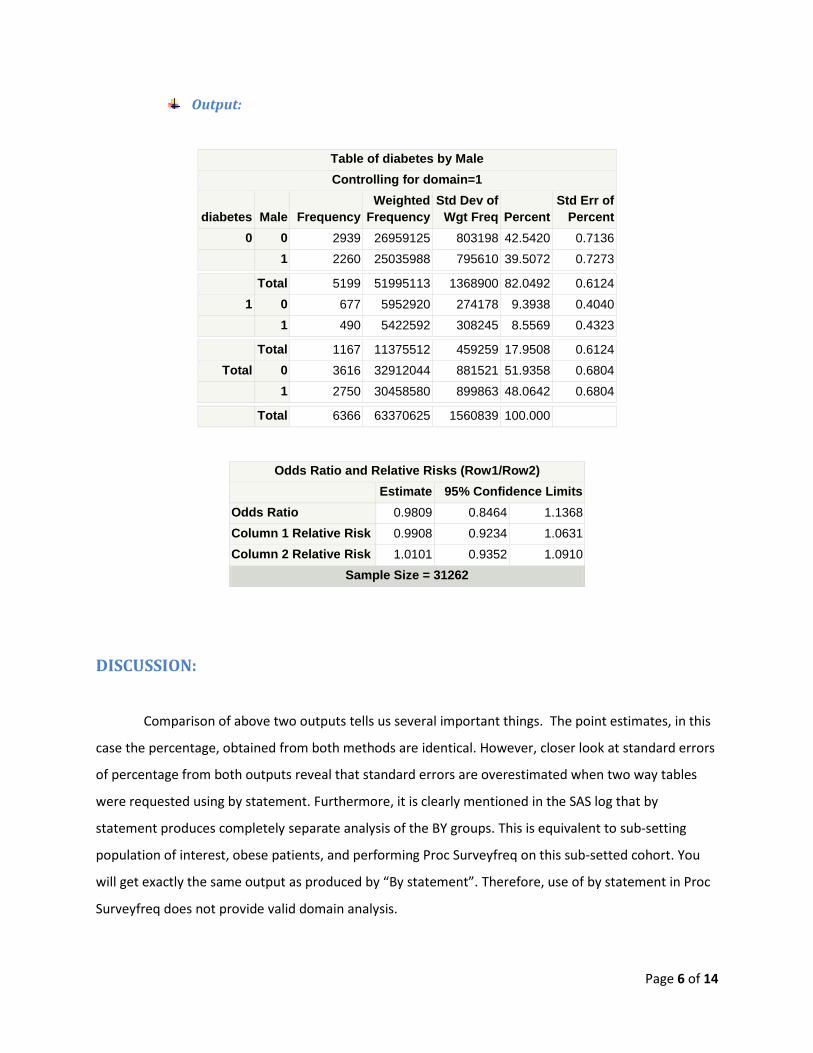
Output:
Table of diabetes by Male
Controlling for domain=1
diabetes Male Frequency
Weighted
Frequency
Std Dev of
Wgt Freq Percent
Std Err of
Percent
0 0 2939 26959125 803198 42.5420 0.7136
1 2260 25035988 795610 39.5072 0.7273
Total 5199 51995113 1368900 82.0492 0.6124
1 0 677 5952920 274178 9.3938 0.4040
1 490 5422592 308245 8.5569 0.4323
Total 1167 11375512 459259 17.9508 0.6124
Total 0 3616 32912044 881521 51.9358 0.6804
1 2750 30458580 899863 48.0642 0.6804
Total 6366 63370625 1560839 100.000
Odds Ratio and Relative Risks (Row1/Row2)
Estimate 95% Confidence Limits
Odds Ratio 0.9809 0.8464 1.1368
Column 1 Relative Risk 0.9908 0.9234 1.0631
Column 2 Relative Risk 1.0101 0.9352 1.0910
Sample Size = 31262
DISCUSSION:
Comparison of above two outputs tells us several important things. The point estimates, in this
case the percentage, obtained from both methods are identical. However, closer look at standard errors
of percentage from both outputs reveal that standard errors are overestimated when two way tables
were requested using by statement. Furthermore, it is clearly mentioned in the SAS log that by
statement produces completely separate analysis of the BY groups. This is equivalent to sub-setting
population of interest, obese patients, and performing Proc Surveyfreq on this sub-setted cohort. You
will get exactly the same output as produced by “By statement”. Therefore, use of by statement in Proc
Surveyfreq does not provide valid domain analysis.
Page 7 of 14
The second method in which domain category was included in the table statement produced
valid estimate of the standard error because it included all observations while calculating standard
errors. Appendix shows the full SAS output; it produces results for both domain and includes all
observations. Since our population of interest is obese patients (domain =1), we will look at that output
only.
We also requested odds ratio (OR) estimate using OR option in table statement. Again, both
methods produced identical point estimates but not the 95% confidence intervals (CI). Since by
statement overestimated standard errors, it is expected that OR will have wider 95% CI. Three way
tabulation produces valid domain analysis, thus giving us valid estimate of standard error and narrower
confidence interval.
Despite the fact that both methods give identical point estimates, standard errors estimated
using by statement are usually higher. While dealing with complex multi-stage probability survey design,
the researcher should request three way tables by including domain category as the third variable in the
table statement. It gives correct point estimates, as well as standard errors.
CONCLUSION:
Unlike other Proc survey procedures, Proc Surveyfreq does not have “domain” statement in its
syntax. In order to perform proper domain analysis, domain category must be added in the table
statement. In Proc Surveyfreq, three way tables should be requested when the researcher needs two
way table information.

Page 8 of 14
REFERENCES: 1. Mehta, H.B., Johnson, M.L. Advice to Advice to Health Services Researchers: Be Cautious Using
the “Where” Statement in SAS® Programs for Nationally Representative Complex Survey Data.
SCSUG 2011.
2. Sample Survey Design and Analysis. Available at:
http://support.sas.com/rnd/app/da/new/dasurvey.html
Contact Information: Your comments and questions are valued and encouraged. Contact the authors at: Hemalkumar B. Mehta, MS
PhD Student (Pharmacy Administration), Department of Clinical Sciences and Administration, College of Pharmacy, University of Houston, Texas Medical Center 1441Moursund Street, Houston, TX 77030 Phone: 718-607-4967 E-mail: [email protected] Web: www.mehtahemal.com
Michael L. Johnson, PhD
Associate Professor, Director of Graduate Studies, Department of Clinical Sciences and Administration, College of Pharmacy, University of Houston, Texas Medical Center 1441Moursund Street, Houston, TX 77030 Phone: 713-795-8353 E-mail: [email protected]
SAS and all other SAS Institute Inc. product or service names are registered trademarks or trademarks of
SAS Institute Inc. in the USA and other countries. ® indicates USA registration.
Other brand and product names are trademarks of their respective companies.

Page 9 of 14
APPENDIX (Complete SAS output):
Title "By statement";
Proc Surveyfreq data = meps08_1;
by domain;
Strata VARSTR;
Cluster VARPSU;
Weight PERWT08F;
Table Diabetes*Male / or;
Run;
By statement
The SURVEYFREQ Procedure
domain=0
Data Summary
Number of Strata 165
Number of Clusters 368
Number of Observations 26392
Number of Observations Used 24896
Number of Obs with Nonpositive Weights 1496
Sum of Weights 241005317
Table of diabetes by Male
diabetes Male Frequency Weighted Frequency
Std Dev of Wgt Freq
Percent Std Err of Percent
0 0 12100 116571686 2957175 48.3689 0.3589
1 11653 113412404 2841063 47.0581 0.3736
Total 23753 229984090 5539237 95.4270 0.1772
1 0 600 5530015 266225 2.2946 0.1023
1 543 5491211 341639 2.2785 0.1316
Total 1143 11021227 484518 4.5730 0.1772
Total 0 12700 122101701 3055483 50.6635 0.3563

Page 10 of 14
Table of diabetes by Male
diabetes Male Frequency Weighted Frequency
Std Dev of Wgt Freq
Percent Std Err of Percent
1 12196 118903616 2949151 49.3365 0.3563
Total 24896 241005317 5753839 100.000
Odds Ratio and Relative Risks (Row1/Row2)
Estimate 95% Confidence Limits
Odds Ratio 1.0206 0.8871 1.1743
Column 1 Relative Risk 1.0102 0.9420 1.0832
Column 2 Relative Risk 0.9897 0.9224 1.0620
Sample Size = 24896
By statement
The SURVEYFREQ Procedure
domain=1
Data Summary
Number of Strata 165
Number of Clusters 363
Number of Observations 6674
Number of Observations Used 6366
Number of Obs with Nonpositive Weights 308
Sum of Weights 63370624.8
Table of diabetes by Male
diabetes Male Frequency Weighted Frequency
Std Dev of Wgt Freq
Percent Std Err of Percent
0 0 2939 26959125 793867 42.5420 0.7182
1 2260 25035988 790287 39.5072 0.7322
Page 11 of 14
Table of diabetes by Male
diabetes Male Frequency Weighted Frequency
Std Dev of Wgt Freq
Percent Std Err of Percent
Total 5199 51995113 1347895 82.0492 0.6130
1 0 677 5952920 272989 9.3938 0.4048
1 490 5422592 308161 8.5569 0.4318
Total 1167 11375512 457927 17.9508 0.6130
Total 0 3616 32912044 868080 51.9358 0.6859
1 2750 30458580 894260 48.0642 0.6859
Total 6366 63370625 1535553 100.000
Odds Ratio and Relative Risks (Row1/Row2)
Estimate 95% Confidence Limits
Odds Ratio 0.9809 0.8463 1.1368
Column 1 Relative Risk 0.9908 0.9234 1.0632
Column 2 Relative Risk 1.0101 0.9352 1.0910
Sample Size = 6366
Page 12 of 14
Title "Domain statement";
Proc Surveyfreq data = meps08_1;
Strata VARSTR;
Cluster VARPSU;
Weight PERWT08F;
Table domain*Diabetes*Male / or;
Run;
Domain statement
The SURVEYFREQ Procedure
Data Summary
Number of Strata 165
Number of Clusters 370
Number of Observations 33066
Number of Observations Used 31262
Number of Obs with Nonpositive Weights 1804
Sum of Weights 304375942
Table of diabetes by Male
Controlling for domain=0
diabetes Male Frequency Weighted Frequency
Std Dev of Wgt Freq
Percent Std Err of Percent
0 0 12100 116571686 2984701 48.3689 0.3587
1 11653 113412404 2870683 47.0581 0.3733
Total 23753 229984090 5599434 95.4270 0.1772
1 0 600 5530015 266839 2.2946 0.1023
1 543 5491211 342369 2.2785 0.1316
Total 1143 11021227 486395 4.5730 0.1772
Total 0 12700 122101701 3084712 50.6635 0.3561
1 12196 118903616 2981163 49.3365 0.3561

Page 13 of 14
Table of diabetes by Male
Controlling for domain=0
diabetes Male Frequency Weighted Frequency
Std Dev of Wgt Freq
Percent Std Err of Percent
Total 24896 241005317 5817991 100.000
Odds Ratio and Relative Risks (Row1/Row2)
Estimate 95% Confidence Limits
Odds Ratio 1.0206 0.8872 1.1742
Column 1 Relative Risk 1.0102 0.9421 1.0832
Column 2 Relative Risk 0.9897 0.9225 1.0619
Sample Size = 31262
Table of diabetes by Male
Controlling for domain=1
diabetes Male Frequency Weighted Frequency
Std Dev of Wgt Freq
Percent Std Err of Percent
0 0 2939 26959125 803198 42.5420 0.7136
1 2260 25035988 795610 39.5072 0.7273
Total 5199 51995113 1368900 82.0492 0.6124
1 0 677 5952920 274178 9.3938 0.4040
1 490 5422592 308245 8.5569 0.4323
Total 1167 11375512 459259 17.9508 0.6124
Total 0 3616 32912044 881521 51.9358 0.6804
1 2750 30458580 899863 48.0642 0.6804
Total 6366 63370625 1560839 100.000
Odds Ratio and Relative Risks (Row1/Row2)
Estimate 95% Confidence Limits
Page 14 of 14
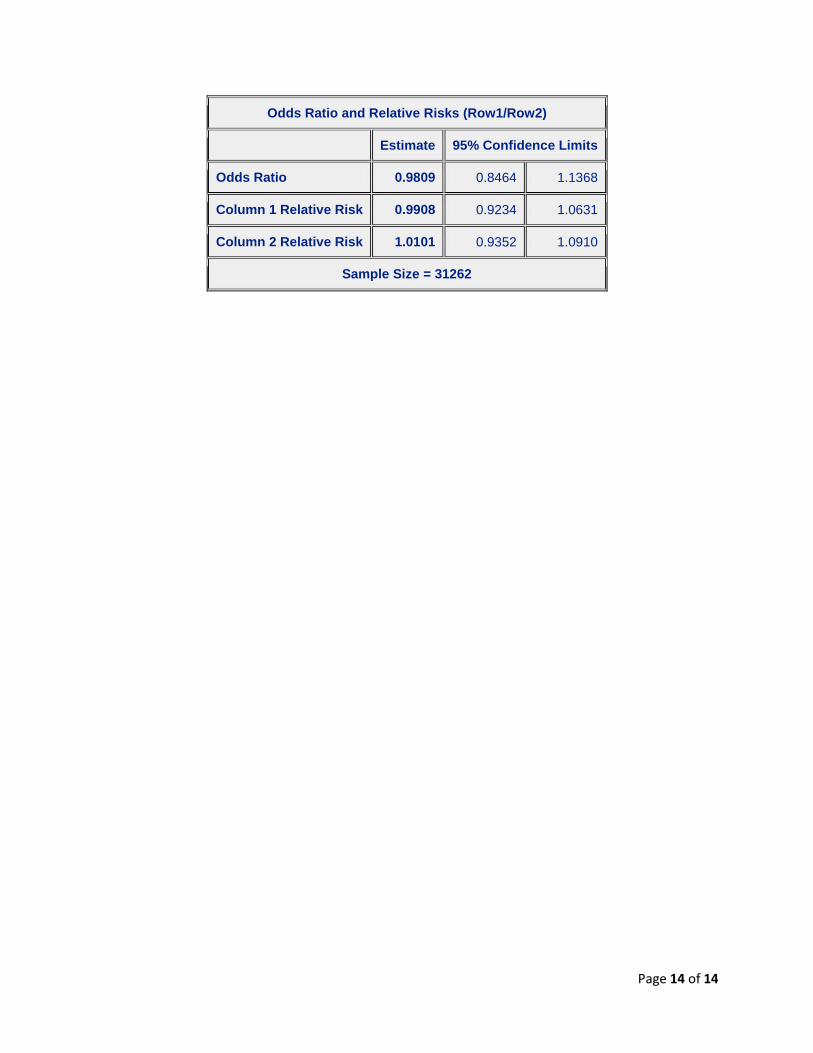
Odds Ratio and Relative Risks (Row1/Row2)
Estimate 95% Confidence Limits
Odds Ratio 0.9809 0.8464 1.1368
Column 1 Relative Risk 0.9908 0.9234 1.0631
Column 2 Relative Risk 1.0101 0.9352 1.0910
Sample Size = 31262