proceedings biodiversity research symposium
TRANSCRIPT

Proceedings of the 1st Research Symposium on
Biodiversity in Trinidad and Tobago
Held in Commemoration of the International Year of Biodiversity 2010
Port of Spain Trinidad
Editors
Andrew Lawrence Department of Life Sciences The University of the West Indies
St. Augustine
Howard P. Nelson Department of Life Sciences The University of the West Indies St. Augustine
Ministry of Housing and the Environment


i
Editors Andrew Lawrence Department of Life Sciences The University of the West Indies St. Augustine Trinidad, West Indies email: [email protected] Howard P. Nelson Department of Life Sciences The University of the West Indies St. Augustine Trinidad, West Indies email: [email protected] Cover Artwork: © 2011 Eleanor S. Devenish © 2011 The University of the West Indies and The Ministry of Housing and the Environment, Government of the Republic of Trinidad and Tobago. All rights reserved.
Published by The Department of Life Sciences The University of the West Indies St. Augustine Trinidad West Indies Email: [email protected] Website: http://sta.uwi.edu/fsa/lifesciences/edulink/
ISBN: 978‐976‐620‐275‐0 Copies of these Proceedings may be purchased from The Department of Life Sciences. An electronic version of these proceedings, searchable by author title and abstract, is posted on The Department of Life Sciences’ biodiversity programme website. Conference presentation proposals are screened by a committee composed of academic staff from the University of the West Indies, the Ministry of Housing and the Environment and invited reviewers. Accepted presenters are given guidelines for submitting their papers/posters for the proceedings. Papers may be rejected by the editor(s) if they are not submitted in a usable format or by the deadline. Research papers may also be rejected if the author declines an editor’s request to meet quality standards. Editorial decisions are made by the editor(s).

ii
Table of Contents Foreword....................................................................................................vi Preface......................................................................................................viii Research Papers..........................................................................................1 How many species are in Trinidad and Tobago? Christopher K. Starr.....................................................................................2 Population Density of the Cook's tree Boa (Corallus ruschenbergerii) in the Caroni Swamp, Trinidad. Kele Taylor, Howard P. Nelson, and Andrew Lawrence..............................8 Demography and general ecology of an introduced primate – the tufted capuchin (Cebus apella) in Chaguaramas, Trinidad. Darshan Narang, Howard P. Nelson, and Andrew Lawrence....................19 Spatial and Temporal Diversity in Ground Level Fruit Feeding Butterflies. Imran Khan, Christopher K. Starr, Howard P. Nelson, and Andrew Lawrence...............................................................................30 A comparison of beach morphology and physical characteristics of Turtle Beach, Tobago and Grande Riviere, Trinidad and its implications for turtle nesting. Sheetal Jankie and Andrew Lawrence.......................................................42 Spatial Distribution of intertidal benthic macrofauna in three sandy beaches in Trinidad. Lanya Fanovich, Howard P. Nelson and Andrew Lawrence.......................55 Genetic Diversity and Structure of the Neotropical Monodominant Species Mora excelsa (Benth.) in Five Naturally Fragmented Populations. Nigel Austin, Michael Oatham and Pathmanathan Umaharan.................72 The conservation status of Metastelma freemani. Gayatrilakshmi Raghava‐Singh and Michael Oatham................................88

iii
Table of Contents (con’t) Fire in the Aripo Savannas Environmentally Sensitive Area: Causes and Consequences. Aditi Bisramsingh and Michael Oatham....................................................99 Biodiversity and biogeography of lichens in Trinidad and the implications for forest health and bio‐sensitivity. Andrea Scobie.........................................................................................110 Electrical Enhancement of Coral Growth: A Pilot Study L.S. Beddoe, T.J. Goreau, J.B.R. Agard, M. George, and D.A.T. Phillip............................................................................................116 Population density of the agouti Dasyprocta leporina at the Central Range Wildlife Sanctuary, Trinidad. Howard P. Nelson, Indira Omah Maharaj, Nadra Nathai‐Gyan, and Antony Ramnarine............................................................................123 Abstracts.................................................................................................130 Natural History and Conservation of the Trinidad Piping Guan Kerrie Naranjit.........................................................................................131 Biofouling on recreational vessels in Trinidad and Tobago Judith F. Gobin, Alana Jute and Anuradha Singh.....................................132 Patterns of biodiversity in Trinidadian spiders. Joanne Sewlal..........................................................................................133 An initial investigation into the third recorded mass‐bleaching event in Tobago. Jahson Alehmu........................................................................................134 Spatial Distribution and extent of mangroves in Trinidad. Rahanna Juman and Deanesh Ramsewak...............................................135 Developing public awareness and education tools to promote an understanding and appreciation of biodiversity in the coastal and marine environment. Lori Lee Lum............................................................................................136

iv
Table of Contents (con’t) An innovative approach for monitoring abiotic factors influencing mangrove forest biodiversity in an estuarine ecosystem. M. Atwell, M. Wuddivira, J. Gobin, and D. Robinson................137 Monitoring and management of marine invasive alien species in Trinidad and Tobago. Rosemarie Kishore, Francis Weekes and Khama Philip.............138 The extent of the sea turtle fishery in Tobago, West Indies. Michelle Cazabon‐Mannette.....................................................139 Mitigating a threat of invasive alien species in the insular Caribbean‐ A Trinidad and Tobago Perspective. Velda Ferguson‐Dewsbury........................................................140 Life and death in the savannas – a study of the rare terrestrial orchid Cyrtopodium parviflorum. Howard P. Nelson, Sharon Laurent, Carlysle McMillan and Eleanor Devenish‐Nelson..................................................141
v
Foreword In 1992, after the Earth Summit in Rio, the Convention on Biological Diversity was established and opened for signature. It was at that occasion the Government of the Republic of Trinidad and Tobago took the opportunity to become a signatory to the Convention, which was subsequently ratified in 1996. By so doing, Trinidad and Tobago had signalled to the international community that this country was aligned with international efforts aimed at reducing biodiversity loss, and the equitable sharing of the benefits arising from the wise use of biological resources. The United Nations has declared 2010 as the International Year of Biodiversity, with the theme ‘Biodiversity is life, biodiversity is our life.’ This theme is very relevant to Trinidad and Tobago. One of the objectives of the International Year of Biodiversity is the mainstreaming of biodiversity issues in public policy, so as to sensitize and raise public awareness of ecological issues, and to ensure that those issues are taken on board in the implementation of environmental agendas. In my Government’s Policy Framework for Sustainable Development, our focus is, ‘Managing our Environment,’ because our understanding is that, ‘there can be no sustainable development without respect for the environment.’ The policy framework for the environment therefore seeks to ‘strengthen and promote efforts at nature conservation, in particular the conservation of bio‐diversity regimes.’ Being a tropical Caribbean island in close proximity to the Equatorial region, our country has been greatly endowed with a rich and unique biodiversity, which has in large measure contributed to our economic and social development. This development has been facilitated by the available knowledge of our natural resources, together with evidence‐based decision making with respect to the use of those resources. It is in this context that the collaboration between the Life Sciences Department of the University of the West Indies and the Ministry of Housing and the Environment for the conduct of the Research and Poster and Paper Symposium in commemoration of the International Year of Biodiversity has generated value to Trinidad and Tobago, and by extension, the international community. Biodiversity research conducted by the University of the West Indies has always been a valuable service, in terms of quantification of species for

vi
management, and the identification of causes and development of solutions for problems occurring in our ecosystems. However, as a nation with an emerging economy, there is need to emphasize that more and continuous research is necessary for us to keep abreast of the country’s developmental needs. Tertiary level research, as seen in the collaborative work between the Life Sciences Department of the University of the West Indies and the Ministry of Housing and the Environment, is therefore an ideal opportunity which allows post graduate students of the University to creatively communicate their research work in a format that would be accessible to all sectors of the public, while at the same time, providing valuable exposure to the salient biodiversity issues which matter to all of us. Tertiary level research also identifies gaps and shortcomings that policy makers and planners need to address within the policy and planning framework. For these reasons therefore, and in my capacity as the Minister of Housing and the Environment, I am committed to promoting and supporting biological research among post graduate students at the University of the West Indies, The hosting of the Research Poster and Paper Symposium was intended to contribute to this effort and reinforces the linkage between my Ministry and the Life Sciences Department of the University of the West Indies. Together, we should look forward to the Symposium becoming a fixture on the calendars of both institutions, and expect an increase in the number of extracts to be presented in the successive years. As the event grows, we can come to expect a greater momentum and higher levels of interest and participation from the various publics, such that biodiversity protection and conservation become an integral part of our existence and ethos. Dr. The Honourable Roodal Moonilal Minister of Housing and the Environment May, 2011

vii
Preface The 2010 International Year of Biodiversity (IYB 2010) has provided the world with a unique opportunity to take a critical look at the state of biodiversity resources at a global level. The emerging picture is not encouraging, as the recent reflections at the Convention on Biodiversity’s Conference of the Parties suggest, we have not done sufficient globally to stem the tide of biodiversity loss. This inability to slow down or reverse the rate of biodiversity degradation has tremendous implications for the quality of human life in the future. Nowhere is this link between biodiversity’s goods and services and the quality of human life more relevant than on Neotropical islands like Trinidad and Tobago, where issues as diverse as rural livelihoods, potable water supply, food security and resiliency to climate change and natural disasters are inextricably linked with the state of the country’s living resources. One key element of any attempt to stem the loss of biodiversity in Trinidad and Tobago must be the development of stronger mechanisms for information exchange between those individuals and institutions involved in biodiversity research, and those agencies involved in policy‐making and management of these resources. This need for better communication between these groups was identified as a critical issue in the country’s National Biodiversity Strategy and Action Plan, and remains an important challenge to improving biodiversity management in the country. Only through directed research on biodiversity can the gaps in our knowledge on the living elements of Trinidad and Tobago be filled and so allow for development of scientifically justifiable, cost‐effective and culturally relevant interventions to manage the country’s living resources. The IYOB 2010 Research and Poster Symposium has provided a unique opportunity to develop a bridge between the research community and the policy and management community in Trinidad and Tobago. The papers and posters presented at the Symposium reflect work on a diverse range of taxonomic groups, ecosystems and management questions currently being investigated by the research institutions operating in Trinidad and Tobago. These proceedings contains 11 abstracts and 12 papers based on the posters and papers presented at the International Year of Biodiversity Symposium held on 25th November 2010, at the Crowne Plaza Hotel, Port of Spain, Trinidad. Accepted abstract and poster presenters/authors who participated in the Symposium were invited to

viii
submit full papers for inclusion in these proceedings. Those full papers presented here represent those presenters/authors who agreed to submit full papers and have met the editorial standard set by the editors. We would like to close by recognizing our colleague Dr. David I. Persaud, whose vision and support for a stronger link between the work of the national and regional research institutions and their policy and management agency counterparts in Trinidad and Tobago provided us with the means to make the Symposium a reality. Professor Andrew Lawrence and Dr. Howard P. Nelson St. Augustine, March, 2011

1
Research Papers

2
How many species are in Trinidad and Tobago?
Christopher K. Starr
Department of Life Sciences, The University of the West Indies, St. Augustine, Trinidad, West Indies. Email: [email protected]
Abstract Knowledge of the number of species of organisms native to Trinidad and Tobago varies widely among taxa. At one extreme, represented by the micro‐organisms, so little is known that no meaningful estimates are yet feasible. At the opposite extreme, represented by land and fresh‐water vertebrates, species‐level inventories are virtually complete. Insects make up about half of the described species of all organisms on Earth, and they certainly make up the bulk of animal species. About one million species have been described, and estimates of the true total converge around 2.5 to 6 million. Applying to this range the Trinidad and Tobago fractions of the world fauna in nine well‐studied groups, the true total for these islands is estimated to be between 67.5 and 312 thousand species. Key words Invertebrate, species richness, Tobago, Trinidad, vertebrate, diversity Introduction It can reasonably be assumed that most readers of this paper are in full sympathy with the view that humanity is not the owner but rather the caretaker of the Earth's biotic resources. In addition, it can be argued that humanity can do a better job of caring for them if it is known what they are. The worldwide enterprise of inventorying the world's species, then, is a key foundation of any conservation effort. In this regard, national boundaries are a convenient ‐ if highly artificial ‐ way of dividing the planet into more manageable units, so that inventories are usually on a country‐by‐country basis. The purpose here is to review the state of knowledge of the species‐level biotic diversity of one such country, Trinidad and Tobago. In the standard classification, the phyla of living organisms are arranged into five kingdoms (e.g. Margulis 1998). Three of these ‐Monera, bacteria and other prokaryotes; Protista, protozoans and most algae; and Fungi ‐ are treated collectively as "micro‐organisms", although this does not imply that together they form a natural, monophyletic

3
group. The other two kingdoms are the plants (Plantae) and animals (Animalia). Micro‐organisms The number of species of micro‐organisms in Trinidad and Tobago remains unknown. About 157,000 species have been described worldwide (Hawksworth and Kalin‐Arroyo 1995), but this is plainly a gross under‐estimate of the true total. It is quite certain that the described species in each of the three kingdoms represent only a small fraction of those in existence. For Trinidad and Tobago, in particular, even less is known. Over the course of the next generation, it can be hoped that a breakthrough in the assessment of microbial biodiversity will be achieved. Plants The situation of the Plant Kingdom is very nearly the opposite of that of micro‐organisms. The vascular plants, and in particular the seed plants, make up the great bulk of described and of all existing species. These are relatively well catalogued worldwide, as well as in Trinidad and Tobago (Baksh‐Comeau et al., in press). The described species of vascular plants here number about 2465: 270 ferns, 25 fern‐allies, 1431 dicotyledonous flowering plants, and 739 monocotyledonous flowering plants. These figures are believed to be close to the true totals. Animals For convenience, attention will be restricted to land and fresh‐water species. The waters around Trinidad and Tobago harbour a richness of animals, but there is no biologically meaningful way of drawing boundaries.
Vertebrates The vertebrates appear even more completely known at the species level than the vascular plants (Table 1). Further close examination will undoubtedly modify these numbers slightly, but they are unlikely to significantly disturb the present total of about 600 species. Insects Insects appear to be by far the most speciose group of organisms on Earth, with slightly over one million described species worldwide. Nonetheless, this is evidently just a fraction of the true total. Furthermore, confidence in the reliability of present numbers varies

4
widely among orders (Nielsen and Mound 1997: Table 2). The various attempts to estimate the number of existing species (Table 2) apply very different methods, but all rely on a comparable mixture of known facts, ratios and explicit assumptions. Table 1 Numbers of land and fresh‐water vertebrate species in Trinidad and Tobago. Vertebrate Group Species References _____________________________________________________________ Fish 42 Phillip and Ramnarine (2001) Amphibians 32 Murphy (1997) Reptiles 106 Boos (2001), Murphy (1997) Birds 321 ffrench (1991) Mammals 98 Boos (unpubl.) Total 599
To illustrate this general approach, the relatively simple method of Hodkinson and Casson (1991) can be summarized. These authors are specialists in Hemiptera, an insect order with about 71,000 described species worldwide. In a set of large samples collected by insecticidal fogging in Indonesia, they found 1690 species of Hemiptera. Of these, 62.5% were previously undescribed. The 71,000 described species, then, were estimated to be just 37.5% of the true total. Hemiptera make up 7.5% of described insect species. Assuming this ratio also holds for undescribed insect species, we reach an estimate of 71,000 X 1/0.375 X 1/0.075 = 2.5 million species of insects in the world. There is no strong reason to favour any one of the estimates given in Table 2. Nonetheless, it is remarkable that with one exception they fall within the range of 2.5 to 6 million species. Given the variety of methods, it is a reasonable working hypothesis that the true total falls within this manageable range. No attempt has yet been made to estimate the number of insect species occurring in Trinidad and Tobago. Even at this small scale, no direct‐census approach will yield a meaningful answer. However, it is possible to reach a reasonable rough estimate by reference to known numbers of species in the few well‐studied groups in a) the world, and b) Trinidad and Tobago, together with an estimate of the total number of species in the world. As seen in Table 3, Trinidad and Tobago's share of the world fauna in nine well‐studied groups ranges from 2.2% to 7.8%, with all but three figures falling between 2.7% and 5.2%.

5
Table 2 Estimates of the number of insect species in the world. _______________________________________________________ Estimate (millions) Reference _______________________________________________________ 2.5 Hodkinson and Casson 1991 2.7 Gaston 1992 4 May 1994 4.8 Ødegaard 2000 4.8‐6 Novotny et al. 2002 5.7 Hammond 1992 6 Groombridge 1992:24‐25 30 Erwin 1982 _______________________________________________________ If the working hypothesis is adopted ‐ that the overall fraction for insects as a whole is within this range ‐ we arrive at the following estimates of the Trinidad and Tobago fauna: Minimum 2.7% of 2.5 million, or 67,500. Median 4.5% of 4.8 million, or 230,400. Maximum 5.2% of 6 million, or 312,000. This is almost a five‐fold range, certainly far from a precise estimate. However, it is a fair beginning and a significant improvement over the lack of any previous estimate. Furthermore, it serves to emphasize that insects comprise the great majority of multicellular species under our national jurisdiction on land. Table 3 Numbers of known insect species in the world and in Trinidad and Tobago. Taxon Known species Fraction References World T and T in T and T Odonata 5500 119 2.2% 1‐4 Isoptera 2100 56 2.7% 5‐6 Heteroptera: Gerromorpha 2400 78 3.3% 7‐8 and Nepomorpha Heteroptera: Dysdercus 64 5 7.8% 9‐10 Lepidoptera: Papilionoidea 13,688 387 2.8% 11‐12 Lepidoptera: Hesperiidae 3592 272 7.6% 11, 13 Diptera: Culicidae 3209 160 5.0% 14, 15 Hymenoptera: social Vespidae 800 38 4.8% 16‐19 Hymenoptera: Dorylinae and Ecitoninae 248 13 5.2% 20‐21
6
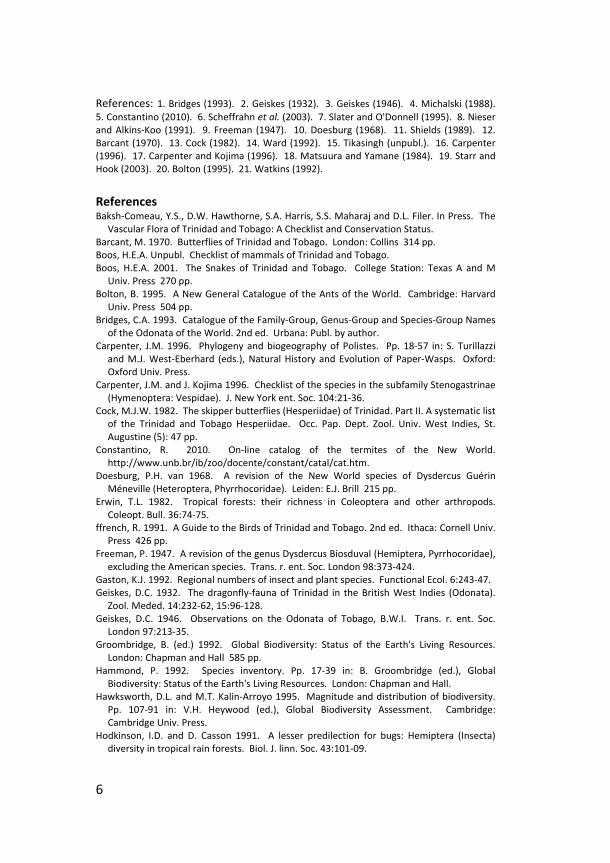
References: 1. Bridges (1993). 2. Geiskes (1932). 3. Geiskes (1946). 4. Michalski (1988). 5. Constantino (2010). 6. Scheffrahn et al. (2003). 7. Slater and O'Donnell (1995). 8. Nieser and Alkins‐Koo (1991). 9. Freeman (1947). 10. Doesburg (1968). 11. Shields (1989). 12. Barcant (1970). 13. Cock (1982). 14. Ward (1992). 15. Tikasingh (unpubl.). 16. Carpenter (1996). 17. Carpenter and Kojima (1996). 18. Matsuura and Yamane (1984). 19. Starr and Hook (2003). 20. Bolton (1995). 21. Watkins (1992). References Baksh‐Comeau, Y.S., D.W. Hawthorne, S.A. Harris, S.S. Maharaj and D.L. Filer. In Press. The
Vascular Flora of Trinidad and Tobago: A Checklist and Conservation Status. Barcant, M. 1970. Butterflies of Trinidad and Tobago. London: Collins 314 pp. Boos, H.E.A. Unpubl. Checklist of mammals of Trinidad and Tobago. Boos, H.E.A. 2001. The Snakes of Trinidad and Tobago. College Station: Texas A and M
Univ. Press 270 pp. Bolton, B. 1995. A New General Catalogue of the Ants of the World. Cambridge: Harvard
Univ. Press 504 pp. Bridges, C.A. 1993. Catalogue of the Family‐Group, Genus‐Group and Species‐Group Names
of the Odonata of the World. 2nd ed. Urbana: Publ. by author. Carpenter, J.M. 1996. Phylogeny and biogeography of Polistes. Pp. 18‐57 in: S. Turillazzi
and M.J. West‐Eberhard (eds.), Natural History and Evolution of Paper‐Wasps. Oxford: Oxford Univ. Press.
Carpenter, J.M. and J. Kojima 1996. Checklist of the species in the subfamily Stenogastrinae (Hymenoptera: Vespidae). J. New York ent. Soc. 104:21‐36.
Cock, M.J.W. 1982. The skipper butterflies (Hesperiidae) of Trinidad. Part II. A systematic list of the Trinidad and Tobago Hesperiidae. Occ. Pap. Dept. Zool. Univ. West Indies, St. Augustine (5): 47 pp.
Constantino, R. 2010. On‐line catalog of the termites of the New World. http://www.unb.br/ib/zoo/docente/constant/catal/cat.htm.
Doesburg, P.H. van 1968. A revision of the New World species of Dysdercus Guérin Méneville (Heteroptera, Phyrrhocoridae). Leiden: E.J. Brill 215 pp.
Erwin, T.L. 1982. Tropical forests: their richness in Coleoptera and other arthropods. Coleopt. Bull. 36:74‐75.
ffrench, R. 1991. A Guide to the Birds of Trinidad and Tobago. 2nd ed. Ithaca: Cornell Univ. Press 426 pp.
Freeman, P. 1947. A revision of the genus Dysdercus Biosduval (Hemiptera, Pyrrhocoridae), excluding the American species. Trans. r. ent. Soc. London 98:373‐424.
Gaston, K.J. 1992. Regional numbers of insect and plant species. Functional Ecol. 6:243‐47. Geiskes, D.C. 1932. The dragonfly‐fauna of Trinidad in the British West Indies (Odonata).
Zool. Meded. 14:232‐62, 15:96‐128. Geiskes, D.C. 1946. Observations on the Odonata of Tobago, B.W.I. Trans. r. ent. Soc.
London 97:213‐35. Groombridge, B. (ed.) 1992. Global Biodiversity: Status of the Earth's Living Resources.
London: Chapman and Hall 585 pp. Hammond, P. 1992. Species inventory. Pp. 17‐39 in: B. Groombridge (ed.), Global
Biodiversity: Status of the Earth's Living Resources. London: Chapman and Hall. Hawksworth, D.L. and M.T. Kalin‐Arroyo 1995. Magnitude and distribution of biodiversity.
Pp. 107‐91 in: V.H. Heywood (ed.), Global Biodiversity Assessment. Cambridge: Cambridge Univ. Press.
Hodkinson, I.D. and D. Casson 1991. A lesser predilection for bugs: Hemiptera (Insecta) diversity in tropical rain forests. Biol. J. linn. Soc. 43:101‐09.

7
Margulis, L. 1998. Five Kingdoms: An Illustrated Guide to the Phyla of Life on Earth. 3rd ed. New York: W.H. Freeman 520 pp.
Matsuura, M. and Sk. Yamane 1984. Biology of the Vespine Wasps. Berlin: Springer 323 pp.
May, R.M. 1994. Past efforts and future prospects towards understanding how many species there are. Pp. 71‐84 in: O.T. Solbrig, H.M. van Emden and P.G.W.J. van Oordt (eds.), Biodiversity and Global Change. Wallingford, Oxon: CAB‐International.
Michalski, J. 1988. A catalogue and guide to the dragonflies of Trinidad (order Odonata). Occ. Pap. Zool. Dep't UWI, St Augustine (6):1‐146.
Murphy, J.C. 1997. Amphibians and Reptiles of Trinidad and Tobago. Malabar, Florida: Krieger 245 pp.
Nielsen, E.S. and L.A. Mound 1997. Global diversity of insects: The problems of estimating numbers. Pp. 213‐22 in: P.H. Raven (ed.), Nature and Human Society: The Quest for a Sustainable World. Washington: National Research Council.
Nieser, N. and Alkins‐Koo, M. 1991. The water bugs of Trinidad and Tobago. Occ. Pap. Zool. Dep't UWI, St Augustine (9):1‐127.
Novotny, V., Y. Basset, S.E. Miller, G.D. Weiblen, B. Bremer, L. Cizek and P. Drozd 2002. Low host specificity of herbivorous insects in a tropical forest. Nature 416:841‐44.
Ødegaard, F. 2000. How many species of arthropods? Erwin's estimate revised. Biol. J. linn. Soc. 71:583‐97.
Phillip, D.A.T. and I.W. Ramnarine 2001. A Guide to the Freshwater Fishes of Trinidad and Tobago. St Augustine: Dep't of Life Sciences, Univ. of the West Indies 79 pp.
Scheffrahn, R.H., J. Krecek, B. Maharajh, J.A. Chase, J.R. Mangold and C.K. Starr 2003. Termite fauna (Isoptera) of Trinidad and Tobago, West Indies. Occ. Pap. Dep't Life Sci. Univ. West Indies (12):33‐38.
Shields, O. 1989. World numbers of butterflies. J. Lepid. Soc. 43:178‐83. Slater, J.A. and J.E. O'Donnell 1995. A Catalogue of the Lygaeidae of the World (1960‐1994).
New York: New York Entomological Soc. 410 pp. (Modified in line with pers. comm. from J.E. O'Donnell.)
Starr, C.K. and A.W. Hook 2003. The aculeate Hymenoptera of Trinidad, West Indies. Occ. Pap. Dep't Life Sci. Univ. West Indies (12):1‐31. Updated version: http://www.ckstarr.net/aculeates.pdf.
E. Tikasingh. Pers. comm. Ward, R.A. 1992. Third supplement to "A catalog of the mosquitoes of the world" (Diptera:
Culicidae). Mosquito Syst. 24:177‐230. Watkins, J.F. 1992. Ecitoninae: Distribution of New World army ants by genus: species:
country: state. Unpubl. list.

8
Population Density of the Cook's tree Boa (Corallus ruschenbergerii) in the Caroni Swamp, Trinidad.
Kele Taylor1, 2 Howard P. Nelson2, and Andrew Lawrence2
2Department of Life Sciences, The University of the West Indies, St. Augustine, Trinidad,
West Indies. Email: [email protected] 1 Corresponding Author
Abstract The monitoring of animal populations is necessary to provide the basis for understanding population changes over time, as well as to conserve, protect and manage a species. Corallus ruschenbergerii, commonly known as the Cook’s Tree Boa, is found in the Caroni Swamp, Trinidad. The aim of this study was to estimate the population density of the Cook’s tree boa in the Caroni Swamp, Trinidad, using line transect distance surveys. The survey was conducted during the wet season period for Trinidad, i.e. the months of September and October 2010 along six transects. A total of 115.97 km of transects were surveyed via boat within the swamp channels and drainage outlets, as well as on foot along the banks of the mangrove. Distance 6.0 was used to estimate density of the Cook’s tree boa, based on transect observations. A total of 32 Cook’s tree boas were observed during this study. The best fitting model for the survey data, based on the Akaike information criterion (AIC) score, was a uniform key function with simple polynomial expansion. Cook’s tree‐boa density estimates were estimated at 11.022 tree boas per km2. Key words Cook’s tree boa, Caroni Swamp, Trinidad, population density estimate, line transect surveys, distance sampling. Introduction Urban expansion, pollution and deforestation have resulted in the dramatic decrease in the abundance of many snakes globally (Mullin and Seigel 2009). In addition, snakes may be considered among the most persecuted organisms, with public attitudes towards them ranging from fascination, awe and worship, to fear and loathing (Mullin and Seigel 2009). This lack of empathy towards these vertebrates is surprising, given that less than 25% of these species are venomous and most perform important top‐down regulation of mammalian pest species.

9
Given these challenges, the development of conservation strategies that maintain the role of snakes as indicators of ecosystem health, and important predators, is imperative (Mullin and Seigel 2009). Whilst numerous studies on the ecology and natural history of many snakes have been conducted, a complete understanding of their ecology, and particularly population biology, remains lacking (Dorcas and Wilson 2009). Such gaps in knowledge limit the ability of managers to develop effective conservation and management strategies. Accurate population estimates for snakes can be difficult to obtain due to problems associated with low detectability and biased sampling methods (Dorcas and Wilson 2009).
The population status of the Cook’s tree boa in the Caroni Swamp, and on the entire island, is unknown, as there have been few systematic snake surveys done in Trinidad. The Cook’s tree boa (Corallus ruschenbergerii) belongs to the snake family Boidae, which contains some of the largest living snakes in the world. Its range includes Trinidad and Tobago, Nicaragua to northern Colombia, and northern Venezuela. Local names include common tree boa, cascabel dormillon, yellow‐marbled tree boa, mangrove cascabel and mangrove dormillon. The Cook’s tree boa can be found in the Caroni Swamp, which is located on the west coast of Trinidad. Cook’s tree boa has also been recorded from the north coast of Trinidad, in forested areas between Paria and Petite Tacarib Bays (Boos 2001). It is a mainly nocturnal and arboreal snake, with colours ranging from khaki green or brown, and yellow beneath the chin, neck and fore body. During the day, individuals can be seen coiled in a tight ball in trees, often overhanging water and their prey includes frogs, bats, birds and iguanas (Wehekind 1955; Hendserson and Boos 2001). Although the Cook’s tree boa is non‐venomous, they can be extremely aggressive and defensive when disturbed.
Reliable census techniques and accurate assessments of tree boa densities are fundamental to wildlife research and future monitoring of populations. A density estimate of the Cook’s tree boa is crucial to the understanding of the temporal dynamics of its population and for evaluating the effectiveness of any management strategies used to conserve the species. It would be important to determine the population of existing Cook’s tree boas in the Caroni Swamp as the area has been undergoing changes, which can directly affect the snake population. The Caroni Swamp is experiencing pressures such as reclamation for roads, housing and industrial development, industrial and chemical pollution, poaching, unmanaged and uncontrolled tourism and drainage modification (Forestry Department, Food and Agriculture Organization of

10
the United Nations 2005). In addition, there is general public indifference to the protection and conservation of Cook’s tree boa in the Caroni Swamp, and the ecological system as a whole. Snakes have life‐history characteristics that make them vulnerable to population declines, such as long life spans, late sexual maturity and low reproductive rates (Mullin and Seigel 2009). This, coupled with the fact that many snake species occupy the highest levels in their respective trophic webs, suggest that any decline in snake populations are likely to have impacts on their prey populations, and for the wetland ecosystem as a whole (Mullin and Seigel 2009).
Without quantitative assessment of the Cook’s tree boa population, the conservation and management of this species cannot be implemented in the long term. As such, this paper describes the application of a distance sampling survey to estimate the population density of the Cook’s tree boa in the Caroni Swamp. Materials and Methods Study Area This study was conducted in the Caroni Swamp, Trinidad, which has an area of approximately 6000 ha, making it the largest wetland on the west coast of the island. The swamp is situated between Port‐of‐Spain and Chaguanas, where the Caroni River meets the Gulf of Paria. The Caroni River, the main watercourse entering the swamp, runs along the north of the swamp. Other natural water courses of the swamp include the Blue River, Catfish River, Phagg River, Guayamare River and Madame Espagnol River. There are many canals and channels within the swamp, some of which are natural and others dredged.
The Caroni Swamp is predominantly estuarine and is characterized by dense mangrove vegetation, reaching some 23 m in height. The swamp holds the largest single stand of mangrove on Trinidad’s west coast, which includes approximately 60 % of Trinidad’s mangroves. This ecosystem includes Rhizophora mangle, Rhizophora harrisonii, Rhizophora racemosa, Avicennia germinans, Avicennia schaueriana, Laguncularia racemosa and Conocarpus erectus. The most widespread is Rhizophora mangle, followed by R. harrisonii and R. racemosa which are also very common (Forestry Department, Food and Agriculture Organization of the United Nations 2005). The climate at this site is tropical humid, with two distinct, wet and dry, seasons. The Caroni Swamp was recognized nationally as an environmentally sensitive system, and today most of the Caroni Swamp is a prohibited area with entry by

11
permit only. The site was also designated a Ramsar site of international importance in 2005. Distance Sampling Surveys Population density data for many terrestrial species can often be estimated using line transect surveys (Hyrenbach et al. 2001). This technique uses counts of individuals and is widely used in animal population ecology for density estimation (Plumptre 2000; Marques et al. 2007). Such line transect surveys can be relatively effective for the estimation of animal densities over large areas or where budgets are limited (Newey et al. 2003).
This study used line transect surveys for Cook’s tree boa in the Caroni Swamp, as a means to determine population density of this predator. Distance sampling is widely used in wildlife ecology (Burnham et al. 1980) and its advantages include flexibility in data collection and processing, and provision of highly precise estimates of animal densities (Harris and Burnham 2002). In this distance sampling study, it was assumed that all Cook’s tree boas were not detected during the surveys due to visual obstructions and observer error.
Distance sampling uses sample data on species detection probability to estimate a detection function that describes how detection of the species changes with increasing distance from the transect (Somershoe et al. 2006). The area around the transect can be derived from this function, and density is then computed as the number of individuals encountered divided by the effective area sampled.
Distance sampling makes three critical assumptions (Newey et al. 2003, Buckland, et al. 2001): First, all individuals on the transect are detected by the observer. This assumption affects the construction of the detection function, and importantly, it relies on the 100% detection of individuals on or very close to the sample line. A second key assumption is that individuals do not move before detection. Distances recorded after any movement by individuals under observation will introduce errors in density estimation; and third, is that distance measurements to the target animal are accurate. Again, any bias in the measurements will introduce a bias in the estimate of individual densities.
The distance surveys undertaken here were conducted through the months of September and October 2010, during the morning period to midday period (0700‐ 1300) and evening period (1400‐ 1900). Surveys were conducted on six transects, along the channels, drainage outlets and mangrove embankments throughout the swamp. Transect lines ranged from 18 km to 22 km in length (Figure 1). A transect width of 50

12
m was estimated on either side of the transect axis. All surveys were conducted with an average of five observers. Surveys were undertaken in a flat bottom boat on open water, with observers on both sides and front of the boat, and on foot in single file while traversing transects along mangrove banks. When Cook’s tree boas were observed, their positions were recorded via handheld GPS receivers. Sighting distance in meters was measured by eye from the transect to the Cook’s tree boa, and compass bearings were taken to determine the sighting angle between the Cook’s tree boa and the transect, by the same observer throughout the whole study. The radial distances and sighting angles were then later converted to perpendicular distances (Buckland et al. 2001). Environmental data on viewing conditions such as weather and glare were also recorded. Data analysis All field data were analysed using the conventional distance sampling (CDS) engine in the software Distance 6.0 (Thomas et al. 2004). This program uses an array of models for estimation of detection function and population density. Three detection functions (half‐normal, uniform and hazard rate), and their series expansions (simple polynomial, cosine or hermite polynomial), were used in this analysis. Exploratory analysis and model selection followed those guidelines recommended by Buckland et al. (2001). Exploratory analysis included plotting of a histogram to allow examination of observation‐frequency and distance relationships. Models were compared using the AIC scores, and the model with the lowest AIC value selected (Burnham and Anderson 1998). Results A total of 32 Cook’s tree boas were observed from a total of 115.97 km line transect surveys in the Caroni Swamp. Buckland et al. (2001) recommends data truncation to eliminate outliers and improve model fitting. However, there were no observations remarkably different in measurement and thus no truncation was made in the analysis conducted in Distance 6.0. The probability of detecting the Cook’s tree boas decreased as the distance from the transect line increased. Based on this data structure, the half‐normal and hazard rate models were considered because they are known to be able to manage data with rapid falls in detection rates with distance (Buckland et al. 2001).

13
Figure 1 Study area and location of survey routes (dotted lines) and all Cook’s tree boa observed within the Caroni Swamp (grey dots)
Using the AIC values, the half‐normal simple polynomial model provided the best fit to the data. The density of the Cook’s tree boa estimated from distance sampling analysis using the lowest AIC value was 11.022 tree boas per square kilometre. The histogram of perpendicular sighting distances had a narrow shoulder that suggested many of the tree boas were detected on the transect line, and that detection rates decreased rapidly with perpendicular distance (Figure 2). Figure 2 Histogram of perpendicular distances and the half‐normal simple polynomial density estimator model for Cook’s tree boa at Caroni swamp, Trinidad.

14
Discussion Distance sampling methods are often constrained by the reality of field conditions (Buckland et al. 2001). Ideally line transects should be placed randomly, and subsequent transects evenly spaced across the swamp regardless of the distribution of habitat type(s) (Kuhl et al. 2008). The major problems of distance sampling the Cook’s tree boa population in this area, was the use of non‐straight transects along the channels, canals and embankments within the swamp. This does not constitute a random sample and possibly gave a biased estimate of the population density (Buckland et al. 2001; Hiby and Krishna 2001).
Surveys on foot were conducted along routes where it was possible to walk. However, there were few areas where this was possible, as most of the landscape within the study area was covered by water and mangrove roots. The boat surveys permitted a larger sample size to be obtained and a larger area to be covered, as well as allowing two views of the transects while going in opposite directions. In addition, although the transect lines were not straight, the estimate may have been more precise because more of the sample site was covered (Plumptre 2000). Also, even though it was difficult to establish straight transect lines throughout all of the study area, transects covering more of the study area made these representative as far as was possible, of the entire area.
Moreover, since most of the surveys were conducted from a small slow‐moving boat, Cook’s tree boa detection was likely to vary with the size of the boat and height of observer above water level and boat speed. Boat size, especially, has implications regarding navigation, as a smaller flat bottom boat can pass through narrower channels as compared to a larger boat. Speed is also an important factor in detection; especially if observers have to sight Cook’s tree boas in dense vegetation.
Other environmental factors such as weather and sun glare affect detection of Cook’s tree boas. Surveys were conducted during the morning period when glare was not a problem, and for those surveys conducted in the evening period when there was some glare present, observers were able to navigate transects one‐way to count individuals on one side of the boat without glare; and then observe/sight individuals on the other side of the boat when returning in the opposite direction.
The accuracy of this kind of survey is limited due to the constraints imposed by the assumptions of distance sampling. This is especially true of observations on or close to the axis of the transect (Bibby et al. 2000). For some species, g (0) may be <1 and is affected by platform types (size of boat and those surveys conducted on foot). Furthermore, the

15
assumption of perfect detection along a transect is often very unrealistic except in the case of narrow strips.
Most observations were made no further away than 12 meters from the observer, and this suggests that as distance away from the transect increased, detection probability decreased. The distance histogram calculated for the observations in this study suggested that only tree boas close to transect lines were detected with certainty. However, in cases where distance histograms decline steeply, detection probabilities can be difficult to estimate, and often result in poor density estimates (Buckland et al. 2001).
Rapid declines in detection may be due to tree boa behaviour or inaccurate sighting distance and angle measurement. Cook’s tree boas are typically stationary during the day and so meet the assumption that individuals should not move in relation to observers. The tree boas in this study were inactive, even when under very close observation, and were undisturbed by observer actions and/or noise.
In this study, it was difficult to assess the assumption of measurement accuracy, especially as measurements were made by eye and not with equipment such as laser range finders. Untrained observers can be poor at judging distances by eye (Alldredge, et al. 2007). As such, observer training and testing is very important in obtaining correct distance measurements. Observers in this study were trained to estimate distances by eye. However, it is noted that correct measurements in the field without the use of laser range finders can be very difficult to obtain, especially under conditions of dense vegetation and whilst on a moving platform, as performed in the swamp.
In general, careful survey design, and proper stratification and sampling of the study area is necessary, to avoid biases in survey data. In addition, it has been suggested that a sample size of 60‐80 is the minimum threshold for reliable population size and density estimates (Buckland et al., 2001), and an accurate population estimate may be unlikely with smaller sample numbers, such as those obtained in this survey.
There have been surveys of other island boa species that have estimated population densities. A study of two endemic boas in the Caribbean (the Mona boa Epicrates monensis monensis, and the Virgin Islands boa Epicrates m. granti) conducted over 9 years from 1984, suggested that density values for these species can vary between 1.5 – 202 boas per ha. These species are listed as threatened and endangered, respectively, under the U.S. Endangered Species Act. Both are nocturnal species and difficult to count in the field. Due to large‐scale habitat

16
destruction and the introduction of exotic predators on these islands (e.g., rats, cats) extra pressure has been exerted on these boas over most of their range (Tolson and Garcia 2003). Population data for these two species was crucial to the development of their recovery plans. The current Cook’s tree boa survey was conducted over a short period and factors such as boa population dynamics were not assessed. However, distance sampling can be advantageous when surveying large areas with difficult terrain and once the key assumptions are met, can produce an accurate estimate of boa density. Conclusions The natural history of snakes often makes the collection of reliable data on their populations challenging (Lind et al. 2005). This study demonstrates that distance sampling can provide a means to estimate density of the Cooks’ tree boas in the Caroni Swamp, once the key assumptions are met. It also shows that distance sampling is advantageous in providing estimates on the Cook’s tree boa when surveying large areas, where obtaining larger samples in the field is difficult, and where budget or time for research is limited.
Other important considerations include the use of other data to obtain a more accurate population density. Due to the secretive nature of most snakes and their intricate activity cycles, accounting for snake’s annual activity is critical in obtaining accurate population estimates (Camacho et al. 2005).
The lack of a standardized techniques for monitoring population status remains a major obstacle in the management of snake populations globally (Dorcas and Wilson 2009). However, a more complete understanding of snake ecology at the individual, population and landscape levels will be important in the development of effective conservation programs for these animals. An appreciation of the Cook’s tree boa should also be encouraged to change the negative view of snakes by people, thereby making a difference in their protection and long‐term survival. More long‐term research is required into the population distribution and trends of the Cook’s tree boa, if it is to be conserved at the Caroni Swamp. In nature, monitoring a population’s change with time is more important for a wild population than any single estimate of population density. Acknowledgements The staff at the Caroni Visitors Centre at the Caroni Swamp are recognised, for providing access to their office and information on the

17
Caroni Swamp. Special thanks Madoo Tours and C. Madoo, D. Madoo and S. Madoo who provided transport, navigation of the Caroni Swamp and advice on species behaviour. This research was funded by the University of the West Indies. The authors also wish to recognize the invaluable support of the many volunteers in the field, and for those constructive comments given by family and friends. References Alldredge, M. W., T. R. Simons and K. H. Pollock. 2007. A field evaluation of distance
measurement error in auditory avian point count surveys. J Wildlife Management 71 (8):2759‐2766.
Bibby, C. J., N. D. Burgess, D. A. Hill and S. H. 2000. Bird census techniques, 2nd ed. Academic Press, London.
Boos, H.E.A. 2001. The snakes of Trinidad and Tobago. 1st ed. W.I. Moody, Jr., natural history series; no. 31. Texas A and M University Press.
Buckland, S. T., D. R. Anderson, K. P. Burnham, D. L. Thomas and J. L. Laake. 2001. Introduction to distance sampling: estimating abundance of biological populations. Oxford University Press, New York.
Burnham. K. P. and D. R. Anderson. 1998. Multiple model selection and inference: an information theoretic approach. Springer, London.
Camacho, C., J. Feinberg and T. Green. 2005. Use of the Program DISTANCE to Assess Population Size of the Eastern Hognose Snake (Heterodon platirhinos) at the Brookhaven National Laboratory, Upton, New York, 11973.
Dorcas, M.E., and J.D. Wilson. 2009. Innovative methods for studies of snake ecology and conservation. In Chp 1 Snakes: Ecology and Conservation/edited by Stephen J. Mullin and Richard A. Seigel. Cornell University, New York.
Forestry Department, Food and Agriculture Organization of the United Nations. 2005. Global forest resources assessment 2005: Thematic study on mangroves in Trinidad and Tobago‐Country profile. Forest resources development service forestry department. Forest resources division FAO, Rome (Italy).
Harris, R. B., and K. P. Burnham. 2002. On estimating wildlife densities from line transect data. Acta Zool Sinica 48:812–818.
Hiby, L., and M. B. Krishna. 2001. Line transect sampling from a curving path. Biometrics 57:727–731.
Hyrenbach, K. D., C. L. Baduini and JR. Hunt. 2001. Line transect estimates of short‐tailed shearwater Puffinus tenuirostris mortality in the south‐eastern Bering Sea, 1997–1999. Mar Ornithol 29:11–18.
Kissling, M. L., and E. O. Garton.2006. Estimating detection probability and density from point‐count surveys: a combination of distance and double‐observer sampling. The Auk 123(3):735‐752.
Kuhl, H., F. Maisels, M. Acrenaz and E. A. Williamson. 2008. Best practice guidelines for surveys and monitoring of great ape populations. Occasional paper of the IUCN Species survival commission no.36.
Lind, A. J., H. H. Welsh and D. A. Tallmon. 2005. Garter snake population dynamics from a 16‐year study: considerations for ecological monitoring. USA Ecological Applications, 15(1).
Marques, T.A., L. Thomas, S. G. Fancy and S. T. Buckland. 2007. Improving estimates of bird density using multiple covariate distance sampling. The Auk 124(4):1229–1243.

18
Mullin, S. J., and R. J. Siegel. 2009. Snakes: Ecology and Conservation. Cornell University, New York.
Newey, S. B., M. Enthoven, and S. Thirgood. 2003. Can distance sampling and dung plots be used to assess the density of mountain hares Lepus timidus? Wildlife Biol 9:185–192.
Plumptre, AJ. 2000. Monitoring mammal populations with line transect techniques in African forests. J Appl Ecol 37:356–368.
Somershoe, S. G., D. J. Twedt and B. Reid. 2006. Combining breeding bird survey and distance sampling to estimate density of migrant and breeding birds. The Condor 108:691‐699.
Tolson, P. J and M. A. Garcia. 2003. Mona/Virgin Islands Boa: A U.S / Puerto Rico partnership seeks to recover endangered boa. Toledo Zoological Gardens, P. O. Box 4010, Toledo, OH 43609.
Wehekind, L. 1955. Notes on the foods of Trinidad snakes. British Journal of Herpetology 2:9‐13.

19
Demography and general ecology of an introduced primate – the tufted capuchin (Cebus apella) in Chaguaramas, Trinidad
Darshan Narang1,2, Howard P. Nelson2, and Andrew Lawrence2
2Department of Life Sciences, The University of the West Indies, St. Augustine, Trinidad,
West Indies. 1 Corresponding Author ‐ Email: [email protected]
Abstract Two endemic non‐human primate subspecies are known from the island of Trinidad: the Red howler monkey (Alouatta seniculus insulanus) and the White‐fronted capuchin (Cebus albifrons trinitatis). A third primate, the tufted capuchin (Cebus apella), appears to have been introduced to the Chaguaramas peninsula during the United States military occupation of that site during 1941‐1977. These tufted capuchins now occur sympatrically with the two endemic Trinidadian monkeys at Chaguaramas, while virtually nothing is known of the ecology and demography of this introduced Cebid. This study investigated the population density of the tufted capuchins within the Chaguaramas peninsula. Line transect distance surveys were conducted within the Chaguaramas peninsula from May to November, 2010. The cumulative distance sampled during the study was 34.6 km, with a sampling effort of 200 hours. Conventional distance sampling (CDS) in Distance 6.0 software was used to estimate density. Capuchin density within the study area was 17.7 troops per km2 with an overall average troop size of 5.2 ± 0.6 individuals per troop (n=30) and a range of 2‐15 individuals per troop. Key words Tufted capuchin, Cebus apella, population density, introduced species, Trinidad, distance sampling. Introduction Humans have introduced animals throughout the world for various reasons: aesthetics, food, hunting and sport, commercial enterprises, controlling pests, scientific research, and through accidental introduction, escapees and pet‐keeping (Long 2003). The Caribbean islands have had a long history of European and American colonization and as a result have experienced frequent species introduction. These exotics have included commensal rodents, the mongoose (Herpestes auropunctatus), a range of domestic species, as well as peccaries and monkeys (four species). In

20
total, the Caribbean has experienced at least 37 mammalian introductions, 28 of which have become established (Long 2003).
Trinidad is home to two endemic non‐human primate subspecies (Agoramoorthy and Hsu 1995): the red howler (Alouatta seniculus insulanus) of the family Atelidae and the Trinidad white‐fronted capuchin (Cebus albifrons trinitatis) of the family Cebidae. It has been suggested that C. albifrons was introduced to the island during pre‐Columbian times (Long 2003). However, no comparative genetic studies with mainland South American populations have been conducted. One competing theory is that C. albifrons may have also occurred naturally on Trinidad and that this population was isolated when Trinidad became an island approximately 10,000 years ago, during the last ice age (Vuilleumier 1972).
Recent research on primates in Trinidad has focused on three wildlife sanctuaries in Trinity Hills, Central Range and Bush Bush Island (Bacon and ffrench 1972, Neville 1976; Agoramoorthy and Hsu 1995; Rylands et al. 1997; Phillips 1998, Phillips et al. 1998, Phillips and Abercrombie 2003). White‐fronted capuchins in Trinidad are limited to only two of the three wildlife sanctuaries: Trinity Hills and Bush Bush Island (Phillips and Abercrombie 2003). White‐fronted capuchins need larger ranges (>80 ha.) than Red howlers and thus are not as likely to persist in viable populations outside of large tracts of forest (Phillips and Abercrombie 2003).
The major threats to primates in Trinidad include hunting, habitat destruction, and harvest of important plant species within and near protected areas (Phillips and Abercrombie 2003). Many important habitat areas for primates in Trinidad already enjoy de jure protection with 13 legal sanctuaries, comprising about 3.4% of the total land area, that are currently managed by the Forestry Division (Phillips and Abercrombie 2003). The Environmental Management Authority (EMA) has also designated some areas of the country as environmentally sensitive, including the Nariva Swamp – an important primate habitat (EMA 2006). Some monkeys may also persist in unprotected areas, and protection of these populations may be particularly difficult (Phillips and Abercrombie 2003). The Conservation of Wildlife Act (67:01) 1953, provides protection to all primates in the country regardless of whether they occur in State or private forest.
A third species of primate, the tufted capuchin (Cebus apella) of the family Cebidae, was introduced on the Chaguaramas peninsula during the United States military occupation from 1941‐1977 (John 1998). These monkeys were kept at a small zoo in the Scotland Bay area of the

21
peninsula. These tufted capuchins now occur sympatrically with the two endemic Trinidadian monkeys within the Chaguaramas peninsula. There has been no research on these free‐ranging capuchins within Chaguaramas. This study investigates the population density and distribution of the tufted capuchins within the Chaguaramas peninsula. The general ecology of these capuchins is also described as it relates to population dynamics. Methods Study area This study was conducted in the Chaguaramas National Park (CNP), located on the north‐western peninsula of Trinidad. This peninsula is five and a half miles long from East to West, and extends three and a half miles from North to South (Figure 1), with an area of approximately 40.5 km2 (CDA 2010). The national park was created and is managed almost exclusively by the Chaguaramas Development Authority (CDA) under the CDA Act (35:02) 1972.
Figure 1: Location of transects within the Chaguaramas peninsula and the distribution of tufted capuchins
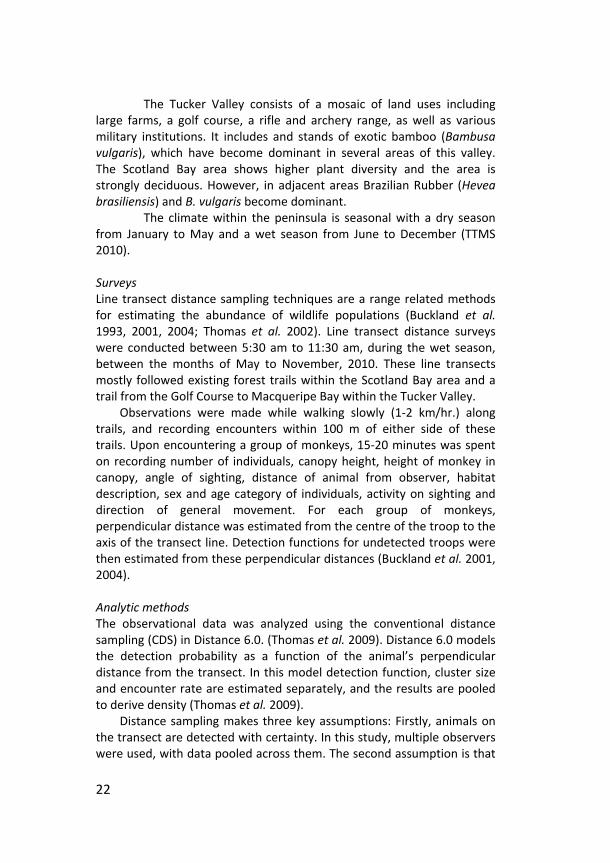
The CNP is characterized by several hills reaching a maximum height of 546 m at Morne Catherine. There are numerous seasonal streams, and the predominant vegetation is tropical dry forest (Beard 1946) with patches of mixed primary and secondary, wet and dry forest, as well as various forms of agriculture. This study was primarily undertaken within the Tucker Valley and Scotland Bay areas of the peninsula.
22
The Tucker Valley consists of a mosaic of land uses including large farms, a golf course, a rifle and archery range, as well as various military institutions. It includes and stands of exotic bamboo (Bambusa vulgaris), which have become dominant in several areas of this valley. The Scotland Bay area shows higher plant diversity and the area is strongly deciduous. However, in adjacent areas Brazilian Rubber (Hevea brasiliensis) and B. vulgaris become dominant. The climate within the peninsula is seasonal with a dry season from January to May and a wet season from June to December (TTMS 2010). Surveys Line transect distance sampling techniques are a range related methods for estimating the abundance of wildlife populations (Buckland et al. 1993, 2001, 2004; Thomas et al. 2002). Line transect distance surveys were conducted between 5:30 am to 11:30 am, during the wet season, between the months of May to November, 2010. These line transects mostly followed existing forest trails within the Scotland Bay area and a trail from the Golf Course to Macqueripe Bay within the Tucker Valley.
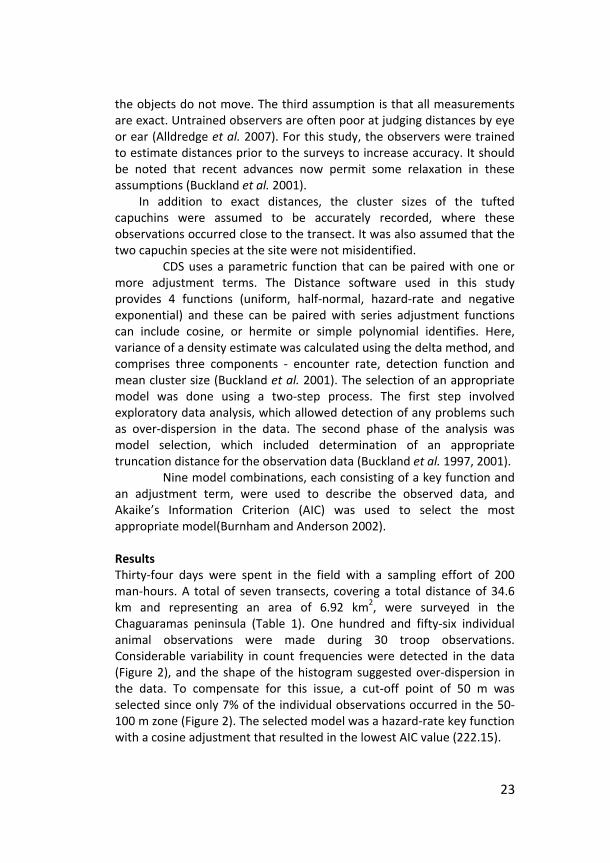
Observations were made while walking slowly (1‐2 km/hr.) along trails, and recording encounters within 100 m of either side of these trails. Upon encountering a group of monkeys, 15‐20 minutes was spent on recording number of individuals, canopy height, height of monkey in canopy, angle of sighting, distance of animal from observer, habitat description, sex and age category of individuals, activity on sighting and direction of general movement. For each group of monkeys, perpendicular distance was estimated from the centre of the troop to the axis of the transect line. Detection functions for undetected troops were then estimated from these perpendicular distances (Buckland et al. 2001, 2004). Analytic methods The observational data was analyzed using the conventional distance sampling (CDS) in Distance 6.0. (Thomas et al. 2009). Distance 6.0 models the detection probability as a function of the animal’s perpendicular distance from the transect. In this model detection function, cluster size and encounter rate are estimated separately, and the results are pooled to derive density (Thomas et al. 2009).
Distance sampling makes three key assumptions: Firstly, animals on the transect are detected with certainty. In this study, multiple observers were used, with data pooled across them. The second assumption is that
23
the objects do not move. The third assumption is that all measurements are exact. Untrained observers are often poor at judging distances by eye or ear (Alldredge et al. 2007). For this study, the observers were trained to estimate distances prior to the surveys to increase accuracy. It should be noted that recent advances now permit some relaxation in these assumptions (Buckland et al. 2001).
In addition to exact distances, the cluster sizes of the tufted capuchins were assumed to be accurately recorded, where these observations occurred close to the transect. It was also assumed that the two capuchin species at the site were not misidentified. CDS uses a parametric function that can be paired with one or more adjustment terms. The Distance software used in this study provides 4 functions (uniform, half‐normal, hazard‐rate and negative exponential) and these can be paired with series adjustment functions can include cosine, or hermite or simple polynomial identifies. Here, variance of a density estimate was calculated using the delta method, and comprises three components ‐ encounter rate, detection function and mean cluster size (Buckland et al. 2001). The selection of an appropriate model was done using a two‐step process. The first step involved exploratory data analysis, which allowed detection of any problems such as over‐dispersion in the data. The second phase of the analysis was model selection, which included determination of an appropriate truncation distance for the observation data (Buckland et al. 1997, 2001). Nine model combinations, each consisting of a key function and an adjustment term, were used to describe the observed data, and Akaike’s Information Criterion (AIC) was used to select the most appropriate model(Burnham and Anderson 2002). Results Thirty‐four days were spent in the field with a sampling effort of 200 man‐hours. A total of seven transects, covering a total distance of 34.6 km and representing an area of 6.92 km2, were surveyed in the Chaguaramas peninsula (Table 1). One hundred and fifty‐six individual animal observations were made during 30 troop observations. Considerable variability in count frequencies were detected in the data (Figure 2), and the shape of the histogram suggested over‐dispersion in the data. To compensate for this issue, a cut‐off point of 50 m was selected since only 7% of the individual observations occurred in the 50‐100 m zone (Figure 2). The selected model was a hazard‐rate key function with a cosine adjustment that resulted in the lowest AIC value (222.15).

24
Table 1 Transect lengths and observed troops at Chaguaramas study sites The estimated density of the tufted capuchins within the sampling
area was 17.7 troops per km2 with the estimate of expected value of troop size 5.2 ± 0.6 individuals per troop (n=30). The overall estimate of density was 92.3 animals / km2.
The range of animals per troop was between 2 ‐ 15 animals and 0.15 troops were observed per hour of observation. Most troops were observed along the Macqueripe trail and only a few troops were seen in the Scotland Bay area and along Elder Road (Figure 1).
Figure 2 Detection distances of C. paella within the Chaguaramas peninsula.
Discussion Demographics The population of the tufted capuchin in the Chaguaramas peninsula appears similar to that of other locations where this species occurs. In

25
comparison, the encounter rate for tufted capuchins on Margarita Island has been reported at between 0.02 and 0.23 troops/hours of observation (Marquez and Sanz 1991), while 0.15 troops/hours were observed in this study. The average group size on Margarita Island was 4.5 individuals per group, with 5.2 individuals per group in the Chaguaramas study population (Marquez and Sanz 1991). Similarly, group sizes in Chaguaramas were identical to that reported elsewhere (Rylands et al. 2008). The tufted capuchins density in Chaguaramas was also very similar to that of the red howlers’ density on Bush Bush Island, Nariva, of 83 individuals in 20 troops/km2 (Agoramoorthy and Hsu 1995). Habitat Cebus is found in almost every kind of Neotropical forest. This generalization is also true of the tufted capuchin, which is known from a broad range of forest habitats and regarded as ecologically plastic in its habitat requirements (Mittermeier and van Roosmalen 1981). These Cebids typically use the lower to mid‐canopy and understory of tropical forests (Fragaszy et al. 2004). In this Chaguaramas study, the tufted capuchin was found throughout the vertical forest profile, as well as foraging on the ground. Diet The tufted capuchin is omnivorous and able to use a variety of food sources, many of which are not used by other Neotropical species. Other authors have reported that their diet contains fruits, pith, nectar, leaves, nuts, insects, birds, small mammals, lizards etc. (Terborgh 1983; Spironello 2001). In Chaguaramas, the tufted capuchins were observed feeding on a range of food sources including various palm fruits, exotic fruits from introduced trees, and various insect larvae. These capuchins spent a significant amount of time foraging in the bamboo and feeding on termites and ants. On one occasion, capuchins were observed eating a frog.
The general daytime feeding habits of Cebus apella is categorized broadly into two types: either foraging as scattered individuals in a given area; or in groups moving slowly or quickly in a given direction (Izawa 1979, 1980). These types of feeding activities occurred mainly along the trail to the Macqueripe Beach, where the capuchins would be moving in an easterly or westerly direction while slowly feeding on mainly animal protein among the bamboo. The capuchins fed opportunistically, thus the specific movement type during feeding was not always obvious. The capuchins were always scattered among the vegetation and there may

26
have been an overlap among the feeding areas of different troops at the same time. Inter‐specific interaction Tufted capuchins typically live sympatrically with other primates, where they occur naturally (Fragaszy et al. 2004). Notably, during this study, no interactions were observed between any of the primate species in Chaguaramas. During this study, only one troop of the Trinidad white‐fronted capuchin (Cebus albifrons trinitatis) was observed east of the Tucker Valley Road, while no tufted capuchins were observed there. In addition, no Trinidad white‐fronted capuchins were observed in any transect west of the Tucker Valley Road, where the Tufted capuchins were observed.
Comparative studies of Cebus albifrons and Cebus apella in Colombia suggest strong differences in their behaviour (Defler 1979). Cebus albifrons troops tended to be large and multi‐male, which were very aggressive towards neighbouring conspecific troops. These primates defended an exclusive territory with little overlap by conspecifics, and used long‐distance calls and fighting to maintain their territories (Defler 1979). In comparison, troops of Cebus apella were small, did not defend a territory, displayed few agonistic interactions and had overlapping territories (Defler 1982). The tufted capuchins in Chaguaramas exhibited similar intraspecific behaviour to that observed in Colombia. However, no interactions between the two capuchin species were observed during this study.
Red howler monkeys were observed throughout the study area, but in relatively low numbers. However, no interactions were observed between these howlers and the tufted capuchins in this study. Tool use Wild tufted capuchins can use tools to obtain food. Thus, fruits may be broken open on tree surfaces, or with baton‐like branches (Boinski et al. 2000). During this study, tool use was observed, including the use of batons to obtain insects from bamboo and use of bamboo leaves to obtain water from hollows of dead bamboo stalks. This is very similar to the tool use observed in wild Trinidad white‐fronted capuchins, which used leaves as cups to retrieve water from tree cavities (Phillips 1998). Conclusion This is the first published study of the establishment of an alien primate on the island of Trinidad. Invasive alien species are currently one of the

27
most significant threats to biodiversity in the Caribbean, and have significant implications for the Caribbean’s economy, the environment and for human health. Further research is therefore, required to understand the history and ecology of this introduced primate species, its potential invasiveness and its impact on the two endemic primate subspecies in Trinidad. Acknowledgments Thanks to the Wildlife Section, Forestry Division, for their support in the field, to L. Guy for providing necessary arrangements for the access to Scotland Bay; to the Chaguaramas Development Authority for providing the research permit; to R. Honoré of the Trinidad and Tobago Regiment for escorting us throughout the Scotland Bay surveys; to the National Herbarium of Trinidad and Tobago for providing support in the field and in the identification of plants; and to all volunteers. References Agoramoorthy, G. and Hsu, M.J. 1995. Population status and conservation of Red Howling
Monkeys and White‐fronted Capuchin monkeys in Trinidad. Folia Primatology 64:158‐162.
Alldredge, M.W., Simons, T.R. and Pollock, K.H. 2007. A field evaluation of distance measurement error in auditory avian point count surveys. Journal of Wildlife Management 71: 2759–2766.
Bacon, P. R. and R. P. Ffrench. editors. 1972. The wildlife sanctuaries of Trinidad and Tobago. Prepared by the Wildlife Conservation Committee, Ministry of Agriculture, Lands and Fisheries, Trinidad and Tobago.
Beard J.S. 1946. The natural vegetation of Trinidad and Tobago. Oxford at the Clarendon Press.
Boinski, S., Quatrone, R.P. and Swartz, H. 2000. Substrate and tool use by brown capuchins in Suriname: ecological contexts and cognitive bases. American Anthropology 102(4): 741‐61.
Buckland, S.T. 1992. Fitting density functions using polynomials. Applied Statistics 41:63. Buckland, S.T., Anderson, D.R., Burnham, K.P. and Laake, J.L. 1993. Distance Sampling:
Estimating Abundance of Biological Populations. Chapman and Hall, London. Buckland, S.T., Anderson, D.R., Burnham, K.P., Laake, J.L., Borchers, D.L. and Thomas, L.
editors. 2004. Advanced Distance Sampling. Oxford University Press, London. Buckland, S.T., Anderson, D.R., Burnham, K.P., Laake, J.L., Borchers, D.L. and Thomas, L.
2001. Introduction to Distance Sampling. Oxford University Press, London. Buckland, S.T., Burnham, K.P. and Augustin, N.H. 1997. Model selection: an integral part of
inference. Biometrics 53:603‐618. Buckland, S.T., Summers, R.W., Borchers, D.L. and Thomas, L. 2006. Point transect sampling
with traps or lures. Journal of Applied Ecology 43:377–384. Burnham, K. P., and D. R. Anderson. 2002. Model Selection and Multimodel Inference: A
Practical Information‐Theoretic Approach. 2nd edition Springer‐Verlag, New York. CDA (Chaguaramas Development Authority). 2010. http://chagdev.com/ Accessed May,
2010.

28
Defler, T. R. 1979. On the ecology and behavior of Cebus albifrons in northern Colombia, 1: Ecology. Primates 20:475‐490.
EMA (Environmental Management Authority). 2006. The Environmentally Sensitive Areas (Nariva Swamp Managed Resource Protected Area) Notice. Legal Notice No. 334.
Fragaszy, D.M., Visalberghi, E. and Fedigan, L.M. 2004. The complete capuchin: the biology of the genus Cebus. Cambridge: Cambridge University Press.
Izawa, K. 1979. Foods and feeding behaviour of wild black‐capped capuchin (Cebus apella). Primates 20:57‐76.
Izawa, K. 1980. Social behaviour of the wild black‐capped capuchin (Cebus apella). Primates 21(4): 443‐467.
John, B. 1998. Changing Patterns of Land use in Chaguaramas. Unpublished Undergraduate Thesis. University of the West Indies. St. Augustine. http://www.triniview.com/Carenage‐Chaguaramas/Chaguaramas.html Accessed August 2010.
Long, J.L. 2003. Introduced Mammals of the World: Their History, Distribution and Influence. CSIRO Publishing, Australia.
Marquez L, Sanz V. 1991. Evaluación de la presencia de Cebus apella margaritae (Hollister, 1914) en la Isla de Margarita. Trabajo Especial de Grado, Universidad Central de Venezuela, Caracas.
Mittermeier, R.A and van Roosmalen, M.G.M. 1981. Preliminary observations on habitat utilization and diet in eight Suriname monkeys. Folia Primatology 36:1‐39.
Neville, M. 1976. The population and conservation of howler monkeys in Venezuela and Trinidad. In: Neotropical Primates: Field Studies and Conservation, R. W. Thorington, Jr. and P. G. Heltne. editors. pp.101‐109. National Academy of Sciences, Washington, DC.
Phillips, K. 1998. Tool use in wild capuchin monkeys (Cebus albifrons trinitatis). American Journal of Primatology 46:259‐261.
Phillips, K. A. and Abercrombie C. L. 2003. Distribution and Conservation Status of the Primates of Trinidad. Primate Conservation 19:19‐22.
Phillips, K. A., Elvey, C. R. and Abercrombie, C. L. 1998. Applying GPS to the study of primate ecology: A useful tool? American Journal of Primatology 46:167‐172.
Rylands, A. B., Mittermeier, R. A. and Rodríguez‐Luna, E. 1997. Conservation of Neotropical primates: Threatened species and an analysis of primate diversity by country and region. Folia Primatologica 68(3‐5): 134‐160.
Rylands, A.B., Boubli, J.‐P., Mittermeier, R.A. and Wallace, R.B. 2008. Cebus apella. In: IUCN 2010. IUCN Red List of Threatened Species. Version 2010.4. http://www.iucnredlist.org/ Accessed July 2010.
Spironello, W.R. 2001. The brown capuchin monkey (Cebus apella): ecology and home range requirements in central Amazonia. In: Bierregaard, R.O, Gascon, C., Lovejoy, T.E. and Mesquita, C.G. editors. Lessons from Amazonia: the ecology and conservation of a fragmented forest. New Haven: Yale University Press. p 271‐83.
Terborgh, J. and Janson, C.H. 1983. The ecology of primates in southeastern Peru. National Geographical Society Research Report 15:655‐62.
Thomas, L., Laake, J.L., Rexstad, E., Strindberg, S., Marques, F.F.C., Buckland, S.T., Borchers, D.L., Anderson, D.R., Burnham, K.P., Burt, M.L., Hedley, S.L., Pollard, J.H., Bishop, J.R.B. and Marques, T.A. 2009. Distance 6.0. Release 2. Research Unit for Wildlife Population Assessment, University of St. Andrews, UK. http://www.ruwpa.st‐and.ac.uk/distance/ Accessed July 2010.
Thomas, L., S. T. Buckland, K. P. Burnham, D. R. Anderson, J. L. Laake, D. L. Borchers, and S. Strindberg. 2002. Distance Sampling. Pages 544‐552 in El‐Shaarawi, A.H and Piegorsch, W.W. editors. Encyclopedia of Environmetrics. John Wiley and Sons, Chichester, UK.

29
TTMS (Trinidad and Tobago Meteorological Service). 2010. Government of Trinidad and Tobago. Accessed at http://www.metoffice.gov.tt/climate/article.aspx?id=4820 Accessed June 2010.
Vuilleumier, B. S. 1972. Pleistocene changes in the fauna and flora of South America. Science 173:771‐780.

30
Spatial and Temporal Diversity in Ground Level Fruit Feeding Butterflies
Imran Khan1, 2, Christopher K. Starr2, Howard P. Nelson2, and
Andrew Lawrence2
2Department of Life Sciences, The University of the West Indies, St. Augustine, Trinidad,
West Indies. Email: [email protected] 1 Corresponding Author
Abstract Butterfly diversity has been proposed as an indicator of habitat disturbance. Rapid assessment of fruit feeding butterflies is often used to predict disturbance impacts and so aid in the development approval process in Trinidad. However, such an approach makes several assumptions about the relationship between butterfly diversity and habitat disturbance. This study reports on an investigation of these relationships. Ground‐level fruit feeding butterflies were trapped within forest, agricultural, and cocoa habitats in Grande Riviere. Seven sampling stations were established in each habitat type, and trapping was replicated six times each month from May to September 2010. Shannon’s Diversity (H) was calculated for each plot to determine whether HF>HA>HC. H was also calculated monthly across all plots to examine temporal changes in diversity. H for the three plots was found to be 2.48, 1.56, and 2.00, respectively. H for the months of May to September was found to be 1.72, 1.98, 1.05, 1.99, and 2.15, respectively. Comparison with another study in Trinidad suggests that the guild of ground level fruit feeding butterflies may be used as biological indicators of disturbance, but not for rapid assessments. Areas dominated by C. minor are less disturbed, and a dominance of E. penelope and E. hermes appears associated with disturbance. Key words Caligo minor, disturbance, Euptchia hermes, Euptchia penelope, indicator, Shannon diversity Introduction The Certificate of Environmental Clearance Rules (2001) is generally considered the most effective mechanism for regulating development in Trinidad and Tobago. For developments that may have significant environmental impacts, the regulating agency, the Environmental

31
Management Authority (EMA), typically requires an Environmental Impact Assessment (EIA), before issuing or denying a Certificate of Environmental Clearance (CEC). The agency issues Terms of Reference (TOR), which are a blueprint for completing the EIA (EMA, 2010). These TORs provide developers with an indication of what studies are required for an EIA.
Typically, developers can satisfy the TOR by undertaking rapid ecological assessments (EMA, 2010). Such assessments provide a snapshot of the biological diversity in the area earmarked for development, and include a description of the species richness and diversity of major taxonomic groups such as trees, birds, fish, and benthic macrofauna (EMA, 2010). This assessment provides a portrait of the degree of disturbance already experienced at the site. From a development perspective, the more disturbed a site is found to be, the easier it would be to obtain a CEC, and the CEC itself should not require intensive conservation efforts to protect the biological resources at the site.
However, while the most diverse taxa on Earth are insects (Wilson, 1988), it is notable, that this taxon has never been identified as objects for study in TORs by the EMA (EMA, 2010). Insects are probably just as overlooked on the local stage as they are on the international level (Meyers et al. 2000; Clark and May, 2002; and Leather, Basset, and Hawkins, 2008). If this taxon was to be considered in the future by the EMA, one key question remains the identification of the group of insects to be used as indicators of habitat disturbance. Termites (Vasconcellos et al, 2010; Lawton et al. 1998; Eggleton et al, 1995), beetles (Scheffler, 2005; Rainio and Niemelä, 2002; Davis et al. 2001) and ants (Philpott, Perfecto, and Vandermeer, 2006; Watt, Stork, and Bolton, 2002; Roth, Perfecto, and Rathcke, 1994) are examples of arthropod groups that have been used in habitat disturbance studies.
Butterflies are another well studied group that have the potential to serve as indicators of disturbance (Sundufu and Dumbuya 2008), and have been widely used in habitat disturbance studies elsewhere (Beck and Schulze 2000; Wood and Gillman 1998; DeVries et al. 1997; Hill et al. 1995; Sparrow et al. 1994; Spitzer et al. 1993; Kremen 1992; Brown 1991; Lovejoy et al. 1986;). These insects have also been suggested as good environmental indicators due to their sensitivity to microclimate and light intensity changes (Wood and Gillman, 1998; Erhardt, 1985), and because of their complex life history (Kremen, 1992; Ehrlich, 1984). Butterfly taxonomy, distribution and natural history (Brown, 1997) is also well

32
known and many species can be reliably identified in the field (Wood and Gillman, 1998).
This paper examines the suitability of butterflies as indicators of disturbance in Trinidad, and their utility in rapid ecological assessments in the local EIA process. This was done by comparing butterfly diversity under natural forest, cocoa plantations and open‐field agriculture land‐use types. Methods Study Site This study was conducted at Grande Riviere, a remote village situated in northeast Trinidad (Figure 1). Here, three treatments of varying human disturbance were chosen: (undisturbed) forest (F); cocoa plantations (C); and open field agriculture (A). Forest study areas had > 70% canopy cover and were dominated by tall trees of several species. Cocoa plantations had > 70% canopy cover, with approximately 90% dominance of Cacao spp. Finally, open‐field agriculture areas had < 30% canopy cover, very few trees, and were dominated by agricultural short crops and grass. The agricultural plot and the cocoa plot were adjacent to each other, and the forest plot was located 1.5 km away from these two (Figure 1).
Figure 1: Location of Forest (F), Agriculture (A) and Cocoa (C) Disturbance Areas and Sampling Stations in Grand Riviere, Trinidad

33
Collection Butterflies were collected at the study sites, during the months May to September, which have been previously documented as the best times for collecting these insects (Barcant 1970). Butterflies were sampled for six days of each month (three days each at the start and end of each month).
Baited fruit traps were used to sample butterfly communities at each site (Mendéz and Funes 2007). Twenty‐one inverted cone butterfly traps were used in this study. Seven traps were set up in each of the three disturbance treatments (F, C, and A). On each day, traps were baited from 8 am to 12 pm, and checked approximately 24 hours later. All specimens were removed for later identification, and bait was replaced if needed. The bait consisted of a fermented mixture of over‐ripe/rotting bananas, brown sugar, and cane juice. Analysis Butterfly diversity in the different habitats (F, A, and C), was estimated using Shannon’s Diversity (H), and Equitability (EH), Number of Individuals (N), and Species Richness (S). These indices were calculated using the total results from F, A, and C treatments for each month from May to September to examine monthly changes in diversity. Non‐metric multidimensional scaling nMDS was also used to investigate differences in the diversity of butterflies among the three disturbance types. nMDS analysis of the top five species from each area was also used to identify indicator species for least and more disturbed areas. Results Two thousand two hundred and forty five (2245) individuals of 45 species of butterfly were captured during 609 trap‐days of effort at Grande Riviere. Diversity indices per treatment for the sampling period are presented at Table 1, and Table 2. Table 1: Butterfly Diversity Indices for Forest, Agriculture and Cocoa Areas in Grand Riviere, Trinidad
DISTURBANCE AREA DIVERSITY INDICES H EH N S Forest 2.48 0.76 443 26 Agriculture 1.56 0.44 1048 35 Cocoa 1.99 0.61 754 26

34
These data suggest that the highest H value was recorded in the forest, and lowest in the agricultural areas. However, both the greatest number of species and individuals were observed from the agricultural area, which also had the lowest EH value. Table 2: Monthly Butterfly Diversity Indices for Forest, Agriculture and Cocoa Areas in Grand Riviere, Trinidad
MONTH DIVERSITY INDICES
H EH N S May 1.72 0.67 116 13 June 1.98 0.70 144 17 July 1.05 0.29 674 37 August 1.99 0.58 396 30 September 2.15 0.64 913 27
H values for the months of June, August and September were similar, with a slight decrease noted in May, and July showing the largest decrease. July also recorded the highest species richness with an intermediate number of individuals, and the lowest EH value (0.29).
The nMDS analysis of species richness for each sampling station is presented in Figure 2. This figure suggests that there is a distinction in butterfly diversity between the three habitat types. Here, forest sampling stations were clustered on the left of the plot, agricultural sampling stations were to the right, and cocoa in the centre. These data suggest that the disturbance level may be related to changes in the butterfly diversity.
Figure 2 An MDS Plot Of butterfly species richness at each Sample Station

35
While the nMDS analysis suggests that there were clear differences between the butterfly communities at each site, there were two agricultural plots (A2 and A3) that clustered with the cocoa plots.
The top five most abundant species for the three habitat types are presented at Table 3. E. penelope, T. virgilia, and Colobura dirce occurred in the top five for each of the study areas, while E. hermes was ranked second in the open‐agriculture and cocoa areas, respectively, but did not rank among the dominant forest species. M. insularis, C. Minor, and P. fusimaculata appeared only in forest sites.
Wood and Gillman (1998) examined the effects of disturbance on forest butterflies in the Victoria Mayaro Reserve in southern Trinidad. They studied butterflies in disturbed (D) and undisturbed (U) areas of evergreen (E) and semi evergreen (SE) forest. To allow comparison with their work, diversity indices were computed from their understory data, and compared with the undisturbed areas in the present study (F to U E and U SE).
Table 3: The top five most abundant butterfly species found in Forest, Agriculture and Cocoa areas in Grande Riviere, Trinidad
Forest Agriculture Cocoa
Species Name Number Species Name Number Species Name Number Euptchia penelope 105 E. penelope 574 E. penelope 353 Taygetis virgilia 55 E. hermes 272 E. hermes 81 Morpho peleides insularis
49 E.palladia 27 E. palladia 70
Caligo eurilochus minor
48 T. virgilia 23 C. dirce 64
Colobura dirce 33 C. dirce 21 T. penela 38 Pierella hyalinus fusimaculata
33 T. virgilia 38
Similarly, a comparison between the disturbed areas in their data (C
and A to D E and D SE), and the current study (F, U E and U SE to C, A, D E, and D SE) was also undertaken. Diversity estimates for the Wood and Gillman (1998) study are presented in Table 4. This data suggests that in undisturbed evergreen forest (U E), H was higher than disturbed evergreen forest (D E), while in undisturbed semi‐evergreen forest (U SE), it was lower than disturbed semi‐evergreen forest (D SE).

36
Table 4 Butterfly Diversity Indices Calculated from Wood and Gillman (1998).
Area Diversity Indices H EH N S D E 1.78 0.81 66 9 U E 2.01 0.87 34 10 D SE 2.24 0.78 133 18 U SE 1.68 0.65 86 13 D E – Disturbed Evergreen Forest U E – Undisturbed Evergreen Forest D SE – Disturbed Semi‐Evergreen Forest U SE – Undisturbed Semi‐Evergreen Forest
Discussion This study set out to investigate the hypothesis that for tropical butterflies, species richness is positively correlated to vascular plant species richness, or HF > HA > HC (Simonson et al. 2001, Nyamweya and Gichuki, 2000). However, it was found that for butterflies at the Grande Riviere sites that HF > HC > HA.
This may be the result of landscape‐scale pattern effects of the cocoa sampling stations. The study area was nestled in a landscape of secondary forest with greater floral diversity than the cocoa area, while the agricultural sampling area was located just north of the cocoa area. The proximity of the cocoa area traps to areas richer in floral diversity may have lured butterflies from these richer surrounding areas.
Perhaps, if Pollard Walks were used instead of baiting, the species richness and diversity in the cocoa sites would have been different. In addition, if the cocoa sample site was of a larger size, the source/sink dynamics may have had a less confounding effect on the results.
However, the clear pattern of Shannon diversity (H) in the three disturbance treatments suggests that there was an effect of degree of disturbance on species richness and evenness.
With the exception of Euptychia spp., no other species in the agricultural plots were observed feeding on food at the site. Interestingly, two agricultural plots could not be differentiated from forest plots using nMDS, suggesting that these plots may have been confounded by their relative position on the landscape relative to the other treatment type. Disturbance of floral composition, height of canopy cover, and the timing and intensity of physical alteration of the landscape may all contribute to changes in butterfly diversity.

37
The monthly H values observed from May to September showed no clear seasonal pattern. The lowest H value was in the month of July, which also recorded the highest S and lowest equitability values. The most abundant species captured in all months, were E. penelope and E. hermes. Notably, July was also the month that experienced the heaviest and longest periods of rainfall.
Barcant (1970) lists the host plant of the Euptychia genus as “grass”, and notes that butterflies were more abundant following an extreme dry season (as was experienced in 2010). These conditions were realised in the agricultural area during the month of July, and this may account for July having the highest species richness, and a population boom of the commonest species (E. penelope and E. hermes).
In decreasing order of abundance, the top five most abundant species for the forest sites were E. penelope, T. virgilia, M. peledies, C. minor, with C. dirce and P. fusimaculata tying for fifth. With the exception of M. peledies, C. minor and P. fusimaculata, all the other species also featured in the top five species for the more disturbed areas. These three species were recorded for each of the trapping months mainly from the forest, but they were also caught in lesser numbers in the cocoa. This makes these species ideal as indicators of least disturbed sites (Sparrow et al. 1994).
The most noticeable difference between the forest and the other two areas are the presence of a tall canopy. This may well be the key factor affecting the distribution of these three butterfly species. Yet, during the time spent in the field, it was not unusual to observe M. peleides flying across the agricultural areas. However, none were caught in traps in this agricultural treatment. Based on this it may be said that M. peleides prefers to feed under the canopy.
Similarly, while the food plant for the larvae of C. minor is the Musa spp. (Barcant, 1970), none were observed flying in the agricultural area, where Musa spp. was present, and only five individuals (N = 69) were captured in this area. This is because the genus is both crepuscular and its eyes are sensitive to bright light (Frederiksen and Warrant, 2008). Despite this, when the conditions at dusk or at dawn were right for flight, the baited traps in the open‐agricultural area still did not attract C. minor. It may, therefore, be said that this species also prefers to feed under the forest canopy.
P. fuscimaculata was exclusively observed from canopy‐enclosed areas, and this species may be indicative of undisturbed forest areas. E. penelope was the most abundant species in all plots, and for each month of sampling. This species was found to exhibit a greater affinity for the

38
disturbed areas (A and C), than undisturbed area (F). However, due to its commonness in all areas, relative abundance and not presence/absence data should be considered, if using E. penelope as in indicator.
T. virgilia and C. dirce were also abundant in all of the disturbed areas. However, C. dirce, showed no meaningful pattern in its use of disturbed areas. Even though its host plant – Cecropia peltata (Barcant, 1970) favours disturbed areas (such as the agricultural and cocoa plots), comparatively high numbers of C. dirce were found in the forest plot. T. virgilia exhibited a preference for disturbed areas, and was more dominant in the cocoa. However, this species was not present in the dry season month, and 71% (N = 118) of the individuals were captured in September. These findings do not make T. virgilia a suitable indicator species.
E. hermes was the most abundant species for both of the disturbed areas (C and A), and exhibited a clear preference for the agricultural area, accounting for 69 % (N = 359) of the total individuals. Based on this and its presence during the entire sample period, this species is typical of disturbed areas. In particular, E. hermes may also be indicative of recently altered sites.
T. penela was only recorded during the last three months of the study with July and September peak population periods for the species. For these reasons, T. penela is not an appropriate indicator species.
In Grande Riviere the least disturbed area (F) produced the highest H value (2.48), and the more disturbed areas had lower H values. However, this was not the case for both undisturbed areas used by Wood and Gillman (1998).
The traps in their undisturbed evergreen sites (U E) produced an H of 2.01, and traps in the disturbed evergreen (D E) sites produced an H of 1.78. This followed the findings at Grande Riviere where least disturbed areas had higher H value than disturbed areas. In contrast, undisturbed semi evergreen (U SE) areas produced an H value of 1.68, compared to the 2.24 value for H in the disturbed seasonal evergreen (D SE) areas. This finding is inconsistent with the previous two observations. For both forest types, undisturbed areas had higher numbers of C. minor than in their disturbed areas. In this case, light sensitivity of this species (Frederiksen and Warrant, 2008) may play a key role in limiting their numbers at disturbed sites. However, almost the same number of M. peleides occurred in either area, and too few P. fusimaculata were caught to make any inferences. On the other hand, E. penelope and E. hermes were more common in disturbed areas. This supports the inconclusiveness of rapid assessment of butterfly indicator species for assessing undisturbed areas.

39
Wood and Gillman (1998) conducted a relatively rapid assessment of butterfly diversity, given that their 10 days of sampling occurred over a twenty‐day period. Since their H results did not consistently show that undisturbed areas have higher H value than disturbed areas, this suggests that rapid assessment of butterfly diversity using Shannon’s Index alone, was not suitable to identify areas of disturbance.
When Wood and Gillman’s (1998) rapid assessment is compared to Barcant’s (1970) list of proposed butterfly indicators (Table 5), three of the five species appear effective. Table 5 Occurrence of proposed butterfly indicator species modified from Wood and Gillman (1998) and Barcant (1970). Species Name Number of Individuals Disturbed Area Undisturbed Area Barcant (1970) Wood and Gillman (1998) SE E SE E INDICATORS OF LEAST DISTURBANCE P. fusimaculata P. hyalinus 0 1 0 0 M. peleides 3 9 6 5 C. minor C. eurilochus 2 0 6 2 INDICATORS OF MORE DISTURBANCE E. penelope Cissia penelope 51 16 43 10 E. hermes C. hermes 6 1 1 0
In the present study, it was not possible to obtain data for a full wet
season and a full dry season, which would have allowed for a more complete analysis. It was also limited to areas in the landscape that were generally safe and accessible. Ideally, larger areas of cocoa and the agricultural plots should have been sampled. This would reduce the contribution of the source/sink dynamics from nearby habitats affecting the results. Finally, due to manpower limitations it was not possible to include Pollard Walks during this study. Conclusions It was found that HF > HC > HA, and that H is greater in less disturbed areas than in more disturbed areas at Grande Riviere. Variation in the monthly H was observed from May to September. However, the results from this study should not be taken as conclusive from a seasonal or annual cycle. Where C. minor is relatively more abundant, such area(s) may be considered least disturbed, while areas where E. penelope and E. hermes are relatively more abundant may be considered more disturbed. Rapid

40
assessment of butterflies, even when coupled with the use of indicator species, cannot be used to determine disturbance levels in an area. References Barcant, M. 1970. Butterfies of Trinidad and Tobago, 1st edn. London: Collins. Beck. J., Schulze. C., 2000. Diversity of fruit‐feeding butterflies (Nymphalidae) along a
gradient of tropical rainforest succession in Borneo with some remarks on the problem of ‘pseudoreplicates’, Transactions of the Lepidoptera Society of Japan 51: 89‐98.
Brown. K.S., 1997. Diversity, disturbance, and sustainable use of Neotropical forests: insects as indicators for conservation monitoring. Journal of Insect Conservation 1: 25‐42.
Brown, K.S., 1991. Conservation of neotropical environments: insects as indicators, In The Conservation of insects and their habitats, 15th Symposium of the Royal Entomological Society of London, pp. 50‐404, New York: Academic Press.
Clark. J. A., and May. R. M., 2002. Taxonomic bias in conservation research, Science 297: 191‐192.
Davis, A. J., Holloway, J. D., Huijbregts, H., Krikken, J., Kirk‐Spriggs, A. H. and Sutton, S. L. 2001. Dung beetles as indicators of change in the forests of northern Borneo. Journal of Applied Ecology, 38: 593–616.
DeVries. P.J, Murray. D., Lande. R., 1997. Species diversity in vertical, horizontal, and temporal dimensions of a fruit‐feeding butterfly community in an Ecuadorian rainforest, Biological Journal of the Linnean Society 62: 343‐64.
Eggleton P, Bignell DE, Sands WA, Waite B, Wood TG, Lawton JH., 1995. The species richness of termites (Isoptera) under differing levels of forest disturbance in the Mbalmayo Forests Reserve, southern Cameroon, Journal of Tropical Ecology 11: 85‐98
Ehrlich. P. R., 1984. The structure and dynamics of butterfy populations, In The Biology of Butterfies (R.I. Vane‐Wright and P.R. Ackery, eds), pp. 25±40, London: Academic Press.
Environmental Management Authority (EMA), 2010, National Register of Certificates of Environmental Clearance, accessed in 2010.
Erhardt. A., 1985. Diurnal Lepidoptera: sensitive indicators of cultivated and abandoned grassland, Journal of Applied Ecology, 22: 849‐862.
Frederiksen. R., and Eric J. Warrant. J.E., 2008. Visual sensitivity in the crepuscular owl butterfly Caligo memnon and the diurnal blue morpho Morpho peleides: a clue to explain the evolution of nocturnal apposition eyes?, Journal of Experimental Biology 211, 844‐851.
Hill, J.K., Kramer, K.C., Lace, L.A., Banham. W.M.T., 1995. Effects of selective logging on tropical forest butterflies on Buru, Indonesia, Journal of Applied Ecology 32: 754‐760.
Kremen, C., 1992. Assessing the Indicator Properties of Species Assemblages for Natural Areas Monitoring, Ecological Applications, Vol. 2, No. 2, pp. 203‐217
Lawton. H. J., Bignell. E. D., Bolton. B., Bloemers. F. G., Eggleton. P, Hammond. M. P., Hodda. M., Holt, D. R., Larsen. B. T., Mawdsley. A. N., Stork, E. N., Srivastava, S. D., and Watt, D. A., 1998. Biodiversity inventories, indicator taxa and effects of habitat modification in tropical forest, Nature 391, 72‐76.
Leather. S. R., Basset. Y., and Hawkins. B. A., 2008. Insect conservation: finding the way forward. Insect Conservation and Diversity 1: 67‐69.
Lovejoy, T.E., Bierregaard. R.O., Ryland, A.B., 1986. Edge and other effects of isolation on Amazon forest fragments, In: Soulé , editor. Conservation biology: the science of scarcity and diversity, pp. 257‐285. Sinauer Associates Inc.
Mendéz. M., and C. Funes., 2007. Inventario de Mariposas en Salamar, Colinas de Jucuarán, Departmento de Usutlán, El Salvador, SalvaNATURA Informe de Consultoría.

41
Meyers. N., Mittermeier. R. A., Mittermeier. C. G., da Fonseca. G. A. B., and Kent. J., 2000. Biodiversity hotspots for conservation priorities, Nature 403: 853‐858.
Nyamweya. N. N., and Gichuki. N. G., 2000. Effects of plant structure on butterfly diversity in Mt. Marsabit Forest – northern Kenya, African Journal of Ecology, 48: 304–312. doi: 10.1111/j.1365‐2028.2009.01151.x.
Philpott. M. S., Perfecto. I., and Vandermeer. J., 2006. Effects of Management Intensity and Season on Arboreal Ant Diversity and Abundance in Coffee Agroecosystems, Biodiversity and Conservation, Volume 15, Number 1, 139‐155.
Rainio. J., and Niemelä. J., 2002. Ground beetles (Coleoptera: Carabidae) as bioindicators, Biodiversity and Conservation, Volume 12, Number 3, 487‐506,
Roth. S. D., Perfecto. I., and Rathcke. B., 1994. The Effects of Management Systems on Ground‐Foraging Ant Diversity in Costa Rica, Ecological Applications, Vol. 4, No. 3 pp. 423‐436
Scheffler. Y. P., 2005. Dung beetle (Coleoptera: Scarabaeidae) diversity and community structure across three disturbance regimes in eastern Amazonia, Journal of Tropical Ecology, 21, pp 9‐19
Sparrow. H.R, Sisk. T.D., Ehrlich. P.R., Murphy. D.D., 1994. Techniques and guidelines for monitoring neotropical butterflies, Conservation Biology 8: 800‐809.
Spitzer. K., Novotný. V., Tonner. M., Lepš. J., 1993. Habitat preferences, distribution and seasonality of the butterflies (Lepidoptera: Papilionidae) in a montane tropical rain forest, Vietnam, Journal of Biogeography 20: 109‐121.
Sundufu. A., and Dumbuya. R., 2008. Habitat preferences of butterflies in the Bumbuna forest, Northern Sierra Leone., Journal of Insect Science 8:64.
Vasconcellos. A., Bandeira. A.G., Moura. F.M.S., Araujo. V.F.P., Gusmao. M.A.B., Constantino. R., 2010. Termite assemblages in three habitats under different disturbance regimes in the semi‐arid Caatinga of NE Brazil, Journal of Arid Environments, 74 (2), pp. 298‐302.
Watt. A. D., Stork, N. E., and Bolton. B., 2002. The diversity and abundance of ants in relation to forest disturbance and plantation establishment in southern Cameroon, Journal of Applied Ecology, 39: 18–30.
Wood. B., Gillman. M.P., 1998. The effects of disturbance on forest butterflies using two methods of sampling in Trinidad, Biodiversity and Conservation 7: 597‐616.
Wilson. E. O., 1988. The current state of biological diversity. In Biodiversity, ed. EO Wilson, pp. 3‐18. Washington D.C., National Academic Press.
42
A comparison of beach morphology and physical characteristics of Turtle Beach, Tobago and Grande Riviere, Trinidad and its
implications for turtle nesting
Sheetal Jankie1,2 and Andrew Lawrence1
1Department of Life Sciences, The University of the West Indies, St. Augustine, Trinidad, West Indies. Email: [email protected]
2 Corresponding Author Abstract Globally, all seven species of marine turtles are threatened with extinction. Consequently, conservation efforts for these endangered species must be improved. One approach to sea turtle conservation is by protection of their nesting habitat. Recent reports from Tobago have indicated a loss in stable nesting habitat at Turtle Beach, where sand mining and infrastructural developments have been suggested as the main contributors to habitat loss. This study investigated spatial and temporal changes in beach morphology and sediment composition of Turtle Beach, Tobago and Grande Riviere, Trinidad, during June ‐ October 2010. These data were compared to previously reported characteristics for these sites, to determine whether there were changes in these parameters and how the beaches differed from each other. Spearman rank correlation revealed a negative correlation between beach area and nesting activity at Turtle Beach. Research has suggested that turtles prefer to nest on smaller secluded bays and this correlation supported that theory. A Kruskal‐Wallis test revealed that the sediments on Turtle Beach were more coarse grained (0.5mm‐1.00mm) than they were 10 years ago with significance values of H=7.02, P=0.008. In 2000, sediments on Turtle Beach were classified as medium to fine grained (0.25mm‐0.5mm)‐(0.025mm‐0.25mm). A Kruskal‐Wallis test also revealed that there was a significant difference (H=4.09, P=0.04) in Grande Riviere’s grain size composition (2010), when compared to analyses done in 1999. The beach however, remains classified as coarse grained. Other factors that may affect nesting activity include anthropogenic influences, photo‐pollution, changes in beach dynamics and bathymetry coupled with climate change and increased poaching. Key words Beach profiles, sediment composition, anthropogenic disturbance, particle size, sea turtles, habitat preference

43
Introduction Of the seven species of marine turtles in the world, three are listed as critically endangered on the International Union for the Conservation of Nature (IUCN) Red List of Threatened Species. In addition, all seven species are listed in Appendix I of the Convention on International Trade in Endangered Species of Wild Fauna and Flora (CITES) (Abreu‐Globois & Plotkins 2008). Marine turtles therefore, must be protected and conservation strategies for these animals strengthened if their long‐term survival is to be ensured.
Beaches play important roles in ocean ecosystems by providing key habitat for marine life, helping to balance marine food webs and facilitating nutrient cycling from water to land (Wilson et. al. n.d.). These habitats also serve as critical nesting sites for marine turtles.
The marine turtle species that most frequently nest in Trinidad and Tobago are Leatherback turtles (Dermochelys coriacea), Hawksbill turtles (Eretmochelys imbricata) and Green turtles (Chelonia mydas) (Lalsingh 2008). Grande Riviere Bay in Trinidad, has the second highest recorded nesting frequency of leatherback turtles in the Caribbean (Lee Lum 2005). In Tobago, Turtle Beach is also an important beach for nesting sea turtles (Clovis, 2006) with approximately two thirds of all nesting activity in Tobago taking place at that beach (Law et al. 2010).
There have been recent reports of declining nesting activity on Turtle Beach and it has been suggested that beach sand mining coupled with changes in the beach structure and morphology are responsible for this decline (Butler 1998). Beach sand mining in Tobago is still prevalent despite being illegal (Lalsingh 2010). Nesting turtles have also increased the popularity of Turtle Beach as a tourist attraction, and this has led to an increase in infrastructure developments, anthropogenic influences, and modifications along the beach. This type of anthropogenic development may directly affect the structure and morphology of beaches, reducing stable nesting habitats and posing further threats to the species (Butler 1998).
Hawksbill turtles prefer to nest on low energy, steep beaches but will also use high‐energy beaches (Earnst and Lovich 2009). However, steep, high‐energy beaches are thought to be preferred by leatherbacks and loggerheads as they reduce the amount of energy required for terrestrial locomotion by gravid females and hatchlings (Pritchard 1971). Hendrickson and Balasingam (1966) report that in Malaya, leatherbacks preferred to nest on beaches with pronounced slopes and coarser sands. In addition, a high correlation between sediment particle size and mean

44
elevation of beach was noted by these authors (Hendrickson and Balasingam 1966).
While, up to 18,000 turtle nests have been recorded at Grande Riviere Bay in Trinidad in one nesting season (Wildlife Section, unpublished data), only 300 nests of this species have been recorded at Turtle beach (Clovis, 2005). Turtle Beach and Grande Riviere Bay are both high‐energy beaches (IMA 2004, Forestry Division et al. 2010). Both are steep beaches, with Turtle Beach spanning a greater area, and each beach hosts the highest number of nests on their respective islands. Although Turtle Beach provides a greater expanse of turtle nesting habitat, it is much more easily accessible than Grande Riviere. Grande Riviere is more isolated and less subjected to exploitation, which may make it a more suitable nesting habitat.
This study compared the differences in beach sediment composition, morphology, and physical characteristics of Turtle Beach and Grand Riviere to assess how these features may influence the suitability of each beach for nesting marine turtles.
Methods Study Areas Turtle Beach, also known as Great Courland Bay, is 1.8km long and is located on the south‐western end of Tobago. Grande Riviere is nestled in the north‐eastern corner of Trinidad and spans approximately 1.3km. Both beaches are bound by rivers that seasonally burst their berms and flow into the sea. A total of 1.1 km of Turtle beach and 0.65km of Grande Riviere were surveyed during this study (Figure 1.0). Figure 1.0 Location of Grande Riviere Bay, Trinidad and Turtle Beach, Tobago.
Grande Riviere
Turtle Beach

45
Beach profiles Grande Riviere and Turtle Beach were studied between June and October of 2010. Each beach was topographically surveyed and sediments were collected for analysis. Twenty‐two beach profiles were performed on Turtle Beach, including 3 at permanent benchmarks previously established by the Institute of Marine Affairs (IMA, unpublished a). Thirteen beach profiles were performed for Grande Riviere. The first 12 profiles were 50m apart and included three IMA benchmarks. A thirteenth profile was performed at a 4th benchmark (IMA‐GR1), 250m away from benchmark 12. Benchmarks on Turtle Beach were surveyed by the IMA from 1999‐2008 whereas those on Grande Riviere were surveyed from 1990‐2008.
Profiling was conducted using methodologies adopted by the IMA (IMA, unpublished b). Profiles were measured using a Sokkia survey level, a survey staff extendable to 4m, and a measuring tape. Profiles were performed on each beach at 50m intervals. Where the IMA’s benchmarks were within 2m of the 50m interval location, these were surveyed instead. Measurements were taken at the vegetation line, high, mid and the low shore positions. Beach profiles were conducted at low tide to capture the maximum transect distance.
For each profile, the maximum elevation, and gradient were determined. These were tabulated against the same parameters from previously conducted profiles and analysed using Spearman Rank correlation tests. Kruskal‐Wallis tests were carried out using Statistix 7 (Analytical Software, 2000) statistical software to determine whether there were any significant changes in each parameter within and between both beaches. Sediment analysis Sediment samples were collected monthly at the upper, mid and low shore marks along each transect, using an 11.25cm x 20cm PVC corer. Approximately 800‐1000g of each sample was extracted using random bulk sampling. Sediment analyses were conducted using ASTM D6919 standard methods for particle size distribution of sediment using sieve analysis and sand grain‐size analysis (Barzani 2009, Zeeman 2009). These techniques were supplemented by methodologies outlined in Knodel et al (2007), and characterised using Folk and Ward’s (1957) classification for skewness, kurtosis and sorting. Samples were air and sun dried, and samples taken at the low shore were oven dried at 100°C for 24 hours. Dried samples were weighed and sieved into six fractions, using an ASTM

46
mechanical sieve shaker for 10 minutes. The fractions in each sieve were calculated as a percentage of the total sample weight. For each profile and sampling point (upper, mid and low shore), an average of the percentage grain fractions was derived for the period of study. Cumulative frequency curves of percentage grain‐size versus phi (ф) values were plotted, and mean, median, skewness, kurtosis, standard deviation and sorting were determined using Minitab. Here, Phi represents the negative logarithm to the base two, of the various particle sizes expressed in mm (Bowen 1986). These results were compared to sediment analyses previously conducted by the IMA using non‐metric Multidimensional Scaling Plots in Primer, Kruskal‐Wallis tests in Statistix 7, descriptive statistics and cumulative frequency plots in Minitab. The sediments were classified according to the Udden‐Wentworth Grain Size Classification Scheme (Knodel et. al 2007). Nesting Data Nesting data was acquired from Save our Sea‐turtles (SOS) Tobago and the Wildlife Section, Forestry Division of the Ministry Housing and the Environment. Unpublished nesting data for Grande Riviere were obtained from the Wildlife Section. These data were also used to comparatively assess differences in nesting activity between both beaches. Nesting data were used in correlation analyses to establish possible linkages between beach condition and nesting. Results Profiling Kruskal‐Wallis tests between profile data from this study (2010) and data from IMA (2000 & 1990) respectively for Turtle Beach and Grand Riviere revealed significant changes over time in beach width, maximum elevation, and area. However, the tests indicated no significant changes over time in the gradient of either beach.
When profile parameters (2010) of both beaches were compared using Kruskal‐Wallis and Multidimensional Scaling Plots, it was found that there were significant differences in the morphology of the beaches (area: H=28.28, p<0.001; width: H=31.85, p<0.01; maximum elevation: H=47.9, p<0.01; Gradient: 34.75, p<0.01). Turtle Beach occupies a greater area, is wider and gentler in slope than Grande Riviere. During this study, Turtle Beach was also found to accrete to higher elevations than Grande Riviere. Throughout the period June‐October 2010, both beaches underwent changes, which included changes in area, elevation and width, which suggest that they are very dynamic and have different patterns of

47
sediment erosion and accretion. Rivers emptying through the beaches contributed to the dynamic nature of both beaches. Sediment Analysis Sediment analyses suggest that the mean grain size of Turtle Beach has changed over time. Turtle Beach now comprises of larger sand grains than it did 10 years ago (Table 1a) and is coarse grained. Its mean particle size composition ranges from 0.3 to 0.8mm. In 2000, sediments on this beach were medium grained and moderately sorted. By 2010, sediment analyses revealed that the beach was medium to coarse grained and moderately well sorted.
Grande Riviere now comprises of slightly larger sediments when compared to sediment analyses conducted in 1999 (Table 1b). It has a mean particle size distribution, which ranges from 0.6mm to 1.1mm. There were significant changes also in Grande Riviere’s mean grain size composition. The beach is now well sorted and coarse grained throughout the entire beach as opposed to being well to moderately well sorted, and ranging from medium to coarse‐grained 11 years ago. Non‐metric multidimensional scaling (nMDS) plots revealed two distinct groups of samples indicative of differences in grain size between Grande Riviere and Turtle Beach as well as similarity in mean grain size among sites within each study area indicating near uniform distribution of sediments across each beach. Outliers of these analyses for both beaches were found where rocky outcrops were present.
1a 1b Table 1. Changes in sediment mean grain size composition of 1a) Turtle Beach Tobago from 2000‐2001 and 1b) Grande Riviere from 1999‐2001. KEY‐ MWS‐moderately well sorted; WS‐ well sorted; P‐poorly sorted; FG‐fine grained; MG‐medium grained; CG‐coarse grained; VCG‐very coarse grained

48
Nesting Data The number of turtles nesting reported on Grande Riviere appears far greater than the number of turtles reported nesting on Turtle Beach. The maximum number of nests recorded in Turtle Beach is 300 in 2005 (Clovis, 2005). Since then there appears to have been a slight decline to the present number of 271 (Clovis, 2005). This is much lower than the 18,000 nesting turtles recorded in Grande Riviere in 2005 (Wildlife Division, unpublished). However, no data were available for nesting on Turtle Beach in 1999 or Grande Riviere in 2009 and 2010 and the figure for 2008 represents only the number of turtles that were tagged at that beach. Discussion Turtle nesting data collected by SOS and the Forestry Division indicate that turtles nest at much higher densities on Grande Riviere, Trinidad, than Turtle Beach, Tobago. Nesting data shows that there has been a temporal increase in the number of nesting turtles on both beaches. However, prior to 2000 monitoring strategies in Grande Riviere were not as systematic (Livingstone & Downie 2004) as those currently employed by the monitoring institutions, and so may not be as accurate (Livingstone 2004). As a small environmental group, SOS Tobago only began collecting data in 2000 (Clovis, 2007).
This study revealed that both beaches have undergone extensive morphological change over time. This is probably due to natural and seasonal patterns of sediment erosion and accretion in each area (Lee Lum 2005). The sediment grain size composition of Turtle Beach has been altered from medium‐grained sand to coarse‐grained sand. A coarser beach means that finer particles have been washed away, leaving behind the larger, coarse grains (Pinet 2003). The composition of coarser sediments may be associated with erosion of the beach (IPCC 2007). Erosion is known to be correlated with wave energy (Bird 2008), as well as sea level rise (IPCC 2007). The Intergovernmental Panel on Climate Change (IPCC 2007) and Singh (1997 a,b) have indicated that beach erosion rates have been high in Trinidad and Tobago over the last 15 years and sea‐level rise is considered a contributory factor (Mc Leod 1999, Singh, 1997a, b).
Erosion and the removal of sand often lead to significant changes in beach morphology and slope, and where the rate of removal exceeds natural replenishment, a negative sediment balance occurs (Cox & Embree 1990). Sediment particle size was found to be positively

49
correlated to beach elevation, gradient, and width in this study. According to Bird (2008), larger grains tend to accrete better than finer grains. In addition, Hendrickson and Balasingam (1966) reported that the steepness of beach slope is correlated to grain size. Consequently, this indicates that the observed changes in beach structure reported here may be related to the sediment changes recorded in this study.
In contrast to green turtles and hawksbills, which tend to nest in vegetated areas where trees shade the sand and keep nests cool (Horrocks & Scott 1991), leatherbacks nest on open sands (Hendrickson and Balasingam 1966). The porosity and ability of animals to burrow into a sandy beach are affected by the sediment particle size. Fine sand beaches have greater water retention whereas coarse sand beaches drain well and dry out quickly (Karleskint et.al 2010). Grain size determines characteristics such as heat retention, compaction, water retention, aeration and porosity (Knodel et al. 2007).
Knodel et al. (2007) also reported that the degree of sorting in sediments affect characteristics, such as porosity of the sand. Sorting is a measure of the evenness of sand particle distribution. Well‐sorted sand is more porous, aerated, well drained and has better heat regulation (Pfannkuch undated, Xie et al. 2010). Turtles generally select undisturbed beaches that are reasonably steep with sand that is neither too fine nor compact (Mc. Lachlan et al. 2006). The sediment analyses conducted here indicated that Grande Riviere has better sorted sediments than Turtle Beach, is fine‐skewed and near symmetrical. Turtle Beach on the other hand was found to be coarse‐skewed, and moderately well sorted. Coarse skewed sand has more sediment finer than it mean grain size (Schwartz 2005).
In this study, it was found that the area of the beach was not a limiting factor for nesting on Turtle Beach, which is longer, wider and covers a greater area than Grande Riviere. In addition, the sediment analyses indicated that the composition of Turtle Beach has changed to those more favoured by nesting turtles and yet the number of nests has been relatively stable/slightly reduced over the last 5 years. No correlations were found between grain size composition and nesting activities when Spearman Rank correlation tests were performed on data from either beach. Therefore, the hypothesis that changes in turtle nesting activities are due to sediment changes cannot be statistically confirmed from this study.
However, grain size can determine the shape and slope of beaches (Karleskint et al. 2010). Studies have revealed that Hawksbill turtles prefer to nest on steep, narrow beaches (Earnst and Lovich 2009).

50
Leatherbacks have an affinity for nesting on coarse‐grained beaches (Hendrickson and Balasingam, 1966). Well‐sorted sand also seems to be favoured by loggerhead turtles (Karavas et al. 2005). Consequently, these turtles seem to select suitable nesting sites in terms of optimum conditions provided by beach sands (Demetropoulos 2001). Indeed it has been suggested that a combination of interacting ecological factors including temperature, particle size, water content, salinity, sand softness, lagoon presence, beach length, and beach height, influence nest site selection (Varela‐Acevedo et al. 2009).
Changes in sediment composition may, therefore, affect the suitability of Turtle Beach as a nesting site. However, differences in nesting activities between sites might not be limited to the characteristics of the beach alone but may also be due to geographic, demographic, historical, natural and anthropogenic factors. Consequently, a more detailed study on properties of the sediments, other factors and nesting patterns is required to explain trends in nesting activities recorded for both beaches.
Grande Riviere is a smaller, narrower, steeper beach with larger, better‐sorted sand grains than Turtle beach. These characteristics may, in part, be responsible for the differences in nest densities between both beaches. Fine‐grained poorly sorted sand allows for compaction and water logging of beaches (Knodel et.al 2007). Sea turtles may nest on coarse grained, well sorted sands because it allows more ease in constructing nest chambers whilst at the same time being easily manipulated by emerging hatchlings (Mc Lachlan et al. 2006). Coarse, well sorted, sand is not easily compacted (Shatzel & Anderson 2005) and this is an advantage for emerging hatchlings as it makes their journey less strenuous. Coarser sands also allow better drainage, reduce water‐logging of nests, are more permeable, and so increase aeration of the sand and oxygen flow to the eggs (Knodel et al. 2007, Shatzel & Anderson 2005, Xie et al. 2010. The temperature of sand is better regulated when there is increased aeration. Not only does temperature affect the sex of the hatchling, it also affects hatchling success and egg mortality. Successful incubation of turtle nests is possible within specific thermal limits and is inhibited below 25 °C and above 35 °C (Gallegos et al. 2009). High temperatures can result in hatchling and nest mortality (Gallegos et al. 2009). These characteristics influence nest site selection by turtles and if the conditions are not favourable, females may make false crawls and return to the sea without nesting.
Steeper beaches are preferred by turtles because it makes their ascent to stable nesting habitat and the descent of their hatchlings easier
51
(Mc Lachlan et al. 2006). Leatherback nests are particularly vulnerable to erosion because the turtles' great size and tender skin force them to choose high energy, accessible beaches with a steep slope, which prevents them from travelling far inland to lay their eggs (Butler 1998). Steeper beaches also offer more protection to nests from wave action and are better drained than gently sloping beaches (Anthoni 2000), thus preventing water‐logging of nest and mortality of eggs.
It has been noted that sea turtles prefer to nest on small beaches, and this is perhaps one of the reasons why so many turtles nest on Grande Riviere. Small beaches in secluded areas may be optimal as they are prone to fewer disturbances and are more sheltered. Open access beaches give room for human interference as is the case with Turtle Beach.
Other factors that may potentially impact the nesting activities on Turtle Beach are mainly anthropogenic. It was noted that there has been an increase in developments along the beach as well as habitat modifications by beachfront décor. Boating activities around Turtle Beach are much more prevalent than in Grande Riviere. Studies by Bacon (1973) in Matura, Trinidad confirmed that light causes disorientation in nesting sea turtles. Due to the Turtle Beach hotel, photo‐pollution and other activities may act as a deterrent to nesting turtles.
Leatherbacks almost never nest on beaches protected by reefs, as contact with the reef systems at low tide especially in a rough sea may be dangerous for this soft‐skinned species (Pritchard 1971). Turtle Beach is one of the few beaches is Tobago not protected by reef systems. However, neighbouring beaches in Tobago are protected by reefs. This may also be a possible reason for the considerably lower nesting activities on Turtle Beach when compared to Grande Riviere. Trinidad has few reef systems, none of which are in proximity of Grande Riviere. Only one reef system, the Salybia Reef, is recorded in Trinidad (Kenny 2008).
More in‐depth and extensive research is required to provide conclusive insight into the patterns of nesting being observed on Turtle Beach and Grand Riviere. Anthropogenic activities are considered to have significant impacts on turtle nesting and this may be a particular problem for Turtle Beach. As such, research and implementation of management and regulatory strategies should be addressed with urgency. Conclusions The morphology and sediment composition of both Turtle Beach and Grande Riviere have changed over the past 20 years. Reductions in beach width, elevation and area have been noted for both beaches and

52
sediment analyses revealed larger mean grain size composition at Turtle Beach than noted 10 years previously. Specifically, this beach was found to be medium to coarse grained, and moderately well sorted. Grande Riviere has coarse grained sand throughout the entire beach and changed from being moderately well sorted to well sorted. These changes may be related to natural and seasonal patterns of sediment erosion and accretion. The changes may also be enhanced by changes in beach dynamics and bathymetry as a result of sea level rise associated with climate change.
Both beaches are steep, high‐energy locations, which are characteristics preferred by nesting turtles. More turtles however, nest on Grande Riviere than on Turtle Beach. Grande Riviere, when compared to Turtle Beach, has higher energy, is narrower and steeper, and has coarser, better‐sorted sands.
In addition to morphological and sediment changes, other factors, not examined in this study, may affect nesting activities. These include presence of vegetation, infrastructure, photo‐pollution, pollution from run‐off and litter. Much more research, therefore, is required to determine the cause for differences in nesting activities between the two beaches. Acknowledgements Above all, I thank God for guiding me with his grace and glory. I thank for their support, my parents and family who worked hard alongside me as my team on the field, and Mr. Shiva Heerah who lent support and assistance in the analytical component of this research. I also thank the Institute of Marine Affairs, namely Mr. Lester Doodnath and Mr. Sunil Ramnath. Many thanks to the Wildlife Division, SOS Tobago and Mr. Giancarlo Lalsingh‐all for providing me with data that was vital to the completion of this research. Many thanks are extended to all the Life Sciences and Soil Sciences staff who assisted especially the laboratory technicians; Raj, Dexter and Anton, Dr. Wuddivira, Dr. Eudoxie, Professor Shaw and Ms. Atwell. References Abreu‐Grobois, A. and Plotkin, P. 2008. Lepidochelys olivacea. In: IUCN 2010. IUCN Red List
of Threatened Species. Version 2010.4. Accessed from www.iucnredlist.org 23/11/2010 Analytical Software. 2000. Statistix 7. Tallahassee, Florida, USA. Anthoni.J.F 2000. Disappearing Beaches: drying in the tide accessed from
http://www.seafriends.org.nz/oceano/beachdry.htm (17.11.2010) Bacon. P.R.,1973. The Orientation Cycle in the beach Ascent Crawl of the Leatherback Turtle
Dermochelys coriacea, in Trinidad. Herpetologica, Vol. 29, pp343‐348

53
Bird. C.F. Eric, 2008.Coastal Geomorphology: An Introduction 2nd Edition, John Wiley and Sons Ltd.England. pp 174
Butler.K.R., 1998.Coastal Protection of Sea Turtles in Florida. Florida State University Journal of land Use and Environmental Law accessed from http://www.law.fsu.edu/journals/ landuse/ vol132/butl.htm
Clovis, T.2005. SOS Tobago Annual Report March – November 2005, Save Our Sea Turtles (SOS), Tobago
Clovis, T., 2006. Save our Sea Turtles Summary Report 2006, Save our Sea Turtles (SOS), Tobago
Demetropolos. A.. 2002 ed. Colloquy on Marine and Coastal Ecological Corridors; proceedings Llandudno 20‐21 June 2002. Council of Europe Publishing, pp 98
Earnst C., Lovich J., 2009.Turtles of United States and Canada, The John Hopkins University Press, pp 87
FAO, 2004. Papers presented at the expert consultation on interactions between sea turtles and fisheries within an ecosystem complex, FAO Fisheries Report No. 738
Lancaster. N, 1995. Geomorphology of Desert Dunes. Routledge, London.pp 105 Gallegos.J., Fish.M., Drews. C. 2009. Temperature Monitoring Manual World Wildlife Fund
(WWF),Central America accessed from http://assets.panda.org/downloads/ temperature_manual_one_pager__final__1.pdf (20.10.2010)
Hendrickson and Balasingam, 1966 in Pritchard. P.C.H.1971. The Leatherback or Leathery Turtle Dermochelys coriacea. IUCN Switzerland.pp17‐20
Horrocks, J.A. and N.M. Scott, 1991. Nest site location and nest success in the hawksbill turtle Eretmochelys imbricata in Barbados, West Indies. Marine Ecology Progress Series 69:1‐8
Institute of Marine Affairs (IMA). 2004. A Guide to Beaches and Bays of Trinidad and Tobago,. Institute of Marine Affairs, pp 80‐87
Institute of Marine Affairs Grain Size analyses and Profile Data (unpublished) Karavas.N., Georghiou.K.,Arianoutsou.M.,Dimopolous.D.,2005.Vegetation and Sand
Characteristics influencing nesting activity of Caretta caretta on Sekainia Beach, Biological Conservation 121, pp 177‐188
Karleskint.G., Turner.R., Small. J. 2010. Introduction to Marine Biology.Brooks/Cole Cengage Learning.U.S.A.pp 375
Kenny.J.S., 2008. The Biological Diversity of Trinidad and Tobago: a naturalists notes. Prospect Press, Port‐of Spain.pp 164.
Knödel. K., Lange. G., Voigt Hans‐Jürgen. 2007. Environmental geology: handbook of field methods and case studies. Springer Verlag Berlin Heidelberg, pp710‐724
Lalsingh G. 2008 Summary Report of marine Turtle Nesting Activity 2008 Save our Sea‐turtles (SOS) Tobago,
Lalsingh G, 2010. Summary of Marine Sea Turtle Activity 2010. Save our Sea‐turtles (SOS). Tobago
Law. A, Clovis, T, Lalsingh. G.R. and Downie J. R 2010 The Influence of Lunar, Tidal and Nocturnal Phases on the Nesting Activity of Leatherbacks (Dermochelys coriacea) in Tobago, West Indies. Marine Turtle Newsletter 2010.
Lee Lum.L, 2005. Beach dynamics and nest distribution of the leatherback turtle (Dermochelys Coriacea) at Grande Riviere Beach Trinidad and Tobago, International Journal of Tropical Biology 53:239‐248.
Marine Turtle Specialist Group 1996. Caretta caretta. In: IUCN 2010. IUCN Red List of Threatened Species. Version 2010.4.accessed from www.iucnredlist.org (23.11.10)
Mc. Lachlan. A., Brown. A.C., Brown, Alexander.C.,2006. The Ecology of Sandy Shores. Elsevier Incorporated, U.S.A. pp 215‐218

54
Ministry of Land, Housing and the Environment, Wildlife Section, 1999‐2007. Nesting Data (unpublished)
National Research Council (U.S.) Committee on Sea Turtle Conservation, 1990.Decline of the sea Turtles: Causes and Prevention. National Science Academy
Pfannkuch. H.O., Paulson, R.n.d Grain size distribution and hydraulic properties accessed from http://faculty.njcu.edu/wmontgomery/Coastal_Zone/
Grain%20Size%20Distribution.htm (01.09.2010) Pinet.R.Paul,2003.Invitation to Oceanography 3rd Edition. Jones and Bartlett Publishers,
London, U.K. pp 368 Pritchard. P.C.H.1971. The Leatherback or Leathery Turtle Dermochelys coriacea. IUCN
Switzerland.pp17‐20 Sand Grain Size Analysis. University of New England. Accessed from
http://faculty.une.edu/cas/szeeman/oce/lab/sediment_analysis.pdf (21.06.2010) Seminoff, J.A. 2004. Chelonia mydas. In: IUCN 2010. IUCN Red List of Threatened Species.
Version 2010.4. Accessed from www.iucnredlist.org> (23.11.2010) Shatzel and Anderson, 2005.Soil: Genesis and Geomorphology, University Press, Cambridge,
pp 17 Schwartz.M.L.2005 Encyclopaedia of Coastal Science, Springer.Netherlands pp178 Singh, B., 1997a: Climate‐related global changes in the southern Caribbean: Trinidad and
Tobago. Global and Planetary Change, 15, 93‐111. Singh, B., 1997b: Climate changes in the greater and southern Caribbean. International
Journal of Climatology, 17, 1093‐1114. Varelda‐Acevedo.E., Eckert K.L., Eckert.S. Cambers.G., Horrocks.G.A.,2009. Sea Turtle
Nesting Beach Characterization Manual, p.46‐97. In:Examining the Effects of Changing Coastline Processes on Hawksbill Sea Turtle(Eretmochelys imbricata) Nesting Habitat, Master’s Project, Nicholas School of theEnvironment and Earth Sciences, Duke University. Beaufort, N. Carolina USA. pp 97
Wilson. E.G, Miller. K.L., Allison. D., Magliocca. M. n.d. Why healthy oceans need sea turtles: the importance of sea turtles to marine ecosystems. Accessed from http://na.oceana.org/sites/default/files/reports/Why_Healthy_Oceans_Need_Sea_Turtles.pdf (06.12.2010)
Xie Z., Wang. Y., Cheng G., Malhi S.S., Vera C.L., Guo. Z., Zhang .Y.,2010.Particle‐size effects on soil temperature, evaporation, water use efficiency and watermelon yield in fields mulched with gravel and sand in semi‐arid Loess Plateau of northwest China. Agricultural Water Management, Vol 97:6,pp 917‐923

55
Spatial Distribution of intertidal benthic macrofauna in three sandy beaches in Trinidad
Lanya Fanovich1, 2, Howard P. Nelson2 and Andrew Lawrence2
2Department of Life Sciences, The University of the West Indies, St. Augustine, Trinidad,
West Indies. Email: [email protected] 1 Corresponding Author
Abstract While sandy beaches in Trinidad and Tobago are important recreational areas, they are often perceived as ecological deserts, since most of the organisms in these habitats are inconspicuous. However, these beach habitats can be biologically diverse, and their fauna, while inconspicuous, is potentially susceptible to anthropogenic disturbance. This study investigated the spatial distribution of the benthic macrofauna in the intertidal zone on the beaches of Salybia, Guayaguayare and Chagville, Trinidad, between June and August 2010. Five transects were sampled on each beach, at 50m intervals. Benthic and sediment samples were taken at the high, mid and low tide levels on each transect. Descriptive and multivariate analyses revealed that all three beaches varied in the length of their intertidal zone, slope, grain size composition and pH. Of these, pH and grain size may have the greatest influence in the patterns found. Salybia and Guayaguayare were different from each other whilst Chagville shared biotic similarities with both these beaches. Species abundance was highest at low tide for Guayaguayare and Chagville and at the drift‐line for Salybia. The deposit feeder and filter feeder guilds of polychaetes dominated each intertidal zone. Nereis sp. was the only carnivore present in the mid‐tidal zones of Salybia and Chagville. Spionid polychaetes were the dominant species in the mid‐tidal and low water mark in Guayaguayare and Chagville. Key words grain size, intertidal zonation, Nereis, pH, salinity, tropical coastlines Introduction Sandy beaches have often been described as “ecological deserts” due to their lack of visible fauna and flora. However, a large percentage of a sandy beach’s diversity is found in the sand. These organisms are small, inconspicuous and often found in high densities (Brown and McLachlan 1990, Jones et al. 2004, Schlacher et al. 2008, Defeo et al. 2009,

56
Pallewatta 2010). Invertebrates in the intertidal zone may be classified as either meiofauna or macrofauna. Meiofauna are those invertebrates that are smaller than 0.5mm while macrofauna are those species larger than 0.5mm (Jones et al. 2004, Pallewatta 2010). Polychaete worms, bivalve molluscs and crustaceans have been previously described as the dominant macroinvertebrates of sandy beaches and their intertidal zones (Jones et al. 2004, Nybakken and Bertness 2005, Defeo et al. 2009).
The intertidal zone is a transition between the marine and terrestrial ecosystem, and as a result is a harsh environment for many organisms due to the fluctuation of environmental conditions caused by tidal movement. As a result, this zone displays the highest variability in environmental conditions compared with any other marine environment (Nybakken and Bertness 2005).
While, several authors have proposed intertidal zonation schemes (Jaramillo et al. 1993, Jaramillo and McLachlan 1995, Barros et al. 2001, Defeo and McLachlan 2005, Neves and Bemvenuti 2006), most intertidal zones exhibit similar community assemblages. Unlike rocky shores, sandy shores do not have easily identifiable zones, and the distribution of macrofauna can be patchy. Particle size, wave action and slope are the important defining factors of sandy shore ecosystems, affecting distribution of organisms (Jaramillo and McLachlan 1993, Jaramillo et al. 1993, McLachlan 1996, Ricciardi and Bourget 1999, Nybakken and Bertness 2005).
It has been proposed that intertidal zonation allows organisms to avoid interspecific competition while feeding in the harsh conditions present in sandy shores (Newell 1979). However, the space provided by sandy shores makes overcrowding unlikely. In addition, motility allows the organisms to avoid interspecific competition unlike most sessile organisms on rocky shores (Nybakken and Bertness 2005). Most species are opportunistic feeders rather than obligate feeders. As a result, competition for food is unlikely (Nybakken and Bertness 2005).
Most information on sandy beaches comes from research in the temperate zone and in the case of tropical coastlines, there is a dearth of research in these areas, particularly the southern Caribbean (Gobin 2010). Published coastal benthic studies conducted in Trinidad and Tobago’s sandy beaches rarely attempt to place the macrofauna into zones, and no published comparative studies of these beaches are known. This study addressed this information gap, by comparing zonation in three sandy beaches. The observed zonation patterns were then compared to the generalised scheme proposed by Brown and McLachlan (1990) to determine its applicability to Trinidad and Tobago.

57
Materials and methods Study Site Three sandy beaches on the island of Trinidad were sampled during the low spring tide. Salybia Bay, on the northeast coast of Trinidad, was sampled on June 7th to 8th, 2010. Guayaguayare Beach, on the south coast, was sampled between the 14th and 15th July 2010. The final sampling site was Chagville Beach located on the western coast, which was sampled between the 8th and 9th of August, 2010 (Figure 1).
Figure 1. Location of Salybia, Chagville and Guayaguayare sandy beach sampling sites, Trinidad. (Source: Adapted from Institute of Marine Affairs 2004)
Salybia Bay is approximately 700m in length, and is exposed to the northeast trade winds and subjected to high wave energy. The eastern part of the beach is protected by a fringing reef, and the beach sediment is coarse‐grained and composed of quartz and carbonate particles (Institute of Marine Affairs 2004, Office of Central Statistics, 2007). Guayaguayare Bay is influenced by moderate energy waves and riverine output from the nearby South American mainland. It is more than 5km in length and composed of brown fine‐grained quartz sand (Institute of Marine Affairs 2004, Office of Central Statistics 2007). Lining the coastline is a seawall approximately 1.5m in height and 30m from the low‐water mark, upon which many houses are built.
N

58
Facing the Gulf of Paria, Chagville is one of the beaches making up Carenage Bay and like Salybia, is frequented by visitors. It is a 600m long man‐made beach composed of sand, gravel and broken coral. On the eastern side of this beach, the mangrove‐lined Cuesa River, empties freshwater into the bay (Institute of Marine Affairs 2004, Office of Central Statistics 2007). Data collection The methodology of Jaramillo, McLachlan and Coetzee (1993) was adapted for this study. Five transects, 50m apart were sampled at each beach, with random selection of the location of the initial transect. At each transect, topographical profiles were taken from the top of the scarp at each beach to the waterline at low tide (Neves and Bemvenuti 2006). The profiles were measured using a Sokkisha TM6 optical theodolite. GPS readings were taken at sampling stations at the high tide drift‐line, the low‐water mark and mid‐way between these two points using a Garmin GPSmap 76S handheld GPS. Three samples of benthic macroinvertebrates were taken at each station, on each transect, amounting to forty‐five samples from each beach. Samples were taken using a 15cm diameter (0.02m2) PVC corer, pushed to a depth of 25cm, or as deep as possible (Neves and Bemvenuti 2006, Schlacher et al. 2008). The first sample at each station was taken at the point of topographical measurement. The remaining two samples at each station were taken 1m to the left and 1m to the right of the first sample (Neves and Bemvenuti 2006). The samples were then sieved using a 1.0mm metal mesh. The residue was transferred to Ziploc™ bags, containing 10% formalin fixative, to which Rose Bengal stain was added (Neves and Bemvenuti 2006, Schlacher et al. 2008). The organisms found were identified to the lowest taxonomic unit and quantified to determine density of individuals per square meter (Neves and Bemvenuti 2006).
Water temperature, salinity, pH and conductivity were recorded in triplicate at each transect, at the time of biological sampling, using a YSI63 meter. In addition, one sediment sample was collected at each sampling station for sediment analysis. The sample was collected as previously described but to the left of the middle benthic sample. In total, three sediment samples were collected per transect at high, mid and low water. In the laboratory, the sediment was dried in an oven for twenty‐four (24) hours between 80°C and 85°C. The dried sediment was then sieved using graduated sieves ranging from mesh size of 4mm to 63μm, such that six (6) sediment fractions were obtained. Each fraction was weighed to determine its proportion in the sample.

59
Data analysis Analyses were performed using descriptive statistics and PRIMER v5 (Clarke and Warwick 2001) for multivariate analyses. A fourth‐root transformation of biological density data was conducted and Bray‐Curtis similarity and non‐metric multidimensional scaling (nMDS) analyses used to determine relationships between the biological communities sampled (Clarke and Warwick 2001).
Square root transformation was initially performed on the grain size data and subsequently a principal components analysis (PCA) of all environmental variables was then undertaken. To test for colinearity among the environmental variables a draftsman plot was produced, in order to remove any variables which were highly‐correlated. In order to link the biological patterns from the nMDS to the environmental patterns from the PCA, a BIO‐ENV analysis was undertaken, to determine which combination of environmental variables best explained the biotic pattern (Clarke and Ainsworth 1993, Clarke and Warwick 2001).
To determine horizontal and vertical zonation patterns within each beach, the densities extrapolated to individuals per square meter (ind. m‐
2) was used. Those species that were present in the highest densities among the sampling stations were considered as dominant and therefore representative of the different zones. Results Topographical profiles, grain size and basic environmental characteristics showed that each beach was highly variable. The steepest slopes were found at Salybia, whereas Guayaguayare was much flatter. Salybia also had the shortest intertidal distance while Guayaguayare’s intertidal zone was much longer than the other two beaches. Profiles of Chagville and Salybia were highly undulating unlike Guayaguayare’s almost even surface. Chagville was extremely uneven in the length of its intertidal zone, unlike the other two sites.
Sediment texture varied immensely between the three sites. The largest grain size found at all 3 beaches was between 501μm and 2.36mm (Figure 2), which is classified as very coarse to coarse‐grained on the Wentworth Scale (Institute of Marine Affairs 2004). Salybia and Chagville had mostly cobble and coarse‐grained sand, while Guayaguayare had a higher proportion of medium to fine‐grained sand.

60
Figure 2. Comparison of proportion of each grain size category from Salybia, Guayaguayare and Chagville beaches, Trinidad
The grain size composition at each tidal level also varied within the
beaches. At mid‐tide levels, coarse grain size greater than 501μm, accounted for over 50% of the sediment at Guayaguayare (60.3%) and Chagville (81%). The high tide levels at both beaches were comprised mainly of the medium to finer‐grained sand. Chagville and Guayaguayare differed in the grain size proportions at the low tidal region, however, with Chagville predominantly cobbly (76.1%), whereas Guayaguayare was mostly medium to fine‐grained (59.4%). In contrast, Salybia had an almost equal distribution of coarse‐grained sediment across all three tide levels, with over 80% of the sediment greater than 501μm.
Temperature, pH, conductivity and salinity of the water were largely similar between beaches, with the exception of salinity and conductivity in Chagville in which there was a sharp decrease in both variables at Transect 5.
The PCA ordination of abiotic parameters showed tight clustering among the stations at each beach, suggesting that very little variation occurred within the sites at each beach (Figure 3). Chagville and Guayaguayare’s environment, while quite distinct from each other, still had higher level of similarity to each other than to Salybia. At Chagville, Transect 5 (C5) showed deviation due to extremely low salinity (0.13ppt) and conductivity (0.387ms).
‐0.1000.0000.1000.2000.3000.4000.5000.600
Proportion
Grain size
Salybia
Guayaguayare
Chagville

61
Figure 3. Principal component analysis ordination of abiotic factors on each transect on sandy beaches at Salybia, Guayaguayare and Chagville, Trinidad
The test of colinearity between environmental variables, revealed no
colinearity between any pair of environmental parameters.
Figure 4. Number of species of each phyla found in the intertidal zone of the three beaches at Salybia, Guayaguayare and Chagville, Trinidad
A total of forty‐one macroinvertebrate species were identified during this study. The phylum Annelida, represented by polychaete worms, was the most species rich group (Figure 4), with most species being found in
02468101214
Number of species
Phyla
Salybia
Guayaguayare
Chagville

62
Chagville. Only at Salybia was this group surpassed in richness by the arthropods, consisting of isopods and amphipods with eleven species, in comparison to ten species of annelids. Porifera and Cnidaria were also present only at Salybia.
Figure 5 Comparison of the density of macroinvertebrates found at Salybia, Guayaguayare and Chagville beaches, Trinidad (Density =number m‐2).
Despite the presence of more phyla in Salybia, this beach only had 36.2 individuals m‐2 (
Figure 5) in comparison to Guayaguayare which had fewer species but at a density of 57.56 individuals m‐2. The organisms exhibited a preference for the mid‐tidal level and the low‐water mark at Chagville and Guayaguayare. However, Salybia had a higher density of macroinvertebrates at the drift‐line (54.04 ind m‐2) and the lowest density was at the low‐water mark (21.37 ind m‐2).
Non‐metric multidimensional scaling (nMDS) analysis of the intertidal macrobenthos showed that Salybia and Guayaguayare had distinct community assemblages whilst Chagville shared similarities with both other beaches (Figure 6). Specifically, the composition at the Chagville drift‐line was similar to that at Salybia, while the mid‐tidal level and low‐water mark of Chagville was similar to that at Guayaguayare. The species assemblages at the drift‐line of all three beaches were markedly different from the other tidal ranges in the intertidal zone. It can therefore be deduced that there were at least two zones present at each beach, with very little distinction between the mid‐level and low‐water mark.
36.20
57.56
36.28SALYBIA
GUAYAGUAYARE
CHAGVILLE

63
The BIO‐ENV analysis suggested that pH and grain size had the highest correlation of (0.728) with the biotic data. Thus, these two environmental variables accounted for the majority of the pattern produced by the nMDS. The pH levels were mostly constant within the beaches but different among the sampling sites. Chagvillle’s pH was much lower than the more alkaline levels at Salybia and Guayaguayare.
Figure 6. Non‐metric multidimensional scaling (nMDS) of intertidal macroinvertebrates in the sampling stations of the three beaches at Salybia (s), Guayaguayare (G) and Chagville (C), Trinidad. H = high water, M = mid water and L = low water.
The distribution of species on each beach indicated that at least two juxtaposed zones shared similar dominant species. However, at least one or two species were found that distinguished each zone (Table 1). Chagville and Guayaguayare both had Spionid polychaetes dominating the mid‐tidal level and low‐water mark. Polychaete worms were the dominant fauna present at these two beaches. However, Salybia showed a greater diversity across different phyla. The amphipod Parhyale hawaiensis was the sole dominant species at the low‐water mark. While each zone had at least one dominant species, the drift‐line in Guayaguayare was an exception, with no dominant species and very few invertebrates in this zone.
All three beaches had an almost equal proportion of polychaete species among the various feeding guilds. Salybia had eight deposit‐feeders, Guayaguayare’s seven and Chagville ten. Filter feeders were very

64
uncommon with one species each at Salybia and Guayaguayare and two at Chagville. Herbivorous polychaetes were absent in Guayaguayare. However, Salybia and Chagville had two herbivore species. This was also the case for the carnivorous species at these two beaches. Guayaguayare had a single carnivore species present. Some species of polychaetes occupied more than one feeding guild such as the spionid polychaetes, Nereis spp. and Lumbrineris spp.
Sampling Stations Zones* Sampling sites
Salybia Guayaguayare Chagville High tide (driftline)
High Intertidal Zone
Notomastus sp. Nematodes sp.
No species dominant
Unidentifiable juvenile polychaetes
Mid‐tidal Mid Intertidal Zone
Nematodes Nereis sp. Sipunculid 2
Spio 1 Donax denticulatus
Nereis sp. Apoprionospio sp. Unidentifiable juvenile polychaetes
Low‐water mark Low Intertidal Zone
Parhyale hawaiensis
Spio 1 Spio 1 Nereis sp. Capitella sp. Prionospio
Table 1. Zonation of macroinvertebrates in the intertidal zone based on density (ind. m‐2) *Zones as modified from Souza Filho et.al.(2003) Discussion This study investigated whether intertidal zonation patterns were present on the three beaches of Salybia, Guayaguayare and Chagville in Trinidad. The results appear to support this hypothesis with two distinct zones apparent, based on dominant species. In addition, each beach appeared to support a different composition of macrofauna in its intertidal zone, with respect to the species present and their trophic level.
Several authors have proposed that grain size may influence beach slope, with coarse‐grained sediment more likely to produce a steeper slope than fine‐grained sediment (Jaramillo et al. 1993, Knox 2000, Rodil and Lastra 2004, Nybakken and Bertness 2005, Wieser Undated). This was found to be the case for Salybia and Guayaguayare. Salybia had a steeper slope than Guayaguayare and comprised mostly of coarse‐grained sand and cobble. This may in turn affected the length of the intertidal zone. Thus, the steeper the slope of the beach, the higher the proportion of coarse‐grained sand and the shorter the length of the intertidal zone.

65
The BIO‐ENV indicated that grain size had an influence on the biotic pattern produced by the nMDS. A predominantly coarse‐grained beach is more porous than fine‐grained beaches. Therefore, water cannot be retained, leaving intertidal invertebrates susceptible to desiccation. This coarse‐grained sand is also unfavourable for burrowing organisms. However, this does not negate the possible influence the other variables such as nutrients, salinity, and oxygen content of the sediment, on the species assemblages. For example, the large decrease in the salinity and conductivity levels measured at site C5 in Chagville may have occurred due to the proximity of the transect to the Cuesa River, which empties a substantial volume of freshwater into the bay. Despite this, however, the biota found at this transect was not affected suggesting their tolerance to the freshwater. This was not surprising since some of these species have been found in estuaries that have brackish water.
Salybia had the highest proportion of coarse‐grained sand and the highest species diversity. Yet it had the lowest number of individuals m‐2. While there was a significant number of species of polychaetes present, the number of crustaceans was much higher than at the other beaches. The isopods may be better suited to moving through the coarse‐grained sand and cobble as well as more tolerant of the low interstitial water within in the intertidal zone.
Guayaguayare had the highest proportion of fine‐grained sands, with extremely low species diversity, but a density of individuals that was much higher than Chagville and Salybia. It is possible for some species dominance to occur in beaches, because of enrichment and other factors. This may favour the proliferation of the species. The Spionid polychaete species were notably absent from Salybia, yet highly abundant at the other two sites. It is quite possible that this family of polychaetes prefer fine‐grained sediment. Low salinity and conductivity levels may also be desired. The same conditions may be preferred by bivalve molluscs such as Donax denticulatus, which was found only at Guayaguayare in this study. There was a significant lack of bivalves in Salybia with the exception of a single Diplodonta punctata.
The sipunculid worms were rock or coral borers. This diagnostic feature may readily explain their absence from Guayaguayare due to the lack of cobble or broken coral. However, they might have been expected in Chagville, since there were quite a number of coral fragments at this site. Higher salinity may be an important factor accounting for their presence in Salybia than Chagville, despite both beaches having a river feeding into the saline waters. Another reason for the absence of

66
sipunculid worms from Chagville, is that this phylum maybe sensitive to wastewater and other contaminants.
Nereis was also absent from Guayaguayare. This polychaete has parapodia that are modified to allow them to negotiate the surface of the coarse‐grained sand and cobble. The very unstable nature of the fine‐grained sediments in Guayaguayare may not be ideal for this species.
The similarities in Chagville’s environment to the other two beaches may have allowed it to have species shared by both beaches. In short, the varying conditions of the beaches possibly accounted for the presence and absence of different species. However, other factors that were not tested could have also influenced the presence of various species.
McLachlan and Jaramillo (1993) in reviewing zonation patterns in sandy beaches concluded that all zonation studies revealed three zones – supralittoral zone, littoral zone and the sublittoral zone. However, these zones are not spatially or temporally fixed and the fauna adjust with the daily changes in the shore gradient (Knox 2000, Nybakken and Bertness 2005). This movement caused by the waves and swash transporting sediment and organisms from one area to another causes the patchiness often found on sandy shores (Knox 2000, Nybakken and Bertness 2005). None of the organisms suggested by McLachlan and Jaramillo (1993) as diagnostic of the supralittoral zone, such as ocypodid crabs, talitrid amphipods and isopods (Brown and McLachlan 1990, Jaramillo et al. 1993, Knox 2000, Nybakken and Bertness 2005) were found at the three Trinidad beaches. This indicates that the supralittoral zone was not surveyed in this study. Future sampling above the drift‐line may yield some of the faunal families suggested by McLachlan and Jaramillo (1995 in Knox 2000), Nybakken and Bertness (2005).
The mid‐littoral zone contained different polychaete species including the Spionid species, and bivalves at Chagville and Guayaguayare. It has been previously suggested that this zone may have greater diversity than other zones in the intertidal area (Knox 2000). This study indicates that the polychaetes, identified as dominant species at these three study sites, were either deposit feeders or filter feeders. Deposit‐feeders are organisms that ingest sediment to obtain their nutrition and are abundant in fine sediments with a high clay and organic content (Fauchald 1979, Newell 1979, Knox 2000, Nybakken and Bertness 2005). The filter‐feeders on the other hand obtain their food in the form of phyto‐and zooplankton, detritus and organic particles, suspended in water. These polychaetes often proliferate in coarse‐grained sediment (Fauchald 1979, Newell 1979, Knox 2000, Nybakken and Bertness 2005).

67
The presence of these organisms may suggest the nature of the sediment at the three beaches. Salybia notably lacked dominant filter or deposit‐feeders, with the exception of Notomastus sp. in the high tide‐zone. Chagville and Guayaguayare, however, had some deposit‐feeders and filter‐feeders within the littoral zone. While the predominant grain size can be considered coarse‐grained, Guayaguayare and Chagville did have a much higher proportion of fine‐grained sand than Salybia. This may have allowed for the dominance of these two feeding guilds. Nereis was the lone carnivore that had some dominance in Chagville and Salybia, favouring the slightly drier conditions of the littoral zone.
One interesting feature in the distinction of feeding guilds was that some organisms occupied more than one feeding guild. Most of the polychaetes that display filter‐feeding or deposit‐feeding behaviours can switch between these two modes, based on flow rates of the water. These organisms were called interface feeders by Dauer et al. (1981 in Knox 2000). Other species like Nereis spp. which can be considered an omnivore (Fauchald 1979), may be opportunistic in nature and feed on any organic particles that may be available at the time.
Most intertidal zonation studies focus on vertical zonation patterns in which differences between the various zones are reported. However, very few studies have addressed horizontal spatial distribution within the sandy beach (Gimenez and Yannicelli 2000). The data in this study failed to detect any substantial difference on the longitudinal axis of the beaches studied.
Sandy beaches are important providers of ecosystem services to people but are sensitive to natural and anthropogenic disturbances. They create important functional links between primary producers and large consumers (McDermott 1983, Ricciardi and Bourget 1999, Jones et al. 2004, Defeo et al. 2009). Filter feeders feed on phytoplankton and grazers such as amphipods feed on stranded algae. Wastes from these organisms return to the environment as useable nutrients. Commercially important fishes feed on surface deposit‐feeders and filter‐feeders (Ricciardi and Bourget 1999, Jones et al. 2004, Defeo et al. 2009). While it is possible for a beach to recover from natural disturbances over time, anthropogenic degradation can become permanent (Linton and Warner 2003, Schlacher et al. 2008, Defeo et al. 2009, Pallewatta 2010).
Intertidal species tend to be sensitive to pollution and changes in their environment (Ulfig 1997, Salvo and Fabiano 2007, Defeo et al. 2009). Therefore, they can act as excellent biological indicators since they are mostly sessile or sedentary in nature, and easy to identify (Clarke and Warwick 2001, Fujii 2007, Schlacher et al. 2008). Diversity estimations in

68
benthic ecology have become increasingly important in regulatory policies and conservation decisions (Carney 2007, Schlacher et al. 2008). Consequently, studies on intertidal macrofauna can be beneficial to Trinidad and Tobago and the wider Caribbean, since they can provide an index to the condition of the beach environment (Linton and Warner 2003) and allow for improved coastal management strategies. In Trinidad and Tobago, approximately 80% of urbanised land is located within or adjacent to coastal areas and approximately 50% of the roads pass through coastal areas (Office of Central Statistics 2007).
Temporal benthic studies are particularly important for understanding the possible consequences that climate change may have on beach ecology (Saizar 1997, Sagarin 2003, Jones et al. 2004, Cambers et al. 2008, Schlacher et al. 2008, Defeo et al. 2009). While the full impact of climate change on sandy beaches remain unknown, some of the predicted changes include decreased physiological performance, geographic movement of fauna to cooler latitudes, increased invasive species, decreased diversity and densities, changing sediment supply and changing particle size and slope (Jones et al. 2004, Cambers et al. 2008, Schlacher et al. 2008, Defeo et al. 2009). In response to sea level rise, there may be an increase in hard‐engineering structures to protect coastlines and human settlements against the encroaching sea. This consequently prevents the migration of the beach and thus reduces available beach habitat. This may in turn affect the assemblage of fauna present on the beach (Sobocinski 2003, Dugan and Hubbard 2006, Dugan 2008, Schlacher et al. 2008, Defeo et al. 2009).
At Guayaguayare, the high tide level was established at the base of the sea wall. Macrofauna was noticeably absent at this site. Observations during this study suggest that coastal squeeze may already be taking effect at this site. However, further research is required to demonstrate this effect. Conclusion Differences in the richness and abundance of benthic macrofauna in the intertidal zone at Salybia, Guayaguayare and Chagville appear related to different abiotic environments at each beach. Among the environmental variables sampled, pH and grain size may have the greatest influence in the patterns found. Each beach had a different vertical zonation pattern, which was consistent with the intertidal zone in the generalised scheme proposed by Jaramillo and McLachlan (1993). No horizontal zonation was found and it was assumed that the data collected might not have been

69
adequate to show a clear pattern. The information produced from this study can form the baseline to future temporal studies, which can be beneficial to Trinidad and Tobago and assist in assessing the state of local beaches and developing suitable management strategies to counter damaging effects on the coastlines. Acknowledgements The primary author would like to give special thanks to her parents who assisted with much of the field and lab work as well as Kerron Castillo. Thanks also to Mark Charran and Shiva Maharaj for giving their time when possible to assist in processing the benthic samples for identification. Thanks to Anuradha Singh, Professor John Agard and Dr. Judith Gobin for their assistance with the identifications of the benthic organisms, invaluable comments and advice. The assistance of Rajesh Ragoo for his support with data analysis is gratefully acknowledged. The assistance of Raabia Hosein, Rajindra Mahabir, Christine Fraser, Anton Manoo, Professor Paul Shaw and Melissa Atwell in the acquisition of all equipment and materials utilised for this study, is gratefully acknowledged. Special thanks to Lee Ann Beddoe for her help and patience with various aspects of this project. Final thanks to all those who encouraged, motivated and supported the primary author during the research. References Barros F, Borzone CA, Rosso S (2001) Macroinfauna of six beaches near Guaratuba Bay,
southern Brazil. Brazilian Archives of Biology and Technology 44:351‐364 Bousfield EL, Quesnel VC (1989‐1990) The beach fleas and sandhoppers (Amphipoda;
Talitirdae) of Trinidad. Living World Journal of Trinidad and Tobago Field Naturalists' Club:43‐45
Brown AC, and McLachlan A (1990) Ecology of sandy shores, Vol. Elsevier, Amsterdam Cambers C, Claro R, Juman R, Scott S (2008) Climate change impacts on coastal and marine
biodiversity in the insular Caribbean. Report No. 382, CANARI Carney R (2007) Use of Diversity Estimations in the Study of Sedimentary Benthic
Communities. In: Oceanography and Marine Biology. CRC Press Clarke KR, Ainsworth M (1993) A method of linking multivariate community structure to
environmental variables. Marine Ecology Progress Series 92:205‐219 Clarke KR, Warwick RM (2001) Change in marine communities: an ecological approach to
statistical analysis and interpretation, Vol. PRIMER‐E, Plymouth Defeo O, McLachlan A (2005) Patterns, processes and regulatory mechanisms in sandy
beach macrofauna: a multi‐scale analysis. Marine Ecology Progress Series 295:1‐20 Defeo O, McLachlan A, Schoeman DS, A. ST, Dugan J, Jones A, Lastra M, Scapini F (2009)
Threats to sandy beach ecosystems: A review. Estuarine, Coastal and Shelf Science 81:1‐12
Dugan J (2008) Ecological effects of coastal armouring on sandy beaches. Marine Biology 29:160‐170

70
Dugan JE, Hubbard DM (2006) Ecological responses to coastal armouring on exposed sandy beaches. Shore and Beach 74
Fauchald K (1979) The diet of worms: a study of polychaete feeding guilds. Oceanographic Marine Biology Annual Review 17:193‐284
Fujii T (2007) Spatial patterns of benthic macrofauna in relation to environmental variables in an intertidal habitat in the Humber estuary, UK: Developing a tool for estuarine shoreline management. Estuarine, Coastal and Shelf Science 75:101‐119
Gimenez L, Yannicelli B (2000) Logshore patterns of distribution of macroinfauna on a Uruguayan sandy beach: an analysis at different spatial scales and of their potential causes. Marine Ecology Progress Series 199:111‐125
Gobin JF (2010) Free‐living marine polychaetes (Annelida) inhabiting hard‐bottom substrates in Trinidad and Tobago, West Indies. Rev Biol Trop 58:147‐157
Institute of Marine Affairs (2004) A guide to beaches and bays of Trinidad and Tobago. Institute of Marine Affairs
Jaramillo E, McLachlan A (1993) Community and population responses of the macrofauna to physical factors over a range of exposed sandy beaches in south‐central Chile. Estuarine, Coastal and Shelf Science 37:615‐624
Jaramillo E, McLachlan A, Coetzee P (1993) Intertidal zonation patterns of macroinfauna over a range of exposed sandy beaches in south‐central Chile. Marine Ecology Progress Series 101:105‐118
Jones A, Gladstone W, Hacking N (2004) Sandy‐beach ecosystems and climate change: potential ecological consequences and management implications. In: The Second Decade ‐ Coastal Planning and Management in Australia towards 2014 Proceedings of Coast to Coast 2004, Australia's 6th National Coastal Management Conference, 2004 April 19‐23, Hobart
Knox G (2000) Soft Shores. In: The Ecology of Seashores. CRC Press Linton DM, Warner GF (2003) Biological indicators in the Caribbean coastal zone and their
role in integrated coastal management. Ocean and Coastal Management 46:261‐276 McDermott IJ (1983) Food web in the surf zone of an exposed sandy beach along the Mid‐
Atlantic coast of the United States. In: McLachlan A, Erasmus T (eds) Sandy beaches as Ecosystems. Junk Publ., The Hague, p 579‐538
McLachlan A (1996) Physical factors in benthic ecology: effects of changing sand particle size on beach fauna. Marine Ecology Progress Series 131:205‐217
Neves FM, Bemvenuti CE (2006) Spatial distribution of macrobenthic fauna on three sandy beaches from northern Rio Grande do Sul, Southern Brazil. Brazilian Journal of Oceanography 54:135‐145
Newell RC (1979) Biology of Intertidal Animals, Vol. Marine Ecological Surveys Ltd., Kent Nybakken JW, Bertness MD (2005) Marine Biology: an ecological approach, Vol. Pearson
Education, Inc., San Francisco Office of Central Statistics (2007) First Compendium of Environmental Statistics Trinidad and
Tobago. In: Development MoPa (ed), Port of Spain Pallewatta N (2010) Impacts of Climate Change on Coastal Ecosystems in the Indian Ocean
Region. In: Michel D, Pandya A (eds) Coastal Zones and Climate Change. The Henry L. Stimson Center, Washington, p 3‐16
Ricciardi A, Bourget E (1999) Global patterns of macroinvertebrate biomass in marine intertidal communities. Marine Ecology Progress Series 185:21‐35
Sagarin RD (2003) A Checklist for Historical Studies of Species' Responses to Climate Change. In. CRC PRess
Saizar A (1997) Assessment of impacts of a potential sea‐level rise on the coast of Montevideo, Uruguay. Climate Research 9:73‐79

71
Salvo VS, Fabiano M (2007) Mycological assessment of sediments in Ligorian beaches in the northwestern Mediterranean: pathogens and opportunistic pathogens. Journal of Environmental Management 8:365‐369
Schlacher TA, Schoeman DS, Dugan J, Lastra M, Jones A, Scapini F, McLachlan A (2008) Sandy beach ecosystems: key features, sampling issues, management challenges and climate change impacts. Marine Ecology 29:70‐90
Sobocinski KL (2003) The impact of shoreline armouring on supratidal beach fauna of Central Puget Sound. MSc Thesis, University of Washington
Souza‐Filho, P.W.M.; Tozzi, H.A.M. and El Robrini, M. (2003) Geomorphology, land‐use and environmental hazards in Ajuruteua macrotidal sandy beach, northern Brazil. Journal of Coastal Research, 35, 580‐589.
Ulfig K (1997) General assessment of the occurrence of keratinolytic fungi in river and marine beach sediments of Caledonian waters (Spain). Water, Air and Soil Pollution 94:275‐287

72
Genetic Diversity and Structure of the Neotropical Monodominant Species Mora excelsa (Benth.) in Five
Naturally Fragmented Populations
Nigel Austin, Michael Oatham and Pathmanathan Umaharan
Department of Life Sciences, The University of the West Indies, St. Augustine, Trinidad, West Indies. Email: [email protected]
Abstract Mora excelsa is an evergreen Neotropical tree prized for its durable lumber, and the species is well known for its ability to form almost pure monodominant stands. In spite of this economic importance very little is known of its genetics characteristics. In this paper the genetic diversity and structure of five M. excelsa populations (four in Trinidad and one on the South American mainland) was examined using RAPDs. DNA from 100 leaf samples of M. excelsa was amplified with 9 decamer primers which yielded 113 RAPD markers, 78% of which were polymorphic. The populations exhibited varying levels of diversity with the Victoria‐Mayaro population in Trinidad having the highest diversity (%P = 64.6%, I = 0.376 ± 0.028 and UHe = 0.264 ± 0.020) and the most isolated population in Paria, Trinidad having the least (%P = 45.13%, I = 0.260 ± 0.028 and UHe = 0.182 ± 0.020). The AMOVA and Shannon Index partitioned the variation similarly, with greater variation found within populations than among populations, which is typical of Neotropical trees. These results suggest that there is significant differentiation between populations (Gst = 0.2535 and ΦPT = 0.210, P<0.001). However, the PCA, Nm and high similarity between populations suggests that this differentiation is recent. The data suggests that the two smaller Mora sp. populations in Trinidad were founded, and the two larger populations were heavily connected, by gene flow in the past. Key words percentage polymorphism, Shannon’s diversity, Trinidad, tropical tree, unbiased heterozygosity, Venezuela Introduction Tropical forests are regarded as amongst the world’s most biologically diverse and threatened terrestrial ecosystems (Myers, et al. 2000; Achard, et al. 2002; Mayaux, et al. 2005). The greatest threats to these forests are from the increasing demand for forest resources by growing

73
populations and the expansion of urban and agricultural areas (Murawski, et al. 1994; Wright 2005). These activities result in reduced forest area and subsequent fragmentation, which not only affect the functioning of biologically important processes carried out by forests but also the genetic diversity and survival of individual species (Achard, et al. 2002; Krishnapillay, et al. 2003; Schaberg, et al. 2008). The genetic consequences to tropical forests of smaller population sizes and fragmentation, are genetic drift and disruption of gene flow, both of which may lead to inbreeding and loss of alleles (Biscaia de Lacerda, et al. 2008). Additionally, in allogamous species, significant loss of genetic diversity and consequent inbreeding are associated with decreased productivity, fecundity and ability to respond to biotic and abiotic changes. Such changes may be disastrous, especially if the species is exploited as a natural resource (Hamrick 1994; Newton, et al. 1996; Young, et al. 1996).
Mora spp. (Fabaceae) is a genus of large trees consisting of seven species (Bisby et al. 2010). The species Mora excelsa is native to Guyana, the proposed centre of diversity, from where it is believed to have expanded to Suriname, Venezuela and Trinidad (Beard 1946). The tree produces valuable and durable timber used for industrial flooring, ship building, railroad and roof construction (Chudnoff 1984). Amerindians have also been known to use its seeds as a food source (Beard 1946).
This evergreen canopy species can exceed 40 m in height and has a girth of up to 3.6 m above the buttresses. In Suriname, Venezuela and Guyana M. excelsa forms mono‐dominant stands confined to alluvial floodplains near streams (Henkel, 2002). In Trinidad M. excelsa seems to have a wider topographical range as it colonizes hills and ridges (Beard 1946; Rankin 1978; Torti, et al. 1997). At maturity, M. excelsa produces spiked inflorescences each with numerous small white bisexual flowers. These flowers are produced on the terminal end of branches every 1.5 to 2 years. Flowering is asynchronous in most populations and usually occurs between January to April and later between July and September of the same year (ter Steege 1990). Vast quantities of large buoyant seeds each weighing up to 0.5 kg and 15 cm in length, usually fall about three months after flowering usually in the wet season (Beard 1946; ter Steege 1994). Seeds are water dispersed, but away from streams, they can germinate in the shade of the parent tree with low mortality (Beard 1946; Oatham and Jodhan 2002).
In Trinidad, M. excelsa is the most abundant tree species existing in naturally fragmented populations (Bell 1971) (Figure 1). The two largest populations in Trinidad, Victoria‐Mayaro and Matura, are believed to be

74
established by natural means whereas the other smaller populations (Paria and Cedros) may owe their existence to dispersal by man (Beard 1946). In Trinidad, M. excelsa usually out‐competes and decreases the presence of other common tree species to a density less than 15% (Beard 1946).
Much of the work done on M. excelsa has focused on its ecology, physiology and its management as a timber resource, while no information exists on the genetic diversity and population structure. The objectives of this study were to measure the genetic variation present within five populations of M. excelsa (four in Trinidad and one in Venezuela) and to determine how this diversity is structured and estimate the level of gene flow between populations. This information would allow for better decisions on its conservation and management.
Figure1 M. excelsa sample locations in Trinidad and South America
Methods Study populations and Laboratory Procedures Five populations, including four from Trinidad (Victoria‐Mayaro, Matura, Cedros and Paria) and one from Venezuela (Orinoco delta) were sampled (Figure 1 and Table 1). In Trinidad, the shortest distance between any two populations was 20 km. All Venezuelan samples were collected near the Caño Tucupita (Tucupita Canal) in the Orinoco Delta (small population).

75
Table 1 M. excelsa locations in Trinidad and Venezuela and population descriptions.
Population Coordinates Description Site Size ha)
Latitude Longitude Paria 10.78331 ‐61.2530 Mora forest *490 Matura 10.65917 ‐61.0774 Mora forest *10,000 Mayaro 10.20759 ‐61.1528 Mora forest *21,750 Cedros
10.11834 ‐61.7667 Disturbed Mora forest
*600
Caño Tucupita
9.4427 ‐61.6753
Single dispersed individuals and clumps with few individuals
**800
* Size based on Beard (1946) **Estimated from area surveyed
With the exception of the Orinoco and Cedros populations, all other samples were located in monodominant Mora forests. Individuals in the Orinoco delta were found in small patches of few individuals or as isolated individuals, while the Cedros population was highly fragmented with several individuals being found near small agricultural plots.
Young‐to‐fully expanded leaf samples from 20 Mora spp. individuals per population were collected. Individuals were sampled at least 20 m apart to minimize sampling of siblings and half siblings. The leaf samples were stored in ice during transport to the laboratory, and DNA isolated using the Kobayashi et al protocol (1998) with the following modifications: approximately 0.4g of leaf tissue was used for each extraction, and all extractions were carried out in 2mL micro centrifuge tubes. To the crushed tissue, 1mL of Buffer 2 together with 1.5% PVP was added. In addition, the β‐mercaptoethanol concentration of the buffer was increased to 0.2%. After incubation at 60oC, the sample was centrifuged for 5 minutes at 12,000 rpm and the supernatant decanted. The extracted DNA was re‐suspended overnight in 1 mL 50mM Tris: 10mM EDTA after which it was washed with a phenol: chloroform: isoamyl alcohol (25:24:1) mixture and again with chloroform. The supernatant containing the DNA was precipitated using 1/10 volume 3M sodium acetate pH 8 and an equal volume of ice‐cold isopropanol. The dried DNA pellet was re‐suspended in 50µL 10mM Tris: 1mM EDTA and quantified by spectrophotometry. Working dilutions were prepared in 10 mM Tris for further analysis.

76
Levi et al’s (1993) PCR protocol was optimized by addition of gelatin to the PCR mix. The mix contained 10.6 µl millipore water with 0.024% gelatin, 5 µl primer (3 ng/µl, Operon, U.S.A.), 3 µl DNA (0.15 ng/µl), 2.5 µl dNTP (2 mM, Gibco, U.S.A.), 2.5 µl Buffer (10x, Klentaq, AB peptides Inc, U.S.A.), 0.25 µl DNA polymerase (Klentaq, 25 U/µl, AB peptides Inc, U.S.A.) and was carried out in 25 µl reactions. PCR was carried out on a Techne Thermocycler (Techne Co. UK) with amplification conditions as follows: 94oC for 5 minutes, 37oC for 30 seconds, 72oC for 1 minute for 40 cycles and a final extension time of 72oC for 5 minutes. Twenty‐two microlitres of the amplified product were mixed with 3µL loading dye and separated on a 1.4% agarose gel containing 0.1 ng/mL ethidium bromide in 1X TBE buffer. The gel was run at 5 V/cm and photo documented using the UVP Imagestore 7500 Gel Documentation system (UVP Inc., U.S.A.). Data Analysis Reproducible amplicons were scored as present (1) or absent (0) for analysis. Genetic diversity was determined for each population, for all samples collected and for samples collected in Trinidad only. Three indices of diversity were calculated using GenAlEx version 6.3: percentage polymorphism (%P), Shannon’s diversity index (I), and unbiased heterozygosity (UHe) (Schlüter and Harris 2006).
The genetic structure within and among the study populations was explored via Analysis of Molecular Variation (AMOVA) (Excoffier, et al. 1992), using the GenAlEx v 6.3 software. Nei’s (1972) expected heterozygosity in the total population (HT) and the within‐population mean expected heterozygosity (HS) were also calculated using POPGENE v. 1.32. The coefficient of differentiation, Gst was calculated in POPGENE and gene flow, Nm estimated. Mantel (1967) tests using 9999 permutations were conducted between pair‐wise parameters to determine whether any relationship existed between population size and genetic diversity, geographic distance and genetic distance and geographic distance and divergence (Table 2).
Jaccard’s similarity coefficients were calculated for each population and a dendrogram was constructed using the neighbour‐joining in FAMD v 1.25 (Schlüter and Harris 2006). The phylogram visualized in FigTree v1.3.1 (Rambaut 2009). Principal coordinate analysis (PCoA) was also undertaken using the similarity and UPGMA algorithms in GenAlex version 6.3.

77
Results Genetic Diversity One hundred and thirteen RAPD reproducible amplicons were generated using the 9 primers for the six M. excelsa populations. The number of amplicons produced per primer ranged from seven in P14 to 25 in BO5 with an average of 12.5 amplicons per primer (Table 3). Table 2 Pair wise Nei’s genetic distance, ΦPT, and Geographic distance for Trinidad and mainland populations of M. excelsa.
Population 1 Population 2 Unbiased Nei’s genetic distance
ΦPT Geographic Distance (km)
Cedros Paria 0.925 0.250 92.594 Cedros Victoria‐Mayaro 0.889 0.166 68.001 Cedros Caño‐Tucupita 0.872 0.245 75.444 Matura Cedros 0.902 0.230 96.325 Matura Paria 0.876 0.252 23.617 Matura Victoria‐Mayaro 0.903 0.109 50.636 Matura Caño‐Tucupita 0.909 0.209 149.849 Paria Victoria‐Mayaro 0.914 0.205 64.624 Paria Caño‐Tucupita 0.881 0.272 155.485 Victoria‐Mayaro Caño‐Tucupita 0.900 0.172 102.390
Of the 113 RAPD amplicons, 94 (78.76%) were found to be
polymorphic among all the populations studied. The percentage polymorphism within populations ranged from 45% in Paria to 65% in Victoria‐Mayaro (Table 4). When considering all the individuals from Trinidad, there was more variation in the summed samples than any single population in Trinidad (Table 4). The trends observed for all diversity indices among populations were similar. In general, the smaller populations in Trinidad (Paria and Cedros) had lower diversity than the larger populations (Matura and Mayaro) with respect to all the diversity indices (Table 4). Although relatively small, the M. excelsa population in Caño Tucupita exhibited diversity levels similar to that of the much larger Matura population.
The genetic distance among M. excelsa populations estimated by the Nei’s Unbiased Genetic Identity index varied from 0.872 to 0.925. There was no significant (P > 0.05) correlation between pair‐wise geographic distance and PhiPT values for all populations (R2 = 0.0911) likewise between Nei’s unbiased genetic distance and geographic distance (R2 = 0.0005) based the Mantel test (Table 2).

78
Table 3. Oligonucleotide sequence and degree of polymorphism detected by primers in Trinidad and Venezuelan populations.
Primer NameNucleotide Sequence
No. Amplicons Scored
No. Polymorphic Amplicons
OPA‐08 5’GTGACGTAGG 8 8 OPB‐05 5’TGCGCCCTTC 25 19 OPB‐07 5’GGTGACGCAG 14 13 OPC‐16 5’CACACTCCAG 9 7 OPF‐09 5’CCAAGCTTCC 13 3 OPF‐12 5’ACGGTACCAG 8 7 OPP‐09 5’GTGGTCCGCA 11 11 OPP‐14 5’CCAGCCGAAC 7 7 OPG‐06 5’GTGCCTAACC 18 13
Table 4 Genetic diversity within populations of M. excelsa from Trinidad and the Venezuelan mainland. N = number of individuals sampled, #P = number of polymorphic markers, %P = percentage of polymorphism, I = Shannon Diversity Index and UHe = Unbiased Heterozygosity. SE = Standard Error.
Population N # P %P I (SE) UHe (SE)Paria 20 51 45.13 0.260 (0.028) 0.182 (0.020) Salybea 20 59 52.21 0.304 (0.029) 0.214 (0.021) Victoria‐Mayaro 20 73 64.60 0.376 (0.028) 0.264 (0.020)
Cedros 20 52 46.02 0.264 (0.029) 0.185 (0.021)
Orinoco Delta 20 57 50.44 0.293 (0.029) 0.207 (0.021)
Trinidad 80 86 76.11 0.444 (0.026) 0.306 (0.018)
All 100 94 78.76 0.453 (0.025) 0.311 (0.018)
The partitioning of the genetic variation by AMOVA suggested
significant (P < 0.001; 9999 permutations) genetic divergence among the populations (Table 5), although most of the variation was within populations. The results for Shannon Diversity Indices were similar (Table 6).

79
Table 5 Molecular variance (AMOVA) of six Mora excelsa populations from Venezuela and Trinidad.
Source df SS MS Est. Var. % Stat Value Prob
Among Pops 4 272.700 68.175 2.870 21.0 ΦPT 0.210 0.0001
Within Pops 95 1024.250 10.782 10.782 79.0
Total 99 1296.950 13.6551 100
The PhiPT value (0.210) obtained from AMOVA, which represents the average divergence among populations, was similar to the Gst value obtained from partitioning based Nei’s gene diversity (0.2535). All pair‐wise PhiPT comparisons derived from AMOVA were significant at the P<0.001 level, emphasizing a high degree of differentiation among these populations.
Table 6 Structuring of variation of populations of Mora excelsa in Trinidad and Venezuela measured using the Shannon Diversity and Nei’s Diversity Indices.
Shannon’s Index
All populations
Trinidad
Nei’s (1987) Gene Diversity
All populations (SE) Trinidad (SE)
Hpop 0.299 0.301 Hs 0.2050 (0.0250) 0.2059 (0.0259) Hsp 0.453 0.444 HT 0.2747 (0.0372) 0.2718 (0.0376) Hpop/Hsp 0.660 0.678 Gst 0.2535 0.2425
(Hsp ‐ Hpop)/Hsp 0.340 0.322 Nm 1.4723 1.5618
The PCoA showed that the individuals in the Victoria‐Mayaro
population could not be separated from the Matura population, while there was significant spatial separation evident with the other populations (Figure 2).

80
Figure 2 PCoA for five populations of M. excelsa studied using RAPD. In this regard, the Cedros population was proximal to the Victoria‐
Mayaro and Caño Tucupita populations on the PCoA plot, while the Cedros and Paria populations appeared as a continuum. The phylogram showed two bifurcating groups (Victoria‐Mayaro and Matura and Caño Tucupita and Paria) and between them was the Cedros population (Figure 3). The tree also suggests a high degree of similarity between the Victoria‐Mayaro and Matura population and between the Caño Tucupita and Paria population.
Figure 3 Unrooted phylogenetic tree of pair‐wise Jaccard’s similarity index values and neighbour joining among M. excelsa populations.
Axis 2
Axis 1
Matura
Cedros
Paria
Victoria‐Mayaro
Caño Tucupita

81
Discussion The M. excelsa populations in this study represent the northern most edge of the natural range of the species (Beard, 1946). Typically, island populations are generally thought to exhibit low genetic diversity since colonization events are believed to be followed by loss of variation by founder and bottleneck effects (Barrett and Shore 1989; Husband and Barrett 1991). Remarkably, for a population on the periphery of the species range and on an island, the diversity of M. excelsa in Trinidad was found to be high (%P = 76%). A similarly high genetic diversity (%P = 74%) has also been reported in another tropical forest tree species, Pterocarpus officianalis, in Trinidad. The diversity for M. excelsa (Shannon diversity index, Hsp = 0.453) in this study is similar to that reported for other Neotropical tree species including Cedrela odorata (Hsp = 0.450), Swietenia macrophylla (Hsp = 0.450), Plathymenia reticulata (Hsp = 0.396), Terminalia amazonia (Hsp = 0.380), Mabea fistulifera, (Hsp = 0.426) and Eremanthus erythropappus (Hsp = 0.455) (Gillies, et al. 1997; Gillies, et al. 1999; Lacerda, et al. 2001; Pither, et al. 2003; Goulart, et al. 2005; Freitas, et al. 2008). It can be concluded that the diversity exhibited by M. excelsa is high and is typical for long‐lived, outcrossing, Neotropical tree species (Dick, et al. 2003; Lemes, et al. 2003; Ruschel, et al. 2007; Cardoso et al. 1998; Santos et al. 2008).
The high diversity of M. excelsa present in Trinidad suggests that this species must have colonized the island with a relatively large founder population (Beard 1946). Unlike other islands in the Caribbean, Trinidad is a continental island, believed to have been part of the South American mainland as recently as 10,000 years ago (Kenny 2000). The fact that the seeds of this species show high mortality when exposed to sea water makes it unlikely that colonization occurred following the separation of Trinidad from the South American mainland (Beard 1946).
The lack of competition from other rain forest species and Trinidad’s seasonal climate seems to have provided ecological release for Mora species in Trinidad (Beard 1946), accounting for the large population size (e.g. Victoria‐Mayaro) and diversity. Further evidence for ecological release of Mora in Trinidad comes from the following observations: firstly, Mora forests have extended beyond their ancestral flat alluvial habitats and exist as large fasciations in Trinidad; secondly, M. excelsa densities in Trinidad are more than twice that found in Guyana and thirdly, M. excelsa is invading and outcompeting the species in the adjacent Carapa‐Eschweilera forest (Marshall 1939; Beard 1946; Oatham and Jodhan 2002).

82
Typically, in fragmented populations the amount of genetic diversity found within a population is proportional to its size (Travis, et al. 1996; White, et al. 1999; Lowe et al. 2003). This was observed in Trinidad, where the larger populations (Victoria‐Mayaro and Matura) were more diverse than the smaller populations (Paria and Cedros). The regression analysis of population size and genetic diversity also supported this hypothesis. Small isolated populations tend to be less diverse since they are prone to effects of inbreeding and genetic drift (Barrett and Kohn 1991; Ellstrand and Elam 1993). The high degree of monomorphism (> 50%) exhibited within the Paria and Cedros populations may represent founder effects, followed by genetic drift and inbreeding in these populations.
If the M. excelsa populations studied were panmictic, no divergence among populations would be expected. The significant population divergence among geographically isolated populations in this study therefore suggests restricted gene flow among populations. The lack of water‐ways between populations makes dispersal by seed unlikely. Furthermore, since the maximal distance travelled by pollinators of Neotropical trees is considered to be not more than 19km (Ward et al. 2005), pollen‐mediated gene flow between M. excelsa populations is also unlikely as the populations were at least 23km apart. Hence, it appears that gene flow between populations is restricted and presently the populations studied may be genetically isolated.
The results from the AMOVA showed that although there was significant divergence among the populations, most of the variation was due to diversity within populations rather than among populations. This is consistent with the general rule for woody tropical long‐lived species, in which insect pollination and allogamy are common (Hamrick, et al. 1992; Nybom 2004). The gene flow between these populations appears moderate (Nm = 1.4723), which is typical for tropical trees and is similar to other values reported for outcrossing animal‐pollinated species (Hamrick and Godt 1990).
The significant PhiPT and Gst values also suggest that the Mora populations were highly differentiated. Differentiation results from restricted gene flow between populations and can be quite strong in populations that have been fragmented or founded (Loveless and Hamrick 1984; Austerlitz et al. 1997). The lack of correlation observed in M. excelsa populations with respect to divergence and diversity and geographic distance suggests that historical and anthropogenic factors may have contributed to their current genetic structure (Castillo‐Cardenas, et al. 2005).

83
Phylogenetic analysis showed limited genetic divergence between the Victoria‐Mayaro and the Matura populations. The scatter plot from the PCoA showed that the two populations formed a continuum with some degree of overlap. These observations suggest that these populations may historically have been a single population, which diverged following recent fragmentation. Based on the size and geological evidence, Beard (1946) believed that the Victoria‐Mayaro population was the first established population in Trinidad, which founded the Matura population by range expansion.
Despite being geographically isolated by the Gulf of Paria, the Caño Tucupita population and the Victoria‐Mayaro‐Matura complex (VMM) were not considerably diverged based on the unbiased Nei’s genetic distance and PhiPT values. The data suggests that the differentiation observed between the Caño Tucupita population and the VMM complex is somewhat recent. A logical explanation for this phenomenon may be that both populations may have been founded by the northern range expansion of Mora prior to the separation of Trinidad from the mainland. The existence of some unique polymorphisms in each population suggests some differentiation may have occurred since the separation of Trinidad from the mainland.
Nei’s unbiased genetic distance suggests that the Cedros population is most similar to the Victoria‐Mayaro and Caño Tucupita populations. The PCoA further suggests that the VM and Caño Tucupita populations contributed to the Cedros population. This is also supported by the phylogram, which positions Cedros between the two major clades. One explanation for this observation may be that both populations have had genetic input into the formation of the Cedros population. Beard (1946) believed that the Cedros population originated from the Orinoco Delta either by a land bridge or through seeds being washed ashore during the seasonal floods. Evidence for his theory is supported by the fact that three other species found in the Orinoco Delta (Saccoglottis amazonica, Quassia amara and Astrocaryum aculeaum) are confined on Trinidad to the Cedros peninsula where M. excelsa also occurs (Beard, 1946). The present data, however, suggests that after separation of the Caño Tucupita and Cedros populations, the Cedros population was still able to access genetic input from the Victoria‐Mayaro population. This could have been because of a historical range expansion of the VM population.
The M. excelsa population in Paria was the most isolated of the populations studied. This population is located primarily along the Paria river which is nested in a valley on the northern side of the Northern Range separated from the nearest natural population by at least 22 km
84
and a mountain ridge about 600m high. The unbiased Nei’s genetic similarity values and phylogenetic and divergence data suggest that this population is most similar to the Cedros population strongly suggesting that this population was founded by individuals from the Cedros population. If this population was the product of natural fragmentation it would have been expected to share more similarity with its nearest neighbouring population – Matura. This evidence supports the theory that this population was founded by anthropogenic means (Beard, 1946). The small size of the founding population may explain the low genetic diversity and the divergence from the Cedros population.
In summary, this study suggests that the Victoria‐Mayaro population is the most diverse and the earliest founding of the five M. excelsa populations studied. The data suggests that Victoria‐Mayaro and Matura populations may have been intimately connected by gene flow until the recent past, supporting the theory of a VMM complex. It appears as though the Cedros population was founded from the Caño Tucupita with relictual gene flow from the VMM complex. The study indicates that the VMM complex is of immense conservation value due to its genetic diversity in Trinidad. The Cedros population with some unique genetic input from Caño Tucupita would also be of value. The Cedros population however appears to be most vulnerable because of its low genetic variation and the high level of anthropogenic disturbance in the area. This population should be considered as a high priority area for conservation in addition to the VMM in the future. References Achard, F., H.D. Eva, H.J. Stibig, P. Mayaux, J. Gallego, T. Richards, and J.P. Malingreau.
2002. Determination of Deforestation Rates of the World’s Humid Tropical Forests. Science 297:999‐1002.
Austerlitz, F., B. Jung‐Muller, B. Godelle, and P.H. Gouyon. 1997. Evolution of coalescence times, genetic diversity and structure during colonization. Theoretical Population Biology 51 (2):148‐164.
Barrett, S.C.H., and J.R. Kohn. 1991. Genetic and evolutionary consequences of small population size in plants: Implications for conservation. In Genetics and conservation of rare plants, edited by D. Falk and K. E. Holsonger. Oxford, UK: Oxford University Press.
Barrett, S.C.H., and J.S. Shore. 1989. Isozyme variation in colonizing plants. In Isozymes in Plant Biology, edited by D. E. Soltis. Portland, Oregon: Dioscorides Press.
Beard, J.S. 1946. The mora forests of Trinidad, British West Indies. The Journal of Ecology 33 (2):173‐192.
Bell, T.I.W. 1971. Management of the Trinidad mora forests with special reference to the Matura Forest Reserve. Port of Spain, Trinidad: Government Printery.
Bisby, F.A., Y.R. Roskov, T.M. Orrell, D. Nicolson, L.E. Paglinawan, N. Nailly, P.M. Kirk, T. Bourgoin, and G. Baillargeon. 2010. Species 2000 and ITIS Catalogue of Life: 2010 Annual Checklist.

85
Biscaia de Lacerda, A.E.B., M. Kanashiro, and A.M. Sebbenn. 2008. Effects of reduced impact logging on genetic diversity and spatial genetic structure of a Hymenaea courbaril population in the Brazilian Amazon forest. Forest Ecology and Management 255 (3‐4):1034‐1043.
Cardoso, M.A., J. Provan, W. Powell, P.C.G. Ferreira, and D.E. De Oliveira. 1998. High genetic differentiation among remnant populations of the endangered Caesalpinia echinata Lam.(Leguminosae‐Caesalpinioideae). Molecular Ecology 7 (5):601‐608.
Castillo‐Cardenas, M.F., N. Toro‐Perea, and H. Cardenas‐Henao. 2005. Population genetic structure of neotropical mangrove species on the Colombian Pacific Coast: Pelliciera rhizophorae (Pellicieraceae). Biotropica 37 (2):266‐273.
Chudnoff, M. 1984. Tropical timbers of the world. Remagen, Germany: Kessel House. Dick, C.W., G. Etchelecu, and F. Austerlitz. 2003. Pollen dispersal of tropical trees (Dinizia
excelsa: Fabaceae) by native insects and African honeybees in pristine and fragmented Amazonian rainforest. Molecular Ecology 12 (3):753‐764.
Ellstrand, N.C., and D.R. Elam. 1993. Population Genetic Consequences of Small Population Size: Implications for Plant Conservation. Annual Review of Ecology and Systematics:217‐242.
Excoffier, L., P.E. Smouse, and J.M. Quattro. 1992. Analysis of molecular variance inferred from metric distances among DNA haplotypes: application to human mitochondrial DNA restriction data. Genetics 131:479‐491.
Freitas, V.L.O., J.P. Lemos‐Filho, and M.B. Lovato. 2008. Contrasting genetic diversity and differentiation of populations of two successional stages in a neotropical pioneer tree (Eremanthus erythropappus, Asteraceae). Genetics and Molecular Research 7 (2):388‐398.
Gillies, A.C.M., J.P. Cornelius, A.C. Newton, C. Navarro, M. Hernandez, and J. Wilson. 1997. Genetic variation in Costa Rican populations of the tropical timber species Cedrela odorata L., assessed using RAPDs. Molecular Ecology 6 (12):1133‐1145.
Gillies, A.C.M., C. Navarro, A.J. Lowe, A.C. Newton, M. Hernandez, J. Wilson, and J.P. Cornelius. 1999. Genetic diversity in Mesoamerican populations of mahogany (Swietenia macrophylla), assessed using RAPDs. Heredity 83:722‐732.
Goulart, M.F., S.P. Ribeiro, and M.B. Lovato. 2005. Genetic, morphological and spatial characterization of two populations of Mabea fistulifera Mart.(Euphorbiaceae), in different successional stages. Brazilian Archives of Biology and Technology 48 (2):275‐284.
Hamrick, J.L. 1994. Genetic diversity and conservation in tropical forests. Paper read at International symposium on genetic conservation and production of tropical forest seed, at Chiang Mai, Thialand.
Hamrick, J.L., M.J. Godt, and S.L. Sherman‐Broyles. 1992. Factors influencing levels of genetic diversity in woody plant species. New Forests 6 (1‐4):95‐124.
Hamrick, JL, and MJ Godt. 1990. Allozyme diversity in plant species. In Plant Population Genetics, Breeding, and Genetic Resources, edited by A. H. D. Brown, M. T. Clegg, A. L. Kahler and B. S. Weir. Massachusetts, USA: Sinauer, Sunderland.
Husband, B.C., and S.C.H. Barrett. 1991. Colonization history and population genetic structure of Eichhornia paniculata in Jamaica. Heredity 66:287‐296.
Kenny, J.S. 2000. Views from the Ridge: Exploring the natural history of Trinidad and Tobago. Port‐of‐Spain, Trinidad and Tobago: Prospect Press.
Krishnapillay, B., M.I. Adenan, A.R.M. Ali, and S. Nimura. 2003. Tropical rainforest: A cradle for biological resources and the Malaysian policies on CBD. Actinomycetologica 17 (2):50‐53.

86
Lacerda, D.R., M.D.P. Acedo, J.P.L. Filho, and M.B. Lovato. 2001. Genetic diversity and structure of natural populations of Plathymenia reticulata (Mimosoideae), a tropical tree from the Brazilian Cerrado. Molecular Ecology 10 (5):1143‐1152.
Lemes, M.R., R. Gribel, J. Proctor, and D. Grattapaglia. 2003. Population genetic structure of mahogany (Swietenia macrophylla King, Meliaceae) across the Brazilian Amazon, based on variation at microsatellite loci: Implications for conservation. Molecular Ecology 12 (11):2875‐2883.
Loveless, M.D., and J.L. Hamrick. 1984. Ecological determinants of genetic structure in plant populations. Annual Review of Ecology and Systematics 15 (1):65‐95.
Lowe, A.J., B. Jourde, P. Breyne, N. Colpaert, C. Navarro, J. Wilson, and S. Cavers. 2003. Fine‐scale genetic structure and gene flow within Costa Rican populations of mahogany (Swietenia macrophylla). Heredity 95:268‐275.
Marshall, R.C. 1939. Silviculture of the trees of Trinidad and Tobago British West Indies. Oxford, UK: Oxford University Press.
Mayaux, P., P. Holmgren, F. Achard, H. Eva, H.J. Stibig, and A. Branthomme. 2005. Tropical forest cover change in the 1990s and options for future monitoring. Philosophical Transactions of the Royal Society B: Biological Sciences 360 (1454):373‐384.
Murawski, D.A., I.N. Gunatilleke, and K.S. Bawa. 1994. The effects of selective logging on inbreeding in Shorea megistophylla (Dipterocarpaceae) from Sri Lanka. Conservation Biology 8 (4):997‐1002.
Myers, N.J., R.A. Mittermeier, C.G. Mittermeier, G.A.B. da Fonseca, and J. Kent. 2000. Biodiversity hotspots for conservation priorities. Nature 403 (6772):853‐858.
Newton, A.C., J.P. Cornelius, P. Baker, A.C.M. Gillies, M. Hernandez, J.F. Mesen, and A.D. Watt. 1996. Mohagany as a genetic resource. Botanical Journal of the Linnean Society 122 (1):61‐73.
Nybom, H. 2004. Comparison of different nuclear DNA markers for estimating intraspecific genetic diversity in plants. Molecular Ecology 13 (5):1143‐1155.
Oatham, M.P., and D. Jodhan. 2002. Is mora taking over? Testing the limits to the invasive ability of Mora excelsa Benth. A pilot study. Journal of the Trinidad and Tobago Field Naturalists' Club.
Pither, R., J.S. Shore, and M. Kellman. 2003. Genetic diversity of the tropical tree Terminalia amazonia (Combretaceae) in naturally fragmented populations. Heredity 91:307‐313.
Rambaut, A. 2009. FigTree: Tree figure drawing tool, v1.2.2. University of Edinburgh, UK: Institute of Evolutionary Biology.
Rankin, J.M.K. 1978. The influence of seed predation and plant competition on tree species abundances in two adjacent tropical rain forest communities in Trinidad, W.I. , University of Michigan, Ann Arbor, MI.
Ruschel, A.R., R.O. Nodari, and B.M. Moerschbacher. 2007. The genetic structure of Sorocea bonplandii in Southern Brazilian forest fragments: AFLP diversity. Silvae Genetica 56 (2):51‐57.
Santos, RP, PCS Ângelo, PTB Sampaio, RC Quisen, ÂMC Leite, and CL Oliveira. 2008. Geographic pattern of genetic diversity in natural populations of Rosewood (Aniba rosaeodora), in the Central Amazonia. Acta Amazonica 38:459‐466.
Schaberg, P.G., D.H. DeHayes, G.J. Hawley, and S.E. Nijensohn. 2008. Anthropogenic alterations of genetic diversity within tree populations: Implications for forest ecosystem resilience. Forest Ecology and Management 256 (5):855‐862.
Schlüter, P.M., and S.A. Harris. 2006. Analysis of multilocus fingerprinting data sets containing missing data. Molecular Ecology 6 (2):569‐572.
ter Steege, H. 1990. A monograph of wallaba, mora and greenheart, Tropenbios Series. Wageningen, The Netherlands: Tropenbos Foundation.

87
———. 1994. Flooding and drought tolerance in seeds and seedlings of two Mora species segregated along a soil hydrological gradient in the tropical rain forest of Guyana. Oecologia 100 (4):356‐367.
Torti, S.D., P.D. Coley, and D.P. Janos. 1997. Vesicular‐arbuscular mycorrhizae in two tropical monodominant trees. Journal of Tropical Ecology 13 (4):623‐629.
Travis, S.E., J. Maschinski, and P. Keim. 1996. An analysis of genetic variation in Astragalus cremnophylax var. cremnophylax, a critically endangered plant, using AFLP markers. Molecular Ecology 5 (6):735‐745.
Ward, M., C.W. Dick, R. Gribel, and A.J. Lowe. 2005. To self, or not to self...A review of outcrossing and pollen‐mediated gene flow in neotropical trees. Heredity 95:246‐254.
White, G.M., D.H. Boshier, and W. Powell. 1999. Genetic variation within a fragmented population of Swietenia humilis Zucc. Molecular Ecology 8 (11):1899‐1909.
Wright, S. Joseph. 2005. Tropical forests in a changing environment. Trends in Ecology and Evolution 20 (10):553‐560.
Young, A., T. Boyle, and T. Brown. 1996. The population genetic consequences of habitat fragmentation for plants. Trends in Ecology and Evolution 11 (10):413‐418

88
The conservation status of Metastelma freemani
Gayatrilakshmi Raghava‐Singh1 and Michael Oatham
Department of Life Sciences, The University of the West Indies, St. Augustine, Trinidad, West Indies. Email: [email protected]
1 Corresponding Author Abstract Metastelma freemani (Apocynaceae‐Asclepiadoideae) is an endemic perennial found on the northeast coast of Trinidad. Currently the species does not occur in any protected area and coastal development may threaten its habitat, endangering its existence. To enable greater protection of M. freemani, its conservation status and current distribution needs to be better understood. Forty random sample points were chosen along the northeast coast, and at each point a hundred meter transect was sampled. Here abiotic (substrate type, substrate pH, inclination, elevation, distance from shore, aspect, canopy cover, canopy openness and land use) and biotic (dominant vegetation) parameters were recorded. Where M. freemani was identified along the transect, the extent of its inland distribution was measured via subsequent perpendicular transects from the coast. Using presence data, Maxent was used to model M. freemani’s geographic distribution along the northeast coast and determine major predictors of this pattern. Logistic regression was used to facilitate intra‐site comparison and development of predictive formulae for observed distributions. Non‐metric Multidimensional Scaling (nMDS) was used to investigate correlations between biological communities and M. freemani sites. It was found that northeastern Trinidad was a hotspot for M. freemani, with geology emerging as a major predictor of the species presence. However, on the micro‐scale, none of the parameters analysed via Logistic Regression was significant. Additionally, nMDS revealed no vegetative compositions that predicted M. freemani distribution. M. freemani appears to be a poor competitor and thus inhabits areas devoid of other vegetation. This plant appears adapted to the harsh abiotic environments found on rocky coastal areas. Unfortunately, its dispersal success seems limited since it has not been observed at sites other than those where it was first collected. Key words Asclepiadoideae, distribution, endemic, habitat, Maxent, Trinidad

89
Introduction Metastelma freemani is a Trinidadian endemic belonging to the Apocynaceae (dogbane) family and the Asclepiadoideae (milkweed) subfamily. Williams et al. (1928‐1992), describes the plant as prostrate, highly branched, forming mats on the rocky cliffs between Balandra and Toco, (Figure 1). Its leaves are opposite, base of stem woody, and corolla tube and lobes both long and pale yellow.
According to APGII (2003), M. freemani initially belonged to the Asclepiadaceae family. However, recent taxonomic consolidation has demoted this family to three subfamilies (Periplocoideae, Secamonoideae, Asclepiadoideae) and these were added to the family Apocynaceae. This plant was also originally included within the genus Cynanchyum but the New World species have now been separated into a new genus, Metastelma (Liede and Meve, 2004).
The generalized destruction and degradation of natural habitats in the West Indies, both during the colonial period and in recent times, has led to the loss of several plant species. However, the true extent of this loss remains unknown (Acevedo‐Rodriguez and Strong, 2007). Currently, the total number of native and naturalised plants of Trinidad and Tobago is reported to be 2361 species (EMA, 2002). A recently revised list of endemic plants for Trinidad and Tobago suggests that both isles contain approximately 59 endemics, 39 of which are exclusive to Trinidad (Van den Eynden et al. 2008). Being a continental island, Trinidad has a low rate of plant endemism that stands slightly less than 3 percent (Van den Eynden et al., 2008). However, it has high species richness, sharing the majority of its flora and fauna with the South American mainland (CBD, 2010). In spite of this, the conservation status of Trinidad's flora is poorly known, as is the case with other developing nations. Indeed, Van den Eynden et al. (2008) note that Trinidad only has seven plant species on the 2007 IUCN Red List of Threatened Species, none of which include its endemic species.
Endemics are important contributors to both local and global biodiversity and, given their restricted global range, are usually of high conservation interest. While a local legislative framework exists in Trinidad for protection to threatened species (Environmentally Sensitive Species Rules, 2001), no plant has yet been added to this list.
The purpose of this study was to determine the distribution, ecology and conservation status of M. freemani, and so determine the most efficient means of protection for this plant.

90
Methods Study area The study was conducted in the north‐eastern region of Trinidad, from Matelot to Matura, with sampling confined to the coastal zone (Figure 1). Within this 60km long region, 40km of transects were surveyed in addition to several random, exploratory surveys. BHP Billiton (2002) notes the variety of coastal landforms existing within this area including exposed rocky shores, wave cut platforms, exposed tidal flats, coarse sand beaches, gravel/pebble beaches and cobble/gravel beaches.
Figure 1 Map of study area of M. freeman on the north east coast of Trinidad. Data Collection According to herbarium records, M. freemani is found on elevated, rocky formations along the coastline. An initial reconnaissance trip was conducted to the location where herbarium voucher specimens were previously collected, to confirm that the species was still extant at this site. Thus, sample sites were chosen from both rocky and non‐rocky locations to investigate the hypothesis, that these plants prefer rocky substrate. A BHP Billiton coastal classification system (BHP 2002) was used to create a thematic layer in the ArcMap 9.3 (ESRI 2005) GIS environment. The study area was classified as ESI1 (exposed rocky shores), ESI2 (wave cut platform), ESI4 (coarse sand beaches), ESI5 (exposed tidal flats) and ESI6 (gravel/pebble and cobble/gravel beaches), using this coastal classification system. Herbarium records indicated preference of rocky substrate. To investigate this ESI1 and 2 were

91
combined under rocky substrate whilst ESI4, 5 and 6 under non‐rocky, in selection of sample sites. Soil type (alluvial, beach, terrace and upland) and geology (alluvium, limestone, metabasalt, metasandstone and slate/metalimestone) were also used as other measures of substrate preference. Forty random sample points were generated using this GIS, which included twenty on rocky substrate and twenty on non‐rocky substrates.
At each sample point, a 100m line transect was laid out parallel to the coast, and sampling took place at five 25m intervals along each transect. At all sites biotic (vegetation composition) and abiotic variables including substrate type, substrate pH, inclination, elevation, distance from shore, aspect, canopy cover, canopy openness and land use) were recorded at each interval.
Where M. freemani was present, transects were sampled perpendicular to the coast from the individual mats, to 20m beyond the last M. freemani individual. Micro environmental variables were recorded at 20m intervals where M. freemani was detected. Stretches of coast were also surveyed if they were thought to be potential sites for M. freemani. In this instance, data was only recorded for positive sites. Data Analysis Maxent (Phillips et al., 2004) was used to model the geographic distribution of M. freemani. This habitat mapping technique predicts a species distribution by estimating the maximum uniform entropy function, assuming that the expected value of each feature matches the measured average for those features (Phillips et al., 2004). In this case, occurrence localities and environmental data provide the measured values for the model (Phillips et al. 2006; Phillips et al. 2004). In this study, presence data and GIS layers were used to generate the data used in Maxent. A jack‐knife analysis was also performed to ascertain which environmental factors had the greatest influence on M. freemani distribution.
Logistic Regression was used to determine if any of the abiotic variables were correlated to the presence of M. freemani. Logistic regression allows for the creation of fitted models, which allow mathematical estimation of presence or absence (Berwick et al., 2005). An intra‐site comparison was conducted using presence/absence data for each vertical interval along the horizontal transect.
Descriptive statistics were used to examine the data for normality. Correlations between independent variables were assessed via Spearman’s Rank Correlation. Significant correlation between pairs of

92
variables was defined when P values were less than 0.05 and R2 values greater than 0.7. One member of correlated pair was then removed to prevent over/under weighting in subsequent analyses, fourth root transformations were carried out to normalise the dataset, and logistic regression performed.
Non‐metric multidimensional scaling (MDS) was performed on the random sample points. The floristic datasets were semi‐quantitative because presence/absence data was recorded at each transect interval. MDS groups were created, which included A ‐ potential M. freemani sites (that is, sites within the predicted hotspot region of Maxent’s model), B ‐ actual M. freemani sites and C ‐ all other sites. Bubble plots of co‐occurring species were overlaid onto the MDS figures, to allow exploration of trends within each group (A, B and C). Results Of the forty randomly selected survey sites, M. freemani was only detected at one location, where five individual mats of the plant were present. The result of the Maxent model of geographic distribution of Metastelma freemani is presented at Figure 3. Here a value of 1 suggests a probability of M. freemani presence, while a value of 0 indicates that its presence is highly unlikely. This model predicts that the northeastern corner of Trinidad is a potential hotspot for M. freemani occurrence.
Figure 2 Showing Maxent Predicted Model of Geographic Distribution of Metastelma freeman.

93
Jack‐knife modelling, of intra‐site conditions where M. freemani occurred, suggested that the environmental variable with the greatest predictive power (Phillips, 2005) for this species was geology (Table 1). Table 1 Showing Jack‐knife Analysis of Variable Contributions
Variable Percent Contribution
Permutation Importance
Geology 80.6 58.6 BHP Coastal Classification
12.3 2
Soil Type 3.7 31.4 Land Use 3 7.7 Slope 0.5 0.3 Exposure 0 0
The analysis of descriptive statistics of the abiotic and biotic factors associated with M. freemani occurrence, indicated that all of the variables were skewed, kurtosed or both. A Spearman’s rank correlation was performed on these data and this suggested that Randia aculeta and Jaquina armillaris (r21.0, p= 0.0); substrate type and substrate pH (r2‐0.9903, p=0.0); location and elevation (r20.8434, p=0.0); distance from shore and location (r20.8128, p=0.00) were significantly correlated pairs. Randia aculeta, substrate type and location were thus removed from the dataset and fourth root transformation performed on the remaining variables. All of the p values were greater than 0.05, thus it was concluded that none of the independent variables were significantly correlated with the presence of M. freemani.
It was not possible to construct fitted logistic regression models for the prediction of M. freemani distribution. Vegetation found at the sample points within the hotspot area for M. freemani included Clusia rosea, Philodendron sp, Languncularia racemosa, Manilkara bidentata, Mikania micrantha, Hedychium gardnerianum, Bromelia plumier, Erythroxylum havanense, Erythrina pallid, angifera indica, Jacquin armillaris, Pteridophyte sp, and Coryanthes sp. Plant species present at both hotspots and confirmed M. freemani sites included Pitcairnia integrifolia, Coccoloba uvifera, and Cocos nucifera. Plant species present at confirmed M. freemani site only was the moss Bryopsida spp.

94
Figure 3 Showing MDS Plot where Sample Sites According to Factors.
The semi‐quantitative presence/absence data was recorded at each
transect interval was constant throughout (values between 0‐5), and as a result no transformations of the data were required. However, non‐metric multidimensional scaling of biotic and abiotic factors revealed no predictive pattern for either abiotic or biotic factors. Discussion The choice of environmental factors used in the predictive models (Maxent, logistic regression and nMDS) was based on observations of the range of environmental characteristics at sample locations. Chapman (1967) notes that substrate plays a major role in presence or absence of plant species, and as a result, three factors were used to represent this variable in modelling in this study.
Field observations suggest that M. freemani preferred to be above the splash zone but within the vicinity of sea spray, indicating some sea‐spray tolerance. Chapman (1967) also notes that the level of salt present in coastal environments is an important determinant of vegetation type in these habitats.
Chapman (1967) also contends that harshness of environment is also reflected in landscape stability. Degree of slope was another variable considered in this study because steeper slopes affect runoff and subsequent erosion. Thus, the ability of the plant to persist in a dynamic environment would be assessed. Exposure, as determined by aspect, was

95
used as a measure of stability and harshness of the environment (with respect to sea‐spray and erosion). Level of exposure of the coast was determined by prevailing winds and currents in the area (CSO, 2004). For this study area, north and west facing segments of the coast were designated as exposed, while south and east were sheltered. Land use was also modelled to determine whether M. freemani was located in higher risk areas of anthropogenic activity (residential and agriculture) or more naturalised conditions (forest, broken forest, coconut estate and scrubland).
Maxent predicted that the north‐east corner of the island was a hotspot for M. freemani, and the dominant environmental variables here included a geology of Galera Grit (metasandstone), coastal classification of rock, terrace soil formation and land use of coconut estates.
The random sample points, which fell within the vicinity of the hotspot, were found to be devoid of M. freemani. Phillips et al. (2006) suggest that human interference, biotic interaction and geographic barriers can explain such discontinuity in Maxent modelling. Human interference can include destruction of habitat and trampling. Biotic interaction could be caused by creation of an unfavourable environment (such as shade) or competition. Geographic barriers, such as habitat heterogeneity, would also prevent M. freemani from colonising a suitable habitat if the plant were unable to disperse across these boundaries. Errors in the model may have also resulted from other environmental factors that were not included in the model, such as elevation. Phillips et al. (2006) noted that a minimum threshold requirement for occurrence localities has not yet been determined, nor has the degree of regularisation, to prevent model over‐fitting of deficient presence data, been finalised. Given the small number M. freemani presence sites there is a strong possibility that the model was over‐fitted, potentially affecting the accuracy of results.
No correlation was found between the presence of M. freemani and the between‐site abiotic variables recorded. From field observations M. freemani appears to colonise the face and edge of cliffs. This indicates that elevation and rocky substrate may be important factors. It may be able to survive under harsh conditions (rocky substrate, sea spray) and becomes confined to this area due to its poor competitive ability and shade intolerance. The Maxent model confirms the preference of rocky substrate. However, it also adds two new dimensions to this variable – soil type and geology. Apparently, M. freemani’s presence is correlated to the occurrence of terrace soil and a metasandstone formation known as Galera Grit. The former substrate type gives an indication of the

96
landform, but not the physiochemical properties of the substrate. Metasandstone is rock formed by metamorphosis of separate clades of sand grade rock, and Ali (1983) indicates that Galera Grit comprises of “indurated quartzitic grit” with calcite and quartz veins and joints. The soft (calcitic) veins and fissures may allow the roots of the plant to invade, enabling M. freemani to colonise the hard rocky substrate.
Bubble plots identified Bryopsida spp. as the only species found exclusively at “presence sites” for M. freemani. However, examination of intra‐site data, reveals that this moss did not occur concurrently with M. freemani (that is, both species were not found within the same transect interval).
The absence of biotic correlation may be due to M. freemani’s poor competitive ability, suggested by its location on the lower cliff faces. It creeps up in some instances, reaching the top of cliffs that are cleared or sparsely vegetated and relatively undisturbed. Remote sensing may aid in habitat identification by mapping of the spectral signature of bare rocky land near the coast (Xie 2008). It should be noted that Maxent also correlated coconut estates with the presence of M. freemani. The trees in a coconut estate are usually well spaced from their neighbours thus shade and competition would not prove to be an issues in this sense. Unfortunately, Cocos nucifera cannot be used as an indicator species given coconut’s widespread distribution along the coast.
Several methods exist for assessment of the degree of threat to a species. Krupnick et al. (2009) give a “preliminary conservation assessment algorithm” that uses data from herbaria to perform an abundance, temporal, and spatial assessment to assess threats to a given plant species. In the case of M. freemani, specimens have only been collected after 1900, and from fewer than 6 localities. Given that it was only collected three times prior to this study and two of those were before the 1960’s, there is a high likelihood that M. freemani warrants a listing as potentially threatened, using Krupnick et al.’s (2009) criteria. M. freemani also satisfies a considerable number of the characteristics of threatened species outlined by Primack (2006). Specifically, it occupies a narrow geographical range due to its specialised niche requirements, has poor dispersal ability and lack of competitiveness. Field studies identified only a few extant populations, some of which may be in decline due to proximity to anthropogenic activity. This is further exacerbated by the fact that M. freemani is a perennial and may have a low rate of population increase. Thus, M. freemani has a high likelihood of becoming prone to extinction.
97
During this study there was difficult to assess whether M. freemani was threatened according to IUCN‘s (2008) criteria because much of the data to apply these criteria was not available. Using best available evidence, to address the IUCN criteria B2a (Area of occupancy estimated to be less than 500 km2) and B2biii (inferred decline of area, extent and/or quality of habitat), suggests that the classification of M. freemani as endangered is warranted. From field observations, there may be less than 2500 mature individuals of this species in north‐eastern Trinidad, but long‐term population demographics comparisons are required to confirm this estimate. Conclusion M. freemani has managed to hold on to its coastal niche in north‐east Trinidad for the last 80 years, with collection sites remaining relatively unchanged, at Balandra, Galera and Toco. Its distribution appears to be limited by geology and confined to the littoral zone. It may be adapted to harsh conditions (rocky substrate and sea spray) due to its poor competitive ability. Its low abundance coupled with the increasing anthropogenic activity along the coast (in the form of pollution, recreational activity and coastal development) may result in destruction of its limited habitat, potentially moving M. freemani’s status to critical. Acknowledgements The primary author wishes to recognise the efforts of her parents who provided support both financially and in the field; Department of Life Sciences field and technical staff for their provision of resources and field help; and most importantly God without whose grace nothing would have been possible. References Acevedo‐Rodriguez, P. and Strong, M. 2007. The Flora of the West Indies. Smithsonian
National Museum of Natural History. http://www.botany.si.edu/antilles/WestIndies/#floristic. Accessed 6th December, 2010.
Ali, W. 1983. News Letter 5: Geological Field Trip to the Toco District. Geological Society of Trinidad and Tobago. http://www.gstt.org . Accessed 28th November, 2010.
APG II. 2003. An update of the Angiosperm Phylogeny Group classification for orders and families of flowering plants: APG II. Bot. J. Linn. Soc. 141:399‐436.
Berwick, V., Cheek, L., Ball, J. 2005. Statistics Review14: logistic regression. Crib Care 9(1): 112–118.
Broken Hill Proprietary Company (BHP) Billiton. 2002. Atlas of Environmentally Sensitive Areas: East Coast Trinidad.
Central Statistical Office (CSO) of Trinidad and Tobago. 2004. Environmental Statistics Chapter 9. http://www.cso.gov.tt Accessed 28th November, 2010.
98
Convention on Biological Diversity (CBD).2010. Country Profile ‐ Trinidad and Tobago. http://www.cbd.int/countries/profile.shtml?country=tt#status . Accessed 20th November, 2010
Chapman, V. 1976. Coastal Vegetation, 2nd end. Pergamon, Oxford. Environmental Management Authority. 2002. State of the Environmental Report 2001 and
2002. http://www.ema.co.tt Accessed 20th November, 2010. Environmentally Sensitive Species Rules (ESS) 2001, Environmental Management Act 2000.
Trinidad and Tobago. ESRI. 2005. ArcGIS. Redlands, CA: Environmental Systems Research Institute. Krupnick, G., Kress, J., Wagner, W. 2009. Achieving Target 2 of the Global Strategy for Plant
Conservation: Building a Preliminary Assessment of Vascular Plant Species using Data from Herbarium Specimens Biodiversity and Conservation, 18(6): 1459‐1474.
International Union of Conservation of Nature (IUCN). 2001. IUCN Red List Categories and Criteria : Version 3.1. IUCN Species Survival Commission. IUCN, Gland, Switzerland and Cambridge, UK.
Liede, S. and Meve, U. 2004. Revision of Metastelma (Apocynaceae‐Asclepiadoideae) in Southwestern North America and Central America. Ann. Missouri Bot. Gard. 91: 31‐86.
Phillips, S., Dudik, M., Schapire, R. 2004. A Maximum Entropy Approach to Species Distribution Modeling. In: Proceedings of the Twenty‐First International Conference on Machine Learning. ACM Press, New York, pp. 472486.
Phillips, S. 2005. A brief tutorial on Maxent. ATand T Research http://www.cs.princeton.edu/~schapire/maxent/tutorial/tutorial.doc. Accessed 5thOctober, 2010.
Phillips, S., Anderson, R., Scharpire, R. 2006. Maximum Entropy Modeling of Species Geographic Distributions. Ecol. Model. 190: 231259.
Primack, R. 2006. Essentials of Conservation Biology. Fourth Edition. Sinauer Associates, Sunderland, Massachusetts.
Van den Eynden, V., Oatham, M., Johnson, W. 2008. How free access internet resources benefit biodiversity and conservation research: Trinidad and Tobago's endemic plants and their conservation status Oryx 42: 400‐407 Cambridge University Press.
Williams, R., Cheesman, E. and Philcox, D. 1928‐1992. Flora of Trinidad and Tobago, Volumes 1‐3. Government Printer, Port of Spain, Trinidad and Tobago.
Xie, Y. 2008. Remote Sensing Imagery in Vegetation Mapping: A Review. J Plant Ecol. 1(1): 9‐23.

99
Fire in the Aripo Savannas Environmentally Sensitive Area: Causes and Consequences
Aditi Bisramsingh1,2 and Michael Oatham2
2Department of Life Sciences, The University of the West Indies, St. Augustine, Trinidad,
West Indies. Email: [email protected] 1 Corresponding Author
Abstract The Aripo Savannas Environmentally Sensitive Area (ASESA) is the last tropical grassland in Trinidad and Tobago still in its natural state. Many of the organisms found there are unique to the area and of great ecological and scientific importance. While the Aripo Savanna remains relatively intact, it is today beginning to face anthropogenic disturbances. One of the more significant forms of anthropogenic disturbance is fire. These fires are caused by squatters using fire to clear land for agriculture or burning debris, and hunters using smoke to drive animals out of their burrows. This study investigates patterns of fire origin and damage at the ASESA and its effects on plant community composition in the open savanna. Using Forestry Division fire records in a GIS platform, sixty‐four 50cm by 50cm quadrats in burnt and unburnt areas sampled to determine their plant species composition. Data analysis using the statistical software PRIMER showed that of all the plants species collected, Paspalum pulchellum and Rhynchospora barbata were the most abundant species at the sample sites. Most unique common species such as Drosera capillaris and Utricularia sp. were found in both the burnt and unburnt areas. Two endemic species in the Polygalaceae family, Polygala exserta and Polygala adenophora, were found in the burnt areas. Burning may, therefore, induce flowering in these species. Other factors such as depth of hard‐pan, soil type, distance to savannah edge and the time since a fire last burnt the area, did not appear to have an effect on the plant communities in the sample plots. Key words Open savannas, fires, species composition, edaphic; squatting, hunting, management plan. Introduction The Aripo Savannas Scientific Reserve (ASSR) lies in North East Trinidad (10° 35´N, 61° 12´W) between Arima and Sangre Grande in a lowland area

100
at an altitude of 35 – 40m, east of the Caroni Plain. It is generally flat, and gently rising to the north towards the town of Valencia. The savannas cover an area of approximately 1788 hectares, including 250 hectares of open savanna habitat, which consist of ten separate savannas (Comeau 1990, EMA 2007a). The ASSR lies within the Long Stretch Forest Reserve (Laughlin 2004).
The ASSR, is the largest remaining natural savanna ecosystem with endemic flora in Trinidad and Tobago. This ecosystem also includes a marsh formation that consists of a mixture of marsh forest, palm‐marsh and savanna. It provides a habitat for several rare and threatened species of plants and animals. In 2007, this site was designated as an Environmentally Sensitive Area, (the Aripo Savanna Environmentally Sensitive Area ‐ ASESA) under the Environmental Management Act 2000 (EMA 2008a).
Of the 457 species of plants identified in these savannas, 38 are restricted to the Aripo Savannas, with 16 to 20 that are considered rare or threatened, and 6 that are thought to be endemic (EMA 2006). These unique species includes the endemic sedge Rhynchospora aripoensis and insectivorous plants such as the sundew and bladderworts. In addition, the ASESA contain the only palm/marsh forest in the country (Young 2006).
The edaphic conditions in the open savanna have a major influence on the vegetation. The soil is poorly drained and impoverished. During the wet season, the savannas are waterlogged, giving rise to physiological drought, causing restricted root growth and function due to lack of oxygen. During the dry season the sandy soil dry out rapidly, giving rise to a severe physical drought. As the sub‐surface clay‐pan and fragipan dry out, they become extremely hard so that roots cannot penetrate to these lower horizons (Richardson 1963).
Savannas fires have been identified in a management plan for the ASESA as being one of the major anthropogenic disturbances at this site. Fires can have direct and indirect effects on several ecological processes in tropical savannas, by affecting plant community composition and physiognomy (Silva et al. 1991). Fires in open savannas can alter the species composition by allowing fire resistant species to survive more than other non‐fire resistant species (Comeau 1990). Fire is also an important source of mortality for plant seedlings and for small grasses and can affect the structure and functioning of the savanna (Silva et al. 1990). In the Aripo Savannas, all the fires that occur are of anthropogenic origin. The cause of fire is a result of human activities such as land clearing by

101
squatters for cultivation, unauthorized private land fires, negligence with incendiary materials, hunting, mischief and land clearing to plant marijuana (Schwab 1988). The fires in the savannas also pose a serious problem to the Forestry Division with regard to implementation of their management plan for the area, since the effects of fires on the plant communities are not well known. (EMA 2008a).
As such, the main objective of the study was to identify the patterns of fire origin and damage to the ecosystems in the ASESA and determine the effects of fire on plant community composition in the open savanna ecosystems. Methods Study Area Areas of the ASESA that have been burnt since 1987 were identified using Forestry Division fire records. These records were transferred to a geographic information system (GIS) and, the areas that frequently burn were identified, and annual maps of fires generated. Stakeholders were shown these maps in order to independently verify accuracy and the maps were updated as necessary. Figure 1.Map of Aripo Savannas Environmentally Sensitive Area (ASESA) and the location of the open savannas within the ASESA. Survey techniques and data analysis Once the burnt areas were identified using the GIS, 100 random points were generated for eight open savannas using ArcGIS 9.3 (ESRI 2005), to select sample points in burnt and unburnt areas. Although the Aripo Savanna consists of ten open savannas, sampling for this project was

102
done in Savannas 1, 2, 3, 5 and Savanna 7. At each sample point, 50cm by 50cm quadrats were used to sample the plants present. If specimens could not be identified in the field, they were taken the National Herbarium for identification. At each quadrat, the depth of the hard pan, soil type and the distance of the nearest marsh forest were determined. The depth of the hard pan was measured using a soil corer. The distance and direction to the nearest marsh forest (savanna edge) was estimated visually. Soil type was derived from a previously produced soil map. Plant species diversity, richness and plant community composition between areas of the open savanna that have never burnt, according to Forestry Division records, and areas that have been burnt were compared using Primer. In Primer, dendrograms were used to cluster quadrats based on site similarity. Multi dimensional Scaling (MDS) was used to investigate site similarities, and differences in species composition at the burnt and unburnt sites. Principal Component Analysis (PCA) was used to determine if any of the environmental variables had an effect on the species composition. Results Fire records for the ASESA were only available for the period from 1997 to the present. These showed that out of the ten savannas, savannah 1, savanna 2, savanna 3 and savanna 5 were burnt every year during this period. No record of fires in the other savannas was found, nor were the foresters in charge of the ASESA, aware of any other fires at the site. However, retired foresters indicated that the savannas were completely burnt in 1987 but no formal records for that period were available. Subsequent to 1987, the savannas were individually burnt, though most of the burning only took place in portions of the savannas. During 2010, Savanna 5 was burnt in its entirety while other savannas were burnt in patches within the savanna.
The fire records also showed that that the majority of these fires were the result of human activities. The fires that originate in Savanna 1 were ignited by squatters, who live along the boundaries of the savanna and use fire to clear land for agriculture. These fires then spread into savannah 2 and 3. Other fires in these savannas, particularly in savannah 5, were caused by hunters using smoke to drive animals. Fires in these savannas were also a result of burning of debris near to the boundary of the ASESA, smokers and malicious intent by residents. In most of these cases, the abundance of shrubs, grasses and surface litter provided an excellent source of ignition. These shrubs and grasses at the boundary of

103
the ASESA easily catch fire, which then spread to the interior of the savannas.
Rainfall data, also recorded in the annual fires reports, revealed that all the fires in the ASESA occurred in the dry season (January to May), with the highest fire frequency occurring in the month of April. The average temperature during this time is 34⁰C. This was once again demonstrated when in 2010 the entire of savanna 5 was burnt during the dry season.
Within the 64 quadrats, only 24 species representative of the open savanna ecosystem were detected (Table 1).
These data showed that the two species, Polygala exserta and Polygala adenophora, were only found in burnt areas while three other species, Hyptis lantanifolia, Myrcia platyclada and Rhynchospora curvula were only found in unburnt areas. The majority of species, however, were found in burnt areas. Table 1 Plant species occurrence in burnt or unburnt quadrats from the ASESA.
Species Burnt Unburnt Total Paspalum pulchellum 36 20 56 Utricularia sp 32 17 49 Rhynchospora Barbata 24 14 38 Rhynchospora filiformis 21 12 33 Drosera capillaris 19 8 27 Lagenocarpus rigidus 14 12 26 Andropogon virgatus 14 2 16 Panicum stenodes 10 4 14 Habenaria leprieurii 6 2 8 Acisanthera bivalvis 3 3 6 Panicum nervosum 4 2 6 Comolia veronicifolia 2 3 5 Sauvagesia sprengelli 3 1 4 Polygala exserta 4 0 4 Rhynchospora tenuis 3 1 4 Chrysobalamus icaco 1 2 3 Polygala adenophora 3 0 3 Thrasya trinitensis 2 0 2 Hyptis lantanifolia 1 0 1 Myrcia platyclada 1 0 1 Perama hirsuta 0 1 1 Panicum parvifolium 0 1 1 Andropogon sp 1 0 1 Rhynchospora curvula 0 1 0

104
The environmental data was analysed using Principal Component Analysis (PCA) (Figure 2). The PCA results for the sample sites and the depth of the hard pan (Figure 2a) showed that the depth of the hard pan had the greatest influence on those sites located on the left of PC1 axis and this influence decreased moving from left to right along the PC1axis.
In addition, the presence of the species Andropogon virgatus was not influenced by the depth of the hard pan since this species was found at depths ranging from 20cm to 60cm (Figure 2b). The same pattern was repeated for all other environmental variables and for all species at the sample sites. Depth of hardpan and Andropogon virgatus was chosen for illustrative purposes but the same results were seen for the other 24 species superimposed onto the other environmental variables. None of the environmental variables tested showed any influence on species composition at each of the sites. Likewise, the presence of a particular species was not determined by any of the environmental conditions measured at each of the areas. (a) (b) Figure 2. (a) PCA ordination for ASESA sample sites showing where the depth of hard pan has the least and greatest influence. The larger the bubbles the greater the influence.(b) PCA ordination for dept of hard pan but this time the species Andropogon virgatus was superimposed onto the environmental variable (depth of hard pan).

105
Discussion The Aripo Savannas Environmentally Sensitive Area (ASESA), though a legally protected area, remains threatened by anthropogenic activities that can affect the plant communities found there. In the sample plots used in this study, it was evident that anthropogenic fires can quickly spread into the interior of the savannas. The results of this study revealed that the fires in these areas originate mainly through squatters clearing land for agriculture and hunters. These two major threats remain prevalent because of a number of reasons. First, there is insufficient staff at the Forestry Division to properly manage and monitor these activities; second, there is ineffective control of access to the ASESA; third, there is a lack of adequate control of hunting in the ASESA; and fourth, there is an ineffective and inappropriate fire management system (Nelson 2007). Squatting, highlighted as one of the major cause of fires in the savannas, could be controlled through the implementation of a proper management plan (EMA 2006). These squatters chose to live on the boundary of the ASESA since they are unable to obtain land legally and a lack of enforcement makes the site accessible to anyone (EMA 2008b).
Hunting, another cause of fires in the savannas, is as a result of hunters commercially exploiting the rare orchids and vertebrate wildlife such as macaws and some reptiles (EMA 2007a). While the enabling legislation of the ASESA does not allow hunting in this area, the lack of enforcement and patrols, and a local demand for wildlife continues to facilitate hunting in the savannas (EMA 2007a).
This study reveals that fires in the ASESA all took place in the dry season. This may be expected since during these times the temperature is high with an average of 34⁰C, and the lack of any significant precipitation at the site. During the dry season, there are a lot of dry grasses, shrubs and surface litter in and around the savannas, and as such when a fire starts it can easily spread to the interior. In addition, the blackened soils at Aripo cause more heat to be lost so producing drier conditions, which favour the spread of fires (Comeau 1990).
All the recorded data suggests that fires in the ASESA are a result of human activities rather than natural factors, such as lightning that are characteristics of other Neotropical savannas. Fire in these other Neotropical savannas is considered a prime factor in determining the savanna structure and functioning since fires are an important source for seeding mortality or germination and can even influence flowering in some shrubs and herbs (Silva et al. 1990). Savannas that have been burnt frequently can also see a change in some of the plant species where some

106
of these plants will begin to evolve so to become fire resistant (Chang 1996).
The Aripo Savannas however is not dependant on fire for its structure. These savannas rely on edaphic factors for their existence. Current evidence suggests that natural fires were not frequent enough in the past to have influenced the structure of the savannas (EMA 2007b). However, illegal fires set within and around the savannas, can have effects on the native vegetation, altering re‐sprouting patterns and flowering characteristics of species (Schwab 1988). These data suggests that out of twenty‐four species detected in the quadrats, five were only found in the burnt areas, three were only found in the unburnt areas alone while twelve species had more individuals in the burnt areas compared to the unburnt areas. Four species had near equal proportions in both burnt and unburnt areas. For the species that were only found in the burnt areas one species Polygala exserta, was endemic. However, while these species were detected in burnt conditions their habitat preference or the effect of fire on them has not been conclusively determined. The small number of individuals within the quadrats, and the individuals collected may not be representative of the entire species.
Only three species were unique to the unburnt area. For these species, fire may be destroying their seedlings or preventing germination (Silva et al. 1990). However, once again due to lack of adequate sample size, it cannot be concluded that fires were directly responsible for the patterns observed.
For those species found in both burnt and unburnt areas, these data suggest that fires may not have much effect on the mortality of these plants. For species such as Paspalum pulchellum, Rhynchospora barbata, Rhynchospora filiformis and Utricularia sp, more individuals were found in the burnt areas than unburnt areas.
It should be noted that out of the 64 sample areas, 41 plots were burnt while only 23 were from unburnt sites. As a result, given that there were more samples in burnt areas, the data set would have captured more species in the burnt areas. No definitive conclusion can, therefore, be made about the role of fire in germination or flowering at the study area.
However, Schwab (1988) showed that most of the open savannas vegetation species were able to resprout in burnt areas. Species such as Paspalum pulchellum flowered profusely in the burnt areas and their densities in both burnt and un‐burnt areas were near identical (Schwab 1988). The data presented here suggests that species such as Paspalum

107
pulchellum were found more frequently in the burnt areas than un‐burnt areas. Therefore, some of these plants may be adapting and evolving to cope with fires in the ASESA.
Even though some of the data suggests that some species are beginning to favour burnt conditions, these data do not represent many species at the ASESA since only 24 of the 86 plant species described in the open savannas, were detected in the quadrats. How fires affect these other species remains unknown.
In this study, it was thought that environmental variables such as the distance and direction of the nearest marsh might have an effect since fires originated at the edge of the marsh forest or the boundary of the savannas. Thus, the closer a plot is to the edge, the higher the probability of it being burnt. However, MDS analysis revealed that this variable did not influence the species composition at the sample plots. The depth of the hardpan/clay pan has been previously proposed as an important environmental variable since it influences the drainage conditions in the savannas (Richardson 1963). However, data in this analysis showed that hardpan depth did not influence the plant species composition between the 64 sample plots.
Soil type or edaphic conditions have a major influence on vegetation. There are basically four types of soil characteristic to Aripo; Type A – Aripo fine sand on fine clay, Type B ‐ Aripo fine sand or silt on silty clay, Type C – Aripo fine sand or sand on sandy to gravelly clay and Type T – Transitional Aripo fine sand silt. As such, the soils here tend to become very waterlogged in the wet season and very dry in the dry season. The plants therefore that grow here are very well adapted to the soil conditions present (Richardson 1963). However, this analysis found that no one species favoured a particular soil type as they were spread out through all the varying soil types.
From this study, therefore, the environmental variables measured did not influence the species composition in the ASESA. As for fire and its effect on plant species, more sampling needs to be done to determine its effect on all 86 species in the savannas. It may be possible that some plants, especially the more common ones are beginning to become adapted to burnt conditions. Another useful approach to determine the full effects of fires on these species in the ASESA is to measure the change over time in permanent plots rather than attempting to determine differences in species composition on a single occasion at varying places (Lonsdale and Braithwaite 1991).

108
Once the full effects of fires are known, those species needing conservation and added protection can be identified, and the Forestry Division can begin to implement their management plan for the area. Acknowledgements We thank the Forestry Division for providing us with permits to enter the ASESA to carry out research as well as to the foresters attached to the Forestry Division’s Cumuto office for their knowledge of the area as well as for field assistance when needed. We also thank staff at the National Herbarium for their help in identifying the plants species collected. We are grateful for the assistance of the technicians attached to the University for providing field assistance during sampling.
References Chang, Chi‐Ru. 1996. Ecosystem Responses to Fire and Variations in Fire Regimes. Sierra
Nevada Ecosystem Project: Final report to Congress, vol II, Assessments and Scientific basis for management options.
Comeau, P. 1990. Savannas in Trinidad. Living World: Journal of the Trinidad and Tobago Field Naturalist Club.
Environmental Management Authority (EMA). 2006. Terms of Reference, Participatory Management Planning for Aripo Savannas Environmentally Sensitive Area.
Environmental Management Authority. 2007a. Aripo Savannas Environmentally Sensitive Area Literature Review to Facilitate the Preparation of Management Plans. Prepared by the Caribbean Natural Resource Institute (CANARI).
Environmental Management Authority. 2007b. Administrative Record for the Environmentally Sensitive Area: Aripo Savannas Scientific Reserve. Port of Spain, Trinidad.
Environmental Management Authority. 2008a. Managing together: A summary of the management plans for the Aripo Savannas, an Environmentally Sensitive Area. Prepared by the Caribbean Natural Resource Institute for the Environmental Management Authority. Port of Spain, Trinidad.
Environmental Management Authority. 2008b. Aripo Savannas Environmentally Sensitive Area Resource Management Plan: A framework for Participatory Management. Prepared by Caribbean Natural Resource Institute for Environmental Management Authority. Port of Spain, Trinidad.
ESRI. 2005. ArcGIS. Redlands, CA: Environmental Systems Research Institute. Lonsdale, W.M and R.W.Braithwaite. 1991. Assessing the effects of fire on vegetation in
tropical savannas. Australian Journal of Ecology. Nelson, H. 2007. Working Report Summary Report. Resource Management Focus Group.
Prepare by Caribbean Natural Resource Institute for Environmental Management. Unpublished data.
Richardson, W.D.1963. Observations on the Vegetation and Ecology of the Aripo Savannas Trinidad. Journal of Ecology, Vol 51, No. 2.
Schwab, S.I. 1988. Floral and faunal composition, phenology, and fire in the Aripo Savannas Scientific Reserve, Trinidad, West Indies. M.Sc. Thesis, University of Wisconsin.
Silva, J.F., J. Raventos and H.Caswell.1990. Fire and fire exclusion effects on the growth and survival of two savanna grasses. Acta Ecologica. Vol.11.

109
Silva, J.F., J.Raventos., H.Caswell and M.C. Trevisan. 1991. Population Responses to Fire in a Tropical Savannas Grass, Andropogon Semiberbis: A Matrix Model Approach. Journal of Ecology, Volume 79, Issue2.
Young, J.L. 2006. Aripo Savanna Scientific Reserve : A Description and Short History. Quarterly Bulletin of the Trinidad and Tobago Field Naturalist Club.

110
Biodiversity and biogeography of lichens in Trinidad and the implications for forest health and bio‐sensitivity.
Andrea Scobie
Geography Department, The University of the West Indies, St. Augustine, Trinidad, West Indies.
Email: [email protected]
Abstract There is no reference material and information on the distribution of lichens of Trinidad, at the National Herbarium of Trinidad and Tobago. This study investigated the biogeography and biodiversity of lichens in Trinidad through field surveys, which mapped the distribution of these plants and provided voucher specimens to the National Herbarium and to the Natural History Museum of London, England. The study involved the survey of forested areas for lichens, verification of species identity, and their substrates. Fifty‐five sites in Trinidad were studied. All lichens were identified to the generic and some to the specific level. Two hundred and fifty‐seven specimens of 35 genera were named. Limitations in the study included a lack of resources and taxonomic expertise in Trinidad. The distribution of lichens at the 55 sites was mapped. Further studies should be undertaken to determine the effect of pollution, disturbance and forest health in Trinidad and Tobago. This study provides a foundation for a national inventory of lichens, from which bio‐monitoring and forest health studies can emerge. Key words voucher specimens, forest, microlichens, diversity, distribution, macrolichen Introduction Trinidad is a tropical continental island, which possesses a range of topography, a variable rainfall pattern and a range of forest types, which encourage a rich diversity. One organism common in the native forests of Trinidad is the epiphytic lichen. This is an inconspicuous organism and, as such, has received little study. In the past, scientists, such as Vainio (1923) and Jermy (1963), made collections of lichens from Trinidad, but no vouchers from these collections now exist at the National Herbarium of Trinidad and Tobago. The lichen flora of the country thus remains comparatively unknown.

111
The objectives of this study were to develop a reference collection of lichens of Trinidad at the National Herbarium, provide duplicates to an international archive (Natural History Museum, UK), develop maps of lichen distribution, produce maps of lichen distribution, and investigate the relationship between environmental conditions and presence and density of the lichens at the study sites. It was hoped that these data would provide the basis for use of lichens as bio‐indicators and in bio‐monitoring. Method Fifty‐five study areas were selected randomly in Trinidad and sample plots of 0.25km2 in size, were surveyed for lichens. The GPS coordinates, elevation, soil‐type, canopy cover, leaf‐litter and presence of surface water, were recorded for all sites where trees were sampled (Figure 1). From a staked central position, four suitable trees closest to that point, one from each quadrant, were selected. Distances from central point and circumferences were recorded. Four quadrat ladders were tied to the tree, one at each cardinal aspect, and lichen types were counted in each quadrat. Samples were then taken from the trunks and transported to the lab for processing. Figure 1 Location of 55 lichen sample plots in Trinidad.

112
Results The geographical information for 35 sites were recorded. Numbers of lichens found in each site are presented at Table 1, and Figure 2 shows the relation between the number of samples of the various genera and their frequencies. A complete list of the genera identified in this study is presented at Table 2. Table 1: Summary of Lichen samples collected from forested areas in Trinidad
Samples Number Collected 287
Identified 216 Genera identified 35
Species identified 17 Curated at NHM C 190 Curated at T and T 287
Two samples, Parmotrema austrosinense (Zahlbr.) Hale (Canas et al., 1997), and Dirinaria picta (Sw.) Schaer. Ex Clem. (Aptroot et al. 1997) are shown in Figure 3.
Figure 2: The number of locations where each genus was found and the frequency of each genus in all locations.
0
10
20
30
40
50
60
70Series1 Series2
GENERA
NUMBE
ROF LO
CATIONS AND
Number of locations Frequency of genera

113
a) b) Figure 3 Photographs of a)Parmotrema austrosinense (Zahlbr.) Hale (Canas et al, 1997) and b) Dirinaria picta (Sw.) Schaer. Ex Clem. (Aptroot et al. 1997) Discussion Trinidad’s location in the Tropics affords a high species richness and diversity. The topography, rainfall and forest types lend themselves to such diversity. The collections of lichen by Vainio (1923) and Jermy (1963) reflected a preponderance of macrolichens. However, this study noted mainly crustose microlichens. These were abundant on the tree trunks in the forested areas, along with some squamulose and foliose types. The smallest representation was the fruiticose types, yielding such genera as Usnea sp., Ramalina sp., Teloschistes sp. and Cladonia sp. The latter, with the exception of Cladonia sp., were located at the site of highest elevation in this study, Morne Bleu (699m). At this elevation, all ten genera were found. This site also held the largest number of fruiticose types. This is consistent with previous studies that noted fruiticose types have their maximum richness at higher elevations than foliose species (Baniya et al., 2009).
The foliose types were more abundant on non‐forested tree species, which were not a major part of this study. Some were more prevalent in wetter forested areas. One example is Leptogium sp., which was found in areas that were waterlogged or experienced high humidity or under a thick canopy. The areas of most abundant crustose species were well lit, i.e. the canopies were light and areas were drier. Sterile crusts were most abundant. Graphis sp. and Pyrenocarp sp. were prominent among the crustose types.

114
Table 2 Lichen frequency from 55 forest sites of Trinidad
Genera number of locations Frequency: n/N x100 Leptogium 5 14.5 Porina 17 49.3 Bacidia 5 14.5 Graphis 12 34.8 Chapsa 1 2.9 Arthonia 5 14.5 Herpothallon 15 43.5 Usnea 1 2.9 Ramalina 1 2.9 Teloschistes 1 2.9 Parmotrema 3 8.7 Phyllopsora 6 17.4 Pyrenocarp 9 26.1 Dirinaria 3 8.7 Gyalecta 1 2.9 Opegrapha 9 26.1 Myriotrema 1 2.9 Dimerella 1 2.9 Catillarea 2 5.8 Letrouitia 7 20.3 Thelotrema 1 2.9 Fissurina 6 17.4 Arthathelium 1 2.9 Coccocarpia 1 2.9 sterile crust 20 58 sorediate crust 2 5.8 Canaparmiella 1 2.9 Pyrenula 2 5.8 Crocynia 1 2.9 Eschatagonia 2 5.8 Heterodermia 4 11.6 Physcia 1 2.9 Lechonidia 1 2.9 Clathroporina 1 2.9 Perusaria 5 14.5
Conclusion The diversity of lichens in Trinidad is comparatively high with 35 genera (17 species of which were identified). This was especially true of the crustose type. The biogeography of lichens in this study was consistent
115
with other studies, as seen in the relationship between elevation and species richness. Acknowledgements Thanks go to my supervisors: Paul Shaw, Yasmin Baksh‐Comeau, Patricia Wolseley; Dr. Holger Thϋs (Natural History Museum); Mr. W. Johnson, Ms. K. Manaure and Mr. Brad Bharat (National Herbarium of Trinidad and Tobago); my husband and children for their keen support. References Vainio, E. A. 1923: “Lichenes in insula Trinidad” a proferrore R. Thaxter collecti – Proceedings of the Amercan Academy of Arts and Sciences 58: 131 – 147.
Jermy, C. 1963. Collection of Lichens of Trinidad. Natural History Museum, Cromwell Rd., London U.K.. Unpublished.
Lumbsch, Mc Carthy and Malcolm. 2001. Key to the Genera of Australian Lichens. Apothecial Crusts. Flora of Australian Supplementary Series II. Australian Biological Resources, Canberra.
Baniya, C.B., Torstein S., Yngvar G. and M. W. Palmer. “The elevation gradient of lichen species richness in Nepal.” The Lichenologist 42 no. 1 (2010): 83‐96.
Will‐Wolf, S., C. Scheidegger, B. McCune. “Monitoring scenarios, sampling strategies and data quality”, in Monitoring with Lichens – Monitoring Lichens, edited by P. L. Nimis, C. Scheidegger and P. A. Wolseley 147 – 162. Kluwer Academic Publishers, Netherlands 2002.

116
Electrical Enhancement of Coral Growth: A Pilot Study
L.S. Beddoe1,*, T.J. Goreau2, J.B.R. Agard1, M. George3, and D.A.T. Phillip1
1Department of Life Sciences, The University of the West Indies, St. Augustine, Trinidad, W. I.
E‐ 2Global Coral Reef Alliance, 37 Pleasant Street, Cambridge, MA 02139, USA
3Department of Physics, The University of the West Indies, St. Augustine, Trinidad, W.I. *Corresponding Author mail: [email protected]
Abstract It has been proposed that weak direct current increases the aragonite form of calcium carbonate deposition in some corals, resulting in increased growth in coral skeletons. The validity of this claim remains unsubstantiated because of weaknesses in the experimental design of previous studies. The objective of this study was to develop a scientific method for testing the effect of low direct current on the growth of corals. This paper reports on the first phase of a 3‐phase study on direct current effects on aragonite deposition. During this first phase, the experimental design was developed and tested in small pilot laboratory and field experiments. The results suggested that closed systems require further experiments when using the mineral accretion method. The field experiments showed that Millepora alcicornis was the most suitable species for further experimental studies and that a modified version of the buoyant weighing method was the most precise approach for measuring coral growth. Key words electrolytic mineral accretion, Biorock®, Millepora alcicornis, brucite, aragonite, buoyant weighing, direct current (DC) Introduction Past research has explored the use of electrolysis as a means to enhance accretion and calcification processes in coral reef restoration (Schuhmacher and Schillak 1994; van Treeck and Schuhmacher 1999). This approach involved passing a weak direct current (DC) through a metal mesh causing the precipitation and deposition of reef like material, such as aragonite, CaCO3; and brucite, MgOH2; from seawater (Hilbertz 1992).
117
Mineral accretion techniques were first applied to coral reef restoration by Tom Goreau and Wolf Hilbertz (Hilbertz 1992). According to Hilbertz (1992), “higher current densities result in faster growth but weaker material dominated by brucite [Mg(OH)2], while lower current densities produce slower deposition dominated by harder aragonite [CaCO3]”. This theory was supported by subsequent experimental studies done by van Treeck and Schuhmacher (1997), and Sabater and Yap (2004). However, the validity of this claim remains disputed due to weaknesses in the experimental design of previous studies and lack of scientifically reviewed evidence. In addition, previous studies have used a range of methods to determine evidence of growth, which included measuring tape, Alizarin dye, and Vernier callipers, all of which have had limitations.
The objective of this study was to develop a method with a proper design of experimental treatments and controls, which provided more precise measurement of growth rates than those that have been previously attempted. It is hypothesized that low direct current increases calcium carbonate deposition in some corals, resulting in increased growth. Previously published papers suggest that lower current density results in more aragonite being deposited, thus the following hypothesis is proposed: A low‐density direct current range of 2‐3 A/m2 will result in an increase in the deposition of the aragonite form of calcium carbonate. This paper discusses some of the results of phase one, which developed and tested the experimental design. Materials and Methods Previous researchers (Hilbertz 1992; van Treeck and Schuhmacher 1997; Sabater and Yap 2002, 2004) have used a range of anode materials, including graphite, steel and lead, but have obtained best results with titanium (van Treeck and Schuhmacher 1997). Titanium is known to be highly resistant to adverse conditions, and in this study, a titanium anode was used.
During this pilot study, the goal was to develop the experimental design for investigating aragonite deposition by low‐density direct current. In this regard, the pilot study consisted of a number of laboratory experiments and a small pilot field experiment at 11°09'26.01"N 60°50'20.81"W in front of a break water barrier.
Coral fragments of local coral species and fragments from the same colony were used to reduce potential variance in growth due to intra‐specific variability. The study site contained both the charged and control experiments, and replicated. Physical parameters measured in the study

118
included water depth; height, size, and shape of the experimental structure; and wave energy; and nature of the sea floor. All environmental variables were kept identical for both the charged and the control experiments, to ensure that measurements of electricity’s influence on coral growth rate could be more accurately determined.
A small‐scale laboratory experiment was set‐up using coral fragments of Porites porites, collected from Toco (10°50'09.2"N 60°55'25.5"W) on the north east coast of Trinidad. The first experiment consisted of two aquaria, measuring 76.2cm x 45.72cm x 45.72cm. One aquarium acted as the control and the other received low DC of 6V 4.24A. Alizarin Red Dye, of concentration identical to that used by Sabater, was used initially to stain the corals so that growth would be visible and measurements made using Vernier callipers (Sabater and Yap 2002). The stainless steel cathode was 2.54cm squares and the anode measured 33.02cm x 38.1cm. PVC frameworks similar to Sabater and Yap's (2004) design were submerged in these aquaria, with a modification in the positioning of the electrodes, specifically positioning the anode below the cathode.
The second laboratory experiment consisted of four aquaria measuring 76.2cm x 45.72cm x 45.72cm each, two of which were the control and the other two being the test treatments. Cathode 1 received a 3V 0.615A DC charge during the day, 6am to 6pm, and cathode 2 received a 3V 0.615A DC charge during the night 6pm to 6am. This was to determine the optimum time for applying electricity in the field.
The third laboratory experiment consisted of four aquaria measuring 76.2cm x 45.72cm x 45.72cm each, two of which were the control and the other two being the test treatments. A fifth aquarium, measuring 15.24cm x 45.72cm x 45.72cm, was used to house the anode and a salt bridge was used to allow the flow of ions from this aquarium to the two aquaria containing cathode 1 and cathode 2 (Plate 1.1). The salt bridge, a component of an electrochemical cell, produces an electrical current as a product of an oxidation‐reduction or redox reaction. The salt bridge electrically connected the two test treatments while keeping them separate and allowed electrons to transfer between the anode and cathode 1 and cathode 2. For this experiment, the salt bridge was a U‐tube design filled with sodium chloride agar. A direct current of 6V 4.24A DC was used.

119
Plate 1.1 U‐tube Salt Bridge for laboratory 3 experimental set‐up
Only one species of coral, Porites porites, was used during these laboratory experiments. A rubble bottom, consisting of ground coral fragments of varying sizes, was created to imitate the seabed. Each aquarium used Aqua Clear filter 70 and a protein skimmer. An Atinic bulb was used to replicate night light and fluorescent bulbs to represent day with a lighting period of 12hrs each. Direct current was supplied using a Nippon America DVP‐515 DC regulated power supply. The sea water was taken from Toco (10°50'09.2"N 60°55'25.5"W), the site where the Porites porites colonies existed. Seawater was changed weekly and parametric readings taken continuously.
In the field, an electrically conductive dome–shaped frame was built from BRC and served as the cathode (van Treeck and Schuhmacher 1997; Sabater and Yap 2004). This was submerged and anchored to the sea bottom and a titanium mesh was used as the anode. A light sensitive circuit was used to allow current during the daylight and no current at night. The main current source for this experiment was a 12V car battery, with a circuit current of 6A. The battery was allowed to recharge during the night. During the day, it was expected that the battery charger would be off or at minimal charging rate, thus ensuring a steady current flow to the experiment. When measured it was approximately 4.85A, lower than the designed current due to the added resistance caused by the distance of the cable to the experiment.
Initially live coral fragments of varying species were attached using steel binding wire to the cathode. However, after several months of observations 20 replicates of Millepora alcicornis were added to the charged and the control experiments.

120
Both van Treeck and Schuhmacher have found that a direct current range between 1 to 24 V at a density of 3 A m‐2 on the cathodic surface gave the best results (van Treeck and Schuhmacher 1997). However, Dr. Goreau and Prof. Wolf Hilbertz (pers. comm.) suggested a range of 2 ‐ 3A per m2 of surface area at 4.5V to be ideal. For this experiment, the amperage range used was 4.7A – 7.1A. Results The first experiment resulted in overnight bleaching and gaseous chlorine fumes being released into the lab environment. A pH of 7.4 was recorded and the total Cl‐ ion concentration measured was out of range. This revealed that the direct current, 6V 4.24A, was too high. The amperage was lowered for the second experiment to 3V 0.615A to eliminate the potential for bleaching. However, within ten days of the experimental set‐up both cathodes developed rust‐coloured bacteria, which subsequently colonized the entire aquaria. This suggested that the amperage was too low. When the DC was applied to the experiment, the pH, decreased from 7.54 to 6.88 for the corals charged during the day. A salt bridge was used for the third lab experiment to reduce the amount of ions being released and the DC was increased to 6V 4.24A. However, within 18 days, bleaching occurred at the base of the corals and rust‐coloured bacteria developed on the cathode of the control. There were visible signs of accretion on the charged cathodes (Figure 1), but eventually the corals were all bleached after several more days. Figure 1 Photograph of coral fragments following eighteen days of accretion on the cathode using the salt‐bridge described in experiment three.

121
In the field, live coral fragments of various species were initially attached so that the correct range of direct current could be confirmed and the best‐adapted coral species for the study site identified. It was determined after three months that Millepora alcicornis and Montastrea annularis were ideally suited for this experiment. However, Millepora sp. was the fastest growing and easiest to obtain of the coral species. Photo transects of the replicates of Millepora were taken to assess growth as measurements using Vernier callipers and measuring tape were found to be inaccurate. Photo transects were also not effective because of the different planes of growth. As a result, only qualitative data was collected (Figure 2).
Figure 2 A representative fragment of Millepora alcicornis showing growth from the pilot field study over six months. Discussion The bleaching process of corals in the laboratory experiments showed that in a closed system like an aquarium, a viable experimental method for investigating mineral accretion remains to be developed. Even with use of a salt bridge, it was not possible to maintain stable experimental conditions. As a result, the laboratory experiments were abandoned.
The pilot field‐study suggested that the thickness of accreted material was greater near the anode and cathode connections and declined as one moves further away from these connections. The electrolytic configuration used in this pilot study yielded visibly significant changes in growth in the charged coral fragments compared to the controls. This study also showed that Millepora alcicornis was the most suitable species for the field experimental site, which had poor water quality.

122
It was also noted that photo transects of the replicates of Millepora sp. were the least effective form of growth measurement. Similarly, Vernier callipers measure length which is a two dimensional planar measurement, were also inappropriate. Since corals grow in various planes, volume or mass measurements were needed to give measurements in three dimensions. As a result it was deduced that buoyant weighing provided a more precise means to measure absolute or relative growth rates (Davies 1989). The buoyant weighing method was adapted for field application and will be applied in future phases of this study. Corals spend a lot of energy building skeletal material, and in the face of global climate change and its stressors of higher sea surface temperatures and ocean acidification, it is important that a better understanding of mechanisms for mineral accretion in coral growth is developed. Acknowledgement We would like to thank the late Prof. Wolf Hilbertz for his valuable training and expertise, Mr. Faizul Mohammed, Mr. Avi Bhagan, Dr. Azad Mohammed, Mr. Deosaran ‘Doc’ Persad, Mr. Marlon George and the staff of the electronics workshop, Physics Dept., Dr. Jennie Mallela, The Dept. of Life Sciences, The Tobago House of Assembly, Undersea Tobago Dive Shop, Coco Reef Resort, The University of the West Indies and volunteers consisting of postgraduates, undergraduates, friends, family, locals and tourists. References Davies, P.S. 1989. Short‐term growth measurements of corals using an accurate buoyant
weighing technique. Marine Biology 101 (3):389‐395. Hilbertz, W.H. 1992. Solar‐generated building material from seawater as a sink for carbon.
Ambio:126‐129. Sabater, M.G., and H.T. Yap. 2002. Growth and survival of coral transplants with and
without electrochemical deposition of CaCO3. Journal of Experimental Marine Biology and Ecology 272 (2):131‐146.
Sabater, M.G., and H.T. Yap. 2004. Long‐term effects of induced mineral accretion on growth, survival and corallite properties of Porites cylindrica Dana. Journal of Experimental Marine Biology and Ecology 311 (2):355‐374.
Schuhmacher, H., and L. Schillak. 1994. Integrated Electrochemical and Biogenic Deposition of Hard Material A Nature‐like Colonization Substrate. Bulletin of Marine Science, 55 2 (3):672‐679.
van Treeck, P., and H. Schuhmacher. 1997. Initial survival of coral nubbins transplanted by a new coral transplantation technology‐options for reef rehabilitation. Marine Ecology Progress Series 150 (1):287‐292.
van Treeck, P., and H. Schuhmacher. 1999. Artificial reefs created by electrolysis and coral transplantation: An approach ensuring the compatibility of environmental protection and diving tourism. Estuarine, coastal and shelf science(Print) 49:75‐81.

123
Population density of the agouti Dasyprocta leporina at the Central Range Wildlife Sanctuary, Trinidad.
Howard P. Nelson1, 5, Indira Omah Maharaj2, Nadra Nathai‐Gyan3, and Antony Ramnarine4.
1 Department of Life Sciences, The University of the West Indies, St. Augustine, Trinidad,
West Indies. Email: [email protected] 2 Wildlife Conservation Committee, c/o Forestry Division, Long Circular Road, St. James Port
of Spain, Trinidad, West Indies 3 Zoological Society, Emperor Valley Zoo, St. Clair, Port of Spain, Trinidad, West Indies 4 Forestry Division, Long Circular Road, St. James Port of Spain, Trinidad, West Indies
5 Corresponding Author
Abstract The red‐rumped agouti Dasyprocta leporina (Linnaeus, 1758) is one of the most heavily hunted game mammals on the island of Trinidad. Results of a 2007 population survey of agoutis at the Central Range Wildlife Sanctuary in Trinidad are reported here. Thirty 1‐km transects were systematically surveyed within the 2,153 ha Central Range Wildlife Sanctuary using trained survey personnel from the Forestry Division. Surveys were conducted during the morning and afternoon over a one‐month period, and these data were pooled to estimate population densities for agoutis. Transect data were analysed using Distance 6.0 software and King’s estimator. Total transect distance surveyed during the study was 60 km and 20 agoutis were encountered. Agouti density was estimated at 10.43 individuals per km2 (95% C.I. 9.68 – 11.18 individuals per km2) using King’s estimator, while that using Distance was 8.38 individuals per km2 (95% C.I. 4.4 – 16.1 individuals per km2). These data were compared to reported densities in other Neotropical sites where D. leporina is known to occur. This study suggests that even within the nominally protected Central Range Wildlife Sanctuary, D. leporina densities were significantly below the reported densities for this species elsewhere in the Neotropics. Key words game mammal, population estimate, distance sampling, line transect, King’s estimator Introduction Wild mammals provide important food and recreational opportunities for local peoples in the Neotropics (Redford and Robinson 1991). This is

124
especially so on the Caribbean island of Trinidad where the hunting of game mammals for subsistence, recreational and commercial activity is an important forest use (Asibey 1984). Such importance is reflected in the over 10,000 hunting licenses now issued annually by the country’s Forestry Division, for the harvest of game species (Wildlife Section, Forestry Division unpublished data). Among the mammals hunted on Trinidad, the red‐rumped agouti Dasyprocta leporina (Linnaeus, 1758) is one of the most important targets for recreational hunting and the most heavily hunted game mammals in Trinidad (Nelson 1996).
The red‐rumped agouti is a 3‐6 kg Caviomorph rodent, which has a comparatively widespread distribution in the Neotropics (Eisenberg 1989; Emmons and Feer 1997; Nowak 1999). These rodents can attain relatively high densities in some tropical forests (Jorge and Peres 2005) and are important seed predators and seed dispersers (Rankin 1978; Smythe 1986; Forget and Milleron 1991; Forget 1996; Silvius and Fragoso 2003). In this way, agoutis can affect composition and spatial distribution of their food trees in these forests (Asquith et al. 1999; Terborgh et al. 2008; Galetti et al. 2010). Additionally, this species is an important prey species for terrestrial carnivores such as the threatened ocelot Leopardus pardalis (Aliaga‐Rossel et al. 2006), which is the largest terrestrial carnivore on the island of Trinidad.
In spite of this rodent’s importance as a keystone species in the tropical forests on Trinidad, and its high value as a game mammal, there have been relatively few attempts to estimate the agouti’s abundance in the remaining forests on the island. Previous studies have suggested that densities of this game mammal are well below theoretical carrying capacity expected for tropical forests on Trinidad, and that the species is being exploited at rates higher than what could be considered sustainable (Nelson 1996).
In 2007, the Wildlife Conservation Committee (WLCC), an advisory committee constituted under Trinidad and Tobago’s Conservation of Wildlife Act, commissioned a survey of the Central Range Wildlife Sanctuary (CRWS), a wildlife conservation area on Trinidad (Bacon and ffrench 1972). The objective of this study was to assess the status of game species within the CRWS and refine survey methodologies for a future national survey. The density estimates of D. leporina within the CRWS based on this survey are reported here and compared with abundance data from other South American localities. The implications for sustainable harvesting agoutis in Trinidad are also considered.

125
Study Area and Methods The Central Range Wildlife Sanctuary lies at the headwaters of the Tumpuna and Talparo watersheds in the central part (UTM Zone 20N ‐ 692069N, 1155165E) of the island of Trinidad (Bacon and ffrench 1972). This wildlife sanctuary consists of 2,153 hectares of undulating topography that is mostly below 200m in elevation. The climate at this site is seasonal and determined by variation in precipitation, with a dry season that extends from January to May, and a wet season from June to December, while the mean annual precipitation is ca approximately 230 cm. The native vegetation of this area consists of tropical moist forests (Nelson 2004), while edaphic conditions within the sanctuary produces a vegetation mosaic at the stand‐level, which fall into three forest associations ‐ Crappo‐carat, Crappo‐cocorite and Acurel‐figuer (Beard 1946). Since the early 1950s, a little under one third of the Sanctuary has been converted to a teak, Tectona grandis, plantation monoculture (Figure 1). Figure 1 Location of Central Range Wildlife Sanctuary and extent of natural forests in Trinidad.
Surveys of agoutis were conducted along thirty systematic 1‐km transects. The initial location of the first of these transects was selected at random using ArcGIS 9 (ESRI 2005), and each subsequent transect placed to ensure regular spacing (using either a north‐south or east‐west alignment) of the remaining 29 transects. Distance surveys (Buckland et al. 2004; Buckland et al. 2001) were conducted during the month of April 2007, in the middle of the dry‐season, with each line transect sampled at least once during the morning and again during the afternoon. Distance to animals and sighting angles were estimated using electronic rangefinders and hand‐held compasses, and density of agouties

126
estimated using King’s estimator (Glanz 1990; Wright, Gompper, and DeLeon 1994) and Distance 6.0 software (Thomas et al. 2009). King’s estimator calculates the density of a population (D) using the formula D=n/(2lR), where N is the number of observed individuals, l is the total transect length and R is the mean distance of the animal from the observer. For analyses conducted in Distance 6.0, the Akaike Information Criterion (AIC) (Burnham and Anderson 2002) was used to identify the most suitable detection function model for our data, specifically adopting a threshold value of delta AIC less than 6 (Richards 2008). Results A total of 60 km of line transects were surveyed within the Central Range Wildlife Sanctuary during this study, with 20 agoutis detected along these line‐transects. Using King’s estimator, the density of D. leporina within the CRWS protected areas was 10.48 individuals per km2, with a 95% confidence interval of 9.68 – 11.18 individuals per km2.
Analyses of the line transect survey results using Distance 6.0 suggested that the most conservative model that fitted the data was a negative exponential model with a simple polynomial expansion. This model gave the lowest delta AIC, and a Kologmorov‐Smirnof goodness of fit value that was not significantly different from the observed data (p=0.77). Using this model Distance 6.0 predicted D. leporina density at the CRWS at 8.38 individuals per km2, with a 95% confidence interval of 4.38 – 16.05 individuals per km2..
These densities from this study site were then compared with reported densities for D. leporina from three other Latin American sites where this species is known to occur. These data are presented at Table 1.
Discussion This study represents the first time that a density estimate of the red‐rumped agouti populations at the Central Range Wildlife Sanctuary is being reported, and one of the few attempts to estimate the density of game species from the island of Trinidad, through direct surveys. When compared with data from other Neotropical sites, this field study suggests that the density at the CRWS is at least one‐half to one quarter the density of other locations where D. leporina occurs.

127
Table 1 Density estimates of D. leporina in Neotropical sites. Location Density
(individuals /km2)
Hunting Intensity
Forest Type Source
Central Range Wildlife Sanctuary, Trinidad
10.43*, 8.38†
Low – moderate (?)
Moist tropical
This study
Pinkaiti Research Station, Brazil
31 None‐Low Semi deciduous tropical
Jorge and Peres 2005
Ilha de Maraca, Roraima, Brazil
40 None‐Low Semi‐ evergreen seasonal
Silvius and Fragoso 2003
Manaus, Brazil 10 ‐ 26 unknown Tropical rainforest
Jorge 2008
Trinity Hills Wildlife Sanctuary/ Victoria‐Mayaro Reserve, Trinidad
2.10 High Moist tropical
Nelson 1996
* ‐ King’s estimator, † – Distance 6.0‐model estimate The limits of the data collected in this study are recognised, particularly with regard to the use of Distance 6.0 to analyse agouti detections. Density estimates using this programme for fewer than 60 observations may not be robust (Buckland et al. 2001). This in part accounts for the wide confidence intervals reported for D. leporina density estimate based on this model. However, it is instructive that the density estimate using King’s estimator is very close to that predicted by Distance 6.0, and well within the confidence limits for that model. This suggests that these values provide a reliable index of agouti density at the CRWS. With agouti being heavily hunted on the island, the CRWS may be performing an important metapopulation role, by providing a “rescue effect” to surrounding forests where intense hunting could be depleting densities of this rodent. As a result, the fate of agouti populations at the CRWS may have significant impacts on hunting success in the surrounding Central Range Forest Reserve. It should be noted that at the Victoria‐Mayaro Reserve, another forest site in Trinidad with intense hunting pressure, agouti populations have been suggested to be as low as 2.1 individuals per km2 (Nelson 1996).

128
Additionally, this study points to a potential impact on long‐term forest structure and composition, should agouti populations at this site remain depressed. Specifically, other authors have demonstrated that the loss of species such as agoutis can have a significant impact in the long term on forest structure and composition, by affecting seed dispersal (Asquith et al. 1999; Terborgh et al. 2008; Galetti et al. 2010).
In this context, there is a need to understand the reasons for the comparatively low densities of D. leporina within the CRWS, given its status as a protected area. The development of a long‐term population dataset on the status of this rodent at the CRWS will provide a clearer understanding of the metapopulation dynamics and its contribution to sustainability of hunting in surrounding forests. Acknowledgments We wish to thank the staff of the Wildlife Section, Forestry Division, for their logistical support, and to the field staff of the Division’s South‐Central Conservancy who assisted with the collection of the field data. We would also like to recognize the support of Dr. David Rampersad of The University of West Indies’ Business Development Office and the Wildlife Conservation Committee of the Ministry of Housing and the Environment. This study was supported by a grant from the Wildlife Section’s Public Sector Investment Programme’s Assessment of the Status of Wildlife Project. References Aliaga‐Rossel, Enzo, Ricardo S. Moreno, Roland W. Kays, and Jacalyn Giacalone. 2006. Ocelot
(Leopardus pardalis) Predation on Agouti (Dasyprocta punctata). Biotropica 38, no. 5 (September): 691‐694.
Asibey, E. O. A. 1984. Economic role of wildlife in Trinidad and Tobago. Rome. doi:FAOFO‐DP/TRI/79/001.
Asquith, Nigel M., John Terborgh, a. Elizabeth Arnold, and C. Mailén Riveros. 1999. The fruits the agouti ate: Hymenaea courbaril seed fate when its disperser is absent. Journal of Tropical Ecology 15, no. 2 (March): 229‐235.
Bacon, P.R., and R.P. Ffrench. 1972. The wildlife sanctuaries of Trinidad and Tobago. Port of Spain: Wildlife Conservation Committee, Ministry of Agriculture, Lands and Fisheries.
Beard, J.S. 1946. The Natural Vegetation of Trinidad. Oxford Forestry Memoire 20. Buckland, S.T., D.R. Anderson, K.P. Burnham, J.L. Laake, D.L. Borchers, and L. Thomas. 2001.
Introduction to Distance Sampling. London: Oxford University Press. ‐‐‐. 2004. Advanced Distance Sampling. London: Oxford University Press. Burnham, K. P., and D. R. Anderson. 2002. Model Selection and Multimodel Inference: A
Practical Information‐Theoretic Approach. 2nd edition Springer‐Verlag, New York. Eisenberg, J. F. 1989. Mammals of the Neotropics, vol. 1.: The northern neotropics. Chicago:
University of Chicago Press. Emmons, L.H., and F. Feer. 1997. Neotropical rainforest mammals: a field guide. 2nd ed.
Chicago: University of Chicago Press.

129
ESRI. 2005. ArcGIS. Redlands, CA: Environmental Systems Research Institute. Forget, P.M. 1996. Removal of seeds of Carapa procera(Meliaceae) by rodents and their fate
in rainforest in French Guiana. Journal of Tropical Ecology 12, no. 06: 751–761. http://journals.cambridge.org/abstract_S0266467400009998.
Forget, P.M., and Tarek Milleron. 1991. Evidence for secondary seed dispersal by rodents in Panama. Oecologia 87: 596‐599.
Galetti, Mauro, Camila I. Donatti, Carla Steffler, Julieta Genini, Ricardo S. Bovendorp, and Marina Fleury. 2010. The role of seed mass on the caching decision by agoutis, Dasyprocta leporina (Rodentia: Agoutidae). Zoologia (Curitiba, Impresso) 27, no. 3 (June): 472‐476.
Glanz, W. E. 1990. Neotropical mammal densities: How unusual is the community on Barro Colorado Island, Panama. In Four neotropical rainforests, ed. A.H. Gentry, 287 ‐313. New Haven: Yale University Press.
Jorge, MSP. 2008. Effects of forest fragmentation on two sister genera of Amazonian rodents (Myoprocta acouchy and Dasyprocta leporina). Biological Conservation 141, no. 3: 617–623.
Jorge, MSP, and Carlos a. Peres. 2005. Population Density and Home Range Size of Red‐Rumped Agoutis (Dasyprocta leporina) Within and Outside a Natural Brazil Nut Stand in Southeastern Amazonia1. Biotropica 37, no. 2 (June): 317‐321.
Nelson, H. P. 1996. Ecological Studies of Forest Mammals in the West Indies with a Focus on Trinidad. The University of the West Indies ‐ St. Augustine.
‐‐‐. 2004. Tropical forest ecosystems of Trinidad: ecological patterns and public perceptions. University of Wisconsin ‐ Madison.
Nowak, R.M. 1999. Walker’s Mammals of the World. 6th ed. Baltimore: The Johns Hopkins University Press.
Rankin, J.M. 1978. The influence of seed predation and plant competition on tree species abundances in two adjacent tropical rain forests. University of Michigan.
Redford, K. H., and J. G. Robinson. 1991. Subsistence and commercial uses of wildlife in Latin America. In Neotropical wildlife use and conservation., ed. J. G. Robinson and K. H. Redford, 6–23. Chicago: University of Chicago Press.
Richards, S. A. 2008. Dealing with overdispersed count data in applied ecology. Journal of Applied Ecology 45, no. 1 (February): 218‐227.
Silvius, K.M., and J. Fragoso. 2003. Red‐rumped Agouti (Dasyprocta leporina) Home Range Use in an Amazonian Forest: Implications for the Aggregated Distribution of Forest Trees. Biotropica 35, no. 1: 74–83.
Smythe, N. 1986. Competition and Resource Partitioning in the Guild of Neotropical Terrestrial Frugivorous Mammals. Annual Review of Ecology and Systematics 17, no. 1 (November): 169‐188.
Terborgh, John, Gabriela Nuñez‐Iturri, Nigel C a Pitman, Fernando H Cornejo Valverde, Patricia Alvarez, Varun Swamy, Elizabeth G Pringle, and C E Timothy Paine. 2008. Tree recruitment in an empty forest. Ecology 89, no. 6 (June): 1757‐68.
Thomas, L., J.L. Laake, E. Rexstad, S. Strindberg, FFC Marques, S.T. Buckland, D.L. Borchers, et al. 2009. Distance 6.0. Research Unit for Wildlife Population Assessment, University of St. Andrews, UK.
Wright, S. Joseph, Matthew E. Gompper, and Bonifacio DeLeon. 1994. Are Large Predators Keystone Species in Neotropical Forests? The Evidence from Barro Colorado Island. Oikos 71, no. 2 (November): 279.

130
Abstracts

131
Natural History and Conservation of the Trinidad Piping Guan
Kerrie Naranjit
Department of Life Sciences, The University of the West Indies, St. Augustine, Trinidad, West Indies. Email: [email protected]
Abstract
The Trinidad Piping‐guan or Pawi, Pipile pipile, is a critically endangered New World cracid, endemic to Trinidad. Due to habitat loss and hunting, it is considered the second most threatened cracid worldwide and an “immediate conservation priority” by the IUCN/Birdlife/WPA Cracid Specialist Group. This paper presents the findings of a two‐year field study that assessed the natural history of the Pawi. The Trinidad Piping‐guan was observed for 26% of the 762 field hours and during 73% of the 304 field sessions. These birds were most active during the early morning when they displayed foraging, preening, aggressive and courtship interaction behaviours. The Pawi appears to be primarily arboreal, with less than 1% of observed activities occurring on the ground. Diet consists mainly of fruits, leaves, flowers and seeds. Group size ranged from 1‐8 individuals with an average group size of 1.3 birds. The phenology of behaviour suggests that the Pawi have an extended breeding season with chicks being first observed in February and mating and courtship behaviour observed as late as July. Significant differences in wing drumming and long piping vocalisations were found between the dry and rainy seasons, suggesting that these behaviours are related to reproduction. Attempts were made to mist‐net birds for radio tracking; however, these attempts were unsuccessful. The information gained from this study will be used to prepare recovery and monitoring plans for the species. Keywords: piping‐guan, Trinidad, Pipile, behaviour, diet, group size

132
Biofouling on recreational vessels in Trinidad and Tobago
Judith F. Gobin1, Alana Jute1 and Anuradha Singh2
1 Department of Life Sciences, The University of the West Indies, St. Augustine, Trinidad,
West Indies. Email: [email protected] 2 Department of Biology, COSTAAT, Port of Spain, Trinidad, West Indies.
Abstract
The twin‐island state of Trinidad and Tobago has seen a significant growth in the yachting industry over the last 30 years with the numbers of boats having increased 10‐fold between 1980 and 2000. Being geographically outside of the hurricane belt, the islands offer a prime hurricane shelter in the Caribbean with excellent boating and repair facilities. The Chaguaramas coastline (Trinidad) has seven anchorages, one of which‐ the Chaguaramas Bay ‐ was the selected study site. Thirty‐two recreational vessels were sampled for biofoulers. Overall, hull foulers belonged to six major phyla: Plantae (macroalgae), Bryozoa, Porifera, Mollusca, Crustacea, and Annelida. To date, 50 species have been identified: 25 annelids, 14 barnacles and 6 bivalves (including Perna viridis, a known introduced species). Preliminary identifications suggest that at least one species (Megabalanus zebra) may have been introduced to Trinidad’s waters via this pathway. This research has provided the first species list of macrofaunal foulers of recreational boats for Trinidad and Tobago. Additionally, the study has contributed to our knowledge of local biodiversity data, while attempting to address the issue of introduced species to our waters. Keywords biofouling, Chaguaramas, introduced species, Tobago, Trinidad, Perna viridis , Megabalanus zebra

133
Patterns of biodiversity in Trinidadian spiders
Joanne Sewlal Department of Life Sciences, The University of the West Indies, St. Augustine, Trinidad, West
Indies. Email: [email protected]
Abstract
Trinidad is a continental island, which was isolated from South America about 10,000 years ago. Habitat types on Trinidad and the fauna they contain are, therefore, representative of the northeastern part of the neighbouring continent. Trinidad’s small size makes studies of its biodiversity more manageable, while at the same time providing insights about South American biodiversity, which is little‐known for most invertebrate taxonomic groups.
In this study, the biodiversity of three orb‐weaving spider families, Araneidae, Nephilidae and Tetragnathidae, were examined in natural habitats. This study also looked at how factors such as habitat classification and geographic location affected spider biodiversity. According to Beard (1946), the natural vegetation of Trinidad can be classified into six formations containing 16 habitat types. Data was collected using the visual search and sweep‐netting methods at 46 localities throughout the island. Biodiversity was determined by examining the observed and estimated species richness, species distribution, distribution models and diversity indices between the formations and habitat types.
It was found that there was a high proportion of rare species, and that species of intermediate abundance were also found frequently throughout the study sites. Spider communities found in Trinidad were simple in nature and their ecology appeared correlated with a single factor, canopy cover, which seemed to have an effect on biodiversity with respect to species richness, diversity, evenness and dominance. Formation type had influence on observed species richness, species diversity and dominance but neither formation nor habitat influenced evenness. Geographic factors such as latitude, longitude and altitude did not influence diversity. The likelihood that climate change will affect abundance, species diversity, and species composition of spider communities in Trinidad is discussed. Keywords habitat classification, orb‐weaving spider, species richness, species diversity, Trinidad
134
An initial investigation into the third recorded mass‐bleaching event in Tobago
Jahson Alehmu Environmental Research Programme, Institute of Marine Affairs, Hilltop Lane, Chaguaramas,
Trinidad, West Indies, Email: [email protected]
Abstract
Mass coral bleaching is a phenomenon that affects multiple species over a large area. Historically, Tobago’s reefs have experienced extensive bleaching events during 1998 and 2005. Instances of milder, small scale bleaching were also reported in 2000, 2001 and 2003, affecting very few species. In September/October 2010, Tobago began experiencing its third recorded mass‐bleaching event. This investigation into coral bleaching in Tobago was initiated in August 2010, to determine the extent of the event, species affected, the degree of mortality, and to identify sites with good recovery, using qualitative and quantitative coral surveys. At the onset (August 2010), bleaching was more prevalent on shallow reef zones (~5m) compared to the reef slopes. However, it later spread down to the lower slope (33m), and was most severe at 10‐15m. Corals, (including the reef building genera Montastrea, Siderastrea and Diploria), sponges, octocorals and algae have all been affected. The most severe incidences of bleaching were at Speyside (northeastern Tobago) where up to 90% coral bleaching was noted, with widespread mortality of the Caribbean barrel sponge, Xestospongia muta, and extensive partial mortality of the yellow tube sponge, Aplysina fistularis. A steady rise in sea surface temperatures (SSTs) to levels well beyond the bleaching threshold of corals for this region (29.5°C), has been attributed as the cause to the widespread bleaching. The highest SSTs were noted at Speyside with temperatures up to 32 °C. Similarly, in situ temperature recorders registered water temperatures exceeding bleaching thresholds on the reef, with the highest temperatures also recorded at Speyside (31 °C). Investigations continue to assess the impact of the bleaching and recovery of the reefs. However, climate change predictions suggest that widespread mass bleaching events may become more frequent, and that greater resilience measures should be incorporated into reef management policy. Keywords Aplysina, Diploria, coral bleaching, Montastrea, sea‐surface temperature, Siderastrea, Tobago, Xestospongia

135
Spatial Distribution and extent of mangroves in Trinidad.
Rahanna Juman1, Deanesh Ramsewak 2
1Environmental Research Programme, Institute of Marine Affairs Hilltop Lane, Chaguaramas,
Trinidad, West Indies 2Geomatics Unit, Institute of Marine Affairs, Hilltop Lane, Chaguaramas, Trinidad, West
Indies, Email: [email protected], [email protected]
Abstract
Mangrove forests provide a range of provisioning, regulating, cultural and supporting services, yet they are the most threatened ecosystem worldwide. In Trinidad, mangrove dominated wetlands were, and continue to be impacted by reclamation for urbanization, industrialization and tourism in coastal areas. These wetlands are further threatened by human induced climate change. The goal of this project was to assess the status and trend of mangrove forests in Trinidad and establish a baseline for response to climate change impacts. Using a 2007 baseline, this study developed mangrove forest maps based on high‐resolution IKONOS imagery, GIS technology and extensive field surveys with GPS.
Estimated mangrove cover was higher than predicted, perhaps because of inaccuracies in historical data and in some cases because of re‐growth following past disturbances. In Trinidad, the majority of mangrove forests were found on the west coast. This coastline is occupied by more than 70% of the country’s population and has experienced the most intense development activities within the past three decades. The current mangrove coverage was estimated at 7,532 ha on the west coast compared to 1,132.8 ha on the east coast, 481.3 ha on the south coast and 0.3 ha on the north coast. The Caroni Swamp accounts for 56% of all mangroves in Trinidad and Tobago. While mangrove forests were impacted by land‐use changes and erosion, there were instances where the forests have expanded at the expense of freshwater wetland communities. As landward migration continues, coastal squeeze from built development on the landward edge of these wetlands can limit their movement. Site‐specific mangrove vulnerability assessment is recommended since the ecosystem is responding to other human threats besides climate change, and its response is determined by site physiography, hydrology and ecology. Keywords mangrove, climate change, land‐use, satellite imagery, Tobago, Trinidad

136
Developing public awareness and education tools to promote an understanding and appreciation of biodiversity in the coastal and
marine environment
Lori Lee Lum
Information Centre, Institute of Marine Affairs Hilltop Lane, Chaguaramas, Trinidad, West Indies
Email: [email protected]
Abstract Among the general public there is a lack of awareness of the role and functions that coastal and marine biodiversity have on the health of oceans and humans. In order to promote a greater level of public understanding of marine biodiversity, the Institute of Marine Affairs (IMA) has been engaged in school outreach and education as well as public awareness programmes. A combination of methods has been used. The general public is reached mainly through IMA participation in environmentally‐themed public exhibitions and through open‐access to its specialized library. However, much of the focus has been on schools.
The Marine Education Centre at the IMA hosts students at both the Primary and Secondary School level. In 2003, an outreach programme with four neighbouring schools was started. This programme was expanded in 2006, to schools in other areas throughout Trinidad and Tobago. To widen the reach of this programme, the teaching modules of the Programme are being developed into a Teaching Manual on CD.
Engagement is both at the school as well as through visits to the IMA. Visits to the IMA often include mentoring with researchers at research laboratories. Several methods are used in presentations including multimedia, and the use of posters and brochures developed with local examples of ecosystems. Much of this material is distributed to schools as teaching materials. Keywords awareness, education, exhibitions, marine biodiversity, schools, Trinidad

137
An innovative approach for monitoring abiotic factors influencing mangrove forest biodiversity in an estuarine ecosystem
M. Atwell1*, M. Wuddivira1, J. Gobin2 and D. Robinson3 1Department of Food Production, University of the West Indies, St. Augustine,
2Department of Life Sciences, University of the West Indies, St. Augustine, 3Centre for Ecology and Hydrology, Environment Centre, Wales, UK
*Correspondence: email‐ [email protected]
Abstract Mangrove forest biodiversity is declining worldwide due to encroachment and other human impacts. These ecosystems are very important since they protect vulnerable coastal and marine ecosystems from rising sea levels and storm tides. In Small Island Developing States (SIDs) such as Trinidad and Tobago, mangrove forest biodiversity faces unprecedented degradation due to anthropogenic land use and climate variability. With increasing urbanization and flow management via sluice gates, the hydrology and surface water flows in the Godineau swamp of Trinidad has been greatly altered. As a result, saline water has intruded into the swamp, altering soil salinity and changing the mangrove zonation patterns. This study investigates the water quality factors influencing mangrove zonation along the South Oropouche River, Godineau swamp. Aerial photos were analysed using GIS to determine mangrove boundary change. A novel geophysical approach (electromagnetic induction) was employed to assess apparent electrical conductivity (ECa) along two channels of the river (a 6 km forest and agricultural run‐off dominated channel and a 2km wetland run‐off dominated channel) bimonthly. A Horiba water quality checker U‐10 was used to determine the spatial distribution of water quality parameters along these two channels simultaneously with the ECa. Mangrove species were identified at 5m intervals along two sides of both channels. Results show that ECa was higher in the 2 km channel (2711 to 3178 mS/m) than in the 6 km channel (1776 to 2711 mS/m) while pH and DO levels were lower in the 2 km channel than in the 6 km channel. This suggests that salts accumulate while higher levels of decomposition take place in the more stagnant shorter channel. Red mangrove (Rhizophora mangle L), the hardiest of the three species, was dominant under adverse water quality conditions in the 2 km channel and at the sea ward edge of the river. The red mangrove is indeed better suited for wetland restoration efforts. Keywords electromagnetic induction, mangrove, Rhizophora mangle, South Oropouche, Trinidad, zonation

138
Monitoring and management of marine invasive alien species in Trinidad and Tobago.
Rosemarie Kishore 1, 3, Francis Weekes2 and Khama Philip1
1Institute of Marine Affairs, P.O. Box 3160, Carenage Post Office, Carenage, Trinidad and Tobago.
2 Maritime Services Division, Ministry of Work and Transport, ANSA House, 2nd Floor, Corner Queen and Henry Streets, Port of Spain, Trinidad and Tobago.
3 Corresponding Author: [email protected]
Abstract
The introduction of marine invasive alien species (IAS) has been reported to be one of the greatest threats to marine biological diversity. In addition, marine IAS causes economic harm to marine industries and related infrastructure as well as impacts on human health. While the green mussel, Perna viridis is the only known marine IAS in Trinidad, little is known of its ecological and economic impacts. Additionally, no system exists to monitor the introduction of marine IAS. As part of a larger regional IAS project, an ecological assessment of P. viridis is underway to determine its current distribution, the community structure of habitats associated with P. viridis, including pier pilings, mangrove prop roots, intertidal mud flats and artificial water channels. An economic assessment will focus on valuing the cost of P. viridis as a fouling organism since its introduction, as well as identify potential benefits. Findings from these assessments will inform efforts to mitigate the spread of P. viridis in Trinidad. Under the Globallast Partnership Project, biological surveys for ports in Trinidad and Tobago are currently being planned to established baseline conditions against which introductions of marine IAS via ships’ ballast water and associated sediments can be monitored. Biological sampling strategies for both projects will follow the CSIRO Centre for Research on Marine Introduced Pest (CRIMP) Protocol. These port biological baseline surveys will also assist in testing the efficacy of proposed legal, policy and institutional reforms related to the introduction of marine IAS from ballast water and associated sediments. Already draft amendments have been made to the Marine Pollution Bill 2008 and Shipping Bill 2008, which seeks to harmonise national legislations with that of the international Ballast Water Management Convention (2004). Keywords Perna viridis, port biological baseline survey, marine IAS, GloBallast

139
The extent of the sea turtle fishery in Tobago, West Indies
Michelle Cazabon‐Mannette
Department of Life Sciences, The University of the West Indies, St. Augustine, Trinidad, West Indies. Email: [email protected]
Abstract
Trinidad and Tobago currently provides only incomplete protection to sea turtles, through the Protection of Turtles and Turtle Eggs Regulations, 1975 of the Fisheries Act, (Ch. 67:51). On Tobago, a small artisanal fishery still exists, principally involving green (Chelonia mydas) and hawksbill (Eretmochelys imbricata) turtles. The current extent of this fishery is unknown but such information is necessary to inform the on‐going national debate on the review of the existing Regulations.
This study’s primary objective was to estimate the number of fishers in Tobago engaged in the fishery, their distribution around the island, the income they derived from this activity, and the numbers of turtles harvested. The knowledge and opinions of fishers on sea turtle biology and life history, and the local Regulations, was also investigated.
Two hundred and fifteen fishermen at 31 landing sites around Tobago were interviewed during 2007. Twenty‐two fishers at 12 landing sites confirmed that they targeted turtles, and fourteen considered turtles an important source of income. Twelve fishers reported turtle fishing year round while six reported limiting their fishing to the closed season. Only one turtle fisher demonstrated complete knowledge of the law, while nine had incomplete knowledge and eleven demonstrated no knowledge.
The turtle fishery in Tobago remains active and widespread; however, relatively few fishers there obtained significant income from this activity. It is evident that enforcement of the current regulations is inadequate. This study supports the call for a moratorium on the turtle harvest, until the legislation can be revised to reflect the current understanding of turtle biology, and the Fisheries Division has developed the capabilities to effectively enforce the legislation, closely monitor any legal fishery and the impact on the turtle population. Keywords Chelonia mydas, Eretmochelys imbricata, fishery, harvest, turtle, Tobago

140
Mitigating a threat of invasive alien species in the insular Caribbean‐ A Trinidad and Tobago Perspective.
Velda Ferguson‐Dewsbury
Ministry of Food Production, Land and Marine Affairs, St. Clair Port of Spain, Trinidad, West Indies. email: [email protected]
Abstract
This project aims to strengthen the regional efforts to address invasive alien species in the Caribbean. It sets out to accomplish this task by strengthening existing national capacity and management approaches, and by developing Caribbean‐wide cooperation frameworks on IAS. Such frameworks will facilitate the development of coordinated regional strategies for managing alien invasive species. The countries involved in the project are Bahamas, Dominican Republic, Jamaica, St. Lucia and Trinidad and Tobago.
Through this regional project, Trinidad and Tobago is engaged in three pilot projects, which include protecting the native biodiversity of the Nariva Swamp: protecting the local cocoa industry and germplasm from Frosty Pod Rot, and mitigating the spread of the marine invasive Perna viridis. These pilot projects strongly emphasise the need for capacity building and increased awareness of Invasive Alien Species (IAS) issues among stakeholder groups and are designed to enable their findings and lessons to be readily transferred to other sites in the Caribbean. Keywords invasive alien species, Trinidad, Tobago, Perna viridis, frosty pod rot, Nariva Swamp

141
Life and death in the savannas – a study of the rare terrestrial orchid Cyrtopodium parviflorum.
Howard P. Nelson1, 4, Sharon Laurent, Carlysle McMillan and Eleanor Devenish‐Nelson.
1 Department of Life Sciences, The University of the West Indies, St. Augustine, Trinidad,
West Indies. Email: [email protected] 2 Trinidad and Tobago Orchid Society, P.O. Box 1128 Port of Spain, Trinidad, West Indies
3 8 St Ann’s Road, Port of Spain, Trinidad, West Indies 4 Corresponding Author
Abstract The terrestrial orchid Cyrtopodium parviflorum Lindl. (1843) is an extremely range‐restricted species in Trinidad, with extant populations only known from the Aripo Savannas. Although widely distributed from northern‐South America to Brazil, its limited distribution in Trinidad makes it a conservation concern locally. In the open‐savanna habitat at Aripo, abiotic conditions are dominated by flooded conditions in the wet season and xeric conditions in the dry season, and the soil is extremely nutrient poor and acidic. One hundred and eighty nine individuals of C. parviflorum were marked and monitored over a 3‐year period (2008‐2010) within Savanna 5 of the Aripo Savannas, and monthly data were collected on flowering frequency, phenology, fruit set, and mortality rates within the population. Over three years, average annual flowering rates for C. parviflorum were 16.37%, mature seed‐set was 2.56% and natural mortality was 2.5%. Anthropogenic disturbance, in the form of fire and illegal collection of plants, contributed 32.8% to mortality in these plants over a one‐year period. This study suggests that C. parviflorum exhibits very low rates of reproductive effort, and points to an extremely K‐selected life history strategy by this orchid. These data also indicate that persistent anthropogenic disturbance such as that observed during this study could lead to a deterministic decline in the population of this orchid at the Aripo Savannas. Keywords Aripo Savannas, flowering, fruit set, phenology, mortality, Trinidad,

142
Index
abiotic ............................. 60, 61, 68, 73, 88, 91, 93, 94, 95, 137, 141 agouti ........................................................... 123, 124, 126, 127, 128 Annelida ...........................................................................61, 70, 132 anthropogenic disturbance ......................................................... 141 Aplysina ....................................................................................... 134 aragonite ............................................................................. 116, 117 Araneidae .................................................................................... 133 Aripo Savannas ............................... 99, 100, 101, 105, 106, 108, 141 Asclepiadoideae ................................................................. 88, 89, 98 awareness ........................................................................ v, 136, 140 Bahamas ...................................................................................... 140 Beach profiles ................................................................................ 42 behaviour ............................................................. 15, 17, 26, 28, 131 benthic macrofauna ..................................................... 31, 55, 68, 70 biofouling .................................................................................... 132 Biofouling .................................................................................... 132 biogeography ...................................................................6, 110, 114 biomonitoring ............................................................................. 111 Biorock ........................................................................................ 116 brucite ................................................................................. 116, 117 Bryozoa ....................................................................................... 132 buoyant weighing ................................................................ 116, 122 butterfly ............................. 30, 32, 33, 34, 35, 36, 37, 38, 39, 40, 41 Caligo minor .................................................................................. 30 Caroni Swamp ........................................ 8, 9, 10, 11, 12, 13, 16, 135 Cebus apella ........................................................... 19, 20, 25, 26, 28 Central Range ......................................... 20, 123, 124, 125, 126, 127 Chaguaramas..............19, 20, 21, 23, 24, 25, 26, 27, 28, 132, 134, 135, 136
Chelonia mydas ..................................................................... 54, 139 climate change ............................. vii, 68, 70, 71, 122, 133, 134, 135 cocoa ............................................ 30, 32, 34, 35, 36, 37, 38, 39, 140 Cook’s tree boa ........................................ 8, 9, 10, 11, 12, 13, 14, 16 coral bleaching ............................................................................ 134

143
coral reef .............................................................................. 116, 117 Corallus ruschenbergerii .............................................................. 8, 9 cracid ............................................................................................ 131 Crustacea ..................................................................................... 132 crustose microlichens .................................................................. 113 Cyrtopodium parviflorum ............................................................. 141 Dasyprocta leporina ..................................................... 123, 124, 129 Demography .................................................................................. 19 diet ............................................................................. 25, 28, 70, 131 Diploria ......................................................................................... 134 direct current ............................................... 116, 117, 118, 120, 121 distance sampling ........ 8, 10, 11, 12, 13, 14, 16, 17, 18, 19, 22, 123 distribution..................6, 14, 16, 21, 31, 37, 41, 53, 54, 55, 56, 60, 63, 67, 70, 88, 89, 91, 92, 93, 96, 97, 110, 111, 124, 133, 138, 139, 141
disturbance..............30, 31, 32, 33, 34, 35, 36, 39, 40, 41, 42, 84, 99, 110, 141
diversity....................v, 2, 6, 7, 22, 28, 30, 31, 32, 33, 34, 35, 36, 39, 40, 41, 55, 63, 66, 68, 72, 73, 74, 76, 77, 78, 79, 81, 82, 84, 85, 86, 110, 113, 114, 133, 138
Dominican Republic ..................................................................... 140 edaphic........................................................... 99, 100, 106, 107, 125 education ..................................................................................... 136 electrolytic mineral accretion ...................................................... 116 electromagnetic induction ........................................................... 137 endemic ................. 15, 19, 20, 21, 27, 88, 89, 98, 99, 100, 106, 131 Eretmochelys imbricata ................................................... 53, 54, 139 Euptchia hermes ............................................................................ 30 Euptchia penelope.................................................................... 30, 35 exhibitions .................................................................................... 136 fires ................................ 99, 100, 101, 102, 103, 105, 106, 107, 108 fishery .......................................................................................... 139 flowering ................................................ 3, 73, 97, 99, 105, 106, 141 forest....................7, 17, 20, 21, 22, 25, 28, 30, 32, 34, 35, 36, 37, 38, 40, 41, 72, 75, 81, 85, 86, 87, 95, 100, 102, 107, 110, 113, 114, 124, 125, 127, 128, 129, 135, 137
frosty pod rot ............................................................................... 140

144
fruit set ........................................................................................ 141 game mammal .................................................................... 123, 124 Genetic diversity ..................................................................... 72, 77 germplasm .................................................................................. 140 GloBallast .................................................................................... 138 Godineau swamp ........................................................................ 137 grain size .............................................. 55, 59, 60, 63, 64, 65, 67, 68 Grande Riviere ..................................... 32, 33, 35, 36, 38, 39, 42, 53 group size .............................................................................. 25, 131 habitat.............8, 9, 14, 15, 20, 22, 25, 28, 30, 31, 34, 35, 40, 42, 68, 70, 87, 88, 91, 95, 96, 97, 100, 106, 131, 133, 141
habitat classification ................................................................... 133 habitat preference ................................................................ 42, 106 harvest .......................................................................... 20, 124, 139 hunting ............................... 19, 20, 99, 101, 105, 124, 127, 128, 131 indicator ................................................................. 30, 33, 38, 40, 96 intertidal ..................... 55, 56, 59, 62, 63, 64, 65, 66, 67, 68, 70, 138 introduced species ................................................................ 19, 132 invasive alien species .......................................................... 138, 140 Invertebrate .................................................................................... 2 Jamaica .................................................................................. 85, 140 King’s estimator .......................................................... 123, 126, 127 land‐use ................................................................................. 32, 135 lichens ..................................................................110, 111, 112, 114 line transect ............................... 8, 11, 12, 17, 18, 91, 123, 125, 126 macrolichen ................................................................................. 110 management plan .......................................... 99, 100, 101, 105, 108 mangrove ............................... 8, 9, 10, 11, 14, 58, 85, 135, 137, 138 marine biodiversity ............................................................... 69, 136 Maxent ....................................................... 88, 91, 92, 94, 95, 96, 98 Megabalanus zebra ..................................................................... 132 Metastelma freemani ........................................................ 88, 89, 92 microlichens ................................................................................ 110 Millepora alcicornis ..................................................... 116, 119, 121 Mollusca ...................................................................................... 132 Montastrea ......................................................................... 121, 134 Mora excelsa ................................................................ 72, 73, 79, 86

145
mortality .................................... 17, 73, 81, 100, 105, 106, 134, 141 Nariva Swamp .................................................................. 20, 28, 140 Nephilidae .................................................................................... 133 Nereis ........................................................................... 55, 64, 66, 67 Open savannas ............................................................................... 99 orb‐weaving spider ...................................................................... 133 orchid ........................................................................................... 141 particle size ........................................................................ 42, 68, 70 percentage polymorphism ................................................. 72, 76, 77 Perna viridis ................................................................. 132, 138, 140 pH ................................... 55, 58, 60, 63, 68, 75, 88, 91, 93, 120, 137 phenology .................................................................... 108, 131, 141 Pipile pipile ................................................................................... 131 piping‐guan .................................................................................. 131 population density ................................. 8, 10, 11, 12, 14, 16, 19, 21 population estimate ............................................................... 15, 123 Porifera .................................................................................. 62, 132 Rhizophora mangle ................................................................ 10, 137 salinity .................................................................. 55, 58, 60, 65, 137 sandy beaches ............................................ 55, 56, 57, 61, 66, 69, 70 satellite imagery .......................................................................... 135 schools ......................................................................................... 136 sea turtles .................................................................. 42, 53, 54, 139 sea‐surface temperature ............................................................. 134 sediment composition ................................................................... 42 Shannon diversity .......................................................................... 81 Siderastrea ................................................................................... 134 South Oropouche ......................................................................... 137 species composition ............................... 99, 100, 102, 104, 107, 133 species diversity ............................................................. 65, 102, 133 species richness ................... 2, 31, 34, 36, 37, 40, 89, 113, 115, 133 squatting ........................................................................................ 99 St. Lucia ........................................................................................ 140 Tetragnathidae ............................................................................. 133 tropical coastlines .................................................................... 55, 56 tropical tree ............................................................................. 72, 86 Tufted capuchin ............................................................................. 19

146
turtle ................................................................................42, 53, 139 Turtle Beach .................................................................................. 42 unbiased heterozygosity ......................................................... 72, 76 Venezuela ..................................................... 9, 28, 72, 73, 74, 75, 79 vertebrate ............................................................................ 2, 4, 105 voucher specimens ..................................................................... 110 Xestospongia ............................................................................... 134 zonation ....................................... 55, 56, 59, 64, 66, 67, 68, 70, 137