proceedings from a workshop on gene flow in fragmented ... · proceedings from a workshop on gene...
TRANSCRIPT
National Center for Ecological Analysis and Synthesis
Proceedings from a Workshop on Gene Flow inFragmented, Managed, and Continuous Populations
Victoria L. SorkUniversity of Missouri, St. Louis
Diane CampbellUniversity of California, Irvine
Rodney DyerUniversity of Missouri, St. Louis
Juan FernandezUniversity of Missouri, St. Louis
John Nason University of Iowa
Remy Petit INRA, Bordeaux, France
Peter Smouse Rutgers University
Eleanor Steinberg University of Washington
Citation: Sork, Victoria L., Diane Campbell, Rodney Dyer, Juan Fernandez, John Nason,Remy Petit, Peter Smouse, and Eleanor Steinberg. 1998. Proceedings from aWorkshop on Gene Flow in Fragmented, Managed, and Continuous Populations. Research Paper No. 3. National Center for Ecological Analysis and Synthesis, Santa
Barbara, California. Available at "http://www.nceas.ucsb.edu/nceas-web/projects/2057/nceas-paper3/".

Proceedings from a Workshop on Gene Flow inFragmented, Managed, and Continuous Populations
January 5-9, 1998National Center for Ecological Analysis and Synthesis
University of California-Santa Barbara
Proceedings written byV. L Sork, D. Campbell, R. Dyer, J. Fernandez, J. Nason, R. Petit, P. Smouse, and E. Steinberg
Workshop Organizer:Victoria L. Sork, NCEAS sabbatical research fellow and University of Missouri-St. Louis
Participants:W. Thomas Adams, Oregon State UniversityDiane Campbell, University of California-IrvineFrank Davis, NCEAS and University of California-Santa BarbaraRodney Dyer, University of Missouri-St. LouisJuan Fernandez, University of Missouri-St. LouisMichael Gilpin, University of California-San DiegoJames Hamrick, University of GeorgiaJohn Nason, University of IowaJoseph Neigel, University of Southwest LouisianaRémy Petit, INRA-Bordeaux, FranceOuti Savolainen, University of OuluPeter Smouse, Rutgers UniversityEleanor Steinberg, University of Washington
Abstract. A workshop was held at the National Center for Ecological Analysis and Synthesis todiscuss gene flow on an ecological, rather than an evolutionary, time scale. Recently, ecologists,conservation biologists, and ecosystem managers have been interested in monitoring on-goinggene flow to understand environmental and landscape influences on genetic variation in existingpopulations. The current paradigm emphasizes the concern about isolation due to reduction ingene flow as a consequence of human landscape alteration. However, evidence also suggests thatlandscape change can increase gene flow with potential detrimental impact on local adaptation.This ambiguity in gene flow effects calls for a sensitive approach to the measurement of genemovement. During the workshop, our first goal was to review current approaches to the estimationof gene flow and their usefulness for measuring on-going gene flow. We concluded that indirectmethods based on F-statistics are not sufficiently sensitive to measure gene flow on this scale.Instead, direct methods of genealogical analysis offer a reliable alternative at a small scale but mayhave more limited utility for scaling up. Because gene flow occurs on a landscape scale, weexplored the usefulness of current population genetic approaches for scaling up our estimates andwe discussed the potential contribution of metapopulation and landscape models. We evaluated therelationships between population genetic and metapopulation models, but concluded a newsynthesis integrating the two approaches is not yet ready for development. However, workshopparticipants explored in detail a new approach to the study of gene flow that would be feasible atthe landscape scale and might generate a parameter or estimator of migration needed formetapopulation and landscape models. Two different approaches are described by John Nasonand by Peter Smouse in Part II of these proceedings. Workshop presentations and discussionaddress issues of general concern about gene flow on an ecological time scale but the emphasiswas largely on plant systems.
Gene flow workshop proceedings page 2
Contents of Proceedings:
Part I: Current approaches: Gene flow on ecological time scales(Summary of workshop discussions)
IntroductionIndirect methods using F-statistics
Box A. Genetic structure of subdivided populations. Shortcomings of indirect methods
Direct methods using parentage analysisBox B. Neighborhood size of continuous populations
Box C. Guidelines for use of models to estimate pollen-mediated immigration. Table 1. Sample sizes needed for direct estimation of gene flow Shortcomings of direct methods
Gene flow and adaptationMetapopulation and landscape approaches to gene flow
Part II. Two essays on new approaches.A. Scaling up: Enlarging the spatial scale of parentage analysis (John Nason)B. Thoughts on a genetic structure-like approach to pollen flow (Peter Smouse)
Literature Cited for Parts I and II
Part III. Abstracts of workshop presentations
Appendix A. Gene-flow related software available through NCEAS web site
Part I. Current approaches: Gene flow on ecological time scales(Summary of Workshop Discussions)
Introduction
The study of gene flow (i.e. movement of genes among populations) has been a vital topic
in evolutionary biology. Most theoretical models of gene flow stem from concepts developed by
Sewall Wright that are based either on continuous populations, using an isolation by distance
approach (Wright 1943; Wright 1946), or on populations as islands that become differentiated
through mutation and genetic drift. The island model assumes equilibrium conditions, gene flow
among all populations, and populations of equal size. Recently, ecologists, conservation
biologists, forest managers, and ecosystem managers have become interested in gene flow on an
ecological time scale (Sork abstract. Part III in these proceedings). Using biochemical or molecular
genetic markers, many of these scientists have borrowed the genetic structure approach to estimate
gene flow (Nem). Yet, both the time scale and the spatial scale of these studies violate the
assumptions of gene flow models based on F-statistic or other genetic structure approaches.
An alternative way to estimate gene flow is to use parentage analysis that can identify
parents (usually fathers) and then quantify the pattern of gene movement. Meagher (1986)
presented an example of paternity analysis in a plant population in order to quantify variance in
reproductive success, as a function of distance. Subsequent modifications of this basic approach
allow this technique to be used for the study of gene movement into populations (Devlin and
Ellstrand 1990; Roeder et al. 1989; Smouse and Meagher 1994). The parental analysis approach
provides a direct estimate of gene movement, which is a critical element of gene flow, but it does
not yield an estimate of Nem, because it is usually based on one or two reproductive episodes,
rather than gene flow over a whole generation.
Many studies of current gene flow, especially those in conservation biology, are aimed at
understanding gene movement on a regional or landscape scale. As continuous populations
become fragmented, they may assume metapopulation dynamics, through extinction and
recolonization events of the different fragments. It is not clear whether recent modeling approaches

Gene flow workshop proceedings page 4
in metapopulation biology and landscape ecology offer viable insight on gene movement nor
whether current measurement of gene movement contributes the migration estimates needed for
landscape models.
In this workshop report, we summarize our discussions of gene flow on an ecological time
scale. A major emphasis of the workshop was the application of gene flow models to tree
populations, although some participants work with other types of organisms. Most applications of
gene flow models have been primarily in small populations (natural or managed) or within stands
of larger populations. Most work has emphasized pollen dispersal dynamics within stand and the
proportion of outside pollen into stands. However, little work to date has examined gene flow
dynamics among stands. The specific objectives were: (1) to review indirect and direct methods
of estimating gene flow; (2) to review available statistical models for estimating gene flow; and (3)
to evaluate the extent to which landscape approaches and spatially explicit models can be
incorporated into gene flow studies. The workshop included: subgroup discussions (Part I of
these proceedings); discussion of new approaches (Part II of these proceedings); presentations (see
abstracts in Part III of these proceedings); and review of available software programs (see
Appendix A. Gene flow related Software and NCEAS web site).
Indirect methods using F-statistics
Historically, the estimation of gene flow has relied on indirect methods or those based on
Wright’s parameter of population differentiation FST, (see Box A). In many respects, FST is an
ideal parameter that summarizes the evolutionary history of the populations under study, yielding
insights about the relative importance of gene flow and genetic drift. Moreover, the relative ease of
collecting the requisite data and the facility of analysis make indirect methods an obvious choice for
many evolutionary and conservation biology studies. Neigel (1997) summarizes the advantages of
using the indirect approach for estimating FST , as a parameter to estimate Nem , and also describes
recent advances in the analysis of genealogical relationships of genes (coalescent approach) as an
alternative method of estimating gene flow (see Neigel abstract, Part III of these proceedings).
Gene flow workshop proceedings page 5
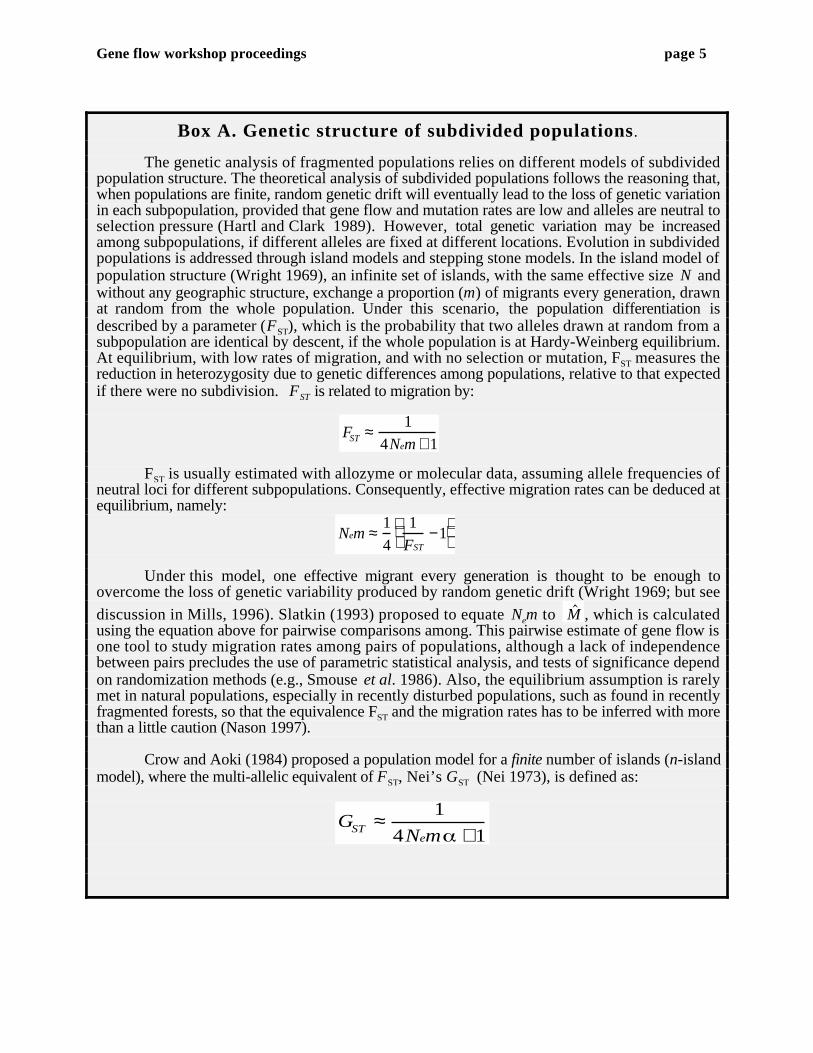
Box A. Genetic structure of subdivided populations.
The genetic analysis of fragmented populations relies on different models of subdividedpopulation structure. The theoretical analysis of subdivided populations follows the reasoning that,when populations are finite, random genetic drift will eventually lead to the loss of genetic variationin each subpopulation, provided that gene flow and mutation rates are low and alleles are neutral toselection pressure (Hartl and Clark 1989). However, total genetic variation may be increasedamong subpopulations, if different alleles are fixed at different locations. Evolution in subdividedpopulations is addressed through island models and stepping stone models. In the island model ofpopulation structure (Wright 1969), an infinite set of islands, with the same effective size N andwithout any geographic structure, exchange a proportion (m) of migrants every generation, drawnat random from the whole population. Under this scenario, the population differentiation isdescribed by a parameter (FST), which is the probability that two alleles drawn at random from asubpopulation are identical by descent, if the whole population is at Hardy-Weinberg equilibrium.At equilibrium, with low rates of migration, and with no selection or mutation, FST measures thereduction in heterozygosity due to genetic differences among populations, relative to that expectedif there were no subdivision. FST is related to migration by:
FST ≈1
4Nem + 1
FST is usually estimated with allozyme or molecular data, assuming allele frequencies ofneutral loci for different subpopulations. Consequently, effective migration rates can be deduced atequilibrium, namely:
Nem ≈1
4
1
FST−1
Under this model, one effective migrant every generation is thought to be enough toovercome the loss of genetic variability produced by random genetic drift (Wright 1969; but see
discussion in Mills, 1996). Slatkin (1993) proposed to equate Nem to M , which is calculatedusing the equation above for pairwise comparisons among. This pairwise estimate of gene flow isone tool to study migration rates among pairs of populations, although a lack of independencebetween pairs precludes the use of parametric statistical analysis, and tests of significance dependon randomization methods (e.g., Smouse et al. 1986). Also, the equilibrium assumption is rarelymet in natural populations, especially in recently disturbed populations, such as found in recentlyfragmented forests, so that the equivalence FST and the migration rates has to be inferred with morethan a little caution (Nason 1997).
Crow and Aoki (1984) proposed a population model for a finite number of islands (n-islandmodel), where the multi-allelic equivalent of FST, Nei’s GST (Nei 1973), is defined as:
GST ≈1
4Nem +1

Gene flow workshop proceedings page 6
Box A. Continued.
where α = [n/(n - 1)]2, and n is the number of subpopulations. The parameter α has a maximumvalue of 4 when there are two subpopulations, and converges to 1 for many subpopulations. Thisimplies that for fewer populations, the homogeneity among populations at equilibrium is achievedwith fewer migrants. When there are many subpopulations, the equation reduces to Wright’sisland model. If populations are of unequal size, Ne is the harmonic mean of the subpopulation(Lande and Barrowclough 1987). Like Wright’s model, the n-island model does not includespatial structure, and is more appropriate for studying small numbers of populations (Slatkin1985a; Slatkin 1989).
Other methods have been developed to estimate gene flow indirectly. Slatkin’s (1985) rare allelemethod is based on the observation that the logarithm of Nm decreases approximately as a linearfunction of the average frequencies of private alleles in subdivided populations. However, thisapproach requires the presence of private alleles and large sample sizes (see Slatkin and Barton1989). Slatkin and Maddison (Slatkin 1989, 1991; Slatkin and Maddison 1989, 1990) havedeveloped another indirect method of estimating historical gene flow that is based on phylogenies ofalleles and coalescent theory. (Also see Neigel 1997 for discussion of these approaches).
Gene flow has often been modeled differently in subdivided and continuous populations.
For subdivided populations, the indirect approach of F-statistics, as described above, is usually
employed. In contrast, for continuous populations, it might be more common to estimate
neighborhood size, based on Wright’s isolation by distance approach (see Box B). This latter
approach is not an indirect method.
Shortcomings of Indirect Methods
The indirect approach of using F-statistics or F-statistic-like methods to estimate gene flow,
evolutionary lineages, and population relationships (Neigel 1997) has made valuable contributions
to evolutionary biology. However, this approach can be misapplied to studies on a ecological time
scale (Steinberg abstract, Part III of these proceedings; Steinberg and Jordan 1997). The result is
that the literature in conservation biology includes many studies that report alleged levels of gene
flow, based on FST estimates, that reflect long-term history, not ongoing processes. For the
purposes of answering gene flow questions on an ecological time scale, FST methods are not
advisable, and should be regarded as mere descriptors of historical genetic structure, along with
Gene flow workshop proceedings page 7
other measures of genetic diversity. The computational robustness of FST is one of its statistical
advantages, but its insensitivity to rare alleles results in an estimate that ignores on-going dynamics
that are directly relevant to the interests of ecologists, conservation biologists, and ecosystem
managers. We do not discount the utility of genetic structure statistics for conservation or
management objectives. In fact, if one wishes to measure them, recent work on optimal sample
size can provide some useful guidelines on how to maximize sampling effort (see Fernandez
abstract, Part III in these proceedings). Nonetheless, we conclude that, for the study of ongoing
gene flow, indirect approaches are not appropriate.
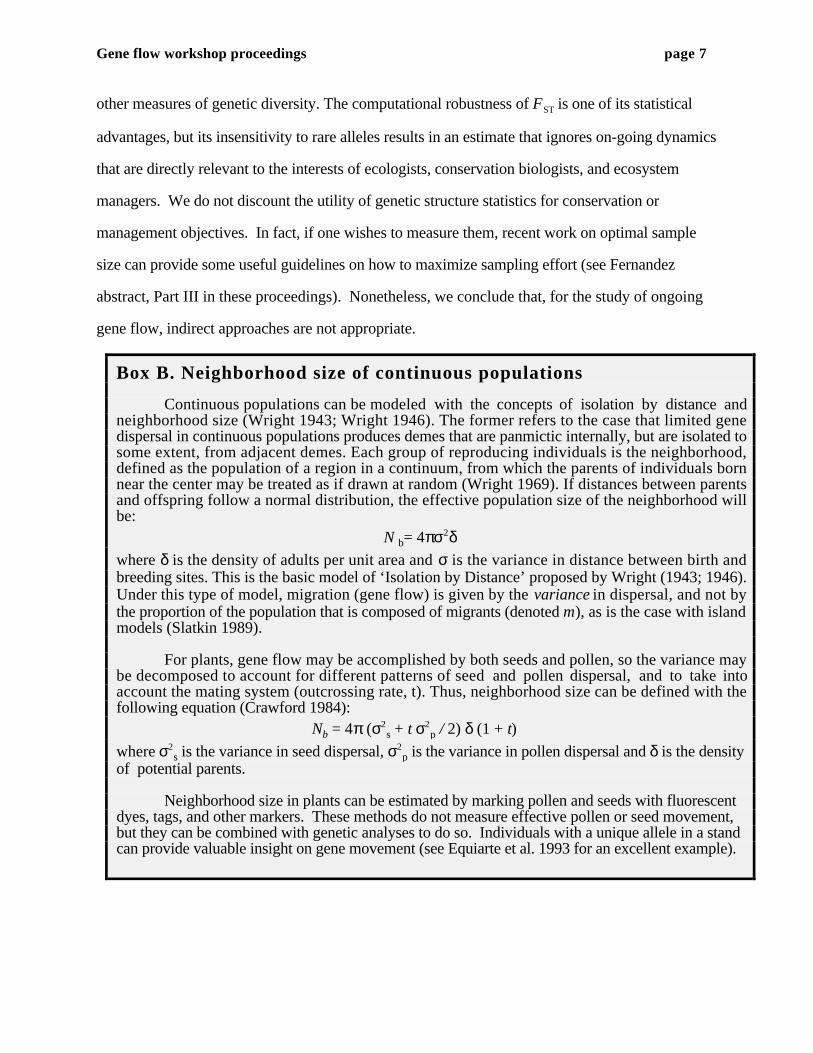
Box B. Neighborhood size of continuous populations
Continuous populations can be modeled with the concepts of isolation by distance andneighborhood size (Wright 1943; Wright 1946). The former refers to the case that limited genedispersal in continuous populations produces demes that are panmictic internally, but are isolated tosome extent, from adjacent demes. Each group of reproducing individuals is the neighborhood,defined as the population of a region in a continuum, from which the parents of individuals bornnear the center may be treated as if drawn at random (Wright 1969). If distances between parentsand offspring follow a normal distribution, the effective population size of the neighborhood willbe:
N b= 4πσ2δwhere δ is the density of adults per unit area and σ is the variance in distance between birth andbreeding sites. This is the basic model of ‘Isolation by Distance’ proposed by Wright (1943; 1946).Under this type of model, migration (gene flow) is given by the variance in dispersal, and not bythe proportion of the population that is composed of migrants (denoted m), as is the case with islandmodels (Slatkin 1989).
For plants, gene flow may be accomplished by both seeds and pollen, so the variance maybe decomposed to account for different patterns of seed and pollen dispersal, and to take intoaccount the mating system (outcrossing rate, t). Thus, neighborhood size can be defined with thefollowing equation (Crawford 1984):
Nb = 4π (σ2s + t σ2
p / 2) δ (1 + t)
where σ2s is the variance in seed dispersal, σ2
p is the variance in pollen dispersal and δ is the densityof potential parents.
Neighborhood size in plants can be estimated by marking pollen and seeds with fluorescentdyes, tags, and other markers. These methods do not measure effective pollen or seed movement,but they can be combined with genetic analyses to do so. Individuals with a unique allele in a standcan provide valuable insight on gene movement (see Equiarte et al. 1993 for an excellent example).
Gene flow workshop proceedings page 8
Direct methods using parentage analysis
For the study of gene movement on an ecological time scale, parentage analysis in the sense
of Roeder et al (1989), Adams and Birkes (1991), Devlin and Ellstrand (1990), and Smouse and
Meagher (1994) is currently the most effective approach (see Nason abstract, Part III of these
proceedings). This form of gene movement is part of the dynamics of gene flow, but we caution
that the results cannot be interpreted as interpopulation gene flow, characterized by Nm or M , the
effective number of migrants per generation, on an evolutionary time scale. Moreover, parentage
analysis based estimates of gene movement measures immigration into a circumscribed area that
may or may not be an “population”. However, one can use parentage analysis to estimate the
distribution of dispersal distances, sometimes yielding a dispersion curve analogous to that of
Wright’s Isolation by Distance model (see Box B). One can also use parentage analysis to examine
pollen or seed mediated gene movement. Here we focus on four related models that provide
estimates of pollen-mediated gene movement. The general model of parental analysis uses progeny
from known maternal parents to assign paternity to a set of potential pollen donors, while the
power of other models is to estimate the rate of pollen immigration from outside the experimental
population.
Individual paternity model. If the objective is to quantify within population patterns of
pollen movement and individual male reproductive success (including selfing) then the methods of
Roeder et al. (1989; see also Smouse and Meagher 1994) provide the greatest detail. Basically,
this approach assumes that the focal population is isolated from outside pollen sources and that
genotypes of all potential males are known. Potential problems with this method are that it can
require extensive sampling of progeny per female, and, due to constraints on assayable genetic
information, often requires the number of potential pollen donors to be relatively small. Moreover,
these methods do not adjust estimates (and variances) of male reproductive success for cryptic gene
flow. This adjustment is important, because cryptic gene movement biases estimates of male
fertility unevenly for males with low and high RS. Nason (in prep.) is working on a modification
of this method to make the adjustment (Nason abstract, Part III of these proceedings). However,
Gene flow workshop proceedings page 9
even with an adjustment for cryptic gene flow, this approach may underestimate fertility
differences among males (Adams 1992a; Adams, Birkes, and Erickson 1992). This paternity
approach is useful for generating a pollen dispersion curve and for estimating gene movement from
outside a circumscribed area, although, as noted below, there are more powerful methods for
estimating gene “immigration”. (This task can be done using PollenGF by Nason (Appendix A)
and on NCEAS web site or using software available from Devlin).
Neighborhood model. This neighborhood model of Adams and Birkes (Adams and
Birkes 1991) groups fathers by distance and fits a dispersal function to the data, instead of
estimating individual male RS. This approach provides estimates of selfing, the probability of
within-population dispersal as a function of inter-mate distance, and pollen movement into an
experimentally defined population. The neighborhood model is similar to the pollen gene
movement model, but it differs by not estimating fertilities of individual males within a
circumscribed area or neighborhood. Instead, it estimates parameters relating mating success to
factors, such as distance, relative pollen fertility, or tree size (e.g., Adams abstract, Part III of
these proceedings). The Individual Paternity Model can also be used to estimate the relationship
between mating success to these same parameters by using individual male fertilities. In the
individual paternity model, there are no assumptions about fertilities but the model estimates them
poorly. The neighborhood model requires applying reasonable models from which estimates of
model parameters can be derived. This approach works best for species with populations with
evenly distributed individuals, but this spatial pattern is not a requirement. The program, as
written, is limited to situations where pollen (or egg, for seed dispersal) haplotypes can be
determined (possible with embryo-megametophyte systems in conifers or when DNA markers
from male-inherited organelles are used). (See program by Adams and Birkes (Appendix A) and
NCEAS web site).
Pollen gene movement model. This method extends the paternity exclusion approach
developed by Devlin and Ellstrand (Devlin and Ellstrand 1990) to estimate both the apparent and
cryptic components of total immigration (Devlin and Ellstrand 1990). So far, this approach as
Gene flow workshop proceedings page 10
been applied to patchily distributed populations (e.g. Ellstrand and Marshall 1985; Hamrick and
Schnabel 1986). Nason (in prep.) is modifying this model so that it jointly estimates individual
fertilities within a circumscribed area and immigration from outside that area. Both this model and
the neighborhood model described below can be done with artificially circumscribed populations
within larger continuous populations (e.g., see Dyer abstract, Part III of these proceedings, Dyer
and Sork, in prep.) or within isolated population patches. (See PollenGF by Nason (Appendix A)
and the NCEAS web site for these proceedings.)
Multiple population gene movement model. Another modification of the parentage
approach is developed by Kaufman, Smouse, and Alvarez-Buylla (Kaufman et al. 1998; see also
Smouse et al. abstract, Part III of these proceedings). Unlike the neighborhood and pollen gene
flow models described above, in which pollen migration into the study population is assumed to
have a single source, it implements more source populations. The current version is restricted to
plant populations where all known source populations can be identified and sampled.
Any of the four models could be modified to include seed-mediated gene movement,
although such estimates can be more difficult to obtain. Estimating seed movement with molecular
markers is hindered by the small rate of mutation in cpDNA that produces very little intrapopulation
variation. Yet, cytoplasmic markers should not be dismissed, because they can provide valuable
information about pollen and seed-mediated gene movement (see Petit abstract, Part III of these
proceedings). Indeed, it has been found that some species (soy bean, rice, and some wild species)
contain hypervariable ssr sequences that are very promising for seed flow studies (e.g., McCauley
1994; McCauley 1995b). For conservation-motivated research, the extension of these models to
seed-mediated movement may be essential for the estimation of colonization probabilities based on
genetic markers, and that task lies ahead of us.
The choice of any of the four methods above is determined by the question. If we want
variance in male fertilities within an area, as well as gene movement, then we need to use either the
individual paternity or the pollen gene movement models. Both will require high exclusion
probabilities and a large number of progeny per mother. Alternatively, if we are interested in gene

Gene flow workshop proceedings page 11
movement into an area, then lower exclusion probabilities and sample sizes may be adequate. The
last three approaches can accomplish this estimation, although the neighborhood model can only be
used for gymnosperms. By reducing the exclusion probability and sample sizes per mother, one
could sample more sites. (See Box C for optimal sampling strategy.)
The use of parentage models to evaluate pollen-mediated gene flow is often quite effective
at demonstrating the consequences of pollination. However, this approach can be complemented
effectively with directly measured ecological data such as pollinator behavior or seedling
establishment. In some cases, pollinator behavior may be easier to study and equally informative
about the nature of pollen-mediated gene flow (Campbell abstract, Part III of these proceedings).
In conclusion, we recommend the use of genealogically-based direct estimates for small
scale measurement of local gene movement. The genealogical approach has limitations (see
section on Shortcomings of Direct Methods below). Nonetheless, numerous studies have already
utilized this approach effectively to study gene flow in fragmented (Ellstrand 1992; Ellstrand and
Marshall 1985; Hamrick et al. 1995; Nason and Hamrick 1997) and, to a lesser extent, continuous
populations (Adams and Birkes 1991; Friedman and Adams 1985; Dyer and Sork, in prep.). The
choice of any of the four methods above should be determined by your question. If one wants
variance in male fertilities as well as gene movement within an area than the individual fertility or
pollen gene movement models are preferable. But in both cases, you will need high exclusion
probabilities and large number of progeny per mother. If you are more interested in gene
movement into an area, then the last three models will all be appropriate. In this case, lower
exclusion probabilities and sample sizes may be adequate. These changes in sampling strategy
would permit sampling of more sites.
Gene flow workshop proceedings page 12
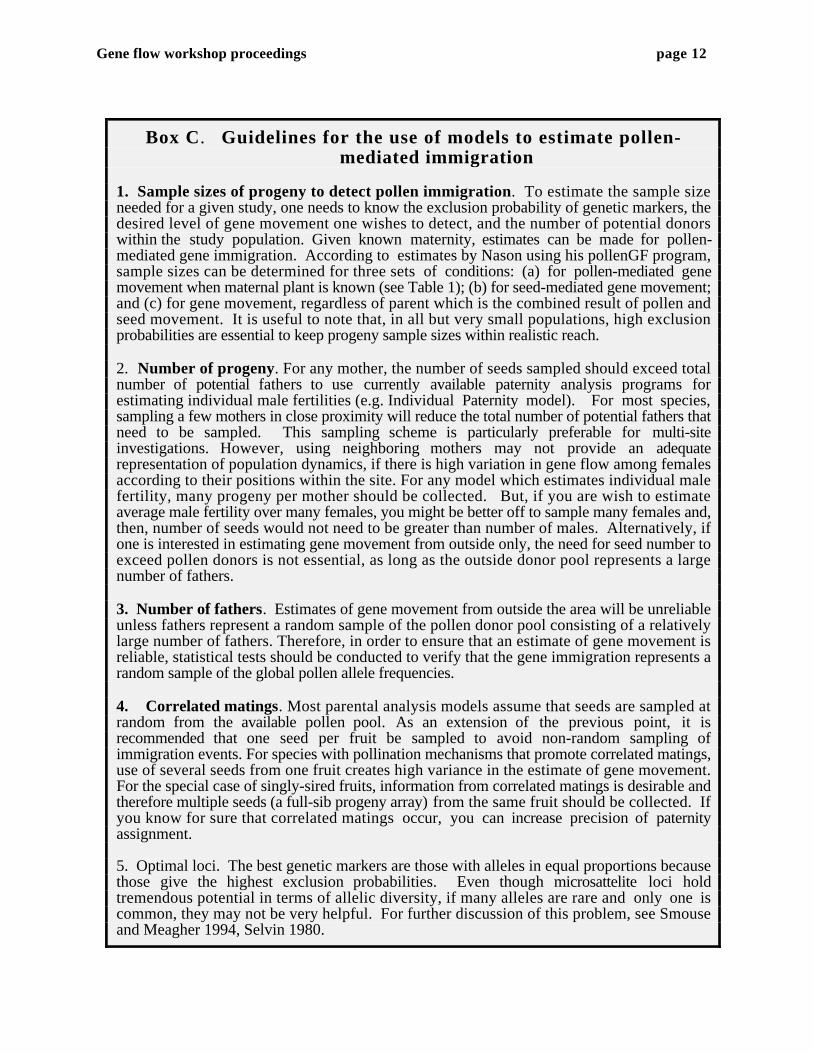
Box C. Guidelines for the use of models to estimate pollen-mediated immigration
1. Sample sizes of progeny to detect pollen immigration. To estimate the sample sizeneeded for a given study, one needs to know the exclusion probability of genetic markers, thedesired level of gene movement one wishes to detect, and the number of potential donorswithin the study population. Given known maternity, estimates can be made for pollen-mediated gene immigration. According to estimates by Nason using his pollenGF program,sample sizes can be determined for three sets of conditions: (a) for pollen-mediated genemovement when maternal plant is known (see Table 1); (b) for seed-mediated gene movement;and (c) for gene movement, regardless of parent which is the combined result of pollen andseed movement. It is useful to note that, in all but very small populations, high exclusionprobabilities are essential to keep progeny sample sizes within realistic reach.
2. Number of progeny. For any mother, the number of seeds sampled should exceed totalnumber of potential fathers to use currently available paternity analysis programs forestimating individual male fertilities (e.g. Individual Paternity model). For most species,sampling a few mothers in close proximity will reduce the total number of potential fathers thatneed to be sampled. This sampling scheme is particularly preferable for multi-siteinvestigations. However, using neighboring mothers may not provide an adequaterepresentation of population dynamics, if there is high variation in gene flow among femalesaccording to their positions within the site. For any model which estimates individual malefertility, many progeny per mother should be collected. But, if you are wish to estimateaverage male fertility over many females, you might be better off to sample many females and,then, number of seeds would not need to be greater than number of males. Alternatively, ifone is interested in estimating gene movement from outside only, the need for seed number toexceed pollen donors is not essential, as long as the outside donor pool represents a largenumber of fathers.
3. Number of fathers. Estimates of gene movement from outside the area will be unreliableunless fathers represent a random sample of the pollen donor pool consisting of a relativelylarge number of fathers. Therefore, in order to ensure that an estimate of gene movement isreliable, statistical tests should be conducted to verify that the gene immigration represents arandom sample of the global pollen allele frequencies.
4. Correlated matings. Most parental analysis models assume that seeds are sampled atrandom from the available pollen pool. As an extension of the previous point, it isrecommended that one seed per fruit be sampled to avoid non-random sampling ofimmigration events. For species with pollination mechanisms that promote correlated matings,use of several seeds from one fruit creates high variance in the estimate of gene movement.For the special case of singly-sired fruits, information from correlated matings is desirable andtherefore multiple seeds (a full-sib progeny array) from the same fruit should be collected. Ifyou know for sure that correlated matings occur, you can increase precision of paternityassignment.
5. Optimal loci. The best genetic markers are those with alleles in equal proportions becausethose give the highest exclusion probabilities. Even though microsattelite loci holdtremendous potential in terms of allelic diversity, if many alleles are rare and only one iscommon, they may not be very helpful. For further discussion of this problem, see Smouseand Meagher 1994, Selvin 1980.
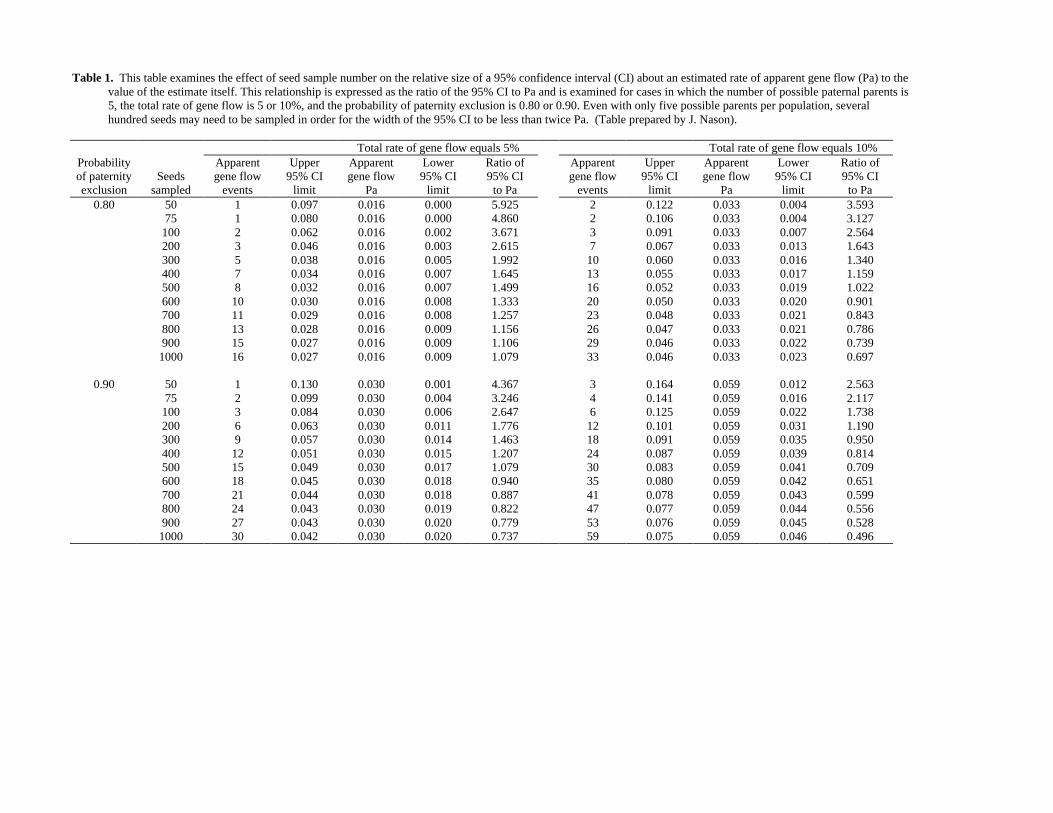
Table 1. This table examines the effect of seed sample number on the relative size of a 95% confidence interval (CI) about an estimated rate of apparent gene flow (Pa) to thevalue of the estimate itself. This relationship is expressed as the ratio of the 95% CI to Pa and is examined for cases in which the number of possible paternal parents is5, the total rate of gene flow is 5 or 10%, and the probability of paternity exclusion is 0.80 or 0.90. Even with only five possible parents per population, severalhundred seeds may need to be sampled in order for the width of the 95% CI to be less than twice Pa. (Table prepared by J. Nason).
Total rate of gene flow equals 5% Total rate of gene flow equals 10%Probability Apparent Upper Apparent Lower Ratio of Apparent Upper Apparent Lower Ratio ofof paternity Seeds gene flow 95% CI gene flow 95% CI 95% CI gene flow 95% CI gene flow 95% CI 95% CIexclusion sampled events limit Pa limit to Pa events limit Pa limit to Pa
0.80 50 1 0.097 0.016 0.000 5.925 2 0.122 0.033 0.004 3.59375 1 0.080 0.016 0.000 4.860 2 0.106 0.033 0.004 3.127100 2 0.062 0.016 0.002 3.671 3 0.091 0.033 0.007 2.564200 3 0.046 0.016 0.003 2.615 7 0.067 0.033 0.013 1.643300 5 0.038 0.016 0.005 1.992 10 0.060 0.033 0.016 1.340400 7 0.034 0.016 0.007 1.645 13 0.055 0.033 0.017 1.159500 8 0.032 0.016 0.007 1.499 16 0.052 0.033 0.019 1.022600 10 0.030 0.016 0.008 1.333 20 0.050 0.033 0.020 0.901700 11 0.029 0.016 0.008 1.257 23 0.048 0.033 0.021 0.843800 13 0.028 0.016 0.009 1.156 26 0.047 0.033 0.021 0.786900 15 0.027 0.016 0.009 1.106 29 0.046 0.033 0.022 0.7391000 16 0.027 0.016 0.009 1.079 33 0.046 0.033 0.023 0.697
0.90 50 1 0.130 0.030 0.001 4.367 3 0.164 0.059 0.012 2.56375 2 0.099 0.030 0.004 3.246 4 0.141 0.059 0.016 2.117100 3 0.084 0.030 0.006 2.647 6 0.125 0.059 0.022 1.738200 6 0.063 0.030 0.011 1.776 12 0.101 0.059 0.031 1.190300 9 0.057 0.030 0.014 1.463 18 0.091 0.059 0.035 0.950400 12 0.051 0.030 0.015 1.207 24 0.087 0.059 0.039 0.814500 15 0.049 0.030 0.017 1.079 30 0.083 0.059 0.041 0.709600 18 0.045 0.030 0.018 0.940 35 0.080 0.059 0.042 0.651700 21 0.044 0.030 0.018 0.887 41 0.078 0.059 0.043 0.599800 24 0.043 0.030 0.019 0.822 47 0.077 0.059 0.044 0.556900 27 0.043 0.030 0.020 0.779 53 0.076 0.059 0.045 0.5281000 30 0.042 0.030 0.020 0.737 59 0.075 0.059 0.046 0.496
page 14
Shortcomings of Direct Methods
The study of fine scale gene flow and relative male fertility is best accomplished by the use
of parentage type analyses. Genetic markers currently have enough resolution and power to model
fine-scale gene movement with some precision. However, a major weakness in parentage
analyses is that they tell us relatively little about the nature of unassigned paternity (i.e. the source
of pollen outside a circumscribed area). This unassigned paternity could come from 10 m outside
the area or 1000 m. If the study of gene flow is to expand to involve longer distance movement of
genes between populations or to address patterns of gene flow across increasingly larger spatial
scales, it is essential to identify the particular limitations inherent in parentage analysis experiments
and to suggest modifications that will allow a successful scaling up of the questions.
First, the emphasis of paternity analyses is steadily shifting away from a strict assignment
of paternity and toward answering questions concerning the factors that might be contributing to
the levels of apparent gene flow. For many plant populations, rates of gene flow are much higher
than had been predicted, and confusion immediately arises when attempting to determine the
patterns of long-distance gene flow. For example, should the scale of the paternity analysis simply
be extended to include more putative fathers? If so, then increasing the scale of the paternity
analysis will bring about a concomitant increase in the labor involved and a loss of genetic
resolution. Moreover, the effort in identifying, sampling, genotyping, and mapping the positions
of all putative fathers in the study plot may be prohibitive for most research projects.
Second, a distinction must be made between the study of gene flow, via paternity analysis,
in fragmented populations and continuous populations. Logistically, fragmented populations are
easier to handle, because of the smaller number of potential fathers in the immediate vicinity. Even
if gene flow occurs over great geographical distances, a fragmented landscape will include fewer
potential fathers than a continuous landscape. However, when identifying the number of
differences in the pollination syndrome, fragmentation structure, background environmental
matrix, and a multitude of potentially confounding environmental variables between species, it
Gene flow workshop proceedings page 15
becomes natural to ask whether studies confined to fragmented habitats are applicable to species
with continuous distributions.
Finally, parentage analysis of gene movement is restricted in both temporal and spatial
scales. In most cases, paternity analyses are conducted on a limited number of maternal trees, for
one or two years and in a single geographic site. Estimates of gene flow based on these studies
have little replication to evaluate their variance. Year to year variation in pollen production or
reception and specific geographic or maternal idiosyncrasies preclude the formation of widely
general patterns from a single paternity analysis (see Hamrick abstract, Part III of these
proceedings. Thus, eventually it may be necessary to shift away from paternity analyses for
questions that involve larger spatial and temporal scales.
Gene flow and adaptation
Workshop discussions focused largely on gene flow alone, with little regard to the
importance of locally adapted genotypes. However, it is clear that gene flow among some
populations could result in reductions in progeny fitness (Savolainen abstract, Part III of these
proceedings). Genetic surveys that are designed to estimate gene flow could also be used to
examine the consequences of gene flow for conservation and management purposes (for
discussion of optimal sampling for surveys, see Petit abstract, Part III of these proceedings).
Indeed, such surveys are meant to identify diploid immigrants (seed flow), haploid immigrants
(pollen flow), within-population outcrossed progenies, and selfed progenies. An evaluation of the
relative fitness of these different classes of progeny would increase our understanding of the
consequences for the viability and adaptability of recipient populations. Numerous studies have
demonstrated reductions in the relative fitness of selfed versus outcrossed progeny, particularly in
predominantly outcrossing species. Habitat modification associated with human activities has, in
some cases, been correlated with increased rates of selfing, though effects on progeny fitness have
not been examined in this context.
Gene flow is considered an important force for the maintenance of genetic diversity. In
addition, high amounts of gene flow will reduce inbreeding. However, gene flow also has the
Gene flow workshop proceedings page 16
potential to introduce poorly adapted genes (outbreeding depression) that can reduce viability of the
population. While it is not clear how likely increased gene flow will result in outbreeding
depression, the possibility illustrates the connection between gene flow and local adaptation.
Populations that now occupy altered landscapes are likely to experience different patterns of future
gene flow than those experienced over a longer period in the past (Savolainen abstract, Part III of
these proceedings). If ecological conditions are changing (e.g., global change), they could
introduce genes adapted to the new conditions (e.g., for Scots pine in Finland, genes from the
southern part of the country may play well to climatic warming in the north).
Finally, if the regional population system functions as a metapopulation, with frequent local
extinction and recolonization, the system as a whole will only persist if colonization of new patches
by seeds occurs with sufficient probability. We conclude that an awareness of the fitness
consequences of gene flow should be a prominent feature of future gene flow studies.
Metapopulation and landscape approaches to gene flow
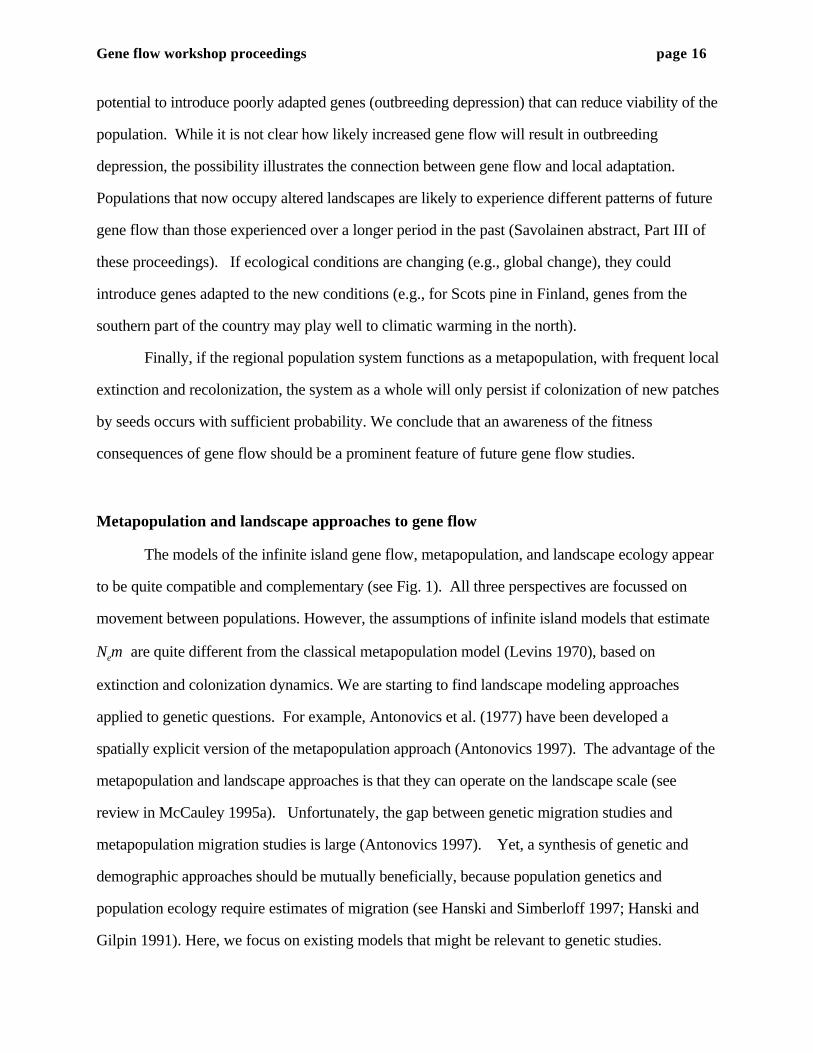
The models of the infinite island gene flow, metapopulation, and landscape ecology appear
to be quite compatible and complementary (see Fig. 1). All three perspectives are focussed on
movement between populations. However, the assumptions of infinite island models that estimate
Nem are quite different from the classical metapopulation model (Levins 1970), based on
extinction and colonization dynamics. We are starting to find landscape modeling approaches
applied to genetic questions. For example, Antonovics et al. (1977) have been developed a
spatially explicit version of the metapopulation approach (Antonovics 1997). The advantage of the
metapopulation and landscape approaches is that they can operate on the landscape scale (see
review in McCauley 1995a). Unfortunately, the gap between genetic migration studies and
metapopulation migration studies is large (Antonovics 1997). Yet, a synthesis of genetic and
demographic approaches should be mutually beneficially, because population genetics and
population ecology require estimates of migration (see Hanski and Simberloff 1997; Hanski and
Gilpin 1991). Here, we focus on existing models that might be relevant to genetic studies.
Gene flow workshop proceedings page 17
Fig. 1. Three different kinds of models that could be used to describe gene flow amongpopulations. Sewall Wright's (1943) infinite island model is a "landscape-neutral" model thatassumes equal population size and equal exchange of migrants across all populations. Themetapopulation model, in its narrow definition (Levins 1970), was initially a demographicmodel that describes a set of populations with certain extinction probabilities that are connectedby migration of colonists. This model is also a "landscape neutral" model. A third model is alandscape model that uses spatially explicit information about the mosaic of habitat types todescribe the landscape. This model can be combined with a metapopulation model or anymodel that describes a set of connected populations that occur within a landscape. This modelwould use spatially explicit information to estimate probability of migration and/or gene flowassociated with exchange within and between habitat types. For further discussion ofmetapopulation models and landscape approaches see Harrison and Taylor 1997, Wiens 1997.(For all models, lines indicate gene flow or migration, solid patches are populations; dottedpatches indicate extinct populations.)
Few models are available that explicitly analyze gene flow within metapopulation or landscape
perspectives, and there are virtually no general spatial models for gene flow. However, there are
different types of spatially explicit models that have potential applicability to gene flow studies
(Davis abstract, Part III of these proceedings). One example of such a spatially-explicit model is
Steinberg and Jordan’s individual-based modeling approach (Steinberg abstract, Part III of these
proceedings, Steinberg and Jordan 1997). Their approach to connecting demography and genetics
(‘virtual pocket gophers’) could easily be adapted to include spatial or temporal heterogeneity.
Alternatively, object-oriented models would be amenable to layering landscape, demographic, and
genetic processes (Davis abstract, Part III of these proceedings). The first category consists of

Gene flow workshop proceedings page 18
biological transport models, individually-based / cellular automata models (i.e. ECOBEAKER, By
E. Meir) and metapopulation models (e.g., RAMAS- GIS, ALEX Lindenmayer et al. 1995). A
second category consists of physical transport models (i.e. FETCHR). The utility of any of these
models for describing gene flow processes has not received much attention (but see Antonovics
1997; Gilpin 1991; McCauley 1995a).
An unresolved question is whether spatially-explicit modeling offers any benefits to
population geneticists. We suggest that this approach could have useful applications for some
situations. For example, understanding pollen flow patterns via wind transport vectors ( i.e. wind
channels, etc.) would provide means for hypothesis testing about influences of landscape changes.
The use of spatially explicit mapping offers a means of mapping different selection regimes (i.e.
soil types, elevation). Finally, the measurement of gene flow within a landscape mosaic allows one
to measure ‘ecological distance’ between populations, as well as direct physical distance, perhaps
having divergent implications for gene flow. In this case, the combination of spatially explicit
genetic data, combined with environmental data, are available for the same landscape would allow
one to test several hypotheses about the impact of “ecological distances” on gene flow or the
influence of environmental variables on gene flow.
From a landscape modeling perspective, migration is important when considering the
contribution of genetics to conservation and management. Integration of genetic and demographic
data, or interpretation of either genetic or demographic processes, each with respect to the other,
require the ability to translate the movement of genes (gene flow) to the migration of individuals (or
of pollen/seeds) and vice versa. To make this translation (i.e., via simulations), it would be useful
to have information on distributions of dispersal or gene flow distances, rather than average (i.e.
Nem) estimates. So far, the type of migration parameters that is needed to connect genetic and
demographic models are not being measured.
From the perspective of metapopulation or landscape models of plant populations, seed
dispersal data may be as important as pollen dispersal data. While seed and pollen movement can
be quite different and influence genetic structure differentially, for population demographic

Gene flow workshop proceedings page 19
processes (i.e. colonization), seed dispersal, or dispersal of vegetative propagules for many
species, is the key. Use of maternally-inherited markers (e.g. Demesure et al. 1996; Dumolin et
al. 1995; McCauley 1994; McCauley et al. 1995), and paternally inherited markers, in conjunction
with nuclear markers, would allow examination of both seed and pollen dispersal.
A key challenge for many ecological, conservation, and management studies is the adoption
of a proper landscape scale. It would be useful to have genetic models that integrate both spatial
variability (i.e., heterogeneous landscapes) and temporal variability (i.e., metapopulation
dynamics). Such models could examine how these types of variation influence the genetic
structure of populations, as well as to consider how these types of variation influence our
interpretations of genetic structure. The application of landscape models necessitates larger scales
of study. Obviously, this will often be logistically difficult. Large-scale studies will be most
tractable in small isolated populations, such as Kaufman et al’s Cecropia study (Kaufman et al.,
1998; see also Smouse et al. abstract, Part III of these proceedings), or for tropical trees in
fragments (e.g. Nason 1997; Stacy et al. 1996) or for populations following a river course (linear
population arrays). The scaling up of genetic studies might require careful selection of study
systems in order to measure parameters that can then be modeled. Another approach to asking
landscape-scale questions (i.e., regarding long-distance gene flow) would be to focus on the edges
of species ranges, where populations are smaller and more fragmented, permitting examination of
associations between distance/size of fragments and gene flow patterns. However, this approach
may give biased picture, relative to more centrally located populations.
For many threatened species, extinction-recolonization dynamics have only recently been
imposed through habitat loss and fragmentation. Thus, we want to emphasize that most currently
fragmented populations of interest to the conservation biologist were probably not fragmented over
extended evolutionary time. Landscape alteration has created metapopulations out of formerly
continuous populations. In most cases, Temporal scale is thus an important consideration in
genetic applications of metapopulation models. Because (a) we do not know what kind of
metapopulation has been created (i.e., disequilibrated, patchy, classical?), and (b) we do not know

Gene flow workshop proceedings page 20
where the metapopulation is headed, methods must be sensitive to recent shifts in gene flow
patterns. We conclude that standard indirect methods may not be sufficiently sensitive to estimate
recent changes in gene flow.
Part II. TWO ESSAYS ON NEW APPROACHES
Scaling-up: Enlarging the spatial scale of parentage analysis
by John Nason
In many cases the spatial and temporal dimensions at which gene movement can be
effectively investigated fails to encompass the scale of interest. Indirect methods of estimating the
effective number of migrants per generation (Nm) from measures of variation in gene frequencies
(e.g., FST) can be utilized over a broad range of spatial scales but reflect the cumulative effect of
migration over an evolutionary time scale. Direct, parentage analysis based methods, in contrast,
estimate contemporary rates of gene movement but have been limited to relatively modest spatial
scales in their application. Given ecological, evolutionary, and management oriented interests in
current patterns of gene movement within and among populations, it is of interest to consider
whether and how parentage analysis methods can be extended to investigate dispersal processes
occurring over larger spatial scales.
Due largely to methodological factors, available analytical models have not been used to
their maximum capabilities to resolve long distance pollen dispersal events. Many estimates of the
rate of effective pollen immigration into experimental populations have come from experiments
specifically designed to examine individual male reproductive success and its ecological correlates.
The power of state of the art paternity analysis models (Roeder et al. 1989; Smouse and Meagher
1994) to provide detailed information on relative male fertilities decreases as the spatial scale of the
experimental population and the number of potential pollen donors increases. Moreover, since
these models assume the absence of cryptic pollen immigration (pollen gametes with genotypes
indistinguishable from ones that could be produced within the population) they have been applied

Gene flow workshop proceedings page 21
primarily to relatively small, spatially isolated populations. As a result, experimental designs
optimized for paternity analysis have often been somewhat unnatural and generally sub optimal for
quantifying the tail of the effective pollen dispersal distribution.
One means of increasing the spatial scale of parentage analysis is to decouple studies of
pollen immigration from paternity analysis. Extending the spatial scale is limited only by our ability
to detect apparent immigration events given available levels of assayable genetic variation. Given
that rates of apparent pollen immigration into experimentally defined populations have often been
relatively high, pollen gene movement could be quantified over larger spatial scales by successively
enlarging the size (e.g., radius) of these populations until apparent pollen gametes could no longer
be detected. Importantly, the major assumption of exclusion based methods of estimating total
pollen immigration from the observed frequency of apparent immigration events (i.e., Devlin and
Ellstrand 1990) is that the genotypes of immigrant pollen gametes can be modeled as being drawn
at random from a large source population of known frequency. As a result, these estimators are not
limited in the types of population structures, continuous or discontinuous, to which they can be
applied.
Other opportunities for enlarging scale involve utilizing certain population configurations
and species with specialized forms of correlated mating. Population structures that are naturally
patchily distributed or linear (e.g., riparian gallery forest), for example, increase the probability of
detecting genetically apparent immigration events by decreasing the density and number of within
population sources. The most powerful method of increasing the spatial scale of parentage
analysis, however, is to utilize species that produce singly-sired fruit. By permitting very precise
reconstruction of paternal genotypes from full-sib progeny arrays, as opposed to the inference of
microgametic genotypes from individual seeds, this form of correlated mating greatly increases the
probability that immigration events will be apparent and thus detectable over a larger spatial scale
(e.g., Nason et al. 1998). Although the routine production of singly-sired fruit is limited to only a
few plant taxa (the Asclepiadaceae, Mimosoid legumes, the genus Ficus, and the Orchidaceae)
these groups are, fortunately, relatively speciose.

page 22
Thoughts on a Genetic Structure-like approach to pollen flow
by Peter Smouse
Introduction
It is important to have some sense of how we arrived at this point, so let me begin by
reminding us that we initiated the use of parentage analysis in the hope that if we could identify
male parentage, we could say something useful about the distribution of male fitness in natural
populations. The growing realization that we were going to have to deal with pollen flow from
outside the immediate population, initially viewed as an aggravating complication, has now
developed into a deeper appreciation of the fact that much of the pollen for a circumscribed area is
coming from somewhere else.
Our initial attempts to model the incoming pollen as drawn from the surrounding
(genetically homogeneous) area is now giving way to the thought (and some results) suggesting
that the 'out-population' pollen may be coming from genetically heterogeneous sources. In many
interesting cases, we have no hope of characterizing a much larger panoply of specific males who
might provide that incoming pollen, and that even our ability to represent them by a sample of
males has serious limitations. We are simultaneously concerned that long distance gene flow
cannot be measured directly by anything we can do.
What it comes down to is that if we are now going to treat pollen flow as a measure of
inter-population gene flow, we are going to have to change our approach. We have a number of
problems and contrasts that need attention, and the resources available will prohibit simply
expanding the size of a paternity analysis. For example, we need to know:
(1) whether fragmented populations show different pollination dynamics from semi-continuous
populations, a question of some interest in conservation genetics;
(2) whether the incoming pollen cloud, representing (in many cases) a substantial portion of the
total male parentage for a localized population, is genetically homogeneous, or whether pollen
from different sources or directions or distances is genetically different;
Gene flow workshop proceedings page 23
(3) whether the gametic input from males in one year is the same as that for another year, or
whether 'it all comes out in the wash,' over the reproductive cycle of an organism that
reproduces over many years.
We have reached the stage where we need to expand the number and ecological range of
studies, so that we can begin to do some serious comparative work. The problem is that a single
parentage study is so laborious that we cannot do many of them, and their spatial extent is
necessarily limited. The population structure alternative, based on GST or FST or NST or ΦST, or
some analogous measure, has proven to be of little value in this context. These measures are
simply insensitive to the types of changes we hope to elucidate. We need the additional power of
the two - generation approach, but we need it in a way that is less expensive, time consuming, and
labor intensive than standard parentage analysis. We need something that we can scale up a bit
easier than parentage analysis and something that will allow comparative analysis, with no more
effort than we are investing now, but with a broader base of inference.
Toward A Pollen Structure Design
Instead of worrying about which individuals are 'inside' and which are 'outside' the
population or the neighborhood, or whether we can even define discrete populations in any
meaningful way, we choose to center the design on single females, spaced and clustered in ways
that might be appropriate for the study or contrast in question. The basic idea is to compare the
gametic pollen profiles extracted from different females to learn something about the heterogeneity
of pollen donor pools they have sampled. As Jim Hamrick has put it, each female can be viewed
(in essence) as a separate biological pollen trap, spaced out in some convenient pattern. Just to get
ourselves started, consider the following quartet of situations, each embedded within a larger-scale
distribution of the species, which latter is inevitably somewhat poorly characterized, and not really
amenable to exhaustive enumeration over any very large spatial scale:

Gene flow workshop proceedings page 24
(a) Strictly patchy distribution, fragmented population
• • • • • •• •
•
• •• •
(b) Patches, but with scattered trees between patches
• • • •• • • • • • •
• • •• • •
•• • •
• •• • •
• • • • • • •• • •
(c) Residual corridors (of lower population density) between patches
• • • • • • •• • •
•
• •• •
• • •• •
Gene flow workshop proceedings page 25
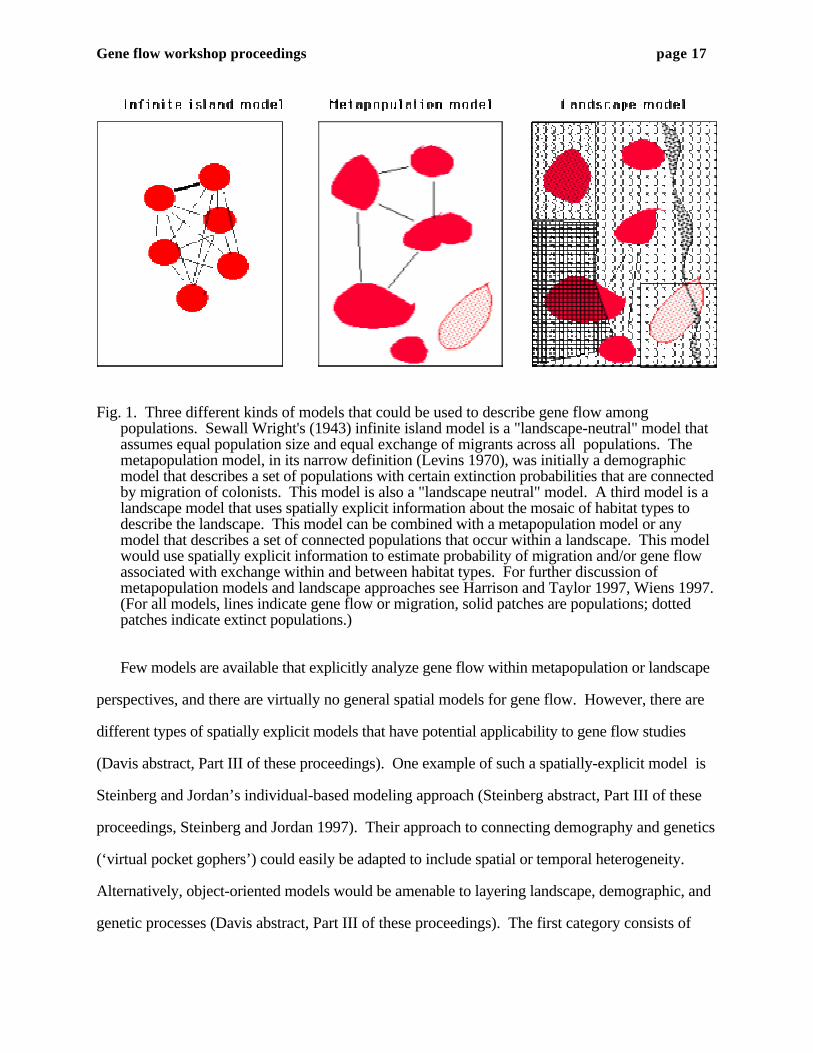
(d) Semi-continuous populations
• • • •• • • • • • •
• • •• • •
•• • •
• •• • •
• • • • • • •• • •
We want a study design that would allow us to attack all four situations, because the idea is
to be able to compare them. Consider the following sample of female individuals, which could be
(more or less) imposed on any of these situations. The idea is to achieve a variety of spatial
separations between females, some attempt to sample patchiness, but enough total separation
among females so that if the male profiles are different over space, we have some hope of detecting
it. To assume a generic design will cover all situations is pretty well hopeless, but we need a
strategy that is reasonably adaptable.
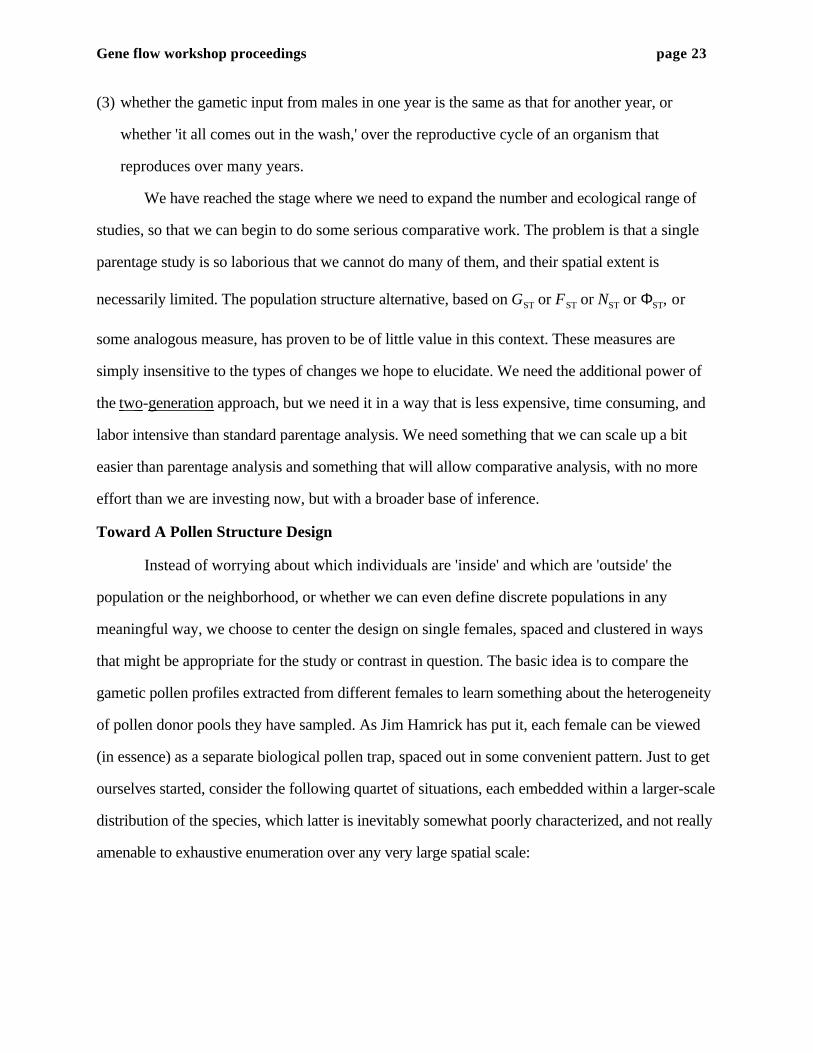
The sampled females are indicated by x's in the diagram below. We want some close
spacing (at distances within the scope of a single patch), some intermediate-scale spacing (as for
single trees in a dispersed population), and a total separation (say, NW to SE or SW to NE) that
should pick up pollen profiles that are different.
x x x x x x xx x
x x
x xx x
x x x xx
Gene flow workshop proceedings page 26
From each female, we will extract n seed. For the sake of definiteness (but with the option
to adjust the sample sizes, on further reflection), let us assume we have n = 50 from each female.
From each seed, we desire the male and female gametic genotypes. Leaving aside the general
difficulty of doing that for the moment, assume we have n = 50 female gametes, with n = 50 paired
male gametes. The idea is to use these gametic genotypes to say something about divergence
among gametes, given homogeneous (or heterogeneous) pollen draws for different females, due
to: (a) patch differences, (b) distance considerations, (c) or whatever else in an ecological context
that is interesting to look at and that is differential for the sampled females.
Genetic Markers / Distance Metrics
In general, our intent here is neither to determine the male parent of particular seeds, nor
even to obtain strong likelihood separation, but rather to determine whether pollen profiles of
different females are different. For the sake of initial discussion, consider a battery of H
polymorphic allozyme loci. We could have two alleles each, but we will generally have more than
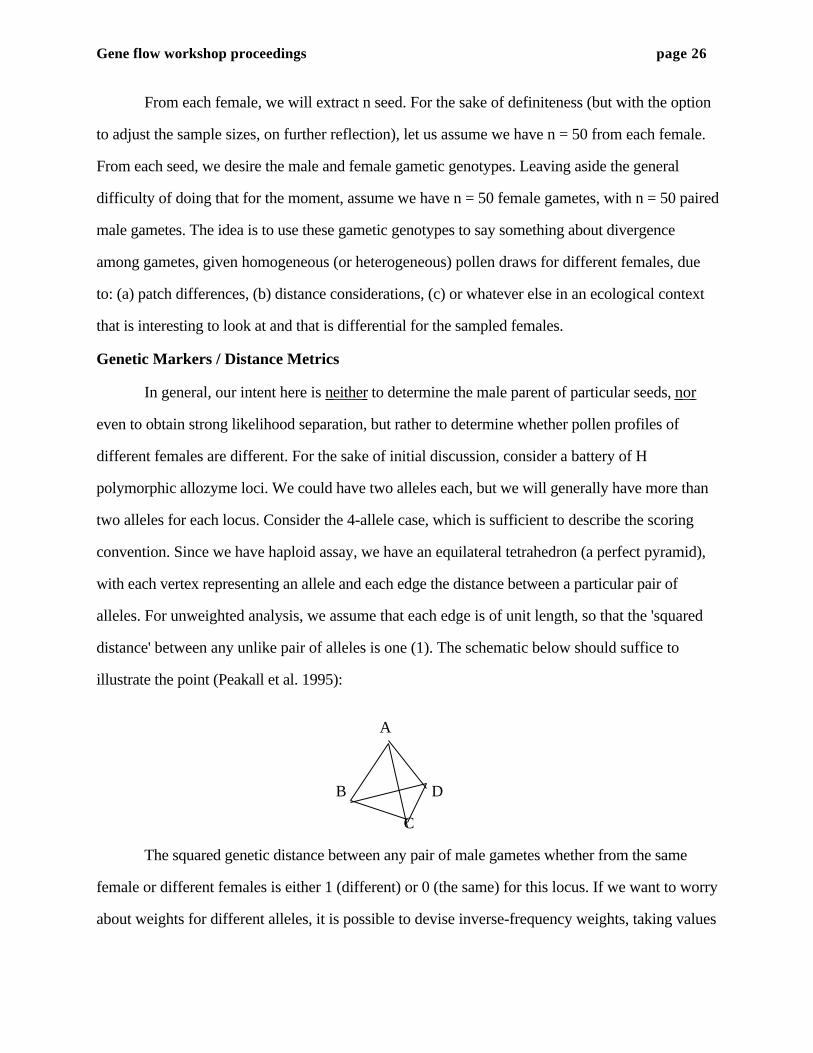
two alleles for each locus. Consider the 4-allele case, which is sufficient to describe the scoring
convention. Since we have haploid assay, we have an equilateral tetrahedron (a perfect pyramid),
with each vertex representing an allele and each edge the distance between a particular pair of
alleles. For unweighted analysis, we assume that each edge is of unit length, so that the 'squared
distance' between any unlike pair of alleles is one (1). The schematic below should suffice to
illustrate the point (Peakall et al. 1995):
A
B D
C
The squared genetic distance between any pair of male gametes whether from the same
female or different females is either 1 (different) or 0 (the same) for this locus. If we want to worry
about weights for different alleles, it is possible to devise inverse-frequency weights, taking values

Gene flow workshop proceedings page 27
1/p, 1/q, 1/r, 1/s (for 4 alleles), and so on, but experience suggests that such nuances won't help
much in practice. The scheme extends to as many alleles as we might have. The strategy for the
multi-locus treatment is simply to add the squared genetic distance for each locus. We have a
separate N x N matrix of pairwise distances for each locus. The multi-locus matrix is simply the
element by element summation of the separate matrices. We will have at least an H-dimensional
representation.
Recently, attention has turned to microsatellites, as they have larger numbers of alleles, so
the multi-allele extension is valuable. With microsatellites, we can also measure along the 'copy
number' axis, using the sort of RST measures recommended by Slatkin et al. (1995) and Goldstein
et al. (1995), reminiscent of the analogous 'ladder measures' of Richardson and Smouse (1976).
The important point is that we want the squared distance for everything we do. Again, for the
multiple-locus distances, we simply sum the squared distances for each locus, for each of the
N(N-1)/2 pairs of individuals. It is probably worth a comment here that some microsatellite loci
are so highly variable that rare alleles are not uncommonly new mutants. We want to avoid that
sort of complication, so it will be necessary, though easy enough to do, to choose among
microsatellite loci for those that are ‘well behaved’.
We also need to consider maternally inherited (mtDNA) and paternally inherited (cpDNA in
conifers) markers, wherever we can get them, not as a replacement for the nuclear markers, but as
a useful adjunct. That leads us to NST-type measures, where each 'locus' is separately coded, but
where there really is no recombination. In that case, we want the number of substitutions between
two multiple-locus 'haplotypes', either measured phenetically or phylogenetically. All of these
measures and types of genetic data can be covered with ΦST methodology (Excoffier et al. 1992).
Partitioning the Variation
We now have an N x N matrix of inter-individual squared genetic distances. We can use
AMOVA, Mantel, and other multivariate matrix methods to partition variation among various
Gene flow workshop proceedings page 28
components of the total haplotypic divergence, search for spatially arrayed pattern, and we have
approximately N = 2000 gametes (20 females x 50 seeds; 1000 male and 1000 female gametes)
with which to work. We now have: (a) paired male-female multiple-locus haplotypes, which might
or might not be correlated, (b) enough information on each female to assess whether we have
mendelian segregation, (c) a gametic spectrum from the males that will be either less or more
distributed than that from a given female, (d) a separate male spectrum from each female that will
(generally) be over-dispersed, relative to the neutral expectation from a homogeneous male
population gamete pool, (e) enough spatial spread and coverage in the females to assess the impact
(if any) of physical separation on differential male reproductive contributions.
All we have to do, in principle, is partition the variation among components. We could do a
separate partition among the male gametes of different females, among the female gametes of
different females, within and among male-female pairs of gametes for a single female, and so on.
With standard partitioning techniques [merely invoked here], we can devise an inter-individual
average genetic distance matrix of size 40 x 40 (20 females and 20 identifiable male pools). We
can, among other questions, ask:
(1) Are the male pools correlated with the female pools? What, if anything, is this telling us
about the correlation of uniting gametes? Particularly if mating is local, there might be some
pattern of correlation that is evident with multi-locus gametes.
(2) Are male pools overdispersed, relative to the female pools? Are they overdispersed, relative
to what would be expected from a homogeneous population draw?
(3) Do female gamete pools show any pattern with physical separation? One suspects that there
will be no real pattern, over the distances in question, but if we have some tight clusters,
there may be some autocorrelation at short distances.
(4) Do male gamete pools show any pattern with that same physical separation, and how does
that pattern relate to the female pool? Can we relate it to the area from which pollen is
provided for different females?
Gene flow workshop proceedings page 29
(5) Is there any way to determine how many males are involved or the extent to which that
number varies with different females? In other words, how can we relate overdispersion to
the 'number of males' problem?
With enough detail, we can begin to describe the ebb and flow of pollen across a landscape
of reasonable scale, and using comparative work, can begin to elucidate the impact of demographic
structure and human management practices on that flow.
Allelic Richness Measures
Most of the indirect (structure-based) work has been based on analyses of GST, FST, NST or
(more recently) RST, each a special case of the ΦST measure of Excoffier et al. (1992), following the
basic theme of Wright. Because all such measures depend primarily on the most frequent alleles
(haplotypes), they are not very sensitive to the sorts of population processes of interest in regional
gene flow. We may need some other measure that is more sensitive to the sorts of processes under
study. Previous work has shown that allelic richness is far more sensitive gauge of agglomeration
of disparate gene pools than is heterozygosity (or related, structure-like statistics). Slatkin's
(1985b) rare allele methods, and other sorts of measures, hold promise. Chakraborty et al. (1988)
and Neel et al. (1988) have shown that allelic richness, particularly the number of rare alleles is
highly sensitive to pooling of heterogeneous gene pools. It might even be possible to improve on
such techniques, if we were to incorporate the level of phylogenetic divergence, though I have my
doubts. Additional theoretical work is needed here.
For analytical reasons, we may yet discover that allelic richness is a more informative
measure of the mixture phenomenon than structure statistics. There are serious sample-size effects,
and we will need to be concerned with rarifaction analysis. The spectrum of allele numbers,
particularly that of rare allele numbers, is drastically affected by the process of mixing divergent
gene pools. Quite apart from interest in the allelic spectrum by conservation biologists, it may
provide powerful statistical clues about longer-range genetic movements.
Gene flow workshop proceedings page 30
Adding Males
If the pollen profile for each female were drawn from a homogeneous pollen cloud, with
average allele frequencies, we ought to be able to detect departures from homogeneity, but whether
we could do much more than that remains to be seen. It seemed to several of us that if we had at
least a sample of the local males, around each of the females, we could 'anchor' the local pollen
cloud frequencies. Since that 'local pool' will be different for the different females, we might hope
to be able to partition out the local effects from the total heterogeneity of pollen profiles for the
different females, and should be able to ask whether (and to what extent) differences in local male
composition would account for non-homogeneity of the total pollen pool. So, we add males
around each cluster of sampled females, say 30 (just as a rough rule of thumb), determine their
pollen capabilities, and show how uneven they are in their contributions. It might develop that the
long-distance (from outside the local area) pollen flow is homogeneous across females, once we
partition out the local male effects. Our results with Cecropia (Kaufman et al. 1998; see also
Smouse et al. abstract, Part III of these proceedings) would suggest that if the outside contributors
are far enough away, their relative distances to local females are so similar that differential
contributions are hard to detect.
LITERATURE CITED
Adams, W. T. 1992a. Gene dispersal within forest tree populations. New Forests 6: 217-220.kAdams, W. T., D. S. Birkes, and V. J. Erickson. 1992b. Using genetic markers to measure gene
flow and pollen dispersal in forest tree seed orchards. Pp. 37-61 in R. Wyatt, ed. Ecologyand evolution of plant reproduction. Chapman and Hall, New York.
Adams, W. T., and D. S. Birkes. 1991. Estimating mating patterns in forest tree populations. Pp.152-172 in M. E. M. S. Fineschi, F. Cannata, and H. H. Hattemer, eds. Biochemicalmarkers in the population genetics of forest trees. SPB Academic Publishing, Hague,Netherlands.
Antonovics, J., P. H. Thrall, and A. M. Jarosz. 1997. Genetics and the spatial ecology of speciesinteractions: The Silene-Ustilago System. Pp. 158-180 in D. Tilman, and P. Kareiva,eds. Spatial Ecology. The role of space in population dynamics and interspecificinteractions. Princeton University Press, Princeton.
Chakraborty, R., P. E. Smouse and J. V. Neel. 1988. Population amalgamation andgeneticvariation: Observations on artificially agglomerated tribal populations of Central and SouthAmerica. American Journal of Human Genetics 43: 709-725.
Crawford, T. J. 1984. The estimation of neighborhood parameters for plant populations. Heredity52: 273-283.

Gene flow workshop proceedings page 31
Crow, J. F., and K. Aoki. 1984. Group selection of a polygenic behavioural trait: estimating thedegree of population subdivision. Proceedings of the National Academy of Sciences, USA81.
Demesure, B., B. Comps and R. J. Petit. 1996. Chloroplast DNA phylogoegraphy of the commonbeech ( Fagus sylvatica L.) in Europe. Evolution 50: 2515-2520.
Devlin, B., and N. C. Ellstrand. 1990. The development and application of a refined method forestimating gene flow from angiosperm paternity analysis. Evolution 44: 248-259.
Dumolin, S., B. Demesure and R. J. Petit. 1995. Inheritance of chloroplast and mitochondrialgenomes in pendunculate oak investigated with an efficient PCR method. Theoretical andapplied genetics 91: 1253-1256.
Dyer, R., and V. L. Sork. Fractional paternity of northern red oak (Quercus rubra L.) inMissouri: Implications for gene flow. In prep .
Eguiarte, L. E., A. Burquez, J. Rodriguez, M. Martinez-Ramos, and J. Sarukhan. 1993. Directand indirect estimatesof the effective population size in a tropical palm Astrocaryummexicanum. Evolution47: 75-87.
Ellstrand, N. C. 1992. Gene flow among seed plant populations. New Forests 6: 241-256.Ellstrand, N. C., and D. L. Marshall. 1985. Interpopulation gene flow by pollen in Wild Radish,
Raphanus sativus . The American Naturalist 126: 606-615.Excoffier, L., P. E. Smouse and J. M. Quattro. 1992. Analysis of molecular variance inferred
from metric distances among DNA haplotypes: Application to human mitochondrial DNArestriction data. Genetics 131: 479-491.
Friedman, S., and W. T. Adams. 1985. Estimation of gene flow in two seed orchards of loblollypines (Pinus taeda L.). Theoretical and applied genetics 69: 609-616.
Giles, B.E. and J. Goudet. 1997. A case stuy of genetic str4ucture in plant metapopulation. Pp.429-453 in M. E. Gilpin, and I. Hanski, eds. Metapopulation dynamics: Empirical andtheoretical investigations. Academic Press, London.
Gilpin, M. E. 1991. The genetic effective size of a metapopulation. Pp. 165-175 in M. E. Gilpin,and I. Hanski, eds. Metapopulation dynamics: Empirical and theoretical investigations.Academic Press, London.
Goldstein, D. B., A. R. Linares, L. L. Cavalli-Sforza, M. W. Feldman. 1995. An evaluation ofgenetic distances for use with microsatellite loci. Genetics 139: 463-471.
Hamrick, J. L., M. J. W. Godt and S. L. Sherman-Broyles. 1995. Gene flow among plantpopulations: evidence from genetic markers Pp. 215-232 in P. C. Hoch, and A. G.Stephenson, eds. Experimental and molecular approaches to plant biosystematics. MissouriBotanical Garden, St. Louis.
Hamrick, J. L., and A. Schnabel. 1986. Understanding the genetic structure of plant populations:some old problems and a new approach Pp. in H.-R. Gregorius, ed. Population geneticsin forestry. Springer-Verlag, New York.
Hanski, I., and D. Simberloff. 1997. The metapopulation approach, its history, conceptualdomain, and application to conservation. Pp. 5-26 in I. A. Hanski, and M. E. Gilpin, eds.Metapopulation Biology. Academic Press, Inc., San Diego.
Hanski, I. A., and M. E. Gilpin. 1991. Metapopulation dynamics: brief history and conceptualdomain. Biological Journal of the Linnean Society : 3-16.
Hartl, D. L., and A. G. Clark. 1989. Principles of Population Genetics, 2nd Ed. SinuaerAssociates, Inc., Sunderland, MA.
Harrison, S. and A. D. Taylor. 1997.. Empirical evidence for metapopulation dynamics. Pp. 27-42 in I. A. Hanski and M. E. Gilpin, Eds. Metapopulation Biology. San Diego, AcademicPress, Inc.
Kaufman, S. R., P. E. Smouse and E. R. Alvarez-Buylla. 1998. Pollen-mediated gene flow anddifferential male reproductive success in a tropical pioneer tree, Cecropia obtusifolia Bertol.(Moraceae). Heredity in press: .

Gene flow workshop proceedings page 32
Lande, R., and G. F. Barrowclough. 1987. Effective population size, genetic variation, and theiruse in population management. Pp. 878-124 in M. E. Soule, eds. Viable populations forconservation. University of Chicago Press, Chicago.
Levins, R. 1970. Extinction Pp. 75-107 in M. Gerstenhaber, ed. Some mathematical problems inbiology. American Mathematical Society, Providence.
Lindenmayer, D. B., M. A. Burgman, H. R. Akcakaya, R. C. Lacy and H. P. Possingham.1995. A review of the generic computer programs ALEX, RAMAS/space and VORTEXfor modeling the viability of wildlife metapopulations. Ecological Modeling 82: 161-174.
McCauley, D. E. 1994. Contrasting the distribution of chloroplast DNA and allozymepolymorphism among local populations of Silene alba : Implications for studies of geneflow in plants. Proceedings of National Academy of Sciences USA 42: 8127-8131.
McCauley, D. E. 1995a. Effects of population dynamics on genetics in mosaic landscapes Pp.178-198 in L. F. L. Hansson, and G. Merriam, eds. Mosaic Landscapes and EcologicalProcesses. Chapman and Hall, London.
McCauley, D. E. 1995b. The use of chloroplast DNA polymorphism in studies of gene flow inplants. Trends in Ecology and Evolution 10: 198-202.
McCauley, D. E., J. Raveill and J. Antonovics. 1995. Local founding events as determinants ofgenetic structure in a plant metapopulation. Heredity 75: 630-636.
Meagher, T. R. 1986. Analysis of paternity within a natural population of Chamaelirium luteum .1. identification of most-likely male parents. The American Naturalist 128: 199-215.
Mills, L. S., and Fred W. Allendorf. 1996. The one-migrant-per-generation rule in conservationand management. Conservation Biology 10: 1509-1519.
Nason, J. D. and J. L. Hamrick 1997. Reproductive and genetic consequences of forestfragmentation: Two case studies of Neotropical canopy trees. Journal of Heredity 88: 264-276.
Nason, J. D., E. A. Herre, and J. L. Hamrick. 1998. The breeding structure of a tropicalkeystone plant resource. Nature 391:685-687.
Nason, J. D., P. R. Aldrich, and J. L. Hamrick. 1997. Dispersal and dynamics of geneticstructure in fragmented tropical tree populations. Pp. 304-320 in W. F. Laurance, and R.O. Bierregard, eds. Tropical forest remnants: Ecology, management, and conservation offragmented communities. University of Chicago Press, Chicago.
Neel, J. V., C. Satoh, S. P. E., J. Asakawa, N. Takahashi, K. Goriki, M. Fujita, T. Kageokaand H. R. 1988. Protein variants in Hiroshima and Nagasaki: Tales of two cities. AmericanJournal of Human Genetics 43: 870-893.
Nei, M. 1973. Analysis of genetic diversity in subdivided populations. Proceedings of theNational Academy of Sciences 70: 3321-3323.
Neigel, J. E. 1997. A comparison of alternative strategies for estimating gene flow from geneticmarkers. Annual Review of Ecology and Systematics 28: 105-128.
Peakall, R., P. E. Smouse and D. R. Huffs. 1995. Evolutionary implications of allozyme andRAPD variation in diploid populations of dioecious buffalograss Buchloe dactyloides.Molecular Ecology 4: 135-147.
Richardson, R. H., and P. E. Smouse. 1976. Patterns of electrophoretic mobility. I. Interspecificcomparisons in the Drosophila mulleri complex. Biochemical Genetics 14.
Roeder, K., B. Devlin and B. G. Lindsay. 1989. Application of maximum likelihood methods topopulation genetic data for the estimation of individual fertilities. Biometrics 45: 363-379.
Selvin, S. 1980. Probability of nonpaternity determined by multiple allele codominant systems.American Journal of Human Genetics 32: 276-278.
Slatkin, M. 1985a. Gene flow in natural populations. Annual Review of Ecology and Systematics16: 393-430.
Slatkin, M. 1985b. Rare alleles as indicators of gene flow. Evolution 39: 53-65.Slatkin, M. 1989. Population structure and evolutionary progress. Genome 31: 196-202.

Gene flow workshop proceedings page 33
Slatkin, M. 1989. Detecting small amounts of gene flow from phylogenies of alleles. Genetics121: 609-612.
Slatkin, M. and N. H. Barton. 1989. A comparison of three indirect methods for estimatingaverage levels of gene flow. Evolution 43: 1349-1368.
Slatkin, M. and W. P. Maddison. 1989. A cladistic measure of gene flow inferred fromthephylogenies of alleles. Genetics 123: 603-613.
Slatkin, M. and W. P. Maddison. 1990. Detecting isolation by distance using phylogenies ofgenes. Genetics 126: 249-260.
Slatkin, M. 1991. Inbreeding coefficients and coaslescence times. Genetical Research (Cambridge)58: 167-175.
Slatkin, M. 1993. Isolation by distance in equilibrium and nonequilibrium populations. Evolution47: 264-279.
Slatkin, M. 1995. A measure of population subdivision based on microsatellite allele frequencies.Genetics 139: 457-462.
Smouse, P. E., J. C. Long and R. R. Sokal. 1986. Multiple regression and correlation extensionsof the Mantel test of matrix correspondence. Systematic Zoology 35: 627-632.
Smouse, P. E., and T. R. Meagher. 1994. Genetic analysis of male reproductive contributions inChamaelirium luteum (L.) Gray (Liliaceae). Genetics 136: 313-322.
Stacy, E. A., J. L. Hamrick, J. D. Nason, S. P. Hubbell, R. B. Foster, and R. Condit 1996.Pollen dispersal in low-density populations of three neotropical tree species. The AmericanNaturalist 148: 275-298.
Steinberg, E. K., and C. E. Jordan. 1997. Using molecular genetics to learn about the ecology ofthreatened species: The allure and illusion of measuring genetic structure in naturalpopulations. Pp. 440-460 in P. L. Fiedler, and P. M. Kareiva, eds. ConservationBiology. For the Coming Decade. Chapman and Hall, New York.
Wiens, J. 1997. Metapopulation dynamics and landscape ecology Pp. 43-62 in I. Hanski, and M.E. Gilpin, eds. Metapopulation biology. Ecology, genetics, and evolution. AcademicPress, San Diego.
Wright, S. 1943. Isolation by distance. Genetics 28: 114-138.Wright, S. 1946. Isolation by distance under diverse systems of mating. Genetics 31: 39-59.Wright, S. 1969. Evolution and the genetics of populations, Vol. 2. The theory of gene
frequencies. The University of Chicago Press, Chicago, IL.

Part III. Abstracts of Gene Flow Workshop Presentations
Adams, W. Thomas, Department of Forest Science, Oregon State University,Corvallis, OR 97331-7501. Mating patterns and effective pollen dispersal intwo western conifers: Douglas-fir and knobcone pine.Because pollen density drops off rapidly with increasing distance from its source, most mating inconifer stands might be expected to occur among near neighbors. The "neighborhood" modelwas applied to multilocus allelic (allozyme) arrays observed in pollen gametes of seeds fromindividual mother trees to estimate mating pattern parameters in a high density stand ofknobcone pine (kp, Pinus attenuata Lemmon.), and in one high density (Dfhd) and one lowdensity (Dfld) stand of Douglas-fir (Pseudotsuga menziesii (Mirb.) Franco). In the neighborhoodmodel, an arbitrarily specified area around a mother tree (with radius r) is designated itsneighborhood, and the paternity of the mother tree's offspring is partitioned into three sources:selfing (with probability s), outcrossing to males outside the neighborhood (m), and outcrossingto males within the neighborhood (1-s-m). In kp (mean tree height = 6 m), neighborhoods (r = 11m) included an average of 44 potential outcross males, while in Douglas-fir, neighborhoods (r =70 m) included 18 potential outcross males in Dfld (mean height = 46 m) and 44 in Dfhd (meanheight = 38 m).Estimated s was zero or nearly so in all three stands, but m was quite high (0.84 in Dfld, 0.74 inDfhd, and 0.56 in kp). In addition, mating success of outcross males within neighborhoods wasonly weakly associated, at best, with distance from the mother tree. Thus, near neighborsaccounted for only a small percentage of the effective mating in these stands, such that theeffective number of mates for each mother tree was quite large. As expected, males withinneighborhoods contributed to a higher proportion of the mating in Dfhd than in Dfld, but onlymarginally so. The lower estimate of m in kp neighborhoods is probably because kp was moreisolated from other populations of the same species (i.e., less gene flow), than the Douglas-firstands.
Campbell, Diane R. Dept. of Ecology & Evolutionary Biology, University ofCalifornia Irvine, CA 92697. Estimating gene flow within and betweenpopulations in a plant hybrid zoneNatural hybridization is common in plants. If plant distribution is patchy across the region ofhybridization, we can distinguish four kinds of gene movement in a hybrid zone. Intraspecificgene flow can occur within or between local populations. Interspecific gene flow can occurbetween distinct patches each occupied by a single species, or within a patch (hybrid swarm).Using two hybridizing species of Ipomopsis (Polemoniaceae) as a model system, I discussongoing efforts to estimate these four kinds of gene movement and the methods appropriate ineach case. The primary means of gene movement in this system is transfer of pollen by hummingbirds.Behavioral observations of hummingbirds, combined with measures of pollen carryover fromflower to flower, explain the highly localized pollen movement (usually a few m) within localpopulations. Similar mechanistic studies predict asymmetrical gene movement between I.aggregata and I. tenuituba and generally high rates of interspecific gene flow. These predictionswere tested using a single genetic marker in mixed-species experimental populations. Work in

progress uses multiple RAPD markers to estimate patterns of gene movement within a naturallyhybridizing population.At the between population level, paternity analysis with multiple allozyme markers suggestsmoderately high rates of gene flow from outside. Minimum rates of gene flow ranged from 9-25% into experimental populations isolated by as much as 150 m. The discrepancy betweenthese results and the short distances of pollen flow within populations suggests that genemovement between versus within populations may result from different pollinator behaviors,making it difficult to extrapolate across scales. Determining the distance of gene flow betweenpopulations presents a special challenge. These studies illustrate the value of combining geneticmarkers with mechanistic methods in determining patterns of gene flow.
Davis, Frank W. NCEAS, University of California at Santa Barbara. Spatiallyexplicit modeling of landscape-scale transport processes.Gene flow across landscapes is accomplished by gravity, wind, water, and animals. Thesetransport processes are increasingly studied using dynamic, spatially explicit models. Thepurpose of this talk is to provide an overview of these models and discuss there potentialapplicability to studying gene flow in fragmented and managed forests. In the most general sense, it is useful to distinguish two classes of spatial models: "object"models, which track discrete spatially referenced features floating in space (e.g. habitat islands),and "field" models, which divide continuous space into smaller elements and assign a value toeach element. Most spatially explicit models in ecology are field models that utilize a 2- or 3-dimensional lattice to represent landscape properties such as elevation, vegetation, location oforganisms, etc. Movement across such grids is usually modeled by local rules. Examples of fieldmodels include cellular automata, discrete reaction diffusion models, and cellular networks.Object models are sometimes used to represent individual animals or populations for individual-based models and metapopulation models, respectively. There are several different data structures for representing spatio-temporal dynamics (e.g.,image sequences, polygons with a vector of temporal attributes for each polygon). Modern GISsystems now provide some useful spatial analytical capabilities relevant to modeling gene flow(e.g., distance and neighborhood analyses, diffusion models, path cost analysis), but are still verylimited for dynamic modeling, which is instead usually performed using specially designedresearch software. Generic issues in the use of spatial dynamic models include: defining thespatial extent, resolution, and time step for the model, treatment of boundary effects, andmovement/connection rules (e.g., rules governing the relationship between diagonal cells on asquare grid). Among physical transport processes, modeling movement of water is well developed and avariety of programs are available to model both surface and subsurface flow at spatial scalesfrom local to continental. Wind transport models have mainly been developed to represent largerscale atmospheric processes, although landscape models have also been developed to studyurban microclimate, valley and land-sea wind systems, and local snow and sand transport. Thesewind models are generally computationally very intensive and require extensiveparameterization. Simpler models have been developed based on surface aerodynamic resistanceand fetch that could be useful in studying local gene flow in rugged or heterogeneous terrain. Spatially explicit diffusion models have been used to study a variety of biological processes, forexample, biological invasions, seed dispersal, and disease spread. Animal movements have been

simulated using simple diffusion and cellular automate models, as well as more complex,spatially explicit individual-based models and metapopulation models, some of which requirelarge-scale computing resources. Simpler approaches to studying gene flow among animalpopulations include analysis of topography, vegetation, or other surface features to calculate pathcosts for varying dispersal routes as a way of modeling likely patterns of animal dispersal oncomplex landscapes. My sense is that spatially-explicit models represent an as yet relatively untapped set of toolswhich could be used to study gene flow in continuous versus fragmented landscapes. Evenrelatively simple applications of widely available GIS software could be useful for managing andvisualizing gene flow data as well as for some simple modeling procedures. There are obviousopportunities here for collaboration between geneticists measuring gene flow in the field andlandscape ecologists with expertise in dynamic spatial models.
Dyer, Rodney J., Department of Biology, University of Missouri-St. Louis,Paternity analysis and gene flow in Northern Red Oak (Quercus rubra L.)For wind pollinated oaks, the rate of pollen migration into the stand is the most important factorgoverning gene flow. However, determining the significance of the resultant pollen distancedistribution is problematic because of the nature of fractional paternity assignment. This studyutilized starch gel electrophoresis and fractional paternity analysis to estimate rates of apparentand cryptic gene flow into a stand of red oak in central Missouri. Progeny arrays from threematernal trees and 234 putative fathers from a 4 ha stand revealed 15 of the 137 offspringresulting from gene flow into the stand. Furthermore, Monte Carlo simulations predicted oneoffspring to be the result of cryptic gene flow. Total gene flow, converted to Nm, was 2.0.Resultant pollen distance distributions suggest a leptokertic distribution, however truncation ofindividuals with ambiguous paternity prevents statistical testing. Male fertilities had nosignificant relationship with dbh, distance to maternal tree, and/or direction. Suggestions forstatistical analysis of the pollen distribution are offered.
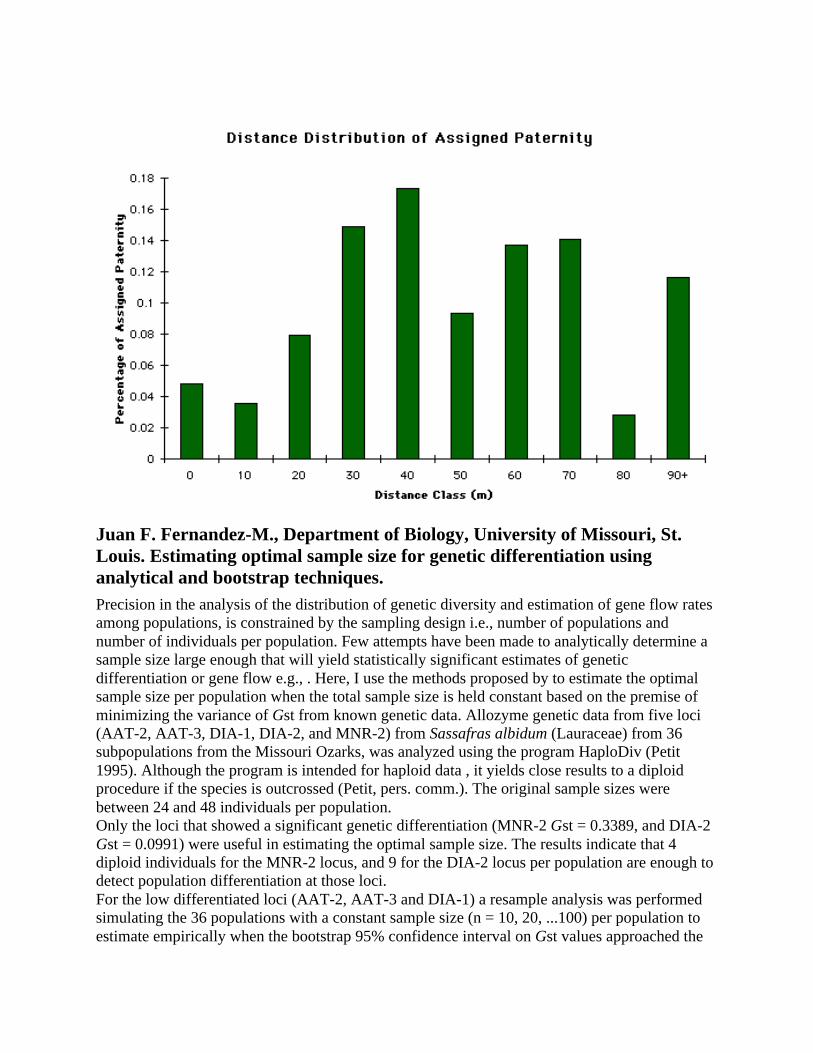
Juan F. Fernandez-M., Department of Biology, University of Missouri, St.Louis. Estimating optimal sample size for genetic differentiation usinganalytical and bootstrap techniques.Precision in the analysis of the distribution of genetic diversity and estimation of gene flow ratesamong populations, is constrained by the sampling design i.e., number of populations andnumber of individuals per population. Few attempts have been made to analytically determine asample size large enough that will yield statistically significant estimates of geneticdifferentiation or gene flow e.g., . Here, I use the methods proposed by to estimate the optimalsample size per population when the total sample size is held constant based on the premise ofminimizing the variance of Gst from known genetic data. Allozyme genetic data from five loci(AAT-2, AAT-3, DIA-1, DIA-2, and MNR-2) from Sassafras albidum (Lauraceae) from 36subpopulations from the Missouri Ozarks, was analyzed using the program HaploDiv (Petit1995). Although the program is intended for haploid data , it yields close results to a diploidprocedure if the species is outcrossed (Petit, pers. comm.). The original sample sizes werebetween 24 and 48 individuals per population.Only the loci that showed a significant genetic differentiation (MNR-2 Gst = 0.3389, and DIA-2Gst = 0.0991) were useful in estimating the optimal sample size. The results indicate that 4diploid individuals for the MNR-2 locus, and 9 for the DIA-2 locus per population are enough todetect population differentiation at those loci.For the low differentiated loci (AAT-2, AAT-3 and DIA-1) a resample analysis was performedsimulating the 36 populations with a constant sample size (n = 10, 20, ...100) per population toestimate empirically when the bootstrap 95% confidence interval on Gst values approached the

observed value for the total data. The simulated samplings suggested: 1) that at least 20individuals per population are required for a 95% confidence interval to overalap with the truemean Gst ; 2) that the estimated variance stabilizes when sample size is greater than 30individuals per population; and 3) that the estimator that approaches the true value the better isthe Gst estimator proposed by Pons and Chaouche (1995). For a locus by locus analysis, the leastdifferntiated locus will determine the minimum sample requirements. Literature Cited
• Assuncao, R. and C. M. Jacobi. 1996. Optimal sampling design for studies of gene flowfrom a point using marker genes or marked individuals. Evolution 50(2): 918-923.
• Epperson, B. K. and T. Li. 1996. Measurement of genetic structure within populationsusing Moran's spatial autocorrelation statistics. Proc. Natl. Acad. Sci. USA 93: 10528-10532.
• Petit, R.J. 1995. HaploDiv. A Pascal program for the Analysis of diversity for haploiddata.
• Pons, O. and K. Chaouche. 1995. Estimation, variance and optimal sampling of genediversity II. Diploid locus. Theor. Appl. Genet. 91: 122-130.
• Pons, O. and R. J. Petit. 1995. Estimation, variance and optimal sampling of genediversity I. Haploid locus. Theor. Appl. Genetics 90: 462-470.
Gilpin, Michael. Department of Biology, University of California-San Diego.Gene Flow and selection under extinction/recolonization dynamics for selfincompatible plants.The S-Allele for self-incompatability in plants has long been a subject for theoretical analysis,since, through frequency dependence, it maintains dozens of alleles in even small populations.Previous work has been based on single patch models or on stepping-stone configurations withconstant population sizes. In collaboration with Josh Kohn (UCSD) and Adam Richman(Montana State University), I'm developing java-based model that incorporates local extinctionof a patch followed by a colonization and founder event. The model tracks alleles and geneticdistance data, such as FST. Metapopulation dynamics increase isolation with distance and reducethe regional number of alleles.
Hamrick, James L. Departments of Botany and Genetics, University ofGeorgia, Athens, GA. Predicting the genetic consequences of gene flow:problems and solutions.The availability of molecular genetic markers coupled with advanced statistical estimationprocedures have significantly increased our ability to estimate gene flow rates and otherpopulation parameters for many plant species. The improved ability to accurately estimate geneflow into plant populations allows us to predict the genetic consequences of small populationsize, habitat fragmentation, and isolation distance. However, when gene flow is estimated inconjunction with male reproductive success or effective population sizes, some problems canarise. For example, when estimating male reproductive success in populations that experience
high rates of gene flow, the assignment of progeny to certain pollen donors may be biasedtowards individuals with multi locus genotypes that most closely approximate gene frequenciesin the immigrant donor population. Perhaps a more serious problem is the observation thatindividual trees do not sample the pollen pool at random as is assumed by most estimationprocedures. There is considerable evidence from the plant mating system literature thatindividual maternal trees often receive genetically different pollen. This is probably also true ofpollen that immigrates into a population. Thus, a second generation of gene flow estimationprocedures are needed that can take into account such heterogeneity in the immigrant pollen pooland use iterative procedures to better estimate the immigrant pollen pool for individual trees aswell as populations.
Nason, John. Dept. of Biological Sciences, University of Iowa, Iowa City, IA52242-1324. Measurement of gene flow through pollen and seed in continuousand discontinuous populations.Due to differences in their physical properties and in the vectors that disperse them, pollen andseed movement may generate spatial patterns of gene dispersion that differ in both continuousand discontinuous populations. Studies of pollen flow have employed statistical geneticapproaches that fall into one of two categories; those that estimate rates of pollen flow intodiscrete populations but do not provide estimates of male fertility and pollen movement withinpopulations and, conversely, those that infer male fertilities but do not adjust these estimates forcryptic pollen flow originating outside of the study population. Combining statistical approaches,I will present a model that simultaneously estimates rates of total gene flow and male fertilitiesadjusted for cryptic pollen gene flow from genotypic data. In contrast to the problems ofquantifying pollen dispersal, the development and application of statistical models to estimategene flow via seed has been hampered by the limited availability of suitable maternally inheritedchloroplast and mitochondrial markers. As a solution to this problem, I will present a generalframework for estimating pollen and seed components of gene flow from the observeddistribution of genotypes at biparentally inherited loci. The model much more rapidly generatesdirect estimates of the levels of pollen flow received by individual maternal plants andpopulations than does currently available methods. Moreover, once a population level estimate ofpollen flow has been obtained, nuclear markers, such as allozymes, can be used to obtain directestimates of seed immigration from the multilocus genotypes of dispersed seeds and seedlings.The application of these models to investigating pollen, seed, and gene movement in continuousand spatially isolated populations will be discussed.
Neigel, Joseph E. Department of Biology, The University of SouthwesternLouisiana. Gene flow analysis based on spatial dispersion of individuallineages.The spatial dispersion of an organismal lineage from a single descendant is a direct consequenceof gene flow. Thus, an analysis of this process can be similar to that used for direct estimates ofgene flow from mark-and-recapture data. Development of this approach as a method forestimating gene flow requires genetic markers that delineate lineages of sufficiently recentorigin, and models that provide a framework for estimating dispersion parameters. This approach
has been applied to large scale patterns of animal mtDNA variation, with encouraging results.
Petit, Rémy J. INRA Forest genetics and tree improvement laboratory,Bordeaux, France. Contribution of cytoplasmic markers to studies of geneflow in plants.It may seem inappropriate to investigate chloroplast DNA (cpDNA) or mitochondrial DNA(mtDNA) to get insights of gene flow in plants. Indeed, the bulk of gene exchanges is mediatedby pollen, and cytoplasmic genomes are usually maternally inherited. But seed flow may besignificant in some species, whereas cpDNA is paternally inherited in an important group offorest trees (Gymnosperms). In general, inferring the relative importance of pollen and seed flowseems important. Indeed, even if often less mobile than pollen grains, seeds are the only vehicleto move to new environments ('The haploid phase of environmental exploration cannot actfurther than what has already been colonized by the diploid phase' to quote Harper). Also, forsome species, humans have moved seeds and plants around. Cytoplasmic markers may in suchcases be extremely useful to differentiate introduced from native material. Indeed, geneticstructure is often much stronger for maternally inherited markers compared to biparentally (orpaternally) inherited ones. In parentage analyses, a set of highly polymorphic nuclearmicrosatellites may be used to identify the parents of a given seedlings but the differentiation ofthe mother from the father may be difficult. On the other hand, if combined with cytoplasmicmarkers, a complete picture may be obtained. Clonally evolving genomes are very appropriatefor reconstructing phylogenies, an information sometimes useful to consider in gene flowstudies. Finally, 'interspecific gene flow' also called 'cytoplasmic captures' are reported to be veryfrequent in plants. Actually, these expressions may be misleading, since it is probably often thenuclear genome which moves over a static maternal bedrock. Nevertheless, it remains true thatone may often get better insights of interspecific gene flow with cytoplasmic than with nuclearmarkers.
Petit, Rémy J. INRA Forest genetics and tree improvement laboratory,Bordeaux, France. Measuring genetic differentiation with molecular markersto identify populations for conservation. The purpose of this talk was to introduce some work done in collaboration with Odile Pons(INRA, Jouy-en Josas) on the estimation of genetic differentiation in various contexts. Amongthe questions studied are the following: How to obtain confidence intervals for estimates ofgenetic differentiation (GST)? How to optimize sampling in order to obtain a better (moreprecise) estimate of differentiation? How to measure differentiation while taking into accountinformation on the nature of the alleles (NST (sequence) or RST (microsatellite) data)? How tocompare differentiation for ordered versus unordered alleles? What does this difference mean?How to get pairwise measures of differentiation? How to measure the differentiation of onepopulation from the rest ? Is a given population important to conserve because it is variable orbecause it is distinct, or because of both? How to measure that? How to compare measures ofallelic richness? What do statements such as: 10% of the diversity is distributed amongpopulations' really mean?
Savolainen,Outi. Department of Biology, University of Oulu, Finland. Geneflow and local adaptation in Scots pine.Scots pine can serve as a case study for considering many aspects of gene flow. The reproductivebiology of Scots pine is better known than that of most other conifers (Sarvas 1962, Koski 1970).The distribution of quantitative genetic variation of adaptive traits has been extensively studied,and for many important traits the populations are highly differentiated (Mikola 1982, Karhu et al.1996, Hurme et al. 1997, Hurme and Savolainen in prep). The distribution of variation inmolecular markers has been well characterized. Until now, all markers, isozymes, RFLP, RAPD,microsatellites, have shown very limited degrees of differentiation. Thus, so far we have notfound markers for those parts of the genome that are differentiated. At least many northernconifers may share similar patterns of biology (Savolainen and Kuittinen, in press). The basicfindings of gene flow in Scots pine, through direct measures by marking pollen, paternityanalysis and indirect genetic inference all suggest that gene flow through pollen is likely to beextensive. The influence of timing of flowering in different populations is in the direction offacilitating south to north gene flow. There is strong selection for adaptation to localenvironmental conditions. The results of the contrasting influences of migration and selectionresult in these divergent patterns of differentiation discussed above. These results can also beused for considering the consequences of fragmentation and management. For literature cited see:
Savolainen, O. and Hurme, P. 1997. Conifers from the cold. Pp. 43-62 in Environmentalstress, adaptation and evolution (R. Bijlsma and V. Loeschcke, eds.). Birkhäuser Verlag.
Smouse1, Peter E. Sylvan R. Kaufman1, and Elena R. Alvarez-Bullya2.1Department of Ecology, Evolution & Natural Resources and Center forTheoretical & Applied Genetics, Cook College, Rutgers University; 2Centrode Ecologia, Universidad Nacional Autonoma de Mexico. Use of parentageanalysis in the assessment of gene flow.Much attention has been directed to the use of F-statistics (and similar measures) for the indirectestimation of gene flow between populations. While such approaches allow estimation from acrosscutting survey of a single generation, they have their limitations. An alternative is to use atwo-generation approach, based on paternity analysis. There are many different situations onecan treat, given proper mendelian inheritance of a set of genetic markers, but we will concentrateon the situation with known mothers and offspring, coupled with candidate male (pollen donor)populations of "well-estimated" genetic composition. This approach is a simple extension ofsingle-male analysis, not unlike a mixed stock (migrational) fisheries analysis. We can alsomodel the respective contributions of the pollen donor populations, in terms of interestingfeatures or in terms of their distance from the recipient (female) population. We will illustratewith a tropical pioneer tree species, Cecropia obtusifolia, for which the appropriate data providea telling demonstration of patterned gene flow. Parentage analysis, while it requires additionalinformation, would appear to be more powerful than F-statistics analysis, in elucidating geneflow.

Smouse1, Peter E. and Rod Peakall2. 1Department of Ecology, Evolution &Natural Resources and Center for Theoretical & Applied Genetics, CookCollege, Rutgers University; 2 Dept. Botany and Zoology, Australian NationalUniversity. Micro-spatial autocorrelation analysis for multiple-locus, multi-allelic genetic dataUntil recently, most spatial autocorrelation analysis of genetic data has been conducted withunivariate techniques. Each allele at each locus has been analyzed separately, yielding manydifferent analyses, usually treated (incorrectly) as independent replicates of the process, thoughtto be (broadly) demographic and spatial. With the recent interest in micro satellite loci, withmyriad alleles, this univariate strategy is hopelessly cumbersome. Various workers, notably suchpeople as Sokal, Barbujani, and Epperson, have begun to switch over to a multiple-charactertreatment. We show that by switching to genetic distance techniques, we can produce acompletely general multivariate treatment, can use multiple-alleles, multiple-loci, weighted orunweighted information, and so on. We then illustrate new non-parametric testing procedures onthe entire autocorrelation profile. We illustrate with published allozyme data on the Australianorchid, Caledenia tentaculata. The new analysis is easily tractable and very powerful, reliablydetecting pattern when it is there, and demonstrating its absence when it is not.
Sork, Victoria L. Sabbatical Research Fellow, NCEAS, University ofCalifornia-Santa Barbara and Department of Biology, University of Missouri-St. Louis. Introduction to workshop: studying gene flow on an ecologicaltime scale.Gene flow among populations can be studied using an evolutionary time frame or an on goingtime frame. Evolutionary questions concerning the role of gene flow in genetic diversity,population differentiation, species identity, and speciation emphasize the evolutionary timescale. However, conservation biological questions concerning the role of gene flow in futurepatterns must rely on estimates of on-going gene flow under current landscape conditions. Myquestion, and to some extent the main question of the workshop, is to evaluate the extent towhich gene flow models developed to answer evolutionary questions in an evolutionaryframework can be used to estimate on-going gene flow. In this introductory talk, I will brieflyreview categories of gene flow models--some of which will be developed in more detail byworkshop participants. Then, I will present evidence of ecological and landscape influences onpatterns of gene flow. My talk will end with a list of questions about which models are mostappropriate for the estimation of on-going gene flow and whether new models should bedeveloped which utilize metapopulation approaches or the spatially explicit models.
Steinberg, Eleanor L University of Washington. Using and individual-based,spatially-explicit simulation model to evaluate the power of FST as an indicatorof recent habitat fragmentation.The ecological impacts of habitat fragmentation due to human-induced landscape modificationsare of serious concern to conservation biologists. Such fragmentation may reduce the exchangeof individuals between populations, resulting in isolated patches made vulnerable to extinctiondue to environmental stochasticity and/or inbreeding depression. Unfortunately, studies ofspecies at risk are typically plagued by logistical problems, making it difficult to collect thedetailed but large-scale demographic data necessary to address this issue. Conservation biologistshave thus increasingly been turning to molecular genetics to study threatened populations. Onegoal of these studies is to use current patterns of genetic structure to elucidate underlyingpopulation processes, in particular, those dealing with migration dynamics. However, thisapproach has some serious limitations. Importantly, because many different population processeslead to similar patterns of genetic structure, particular processes are difficult to infer frompattern. In addition, the population genetics models most commonly applied to these systems arebased on equilibrium conditions not typically found in nature, and are framed in abstract termsthat are difficult to link to biological data. Finally, influences of current and historical conditionsare not easily separated. I will present an individual-based simulation model (based on pocketgopher biology) that incorporates genetics and demography to explore scenarios of change ingenetic structure as a result of habitat fragmentation. In particular, I will use the simulation toillustrate limitations in using models based on F-statistics as a generic tool (particularly formanagement applications), and will suggest possible future directions for applying this modelingapproach to interpret both spatial and temporal patterns of genetic variation. Reference:
• Steinberg, E.K. and C.E. Jordan. Using molecular genetics to learn about the ecology ofthreatened species: the allure and illusion of measuring genetic structure in naturalpopulations. Pp. 440-460 in Conservation Biology for the Coming Decade (P. Fiedler andP. Kareiva eds.). Chapman and Hall, NY.