proceedings of the 1st international workshop on social ... no.2.pdf · proceedings of the 1st...
TRANSCRIPT
National Institute for Environmental Studies
Editors Stephan Scholz Penelope Canan Yoshiki Yamagata
Proceedings of the 1st International Workshop
on Social Network Approaches to Urban and Regional Carbon Management
5-7 April, 2005, Tsukuba, Japan

Published by: Global Carbon Project and the National Institute for Environmental Studies Editors: Stephan Scholz Penelope Canan Yoshiki Yamagata Global Carbon Project National Institute for Environmental Studies 16-2 Onogawa, Tsukuba, Ibaraki 305-8506 JAPAN Tel: 029-850-2672 Fax: 029-850-2690 Copyright: Global Carbon Project 15 January 2006 Copies of Global Carbon Project Reports are available by request from: Global Carbon Project National Institute for Environmental Studies 16-2 Onogawa, Tsukuba, Ibaraki 305-8506 JAPAN Tel: 029-850-2672 Fax: 029-850-2690
Printed on Recycled Paper

Front Cover Photograph: spring cherry blossom in Tsukuba, taken by Fukuya Iino

i
PARTICIPANTS
1. Kazumi Kondoh 12. Yasuko Kameyama 2. Catherine Dibble 13. Michael Obersteiner 3. Beth Schaefer-Caniglia 14. Yoshiki Yamagata 4. Frank Malone 15. Melanie Hartman 5. Stephan Scholz 16. Rajesh Nair 6. Yukako Ojima 17. Midori Usui Aoyagi 7. Erich Schienke 18. John Sonnett 8. Liz Malone 19. Hiroyasu Sugihara 9. Mikiko Kainuma 20. Joseph Cabrera 10. Jeffrey Broadbent 21. Fukuya Iino 11. Penelope Canan 22. (Not Pictured: Yukiko Yoshida)

ii
TABLE OF CONTENTS Participants…………………………………………………………………………………...i Table of Contents…………………………………………………………………………….ii Executive Summary………………………………………………………………………….1 Invitation Letter……………………………………………………………………………...3 Presentation Themes and Schedule……………………………………………….……...…5 Presentations………………………………………………………………………………..10 GCP URCM Initiative……………………………………………………………...10 Penelope Canan……………………………………………………………..10 Biographical Statement…………………………………………….10 Pre-Workshop Thought Piece……………………………………..11
Presentation Summary: Social Networks and Regional Carbon Management: GCP URCM Initiatives……………………………...12 Power Point Slides………………………………………………….13 Capturing Network Dynamics across Space and Time…………………………..21 Jeffrey Broadbent…………………………………………………………..21 Biographical Statement…………………………………………….21 Pre-Workshop Thought Piece……………………………………..21
Presentation Summary: The “String Accordion” Network Dynamics through Space and Time………………………………...22
Power Point Slides………………………………………………….32 Stakeholder Identification, Participatory Research and Citizen Involvement…28 Erich Schienke……………………………………………………………...28 Biographical Statement…………………………………………….28 Pre-Workshop Thought Piece……………………………………..29 Presentation Summary: From Perfect Knowledge to Working
Knowledge (s): Rethinking Scientific Output for Effect Public Participation in the Context of Carbon Budgets…………………...30 Power Point Slides………………………………………………….32 Yasuko Kameyama…………………………………………………………35 Biographical Statement…………………………………………….35 Pre-Workshop Thought Piece……………………………………..35
Presentation Summary: Future Climate Regime: Assessment by Scenario Planning Approach……………………………………….36 Power Point Slides………………………………………………….37 Penelope Canan……………………………………………………………..40 Presentation Summary: The Battle over Definitions of Development: Overwhelming the Resistance to the Growth Machine…………………………………………………….40 Overview Handout………………………………………………….41 Networks in/for Ecosystem Understanding and Management…………………..43 Beth Schaefer Caniglia……………………………………………………..43 Biographical Statement…………………………………………….43 Pre-Workshop Thought Piece……………………………………..43

iii
Presentation Summary: Learning from a Counter Case of Social Network Failure: Dust Bowl Recovery in the Great Plains of the
USA………………………………………………………………….44 Power Point Slides………………………………………………….45 Kazumi Kondoh…………………………………………………………….50 Biographical Statement…………………………………………….50 Pre-Workshop Thought Piece……………………………………..50
Presentation Summary: The Urban Growth Machine and its Unintended Ecological Consequences: A Case Study of the Urban
Heat Island…………………………………………………………..51 Power Point Slides………………………………………………….53 Michael Obersteiner………………………………………………………..56 Biographical Statement…………………………………………….56 Pre-Workshop Thought Piece……………………………………..56
Presentation Summary: A Caricature of Transatlantic Differences Over Risk Management……………………………………………..58
Power Point Slides………………………………………………….59 Early Report on Regional Carbon Management Case Study in Hokkaido…….62 Hiroyasu Sugihara………………………………………………………….62 Biographical Statement…………………………………………….62 Pre-Workshop Thought Piece……………………………………..62 Presentation Summary: Towards a Regional Carbon Management
System: Creating Network Economies Between Nature and Economy……………………………………………………………..63
Power Point Slides………………………………………………….64 Stephan Scholz……………………………………………………………...67 Biographical Statement…………………………………………….67 Pre-Workshop Thought Piece……………………………………..67
Presentation Summary: Sustainable FMBECS Market in Hokkaido…………………………………………………………….68
Power Point Slides………………………………………………….69 Making Case Studies Comparable………………………………………………...74 Stephan Scholz, John Sonnett……………………………………………...74
Power Point Slides: An Introduction to Qualitative Comparative Analysis……………………………………………….74
Network Views of Cultural Content and Media Analysis………………………..77 Elizabeth Malone…………………………………………………………...77 Biographical Statement…………………………………………….77 Pre-Workshop Thought Piece……………………………………..77
Presentation Summary: Rhetorical Elements as Social Network Links and Potential Pathways of Change….……………………….79 Power Point Slides….………………………………………………80 John Sonnett………………………………………………………………...81 Biographical Statement…………………………………………….81 Pre-Workshop Thought Piece……………………………………..82

iv
Presentation Summary: Mapping Global Climate Change in Multiple Media Arenas……………………………………………...83 Power Point Slides………………………………………………….84 Simulations, Modeling Network Dynamics……………………………………….87 Catherine Dibble……………………………………………………………87 Biographical Statement…………………………………………….87 Pre-Workshop Thought Piece……………………………………..87 Presentation Summary: Network Analysis, Process, Simulation...88 Power Point Slides………………………………………………….89 Joseph Cabrera……………………………………………………………..91 Biographical Statement…………………………………………….91 Pre-Workshop Thought Piece……………………………………..91
Presentation Summary: Cultural Integration: A Network Simulation Study…………………………………………………….92
Power Point Slides………………………………………………….93 Yoshiki Yamagata…………………………………………………………101 Biographical Statement…………………………………………...101 Pre-Workshop Thought Piece……………………………………102
Presentation Summary: Towards a Carbon Balanced Region: Integrated Modeling Approach……………………………………103 Power Point Slides………………………………………………...104 EXPO 2005………………………………………………………………………...107 Yukiko Yoshida……………………………………………………………107
Power Point Slides: About the 2005 World Exposition: Message from Japan, Nature’s Wisdom…………………………………….107 Keynote Presentation……………………………………………………………..110 Jeffrey Broadbent…………………………………………………………110
Presentation Summary: Pathways to Participation: Global Networks and NGO “Voice” in Japanese Climate Change Policy-
Making……………………………………………………………..110 Power Point Slides………………………………………………...111 Conclusions………………………………………………………………………………...124 Appendix I: IPCC Recommendations…………………………………………………...125 Appendix II: Workshop Carbon Budget………………………………………………...127 Appendix III: Relevant Literature…………………………………………………….....128

1
EXECUTIVE SUMMARY
What can social network analysis (SNA) contribute to addressing the problem of climate change? This question was explored at the International Workshop on Social Network Approaches to Urban and Regional Carbon Management (URCM), hosted by the Global Carbon Project (GCP) in Tsukuba, Japan April 5-7, 2005. Social scientists from Japan, the USA, and Europe reported on social network theory, applications and methodology to envision their use for on-the-ground social change regarding carbon management. Some Beginning Assumptions: We began with the assumption that network action is a powerful organizational force, especially useful for intentionally flexible response to changing conditions in an operating environment. Network ties can also be usefully called upon to resist threats to the status quo from external challenges. (Consider, for example, the power of the “old boys network” in resisting acceptance of women and minorities in decision making positions in most societies). Network analysis is especially promising to go beyond the static conceptual categories of organizational behavior (firms, nation-states, disciplines) in that it facilitates the examination of non-continuous social units that traverse nation-states, regions and continents. Essentially, network analysis is concerned with the structure of social relations, examining patterns in connectedness among non-contiguous, multi-site entities, using interpersonal, inter-organizational, informational, cultural and other ties as the basic units of analysis. Anheier and Katz (2005: 207) explain that “network analysis measures social reality not by reference to people’s individual attributes (gender, class, age, values and so on) but by looking at their social relationships, the patterns they form, and their implications for choices and behaviour”. The mission of earth system science and of the Global Carbon Project is revolutionary: to change the way science and management of carbon are conducted. Everyone agrees that accomplishing this mission requires understanding the intricately woven fabric of systemic relations in nature, including those among human societies, in order to tease out “windows of opportunity” for efficacious interventions in the “business as usual” scenario. We know that business as usual is supported by complex systems of economic, political, and cultural interests, with the dominant culture being globalized capitalism with “local” growth machines. These systems (networks of existing practices) have been institutionalized, making challenge by an activated public, interested media, or scientific consensus difficult. Therefore, the GCP call for a regional/urban future far different than business as usual requires understanding conservative networks of BAU as well as processes of network transformation and the emergence of networks for innovation. The earth has always cycled carbon in the atmosphere (mainly as CO2); in the oceans (surface, intermediate waters, deep waters and marine sediments); in terrestrial ecosystems (vegetation, litter and soil); in rivers and estuaries; and in fossil carbon, which is being remobilized by human activities. However, with the rate of fossil fuel burning feeding industrialization, urbanization and transportation and with large scale land clearing, the naturally balanced carbon cycle is in a non-analogous and dangerous state.
2
We agreed that current management of the carbon cycle is piecemeal, careless, inconsistent, profligate and shortsighted. Enabled by past and current networks of power, the world has embraced a carbon culture that has spun out of control in the past 100 years. So, social change needs to take place, but how? Part of the answer will require the creation of new networks at every level and sector of human activity to revolutionize the way we live on the planet. Such sweeping social change must occur at local (regional) levels since regions vary in their natural resources and ecosystem properties (forest, plains, desert, e.g.) as well as in their social resources and socio-economic characteristics. Moreover, and very importantly, places vary in their location in larger networks of regional, national and global carbon-based power. What We Learned: We feel that the workshop successfully represented the broad array of research that exists within the SNA tradition from empirical studies to dynamic agent simulations. One of the central threads that ran throughout all of these presentations was how to create networks for pro-active change. This issue has often been referred to as a problem of scale in the climate change research community (or frames in the social science community). Climate researchers have focused their analyses on global level simulations that are too abstract and removed from local level policy concerns. Successful carbon management in the future will have to bridge this gap by mapping different stakeholder needs and finding synergistic intersections for policy implementation. For example, how can policies be designed that reduce particulate pollution in urban areas that would simultaneously mitigate carbon emissions? How can urban heat island issues be addressed and/or rural development be fostered that also achieve carbon mitigation? These examples would benefit from social network analyses that can map cultural, rhetorical space as well as actual connections between different actors. One such application is taking place in rural Japan that will attempt to knit rural actors together around the creation of biomass power that addresses economic, ecological and environmental needs. The potential application of dynamic network simulations was also explored. Basic network evolution can be modeled and coupled with urban or land-use change dynamics. International networks of civil society actors can also be modeled to predict which actors will have the greatest impact on policy formation based on the social capital they can draw upon. For example, it was shown that within the context of Japan’s environmental policy arena those NGOs that draw on domestic social capital are more successful than those which draw on international social capital. Finally, we introduced qualitative comparative analysis as a potential method to compare case studies of network mobilization success or failure, as in the presented case of the Oklahoma Dust Bowl. Overall, the workshop was very stimulating and successfully pushed the GCP’s thinking in new directions, which is reflected in the subsequent URCM framework drawn up in June.
Penelope Canan Stephan Scholz

3
INVITATION LETTER
It is with pleasure that we invite you to participate in the GCP Workshop on Social Network Theory and Methods for Ecosystem Management to be held in Tsukuba, Japan on 5-7 April 2005. The purpose of the workshop is to convene top minds in social network analysis to construct a framework to guide future research relevant to carbon management. In the workshop we will: • Explore the current state of network theory and methods • Explore directions for application of network theory & methods for regional carbon
management • Organize into subgroups around theoretical, methodological, and practical concerns • Outline an article for co-authored publication: “Social Network Theory Applications for
Regional Ecosystem Management.” What is the GCP? The Global Carbon Project is one of the Earth Systems Science Partnerships created by four international science communities known as the International Human Dimensions Programme on Global Environmental Change (IHDP), the International Geosphere-Biosphere Programme (IGBP), the World Climate Research Programme (WCRP), and the International Programme of Biodiversity Science (DIVERSITAS). The Earth Systems Science Partnerships were created to foster the integration of the natural and social sciences for policy-relevant science on global environmental issues. The GCP’s mandate is to promote and support coordinated science on the global carbon cycle as it takes place around the world. The GCP’s international project office in Tsukuba, Japan is headed by sociologist Penelope Canan from the University of Denver in the USA. One of the Tsukuba office’s challenges is to foster policy-relevant science for place-based carbon management. The other GCP office is directed by Pep Canadell, a terrestrial ecosystem biologist, in Canberra, Australia. The Canberra office focuses on vulnerable carbon pools, among other things. Why is the GCP interested in social networks? Social networks are known to be powerful vehicles for social change and the diffusion of information and knowledge. The GCP wishes to bring together experts in social network analysis to advance a framework for social network research that would be useful for regional carbon management. We need your expertise to help us draft such a research framework. The workshop organizers do not expect the invited participants to know about the global carbon cycle, carbon budgets, greenhouse gases, or ecosystem management (although some do). What we hope is that you bring your experiences in social network research,

4
comparative methodology, and the study of social behavior to bear on a pressing environmental challenge, the transformation of social institutions at local, regional, national, and global scales. (We are sending you a very brief overview of the carbon cycle that appeared in National Geographic earlier this year to help locate the policy issue. But, again, your expertise in social network research is the reason we are inviting you.) We sincerely hope you will join us in April, at cherry blossom time in Japan. It will be a great pleasure to see you and to hear insights from you and to socialize with you. For our part, we will do our best to facilitate an exciting meeting in what is a very interesting part of the world. The information that we are mailing to you will also tell you more about the GCP. If you have any questions or need any further assistance, please don’t hesitate to contact our office. Sincerely, Penelope Canan, Ph.D. Executive Director, GCP

5
PRESENTATION THEMES AND SCHEDULE
GCP 2005 International Workshop on Social Networks and Regional Carbon Management
GCP URCM Initiative
Social Networks and Regional Carbon Management Canan
Capturing Network Dynamics Across Space and Time
The “String Accordion” Network Dynamics Through Space and Time Broadbent
Stakeholder Identification, Participatory Research and Citizen Involvement
From Perfect Knowledge to Working Knowledge (s): Rethinking Scientific Output for Effective Public Participation in the Context of Carbon Budgets Schienke Future Climate Regime Assesment by Scenario Planning Approach Kameyama The Battle Over Definitions of Development: Overwhelming the Resistance to the Growth Machine Canan
Networks in/for Ecosystem Understanding and Management
Learning from a Counter Case of Social Network Failure: Dust Bowl Recovery in the Great Plains of the USA Caniglia The Urban Growth Machine and its Unintended Ecological Consequences: A Case Study of the Urban Heat Island Problem Kondoh A Caricature of Transatlantic Differences over Risk Management Obersteiner
Early Report on Regional Carbon Management Case Study in Hokkaido
Towards a Carbon Balanced Region: Integrated Modeling Approach Yamagata Towards a Regional Carbon Management System: Creating Network Economies Between Nature and Economy Sugihara

6
Sustainable FMBECS Market in Hokkaido Scholz
Making Case Studies Comparable
An Introduction to Qualitative Comparative Analysis Scholz, Sonnett
Network Views of Cultural Content and Media Analysis Rhetorical Elements as Social Network Links and Potential Pathways of Change Malone Mapping Global Climate Change in Multiple Media Arenas Sonnett
Simulations, Modeling, Network Dynamics
Network Analysis, Process, Simulation Dibble Cultural Integration: A Network Simulation Study Cabrera
Expo 2005 About the 2005 World Exposition: Message from Japan, Nature’s Wisdom Yoshida
Keynote Presentation
Pathways to Participation: Global Network and NGO Voice in Japanese Climate Change Policy-Making Broadbent

7
GCP 2005 International Workshop on Social Networks & Regional Carbon Management
Schedule Monday April 4th: Arrive at Okura Frontier Hotel, Tsukuba
18:30 – 22:00 Open House Dinner Ninomiya House Rm. 1203 Penelope’s Apartment
Tuesday April 5th: Hotel Breakfast Buffet Camellia – 2nd Floor (beginning at 07:00)
Panel/Topic Speakers/Panelists Reporters
08:30 Taxis leave hotel for NIES
09:00 – 09:45 Introductions, Logistics, Templates Canan, Broadbent
09:45 – 10:30 GCP URCM Initiative Canan Caniglia
10:30 – 11:15 Capturing Network Dynamics Across Space and Time Broadbent Schienke
Yamagata
11:15 -13:00 Stakeholder Identification, Participatory Research & Citizen Involvement
Schienke, Kameyama, Canan Kondoh
13:00 Van to lunch
13:20 – 14:45 Japanese Lunch San Suitei
14:45 – 16:30 Networks in/for Ecosystem Understanding & Management
Caniglia, Kondoh, Obersteiner Malone
16:30 –17:30 Early Report on Regional Carbon Management Case Study in Hokkaido
Yamagata, Scholz, Sugihara Obersteiner
17:30 – 18:45 Walk to NIES Pond and Write/Enter Tuesday Session Reports on GCP Computer
Reporters
18:45 Cars to dinner

8
19:00 – 22:00 Pizza & Salad Dinner Cork Heads Aussie Bar
Darts, Billiards & Toasts by All
None!
22:00 Taxis leave for hotel
Wednesday April 6th:Hotel Breakfast Buffet Camellia – 2nd Floor (beginning at 07:00)
Panel/Topic Speakers/Panelists Reporters
08:30 Taxis leave hotel for NIES
09:00 – 10:00 Making Case Studies Comparable (QCA)
Scholz, Cabrera, Sonnett Canan
10:00 – 11:30 Network Views of Cultural Content and Media Analysis Malone, Sonnett Dibble
Kameyama
11:30 Walk to lunch restaurant
11:45-12:45 Lunch: Coco’s
12:45 13:00 Walk back to NIES
13:00-14:30 Simulations, Modeling Network Dynamics
Dibble, Cabrera Yamagata
Scholz
14:30-15:00 Break and Group Photo
15:00 – 17:00 Pathways to Participation: Global Networks and NGO “Voice” in Japanese Climate Change Policy
GCP Seminar Broadbent Scholz
17:00-18:00 Summary and Synthesis Canan and Broadbent Sonnet
18:00 Van leaves for dinner
18:30 - 20:30 Japanese Dinner Kenchintei Guest Introductions Expo Logistics
Canan Hartman Yoshida
20:30 Van leaves for hotel

9
Thursday April 7th: Hotel Breakfast Buffet Camellia – 2nd Floor (beginning at 07:00)
08:30 Taxis leave hotel for NIES (if you need to download reports)
09:00 – 10:30
Write/Enter Wednesday Session reports on GCP Computer Hartman Reporters
10:30 - 11:00 Duplicate and assemble summaries & outlines
Ojima, Scholz, Cabrera, Sonnett, Kondoh, Umemiya
11:00 Bus departs Okura Frontier Hotel for NIES
11:15 Bus Departs NIES for Hakone (Box Lunches)
18:30 Japanese Dinner Hakone Yumoto Hotel
Friday April 8th: Hotel Japanese Breakfast 7:30
08:45 Bus Departs for Aichi (Box Lunches)
12:45 - 22:00 World EXPO 2005
18:00 Dinner at EXPO - Tou-Ka-Rin (Chinese)
22:00 Shuttle to Chisan Inn
Saturday April 9th: Hotel Breakfast and Departure for airports etc.

10
PRESENTATIONS
GCP URCM Initiative
PENELOPE CANAN
Biographical Statement
Dr. Penelope Canan is the Executive Director of the Global Carbon Project, International Office at the National Institute for Environmental Studies in Tsukuba Science City, Japan. She comes to the GCP having been a professor of sociology at the University of Denver, the University of Hawaii, and the University of Virginia. An environmental sociologist, Canan is known for her work on integrated social impact assessment, energy and community development, democratic governance, and the formation of knowledge sharing expert networks. She has served as lead author on the Technology and Economic Assessment Panel of the UNEP Montreal Protocol on Substances that Deplete the Ozone Layer, chair of the Environment and Technology Section of the American Sociological Association, vice president of the Society for Applied Sociology, and director of the International Institute for Environment and Enterprise. Currently on leave from the University of Denver, she continues as a board member of the Colorado Energy Science Center, president of the SLAPP Resource Center, and member of the Awards Committee for the Ozone Layer Protection and Climate Change Office of the US Environmental Protection Agency and of the Asahi Foundation Blue Planet Award in Japan. She is the recipient of the Ozone Layer Protection Award of the US EPA, the Distinguished Practice Award of the Pacific Sociological Association, and the Driscoll Master Teacher Award at the University of Denver. For 20 years Canan has collaborated with law professor George Pring on SLAPPs or “Stategic Lawsuits Against Public Participation,” that is, the use of civil lawsuits to silence political speech. Their book, SLAPPs: Getting Sued for Speaking Out (Temple University Press 1996) and testimony before state legislatures helped lead 23 states and Guam enact anti-SLAPP laws. Her latest book with Nancy Reichman is entitled Ozone Connections: Expert Networks in Global Environmental Governance (Greenleaf 2002), published in Japanese in 2005 by Nippon Hyoronsha Co. Ltd. This work combines participant observation with depth interviews, surveys, and a formal network analysis to dissect the social system of global regulation into three intersecting networks—policies, programs, and projects—and showed how the networks evolved from the happenstance of initial contacts into complex working systems or regimes.

11
Fig. 1-6 TEAP Committees
Pre-Workshop Thought Piece
Social network analysis of the committees comprising the Technology and Economic Assessment Panel (TEAP) that rose as the policy advisory committee to the Parties for the implementation of the Montreal Protocol reveals the importance of collaborative leadership to explain its network properties and globally acknowledged effectiveness (Canan and Reichman 2002). Dr. Stephen Andersen of the US EPA acted as the quintessential collaborative leader: he auditioned, recruited, inspired, steered, cajoled, rewarded and awarded collaborative performance on demonstration ODS phase-out projects and the policy synthesis of state-of-the-art technological and economically feasible phase out possibilities. He united business, industry, NGOs and academics across very different industries, nations, and time. His example reminds us that characteristics of individual leadership are key factors for intentional network action as opposed to descriptive knowledge of the structure of social relationships. Figures 1-6 show committee networks. Figure 7 shows the overall TEAP network with Andersen located at the center of a powerfully cohesive unit. Figure 8 removes Andersen from the analysis to confirm his central role as an ozone protection institutional entrepreneur.
Fi 8 TEAP With t A d
Figure 7. TEAP, with Andersen

12
Some of the questions for social network research applied to social change regarding regional carbon management are: (1) who leads an emerging network from cliques to a coherent and dense structure; (2) what is the process of enrolling the commitment of potential network actors with the “right” social capital; (3) how is commitment to the network sustained over time; (3) how does a network evolve a common vision of action; (4) what resources (social capital) do leaders need to have in order to foster creativity, reliability, and brilliance; and, (5) who do we work for when we embark on intentional social network formation for planned social change?
Presentation Summary
GCP URCM INITIATIVES Penelope Canan
(Reporter: Beth Caniglia) Main Points
• The Earth System Science
Partnership was created to overcome barriers to cooperation across scientific fields.
• The GCP envisions building a
true integration between the social and natural sciences as a tool for regional carbon understanding and management.
Penelope Canan and Elizabeth Malone • Social science models developed to date (e.g. I=PAT) do not adequately capture the full range of social dynamics. The GCP hopes to encourage the development of richer models that also incorporate social network theories and techniques. Extant literature from social impact analysis can also provide valuable insights. • Within the POETICs categorization, social networks fall primarily within the
organizational dimension. • One goal of the GCP URCM initiative is to facilitate the development of a database
of place-based studies that can provide comparative and cumulative insights. • Another goal is to purposively build carbon expert networks and training programs
that are regionally focused yet collaborative across regions.
13
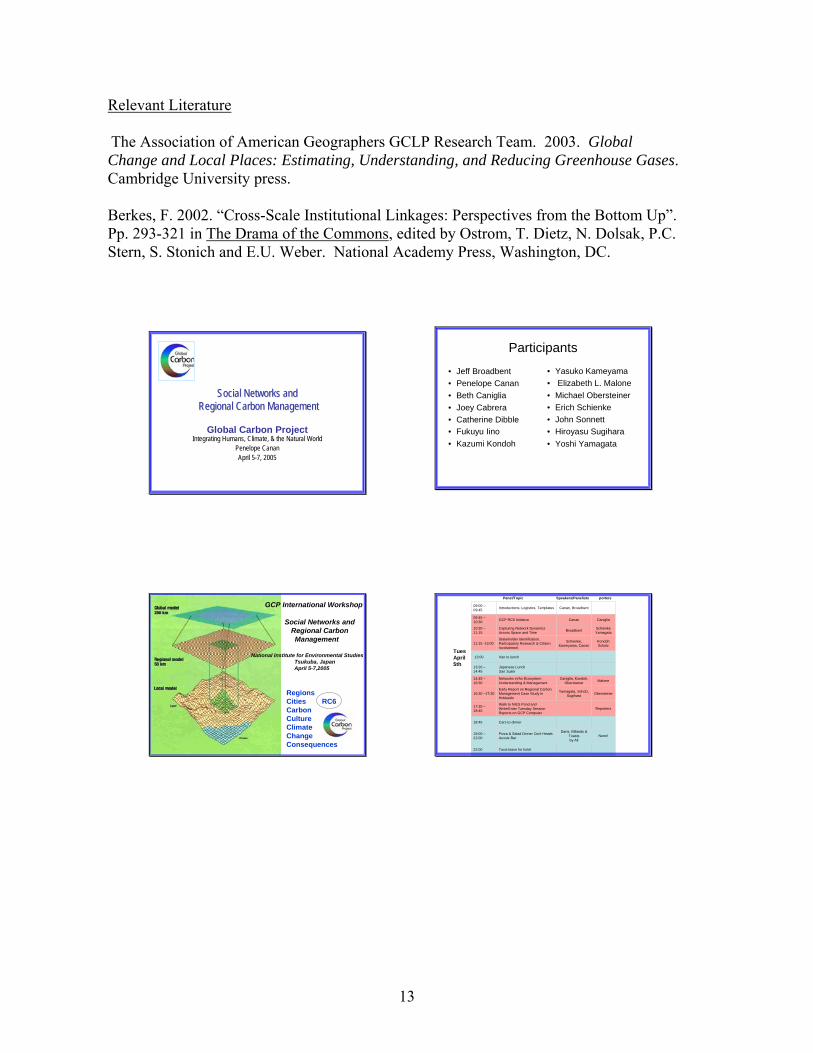
Relevant Literature The Association of American Geographers GCLP Research Team. 2003. Global Change and Local Places: Estimating, Understanding, and Reducing Greenhouse Gases. Cambridge University press. Berkes, F. 2002. “Cross-Scale Institutional Linkages: Perspectives from the Bottom Up”. Pp. 293-321 in The Drama of the Commons, edited by Ostrom, T. Dietz, N. Dolsak, P.C. Stern, S. Stonich and E.U. Weber. National Academy Press, Washington, DC.
Social Networks andSocial Networks andRegional Carbon ManagementRegional Carbon Management
Global Carbon Project Integrating Humans, Climate, & the Natural World
Penelope CananApril 5-7, 2005
Participants
• Jeff Broadbent• Penelope Canan• Beth Caniglia• Joey Cabrera • Catherine Dibble• Fukuyu Iino • Kazumi Kondoh
• Yasuko Kameyama• Elizabeth L. Malone• Michael Obersteiner• Erich Schienke• John Sonnett • Hiroyasu Sugihara • Yoshi Yamagata
RegionsCities RC6CarbonCultureClimateChange Consequences
GCP International Workshop
Social Networks and Regional Carbon Management
National Institute for Environmental StudiesTsukuba, JapanApril 5-7,2005
Panel/Topic Speakers/Panelists porters
Taxis leave for hotel22:00
None!Darts, Billiards &
Toasts by All
Pizza & Salad Dinner Cork Heads Aussie Bar
19:00 –22:00
Cars to dinner18:45
ReportersWalk to NIES Pond and Write/Enter Tuesday Session Reports on GCP Computer
17:30 –18:45
ObersteinerYamagata, Scholz, Sugihara
Early Report on Regional Carbon Management Case Study in Hokkaido
16:30 –17:30
MaloneCaniglia, Kondoh, Obersteiner
Networks in/for Ecosystem Understanding & Management
14:45 –16:30
Japanese Lunch San Suitei
13:20 –14:45
Van to lunch13:00
KondohScholz
Schienke, Kameyama, Canan
Stakeholder Identification, Participatory Research & Citizen Involvement
11:15 -13:00
SchienkeYamagataBroadbentCapturing Network Dynamics
Across Space and Time10:30 –11:15
CanigliaCananGCP RC6 Initiative09:45 –10:30
Canan, BroadbentIntroductions, Logistics, Templates09:00 –09:45
TuesApril5th

14
Introductions & Logistics
Van leaves for hotel20:30
Canan HartmanYoshida
Guest Introductions
Expo LogisticsJapanese Dinner Kenchintei18:30 - 20:30
Van leaves for dinner 18:00
SonnetMalone
Canan and BroadbentSummary and Synthesis17:00-18:00
KondohSchienke
GCP SeminarBroadbent
Pathways to Participation: Global Networks and NGO “Voice” in Japanese Climate Change Policy
15:00 –17:00
Break and Group Photo14:30-15:00
ScholzObersteiner
Dibble, CabreraYamagata
Simulations, Modeling Network Dynamics13:00-14:30
Walk back to NIES12:45 13:00
Lunch: Coco’s11:45-12:45
Walk to lunch restaurant11:30
DibbleKameyamaMalone, SonnettNetwork Views of Cultural Content
and Media Analysis10:00 –11:30
CanigliaScholz, Cabrera, Sonnett
Making Case Studies Comparable (QCA)
09:00 –10:00
WedApril6th
Thursday April 7th: Hotel Breakfast Buffet Camellia – 2nd Floor (beginning at 07:00)
Japanese Dinner Hakone YumotoHotel18:30
Onsen - Hakone Yumoto Hotel or free time15:30 - 18:30
Bus Departs NIES for Hakone(Box Lunches)11:15
Bus departs Okura Frontier Hotel for NIES11:00
Ojima, Scholz, Cabrera, Sonnett, Kondoh, Umemiya
Duplicate and assemble reports for editing enroute10:30 - 11:00
ReportersHartmanWrite/Enter Wednesday Session reports on GCP Computer09:00 – 10:30
(if you need to download reports)Taxis leave hotel for NIES08:30
ThursApril7th
RELEVANT LITERATURECanan, p., 1992. “Environmental disputes in changing urban political economies: A dynamic research approach,” Studies in Law, Politics, and Society, Vol. 12: 287-308. . Caniglia, B. S.. 2004. “Human Behavior & Land Use.” Oklahoma’s Environment: Pursuing A Responsible Balance. Oklahoma City: The Oklahoma Academy.Dibble, Catherine and Duncan Watts, 2006.“Matching range in physical and social space,”Journal of I Wish They Would Work on This Together Assoc of American Geographers Global Change and Local Places Research Group, 2003. Global Change and Local Places. Cambridge U. Press.
TESTABLE HYPOTHESES•The shorter the network average path length, the more swiftly new technological information is exchanged.•Industrial sectors with long term government subsidies will be less likely to innovate.•Geographic morphology and network morphology are related isotonically.
IMPLICATIONS FOR RC6 NETWORKS•Just as bottom up-top down approaches are necessary for understanding regional and local carbon budgets, understanding social networks of power and decision making operating at global, regional and local levels provide insights into the barriers to and opportunities for regional carbon management•Understanding regional Sectoral dynamics (e.g. agriculture, transportation, residential commercial, waste, energy) helps identify the stakeholders who are relevant to considerations of social change and innovation and the historical context of their willingness to change•National policies (regulation, subsidization) have a critical influence on the current local POETICs that cause local emissions and land use behavior. Enlightened national policies aimed at empowering local areas to change those POETICs can have a critical influence on more sustainable future behavior.
SUMMARY OF PRESENTATIONSPenelope Canan, Stakeholder Identification as a Matter of Policy, Program, Or Project AnalysisBeth Caniglia, Regional Elites in the US Cropland Growth Machine
MAIN POINTS•Geographical scale of network connections can be taken into account by range measures developed by Dibble and Watts (2006)•Measures of average path length provide an indication of the relative swiftness of information flow and therefore innovative capacity of a network•Network boundaries are arbitrary and need to be fixed by a combination of informed expert judgment and network member wisdom.•The strength and duration of commodity subsidies has perverted the market in a way that discourages innovation in the large scale agribusiness.
Friday April 8th: Hotel Japanese Breakfast 7:30
Shuttle to Chisan Inn22:00
Dinner at EXPO - Tou-Ka-Rin (Chinese)18:00
World EXPO 200512:45 - 22:00
Bus Departs for Aichi(Box Lunches)08:45
Saturday April 9th: Hotel Breakfast and Departure for airports etc.
FriApril8th
SatApril9th
What is the GCP?

15
RELEVANT LITERATURETESTABLE HYPOTHESES
IMPLICATIONS FOR RC6 NETWORKS•
SUMMARY OF PRESENTATIONSPresenter(s), Title(s)MAIN POINTS
Earth System Science Partnership
Health
International Geophere-Biosphere Program
IHDP
WCRP
Diversitas Water
GlobalCarbonProject
Joint Projects on Global
Sustainability
World ClimateResearch Program
International Human Dimensions Program
IGBP
Food
Setting UpSCIENCEFRAMEWORK IN
• CHINESE-MANDARIN
• RUSSIAN
• JAPANESE
Newsletters EditorialsJournal ArticlesConferencesLectures, Presentations
• GCP SEMINAR SERIES• e-NEWS• TV DOCUMENTARIES• GCP PAMPHLET• IMPROVED WEB SITE• TSUKUBA WEB PAGE
Partnerships with the major C programs
ACCSP,CanberraAustralia
NIES,TsukubaJapan (social scholar)
Inter.Proj.Office
NACP, D.C., USABeijing, China
CarboEurope, GermanyGHG CA, Italy
IOC/SCOR-CO2 PanelParis, France
Affiliate Program
PublicationsRussian
June 2005
Spanish-Short vs.
June 2005
Data Assimilation
2005
Japanese-Short vs.
June 2005
State of the Science Future Directions
2004 2004
Carbon-LUCC in AP
2003
English
Oct. 2003
Chinese
Nov. 2004
Science Networks for Comprehensive & Dynamic Regional Carbon Budgets
LBA
CarboEurope
China
NCASBiosphere WG
IIASA, EU, NEESPI
Japan
SouthernAfrica
IndiaC Sequestrationin Sahel
CanadaNorth America
Carbon Plan (NACP)
• Bottom-up constraints to the global carbon cycle• Driving processes of carbon sources and sinks• Carbon management tools for informing policy development• With the goal to integrate socio-economics to biogeochemistry

16
Japan (Penelope Canan)
• Integration of Human & Biophysical Forces
• Regional Development & the Carbon Cycle (RC6)
• Asia-Pacific Observation/synthesis
• Support Japanese Carbon Project
Science Foci ofGCP
International Offices
Australia (Pep Canadell)
• Model-data fusion
• Lateral transport (including dust)
• Australasian region observation/synthesis
• Vulnerability of C pools
Periodical Table of Elements
+ 1°C in past ~100 years = Glacial & polar ice melt, sea level rise, change natural habitats
Seasonal Fluctuation& Swift Rise
Historical Trends in Global CO2 Concentrations and Average Temperature
2000 2050 2100IPCC SRES, from
Kameyama 2004
(temperature increase from 1900: 1°C)
0
1
2
3
4
5
6
7 °C
Predicted Temperature IncreasePredicted Temperature Increase
1.4 ~5.8 °C

17
Global History of Human Dimensions of Drivers and POETIC Causes
Global Net Ecosystem Exchange (gC m-2 y-1)
Data:• remote sensing,• atmospheric CO2
NEE
Multiple constraints data assimilation for GLOBAL carbon cycle
Models:• terrestrial
biosphere (BETHY)
• atmospheric transport model
Kaminiski et al. 2002Peter Rayner
OptIC – (Parameter Estimation) Optimization IntercomparisonGCP-European Space Agency-IGBP-CSIRO funded project
Workshops 2004, 2005.
Vulnerabilities of the Carbon-Climate system
Gruber et al. 2004
Permafrost (Ta): 400 PgC
Wetlands (Ta, LUC): 450 PgC
Vegetation (fire/LUC):500 Pg
Methane hydrates (Ta): Large-PgC unknown
• Up to 200 ppm could be release this century.• Many of these vulnerabilities are poorly treated or not included in GCMs.
? How to Change the Trajectory?
Terrestrial Carbon Hot Spots in the Earth System
PermafrostHL PeatlandsT PeatlandsFire
18
Atmospheric CO2
Fossil Fuel burning
Vulnerability of biospheric C pools
WARMING
(+)
C emissions
(+)
(+)(+)
(+)
Carbon-Climate System
XLAND USE CHANGE(eg, deforestation, logging, fire)
Social Behavior
Social Structuresand Institutions
Human System
(+)
eg, fire risk, climate perceptions, smoke-health
(-)
(-)Human Vulnerability
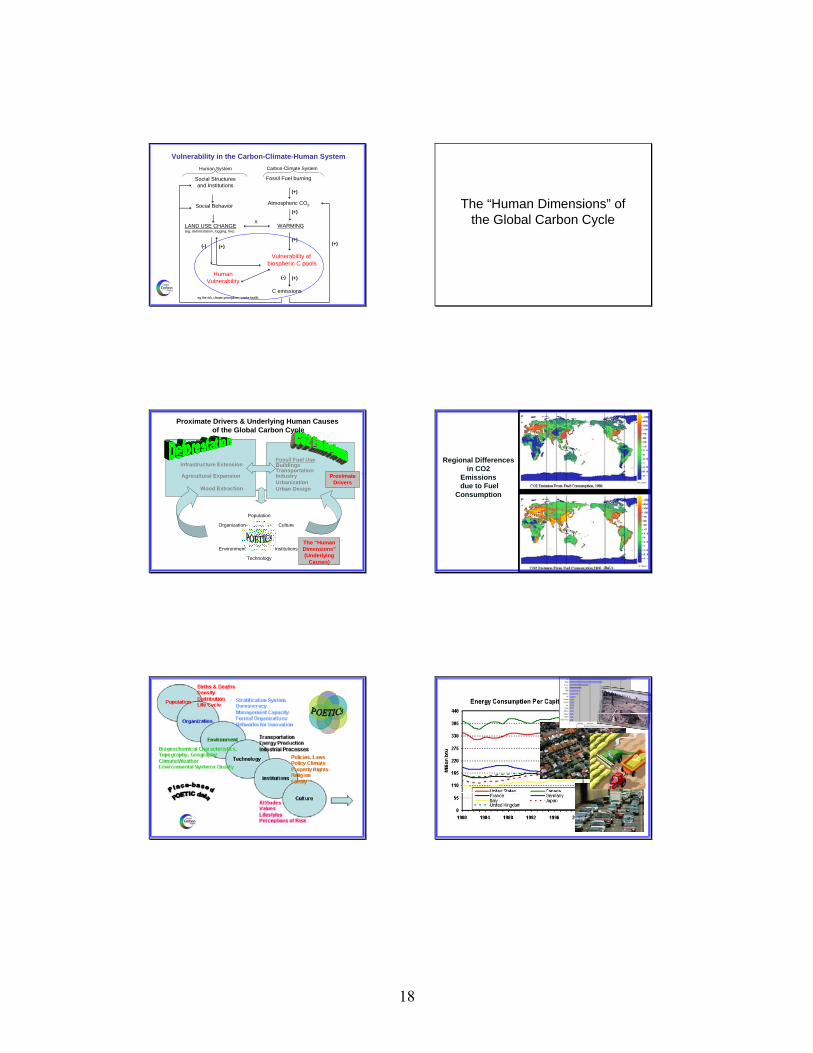
Vulnerability in the Carbon-Climate-Human System
The “Human Dimensions” of the Global Carbon Cycle
Population
Culture
Institutions
Technology
Environment
Organization
The “Human Dimensions”(Underlying
Causes)
Infrastructure Extension
Agricultural Expansion
Wood Extraction
BuildingsTransportationIndustryUrbanizationUrban Design
Fossil Fuel Use
Proximate Drivers
Proximate Drivers & Underlying Human Causes of the Global Carbon Cycle
Regional Differencesin CO2
Emissionsdue to Fuel
Consumption
19
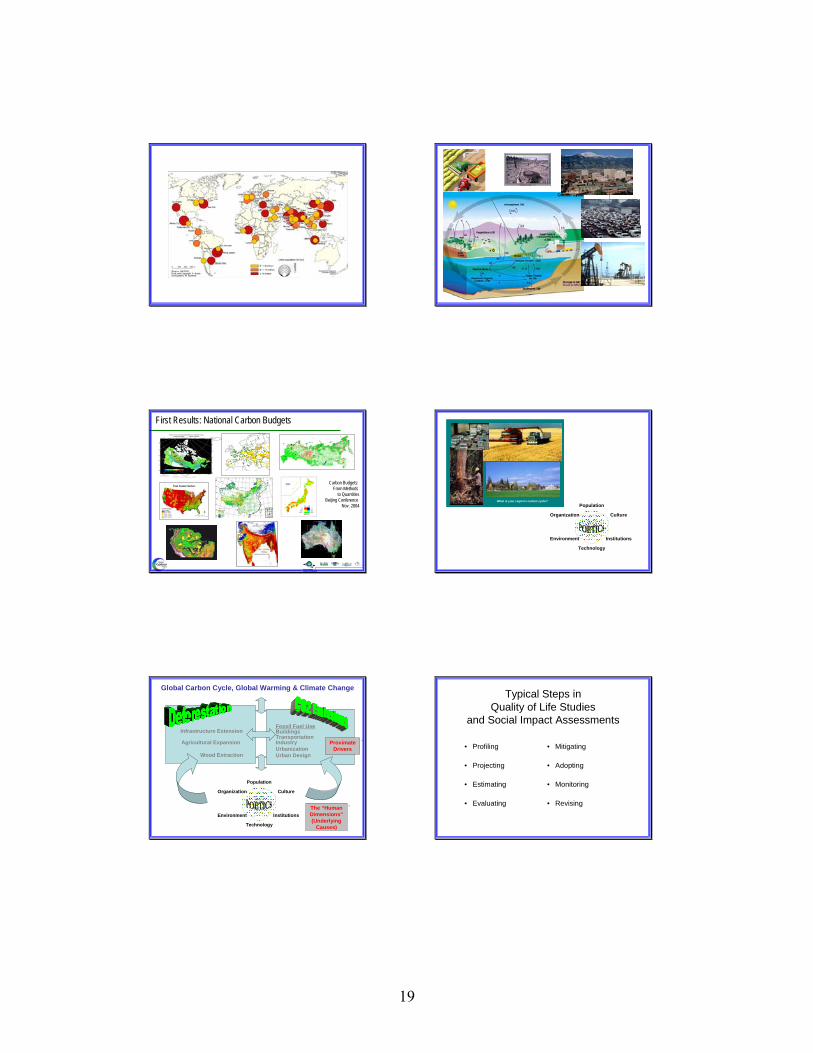
First Results: National Carbon Budgets
Carbon Budgets: From Methods
to QuantitiesBeijing Conference
Nov. 2004
What is your region’s carbon cycle?Population
Culture
Institutions
Technology
Environment
Organization
Population
Culture
Institutions
Technology
Environment
Organization
The “Human Dimensions”(Underlying
Causes)
Infrastructure Extension
Agricultural Expansion
Wood Extraction
BuildingsTransportationIndustryUrbanizationUrban Design
Fossil Fuel Use
Proximate Drivers
Global Carbon Cycle, Global Warming & Climate Change
Typical Steps in Quality of Life Studies
and Social Impact Assessments
• Profiling
• Projecting
• Estimating
• Evaluating
• Mitigating
• Adopting
• Monitoring
• Revising

20
RegionsCarbon RC6CultureCitiesClimateChange Consequences
GCP International Workshop
Social Networks and Regional Carbon
Management
National Institute for Environmental StudiesTsukuba, JapanAugust 5-7,2005
POETIC Indicators for Trends & Forecasts
RC6
Networks of PowerAnd Oppty for Change
+ +
RegionsMega-citiesCountiesCitiesTownsRural Areas
QCAQualitativeComparativeCaseAnalysis
Population
Culture
Institutions
Technology
Environment
Organization
Regions
Cities
Culture
Climate
Carbon
Change
Consequences
Literature
Places
Models
Research Resources
Participatory Action Research
Population
Organization
Environment
Technology
Institutions
Culture
Carbon Footprints and Social ChangeAt Multiple Scales in Space and Time
RC6 Framework Human Dimensions
DataDevelopment Pathways
IndicatorsStudiesTypes
CarbonClimateHuman
Acronyms, Bibliography, Contacts,Carbon Programs, Definition, Organizations,
Publications, Software, Websites
Networks
SpatialComparative
Biogeophysical
Historical TrendsCurrent Conditions
Policy Options
ImpactsScenarios
Databases
Socio-cultural
March 4, 2005
RessCML Training andResearch for RC6
Front Range Colorado
Chiang Mai Beijing
Yamagata
Hokkaido
RC6 in Asia
NIES & University of Hokkaido
Tohoku Universityof Art & Design
National Institute of Geographical Sciencesand Natural Resources, China Academy of Sciences
UniversityOf Chiang Mai
Colorado StateUniversity, NCARCU-Denver,Global LandProject
The Basic Social Impact Assessment Model: Pre-Test/Post-Test with Generalized Control Group
T1c T2c T3c T4cPast Present Future Far Future
Control Study (c)
Xa
T2b T3bImpact Study (b)
Xa
T 1a T2aComparativeStudy (a)
(X = Policy)Burdge 1998
RessCML Training andResearch for RC6
Southeast and Caribbean
Southwest and Mexico
Pacific Northwest
Midwest Lakes
The PlainsUS & Canada
Northeast
RC6 in the Americas
Oklahoma StateUniversity
University ofCentral Florida
University of Arizona,Arizona StateUniversity & AutonomousUniversity of Mexico City
Penn State University
Michigan StateUniversity
Washington StateUniversity

21
RessCML for RC6
Regional “Earth System Science” Carbon Management Leadership Program
forRegions, Carbon, Culture, Cities, Climate, Change and Consequences
Houston, We Have a Problem…
Capturing Network Dynamics Across Space and Time
JEFFREY BROADBENT
Biographical Statement Jeffrey Broadbent is Professor in the Department of Sociology and Institute of Global Studies, University of Minnesota, USA. His research primarily concerns the application of network methods to the study of comparative environmental politics and movements from a cultural and structural approach, with a regional focus on Japan. His book Environmental Politics in Japan: Networks of Power and Protest (Cambridge 1998) won the “Masayoshi Ohira Memorial Prize” in Japan and the “Outstanding Publication Award” from the Section on Environment and Technology, American Sociological Association (2000). Recent publications include “Movement in Context: Thick Networks and Japanese Environmental Protest,” in Diani & McAdam, Social Movements and Networks (Oxford, 2003) and "Japan’s Environmental Regime: the Political Dynamics of Change," in Uday Desai (editor), Environmental Politics and Policies in the Industrialized Countries (MIT Press, 2002).
Pre-Workshop Thought Piece
Pathways to Participation: Global Networks and NGO “Voice” in Japanese Climate Change Policy-Making Greater direct participation by the public in the making of government policies related to climate-change is thought to be essential to policy success (Agenda 21). Under what conditions do governments allow greater direct public participation on advisory councils and other ways of helping to write legislation? Since the start of the 1990s, Japan has seen an upsurge of civil society, such as environmental non-governmental organizations (NGOs). The government has allowed some of these NGOs greater participation in its traditional “corporatist” method of writing policy, through the participation of “stake-holders” on

22
advisory councils. What types of NGOs get included and for what reasons? This research tests four hypotheses that could bring about greater NGO participation: civil society growth, the boomerang theory, international INGO pressure, and the diffusion of new global norms supporting participation (from the UN, Agenda 21, etc.). The data comes from the Global Environmental Policy Network survey of 1997. This survey collected data on 128 organizations in Japan concerned with climate change issues, including 14 climate-change related NGOs, as well as on 33 international organizations. The data include the “policy networks” of these organizations on the exchange of vital information and of public political support, as well as other types of data. The network and other data provide information on the resources and other characteristics of each NGO. These organizational differences in combinations of resources, compared using Qualitative Comparative Analysis, indicate why some NGOs participated in advisory councils and writing legislation, while others did not. The results offer the most support for the civil society growth theory, a result explainable by various Japanese institutions and other features. Further research is required to assess the effectiveness of NGO participation on the eventual actual content and implementation of policy – the point of real impact. The degree to which the results are tied into the Japanese institutional formation makes generalization to other countries risky. This paper combines network analysis with testing theoretically-derived hypotheses, a good approach for further network research on carbon use societal processes.
Presentation Summary
THE “STRING ACCORDION”: NETWORK DYNAMICS THROUGH SOCIAL SPACE AND TIME
Jeffrey Broadbent (Reporter:Eric Schienke)
Main Points
• Network measurement has typically worked with a slice in time approach.
• Networks are not static and their members change over time. Thus, they need to be studied temporally. Patterns are likely to emerge by studying the network shift over time. Final pattern is a squeezed view down the tunnel of time.
Jeff Broadbent and Erich Schienke

23
• "String Accordion" unfolding theory of network interactions over time. Encompassing of time, rather than an additive slice approach.
• Action Dyads -> "relation units" between people, organizations, nations, etc.
• Edges of the network multiply with more nodes.
• "String theory" approach, actors are the products of relationships. This is the thread with which the social fabric is woven. A->B vs. A->A'->B->B'->B''
• Transfer/exchange of hard/soft sanctions. One can look at any kind of exchanges that change behaviors.
• By looking at the network over time you can begin to see the appearance and disappearance of institutions, people, and actors in the processes development.
• Relationship vectors, tracing power, such as domination and persuasion. These can indicate how the "fabric" is woven.
• Field study on environmental conflict in Oita Japan, 1960—1980. Over 500 formal and informal interviews.
• Coding is the primary work of this kind of study. Emergent codes based on a tacit knowledge of the investigation.
• With this you can find points on the cube of power. Axes - Cohesiveness/Rationality - Tangibility - Malleability... two dimensions developing a picture of conjoint action.
• Dyads can be linked to other dyads to form other types of action dyads.
• We can develop a visualization of institutional impacts over time.
• Difficult to be predictive with this form, however, since uncertainty is high in dyad formation.
• Networks are difficult to study as dynamic entities, but interesting things emerge when you look at them over time.
• Taking network dyadic conjoinments and coding them, and looking at them over time can produce visualization of institutional impacts.
Testable Hypotheses How does conflict-persuasion change impact of an institution or actors over time?
Do emergent patterns allow for future predictions, i.e. what are the valuable patterns (lessons learned, unexpected generations) and where can interventions be generative?

24
Implications for URCM Networks RC6 can be the major coding categories for qualifying and weighing (quantitatively) the relationship vectors.
Institutional impacts within RC6 can be temporally understood.
Emergent patterns in conflict, while not prognostic because future relations are highly difficult to predict, can provide warning signs for communities or institutions at risk of being taken out of the picture.
The “String Accordion:”Network Dynamics
through Social Space
and Time
String• In society, an “edge” is a relationship.• Relationships of mutual recognition,*
• also often involve influence or domination• And transfer/exchange of hard/soft sanctions • between “relating units” --• people, organizations, nations, etc. • These “strings” weave “social fabric” (network).
*Bourdieu
Networks in Space & Time
• Mostly network measurement is taken • At one “slice in time.”• Now trying to capture change over time.• Difficult -- network members change• Adding several “slices” is typical* • My approach is encompassing of time.• Metaphorical name: “string accordion”
•Stockman
Static• We can think of this network• As a static arrangement• And analyze the pattern with • Centrality, cliques, density. . . .• But the pattern is more likely dynamic • Its members energize it, • Reproduce it or change it.
Dynamic

25
• Network itself fascinating object of study• Abstract terms describe basic network• Edges” (ties) among “Nodes” (members)
• Two Nodes (N=2) + one Edge (E=1) =dyad• As N adds, E multiplies: N(N-1)/2=E• Edges can indicate flow and reciprocity• Build into large networks, complex patterns
Network in Abstract
Squeezing
A B
C
D
• Not only are the members dynamic,• They can come and go, • Make a tie, then break it.
• So, the network members & patterns• Expand and contract over time.• Any “final” pattern is a “squeeze,”• A view down the tunnel of time.
Accordion
A B
Time
A
• If we look at the network over time• Noting the actors and interactions• As they appear or disappear
• We portray the temporal process• That built up into the network pattern. • We turn the pattern sideways,• And “expand the accordion.”
Coding of Action Dyads
• Code each A-B dyad in the sequence(s)• Can draw data from qualitative sources• Code all important factors of• actors and “strings” tying them together-• Name of organization, sector/type of org.• Date, issue, motivations, strategies• Types of incentives, sanctions used• Net control and impact
Influence Vectors• To study “political” process in large groups• Relationships become “vectors”• Vector transmits “power” A B • Vector also affects outcome V O• Vector composition: binary contrast• Incentives: dominative & persuasive incentives• Sanctions: soft (symbolic, normative) &• hard (cost imposing) sanctions• What kind of social fabric do vectors weave?
The Cube of Power: Elements of Strings and Actors
Plastic
Malleability
Social
Structure
Agency
Cultural
MaterialTangibility
Cohesiveness
/Relation
ality
Indeter- minate
Relationship sets behavior
Behavior sets relationship

26
Key Influence Relationship:Conjoint Action Dyad
Thread (Relationship) of Conjoint Action
Actor A
Actor B
String A (Vector)
String B (Vector)
Modes of Influence
Control
Impact
The Relational Elements of Conjoint Action (CA): A Periodic Table
Agency: actors voluntaristically construct the vectors that define action
Structure: Existing role and relational patterns define the forms of action
Malleability of bonds patterning conjoint action (CA)
Material: coercive, economic or physical sanctions
Cultural: cognitive, emotional and moral codes as sanctions
Social: roles, norms, relationships, practices as sanctions
Tangibility of vectors tying actors into conjoint action (CA).
A. Material structures: Existing distribution of extrinsic sanctions & resources defines (invites or inhibits) CA
D. Social structures: Existing institutional roles channel collective action (CA)
G. Cultural Structures Dominant moral codes ideologies & collective identities channel CA
H. Cultural “Plastic” Vectors emerge from clash between cultural, or with soc. & material factors.
I. Cultural Agency: Vectors defined by actors reflexively making & adopting new cultural codes
E. Social “Plastic” Vectors emerge from clash between social, or with mat. & cultural factors
“Plastic:” Clash of structures & agenciesdefines action
B. Material “Plastic” Vectors emerge from clash between material, or with soc. & cultural factors
F. Social Agency: Vectors defined by actors breaking old, creating new norms, roles, & practices
C.Material Agency Vectors are defined by actors inventing new material tactics
Example
• I coded all the action dyads • In my field study on environmental conflict• In Oita Japan, 1960—1980.• This is in an SPSS data base.
KIR spss dataset.sav
• Network content (type of incentive)– “Hard” – dominates B despite resistance– Example:Votes make politician lose
election– “Soft” – persuade B to change preferences– Example: Agenda 21 convinces official to
allow more NGO participation• Network cohesion• Network pattern • Also, interaction of multiple networks• Network context
Many Aspects of Networks
Figure 5: Changing Impact of Institutions over Time
0
10
20
30
40
50
60
70
80
90
100
1 2 3 4 5 6 7 8 9
Time Period
Perc
ent
Other
Int'l. Bus.
Nat. Gov.
Nat LDP
Nat'l. Bus.
Nat'l. Adv.C.
Pref. Gov.
Pref LDP
Pref. Bus.
Town CM

27
Changing Impact of Elements over time
0
10
20
30
40
50
60
70
80
90
100
1 2 3 4 5 6 7 8 9
Year Period
Perc
ent
Reference
LegitimacyPersuasion
ExpertLegal-CoerReward
Accordion
Network Contexts• Resources
– Distribution of wealth, status, etc.• Rules & institutions
– Voting system & political parties– Press and other freedoms
• Culture and beliefs– Credibility of leaders– Legitimacy of science
• Provide other sources of influence/power• Also affect behavior and outcomes
““Influence VectorInfluence Vector”” -- members members seemseem intentionalintentional
A B
Ties voluntary choice, networks Ties voluntary choice, networks ““crumblycrumbly””
ButBut degree of choice depends on degree of choice depends on contextcontextTies might exist due to Ties might exist due to rules, coercion*rules, coercion*
*New institutional theory: North, Moe, Nee
Members Members embedded,embedded, network network ““stickysticky”” (cohesive)(cohesive)
BUT, ties might be BUT, ties might be ““taken for grantedtaken for granted””** **
; **NeoNeo--Institutional Theory: Meyer, Scott; Institutional Theory: Meyer, Scott;
Or, ties might represent Or, ties might represent identityidentity of member***of member***
***Relationalism: ***Relationalism: EmirbayerEmirbayer
Networks in Social Science
• Start by Moreno, social group interaction• Since 1970s, mathematical analysis of networks• Focus on networks as static, whole “entities”• Produce crucial methods for analyzing networks.• In small group, social network is main dynamic.• But for larger groups: community, nation, globe• Social networks interact with other networks & factors.• Process to outcome much more complex, “political”• Networks help study dynamic process over time
““Market context:Market context:”” spontaneous choices by all 6spontaneous choices by all 6
DyadDyadAs members grow, network pattern complicates As members grow, network pattern complicates
““Rule context: company hierarchyRule context: company hierarchyTakenTaken--forfor--granted context: traditional familygranted context: traditional family
Complexity Rules!Complexity Rules!
TriadTriad 6 members6 members
What mix of intentions, incentives, strategies?What mix of intentions, incentives, strategies?
What relationships might they have?
Mixed: family company, workers, spouse, friendMixed: family company, workers, spouse, friend
IntentionIntentionIncentiveIncentiveHardHardSoftSoft
What context conditioned this pattern? What context conditioned this pattern?
28
Types of Relationships
A B
““Classical:Classical:”” individual choicesindividual choices-->group networks>group networks
B can ignore A (one way vector)B can ignore A (one way vector)Or B can reciprocate (exchange)Or B can reciprocate (exchange)
HardHard incentives: coercive incentives: coercive (votes),(votes), financefinance($($¥¥))
A seeks relationship with B, say A seeks relationship with B, say friendshipfriendship
If B reciprocates in kind If B reciprocates in kind --> > friendlyfriendly relationshiprelationshipBut if B demands But if B demands money money --> mixed exchange> mixed exchangeSoftSoft incentives: symbols incentives: symbols (info),(info), approval approval (trust)(trust)
A
Networks as social molecules
B
CentralityCentralityDensityDensity
ReachabilityReachabilityPath distancePath distance
Structural holesStructural holes
Network patterns have holistic propertiesNetwork patterns have holistic properties
These properties affect member options, action These properties affect member options, action
““BridgeBridge--keeperkeeper””ClusterCluster
Stakeholder Identification, Participatory Research and Citizen Involvement ERICH SCHIENKE
Biographical Statement I am working to identify where technological and scientific production can be improved by better understanding their social and political consequences. In my graduate research I study, across multiple sites, the use of environmental information systems in the social and political decision-making process on environmental issues, particularly as they apply to human health. Since the early 1990’s, I have been conducting research across various sites and domains of research concerning one overriding question: “How, what kind, and in what ways does information shape and direct action in society – particularly in the environmental domain?” I have come to realize that this question is an instrumental one in how we define differences and conduct operations in information rich/dense societies. As we develop more methods and instruments for gathering and analyzing data, we are able to refine predictive models on historical, current, and future trends across all sectors of societies and the physical world in which these trends operate. However, while we are refining our technoscientific methods at what appears to be a rapid pace (such as Moore’s Law), understanding exactly what to do with the mounds of predictive information and how to do it is less directly a function of computing power and data gathering, than it is a function of social networks and culturally derived modes of meaning-making. That is, data and predictive models are only a part of the process in understanding how to proceed in issues concerning governance of local, regional and global collectives. The other part of a successful governance equation would necessarily include data that is difficult to quantify, and thus model, such as data about people’s motivations, symbolic systems, cultural preferences, habits, rituals, risks, belief structures, modes of reasoning, etc. Thus, I strongly contend that any attempt to answer the question ”how does information direct humans’ actions” would necessitate an evaluation of both the development of technoscientific systems and the cultural, social, and civil contexts in which these systems operate and inform.

29
Reflecting my long-term core interest in the interface between culture and technology, my undergraduate thesis at Hampshire College was on the early cultural and technical history of the loudspeaker. Here, I investigated how loudspeakers changed the physical as well as the social structures of public spaces beginning with the emergence of late Nineteenth Century scientific and technological innovations (in amplified audio) that pre-cursed the field of electroacoustics. My Ph.D. thesis is the production of an ethnographic record on the use of environmental information systems in the policy-making process in Beijing, China. I will document, through various interviews and participant observations, the global, local, collaborative, and material-cultural influences on generating (with science and technology) and using, through policies and reforms, environmental information. Currently, there is little historical or contemporary data being collected on the emergence of this newer kind of scientific research, particularly in the context of transnational partnerships and collaborations.
Pre-Workshop Thought Piece
Based on Greening the Dragon:
Information Systems in the Eco-Environmental Governance of China China is currently undergoing rapid change across all social, political-economic, cultural, technoscientific, and eco-environmental domains of development. These rapid structural changes have put tremendous strain on all eco-environmental resources, which have repeatedly been put under serious threat since the Maoist reforms of the Great Leap Forward and the following Cultural Revolution. Over the past two decades, funding research into plausible solutions to eco-environmental problems in China has become a scientific and political imperative of global organizations, transnational enterprises, national bureaus, and local administrations. Though Deng Xiaoping's reforms ('78-'92) began to acknowledge the seriousness of the environmental situation, projections for China's future eco-environment are less than optimistic for the state of forestry resources, carbon output, fresh water, clean air, and their collective impacts on human health. Now, more than ever before, the Central Government (NPC & CPPCC) and scientists (in the Chinese Academy of Science) are addressing the seriousness of this situation in a sober and self-critical manner that promises a future different from its past, though the results of these promises remain to be seen, especially in how the public is to become more involved in environmental protection.
In previous ethnographic research I have conducted in the U.S. on the design and implementation of information systems (in media design and in the design and production of geographic information systems in the case of breast cancer research) successful "formulas" for directing/motivating social change have come from both the enhancement of public understanding of science and public participation at various levels of the design process itself. However, public participation methods (often requiring some degree of enhancing public understanding) in such a directly influential (democratic) manner as has been successfully implemented in Europe, the US, and Latin America, currently have little or no purchase on national and local decision making processes in China. Political and scientific elites' actions are being brought into line less by internal pressures to reform, than by external

30
pressures to be "good players" in the global capital markets, including cultural as well as material capital. Enhancing the visibility to a broader audience of the local actions and outcomes of the processes these elites manage will increase degrees of accountability, not only to local stakeholders, but to the central government as well as direct foreign investors. I contend that enhancing public understanding of eco-environmental science by improving how scientific research is produced, critiqued, and distributed by Chinese scientists, so as to be accessible across multiple forms of literacy, will result in changes that are more on-target with the promises of the central government. Studying how and where these enhancements can be made requires close empirical (qualitative) research as to how and under what conditions these epistemic communities are formed and sustained, and thus, where they can be changed.
At this point, I have minimal experience with the application of social network analyses, though I am particularly interested in how network analyses can be used in conjunction with spatial analyses of socio-cultural phenomena (something I do have experience with) to improve environmental regime performance. For example, how can Tobler's first law of geography, that ‘‘everything is related to everything else, but, near things are more related than distant things", be applied or used in conjunction with the study of social networks, particularly when these networks often (geographically) span the globe? While demands on environmental regime improvement often come from global governing regimes, necessary action plans responding to these demands are often entirely localized -- moving from the general to the specific. Using spatial analyses in conjunction with social network analyses can produce more targeted planning at various scales of governance (local, regional, global). For example, understanding where to target efforts on changing fuel wood collection habits for the sake of biodiversity preservation is more temporally critical in some places (such as nature reserves) than it might be in others. These areas, then, would be more crucial for directing social network analyses, such as on family habits, food production, local economies, conflicts, kinships, linguistic hurdles, etc. Currently, one of the major difficulties in conjoining spatial analyses and network analyses is figuring out how the disparate data and models can and should 'talk' to each other in a productive way. One area I see as most productive for such a spatial-network conjunction is in targeting public participation efforts, and through the analyses of census data to determine literacy rates, public understanding and communication efforts.
Presentation Summary
FROM PERFECT KNOWLEDGE TO WORKING KNOWLEDGE(S): RETHINKING SCIENTIFIC OUTPUT FOR EFFECTIVE PUBLIC PARTICIPATION IN THE
CONTEXT OF CARBON BUDGETS Erich William Schienke
(Reporter: Kazumi Kondoh) Main Points
• Postmodernist critique of science (truth vs. reality). • Deeper public participation requires scientific literacy.

31
• The public has demonstrated a propensity for learning scientific subjects on a need-to-know basis.
• We need to develop better bridging metaphors. • Bring public participation in at the beginning of
the processes.
• Efforts to inform need to be localized, which requires better information tools.
• Science is best learned hands-on.
• Develop robust interpretive frameworks.
Jeffrey Broadbent and Erich Schienke Testable Hypotheses Public participation and the adoption of desirable policy are related. Implications for URCM Networks Although a majority of dialogue for the global warming issue takes a top-down approach, bottom up approaches are also necessary. Thus, understanding citizens’ networks is a relevant topic. We may want to incorporate the social movement literature to make a theoretical argument on the relationship between public participation and network effects. Relevant Literature Agarwal, Bina. 2001. “Participatory exclusions, community forestry and gender: an analysis for South Asia and a conceptual framework. World Development. 29(10):1623-1648.

32
From Perfect Knowledge to Working Knowledge(s):
Rethinking Scientific Output for Effective Public
Participation in the Context of Carbon Budgets
For the GCP 2005 conference on Networks and Regional Carbon Management
Erich William Schienke Department of Science and Technology Studies
Rensselaer Polytechnic Institute Troy, NY
“The dream of the Enlightenment subject...” • Since the Enlightenment, the production of a “perfect knowledge” has been the overt goal of scientific output. The true.
• Over the past few decades, there has been an historical shift in how objectivity is produced... moving towards an “informed objectivity”, i.e. a robust and socially constructed production of knowledge systems. (Fortun, Galison) The real.
• Scientific objectivity, in policy driven contexts, is “opening out”, requiring scientific knowledge to work in conjunction with other forms of knowledes, i.e. local, economic, cultural. Science on trial vs. science in policy contexts • Science on trial (or science at the bar, Jasanoff) often becomes the trial between experts. Scientific evidence is weighed and a shadow of doubt can be cast... often leading to inaction or non-justice.
• This model does not work well for policy (decision-making) contexts, where well informed actions are often either economically beneficial or systemically required, before the thresholds of a perfect certainty are crossed. From stabilization to strategic thresholds • Scientific knowledge, achieving points of testable certainty, is considered to have reached a point of epistemic stabilization.
Science of open systems, such as the climate, ecosystem, or environmental effects on human health, will rarely, if ever, achieve such traceable points of stabilization. This is because what is studied never remains static or precisely reproducible. (Rheinberger, Latour)
• Scientific output for decision-making processes (including public participation) should be most concerned with realizing strategic thresholds, where the ethos of action overrides the ethos for perfection. (Schienke) Public understanding for public participation • Deeper public participation requires some enhanced degree of scientific literacy on the part of the participating public.
• While the public may not be generally literate about current scientific facts and developments, the public has demonstrated a propensity for learning scientific subjects on a need-to-know basis (ozone depletion, amneocentesis, breast cancer, asthma, pollution, etc.)
• These are transitions on the part of the subject(s) from having something generally at stake to something specifically at stake in the process, and usually is motivated by personal experience. A complexification of standpoints.
• Carbon will have a difficult time making this transition...

33
Example 5 - Carbon management action plans of local urban centers (Belfast) Carbon Management Action Plan of Belfast: ° 2000: The approximate CO2 produced by all council sites in 2000 was 20,000 tonnes/year ° 2001/02: The savings in CO2 [reduction of 1000 tonnes from previous year] were a direct result of changing the electricity to Energia (renewable) for the Waterfront Hall and the Zoo. ° 2002/03: The savings in CO2 [reduction of 1200 tonnes from previous year] were a result of changing the electricity in the City Hall to Energia as well as converting some of the major sites to natural gas, i.e. Avoniel LC, Andersonstown LC, Whiterock LC, Belfast Castle and Belfast Zoo. ° 2003/04: The savings in CO2 [reduction of 3000 tonnes from previous year] will be due to changing the electricity in approximately 100 council owned sites to Airtricity (renewable) and installing CHP into four BCC lesure centres, i.e. Avoniel LC, Andersonstown LC, Whiterock LC, and Shankill LC. [FROM: Carbon Management Action Plan, Belfast City Council, Local Authority Carbon Management Programme. April, 2004. <http://www.thecarbontrust.co.uk/carbontrust/about/publications/Belfast-LAP-111104%20FINAL11.pdf>] So... how to turn carbon into diamonds?

34
Some lessons learned from public • People learn most about scientific and environmental matters through interpersonal discussions. (Ungar, Kempton) Interaction ritual chains are essential to knowledge acquisition and reproduction. (R. Collins)
• The public tries to understand through synchretism—ozone is the closest previous model people have to climate change.
• Ozone was capable of capturing public imagination (sunscreen, shields, shells, protection)
• Which is it, global warming, climate change? Is it a blanket? Why is warmer weather a bad thing? How does global warming lead to worse winters? (Stamm) understanding of climate change versus ozone depletion • Not all parties see a problem with global warming. (New Arctic shipping lanes! Carbon is life.) But most can relate to sunburns and skin cancer. (Fish don’t wear sunglasses!)
• No overt connection observed in public (2000) between energy conservation and global warming. Much as there was no overt link between cooling and refrigeration with ozone... but with styrofoam and aerosol cans, yes. (Ungar, Kempton)
• How can climate change, as a perceived future oriented problem, be brought into the present with carbon budgets? How can carbon budgets be better understood and taken up for public participation? • Efforts to inform need to be localized! Conduct “literacy gap analyses” in certain local contexts. Some regions may need to be more focused on communicating towards supporting the increase of carbon sinks, such as rural reforestation efforts, while other regions require greater emphasis on release/emissions reduction methods, such as urban centers.
• Home energy consumers have learned to read their energy use (as kilowatt hours) into their energy budgets and have learned to take steps to reduce energy use, such as insulation, draft reduction, fuel choice, etc. Can carbon budgets begin to be read as another part of the home energy budget? Let’s find out how well that works.
Development of better bridging metaphors • Climate change - the slow and permanent tsunami? (I was actually asked if the extreme nature of the recent tsunami was an effect of climate change... is it earthquake weather?)
• Should the necessity of carbon markets be best explained through global warming? Or global ecological protection? Or energy budgets? Or daily weather reports? Or reforestation efforts? Or urban growth? Or sustainable development?
• Making human health effects of global warming & climate change very apparent. Drought, disease vectors, flooding...
• Carbon as useful and valuable resource, not as pollution. (Wang) Design and development of better Toolsets • Bring public participation in at the beginning of the processes. In many circumstances, participatory design has proven quite successful in improving the design process. • Better information tools, such as the previous examples, such as a regional carbon layer for Scorecard.org.
• Carbon counters for different forms of energy use.
• Useful tax credit incentives.
• A MoleculariumTM for youth education about climate change and carbon cycles. Science is best learned hands-on.
• Develop robust interpretive frameworks. ...but all of this will require a lot of work for scientists and the public(s)! • The goal: to develop better working knowledge(s), and thus, transform the topologies of perception. (M. Fischer)
• Merging frames of analysis to create better hybrids (ethical assemblages). Spatial Proximity with Social Connections. Qualitative with Quantitative. Policy with Science. Local with Regional with Global. Coherency with Uncertainty. Pro-action with Reasonable Precaution.
• Concerted effort on the part of the carbon and climate science community to communicate their knowledge in ways that decision makers and the public process can uptake. This will require better multi-way communications and multiple forms of scientific output to be usable across multiple forms of literacy. Thank you for your participation

35
YASUKO KAMEYAMA
Biographical Statement
Yasuko Kameyama’s main field of research has been on international negotiation on climate change, from the aspect of international relations. She is currently head of a research project on “Future International Climate Regime Beyond 2012”. She has participated in such negotiations since COP1, 1995 as a member of the Japanese governmental delegation. During 1999-2001 she was engaged in the drafting of UNEP’s Global Environmental Outlook 3, as a researcher of NIES, the Asia Pacific regional coordinating office. In 1999-2000, she was a visiting researcher at Department of Government and Politics, University of Maryland, U.S. She is a member of several committees set up under central and local administrations, including: “Sub-Committee for International Climate Change Strategy, Global Environmental Committee, Central Environmental Council” of the Ministry of Environment, and “Council on Urban Planning” of Kamakura City. She is a member of seven academic societies including: the International Studies Association (ISA), the U.S.; and Society for Environmental Economic and Policy Studies, Japan. Honors received from these societies include: award for the Best Treaties, the Academic Association of Social Information, in 1999; Award for the Best Treaties from the Society of Environmental Science, in 1998; Young Scholar Merit from the Japan Association for Planning Administration in 1994.
Yasuko Kameyama earned her doctoral degree at Tokyo Institute of Technology in 1997.
Pre-Workshop Thought Piece
Personal View on "Methodology to Social Change in Real Places" Since I am not an expert on social network theory and my research is more oriented towards International Relations (IR) -related theories, the following description will mainly be on my personal view on “methodology to social change in real places”. Many of the works done in the past realm of IR and other social science mainly focused on objective explanation of past events, and theories and methodologies were built on meeting such purpose. However, this type of study was not aimed at assessing the past, forecasting the future, or raising political suggestions. This meant that studies were not intended to be “useful” for policy makers, and also were not expected to be flexible enough to fit social changes. On the other hand, there has been increasing needs from policy makers for policy-relevant studies, which require knowledge of social science experts. Many of recent studies in the last

36
decade have thus aimed at meeting such needs, and have come up with new ideas for methodology. Social network theory is one of such theories. I myself have been engaged in studies related to climate change negotiation at international level. However, in order to fully respond to the needs of policy makers as to how we should negotiate to reach an agreement on effective climate mitigation policies, methodologies in addition to pure IR theory was necessary. One way is to introduce “2-level game” theory or methodology similar to it. It is a way to explain behavior of nations by looking both from IR and domestic politics. Other methodologies have integrated methodologies in other fields such as statistics. For instance, I have made a lot of interviews in the past. Information gathered by interviews is useful to confirm explanation for 2-level game, but it could also be used to explain social reality in a quantitative manner. I feel such new methodologies are in many cases not very well received among traditional IR academic community (especially in Japan), but more recognized by researchers in academic community outside of social science, and policy makers.
Presentation Summary
FUTURE CLIMATE REGIME: ASSESSMENT BY SCENARIO PLANNING APPROACH
Yasuko Kameyama (Reporter: Kazumi Kondoh)
Main Points
• Defining the possible scenarios after the Kyoto protocol or “Beyond-2010”.
• By using a scenario planning approach the following three scenarios are identified: carbon market initiative, government-led policies & measures, and technology optimist.
• Carbon market initiative: climate institutions will be private-sector driven. Firms that are likely to benefit from ET or new technology
Yasuko Kameyama, Kazumi Kondoh will push governments to agree Michael Obersteiner on multilateral climate change.
• Government-led policies & measures: climate change negotiations will be government-driven as private sector finds little benefit from accepting emissions limitation and reduction.
• Technology optimist: climate change is expected to be overcome by technology.

37
• Scenario planning approach is a useful tool to define several scenarios that could be used to categorize options and to show their strengths and weaknesses.
Testable Hypotheses If business interests occupy the central position in networks in negotiations beyond 2012, either the carbon market initiative or technology optimist scenario, or a combination of both is more likely to be adopted.
Future Climate Regime: Assessment by Scenario
Planning Approach
GCP Workshop on Social Network Theory April 6, 2005
Yasuko Kameyama, Ph.D.National Institute for Environmental Studies, Japan
2. Regional tendenciesReviewed more than 100 articles related to post 2012, and categorized those articles according to the region in which the lead authors were based. About 40-45% from EUAbout 35-40% from U.S.About 3-5% from other Annex IAbout 15-20% from non-Annex I
The Kyoto Protocol
The Kyoto Protocol sets emission targets for all Annex I countries (developed countries + Economy-in-Transition countries) for years between 2008-2012.No article in the Protocol for what should be done after 2012. Withdrawal of the U.S. from Kyoto has been considered as a serious problem.The Kyoto Protocol has entered into force last February and intergovernmental exchange of view on beyond 2012 is to start this May, 2005.
2. Regional tendenciesEU: Proposals were on;
- Emission allocation rules,- Ultimate objective of UNFCCC (long-term stabilization target) and short-term commitments,
- Criteria for “equity”,U.S: Proposals were on;
- Emission trading rules, such as safety-valve- Means to involve developing countries’ participation- Technology agreements- Voluntary action at regional level, or bilaterally

38
2. “Beyond-2012”…
Informal dialogue on “beyond 2012” had already been become popular among researchers and various stakeholders since 2001.Many proposals exist, but there seems to be tendencies or areas of common ground shared among groups of proposals in each regionWhat can be said from existing literature?
---- Implicit messages
2. Regional tendenciesOther Annex I countries: Proposals were on;- Emission trading rules,- Separation of treaties according to themes- Involvement of sub-national stakeholders in negotiationsNon-Annex I countries: Proposals were on;- Sustainable development and climate policy
such as SD-CDM- Emission allocation according to responsibility- Funding from Annex I to non-Annex I
2. Regional tendencies– explanation from IR
EU : Assumes “international society” where an order, or a norm, exists. Countries basically keep their promises. Enough discussion should be made to reach an agreement before using force.U.S.: Considers international arena as an Hobbesianworld (a war as is of every man against every man). Countries basically aim for their self interest, and can only be expected to take action voluntarily. Other Annex I: Caught between the two worlds. Supports U.S. view for self-protection.Other non-Annex I: Caught between the two worlds. Supports the UN system to maintain negotiating power.
What is Scenario Planning Approach?What is Scenario Planning Approach?
•• An effective strategic planning tool for medium to An effective strategic planning tool for medium to longlong--term planning under uncertain conditionsterm planning under uncertain conditions
•• Thinking in scenarios helps us understand the logic Thinking in scenarios helps us understand the logic of developments, clarify driving forces, key factors, of developments, clarify driving forces, key factors, key players and our own potential to exert an key players and our own potential to exert an influence. (Lindgren and influence. (Lindgren and BandholdBandhold, 2003) , 2003)
•• Originally, the scenario planning approach was Originally, the scenario planning approach was used by Shell (oil company) to determine its longused by Shell (oil company) to determine its long--term strategy. In recent years, the approach have term strategy. In recent years, the approach have been used in the area of global environmental been used in the area of global environmental management.management.
2. Regional tendencies– two scenarios
“Leadership of International society” caseLeadership of EU continues. Japan, Canada and Russia follow EU. They support non-Annex I countries to engage in sustainable development with climate-related actions, such as SD-CDM. A new round of negotiation secures success of global mechanisms which U.S. and Australia gradually participate. “Voluntary action under national interest” caseEU gets more interested in regional actions than global. The U.S. comes up with its own climate strategy, which consists of bilateral economy & technology cooperation. The Umbrella group follows the U.S. They set up bilateral agreements with non-Annex I countries for emission limitation strategies.
Scenarios used for SRES, IPCC (2000)Scenarios used for SRES, IPCC (2000)
Economic
Environmental
RegionalGlobal
A2
B1 B2
Population
EconomyTechnology Energy
Agriculture (land-use)
Driving Forces
A1(A1F1)
(A1T)( A1B)

39
NIES/IGES Project: use of Scenario Planning Approach for assessment of future climate regimes
•• The most suitable climate institution may The most suitable climate institution may differ according to a scenario into which differ according to a scenario into which the world is moving.the world is moving.
•• Conclusion of evaluation differs Conclusion of evaluation differs according to the underlying scenario according to the underlying scenario
PopulationDriving Forces
Scenarios
Economy Equity Technology Conflict
Markets First
Policy First
Security First
Sustainability First
GEO3, UNEP (unpublished, 2000)GEO3, UNEP (unpublished, 2000)
Three Scenarios
Scenario CTechnology
Optimist
Scenario BGovernment-led
Policies and Measures
Scenario ACarbon Market
Initiative
Wide use of emissions tradingWide use of
regulations
High expectation for innovative technological solutions
Pessimistic about innovative technological solutions
Scenario B:
•• Climate change is expected to be overcome by Climate change is expected to be overcome by ““technologytechnology”” in the next several decades. in the next several decades.
•• A country or countries that are likely to benefit by A country or countries that are likely to benefit by the the ““technologytechnology”” becomes a strong leader in becomes a strong leader in pushing other countries to agree to a climate pushing other countries to agree to a climate agreement, while other countries have less agreement, while other countries have less willingness to negotiate.willingness to negotiate.
•• CDM fails together with ET, and nonCDM fails together with ET, and non--Annex I Annex I countries demand for technology transfer.countries demand for technology transfer.
•• Countries prefer nonCountries prefer non--legally binding consequence, legally binding consequence, except for technology standards. except for technology standards.
•• Concern on adaptation strategies decreases. Concern on adaptation strategies decreases.
Scenario A: Carbon Market Initiative•• Climate institutions will be privateClimate institutions will be private--sector driven. sector driven. •• Firms that are likely to benefit from ET or new Firms that are likely to benefit from ET or new
technology push the governments to agree on a technology push the governments to agree on a multilateral climate regime.multilateral climate regime.
•• Industrialized countries strongly urge the Industrialized countries strongly urge the developing countries to commit to emission developing countries to commit to emission ““capscaps””. . Loose emission limitation targets may be sought for.Loose emission limitation targets may be sought for.
•• The U.S. may change its position if its private The U.S. may change its position if its private sector is to benefit by a multilateral climate regime.sector is to benefit by a multilateral climate regime.
•• ET scheme prefer enforcement procedure in case of ET scheme prefer enforcement procedure in case of nonnon--compliance. compliance.
•• Concern on adaptation strategies decreases. Concern on adaptation strategies decreases.
Assessment of Options for future climate regime (example)
NIES CNIES BNIES AAdditional ideas
Weakness
Strength
C1C2 C3
B1B2B3
A1A2A3
Existing Proposals
Technology Optimist
Government-led P&M
Carbon Market Initiative

40
Scenario B: Government-led Policies & Measures
•• Climate change negotiation will be governmentClimate change negotiation will be government--driven, as private sector finds little benefit from driven, as private sector finds little benefit from accepting emission limitation & reduction. accepting emission limitation & reduction.
•• Less incentive to set emission Less incentive to set emission ““capscaps”” because of because of having experienced failure of international ET. having experienced failure of international ET.
•• More interest in discussion on coordinated carbon More interest in discussion on coordinated carbon tax, to maintain balance of international tax, to maintain balance of international competitivenesscompetitiveness
•• Countries prefers nonCountries prefers non--legally binding consequence legally binding consequence without ET schemes. without ET schemes.
•• NonNon--Annex I countries demand for a progress in Annex I countries demand for a progress in negotiation on adaptation issue. negotiation on adaptation issue.
SummaryPost-2012 debate will be a difficult negotiation countries need to start within the next 2-3 years. Various argument exist on the future climate regime architecture beyond 2012.
The most suitable architecture will be determined by some key driving forces that are uncertain at this moment. Those driving forces are, for example, development of emissions trading scheme, prospects for technology development, and people’s awareness on climate change .
PENELOPE CANAN
Presentation Summary
THE BATTLE OVER DEFINITIONS OF DEVELOPMENT: OVERWHELMING THE RESISTANCE TO THE GROWTH MACHINE
Penelope Canan (Reporter: Kazumi Kondoh)
Main Points
• Penelope presented some of her prior research on the structure of community values on the island of Moloka’i, Hawaii.
• Based on her findings she recommended the adoption of biomass, hydro-electric energy and smart energy consumption to meet the needs of the community residents.
• However, despite the overwhelming support for this recommendation, the priorities of the Tourism and Development Office were such that they favored the pro-growth coalition, which ultimately won out in shaping the community’s energy choices.
Testable Hypotheses Perhaps the more that a community has non-governmental organizations representing local residents’ interests the more likely they are to draw their favored political outcomes. Also, a community that has connections with central government actors (governmental agencies, political parties etc.) is more likely to draw their favored political outcomes.

41
Implications for URCM Networks It is interesting to see if networks among local residents and/or with extra community actors give collective power to local residents in pursuing their collective interests (i.e., preserving their traditional values and lifestyle) in the local political arena. Relevant Literature Canan, P. and Michael Hennessy. 1989. “Tourism, the Growth Machine and the Selling of Culture.” Sociological Perspectives. vol. 32, No.2:227-243. Canan, P. and Michael Hennessy. 1982. “The Moloka’i Databook: Community Values and Energy Development”. Univ. Hawaii: Department of Urban and Regional Planning. Moloch, Harvey. 1976. "The City as Growth Machine: Towards a Political Economy of Place." American Journal of Sociology 82(2): 309-352.
Overview Handout
THE BATTLE OVER DEFINITIONS OF DEVELOPMENT: OVERWHELMING THE RESISTANCE TO THE GROWTH MACHINE
Policy makers, civic leaders, community advocates and researchers alike often aim to involve the public in deliberations about community futures, but they are just as likely not to know how. Now more than ever we need ways to do this. A collaborative research project conducted 20 years ago on the island of Moloka’i in the Hawaiian archipelago provides a good (and award-winning) example of community-based sustainable development policy research and a few untoward lessons. Returning to this island locale would be ideal for RC6 comparison over time. When the island of Moloka’i was faced with the challenge of retiring and replacing its aging diesel generator at a time when a relatively poor community was paying 24 cents/kwh for electricity, it was right in the aftermath of the oil crisis of the late 1970s. Alternate energy technologies were a hot policy topic then (only to be dropped subsequently by the Republican Reagan administration). At the time the US Department of Energy commissioned the Hawaii Natural Energy Institute of the University of Hawaii to conduct a demonstration project regarding Moloka’i’s becoming electrically self-sufficient. As a professor of the University’s Department of Urban and Regional Planning, I led a graduate planning practicum to work with community residents and social science experts to articulate a process by which community values would guide the selection of energy technology options. Our methods included in-depth interviews regarding the Preferred Way of Life on Moloka’i, a survey- based multidimensional analysis of the structure of the community’s values (conducted by trained island residents), the projection of social and economic trends from indicator data (Canan, Hennessy et al. 1982), a household survey of electrical appliances and matched of household energy bills for 18 months (Canan & Hennessy 1981). The energy production technology path that we recommended was a combination of a biomass energy facility, hydro-electric energy, and smart

42
energy consumption (using the excess steam to power a community-wide food freezer locker system so people could retire their individual home food freezers) (Canan and Hennessy 1982). The recommendations were based on the findings that the following Gemeinschaften values were held dear by the community residents: Hawaiian Culture, Everybody Knows Everybody, Living Off the Land, Rural, Land, and Slow Pace. By utilizing biomass, the rural nature of the island would be supported and the land kept in sugarcane. The frozen food locker system designed as part of a civic center would satisfy the desire for maintaining the local norm of knowing everybody and the ability to live off the land by freezing local harvests. Despite the overwhelming support for this plan, there were divisions within the community that were more closely aligned with the values of off-island elites. The community values survey results from a purposeful sample of statewide decision makers (the governor, members of the legislature, the mayor, business elites e.g.) revealed that they endorsed the values of Tourism and Development. A sub-set of local residents who were pro-growth (the local growth machine) were likely to select the value concepts of Tourism and Development as well as an identity based, not in traditional Hawaiian culture, but in socio-economic status (Gesellschaften) defined in terms of the concepts of Jobs, Education, and Land (Canan and Hennessy 1989). The alignment of forces defining “development” as “business as usual” overwhelmed the community-based vision of the future. Yet 20 years later the vision may have changed as the current electricity provider, Maui Electric Company (MECO), has been awarded $1.1 million in USDA grant funds for its "Solar for Molokai" project. MECO was one of just nine applicants chosen under the USDA's Assistance to High Energy Cost Rural Communities program. Solar for Molokai is expected to install 300 or more solar water heating systems over two to three years (www.heco.com/MECO). A revisit to this island setting would be an ideal addition to RC6 case studies. Canan, Penelope and Michael Hennessy. 1989. “Tourism, the Growth Machine and the Selling of Culture,” Sociological Perspectives, Vol. 32, No. 2: 227-243 Canan, Penelope, Michael Hennessy et al. 1982. The Moloka’i Databook: Community Values and Energy Development, University of Hawaii: Department of Urban and Regional Planning. Canan, Penelope and Michael Hennessy. 1982 "Community Values as the Context for Interpreting Social Impacts." Environmental Impact Assessment Review, Vol. 3, No. 4: 351-365 Canan, Penelope and Michael Hennessy. 1981. "In Defense of Lifeline Rates: An Empirical Analysis." Public Utilities Fortnightly, Vol. 108, No. 10 (November): 31-35, with Michael Hennessy.

43
Networks in/for Ecosystem Understanding and Management
BETH SCHAEFER CANIGLIA
Biographical Statement
Beth Caniglia is Assistant Professor of Sociology at the University Oklahoma having received masters and doctoral degrees from the University of Notre Dame. Her research interests as an environmental sociologist span global, international, transnational, regional and organizational scales. Her work is known for combining insights on social networks, social movements, and social stratification. She has won numerous awards for excellence in teaching and her early scholarship brought public honor (Outstanding Thesis at the University of Notre Dame; Olsen Outstanding Graduate Student Paper Award - Environment & Technology Section of the American Sociological Association). She has published in leading journals (e.g., Mobilization, the American Sociological Review, and Society & Natural Resources) as well as in a wide range of book chapters and conference proceedings.
Pre-Workshop Thought Piece
Building Effective Regional Carbon Management Networks: Lessons from the Dust Bowl
In 1889, the state of Oklahoma was opened to white homesteaders for settlement. Tracts of 160 acres were claimed by the thousands, and quickly the vast grasslands, bottoms and forests were put under the plow. For many, Oklahoma seemed a paradise. The plains were, in the words of Walt Whitman, “North America’s characteristic landscape” – a land filled with endless possibility.1 For forty years, the dream seemed to be real. The wheat fields prospered. But in the spring of 1931, the rain stopped, ushering one of the largest environmental disasters in recent U.S. history: the Dust Bowl. How did the Great Plains recover from this disaster? And, more specifically, what role did regional social networks play? Unfortunately, this story provides a counter-case, rather than an exemplary model. Dust Bowl recovery networks were by and large a failure on every front. However, counter-cases are critical components of theory building, and the Dust Bowl recovery case provides important lessons related to regional carbon management networks. Numerous federal, regional and state agencies, alongside scientists, university cooperative extension units, community groups and individual farmers devised strategies for Dust Bowl recovery. Key challenges that ultimately blocked cooperation included: divergent land management philosophies, private land ownership, distrust among potential allies, and tradition. In the end, the effects of draught and wind – a convergent cycle that repeats itself approximately every twenty years on the plains – were mitigated by deep well irrigation, rather than by strategies offered by Dust Bowl recovery networks.
1 Worster, Donald. 1982. Dust Bowl: The Southern Plains in the 1930s. New York: Oxford University Press.

44
This paper provides an examination of the social network failures of Dust Bowl recovery in order to provide insights into conditional factors that may impact the success of regional social networks for carbon cycle management. The primary lesson that emerges from this story is that geographic scale and local social contexts play important roles in the creation, transmission and implementation of environmental management technologies. Managerial decision making processes – those that rely upon the scientific method to derive the “common good,” may produce best practices that will lead to environmental benefits. Nonetheless, indigenous knowledge systems and local social structures often resist change. Current research related to the carbon cycle in Oklahoma reveals that significant losses in soil carbon levels resulted from intensive tillage of cropland.2 Since 1950, just under half of the carbon lost due to tillage was regained from conversion of cropland to grass. These estimates do not account for carbon releases that result from evaporation on irrigated fields. Oklahoma’s current land use practices require modification if we hope to further ameliorate our regional carbon losses. Therefore, this paper is intended to provide initial recommendations for building successful carbon management networks in our state.
Presentation Summary
BUILDING EFFECTIVE REGIONAL CARBON MANAGEMENT NETWORKS: LESSONS FROM THE DUST BOWL
Beth Schaefer Caniglia (Reporter: Elizabeth Malone)
Main Points
• The Dust Bowl is a good case study because the
causal conditions persist: carbon loss (soil, vegetation) from tillage, monocropping, soil erosion.
• Dust Bowl networks for relief and recovery included federal (often working at cross purposes), regional and state (often reporting to the federal level), county, and local groups.
• Dust Bowl networks failed to bring significant change to better adapt to the existing ecology and climate. The farmers who stayed wanted to return to wheat production and did, enabled largely by irrigation.
Malone, Kondoh, Obersteiner, Caniglia 2 Oklahoma Conservation Commission. January 6, 2003. “Oklahoma Carbon Sequestration Enhancement Act.”

45
Testable Hypotheses If relief agencies provide incentives to change, people will change their behaviors (e.g., farm management). Given mixed messages from relief and recovery agencies, farmers will choose to continue previous practices and ways of life. Implications for URCM Networks The same processes that contributed to deterioration of the soil in the Dust Bowl region also contribute to carbon release; these processes continue. Private property ownership patterns challenge new policy implementation. Attitudes in the region suggest that local citizens will not be inclined to alter their practices in the name of carbon fixation, and government actions may enable the continuation of harmful farming techniques and attitudes. Natural circumstances (e.g., groundwater depletion in the Ogallala aquifer) and technological innovations (e.g., fuel efficiency) may have a positive impact. Coordination and agreement among federal agencies is important, but networks are only important when their goals correspond to the goals of local community members. Relevant Literature Caniglia, B.S. 2004. Human Behavior & Land Use. Oklahoma’s Environment: Pursuing a Responsible Balance. Oklahoma City: The Oklahoma Academy. Harrington, John 2003. [altering attitudes in the name of carbon fixation]. Oklahoma Conservation Commission. January 6, 2003. Oklahoma Carbon Sequestration Enhancement Act. Worster, Donald. 1982. Dust Bowl: The Southern Plains in the 1930s. New York: Oxford University Press.
Building Effective Regional Carbon Management Networks:
Lessons from the Dust Bowl
Beth Schaefer Caniglia, PhDAssistant Professor of Sociology
Oklahoma State University
Why the Dust Bowl?
• Carbon loss in the Great Plains is closely tied to land management.– Conversion of grass to
cropland– Tillage– Deforestation

46
Lessons from the Dust Bowl: Overview
• Why the Dust Bowl?
• Case Review
• Closer View of Dust Bowl Recovery Networks
• Lessons from the Case
Why the Dust Bowl?
• Wind is both friend and enemy in the Great Plains.
• Cycles of draught hit the plains every 20 years, bringing significant soil erosion.
• Causes of the Dust Bowl and Carbon loss are the same.
Why the Dust Bowl?
• Carbon loss in the Great Plains is closely tied to agriculture, especially to tillage.
• Similar techniques caused the Dust Bowl.• Looking around at the lush greenery, one might
guess that Dust Bowl recovery was successful.• In fact, Dust Bowl recovery networks were a
failure.
Why the Dust Bowl?
• The Dust Bowl was region-specific in its conditions, causes and consequences.
• Possible solutions were funneled to the area by a variety of elite, expert organizations, operating at various scales: national, regional, state, county and local levels.
• The failure of these networks to bring significant changes provides insights into possible challenges to carbon cycle management in the region.
The Dust Bowl Case
• Physical Environment Pre-Land Run– Upper East/C. Kansas
• Tall Grass Prairie– Colorado, New Mexico, Texas
& Oklahoma• Short Grass Prairie
– Bison, antelope, jackrabbits, mice, prairie dogs, gophers and rats, rattle snakes, hawks, eagles, skunks, coyotes and wolves.
The Dust Bowl Case
• The ecosystem that fixed the soil had been dramatically changed, bringing dust storms and static electricity, which killed crops and choked animals and people.

47
The Dust Bowl Case
• Manifest Destiny & the Boomers
• Late 1800s brought thousands to homesteads on the Great Plains
• 1889 Land Run opened Oklahoma to settlement
The Dust Bowl Case
• Across the Dust Bowl region, 20-33% of the population left for greener pastures.
• Many stayed, hoping rain would come.– These are the folks who
form the center of Dust Bowl recovery networks.
Dust Bowl Case
• 1920s tractors came to the Great Plains• By 1935, the year dust storms began to blow, one-third
of the Dust Bowl region had been plowed.• 33 million acres
Dust Bowl Network Actors
• Dust Bowl relief & recovery networks were comprised of organizations and individuals at many scales – federal, regional, state, county and local.
• Federal Government Aid/Relief was the largest category in the network.
• Federal Government Education/Recovery groups were also significant.
Dust Bowl Network Actors
• Federal Government Aid/Relief– Agricultural Adjustment Administration– Drought Relief Service– Works Progress Administration– Rural Rehabilitation Program– Bureau of Reclamation– Federal Emergency Relief Administration– Farm Credit Administration– Resettlement Administration– US Department of Agriculture
Dust Bowl Network Actors
• County Organizations– Ecology Field Stations– Cooperative Extension Offices– Soil Conservation Districts– Truth Squads & Last Man’s Clubs
• Local Organizations– Churches, Fraternal Lodges, Women’s Clubs, 4-H Clubs,
Townsendites– Grocers, Families & Farmers

48
Dust Bowl Network Actors
• Federal Education & Recovery– Soil Conservation Service– National Research Council– National Forest Service– Bureau of Agricultural Economics
• Federal NGOs & Industry Associations– American Farm Bureau Association– Ecology Society of America– National Livestock Association
The Dust Bowl Networks
• In all, nine (9) federal agencies provided relief during the Dust Bowl.– Jobs, low-interest loans, subsidies for leaving land
bare or implementing new farming techniques, purchasing unproductive lands, food aid.
• Only four (4) federal agencies focused specifically on ecological/conservation education and recovery.
Dust Bowl Network Actors
• Regional Organizations– Great Plains Council– Great Plains Drought Area Committee– Tri-State Land Utilization & Conservation Project
• State Organizations– Governors– Land Grant Universities
The Dust Bowl Networks• Federal agencies often worked at cross-purposes.
– Ecology/conservation groups focused on teaching farmers about ecological balance, insisting that large portions of cropland revert to grass; but they did not attend to the socio-economic dimensions of such changes.
– Ecology agencies advocated crop rotation and biodiversity, but these agents were not trusted by local farmers.
– Relief agencies often rewarded those whose moncropping strategies caused the Dust Bowl by basing incentives on the amount of wheatproduced in 1931-32.
– Relief agencies also encouraged the continuation of plowing by allowing people to endure without questioning whether the Great Plains region was suitable to monocrop farming.
The Dust Bowl Networks
• Regional groups were primarily reporting mechanisms for the federal government.
• State agents, too, remained distant from farmers.• At the county level, cooperative extension agents
competed with ecology field stations. Advocating “conservation agronomy,” their intent was to increase productivity on the land, while the ecologists wanted to decrease and/or drastically change approaches to productivity.
Dust Bowl Attitudes• During the Dust Bowl, the primary barrier to the success of Dust
Bowl recovery was attitudes – at the local level and beyond.• “Water will follow the plow” exemplifies only one side.• On the other side lies beliefs about the ability of science and
technology to enable humans to maintain the productivity of the land.
• Very few members of Dust Bowl recovery networks advocated significant changes in human-environment relations; and, those that did were distrusted and ignored.
• There is severe recalcitrance in the area and a strong preference to preserve traditional methods.

49
The Dust Bowl Networks
• At the county and local levels, citizen groups sided primarily with the conservation agronomists. Most of these groups hoped to return to wheat production when the rain returned.
• Farmers did implement shelter belts and terracing techniques, which curbed soil erosion and increased water uptake by crops.
• When the land returned to productivity in the 1940s, however, farmers plowed down most of the shelter belts to make room for more wheat.
Lessons for Regional Carbon Management
• The same processes that contributed to deterioration of the soilin the Dust Bowl region also contribute to carbon release; and these processes continue.
• Private property ownership patterns continue to be a challenge for new policy implementation.
• Attitudes in the region suggest that local citizens will not be inclined to alter their practices in the name of carbon fixation(John Harrington 2003).
• Natural circumstances (e.g. groundwater depletion in the Ogallala aquifer) and technological innovations (e.g. fuel efficiency) may have a positive impact.
Mini-Dust Bowls
• Drought came to the Great Plains in the 1950s and 1970s. In both cases, dust storms rolled across the lands, suffocating livestock and killing crops.
• These mini-Dust Bowls were shorter-lived, but they illustrate the failure of the original Dust Bowl networks to foster long-term, meaningful changes in farming techniques.
• Attitudes among local farmers, families and leaders were and remain a significant barrier to required changes.
• Deep-well irrigation was the primary mitigator.
Farming Lessons• Recent evidence suggests that other semi-arid environments will
become vulnerable to carbon release through the global dissemination of Western agricultural practices.
• Extent research shows these monocrops and corresponding chemical and irrigation intensive techniques disrupt successful grassland carbon sinks, alter local climates through evapo-transpiration, and leave areas vulnerable to wind and water erosion.
• Biodiversity, no-till techniques, crop rotation, and choosing environmentally suitable crops increase carbon sequestration, deter soil erosion and require less or no irrigation.
Network Specific Lessons
• The primary contribution of Dust Bowl networks was to enable the continuation of harmful farming techniques, along with corresponding attitudes regarding human-environment relations.
• Lack of coordination and/or agreement among federal agencies allowed locals to choose the approach most suited to their views.
• Managerial networks (top-down) were only influential when their goals corresponded to the goals of the local community members.
Network Specific Suggestions
• Coordinate federal agency approaches to regional and local carbon management. Facilitate coordination from top to bottom.
• Encourage holistic approaches toward carbon management at all levels (scientific and socio-economic).
• Build trust at the local level by facilitating stakeholder participation processes – not only related to policy implementation, but in the scientific process.
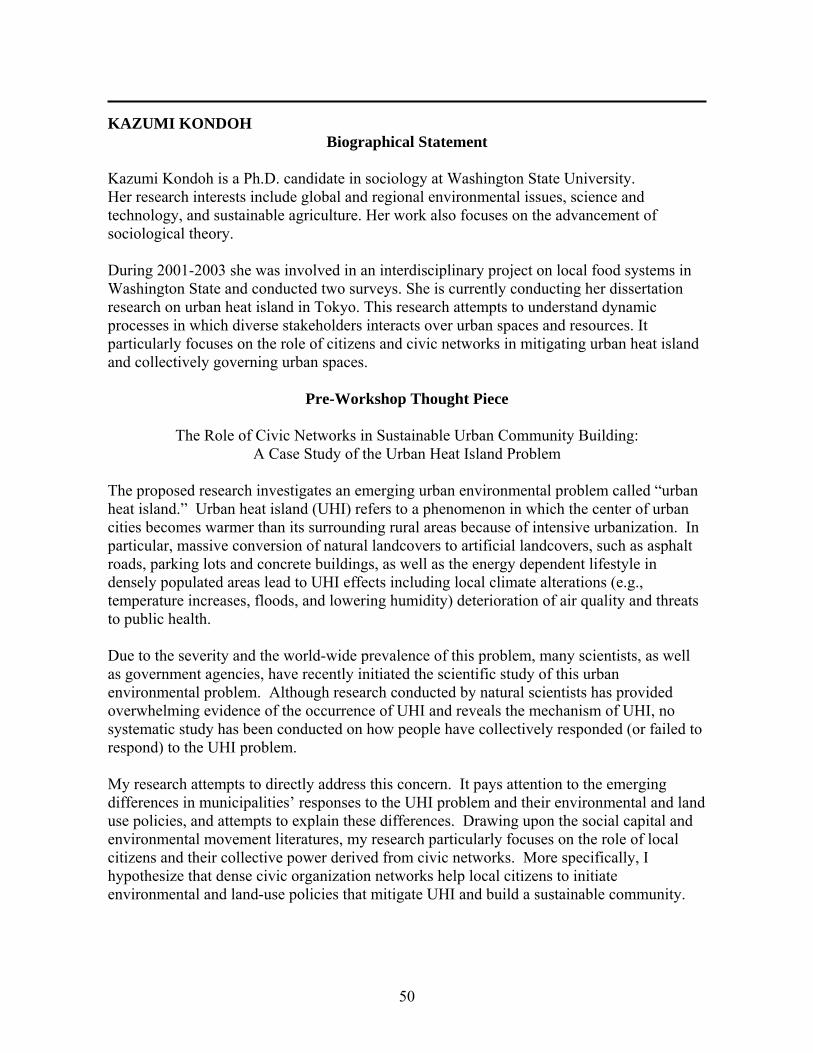
50
KAZUMI KONDOH
Biographical Statement Kazumi Kondoh is a Ph.D. candidate in sociology at Washington State University. Her research interests include global and regional environmental issues, science and technology, and sustainable agriculture. Her work also focuses on the advancement of sociological theory. During 2001-2003 she was involved in an interdisciplinary project on local food systems in Washington State and conducted two surveys. She is currently conducting her dissertation research on urban heat island in Tokyo. This research attempts to understand dynamic processes in which diverse stakeholders interacts over urban spaces and resources. It particularly focuses on the role of citizens and civic networks in mitigating urban heat island and collectively governing urban spaces.
Pre-Workshop Thought Piece
The Role of Civic Networks in Sustainable Urban Community Building: A Case Study of the Urban Heat Island Problem
The proposed research investigates an emerging urban environmental problem called “urban heat island.” Urban heat island (UHI) refers to a phenomenon in which the center of urban cities becomes warmer than its surrounding rural areas because of intensive urbanization. In particular, massive conversion of natural landcovers to artificial landcovers, such as asphalt roads, parking lots and concrete buildings, as well as the energy dependent lifestyle in densely populated areas lead to UHI effects including local climate alterations (e.g., temperature increases, floods, and lowering humidity) deterioration of air quality and threats to public health. Due to the severity and the world-wide prevalence of this problem, many scientists, as well as government agencies, have recently initiated the scientific study of this urban environmental problem. Although research conducted by natural scientists has provided overwhelming evidence of the occurrence of UHI and reveals the mechanism of UHI, no systematic study has been conducted on how people have collectively responded (or failed to respond) to the UHI problem. My research attempts to directly address this concern. It pays attention to the emerging differences in municipalities’ responses to the UHI problem and their environmental and land use policies, and attempts to explain these differences. Drawing upon the social capital and environmental movement literatures, my research particularly focuses on the role of local citizens and their collective power derived from civic networks. More specifically, I hypothesize that dense civic organization networks help local citizens to initiate environmental and land-use policies that mitigate UHI and build a sustainable community.

51
I use a comparative method to understand the roles of local civic networks. Four cities are selected within the Tokyo Metropolitan Area to investigate the roles of local citizens and their civic networks in responding to UHI while controlling for cultural, social and political influences. I already have collected existing archival documents and statistical data on land-use and population changes, and household energy consumptions. The information concerning each municipality’s UHI mitigation policies, general environmental and land-use policies had been also collected. The proposed project is for the final phase of my dissertation research. I will conduct a mail survey to local civic organizations and interview individuals that play important roles in local environmental and land-use policies. The survey and interview data will provide the information on the strength and nature of civic networks in each city and their role in creating local UHI mitigation policies. This research has significant implications. The findings will advance our understanding of the extent that common-pool resource theory explains resource sustainability in the urban setting. This research will also provide a coherent theoretical foundation for the study of other urban environmental problems such as air pollutions. In addition, by examining the role of civic networks in mitigating the UHI problem, it may fill the gap between theoretical understanding and local activists’ emphasis on the importance of citizen participation in local decision-making processes. Furthermore, the findings will offer practical implications to urban planners and policy makers in many urban cities around the world that have experienced UHI.
Presentation Summary
URBAN HEAT ISLANDS Kazumi Kondoh
(Reporter: Elizabeth Malone) Main Points
• Large-scale conversion of land to artificial cover plus energy-dependent lifestyle and air-conditioning feedbacks contribute to urban heat island effect.
• In rural areas evaporation and transpiration keeps temperatures cooler.
• Negative consequences of the heat island effect include change in local climate (temp increase, precipitation patterns and wind patterns), a changing urban ecosystem, deteriorates AQ and increases public health risk (heat-related illness, respiratory illness).
• Tokyo’s average temperature has increased ~3 deg Celsius over the past century. An average of 250 hours per year of 30 deg Celsius temperatures has increased to an average of over 400 hours in the past
Kazumi Kondoh, Chisa Umemiya, 20 years. Yukako Ojma

52
• Tokyo is comprised of 23 wards and 29 cities covering 2,187 square km and has a population totaling 12 million (plus 3 m commuters). • 2001 land use coverage was 56.6% in buildings, 21% in roads (80% artificial cover) and steadily increasing (road length); registered automobiles increased dramatically after WWII to 3.6 m cars in 2000. • Mitigation policies: urban heat island is an important government environmental issue; March 2003, UHI Action Plan to mitigate involves multi-agency efforts by powerful agencies; engineering solutions are emphasized [roof-top gardens, reflective pavements, water-retaining pavements], little effort to control building and population densities and changing lifestyles promotes large-scale unsustainable urban renewal projects [engineering solutions]. • Governor Ishihara created Council for the Urban Revitalization Project in April 2001; national government set up Urban Renaissance Headquarters (URH) in May, in July announced Priority Project Areas, including 7 areas in Tokyo. • The national government enacted the Urban Renaissance Law in 2002, but is has many exemptions so is pretty much ignored. • Example: Shiodome Shio-Site Project: 30.7 ha Tokyo Bay Waterfront Development – business interested; as of 2003, 12 high-rise buildings were constructed; est. pop in 2007 is 61,000 workers and 6,000 residents; environmental impacts are huge: ocean breeze is blocked by buildings and exacerbated the urban heat island effect. • National and TMG politicians, bureaucrats and industry have a strong network, but what about the citizens? Testable Hypotheses Research questions: What is the role of civic networks in mitigating UHI in Tokyo? To what extent are local citizens involved in local organizations working on UHI problem, environmental or city planning issues? How and to what extent is each local organization connected with other local organizations? How and to what extent are local organizations connected with extra-local organizations, including industries and local government, which affect the decision-making process of UHI mitigation? Is there an association between the strength of civic networks and the effectiveness of UHI mitigation policies? Methods: interviews & organization survey, comparative case study design; four municipalities: Sumida, Minato, Setagaya and Nerima.

53
The Role of Civic Networks in Mitigating
Urban Heat Island
Kazumi KondohDepartment of Sociology
Washington State University
The Global Carbon Project ConferenceApril 4, 2005
Tsukuba, Japan
Tokyo Metropolitan Government
• A regional administrative unit
• 2,186.90 square km or 0.6 % of the total area of Japan
• Population: 12 million
Urban Heat Island (UHI)
• Urbanized areas are warmer than their surrounding rural areas
• Caused by a large-scale conversion of land from natural landcovers to artificial landcovers (e.g., concrete buildings, asphalt roads, parking lots etc.), and
• Energy dependent lifestyle
Negative consequences include:
• Changes a local climate (temperature increase, changing precipitation patterns & wind patterns)
• Changes urban ecosystem• Deteriorates air quality
• Increases public health risk (heat-related illness & respiratory illness)
Implications for the carbon management
• Rising temperatures increase energy consumption for cooling indoor environments
• Reducing energy consumptions mitigates UHI & global warming
• Conserving & creating green spaces mitigate UHI & global warming

54
Tokyo Metropolitan Region & Special 23-Wards Population Shift
0 0
2 000 000
4 000 000
6 000 000
8 000 000
10 000 000
12 000 000
14 000 000
1920 1925 1930 1935 1940 1945 1950 1955 1960 1965 1970 1975 1980 1985 1990 1995 2000
All TMG 23-Wards
Source: The Tokyo Metropolitan Government
Total Number of Registered Automobil in Tokyo
188 841 4,097 13,163 41,362240,337
622,924
1,712,070
2,693,196
854,034
65,05444,13258,42727,469
3,621,726
3,603,208
0
500,000
1,000,000
1,500,000
2,000,000
2,500,000
3,000,000
3,500,000
4,000,000
1910 1915 1920 1925 1930 1935 1940 1945 1950 1955 1960 1965 1970 1980 1990 2002
2001 Tokyo Special 23-Wards Land Use
56.6%21.0%
6.1%
5.3% 0.9%
5.2%
3.3%
1.4% 0.1%
ResidentialRoads&othersOther useParksUnused landFarm useWater SpaceWoods&ForestsGrassland
Source: The Tokyo Metropolitan Government, Bureau of City Planning 2002
Prime Minister Koizumi set up Urban Renaissance Headquarter (URH)
URH announced the Urban Renaissance Priority Project Areas (URPPA) 7 areas in TKO
May
July
Adopted the Environmental Preservation Ordinance mandatory requiring greening-up rooftops
Gov. Ishihara created Council for the Urban Revitalization Project
Apr
Apr
2001Created 120 weather monitoring stations
2001
National GovernmentTMG
Total Road Lengths & Areas in the Tokyo Special 23-Wards
8,500,000
9,000,000
9,500,000
10,000,000
10,500,000
11,000,000
11,500,000
12,000,000
1965 1970 1975 1980 1986 1990 1995 2000 2003
Leng
th (m
)
0
20,000,000
40,000,000
60,000,000
80,000,000
100,000,000
120,000,000
Are
a (s
quar
e m
)
Length Area
Adopted Guidelines for UHI Countermeasures
2004Mar
2004
Adopted Heat Island Action Plan (HIAP)
2003Mar
Set Up the Council for the UHI Countermeasures
SeptSet Up the Heat Island Countermeasure Promotion Council (HICPC)
Aug
Enacted the Urban Renaissance Law
2002Mar
Revised the TMG Environmental Master Plan
2002Jan
National GovernmentTMG

55
Characteristics of TMG’s UHI mitigation policies
• Multi-agency efforts, powerful agencies (Bureau of City Planning, Bureau of Transportation etc. played the central roles)
• Engineering solutions are emphasized. – Roof-top gardens– Reflective pavements, Water-retaining pavements on the
surface of roads– Energy efficient buildings
• Little effort is made for controlling building and population densities and changing lifestyle – Instead, TMG have promoted a large scale unsustainable
urban renewal projects
Research Objectives• To examine the role of civic networks in mitigating
UHI in Tokyo
Research Questions• To what extent are the local citizens involved in local civic
organizations working on the UHI problem, environmental or city planning issues?
• How and to what extent is each local organization connected with other local organizations?
• How and to what extent are local organizations connected with extra-local organizations including industries and local governments that affect the decision-making process of the UHI mitigation policies?
• Can the variation of UHI and city planning policies among municipalities be explained by the level of civic networks?
Shiodome Shio-Site Project • 30.7 ha Tokyo Bay Waterfront Development
• It was an open-space area located in the center of Tokyo
• It is designated as an URPPA Project area
• As of 2003, twelve high-rise buildings were constructed
• Estimated population in 2007 61,000 workers & 6,000 residents
• Environmental Impacts of this projectFor example: Ocean breeze is blocked by a set overcrowding
high-rise buildings and exacerbates the degree of UHI in nearby communities
• Methods
– Multiple-method (interviews & an organization survey), comparative case study design.
– Four municipalities--Sumida, Minato, Setagaya and Nerima were selected based on my preliminary research
– Cases are selected from the same region to control cultural, social and political influences.

56
MICHAEL OBERSTEINER
Biographical Statement
Michael Obersteiner is currently working in the Forestry Project of IIASA where he is the principle investigator and scientific coordinator of the INSEA (Integrated Sink Enhancement Assessment) project.
Dr. Obersteiner joined the Forestry Project in 1993 as a Guest Research Assistant. Since 2002 he has been a Research Scholar dealing with multiple research topics, including global risk management, real option theory, dynamic systems theory, terrestrial ecosystem management, information technology and structural change of the global forest-agri sector and carbon analysis. Dr. Obersteiner received his Ph.D. from the Institute of Forestry, at the University of Agriculture and Forestry in Vienna, Austria. He is also a Ph.D. candidate at the department of mathematical economics at Novosibirsk State University in Novosibirsk, Russia. In addition, he graduated as a Diploma Economist (M. phil. in Economics) in the Joint Ph.D. Program in Economics, from both Columbia University (New York, USA) and the Institute for Advanced Studies in Vienna, Austria. Before coming to IIASA, Dr. Obersteiner was a visiting scientist at the Institute for Economics and Industrial Organization, the Siberian Branch of the Russian Academy of Sciences in Novosibirsk, Russia working on forest industry modeling. Prior to this he was a Fullbright Research Assistant at the College of Forest Resources at the University of Washington in Seattle, Washington, working in the area of eco-physiological responses of plant stress.
In addition to his research at IIASA, Dr. Obersteiner is a Research Economist with the Department of Economics and Finance at the Institute for Advanced Studies in Vienna, Austria. Dr. Obersteiner has been a consultant to a number of national and international organizations, including inter alia the European Commission, OECD, and national governments. He is author of over 100 scientific papers and consultancy reports in the above mentioned fields.
Pre-Workshop Thought Piece
A Caricature of European-US Climate Risk Management Transatlantic Philosophical Rifts and Bifurcating Epigenic Coding of Social Networks
Approaches on how to manage the global carbon cycle crucially depend on how scientists and policy makers perceive risks and uncertainties associated with the perturbation of the carbon cycle. Art 3.3 of the convention is a typical negotiation text in the sense that it is ambiguous, and yet fully comprehensive covering almost all strategic postures possible to manage climate change related risks. It is worth repeating the Principles section of the UNFCCC detailing that “The Parties should take precautionary measures to anticipate, prevent or minimize the causes of climate change and mitigate its adverse effects. Where there are threats of serious or irreversible damage, lack of full scientific certainty should not

57
be used as a reason for postponing such measures, taking into account that policies and measures to deal with climate change should be cost-effective so as to ensure global benefits at the lowest possible cost. To achieve this, such policies and measures should take into account different socio-economic contexts, be comprehensive, cover all relevant sources, sinks and reservoirs of greenhouse gases and adaptation, and comprise all economic sectors. Efforts to address climate change may be carried out cooperatively by interested Parties.”
Analysing this text, we find that Parties should firstly take precautionary action (one point to Europe). Yet, in the following sentence precautionary action is conditioned on a cost-effectiveness clause which in the third sentence can be interpreted as a mean value based cost/benefit analysis weighing preventive mitigation measures against (1) adaptation costs and (2) opportunity costs with respect to possible foregone economic growth due to investments deviated to mitigation actions (two, but secondary, points to North America).
Given deviating belief of what the nature of the risks and opportunities are, as well as whether these risks and their associated uncertainties can be quantified ex ante, researchers and policy makers defend different approaches on how to deal with the fact that mankind has and will perturb the global carbon cycle (see Figure 1). Ceronsky et al. (2005) find that the way people set up the cost/benefit analysis drives the negotiation process under the UNFCCC and other internationally coordinated actions mitigating global risks. Those who believe that the risks from climate change are reversible and that the associated uncertainties of those risks are quantifiable want to engage in a process of adaptive management. If there is ignorance (no knowledge) about the nature of the reversible risk or the occurrence of a new risk, the Proactive Principle demands protecting people’s freedom to experiment, innovate, and progress. The Proactive Principle and the Adaptive Management Paradigm, as supported by North Americans, implies several imperatives when restrictive measures are proposed: Assess risks and opportunities according to available science, not popular perception; account for both the costs of the restrictions themselves, and those of opportunities foregone; favor measures that are proportionate to the probability and magnitude of impacts, and that have a high expectation value even if value free quantification is impossible or very difficult. Europeans, on the other hand, are more concerned in their decision making about extreme events and irreversible damage. In the case when damages appear to be of a irreversible nature or at least as very serious and when these damages can scientifically be quantified ex ante, then minimization algorithms on a measure of the down side risk should be applied. The value at risk (VaR) calculation employed by banks, guarding against bankruptcy risk by international regulation, could be such a risk measure. VaR approaches could also be implemented in an adaptive manner if the probability of occurrence of a serious and irreversible event can be ruled out. Finally, the Precautionary Approach, which is more in line with the Hippocratic oath (First of all, do no harm, or, Better do nothing than cause harm), is mainly favoured and implemented by European law makers. This principle is often invoked when the consequences are considered great enough that they may require significant technological and/or economic changes, even when the uncertainties regarding likely consequences remain high or in the situation of complete lack of knowledge.

58
Risks & Opportunities Reversible Irreversible
Quantifiable Adaptive Management Minimize Value at Risk Uncertainty Ignorance Proactionary Principle Precautionary
Principle/Gambling
Figure 1: Management responses to different qualities of risks and uncertainties.
Kagan (2002) argues that the different responses of Europeans and Americans to major strategic and international challenges are not simply due to differences in the current administrations, but rather results from (i) a power gap and (ii) differing ideologies. Applying Kagan's theory to climate policy and employing terrorism policy as a point of comparison, we argue that the power gap between Europe and America is unable to explain the differences in climate policy. In contrast, the ideology gap may indeed have some explanatory value. Furthermore, we argue that two additional feature are critical--the costs and benefits imposed by climate change and terrorism prevention and the process by which such costs and benefits are evaluated--differ between America and Europe.
In the presentation I will focus on this process and illustrate how relevant science and policy networks interact and, to some extent, mutually reinforce each other in an isolated manner on both sides of the Atlantic.
Presentation Summary
A CARICATURE OF THE TRANSATLANTIC DIFFERENCES OVER RISK MANAGEMENT
Michael Obersteiner (Reporter: Elizabeth Malone)
Main Points • Because of long-term relationships and high number of participating parts and high level
of anonymity/reciprocity/ efficiency of interaction, carbon is mostly networks and institutions; common resource management is the principal need, i.e., carbon constraint not a money problem.
• Adaptive dynamic modeling (population dynamics governed by Prisoner’s Dilemma rules) suggests that common resource management will oscillate between almost complete defection (tragedy-of-the-commons process until disaster is seen to be near) and cooperative management that includes altruists & adaptive checkers.
• Risk (reversible v. irreversible) and uncertainty (quantifiable v. ignorance) can prompt management responses of adaptive management, preemption, proaction, or precaution.
• EU and US different strategies are rooted in post-WWII history. EU focuses on economic power/diplomacy in an international regime, the US on military power and unilateral freedom to act. EU analyses emphasize lost benefits, US sure costs, alternative/ immediate uses for investment, and backstop technologies. EU uses a 3-4% discount rate

59
and supports equity via foreign aid (>0.8% of budget); US uses 7% discount rate and supports equity at a lower rate of foreign aid (0.14%).
Testable Hypotheses The history of US (defector) participation will show oscillation between dominance and more cooperative behavior. The EU will strengthen its leadership role in climate change issues because it has a comparative advantage in international regime participation. Implications for URCM Networks Game theory (especially reiterated games) can yield insights into likely national behavior in the climate change regime. Constructed ignorance (e.g., in the US) is necessary to avoid climate change action, so strategies to address constructed ignorance are important. The emphasis on costs obscures larger problems of networks and institutions.
A Caricature of the Transatlantic Differences over Risk
Management
Michael ObersteinerIIASA
GCP WS on Networks&Regional Carbon Management ScheduleTsukuba, 5th April 2005
Adaptive Dynamics models Agent –Artefact Space
Basic Substrate– Matter– Energy– Information
– Ways of doing
Dynamics– M, E, I– Ideation &
Innovation– Social-
Institutional
Agents
Overview
• AD and the ToC• Approaches to Risk and Uncertainty• Homo Europaeus contra Homo
Americanus (diagnostics)• Projection of future dynamics (prognostics)
institutional timescale, T
X1Consistency in timescales and aggregation

60
Adaptive Dynamics
Technology
InstitutionsEndogenous Environment
Feedback
Adaptive change
•Directional
•Anticipative/reactive
•Rational (conditional)
•Institutions and social structures
•Moral concepts
Modulators Trigger•Technological change
•Market Liberalization
•Wars, Acts of Terror
•Natural Catastrophes
Vectorization of Network properties
Number of participating parties
Dur
atio
n of
rela
tions
hip
Supply chains Networks
CompetitivemarketsProjects
Level of anonymity
Efficiency of interaction1/Level of Reciprocity
Obersteiner (2000)
Altruists
DefectersAdaptive Checkers
Co-operation
Maintenance of resource
Market defection
Destruction of resource
Agent-types in Common Resource Management
OscillationConditional Equilibrium
• Power and Ideology gap – “Institutional time line”
• Cost / Benefit tools – “Innovation timescale”
• Media Coverage – “Market time scale”
Tragedy-of-the-Commons3H
• High stake– Mitigation & Adaptation– Potential Losses– Long time spans
• High uncertainty– Physico-chemical and ecological– Socio-, techno- economic
• Heterogeneity– Impacts– Historical contributions– Ability to pay– Risk aversion– Goals
Power Gap
•Military Power, which is rooted in Cold-War
•Economic Power and Diplomacy, which is rooted in Post-WWII history
US, Mars, HobbesEU, Venus, Kant
Kagan: Let the Comparative Advantage due to different resource endowments
play out

61
Management responses to Risk and Uncertainty
Risk Reversible Irreversible
Quantifiable Adaptive Management
Preemption V aR
Uncertainty
Ignorance Proactionary Principle
Precautionary Principle
Note: Risk = Hazard x Vulnerability ~ Frequency x Impact
Ideology Gap
•Freedom to act•Policeman
International Regime•Democratic and more equitable international setting
•Cost are sure•Schelling•Backstop technologies
Measurement of CB•Emphasis on lost benefits
Differences in the Valuation…ideology gap cont.
Foreign Aid: 0.14%
Geographic (social) equityForeign Aid (Equity proxy): > 0.8%
Discounting of 7%
Intergenerational equityDiscounting (UK 3.5%, DEU 3%, NDL 4%)
Projection….today’s mega risks are truly global and full of
noise….
•Continue with “shock and awe” with maybe careful Bismarkianreconstruction (Gaddis)•Speaking more softly
•Learn•Buy its way to be contagious
•Excessive Budget Deficit•Lost relationship capital
Status•CC is the first policy field EU is leading
Media coverage
•Florida storms without connection to CC•Little coverage on EU heat wave.
•Florida storm well covered and connection to CC made.
…first signs of soft talk…
Wolfy!!! Get out….
I love Paris

62
The magic loop….which is based on strategic advantage
•Ignorance (CC) and hyperstatements (Iraq) of particular risk•Coercive action is prepared ex ante and needs to be exercised = Threshold events
•CanNot Break Tabus(sovereign NationState) or Commit Sins (e.g. Ignores adaptation)•Institution building takes a long time => incrementalism
Strategic position–Military SuperPower
reenforce power and freedom to act => unilateralism
Strategic position–MultiNationalism–Largest Economy
nurtures multilateralism
Early Report on Regional Carbon Management HIROYASU SUGIHARA
Biographical Statement
Hiroyasu Sugihara is Senior Economist in Research Center of Regional Policy, Research Institute of Capital Formation, Development Bank of Japan. His areas of focus have included sustainability science, environmental policy, environmental accounting, and environmental management etc. as shown in his works: Carbon Portfolio Analysis in Japan, Regional Policy Research vol.14, Research Center of Regional Policy (2005) (JW: First author, in English/Japanese); An Estimation of Carbon Stocks Using GIS in Japan, Regional Policy Research vol.11, Research Center of Regional Policy (2005) (JW: First author, in Japanese); Global Environmental Issues and Local Responses: Creating the Network Economies between Nature and Economy, Economy Society Policy No.391, November 2004, Cabinet Office(in English/Japanese); EcoBudget by ICKEI-Local Governments for Sustainability in Masao Kawano (ed.) Environmental Accountings, Ministry of Environment (2005, forthcoming) (in Japanese); The Regional Management System for Environment and Development, Environmental Information Science Vol.30, No.4, 2001, Center for Environmental Science (in Japanese); “Iriai”: Commons in Japan in Hirofumi Uzawa (ed.) Social Common Capital: Cities and the Commons, University of Tokyo Press (1994) (in Japanese).

63
Pre-Workshop Thought Piece
Network is a key for both economic externality and environmental externality. → Flow Network is a key for both innovative milieu and natural environment. → Stock Network is also a key for activity scale. For both Positive approach (analysis, ex post, backward-looking) and Normative approach (policy, ex ante, forward-looking).
Presentation Summary
TOWARDS REGIONAL CARBON MANAGEMENT SYSTEM – CREATING NETWORK ECONOMIES BETWEEN NATURE AND ECONOMY
Hiroyasu Sugihara (Reporter: Michael Obersteiner)
Main Points
• Positive approach has been the legacy of the past but normative approaches are important for the future.
• Focus is on carbon stocks rather than flows motivated by large labile stocks like wetlands.
• Networked economies is the guiding principle for the organization of regional carbon projects. Agglomeration economies and external economies. Vectors are group, time and space.
Kazumi Kondoh, Jeffrey Broadbent, Erich Schienke, Hiroyasu Sugihara
• Sens’s concept of sustainability and capability. Capability map of forest ecosystem carbon is presented – reflects the physical potential over time
• The sum of POETICs data produces sustainability maps. • Three concrete examples of regional carbon management in Japan were presented.
Testable Hypotheses Sustainability tests through modeling.

64
Implications for URCM Networks Regions: Motivated by global issues and brings it down to the region. Cities: Reflected by data e.g. transport infrastructure Carbon: Stocks are the important issue mainly due to its vulnerability to climate change, such as wetlands. NIES model shows carbon potentials. Culture: Legal issues are included Climate: Part of the data sets, includes also impact assessment. Change: Focus on the value of diversity in development. Consequences: Illustrated in its physical potentials.
1Copyright © Sugihara 2005
Toward Regional Carbon Management System:
Creating Network Economies between Nature and Economy
Hiroyasu SugiharaResearch Center of Regional Policy
The Development Bank of Japan
2005-04-05Joint Study with Dr.Yamagata
4
Copyright © Sugihara 2005
Portfolio Model
“Diversity-productivity relationship” in the context of biodiversity, was sustained regarding the carbon stocks.
The maintenance of diversity in the carbon stocks increases the total amount of carbon accumulation.
PortfolioModel
Sugihara, H., Yamashita, J. and Ikoma, Y. (2005), "Portfolio Analysis of Carbon Stocks in Japan", Regional Policy Research, 14.
2Copyright © Sugihara 2005
Regional Carbon Management System
Capability Maps
(RMS*)
Carbon Flow & Stocks
Regional Carbon
Projects Inter-compatibilitycheck
Sustainability&
Capabilities
PortfolioModel
Network Economies
Temporal, Spatial & Group Scales
Suitability Analysis(RMS*)
* RMS: Regional Management System
Approaches
Diversity 5Copyright © Sugihara 2005
Sustainability & Capabilities
“Capability” presented by A. Sen implies human capability to conserve the (natural)stocks and achieve inter-generational stock managements.
Vi( fi(c(wi)), pi) → Capability Maps
The function fi(・), which consists of person i and goods wi, is determined by characteristics of the goods, i.e. c (wi). Assuming that the goods is environment, and human beings are persons in a region, the wealth of a region Vi( fi(c(wi)), pi) is expressed by a combination of the environmental wealth fi(c(wi)) with human abilities (or richness) pi.
Sustainability&
Capabilities
Sugihara, H., Ikoma, Y. and Yashiro, M. (2005) “Estimation of regional potentials using the regional management system (RMS)”
Regional Policy Research, 15. (in print)

65
3Copyright © Sugihara 2005
Network Economies
Communities
Populations
EcosystemGroup
Individuals
Space
Time MicroMesoMacro Mega
ShortMedium
LongSuper Long
Size of Area Large ←→ Small Large ←→ Small
Balancing
ManagementOrg. directivity
Multiple Entities→ SOLE Entity (*1)
Multiple Entities→ SOLE
EntityFor Internalization Scale economies(Large)Scope economies(Small)
Scale economies(Large)Scope economies(Small)
DiversitySubsidy & Tax Cross-subsidization
(for grouping) (*2)
ExternalDiseconomies
AgglomerationEconomies
AgglomerationDiseconomies
ExternalEconomies
Managementdirectivity
Multiple Entities→ MULTIPLE Entities
Multiple Entities→ MULTIPLE Entities
For Internalization Network economies(Large ~ Small)
Network economies(Large ~ Small)
DiversitySubsidy & Tax
*1 UNFCCC Article4.2 Annex I Group*2 UNFCCC Article4.3 Annex II Group
Flow Stock
Network Economies
6Copyright © Sugihara 2005
For est soi l sFar ml and
soi l s2, 300
Global Carbon Cycle (1980s)
Atomospher i c Pool : At mosphere 751
5.9 Emission
Uni t s: Gt-C ( a bi l l i on car bon t ) , Gt -C/yr ( annual f l ow) .
Sour ce: SCOPE23( 1984) →I GBP-I HDP-WCRP ( 2003) . → ar r anged.
Sur f ace ocean 915
Geol ogi cal Pool : Land and sedi ment ( 20, 000, 000)
Mi d & deep ocean37, 195
Fossi l f uel 5, 780 ( ~12, 000)
Coal 730, Oi l 250, Nat ur al gas 200
Ter r est r i al ecosyst em 6, 800
r i ver f l uxes 1. 1
0.5 deposition
91. 9 90. 6
1. 3 Upt ake
Fossil fuel 5.8 Cement Emissions 0.1
1.4
Fr ozen soi l s
Wet l and soi l s
450~600
57 Photosynthesi s
( NPP)
1. 5 Upt ake
55. 5-0. 4 Respi r at i on 52. 1 For est f i r es 3. 4
0. 4 bi omass ener gy
Ocean 38, 110
+ 3. 4 Gt -C/yr ( accumul at es)
<0. 1 Vol cani sm
1. 8Land si nk
( af f or estat ion
0. 5 et c. )
0. 6 Upt ake1. 2
Land-UseChange 0. 6Fi r e 0. 6
Forest Ecosystem90% of Plants50% of Soils
Mar i ne or gani sm
28
50 phot osynthesi s ( NPP)
2
38. 5 Resp.
溶存性or gani c car bon
700
1. 5 r i ver expor t
1. 0 r i ver out gassi ng0. 2 weat her i ng
0. 4 weat her i ng
0. 8 Emission
Pl ant s 650
400~3, 300
F l ow
7Copyright © Sugihara 2005
Carbon Stocks: Forest , Farmland soil , Wetland
Copyright © Sugihara 2004
t -C
t -C / ha
Sugihara, H., Yamashita, J. and Ikoma, Y. (2004), "Carbon Pools in Japan: Forest, Wetlands and Farmlands", Regional Policy Research, 11. 10Copyright © Sugihara 2005
Capbility Map: Prevention F unction against G lobal Warming
Copyright © Sugihara 2005 Sugihara, H., Yamashita, J. and Ikoma, Y. (2004), “Portfolio Analysis of Carbon Stocks in Japan”, Regional Policy Research, 14.
8Copyright © Sugihara 2005
Carbon Stocks in Japan
Sour ce: Sugihara, H., Ikoma, Y. and Yamashita, J. (2004), “Carbon Pools in Japan: Forest, Wetlands and Farmlansd”, Regional Policy Center of DBJ
* Muni ci pal i t i es basi s where wet l ands exi st .
590,94331,943*1,580,5461,179,257401,289Average carbon accumulation by municipality (t-C)
AgricultureWetlandForestForestForestCategories
33.50.765.865.865.8Percentage (%)
12,473,187.99243,135.87 24,490,387.0024,490,387.0024,490,387.00Area(ha)
159.57442.49217.36162.1855.19Average carbonaccumulation(t-C/ha)
1,990,296,453.86 107,584,276.735,323,277,665.733,971,737,949.441,351,539,716.29Carbon accumulation(t-C)
Agricultural carbon stock Ss (D-B-C)
Wetland carbon stock Sw (C)
Forest carbon stock Sf(A+B)
Carbon accumulation in forest soils (B)
Carbon accumulation in woods (A)
11,0322,203,4321,802,143Average carbonaccumulation by municipality (t-C)
ForestForestForestThe whole soilsThe whole soilsCategories
65.8100.0100.0Percentage (%)
(24,490,387)(24,490,387)24,490,38737,206,710.8637,206,710.86Area (ha)
(220.5)(52.1)1.52199.46163.13Average carbonaccumulation (t-C/ha)
5,400,000,0001,276,580,00037,172,596.697,421,158,396.326,069,618,680.03Carbon accumulation (t-C)
Carbon accumulation inforest soils(Ota, 2000)
Carbon accumulation in woods (Matsumoto,2001)
Forest carbon sinks (flow)
Total carbon stocksSf+Sw+Ss (A+D)
Carbon accumulation in all the soils (D)
11Copyright © Sugihara 2005
Capability (and Suitability) Maps of JapanVi( fi(c(wi)), pi )
wi wi c(wi) fi(c(wi)) Vi( fi(c(wi)), pi))
Data Maps DataCapability Maps (Evaluation foreach regional characteristic)
Capability Maps (Evaluationof regional functions)
Suitability Maps
Classificationcriteria
Evaluationcriteria
1 Possibility of shallow landslide Regional Capability Map
2 Water permeability
Geology Surface geology 3Earthquake resistance of theground
4 Ground stabilityPreventive function against
disasters in mountains
5 Ground permeability
6 Probability of slope landslide Mountainnious Functions
7 Prevention against surface runoff
8 Ground safetyFunction of water
conservationMain
classification9
Difficulty in conservation of soilfertility
Watershed management
10Prevention against outflow ofnutrient salts
Topography 11 Facilities for human activitiesPreventive function against
earthquake disaster in
12 Easiness for land formation Estate development
13 Slope stability
Sub-classification
14 Disaster-prone topography 1Prevention function against
global warming
15 Disaster-prone topography 2 Rural Village Functions
16 Forest productivity
Altitude Altitude 17 Vegetation growth
18 Difficulty in land formationRecycling function of
biomassTourism promotion
19 Water retentivity
20 Forest growth
Soil Soil 21 Probability of activities of microbesFormative function of
human habitatsEnvironmentalconservation
22 Soil moisture
23 Water permeability
24 Contribution to slope stabilityLocational function of
large-scale industries (I)
25 Surface water conservation Large-scale development
26 Vegetation density in urban area
Land UseVegetation and
Land Use27
Artificial management (afforestation& regeneration)
Locational function oflarge-scale industries (II)
28 Supply of organic matter
29 Vegetation scarcity 1 City Functions
30 Vegetation scarcity 2
Climate Climate 31Space for development (existingurban area etc.)
32 Warm climate
Transportation Transportation 33 Transportation accessibility
34Accessibility to majortransportation networks
Supply function of urbanservices
Legal regulation Urban areas 35 Accumulation of urban facilities
Rural areas 36 Difficulty in development

66
9Copyright © Sugihara 2005
Prediction of Annual Carbon Sequestration in Japanese Forest using NIES Model
Sour ce: Y. Yamagat a
12Copyright © Sugihara 2005
Exchange & col l abor at i on wi t h
Ur ban ci t i es: St udy & t r ai ni ng, Eco-t our , Car bon Bal ance
Pr ogr amme
Eco-products
The change of a l i f e st yl e
Taki ng I nt er est I n t he r ol e of f or est
To Sust ai nabl e f or est management
Ur ban Ci t i es
A. Forest Museum Shimokawa : Local Carbon Management
(1) Maintenance of carbon pools
(2) FSC Forest Certificate:
Ecosystem maintenance
(3) Forest Zero EmmissionSee 1-2 (4) Conversion of fossil fuel energy
to ex.Wood-based biomass boiler
Money
(5) Cabon stock increasing by charcoal
as soil conditioners
13Copyright © Sugihara 2005
東部終末処理場太陽光発電
鉛電池
バイオガスエンジン
エンジン排熱を有効利用東北電力系統
(終末処理場へはシステムによる電力供給は行わない)
廃材 木質バイオマスボイラ
消化槽
蒸気ボイラ(既設)
消化ガスをエンジンン燃料に利用
太陽光発電
風力発電
太陽光発電
小中野小学校(47kW)
風力発電
小中野中学校(59kW)
八戸市庁舎本館(360kW)
八戸圏域水道企業団(38kW)
太陽光発電
風力発電
東北電力系統
江陽小学校(50kW)江陽中学校(49kW)
自営線(電力・通信)
制御システム
消化ガスタンク
八戸市新エネルギー等地域集中実証研究事業Eastern part final sewage disposal plant
Tohoku Electric Power system
Woody biomass boiler
Scrap wood
Biogas engine
(The electric power supply by a system is not performed to a final sewage disposal plant)
Digestive gas holder
Engine exhaust heat is used effectively.
Photovoltaics
Batteries
Digester gas is used for an engine fuel.
Steam boiler (existing)
PhotovoltaicsWind power
PhotovoltaicsWind power
Photovoltaics
Wind power
Hachinohe city Main building of city hall(360kW)
Hachinohe catchmentarea water service
corporation (38kW)
Konakano Junior high school(59kW)
Konakano Elementary School(47kW)
Koyo junior high school (49kW)
Koyo elementary school (50kW)
Control system
Self-management line (power and communication)
Tohoku Electric Power system
Digester
B. Microgrid System at Hachinohe city
14Copyright © Sugihara 2005
C. The Kyoto (City) Global Warming Prevention Ordinance
Target : reducing GHGs by 10% below 1990 levels by 2010
City of Kyoto
City, Citizens, Businesses :Energy-conserving, renewables
public transportation,reducing-reusing-recycling, etc
Large enterprisesmust submit
GHGs Reduction Plansand Periodical Reports
Large bulding& house builders
must submit GHGs Reduction Plans
Air-conditioner & refrigerator
sellers must make and explain
Energy-efficiencyLabels
Tourists and visitorsmust cooperate with

67
STEPHAN SCHOLZ
Biographical Statement
I am currently a PhD Candidate in the Department of Sociology at the University of Arizona. I hold an MA in Sociology from the University of Arizona and a BA in Sociology/Anthropology from Carleton College with a concentration in Environmental Studies. My interests are in environmental sociology, world population, world systems and social network analysis. As a research assistant with the Global Carbon Project I am involved in trying to integrate sociological and physical science models of climate change.
My master’s thesis incorporated a network measure of centrality in global civil society to show that institutions independently impact environmental conditions on a cross-national level. I presented a draft of this paper at the American Sociological Association annual meeting in 2003, at which time I met Penelope Canan. Subsequent teaching experience as a world population instructor has exposed me to the broad array of environmental sociology theories. At the Global Carbon Project I am assisting in combining these theories into a policy relevant, comparative framework. To help our thinking in this endeavor I am also collaborating in a conceptual analysis of biomass energy production in rural Japan. Small towns like Furano, Hokkaido have abundant forest resources, which, if used innovatively in something like a biomass gasification plant, would result in net savings to Japan’s carbon budget with potential profits to local economies. A variety of stakeholders such as city governments, local unions, research institutes, tourism industries and industrial manufacturers are implicated in the possible construction of such biomass plants. Structural analysis of the overlapping networks among these stakeholders should demonstrate independent effects on their stated willingness to pay for and participate in such energy programs.
Pre-Workshop Thought Piece
Knitting Sustainable Carbon Markets through Social Network Analysis
As a relatively young social science, sociology is often concerned with the production and interpretation of a fundamental knowledge base. Methodologies that actively attempt to restructure the actions of real world actors are therefore underdeveloped and approached with trepidation because they walk the fine line of scientific objectivity. The mitigation of human induced climate change, however, drastically requires the implementation of applicable sociological methods. Social network analysis (SNA) occupies a unique position to make this type of contribution. In a prototypical case study of Hokkaido, the Global Carbon Project hopes to use SNA to knit a sustainable network of market actors around the production of a biomass sequestration economy. SNA can present stakeholders with actionable pictures of their connections and adds value to economic analysis by tackling the problem of transaction costs.

68
Sociology and economics have been growing together as evidenced by increasing publication rates in their respective sub-fields of New Economic Sociology and New Institutional Economics. These fields have been converging around the concept of transaction costs, which are high in situations of uncertain information, low trust and unarticulated routines. As Mark Granovetter originally pointed out, the distinctive contribution of economic sociology should not grow out of a critique of the rational actor per se, but out of the analysis of the expectational and situational structures that economic actors rely on for the reduction of uncertainty in decision making processes. His concept of embeddedness bridges the divide between under socialized and over socialized actors and embeds them in networks of connection dependent information flows (Granovetter 1985). Subsequent studies of embedded economic actors have shown how particular mixes of internal and external organizational ties influence innovative behavior. However, there have been very few attempts to use SNA to explicitly knit economic actors together into robust and ecologically sustainable markets. The work of Krebs and Holley coming out of the Appallachian Community Development Network is an exception, and Hokkaido’s struggling forest economy presents another opportunity to do so around the establishment of a carbon credit generating biomass facility. Krebs and Holley outline a four stage process in community development that evolves from scattered clusters to stable core/periphery structures (Krebs and Holley 2002). The Global Carbon Project is hoping to learn from and implement such an approach in Hokkaido. Granovetter, Mark. "Economic Action and Social Structure: the Problem of Embeddedness." American Journal of Sociology, 91 (1985), 481-93. Krebs, Valdis and June Holley. “Building Sustainable Communities through Network Building”. www.orgnet.com, 2002.
Presentation Summary
SUSTAINABLE FMBECS MARKET IN HOKKAIDO Stephan Scholz, Florian Kraxner, Yoshiki Yamagata
(Reporter: Michael Obersteiner) Main Points
• Sustainable development is defined by a combination of social networks, economics and ecology.
• Forest management, biomass energy and carbon sequestration market is presented and the large potential is quantified. The economic, social and ecological factors are outlined.
• Transaction costs represent one of the theoretical concepts that bridge economics and sociology.
Stephan Scholz

69
• Reduction of transaction cost through social networks. • Innovation diffusion is accelerated through networked economies.
Testable Hypotheses How to knit a network. Implications for URCM Networks Bottom up management approach for biomass projects such as in Hokkaido. Biomass energy would develop rural areas and sequester carbon. Relevant Literature Canan, Penelope and Nancy Reichman. 2002. Ozone Connections: Expert Networks in Global Environmental Governance (Greenleaf).
Sustainable FMBECS Market in Hokkaido(Forest Management Biomass Energy Carbon Sequestration)
Stephan Florian YoshikiScholz Kraxner Yamagata
General BackgroundIt is estimated that in Japan 16 Mt C/a are already being sequestered by forests (Alexandrov, Yamagata 2002). This is equal to 4% of Japan’s emissions and obviously should not becounted towards meeting the Kyoto commitment of an 8% reduction.
New biomass projects and the establishment of forest economies, however, do represent legitimate Kyoto offsets, especially if they replace fossil fuel energy systems.
FMBECS
(Nelson 2004)

70
FMBECS
Willingness to Pay/Transaction Costs/OpportunityCosts
Sustainability
Willingness
to Pay?
FMBECSEconomic Factors
Needs of a Sustainable FMBECS Market
• Forest (Owners)
• Forestry(Management)
• Opportunity Costs/Transaction Costs
• Forest Sector Industry (Including Biomass)
Wood SUPPLY
• Consumers
• Other Industry Sectors
(buying Carbon Credits)
Wood DEMAND
ECONOMIC FACTORS
SOCIAL FACTORS
ECOLOGICAL FACTORS
General Background
Japan committed to reducing its total carbon emissions by 8% under the 1997 Kyoto Protocol. There are four basic strategies that exist to achieve this goal:
• Reduce the total amount of energy used and improve efficiency
• Substitute dirty fuel sources for carbon efficient sources
• Utilize market mechanisms to purchase carbon credits (JI, CDM)
• Capture and sequester greenhouse gases (Article 3.3)
AgriculturalMechanical scrubbing removal and underground injectionForestryBiomass Energy – forest slash can be used for renewable energy production. Because plants sequester carbon while they grow andrelease carbon when burned, they approximate a carbon neutral energy generation cycle – in contrast to large net outflows of carbon dioxide when conventional fossil fuels are burned.
FMBECS
FMBECSEcological Factors
Needs of a Sustainable FMBECS Market
• Landscape
• Biodiversity
• Water
• Forest
Resources
• Protection
• Stability
• Capabilities/ActualOpportunityCosts(Sugihara-san)
Interactions
ECONOMIC FACTORS
SOCIAL FACTORS
• Correct
Forest
ManagementECOLOGICAL FACTORS
Tokyo Experimental
Research Forest (Furano)
FMBECS
Where do Sociology and Economics Meet?How can Sociology Contribute to a WTP Study?
Economics Sociology
Transaction Costs – costs associated with obtaining and evaluatinginformation, finding partners, holding negotiations, consulting withexperts and monitoring agreements.
These costs are high in newly developing markets where there is littleinformation and much uncertainty concerning the behavior of otheractors.
FMBECS

71
FMBECS
How to Solve Transaction Costs and Reduce Uncertainty?
Sociology emphasizes the creation of social networksthat transmit trustworthy information.
When actors don’t know how to evaluate information or how to behave in a market they rely on social networks.
The more developed the social network, or the more connected an actor is, the lower the transaction costs.
FMBECS
• Public Opinion
• Perception
• Attitudes
• Connections
Willingness to Pay?
FMBECSSocial Factors
Needs of a Sustainable FMBECS Market
• Industry
• Public/Civil Society
• Owners/Managers
• GovernmentStakeholders
• Jobs
• Income
• Recreation (Tourism)
Needs
ECONOMIC FACTORS
SOCIAL FACTORS
ECOLOGICAL FACTORS
Why do Social Networks Matter?
The structure of ties between organizations and ties within organizations can reduce the transaction costs andimprove the efficiency of a market. Networks createinnovative behavior because they increase information flow develop trust.
In Hokkaido the transaction costs for an innovative FMBECS market can be analyzed and hopefully reduced through a social network analysis of the relevant stakeholders.
FMBECS
FMBECS
Examples of Social Network Effects1. Diffusion of an innovation:
(Coleman, Katz et. al. 1957)
Coleman studied the adoption Of tetracycline by physicians.
Data was collected 15 monthsafter the drug was released.
85% of all physicians in 4 small Mid-western cities were interviewed.
The dependent variable (what He was trying to explain) was time of adoption (when the doctors first started prescribing tetracycline)
% of D
octors Using Tetracycline
Time (Months after release date of Tetracycline)
Never Chosen
Examples
3. Network ties and survival amongst 25 clothing manufacturers in NYC(Uzzi 1997)
The right mix of embedded and arm’s length ties were also seen to have an effect on the success and survival of clothing businesses in New York City.
Embedded ties quickly transmit rich information about markets therefore they improve survival.
This only happens up to a point, however, as embedded ties don’t give access to a wide variety of information.
FMBECS

72
Examples:
2. Network Ties and Bank Loans: (Uzzi 2000)Organizations seeking loans from banks did the best when they had a
mix of embedded and arm’s length network connections.
Embedded Ties(Close Relationships)
• Trust• Fine grained information transfer• Joint problem solving
arrangements
• Problem: Lack of information flowfrom outside of the network
Example: Buying a used car
Arm’s Length Ties(Weak Relationships)
• Reduced “cost” of maintainingthe relationship
• Diverse information
• Problem: Lack of detailedinformation and trust
Example: Finding a job
FMBECS
FMBECS
(Uzzi 1997)
FMBECS
(Uzzi 2000)
Constructing (Knitting) a Network
Based on social network studies how can a successful network be created?
1. Know the network. Improved connectivity starts with a map.
Who are playing leadership roles in the community? Who is not, but should be?Who are the experts in this area?Who are the sensei that others ask for advice?Which businesses already have the right structure of embedded and arm’s length ties?Where are the key connections missing?
2. Knit the network through four stages. (Krebs, Holley 2002)
FMBECS
FMBECS
Knitting a Network (Stage 1): Scattered Clusters (Krebs 2002)
Knitting a Network (Stage 4): Core/Periphery Network
FMBECS
(Krebs 2002)

73
Knitting a Network (Stage 2): Single Hub and Spoke
FMBECS
(Krebs 2002)
Methodology: Ego Network Data and Snowball Sampling of Local Forest Owners
1st Order: Ego networks consist of a focal actor (ego) and the actors to whom ego is directly connected (alters), plus the ties among the alters.
2nd Order: Each alter in an ego network has his/her own network of connections.
Within the scope of this study forest owners may be the onlystakeholders who can be surveyed. Ego networks are goodat measuring social capital, but not in mapping a complete, closed network.
FMBECS
Knitting a Network (Stage 3): Multi Hub Small World
FMBECS
Embedded Ties
Arm’s Length Ties
(Krebs 2002)
“Connect through your similarity and innovate through your diversity”
?
?
??
?
?
?
FMBECS
Order 1: Ego and alters
Order 2: Alters’ Networks
Who are the Stakeholders?
Local and National
Government
Forest Owners/
Managers/Farmers
SocialMovements/
NGOsLocal Public
University/Researchers
Other Industries
ForestIndustries
Tourism
?
FMBECS
What are the Connections?
Vignette Survey Study (Yasushi Shogi):
What influences consumer WTP?
Social Network Analysis:How can social networks influence industrial WTP?
Does forest owner embeddedness influence their perception of biomass energyproduction?

74
Making Case Studies Comparable
STEPHAN SCHOLZ, JOHN SONNETT
Qualitative Comparative Analysis:An Introduction
Binary and Fuzzy Set Data
In Boolean algebra there are two conditional states, presence (1) or absence (0).
In most comparative case studies the phenomena being studied are not arrayed on a continuous interval scale, therefore not much information is lost in such a coding scheme. Even so, recent reformulations by Ragin have made QCA more fine grained by incorporating fuzzy sets in the creation of fs/QCA.
Fuzzy sets refer to a labeling scheme that is ordinal, such that:
0 refers to ‘not in this set’low numbers below .5 refer to ‘not really in this set’0.5 represents neither in nor out of the set;higher numbers represent ‘more in than out of this set’1.0 refers to ‘fully in this set’.
Introduction to QCAQCA was developed for the analysis of small and moderate N (5 – 50) data sets.
Social scientists tend to avoid work in this realm in favor of either qualitative analyses of a few cases or quantitative work on a very large number of cases.
Charles Ragin’s method of qualitative comparative analysis addressesthis gap by formalizing comparative research through the generalization of qualitative case study methods. This process focuses on the discovery of necessary and sufficient conditions for producing particular outcomes.
In set theory, variables are conceived of in terms of set membership, and relationships between sets are modeled as combinations of conditions.
Truth Tables
Once the data have been coded into nominal (or interval) scale variables they can be sorted into different combinations of values on the independent variables. Each combination of values on the independent variables is represented as one row in a truth table.
Each row can then be assigned a set membership score on the outcome based on the scores of the cases that share that particular configuration of input variables.
Truth tables have as many rows as there are logically possiblecombinations of values on the causal variables. If there are four binary independent variables, for example, the truth table will contain 16 rows, one for each possible combination of presence/absence independent variables.

75
Traditional Statistics
Traditional statistical research is different because it looks for the net effects of variables across a large set of cases. It does not consider how variables might combine into unique configurations of sufficiency and necessity.
Ragin advises gathering a small N of cases, comparing them deliberately using various types of evidence, summarizing the intermediate results in a table, reducing the table using Boolean logic, iterating, and then drawing conclusions. He doesn’t give a specific protocol but this is a summary of how one might proceed.
Truth Tables
611111
800111
511011
1100011
1301101
1000101
411001
310001
511110
710110
701010
910010
501100
810100
401000
600000
Number of Instances
OutcomeY
ConditionX1 X2 X3 X4
Boolean Minimization:Military Regime Failure
31111
11110
11101
21011
11100
31010
21001
90000
Number of Instances
Regime Failure
F
Condition
A B C
A = Conflict between older and younger military officersB = Death of a powerful dictatorC = CIA dissatisfaction with the regime
SUCCES = CORP LEFT PROP +(AT, DK, FI, DE, NO, SE, CH)
GDP SOS LEFT PROP +(BE)
GDP SOS CORP PROP(NL)
= PROP(CORP LEFT + GDP SOS LEFT + GDP SOS CORP)
Boolean MinimizationIn the above example the outcome of regime failure can be captured by thestatement:
F = Abc + aBc + abC + ABc + AbC + aBC + ABC
Where ADDITION implies logical OR and MULTIPLICATION implies logical AND.
This equation can be minimized by combining and eliminating redundantexpressions. For example:
Abc combines with ABc to produce AcAbC combines with ABC to produce AC
Ac combine with AC to produce A
Finally we are left with F = A + B + C. A,B and C are all sufficient causes but none of them are necessary.

76
1 NL110111
3 (DK, West DE, SW)
111111
1 BE111011
1 AT111110
1 CH111101
1 FI111100
1 IR010010
1 FR000011
1 IT010000
1 UK001000
2 (CAN, USA)000001
3 (JP, NZ, AUS)000000
InstancesSUCCESPROPLEFTCORPSOCSPNB
(Spreitzer, Yamasaki 2004)(Redding, Viterna)
Hypothetical QCA of Forest Owners in Furano
010007
000106
111005
101114
110013
000102
101111
Outcome(Willingness to
Innovate)
Ecological Capital(Capability)
Cultural Capital(Perception of government)
EconomicCapital(Income)
Social Capital(Advice, Trust)
Stakeholders(Forest Owners)
O = S + C
Some Final Thoughts for the GCP
Within cases of regional carbon management such as Hokkaido QCA/Network visualization can be used to present information in more accessible ways.
Across cases (RC6 framework) comparisons on relevant outcomes such as carbon footprint intensity or community development failure can be made using QCA.
These cases can be drawn from current studies or from a coding of historical and archival data (Oklahoma Dust Bowl ?).

77
Network Views of Cultural Content and Media Analysis ELIZABETH MALONE
Biographical Statement
Elizabeth L. Malone’s research interests focus on developing studies that integrate disparate worldviews, data sources, and scientific approaches, particularly global change issues. Social network analysis is one such integrating methodology, applied in her dissertation to link participants in the global climate change debate. Her work has contributed to linkages among global environmental change, globalization, economic development, equity, and sustainability. She edited, with Steve Rayner, Human Choice and Climate Change, a four-volume assessment of social science research relevant to global climate change, jointly authoring, with Steve Rayner, the summary volume and an invited paper for Nature on the conclusions. Malone has participated in the assessment activities of the Intergovernmental Panel on Climate Change, most recently giving a keynote address to a joint meeting of authors from Working Groups II and III. She earned a Ph.D. in Sociology at the University of Maryland.
Pre-Workshop Thought Piece
Representing Change in Social Networks Data analysis approaches have tended toward revealing eigenvector characteristics such as the centrality of actors, the between-ness of cliques and actors, and so on. Average path length, density, and other values help to describe networks in mathematical ways. These are largely static and descriptive analyses. Similarly, the number of ties and even comparative roles of actors do not provide tools to analyze changes in links or in the social network. “Event” ties, as opposed to affiliation ties (e.g., “likes” or “gets advice from”) exhibit the same static-ness and raise other questions. Can we infer from the presence of people at the same parties or on the same corporate boards that they are linked by these “events” and thus constitute a social network? If more events occur, can we conclude that the ties have changed? In short, social network analysis lacks approaches for analyzing and strategizing change. We need to use SNA tools in different ways in order to help increase the issue relevance (and, possibly the policy relevance) of social network analysis. An examination of how people communicate in a debate can reveal bases for social network links instead of the links themselves. For example, if two politicians favor a policy and use the same reasons for favoring it, their agreement on these two issues may be considered at least potential social links. The “set” of conservative policymakers in a legislature could be considered a social network based on the set of agreed assumptions about how government should work and policy preferences. Similarly, within the scientific community the scholars who use a particular methodology (e.g., social network analysis or comparative historical

78
analysis) or work on an issue (e.g., globalization, racism, climate change) often link themselves via conferences, sections within professional organizations, and so on. But even those not linked via explicit events or organizations have potential links to scholars who use the methodology or focus on the problem of interest. As people take part in a conversation or debate, certain features of their arguments could be the basis for links, things-in-common that could lead to agreements among them. The professions or professional status of social network members could provide such a basis; two chemists, for example, share at least a partial vocabulary and educational background. Or debaters may agree that only empirical evidence (to take one example) can be brought to bear on a certain issue. People may hold beliefs in common about how the world is or ought to be. Finally, they may propose, for the same or for different reasons, similar courses of action. Examining a set of rhetorical elements like these reveals the bases for agreements or disagreements among people who are engaged in an issue such as regional carbon management. This approach, then, provides a way to see partial and potential agreements and to define changes that could be attempted to come to agreement – in short, to define mechanisms of change among social networks. People with one or two links can use those as springboards toward agreement. Although participants in the climate change debate tend to have more links with people who make similar arguments, they also exhibit multiple ties with rhetors who make dissenting arguments. Social network analysis can help identify things-in-common among debaters and help in developing strategies for coming to agreement.
Presentation Summary
RHETORICAL ELEMENTS AS SOCIAL NETWORK LINKS AND POTENTIAL PATHWAYS OF CHANGE
Liz Malone (Reporter: Catherine Dibble)
Main Points • Search for common ground in the rhetorical debates related to climate change. • To what extent can social network analysis across families of climate change arguments
provide insights for effective understanding and constructive agreements? • Method: select 100 documents, extract key words and phrases, group into 11 families of
arguments based upon within versus across variation. Testable Hypotheses Is it possible to identify “core” versus “periphery” arguments? Does the social network analysis of proponents of the various arguments indicate key areas of understanding that could be used to provide bridges for communication?

79
Implications for URCM Networks Such analyses may provide insights regarding common bases for core arguments, in order to facilitate the development of effective policy agreements for local, regional, and global carbon management. Caniglia ⎯ Arguments may either enable or constrain effective agreements. Core arguments may constrain rather than enable. Ask: “where would be the constraints to [forming] coalition[s]” Malone ⎯ Helpful for people not to “black box” (verb) other families of arguments. Helpful for people to see whatever commonality they may share.
Rhetorical Elements as Social Network Links and Potential
Pathways of ChangeElizabeth L. Malone
Networks & Regional Carbon ManagementTsukuba, Japan
April 2005
Methods
• Use of 100 documents to identify principal argument “families” and rhetorical features of the arguments
• Social network analysis to examine how debaters are linked by rhetorical elements
The question
Do the rhetorical elements of the arguments in the climate change debate (considered as social network links) provide bases for potential agreements?
“Families” of arguments1. “No Problem!”2. “Climate Change Could Be Good for You”3. “Science Provides Knowledge about Climate
Change”4-9. “More Modernization Is the Cure” (five
different families – focus on politics, energy system, mitigation, adaptation, economics, both mitigation and adaptation)
10. “Inequality Is the Problem”11. “Rift with Nature”

80
Points in this argument• The climate change debate constitutes a social
network.• “Event” links may be cultural (discursive).• An argument may constitute a subnetwork.• Links within and across subnetworks may be
rhetorical:– A shared basis for authority– Agreement on what evidence counts– Shared view of nature and human-nature relationship– Agreement on specific actions to take.
Analysis• The major role of science in raising the issue, analyzing
causes and impacts, etc. affects questions of authority, evidence, and worldview.
• Worldview may be the strong link in argument families; other rhetorical elements can be considered weak links.
• Focusing on ties formed by proposed actions may be a good strategy for coming to (or toward) agreement.
• The worldview that humans can manage nature, devise “green” technologies, and address negative consequences is in the mainstream of the debate. (Can voices who don’t hold this view be heard?)
Example: Family 5
TECMODDAT, THENGOENVTECMODSCT, PANGOV--
EMI, TEC, SUS, FND, RCH
NATSCTNGO--
TECMODDAT, PIXRESENVEMI, TECMODCAS, DATGOV--
EMI, TEC, ETR, EQU, SUS
ECN, PLYPANNGOSCI, ENVEMI, KYOMODDATNGOENVNRGECOPANGOVSCI
TEC, RCH, NEG
MODSCT, DATRESSCI
EDU, NRGMODDATGOV, INDPOL, TRAActionsWorldviewEvidence TypesOrganizationAuthor
Findings (general)
• Families have many elements in common, but much in-family divergence exists, also.
• The climate change debate space is a dense social network, with many ties across families.
Example: rhetorical links Ashford Member of Family 3, “Science Provides Knowledge about
Climate Change” (total of 9 members)Links with Family 3 members: scientist (6 members total);
uses data and models as evidence (5 members total); and advocates education, monitoring, and research (7 members advocate one or more of these).
Links outside Family 3: 36 other scientists (all other families); 43 uses of data/models (all other families) as evidence; 20 instances of one or more proposed actions that Ashford also proposes (eight other families)
An individual-level analysisAshford, who advocates non-aggressive and relatively low-
cost actions, may use weak links to• Explicitly associate his arguments with those made in
other families – e.g., pointing out the need for education, monitoring, and research to accomplish the more aggressive goals of the “More Modernization” arguments
• Show how his evidence, other types of evidence, and results from other models/data can reinforce each other
• Provide additional arguments about the need to study and monitor in order to establish if something has happened and, if so, whether or not that something can be defined as climate change.

81
JOHN SONNETT
Biographical Statement
I am currently a PhD Candidate (degree expected November 2005) in the Department of Sociology at the University of Arizona. I hold an MA in Sociology from the University of Arizona and a BA in Russian Studies from the University of Virginia. My primary interests are cultural sociology, research methods, environmental sociology, globalization-political economy, and science studies. In my research I have sought to combine network and comparative methods to help generate new insight on cultural phenomena.
In my dissertation, I am exploring the ways in which diverse social actors construct knowledge about global climate change across media arenas, including political and popular news, professional science and science popularization, environmental magazines, and business and petroleum industry journals. I employ a mix of quantitative and qualitative methods, including Qualitative Comparative Analysis and Correspondence Analysis, which enable me to map macro-structures of discourse and link these patterns to individual texts. I presented a draft chapter titled “Fear, Uncertainty, and Risk: Boundary Concepts in Environmental Discourse” at the 2004 annual meeting of the American Sociological Association and this paper is currently in preparation for journal submission. In this paper, I show how conceptualizations of risk differ systematically across media arenas and how this variation affects the definition of the problem, for example, “global warming” corresponds to political and economic fears whereas “climate change” corresponds to scientific assessments of uncertain risk.
I am also currently conducting research with an interdisciplinary team at the University of Arizona’s Institute for the Study of Planet Earth. A paper currently under review, “Discursive Framing of Drought in the Desert Southwest,” compares newspaper reporting about drought in New Mexico and Arizona. In this paper, we show variations in the temporal and spatial scales in which drought is conceptualized and link these variations to the physical and political contexts of the two states. We use correspondence analysis to show how discourses changed over a three-year period of deepening drought. A second study, currently in progress, examines discourses about wildfire perception and policy over a five-year period. In this study we link discourses in New Mexico and Arizona with national level discourse as represented in the New York Times and the Los Angeles Times.
In addition to my research on environmental issues, I have also published several papers on culture, methods, and political economy. A sole-authored article in Poetics: Journal of Empirical Research on Culture, the Media and the Arts examines intersections of symbolic boundaries around musical tastes. In this paper I describe the diversity of taste patterns and find that when standard sociodemographic variables are measured as configurations they are poor predictors of these patterns. A chapter with Charles Ragin (forthcoming in Vergleichen in der Politikwissenschaft, Sabine Kropp and Michael Minkenberg, eds.) examines limited diversity and counterfactual cases in comparative analysis. We show how the clustering of empirical cases can be measured with the configurational approach of Qualitative Comparative Analysis and how counterfactual cases can be systematically identified and

82
incorporated into analyses with this method. A paper with Albert Bergesen in American Behavioral Scientist maps the regional and industrial structure of Global 500 corporations. We show the development of the tri-polar world economy since the 1950s and use network analysis to map competition between the U.S., Europe, and Asia in finance, production, and service sectors, providing the basis for theorizing the rise of Asian capitalism within the context of world systems theory.
Pre-Workshop Thought Piece
Configuring Entities in Social Network Analysis Conventional analysis of one-mode social networks examines the complexity of relations among an array of actors. This complexity includes patterns in network ties beyond simple direct connections between nodes, and may include the analysis of several types of relations within a single network. Recent work in cultural analysis has built on this model to examine two-mode networks, relating heterogeneous entities such as actors and cultural categories. This work has used lattices to show logical relations between the two types of entities, such as between categories and practices in social welfare relief (Mohr & Duquenne 1997), and has been extended to tripartite lattices such as of actors, projects, and events (Mische & Pattison 2000). While current approaches to social network analysis have expanded the types of relations considered, they tend to retain a unidimensional conception of network entities or nodes. One promising direction for expanding the conception of entities in network analysis is through the incorporation of the combinatorial logic of Qualitative Comparative Analysis (QCA; Ragin 1987; Ragin & Sonnett 2004). In QCA, empirical cases are described by configurations of conditions measured as sets. Cases are coded by whether they display a relevant condition (e.g. “1”) or do not (e.g. “0”), and can be coded within this range for fuzzy-set analysis. The goal of the analysis is to identify combinations of conditions which lead to an outcome of interest, formalizing the analytic strategy of case-oriented qualitative research. Several points of contact have been established between QCA and social network analysis (Spreitzer & Yamasaki 2004), including the use of network attributes as causal conditions and the decomposition of QCA results into a one-mode network, where the tie between two conditions is the number of times those two conditions co-occur across configurations which lead to the outcome. Another approach uses two-mode network analysis to represent relations between causal configurations and multiple outcomes, such as the relationships between configurations of sociodemographic characteristics and musical tastes (Sonnett 2004). In this approach, both cases and outcomes can be represented by combinations of conditions. This approach complexifies network entities while retaining the simplicity of conventional two-mode network analysis, enabling the use of methods such as correspondence analysis for visually representing network structure. This approach to network analysis has potential application in policy implementation because it can be used to represent complex data in a relatively simple relational model. Such models

83
might be useful for introducing a degree of reflexivity in stakeholder discussions, for example by visually representing relations between configurations of stakeholder conditions (i.e., economic resources, social network positions) and dimensions of willingness to pay or participate in policy implementation. Representing actors as configurations of conditions would help to specify the relevant characteristics of actors which link them to variations in perceptions. Mohr, John W. and Vincent Duquenne. 1997. “The Duality of Culture and Practice: Poverty Relief in New York City, 1888-1917.” Theory and Society, 26/2-3:305-356. Ragin, Charles C. 1987. The Comparative Method: Moving Beyond Qualitative and Quantitative Strategies. Berkeley: University of California Press. Ragin, Charles C. and John Sonnett. 2004. “Between Complexity and Parsimony: Limited Diversity, Counterfactual Cases, and Comparative Analysis.” COMPASS Working Paper 2004-23. Sonnett, John. 2004. “Musical Boundaries: Intersections of form and content.” Poetics, 32/3-4:247-264. Spreitzer, Astrid and Sakura Yamasaki. 2004. “Beyond methodological tenets: The worlds of QCA and SNA and their benefit for policy analysis.” COMPASS Working Paper 2004-27, www.compasss.org.
Presentation Summary
MAPPING GLOBAL CLIMATE CHANGE IN MULTIPLE MEDIA ARENAS John Sonnett
(Reporter: Catherine Dibble) Main Points
Uses keywords from articles in Scientific, Political/Popular, Environmental Movement, and Oil Industry literatures to map onto axes of “risk” and “uncertainty.” Axes in his diagrams are really diagonal in his diagram, not orthogonal to the text. Risk (which might also be called fear) increases from NW to SE, Uncertainty increases from NE to SW.
John Sonnett

84
Testable Hypotheses When correspondence analysis is applied to the distribution of aggregated keyword frequencies mapped onto subspaces, which dimensions account for the greatest % of variance? (“Risk” and “Uncertainty” accounted for 45% of overall variance.) Implications for URCM Networks Similar to Malone’s talk: understanding families of arguments may provide insights to support understanding, communication, and effective agreements. Caveat: keywords have different meanings in different contexts, and combinations of keywords within specific articles may be important.
Mapping Global Climate Change in Multiple Media Arenas
John SonnettDepartment of Sociology
University of ArizonaTucson, AZ 82705 USA
Prepared for the Global Carbon Project Conference onNetworks and Regional Carbon Management, April 2005,
Session on “Network Views of Cultural Content and Media Analysis”
Risk: Between Uncertainty and Fear
Networks and Media Analysis
• How to represent fields of discourse using SNA?—relational approach
• How to represent discursive content of specific texts?—configurational approach
• How is the risk of global climate change conceptualized across various media arenas?
Methods
• Discursive fields can be mapped through keywords– Actor Network Theory, Concept mapping
• Correspondence Analysis—relational• Qualitative Comparative Analysis—configurational

85
Media Arenas
• Scientific• Political/popular• Environmental movement• Oil Industry
DataU.S. periodicals and magazines, 1997-2002
Online databases: Lexis-Nexis,InfoTrac OneFile, EbscoHost EJS
Keywords:“global warming*”, “climate change*”
also searched“greenhouse effect*”, “greenhouse gas*”
BusWk EarthIsJEmag FortuneNation NatRev New sWOilGasJPNAS SciAmeScienceSciNewTimeMaWorldOclimate change 35 115 54 13 34 11 72 288 139 51 232 84 51 26global w arming 163 155 98 51 105 67 150 230 62 62 146 91 155 34
fear 32 27 22 15 36 16 34 44 11 15 13 10 41 3uncertain 18 3 8 3 10 6 13 72 65 21 119 16 14 10
risk 36 51 28 20 31 19 31 60 39 15 33 25 44 8alarm 8 20 13 7 15 11 13 40 7 7 12 6 11 4
ambivalen 1 0 1 0 4 2 3 1 0 0 0 0 2 0answ er 17 23 25 17 37 19 32 47 33 25 41 20 36 11anticipat 6 8 8 5 9 3 4 40 29 10 18 13 10 2anxiety 4 0 1 1 10 4 4 10 1 1 0 3 6 0
aw ful 1 2 0 1 3 1 1 0 1 2 0 4 2 0bad 29 27 33 17 39 31 62 34 22 12 24 12 47 6
believ 49 56 51 28 55 40 66 111 43 28 61 20 66 15bet 9 6 4 10 4 8 9 3 0 2 3 2 7 1
cautio 15 10 12 8 20 8 7 48 21 11 40 17 20 2certain 42 24 47 25 47 32 47 154 95 44 137 38 53 18
chance 32 12 23 11 32 7 35 46 19 10 30 13 41 5conclu 32 39 26 8 22 17 34 91 100 30 105 44 25 9confid 17 8 7 9 12 14 17 21 29 10 49 6 21 4credib 5 10 15 6 22 6 15 23 10 9 21 4 14 1
danger 26 65 52 21 45 26 46 31 21 28 23 13 54 6decide 38 36 33 27 55 31 65 98 26 19 41 23 64 12defen 33 48 38 16 47 35 41 43 17 14 26 11 48 5
distress 1 2 0 1 2 2 2 4 2 0 0 1 7 1doubt 19 15 15 10 29 27 39 63 23 15 45 10 26 7
eviden 31 34 30 9 33 27 27 68 120 47 134 45 37 12expect 52 52 40 23 45 21 68 168 100 37 130 40 66 20
Table 1 (excerpt). Number of Articles containing Keywords, 1997-2002
table continued…
Risk is Determined:
Wager (vt.) “To stake or hazard (something of value) on the issue of an uncertain event or on some question to be decided, to bet.”
Risk is Constructed:
Precaution (n.) “As a quality or mode of action: Caution exercised beforehand to provide againstmischief or secure good results: prudent foresight.”
(Oxford English Dictionary)

86
Figure 1. The Field of Risk Discourse for Global Climate Change, 1997-2002
“Evidence”• Denying uncertainty makes life so much easier, as many have
discovered when it comes to climate change. Between skeptics' insistence that global warming is just hot air and radical environmentalists' advice to start selling the beachfront property, responses to climate change tend to be predicated on claims of absolute knowledge. Who wants to deal with the messy reality? There is plenty of evidence that temperatures are rising and will continue to do so but lots of uncertainty about the details and amount of future change. Scientific American, October 29, 2001.
• …the Administration has given no hint that it perceives global warming as a serious problem. And such a stance carries a risk: While some uncertainty remains about the consequences of global warming, the overwhelming evidence suggests that the phenomenon is real. Theprobusiness Bush Administration should listen a little more closely to what some businesses are actually saying. Business Week, April 23, 2001.
Confidence, Evidence, Probability Bet, Trouble, WorryEnvrMvmt Industry Politics Science EnvrMvmt Industry Politics Science
c.e.p 226 298 444 188 b.t.w 259 390 470 552c.e.P 26 54 94 80 b.t.W 25 35 137 39c.E.p 45 48 94 157 b.T.w 22 18 70 32c.E.P 14 24 48 124 b.T.W 10 2 46 13C.e.p 10 12 38 16 B.t.w 6 2 20 4C.e.P 0 5 30 13 B.t.W 2 1 15 2C.E.p 4 8 13 23 B.T.w 1 1 9 0C.E.P 1 0 9 42 B.T.W 1 0 3 1
Anticipat, Cautio, Expect Protect, Safe, SecurEnvrMvmt Industry Politics Science EnvrMvmt Industry Politics Science
a.c.e 219 217 436 276 p.sa.se 135 250 353 448a.c.E 71 147 224 224 p.sa.SE 11 49 75 19a.C.e 9 25 46 36 p.SA.se 22 28 51 37a.C.E 11 18 27 37 p.SA.SE 3 8 27 2A.c.e 4 15 13 20 P.sa.se 77 63 116 92A.c.E 10 20 19 34 P.sa.SE 15 22 65 11A.C.e 2 4 0 4 P.SA.se 41 17 45 23A.C.E 0 3 5 12 P.SA.SE 22 12 38 11
Table 2. Number of Articles with Configurations of Keywords in 4 Media Arenas
Figure 1. The Field of Risk Discourse for Global Climate Change, 1997-2002
Figure 2. Configurations of Keywords
Conclusions1) Naming the issue is framing the issue:
“Global Warming” is linked to fear of risk“Climate Change” is linked to uncertainty of risk
2) Conceptions of risk differentiate media arenas:Environmentalists and popular press differ on fear of riskOil industry and science differ on uncertainty of risk
3) Conceptualizing network nodes as configurations helps specify relations between keywords

87
Simulations, Modeling Network Dynamics CATHERINE DIBBLE
Biographical Statement
Catherine Dibble is an Assistant Professor in the Department of Geography at the University of Maryland. She uses her GeoGraph agent-based computational laboratory to model and optimize interventions for network-influenced processes such as epidemics of infectious diseases among highly mobile populations, long-run regional development and land-use changes, and social-ecological resilience at multiple scales. She has served on the International Steering Committee for the GeoComputation Conference Series since its inception in 1996, and has complementary expertise in network optimization, spatial evolutionary algorithms, and relevance filters. For 2005-2007, she will be serving on the US National Academies of Sciences (NAS) National Research Council (NRC) Committee on Organizational Models from Individuals to Societies. Her academic background includes graduate work in formal micro-economic theory and international trade theory, public finance, and game theory (especially axiomatic bargaining theory, a formal structure for evaluating fairness in resource allocation problems) in the Department of Economics at the University of Rochester. Professional experience includes computer science and many years as a professional software designer, developer, and software- development department director (simulations, executive information systems, and national and international software patents for analysis of healthcare providers). She attended the 1995 Santa Fe Institute Complex Systems Summer School, and holds an M.A. in Economic Theory from the University of Rochester and a Ph.D. in Geography from the University of California Santa Barbara.
Pre-Workshop Thought Piece
Network Simulation, Analysis, and Optimization
Agent-based computational laboratories offer virtual worlds where it is feasible, safe, and affordable for us to model and optimize dynamic processes on richly structured social, organizational, and geographic network landscapes. Laboratory simulations allow us to learn from our mistakes far sooner than we might otherwise learn the hard way via dire or irreversible consequences in the real world. Ideally, virtual worlds help us to discover and evaluate practices that foster effective social-ecological resilience at multiple scales; more quickly, more feasibly, and more thoroughly tested in the laboratory than would otherwise be possible. The crucial challenge is to improve methods for refining models and fully exploring their behavior, in order to ensure that the lessons we learn reflect pragmatic realities rather than merely artifacts of one model or set of simulation results versus another. We have been using several new network measures and simulation methods recently to evaluate the effects of organizational and geographic networks on dynamic social processes. We have some new methods related to search and optimization for simulation-based

88
scientific inference and practical policy, and for modeling and guiding social-environmental systems at multiple scales. Links: Dibble and Feldman (2004) http://jasss.soc.surrey.ac.uk/7/1/7.html Community of Science Profile http://myprofile.cos.com/cdibble
Presentation Summary
NETWORK SIMULATION, ANALYSIS, AND OPTIMIZATION Catherine Dibble
(Reporter: Stephan Scholz) Main Points
• How can we create general models that run histories of human and environmental interactions that optimize on some particular outcome?
• Genetic algorithms – optimization problems across space
and time can be run using evolutionary algorithms. Space and time cause problems for the evolution of expert systems, but genetic algorithms are able to compare space and time at any scale.
Catherine Dibble • One problem is how to optimize organization networks for gathering and diffusing
innovation. These two processes must be properly balanced. • SNA has generally been empirical whereas physics modeling creates synthetic
networks that can study processes based on perfect data and unlimited observations (runs).
• One of the interesting things to model is what happens to the evolution of a network when certain nodes are removed. This has applications in many realms from epidemiology networks in scale free networks with central hubs to policy formation on carbon mitigation. The point is to figure out the marginal contribution of different network components to outcomes or processes.
Testable Hypotheses What happens when certain countries or actors are removed from climate change policy networks? What happens to local environments based on social/economic/structural contexts?

89
Implications for URCM Networks One key issue is the costliness of conducting traditional SNA. Simulations have unlimited cases and can be used as hypothetical scenarios for comparison across real world cases. This is like developing a theory of gravity in a vacuum but then getting real world measurements that involve friction. Parsimonious and powerful presentation tools for policy makers. More complex modeling of agent behavior based on social network characteristics and not just rational agent assumptions. Regional modeling of social/economic contexts on environmental outcomes. Relevant Literature Dibble, Catherine. Beyond Data: Handling Spatial and Analytical Contexts with Genetics Based Machine Learning”. Chapter 3, Spatial Evolutionary Modeling, Oxford University Press, 2001.
Network Analysis, Process Simulation, and Optimization
Catherine Dibble, PhDUniversity of Maryland
Economics, Axiomatic Bargaining Theory, Spatial Networks, Agent-Based Computational
Laboratories, Epidemiology, Conflict, Sustainability, Spatial Evolutionary Algorithms
& Optimization
Two (New?) Classes of Network Measures
Recent synthesis and analysis of complex networks:small-world networks (Watts and Strogatz, Nature 1998)scale-free networks (Barábasi and Albert, Science 1999)network motifs (Milo et al. Science 2002)
Could benefit from complementary advancement in two classes of measures to quantify the contribution of specific local components to the overall structural characteristics of the network and to their effects on distributed network processes.
Consider two general classes of network measures for assigning specific values to the incremental (“marginal” per economic analysis of decisions at the margin; the last unit added or deleted) effects of specific components to network characteristics and to outcomes of processes operating on such networks.
Network Analysis, Simulation, and Optimization
Analysis – general classes of static and dynamic measures to incorporate context
Network Optimization for Effective Processes
GeoGraphs for Context and Dynamics
Optimization of Policies / Interventions based upon GeoGraphSimulation Outcomes
Post-scriptsMulti-scale integrated environmental / social science modelsMulti-scale games (national/global, meta-rules, equity/fairness)
Incremental Contributions of Components
Let G denote a connected network (graph). Let i denote a specific component of the network, such as a single node, link, or motif. Let G-i denote the network G from which component i has been removed. Let f denote a structural measure for the network, such as average shortest paths. Let h denote an outcome of a process defined on the network, such as the attack rate for an infectious disease, or forging effective GCP agreements.
Define the incremental (marginal) contribution of each local network component i
to network structural measures as mf(G, i) = f(G) – f(G-i)to outcomes of network processes as mh(G, i) = h(G) – h(G-i)
More generally, we could define similar measures for G–{i} sets of components. On social networks, G-{i} could represent removal of a family unit or other group. For multi-scale analysis {i} could represent removal (hence incremental importance) of a country’s participation.

90
Networks in Nature and Science
Small-world Networks
short-cuts shrivel the world
Watts and Strogatz Nature 1998
“Scale-Free” Networks
hubs play crucial roles
Barabási and Albert Science 1999
Genetic Algorithms and Process Simulations to EvolveOptimal Organizational Designs
Genetic Algorithm optimization of organizational network structure based on performance of multiple simulated processes.
Here, networks balance tradeoffs between diffusion and aggregation of information when maintenance of network links has a fixed cost.
“Organizational Structure and the Behavior of Firms: Implications for Integrated Assessment”
(DeCanio, Dibble, Amir-AtefiClimatic Change 2001)
Agent-Based
Agent is a generic term for any constituent entity whose behavior we wish to model, and for its representation within the model. For example, an agent may be, or may represent, a plant, an animal, or a person.Note! Even a group such as a family, a country, or a corporation may be regarded as a behavioral agent for purposes of understanding a given system, depending upon the model’s scale and degree of generalization.Agent-based models are also called individual-based models, especially in ecology. But we mean the term to be more general than individuals.
Multi-Scale Synthetic and Remote Sensing GeoGraph
Simulation Landscapes
Computational Laboratories
We define a computational laboratory as a well-specified agent-based simulation model coupled with complementary search and optimization tools, careful experimental design, and thorough testing and risk analysis.Yet the usefulness of agent-based models extends beyond formal laboratory experiments:
to play with representations and dynamic behavior of a system for both positive and normative research; to compress time and space and support omniscient data collection in order to observe surprising phenomena; to refine the model of the system or problem;and to develop, test, and refine integrated normative policies.
Optimizing Interventionsfor Controlling Epidemics
Run many GeoGraph simulations (“epidemic histories”) to evaluate each intervention.
1. A Genetic Algorithm (GA) evolves highly effective interventions, based on simulation results.
2. GA then assists with risk analysis by seeking best-case and worst-case outcomes for each of the best interventions.
Genetic Algorithm
I I I I I I I I I I I I I I
Intervention: types of control measures and geographic deployment of resources for each.

91
The GeoGraph 3D Agent-Based Computational Laboratory (Univ of Maryland)
A general purpose computational laboratory for modeling:heterogeneous mobile agentson richly-structured network landscapesat all scales from buildings to global networks of citieseither synthetic landscapes or real-world GIS / RS landscapesnetwork and/or raster
Practical Relevance and Current ResearchSubstantive Research
NIH (MIDAS) Controlling Pandemics
ONR Controlling Civil Violence
EPA Long Run Demographics & Remediating Inequality
Methodological Advances
Synthetic versus GIS Landscapes
Rugged Natural Terrain & RS Data
Vegetation Models (trees (re)grow)
Group Dynamics (flocking, panic)
Genetic Algorithm Optimization of Interventions and Risks
JOSEPH CABRERA
Biographical Statement
I received a BA in Social Ecology from the University of California, Irvine in 1997. I then received an MA in Urban Planning from the City University of New York, Hunter College in 2000 followed by an MA in Sociology from the University of Arizona in 2002. I am now in the beginning stages of my dissertation planning and I expect to complete the Ph.D. in May of 2007. My Master’s thesis was a social psychological study of trust development. After beginning my graduate program in the area of social psychology I have since moved into the area of network analysis and the study of how networks effect nonprofits and other organizations that work with nonprofits. I am especially interested in how organizations network with one another to achieve successful cooperative outcomes. I have also just begun working with MATLAB to create simple computer simulated models of network integration.
Pre-Workshop Thought Piece
I am interested in studying the effects of inter-organizational ties on community service provision systems. Specifically, my work examines how ties between organizations working in juvenile rehabilitation systems (within a single community) can be structured to more successfully provide rehabilitation services to juvenile offenders. This problem is closely related to studies conducted in the areas of common resource properties and social dilemmas, in which the goal is to understand how groups with no centralized authority can effectively cooperate to solve public goods problems. There have been very few studies examining inter-organizational effectiveness, these include (Lehman et al. 1994, Morrissey et al. 1994) and an informative study by Provan and Milward (1995) that examined systems of organizations working to provide mental health services in

92
four U.S. cities. Using a rich network and qualitative dataset Provan and Milward formulated what they call a “preliminary” theory of inter-organizational network effectiveness. Their theory makes a great contribution to understanding how network structures and contexts influence network effectiveness. Four propositions illuminate the relationship between inter-organizational systems and the effectiveness of outcomes. Network effectiveness is improved (1) as network integration (i.e. interconnectedness) increases, but only when integration is achieved through centralization of the network, (2) when mechanisms of external control are direct and not fragmented—thus, government funding is limited to one core agency that then disperses funds throughout the network as needed, (3) when networks operate in the context of system stability—thus, systems in which relationships are well established and understood, and (4) when networks operate in the context of higher levels of system-wide resources, such as external funding from the government or international agencies.
The Provan and Milward article provides a wonderful point to begin formulating a better understanding of how system interconnectedness and interorganizational networks effect community outcomes in service provision. My work seeks to test these findings in a different network setting (juvenile rehabilitation) and also to integrate findings from the common resource property literature into the model.
Presentation Summary
THE ORIGINS OF NETWORK INTEGRATION: A SIMULATION STUDY Joseph Cabrera
(Reporter: Stephan Scholz) Main Points
• How can we use simulations to model inter-organizational effectiveness? For example, the recent U.S. Olympic basketball team, although comprised of superstars, was ineffective due to lack of network cohesiveness. Joseph’s interests are in service implementation networks that allow organizations to effectively treat mental health patients.
• Effectiveness is affected by monitoring and
sanctioning or the creation of embedded networks. Embedded networks are the result of events that affiliate actors to each other.
Joseph Cabrera

93
• Joseph simulates weak link connections between organizations and subsequent integration. Organization size doesn’t effect integration. Memory capacity is significant and negatively related.
• Cultural complexity (increasing facts) doubles integration time and therefore is also negatively related.
• As organizations become more complex and have more memory it takes longer to integrate.
Testable Hypotheses Which method of reducing transaction costs is more effective: informal, embedded networks or institutionalized monitoring and sanctions? Can this question be modeled with regard to carbon footprint outcomes? Implication for URCM Networks Perhaps the creation of affiliational events or organizations will knit network actors into cohesive, de-carbonized economies. Small scale, regional development will have to involve cooperation and increases in social capital. Relevant Literature
Burt, Ronald. 1982. Toward a Structural Theory of Action. New York: Academic Press.
Burt, Ronald. 1987. “Social Contagion and Innovation: Cohesion Versus structural Equivalence.” American Journal of Sociology 92(6): 1287-1335. Burt, Ronald. 1993. “The Social Structure of Competition”. Pp. 65-103 in Explorations in Economic Sociology, edited by Richard Swedberg. New York: Sage.
Cultural Integration:Cultural Integration:
A Network Simulation Study
Joseph F. CabreraUniversity of Arizona
Provan & Milward Results
4 Key Findings:1. Network integration (density of ties) increases
network effectiveness (when centralized).2. System stability increases network effectiveness.3. Direct/focused external control (funding central
agency) increases network effectiveness.4. Funding Environment:
a) Resource-Scarce: network effectiveness (low-moderate)b) Resource-Rich: network effectiveness (low-high)

94
Research Question
How can people/organizations collaborate to achieve effective network outcomes?– Examples:
• Team Sports – Soccer, Basketball, Ultimate Frisbee
• Common Resource Property (Social Dilemmas)– Resources: water, ocean fish, and clean air
• Service Implementation Networks– Healthcare, Homeless Care, Elderly Care, Mental Health
Care, Juvenile Delinquency Rehabilitation
Provan & Milward Results
4 Key Findings:1. Network integration (density of ties) increases
network effectiveness (when centralized).2. System stability increases network effectiveness.3. Direct/focuses external control (funding central
agency) increases network effectiveness.4. Funding Environment:
a) Resource-Scarce: network effectiveness (low-moderate)b) Resource-Rich: network effectiveness (low-high)
A Preliminary Theory of Network Effectiveness1
Studies Mental Health Service Provision Networks (SPNs)4 Cities (Albuquerque, NM; Akron, OH; Providence, RI; Tucson, AZ)Each service implementation (SI) network had an average of 40 organizations.The four SI networks varied in size, funding, and network structures.
1. Provan & Milward. 1995. “A Preliminary Theory of Interorganizational Effectiveness: A Comparative Study of Four Community Health Systems” Administrative Science Quarterly, 40(1): 1-33.
Why does integration improve network effectiveness?
Common Resource Property literature: – Ostrom, Elinor. 1990. Governing the Comomns: The Evolution of Institutions for Collective
Action, New York, NY: Cambridge U. Press.
– Dawes, Orbell, & van de Kragt. 1986. American Political Science Review, 80: 1171-1185.– Farrell & Rabin. 1996. Journal of Economic Perspectives, 10: 103-118.– Frey and Bohnet. 1996. Journal of Political Philosophy, 4: 322-336.– Hackett, Schlager, & Walker. 1994. J. of Environ. Economics and Management, 27: 99-126.– Isaac & Walker. 1998. Economic Inquiry, 26: 585-608.– Miller, G. 1992. Managerial Dilemmas. The Pol. Econ. of Hierarchy. Cambridge U. Press. – Orbell, Dawes, & van de Kragt. 1990. Ethics, 100: 616-627.– Ostrom, et al. 1994. Rules, Games, and Common-Pool Resources. U. Michigan Press.– Salley, David. 1995. Rationality and Society, 7:58-92
Why does integration improve network effectiveness?
Fact Matrix
A B C D E1 1 1 12 1 13 1 1 14 1
Peop
le
Facts

95
Cultural Interaction Model
Adapted from K. Carley (1991)2
– Examined group stability.2. Carley, Kathleen. “A Theory of Group Stability”
American Sociological Review, 56(3): 331-354.
And Noah Mark (1998)3
– Examined origins of differentiation.3. Mark, Noah. “Beeyond Individual Differences: Social Differentiation from
First Principles” American Sociological Review, 63(3): 309-330.
Fact Matrix
A B C D E1 1 1 12 1 13 1 1 14 1
Peop
le
Facts
Culture as Information
Culture is understood as the type and amount of information known to a person or group.Assumption 1 of the model:
– Cultural similarity increases probability of interaction (homophily).
Fact Matrix
A B C D E1 1 1 12 1 13 1 1 14 1
Peop
le
Facts
Probability Matrix
1 2 3 41 0.50 0.33 0.17 0.002 0.50 0.50 0.00 0.003 0.20 0.00 0.60 0.204 0.00 0.00 0.50 0.50
People
Peop
le
The Model
4 Assumptions1. Homophily2. Interaction leads to exchange.
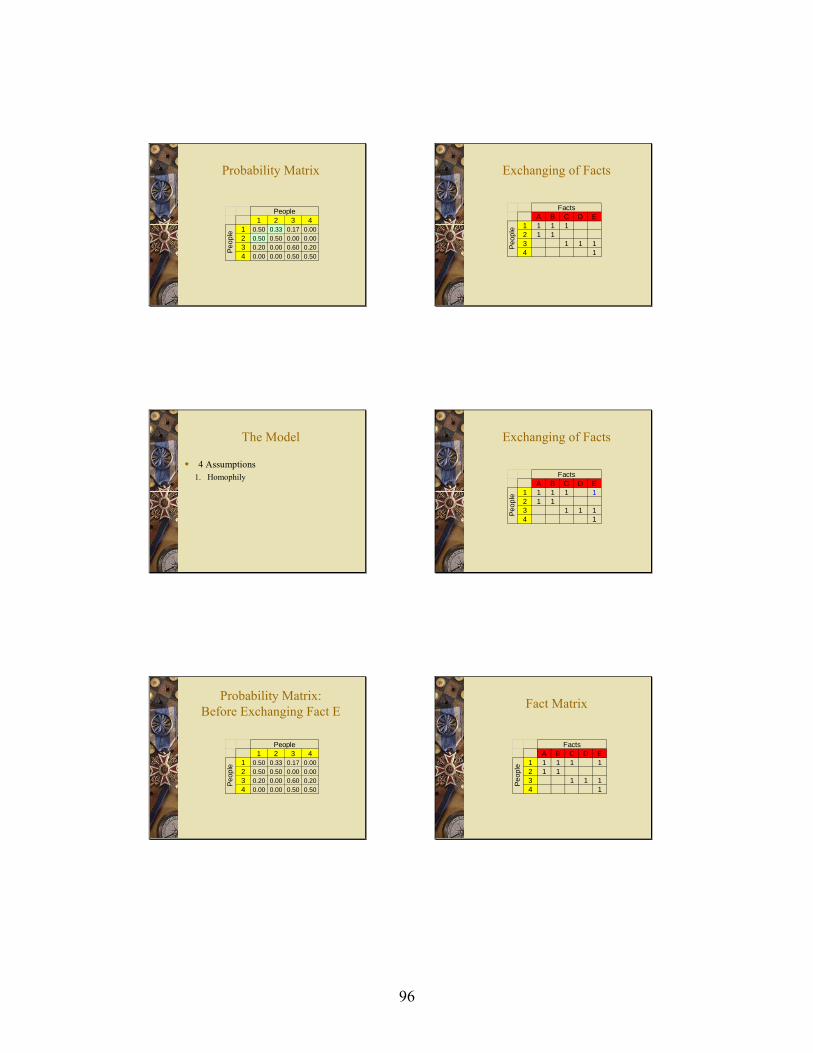
96
Probability Matrix
1 2 3 41 0.50 0.33 0.17 0.002 0.50 0.50 0.00 0.003 0.20 0.00 0.60 0.204 0.00 0.00 0.50 0.50
People
Peop
le
Exchanging of Facts
A B C D E1 1 1 12 1 13 1 1 14 1
Peop
le
Facts
The Model
4 Assumptions1. Homophily
Exchanging of Facts
A B C D E1 1 1 1 12 1 13 1 1 14 1
Peop
le
Facts
Probability Matrix:Before Exchanging Fact E
1 2 3 41 0.50 0.33 0.17 0.002 0.50 0.50 0.00 0.003 0.20 0.00 0.60 0.204 0.00 0.00 0.50 0.50
People
Peop
le
Fact Matrix
A B C D E1 1 1 1 12 1 13 1 1 14 1
Peop
le
Facts

97
Probability Matrix:Before Exchanging Fact E
1 2 3 41 0.44 0.22 0.22 0.112 0.50 0.50 0.00 0.003 0.33 0.00 0.50 0.174 0.33 0.00 0.33 0.33
People
Peop
le
Fact Matrix: Creating a Fact
A B C D E F1 1 1 1 1 12 1 13 1 1 1 14 1
Peop
le
Facts
The Model
4 Assumptions1. Homophily2. Interaction leads to exchange.3. Facts can be created through interaction.
The Model
4 Assumptions1. Homophily2. Interaction leads to exchange.3. Facts can be created through interaction.4. People forget facts.
Fact Matrix: Forgetting
A B C D E F1 1 1 1 1 12 1 13 1 1 1 14 1
Peop
le
Facts
Probability Matrix:After Person 1 Forgets Fact A
1 2 3 41 0.44 0.11 0.33 0.112 0.33 0.67 0.00 0.003 0.38 0.00 0.50 0.134 0.33 0.00 0.33 0.33
People
Peop
le

98
Fact Matrix: Forgetting
A B C D E F1 1 1 1 12 1 13 1 1 1 14 1
Peop
le
Facts
Initial ConditionsBasic groups:– Organization size = 10 people– Cultural complexity = 10 facts– Memory = 10 rounds– Only 2 organization are simulated.– Initially one person from one organization
shares one fact from the other organization.– All persons know all facts from their
organization and none from the other organization.
Probability Matrix:After Person 1 Forgets Fact A
1 2 3 41 0.44 0.11 0.33 0.112 0.33 0.67 0.00 0.003 0.38 0.00 0.50 0.134 0.33 0.00 0.33 0.33
People
Peop
le
Initial Conditions:Shared Facts
A B C D E F G H I J K L M N O P Q R S T1 1 1 1 1 1 1 1 1 1 12 1 1 1 1 1 1 1 1 1 13 1 1 1 1 1 1 1 1 1 14 1 1 1 1 1 1 1 1 1 15 1 1 1 1 1 1 1 1 1 16 1 1 1 1 1 1 1 1 1 17 1 1 1 1 1 1 1 1 1 18 1 1 1 1 1 1 1 1 1 19 1 1 1 1 1 1 1 1 1 110 1 1 1 1 1 1 1 1 1 111 1 1 1 1 1 1 1 1 1 112 1 1 1 1 1 1 1 1 1 113 1 1 1 1 1 1 1 1 1 114 1 1 1 1 1 1 1 1 1 115 1 1 1 1 1 1 1 1 1 116 1 1 1 1 1 1 1 1 1 117 1 1 1 1 1 1 1 1 1 118 1 1 1 1 1 1 1 1 1 119 1 1 1 1 1 1 1 1 1 120 1 1 1 1 1 1 1 1 1 1 1
Facts / Cultural Knowledge
Per
sons
(Gro
up 1
= 1
-10;
Gro
up 2
= 1
1-20
)
Initial Conditions: Probability of Interaction
0.099 0.099 0.099 0.099 0.099 0.099 0.099 0.099 0.099 0.099 0 0 0 0 0 0 0 0 0 0.0100.099 0.099 0.099 0.099 0.099 0.099 0.099 0.099 0.099 0.099 0 0 0 0 0 0 0 0 0 0.0100.099 0.099 0.099 0.099 0.099 0.099 0.099 0.099 0.099 0.099 0 0 0 0 0 0 0 0 0 0.0100.099 0.099 0.099 0.099 0.099 0.099 0.099 0.099 0.099 0.099 0 0 0 0 0 0 0 0 0 0.0100.099 0.099 0.099 0.099 0.099 0.099 0.099 0.099 0.099 0.099 0 0 0 0 0 0 0 0 0 0.0100.099 0.099 0.099 0.099 0.099 0.099 0.099 0.099 0.099 0.099 0 0 0 0 0 0 0 0 0 0.0100.099 0.099 0.099 0.099 0.099 0.099 0.099 0.099 0.099 0.099 0 0 0 0 0 0 0 0 0 0.0100.099 0.099 0.099 0.099 0.099 0.099 0.099 0.099 0.099 0.099 0 0 0 0 0 0 0 0 0 0.0100.099 0.099 0.099 0.099 0.099 0.099 0.099 0.099 0.099 0.099 0 0 0 0 0 0 0 0 0 0.0100.099 0.099 0.099 0.099 0.099 0.099 0.099 0.099 0.099 0.099 0 0 0 0 0 0 0 0 0 0.010
0 0 0 0 0 0 0 0 0 0 0.100 0.100 0.100 0.100 0.100 0.100 0.100 0.100 0.100 0.1000 0 0 0 0 0 0 0 0 0 0.100 0.100 0.100 0.100 0.100 0.100 0.100 0.100 0.100 0.1000 0 0 0 0 0 0 0 0 0 0.100 0.100 0.100 0.100 0.100 0.100 0.100 0.100 0.100 0.1000 0 0 0 0 0 0 0 0 0 0.100 0.100 0.100 0.100 0.100 0.100 0.100 0.100 0.100 0.1000 0 0 0 0 0 0 0 0 0 0.100 0.100 0.100 0.100 0.100 0.100 0.100 0.100 0.100 0.1000 0 0 0 0 0 0 0 0 0 0.100 0.100 0.100 0.100 0.100 0.100 0.100 0.100 0.100 0.1000 0 0 0 0 0 0 0 0 0 0.100 0.100 0.100 0.100 0.100 0.100 0.100 0.100 0.100 0.1000 0 0 0 0 0 0 0 0 0 0.100 0.100 0.100 0.100 0.100 0.100 0.100 0.100 0.100 0.1000 0 0 0 0 0 0 0 0 0 0.100 0.100 0.100 0.100 0.100 0.100 0.100 0.100 0.100 0.100
0.009 0.009 0.009 0.009 0.009 0.009 0.009 0.009 0.009 0.009 0.090 0.090 0.090 0.090 0.090 0.090 0.090 0.090 0.090 0.099
PERSONS
PE
RS
ON
S
Research Questions
1. How does group size effect integration?
2. How does memory capacity effect integration?
3. How does cultural complexity effect integration?

99
Trials
Each simulation consisted of 30 trials of complete integration. Complete integration occurs when people in one organization have the same probability of interaction with people in their own group as those in the other organization.
The Variables
Dependent Variable: – Time to Integration
Independent Variables:– Organization Size– Memory Capacity
• Number of rounds before fact forgotten.
– Cultural Complexity• Number of facts in an organization.
Probability of Interaction after Integration
1 2 3 4 5 6 7 8 9 10 11 12 13 14 15 16 17 18 19 201 0.05 0.05 0.05 0.05 0.05 0.05 0.05 0.05 0.05 0.05 0.05 0.05 0.05 0.05 0.05 0.05 0.05 0.05 0.05 0.052 0.05 0.05 0.05 0.05 0.05 0.05 0.05 0.05 0.05 0.05 0.05 0.05 0.05 0.05 0.05 0.05 0.05 0.05 0.05 0.053 0.05 0.05 0.05 0.05 0.05 0.05 0.05 0.05 0.05 0.05 0.05 0.05 0.05 0.05 0.05 0.05 0.05 0.05 0.05 0.054 0.05 0.05 0.05 0.05 0.05 0.05 0.05 0.05 0.05 0.05 0.05 0.05 0.05 0.05 0.05 0.05 0.05 0.05 0.05 0.055 0.05 0.05 0.05 0.05 0.05 0.05 0.05 0.05 0.05 0.05 0.05 0.05 0.05 0.05 0.05 0.05 0.05 0.05 0.05 0.056 0.05 0.05 0.05 0.05 0.05 0.05 0.05 0.05 0.05 0.05 0.05 0.05 0.05 0.05 0.05 0.05 0.05 0.05 0.05 0.057 0.05 0.05 0.05 0.05 0.05 0.05 0.05 0.05 0.05 0.05 0.05 0.05 0.05 0.05 0.05 0.05 0.05 0.05 0.05 0.058 0.05 0.05 0.05 0.05 0.05 0.05 0.05 0.05 0.05 0.05 0.05 0.05 0.05 0.05 0.05 0.05 0.05 0.05 0.05 0.059 0.05 0.05 0.05 0.05 0.05 0.05 0.05 0.05 0.05 0.05 0.05 0.05 0.05 0.05 0.05 0.05 0.05 0.05 0.05 0.05
10 0.05 0.05 0.05 0.05 0.05 0.05 0.05 0.05 0.05 0.05 0.05 0.05 0.05 0.05 0.05 0.05 0.05 0.05 0.05 0.0511 0.05 0.05 0.05 0.05 0.05 0.05 0.05 0.05 0.05 0.05 0.05 0.05 0.05 0.05 0.05 0.05 0.05 0.05 0.05 0.0512 0.05 0.05 0.05 0.05 0.05 0.05 0.05 0.05 0.05 0.05 0.05 0.05 0.05 0.05 0.05 0.05 0.05 0.05 0.05 0.0513 0.05 0.05 0.05 0.05 0.05 0.05 0.05 0.05 0.05 0.05 0.05 0.05 0.05 0.05 0.05 0.05 0.05 0.05 0.05 0.0514 0.05 0.05 0.05 0.05 0.05 0.05 0.05 0.05 0.05 0.05 0.05 0.05 0.05 0.05 0.05 0.05 0.05 0.05 0.05 0.0515 0.05 0.05 0.05 0.05 0.05 0.05 0.05 0.05 0.05 0.05 0.05 0.05 0.05 0.05 0.05 0.05 0.05 0.05 0.05 0.0516 0.05 0.05 0.05 0.05 0.05 0.05 0.05 0.05 0.05 0.05 0.05 0.05 0.05 0.05 0.05 0.05 0.05 0.05 0.05 0.0517 0.05 0.05 0.05 0.05 0.05 0.05 0.05 0.05 0.05 0.05 0.05 0.05 0.05 0.05 0.05 0.05 0.05 0.05 0.05 0.0518 0.05 0.05 0.05 0.05 0.05 0.05 0.05 0.05 0.05 0.05 0.05 0.05 0.05 0.05 0.05 0.05 0.05 0.05 0.05 0.0519 0.05 0.05 0.05 0.05 0.05 0.05 0.05 0.05 0.05 0.05 0.05 0.05 0.05 0.05 0.05 0.05 0.05 0.05 0.05 0.0520 0.05 0.05 0.05 0.05 0.05 0.05 0.05 0.05 0.05 0.05 0.05 0.05 0.05 0.05 0.05 0.05 0.05 0.05 0.05 0.05
PERSONS
PE
RS
ON
S
Results: Organization SizeGraph
Integration by Group Size
30.2
33.434.3
40.0
0.0
5.0
10.0
15.0
20.0
25.0
30.0
35.0
40.0
45.0
5 People 10 People 30 People 100 People
Group Size
Tim
e to
Inte
grat
ion
Results: Organization Size Regression
Group size has a small positive relationship with integration.However, this relationship is small and fairly insignificant.
N = 120
R2 =.23
Time b s.e. t p>|t|Group Size 0.09 0.02 5.86 0.000
Results: Cultural ComplexityRegression
Cultural complexity has a positive relationship with time to integration.Organizations with more cultural complexity take longer to integrate.
N = 150
R2 =.39
Time b s.e. t p>|t|Memory 0.23 0.02 9.75 0.000

100
Results: Memory CapacityRegression
Memory capacity has a positive effect on time to integration.Thus, organizations with higher levels of memory capacity take longer to achieve cultural integration.
N = 150
R2 =.38
Time b s.e. t p>|t|Memory 0.18 0.02 9.61 0.000
Results: Memory/Cultural Complexity Interaction
Number of Rounds to Integration by Number of Facts & Memory Capacity
0.0
10.0
20.0
30.0
40.0
50.0
60.0
70.0
80.0
3 5 10 20
Memory Capacity
Rou
nds
to In
tegr
atio
n
5 Facts10 Facts
20 Facts30 Facts
Results: Cultural ComplexityGraph
22.8
34.837.1
48.0
51.2
0.0
10.0
20.0
30.0
40.0
50.0
60.0
5 Facts 10 Facts 15 Facts 30 Facts 100 Facts
Results: Memory/Cultural Complexity Interaction
N = 480
R2 =.74
Time b s.e. t p>|t|Memory 0.87 0.08 10.5 0.000Complex 0.97 1.35 3.1 0.002MemXComplex 1.73 0.12 14.8 0.000
There was a positive interaction between memory and cultural complexity.Thus, as memory and cultural complexity increase time to integration increased at an increasing rate.
Results Summary:
Organization size does not effect integration.Memory capacity is negatively related to integration.Cultural complexity is negatively related to integration.As organizations become increasingly more culturally complex and increase their memory capacities it takes significantly longer for them to become integrated.
Conclusions
Integration (especially when centralized) positively influences network effectiveness.Increases in memory capacity and cultural complexity make integration more challenging.However, without restrictive factors—not in the model—integration occurs very naturally.Can increase integration by promoting cultural “translators” that bridge knowledge gaps.Would network integration lead to more effective carbon trading?

101
Weaknesses of the Model
Organizations will completely integrate or have zero integration, no middle ground is possible.Integration is not centralized, which is an important component of integration for Provan and Milward.
Questions? Comments? Concerns?
Joseph F. Cabrera– University of Arizona
Possible Changes to Model
Add structural specifications that allow popular actors to have a higher likelihood of being chosen as interaction partners than less popular actors.Add a repulsion effect so that certain cultural facts would reduce the probability of interaction.
YOSHIKI YAMAGATA
Biographical Statement
Dr. Yoshiki Yamagata graduated from the University of Tokyo in 1985 with a major in system science. For the past 20 years he has worked in Tsukuba on various projects including: remote sensing, wetland monitoring, forest ecosystem modeling and carbon management. He is currently the leader of the Carbon Sink Assessment Team of Climate Change Research Project at NIES. Internationally, Dr. Yamagata has served as a member of the GCP Scientific Steering Committee since 2001.

102
Pre-Workshop Thought Piece
My current main research interest is to develop coupled carbon management models by integrating ecological and social systems at global and regional scales. The purpose of this coupled model development is the assessment of policy options for achieving sustainable global/regional carbon management.
Based on 20 years research experience on modeling and monitoring terrestrial ecosystems, I participated on the IPCC as a lead author (Land Use, Land Use Change and Forestry) and as a expert member of the Japan negotiation team for the Kyoto Protocol COP since its creation.. As the carbon sink issue under the KP was both scientific and political, I came to realize the importance of filling the gap between pure science and pure policy.
I was invited to join the Global Carbon Project as a Scientific Steering Committee member since the beginning (2003). Before this, with Oran Young, I helped launch a Carbon Management Research Program under the Institutional Dimensions of Global Environmental Change(IDGEC)of IHDP (1999-2002). My main interest in the GCP is to establish a policy relevant Science by integrating both natural and social sciences. This policy relevant Science should be neither ignorant of policy nor influenced by political interests. While the IPCC is not a scientific research activity but a review of past research, the GCP can coordinate future research activities looking at long-term carbon management policy needs. On the other hand, as the GCP under ICSU is nothing but a research NGO, it is destined to suffer less budget.
I am currently leading a carbon sink assessment team to look at Kyoto-related scientific assessment including the analysis of long-term policy options related to carbon sinks. I also lead and plan research projects on regional/national/global level carbon management, with a special emphasis on the coupled model development for realizing sustainable carbon management activities.
My interest in the social network theory and its application is related to my new research project to achieve an innovative regional carbon management system for the northern island of Japan, Hokkaido. This project is about creating a sustainable local region by combining forest management and biomass energy use with a new local carbon crediting system that would link the separated sectors. I believe creating effective social networks of stakeholders in the region would be a key for the success of the project. I am looking forward to learning the theory and to studying together.
103
Presentation Summary
TOWARDS A CARBON BALANCED REGION: INTEGRATED MODELING APPROACH
Yoshiki Yamagata (Reporter: Michael Obersteiner)
Main Points
• Presented the concept of global carbon management (find greater detail in the GCP’s research outline ESSP no.1).
• Vision includes the interaction of innovation, market, assessment and regime with agent philosophy, network action and growth model at the center- at the regional scale.
• Harmonization with national policies and regimes (e.g. Carbon market).
• Approach: integrated modeling of the eco-human system aiming at long-term human welfare supporting and guiding the technology and institutional arrangement.
Yoshiki Yamagata Implications for URCM networks Regions: This is a truly regional approach aiming at zero emissions. Carbon: Integrated carbon management including industry, energy and land-use sectors. Change: Must include the motives of the agents i.e. human motives driven.

104
1
Toward a Carbon Balanced Region– Integrated Modeling Approach
Yoshiki YAMAGATA
Climate Change Research Project National Institute for Environmental Studies
JAPANContact: [email protected]
GCP 2005 International Workshop on Networks & Regional Carbon Management, April. 5-7, 2005, Tsukuba, Japan
4
• Agent Philosophy• Network Action• Growth Model
Regime
Market
Innovation
Assessment
Vision: Integrated modeling for regional carbon management
2
The challenge for modeling regional carbon management
In modeling integrated regional eco-human systems, it is especially important to consider diverse regional human responsesOverall success of regional carbon management should be judged in terms of long-term human welfare increaseRegional carbon management regime could be realized through technological and institutional arrangementsValuable insights can be obtained by assessing different regional policies using the integrated modeling
5
Integrated modeling approach for global carbon management
This analysis aim to provide insights into what kind of carbon management regime will be formed using dynamic game modelWe model successive international negotiation process as differential gamesThe model allow us to asses how nations try to optimize long-term human welfare under gradual and abrupt climate changeSimulations reveal factors (risk averseness of agents etc.) that will influence carbon management regime formation
3
What is global carbon management?
Disturbances EcosystemPhysiology
AtmosphericCarbon
TerrestrialCarbon
Ocean/CoastalCarbon
BiologicalPump
ClimateChange
andVariabil.
SolubilityPump
Land UseSystems
IndustryTransportSystems
Ocean-useSystems
FossilCarbon
Perceptionsof humanwelfare
Changes ininstitutions& technol.
Perturbed C CycleUnperturbed C Cycle
Human Response“The Global Carbon Project”ESSP No.1
6
Analysis flow diagram
2. Climate constraint gamewith economic growth
BAU scenario
1. Optimal control of non-renewable resource extraction
3. Climate constraint game under carbon cycle vulnerability
Utility function
Carbon sink

105
7
Analysis tool: Differential Game
What is “Differential game”.“Dynamic (differential) game theory can be viewed as a child of the parents game theory and optimal control theory.”[1]
Each player maximize (individual or total) welfare integrated over time with discount rate
Purpose to solve the differential gameto find the Nash equilibrium paths or strategiesto find the conditions on which equilibrium exists
10
Carbon emission
∗ BLUE: Don’t consider damage (d=0)∗ RED: Markovian Nash equilibrium∗ GREEN: Cooperative solution
Dynamic Results of Games
8
)( ty
)( tw
tew ρ0
1. Solution of Non-Renewable Resource Extraction Optimal Control
11
FormulationDynamic system∗ x [GtC]: Atmospheric carbon concentration∗ u1, u2 [GtC/year] : each player’s emission∗ S(x): Sink term, three types are consideredUtility function∗ U(u) : economic utility, three types are considered∗ d : Damage coefficientthen optimization problem of each player is
)()()()( 21 xStututx −+=&
( )∫∞ − −
0
2)())(( dttdxtuUe irtMaximize
subject to .)0()),(()()()( 021 xxtxStututx =−+=&
2)(),,( dxuUtxuF iii −=
3. Climate constraint game under carbon cycle vulnerability
9
2. Climate constraint gamewith economic growth
Global emission is divided into playersFormulate climate constraint carbon management regime by differential gameUse the solution of non-renewable resource optimization as BAU emission level (bliss point) of the gameCalculate cooperative solution (global optimal solution) and Nash equilibrium solution of the game
12
Predicted saturation of carbon sink
Cramer et al. ( 2000)

106
13
0
10
20
30
0 400 800 1200x[GtC]
S(x
)[G
tC/ye
ar]
lin
quad Stoc
Sink saturation functions (cont.)
16
Conclusion and Discussion
Carbon management regime formation is simulated using differential gameHuman response changes under gradual and abrupt climate change are analyzedMore realistic model with regional heterogeneous agents need to be developedSocial network analysis for creating cooperation based on scientific knowledge need to be modeled
14
Sink saturation functions
[lin]: linear sink
[quad]: quadratic sink
[stoc]: stochastic sink∗ mode 1:∗ mode 2:∗ Probability to switch mode 1 to mode 2:
• where W=W(X) is the inverse function of X=W exp(W)
qxxS =)(
( )xpxqxS −=)(
( )( )( ))/(1
012 1)(mode2)(modeProb1lim)(
pxqqpxq
qpxq
q eW
ttxQ
−−−−
→∆
−+=
==∆+∆
=
τ
qxxS =)(0)( =xS
15
Effect of sink saturation functions on stable CO2 concentration
In an early phase, stoc<quad<lin∗ Stoc: agent is afraid of
changing into mode 2∗ Quad: reduce emission
against less-sink in the future
In a later phase, lin<quad<stoc.∗ Stoc:, no sink effect due
to mode change∗ Quad: less-sink ∗ Lin: much sink
0
200
400
600
800
1000
0 20 40 60 80 100
t[year]
x[GtC]
CARA_lin
CARA_quad
CARA_stoc

107
EXPO 2005
YUKIKO YOSHIDA
About the 2005 World Exposition, Aichi, Japan
Message from Japan: “Nature's Wisdom”
Yukiko YOSHIDACGER/NIESApril 6, 2005
Why “Nature's Wisdom”?• Technology
the key to finding answers• Culture
defining the future of technology• A new balance between nature, technology and
culture↓
When I summarize itFor future vision of 21st century
Key word: Hybrid(New and Old)
Development for Eco-Communities
Outline
• EXPO Overview• Why “Nature's Wisdom”?• Environment of the EXPO• How to evaluate the environment?• Attempt to solve environmental problems• Thinking about earth and future
Environment of the EXPO
Daytime-Direction of wind
Nighttime-Direction of wind
Average annual temperatureNAGOYA 15.1℃(Average 1956-1990)
From measurement data of last yearThe effect of the forest is expected.
0
10
20
30
Nag
oya
Janu
ary
Feb
uru
ary
Mar
ch
April
May
June
July
Aug
ust
Sept
em
ber
Octo
rber
Dec
em
ber
Nov
em
ber
Ann
ual
aver
age
Tem
pera
ture
[℃]

108
Overview• Location Nagoya Eastern Hills
(Nagakute Town, Toyota City and Seto City)
• Duration25 March - 25 September 2005
(total of 185 days) • Expected number of visitorsapprox.15 million ・ Organizer
*TOYOTA*Aichi Prefecture*Ministry of Economy, Trade and Industry, JAPAN
How to evaluate the environment?-1
On the loops Inside in forest
Green walls in main stage
1) Environmental monitor system of domestic maximum scale that uses wireless sensor(EXPO office, WASEDA University, NIES,NEC)2) City-level modeling
• 3) Very difficult to count from heat image(The building shape is special.)
• 4) It becomes effective study in logic on the city planning construction.
How to evaluate the environment?-2
Ex; The building shape is special
Before construction After construction
Infrared rays heat image
Attempt to solve environmental problems
• Recycling system (3R)Reuse・ Reduce・ R ecycling( Garbage, E n e r g y )
• All the temporary buildings are constructed on the assumption of recycling.
• Use of new energy
Environmental observation in real time
http://ecoclub.expo2005.or.jp/check/c4-1.html
•Temperature•Humidity•Temperature of surface of the earth•Underwater temperature•CO2•Quantity of solar radiation•Wind•Velocity of the wind•Rainfall•Number of visitors•Energy consumption
Thinking about the earth and the future
EXPO2005

109
Related site( for KIDs)
http://ecoclub.expo2005.or.jp/
Collaboration of artists, scientists and the public
http://co2.nies.go.jp
•Interview•Animation•Quiz•GCP•News
Project CO2 -Art, Science & Society-
EXPO Web Site• http://www.expo2005.or.jp/
Please enjoy your stay, and please think about the future for yourself.
• Thank you!!If you have a chance,
you can see CO2 cycle imagein Monitor

110
Keynote Presentation JEFFREY BROADBENT
Presentation Summary
PATHWAYS TO PARTICIPATION: GLOBAL NETWORKS AND NGO VOICE IN JAPANESE CLIMATE CHANGE POLICY MAKING
Jeffrey Broadbent (Reporter: Stephan Scholz)
Main Points • Broadbent tests four hypotheses to explain the rate of NGO participation in stakeholder
advisory councils and policy formation committees. These four hypotheses are civil society growth, the boomerang theory, international NGO pressure, and the internal logic of the state.
• Data was taken from surveys of 162 Japanese domestic and international governmental organizations, non-governmental organizations and media companies.
• The results offer the most support for the civil society growth theory, and some support for the internal logic of the state. Internal logic of the state refers to the idea that states may decide to co-opt or include strong movements as a form of social control, whereas the civil society growth theory points to the growing influence of NGOs as a function of their domestic ties, and not their international ties.
Testable Hypotheses After determining which NGOs have been included in advisory councils, and why, it would then be of interest to see if inclusion actually equals effective outcomes.
Implications for URCM Networks NGO participation will be a crucial component of carbon mitigation. This study provides a case study and framework for determining how international and national level networks impact NGO effectiveness. Relevant Literature Fernandez, Roberto M. and Roger V. Gould. “A Dilemma of State Power: Brokerage and Influence in the National Health Policy Domain”. American Journal of Sociology, Volume 99, Number 6 (May 1994): 1455 – 91. Moody, James and Douglas R. White. “Social Cohesion and Embeddedness: A Hierarchical Conception of Social Groups”. American Sociological Review, 2003.

111
日本の気候変動問題の政策
日本の気候変動問題の政策
決定過程に
決定過程におけるグローバル・
おけるグローバル・
ネットワークと
ネットワークとNGO
NGO
「声」
「声」
Pathways to Participation:Pathways to Participation:Global Networks and NGO Global Networks and NGO ““VoiceVoice”” in Japanese Climate in Japanese Climate Change PolicyChange Policy--MakingMaking
政治参加への細道
政治参加への細道
Jeffrey Broadbent(Professor, University of Minnesota)
Stephanie Devitt(Research Assistant)
GCP Research Agenda:問題提起
• POETIC – interaction of six factors • In producing carbon usage at many levels:• Family, organization, community, • Government, nation, global systems.• What factors affect “carbon politics” and• bring about sustainable carbon use?• How can we use network analysis• In this kind of research?.
Acronyms
• GO – Government of a nation• IGO - International Governmental
Organization (i.e., UN)• NGO – Domestic Non-Governmental
Organization (i.e., Japan Wild Bird Society)• NPO – Non-Profit Organization (=NGO)• INGO - International Non-Governmental
Organization (i.e., Greenpeace)
Networks• Reveal inter-actor relations & processes. • Can indicate mechanisms of change• But not often joined with theory• Or with in-depth interviews about • politics, power and policy-making.• This paper integrates these aspects• to study NGO/NPO participation • in climate-change policy-making
Introduction
Public Participation as Global Norm
• UNCED Rio 1992 set new global norms• Agenda 21: identified public/NGO participation• As crucial for sustainable carbon practices.• Nations responded in different ways.• US ignored it; Japan tried to implement.• Seems like a good idea, but raises questioins:• What is participation? Does it really help?

112
“Participation”• Voting is a form of participation, but• Indirect through elected representatives. • Agenda 21 advocates direct participation • in making policy by stakeholder groups• On advisory councils and other ways.• Idea: giving voice to critical voices • Will improve policy. • NGOs as “moral stakeholders.”
Hypotheses on MechanismsN G O 参加を増するメ カ ニズムの仮説
NGO Participation in Japan
• Japanese government allows participation• By groups on advisory councils (shingikai).• Over 800 shingikai, 16,000 seats. • Mostly business, academics & “Old Boys”• During 1990s growth of environmental NPOs• Some gained participation, but others not.• Why did this selection occur?• Was their participation trivial, symbolic or
effective?
Theories
• Concern “ideal” social & cultural processes • That distribute power & influence• And produce outcomes, policies.• In Conflict Theories – A dominates B using
superior resources and strategies • In Neo-institutional Theory – A persuades B
based on legitimacy, norms, schema, habits• Propose different elements of mechanisms
Research Question :問題提起
“During the 1990s, what mechanism(s) brought about the participation of some climate-change related NGO/NPOs in Japanese government climate change policy-making, but not others?””
Mechanisms• Mechanisms* -- vectors of pressure• (domination or influence) that• maintain or change power structures.• Mechanisms composed of elements:
– Actors – units that act to exert pressure– Sanctions – hard and soft incentives – Contexts – larger “playing field” of resources,
• institutions, culture, other actors.• Hypotheses -- concern causal mechanisms • & the elements composing them
*Tilly, Tarrow & McAdam 2001

113
Soft sanction
Hard sanctionEither/both
GOGO
Elements of Mechanisms
IGOIGO
INGOINGONGONGO
Country XCountry X
ActorsActors
SanctionsSanctions
ContextsContextsGlobal SystemsGlobal Systems
• Domestic NGOs become stronger on own*• 国内N G O が自発的に強く なっ て。 。
• Acquire resources (members, information)**• NGOs pressure state to gain participation• N G O : 両方かどちら か利用し て政府に働き か
ける
• Example: the German Green party,• Japan: Peoples’ Forum 2001 市民フ ォ ーラ ム
第一仮説・ Hypothesis 1 Domestic Civil Society
*Putnam; Skocpol; **Zald & McCarthy
Hard Sanction (domination-権力)
• A uses resources to dominate B,• change B’s behavior against B’s will.• Examples: money, votes, violence• Strategy: Instrumental, manipulative• 例: 投票する会員が多い
• “Conflict Theory”*• Proxy: Political support network
*Tilly
Soft incentives
Hard incentivesEither/both
GOGO
Illustration of H1
IGOIGO
INGOINGONGONGO
Country XCountry X
• A persuades B to adopt new norms• Examples: legitimacy, information,
morals, norms• 例: 研究で新し い情報を作る能力
• Strategy: cooperation, mutual benefit• Neo-Institutional Theory*• Proxy: Vital information network
*Meyer
Soft SanctionSoft Sanction (Influence(Influence--説得説得))
• Domestic NGOs appeal to INGO/IGO• INGO/IGO apply hard (legal)/soft
(embarrassment) sanctions to government.• Domestic government concedes.• Example: Anti-Narmada Dam movement• FOE Japan publicly mocked Mitsubishi, • got Japan to withdraw support
第二仮説・第二仮説・ Hypothesis 2 Hypothesis 2 ““BoomerangBoomerang”” ブメ ラ ンブメ ラ ン **
*Keck & Sikkink*Keck & Sikkink

114
Soft incentives
Hard incentivesEither/both
GOGO
Illustration of H2
IGOIGO
INGOINGONGONGO
Country XCountry X
第四仮設・ Hypothesis 4Internal logic of state
• Domestic state has own policy • Not created by Agenda 21• To allow NGO participation • under certain conditions• For strategic reasons • to maintain social control• State-centric theory*• Or following institutionalized rules.
*Skocpol, et al.
第三仮設・ Hypothesis 3New “Soft” Global Norms*
IGO, INGO and multi-national “protocols”Create new global normsThese pass by diffusion, modeling, persuasionTo domestic actors who learn new standardsIf state: officials allow more NGO participationIf NGOs: become more legitimate & demandingIf citizens: become more supportive of NGOs国連・ 国際協定などで新国際規範の普及
• 国際協定で出来た新し い規範がそれを結んだ政府の役人などに説得力をも っ て政府が積極的に参加を認めるよう になる。Ex: Global spread of Environmental Agencies
*Frank et al.; John Meyer, Richard Scott*Frank et al.; John Meyer, Richard Scott
Soft incentives
Hard incentivesEither/both
GOGO
Illustration of H4
IGOIGO
INGOINGONGONGO
Country XCountry X
Soft incentives
Hard incentivesEither/both
GOGO
Illustration of H3
IGOIGO
INGOINGONGONGO
Country XCountry X
Predictions

115
• Domestic NGOs with • more resources (membership, budget), • more domestic information ties and • more domestic political support ties• will gain more participation• NGOは資源があればあるほど政治参加も 増
す
第一仮説が正し い場合の予測:If H1-Domestic Civil Society is correct
第四仮説が正し い場合の予測:If H4-Internal Logic of State is correct:
• Participation by other types of NGOs• Will occur before 1992 Agenda 21.• State use internal criteria to pick NGOs• If conflict logic:
– to co-opt NGOs posing political threat– and to seek other advantage
• If neo-institutional logic: – to pick “like-minded” compliant NGOs
第二仮説が正し い場合の予測:If H2-Boomerang is correct
• Domestic NGOs with more • political support from INGOs and IGOs• will gain more participation• 正し ければ、 国際N G O を呼び出し た国内N
G O がう まく 参加出来るはず
研究方法・ Research Methods
第三仮説が正し い場合の予測:If H3-New Soft Global Norms is correct
State officials will allow State officials will allow all NGOs more participation.all NGOs more participation.すべてのN G O は政治参加を増大するすべてのN G O は政治参加を増大するOr, NGOs most expressing Or, NGOs most expressing the new global norm the new global norm (most information ties to IGO/(most information ties to IGO/INGOsINGOs) ) will gain more participation.will gain more participation.
Policy Network Approach
• Laumann & Knoke Organizational State 1985 • Knoke, Pappi, Broadbent & Tsujinaka • Comparing Policy Networks 1996• Broadbent proposal--Comparing Environmental
Policy Networks, 1992• Tsujinaka got funding, further specified:• Tsujinaka & Ishio designed GEPON • (Global Environmental Policy Network) Survey• And fielded GEPON in Spring 1997

116
Respondent Organizations・ 回答者組織
• Interviewed 128 domestic organizations • Not a “sample,” a “universe”-whole network• All major organizations engaged in global
climate change issue, Japan 1997• 1 9 9 7 年当時、 気象変化に関し て活発に
声を上げる日本国内の団体
• Also asked about ties to 33 IGO/INGO• Interviewed by survey company in 1997• Supplementary interviews Broadbent 1999
Focal NGOs• CASA--National Citizens Meeting for
Considering Global Environment and Air Pollution
• ED90-00--Earth Day 1990-2000 • JANIC--Japanese NGO Center for
International Cooperation• JASON--Japan's Save the Ozone Network • JELC--Japan Eco-Life Centre• PF2001J--People's Forum 2001, Japan• UPPCAN--Used Paper Problem Citizens
Action Network• GPJ--Greenpeace Japan
組織分類 ( GEPON調査データ )Types of Organizations (GEPON Data)
国内組織 Domestic Organizations• 政府 Government 40• 政党 Political Party 8• 企業 Business 44• 労働 Union 1• 専門団体 Professional Group 2• 市民社会 Civil society/NGO 17• 政府機関 Quasi-Gov’tal Agency 7• マスコ ミ Mass Media
9小計 Total 128
調査対象N G O国内NGOCASA 地球環境と 大気汚染を考える
CUJ 日本諸費者連合
ED90-00 アース・ デイ ー 1990-2000 JANIC N G O 活動推進センタ ー
JASON スト ッ プ・ フ ロン全国連絡会
JCCU 日本生活協同組合連合
JECO 日本・ エコ ロジー・ センタ ー
JELC ジャ パン・ エコ ラ イ フ ・ センタ ー
PARC アジア・ 太平洋資料センタ ー
PF2001J 市民フ ォ ーラ ム
UPPCAN 古紙問題市民行動ネト ワーク
WBSJ 日本野鳥の会国際 NGOの日本支部GPJ グリ ンピース・ ジャ パン
WWFJ World Wide Fund for Nature-ジャ パン
国際組織 International Organizations• 国際NGO International NGOs 11• 国際政府的 International Gov’tal 14• 政府機関 Quasi-Gov’tal Agency 6• 企業 Industrial Organizations 2• 小計 Total 33
• ( 総数 Grand Total 161)
質問内容・ Question Content• Networks of information and support • Reputation for influence• Resources-membership, budget, information-
providing capacity, organizational form • Participation in policy-making events• Degree of interest in different issues
国内の組織的資源、 相互の情報交換と 政治支援交換の関係 ( 1 2 8 国内団体、 3 3 国際組織) 、 影響力のスコ ア、 組織資源 (会員数、 予算、 情報提供能力) 、 政策決定過程への参加、 イ シュ ー態度等

117
Networks as Political Data• Networks are not just “social”• Network approach can provide new• types of data, insights, & explanations.• GEPON collected data on 2 kinds of networks• Political support -- a “harder” resource because
it can cause politicians to lose elections• Vital information -- a “softer” resource relating to
scientific knowledge, ideology & persuasion
Typology of NGO ParticipationTwo Types of Participation asked in GEPON
Membership in an Advisory CouncilCentral Council for Environmental Pollution Control
Helping to write legislationTable: Four Types of Participation
NoNoExcludedNoYesTokenYesNoPoliticalYesYesInfluential
Help writeMembershipType
Findings・ 結果
N G O 参加の分類
NGOの政策形成過程への参加の四つのタ イ プ
類型審議会委員への参加( 中央環境審議会等)
法案作成への参加
NoNo無参加
NoYesフ ォ ーマル
YesNo政治的
YesYes影響的
法律策定審議会参加タ イ プ【 表1 】
Findings Include・ 結果内容
• Typology of NGO Participation• N G O 参加の分類
• Organizational Form of NGOs国内N G O の4 組織的模様
• Network Images (Whole & Cluster)• Table Comparing NGO Variables• “Pathways to Participation”• Reputations for Influence
*Qualitative Comparative Analysis (Ragin)
Organizational Form of NGOs国内N G O の4 組織的模様
単独 一つの組織だけ
Single unit NGO (domestic) (S)支部 地方支部を持つ全国組織
NGO with chapters (domestic) (C)傘 多数の組織が議論・ 調整できる場
Forum (umbrella) NGO (domestic) (F)国際 国際N G O の国内支部.Local branch (of international) NGO (B)

118
Network Images—Whole & Cluster
• Whole network: all connected organizations• If many members, very complicated• Useful data for statistical analysis• Visual analysis reveals patterns• One way: define sub-sets: clusters*• Cluster: highly inter-connected “clique”• View on image program**
* Network analysis with Network analysis with UCINetUCINet;; **Mage
Pathways to "Influential" Participation
00.5
11.5
22.5
33.5
Genera
te New
Info
Budget & M
emb Sz
Criteri
a Dom/U
niv
Dom Info
Dom Support
IGO In
fo
IGO Support
INGO In
fo
INGO Support
Resource
Stre
ngth
JASON CJANIC F
H M L
QCA Data Reduction
• Qualitative Comparative Analysis* • Start with detailed statistical table• Convert statistics to categorical variables
(Low, Medium, High)• Create comparative QCA table • Table indicates factors affecting participation • Factor combinations indicate “Pathways to
Participation”
*Ragin*Ragin
Pathways to "Token" Participation
0
0.5
1
1.5
2
2.5
3
3.5
Genera
te New
Info
Budge
t & M
emb Sz
Criteri
a-Dom/U
niv'
Dom In
fo
Dom Sup
port
IGO In
fo
IGO Supp
ort
INGO In
fo
INGO Support
Resource
Stre
ngth
CASA CPF2001 FUPPCAN C
H M L
Table 2: Pathways to Participation Domestic Resources International
Networks Degree of Participation
Org Name & Founding Year
Type
Own Info
Bud&Mem
Japan Orien- tation
Dom Info
Dom Sup
IGO Inf
IGO Sup
IN GO Inf
IN GO Sup
Advis. Coun.
Help Write Legis
Type
JASON 95 C H L H H M L L L M Y Y INF JANIC ‘87 F H M H H H M L M L Y Y INF JCCU ‘51 C H H H H L M L H L Y Y INF JECO ‘77 S L H H L L L L L L N Y POL WBSJ ‘70 C L H H L L L L L L N Y POL
CASA ‘88 C H L L M L L M H H Y N TOKPF2001 ‘93 F H M L H H H H M M Y N TOKUPPCAN 93
C L L H L L L L L L Y N TOK
JELC ‘91 C L L H L L L L L L N N N ED90-00 89 B L L L L L L L M H N N N GP-J ‘89 B L H L H L H L H L N N N PARC ‘73 S L M L M L M L M L N N N WWF-J ‘71 B L H L L L L M L L N N N
CUJ ‘69 S L M H M L H L L L N N N
Key: S = domestic Single unit NGO; C= domestic NGO with Chapters; F = domestic Forum (umbrella) NGO; B= local Branch (of foreign) NGO; INF = Influential; TOK=Tokenism; POL=Political
Pathways to "Non"-Participation
0
0.5
1
1.5
2
2.5
3
3.5
Genera
te New
Info
Budget
& Mem
b Sz
Criteri
a Dom/ U
niv
Dom Info
Dom Sup
port
IGO In
fo
IGO Support
INGO In
fo
INGO Support
Resource
Stre
ngth
WWF-J BGP-J BED90-00 B
H M L

119
Pathways (factors) to participation?
• Domestic, high new information, high domestic information ties, use domestic criteria, low IGO/INGO political support Influential
• Domestic, two generate new information but use universalistic criteria Token
• Domestic/foreign branch, no new information, domestic/IGO/INGO political support Excluded
Reputation for Influence (RI)–Top Ten• 102 EA-Global Environment Dept., Planning &
Coordination Bureau • 102 IPCC-Intergov’l Panel on Climate Change • 95 UNEP-United Nations Environ’l Program • 94 MITI-Enviro. Prot. & Industrial Loc. Bureau • 92 Central Advisory Council for Environment • 83 Japan Federation of Economic
Organizations • 79 MITI-Agency of Natural Resources & Energy • 78 OECD-Environmental Policy Committee • 77 Greenpeace International • 76 EA Air Quality Bureau
Does Participation Bring Influence?
PARTICIPATION BRINGS INFLUENCE?
ACRONYM RI TYPE NAME JASON 15 INF Japan's Save the Ozone Network
JANIC 8 INF Japanese NGO Center for International Cooperation
PF2001J 23 TOK People's Forum 2001 of Japan
CASA 16 TOK (National Citizens Meeting for Considering Global Environment and Air Pollution)
UPPCAN 6 TOK Used Paper Problem Citizens Action Network
GPJ 37 NON Greenpeace Japan
ED90-00 11 NON Earth Day 1990-2000
JELC 9 NON Japan EcoLife Centre
Measures of Influence• Positional – hold formal office• Decisional – who makes actual decisions?• Reputational – experts identify influentials• GEPON: reputational method (and others)• Respondents of 103 domestic organizations • Checked “very influential” organizations• in Japanese climate change politics.• List: 103 domestic, 33 international orgs.
Real Influence?
• The NGOs with the highest • reputation for influence (RI)• In the Japanese climate-change domain• Did not attain the most participation.• Both “tokens” had higher RI• Than both “influentials”• GPJ had higher RI than any domestic

120
Validity of Hypotheses
Validity UnclearNegative indicators:
NGOs with international ties not participateOlder NGOs participated before 1990s.
Positive indicators:Ministries (MOFA & EA) allow participation Had many international ties Known as “internationalist” (EA also?)So, perhaps more affected by global norms
Hypothesis 3: Hypothesis 3: Global Soft NormsGlobal Soft Norms
Hypothesis 1: Domestic Civil Society TheorySupported.Supported.Domestic NGOs with resourcesDomestic NGOs with resourcesGenerated Generated withinwithin domestic civil societydomestic civil society
Capacity to make new information, Capacity to make new information, More domestic information ties,More domestic information ties,
Gained more participation.Gained more participation.Shows growing strength of civil societyShows growing strength of civil society
Hypothesis 4: Internal State Logic
Probably Supported. Only NGOs with specific qualitiesAttained “full” participation (AC & help write) But -- What does this pattern indicate?A state “logic” of “choosing” NGOs?
NGOs participated before Agenda 21Or an NGO “logic” of rejecting “participation”?
Because outsider tactics* more influential?*Ishio
Hypothesis 2: “Boomerang” Theory
Not supported by data.Domestic NGOs with political support ties to INGOs or IGOs did not participate.But, is this an adequate indicator?
Foreign pressure (外圧) could cause inclusion of non-demanding NGOs.
Reputation for Influence
• Another way to measure • The influence of an organization n--• Ask the policy-experts of each • Organization on the survey• To check off all those organizations • having “a lot of influence over climate
change policy”*• (scores range from 102 to 4).

121
Discussion
Japanese NGO sector• Is growing rapidly & gaining more participation• But on state’s terms.• NGOs remain very weak financially• Lack of much public or philanthropic support • Now getting more grants (MOFA, JEC, Toyota)• Environmental NGOs growing political influence
• “Participation” does not mean influence!• “Cooperative” NGOs attain participation.• “Outsider” tactics are more influential • On the content of policy.• Participation mutes critical voice.• (In AC, policy writers are 40% OB*)
*Asahi Shimbun data
• Boomerang not effective • because Japan not a developing country,• not dependent upon foreign aid and loans
that can be cut off for non-compliance.• Global norms and examples from foreign
NGOs and INGOs inspire and teach strategies to domestic NGOs
• Has “corporatist”* logic –• Solicits participation by strong domestic groups • But only if they are “cooperative.”• Some ministries tied to global actors• But not determined by those networks & norms• Only allow preferred NGOs participation.• Excludes INGOs and their domestic branches
*Jepperson; Schofer and F-G
The Japanese state:The Japanese state:
Conclusions

122
• Shows contradictions in Agenda 21• The penetration and effect of new global
norms depends heavily upon the domestic institutional structures.
• Global and domestic factors interact to produce a distinct pattern of change.
• Understanding of these distinct local institutions and patterns within a given country
• may help NGOs there to become more effective.
Future Directions• Relate participation to policy output• See what NGOs asked for “participation”• Interview ministry officials in charge of AC• Interview NGO representatives in AC• See if having more international ties • predicts using more global discourse (for
orgs)• See if ministries with more international ties • allow more NGO participation.
• Participation as defined here may not mean actual effect upon policy.
• Even if NGOs persuade the Environmental Agency of their ideas, the EA’s proposal often lose out to more powerful ministries & the LDP
• 参加と 影響組織と いっ ても それはN G Oが国の政策に影響を及ぼす意味と 違います。 (環境省が弱く て)
• Also, Non-Participation need not mean the absence of an NGO’s effect upon policy. Outside critics may be more effective than inside mild reformers in forcing change.
Future Directions for Self
• Apply policy network method to other levels• Comparative community carbon studies• Investigate new dimensions of polity such as• Distribution and connections of ideas and
values
• The paper has demonstrated the utility of network data for the analysis of carbon politics
• The paper also articulated network analysis with general theory to derive empirical conclusions about power, structure & change.
• This kind of analysis of meso-level process • can be applied to other multi-actor processes • at community, region, nation or global levels
Steps walked by poet Matsuo Basho (1644-94) along his “Narrow Road to the Deep North,” Miyagi Prefecture
石段や
石段や
冬に登れば
冬に登れば
帰る哉
帰る哉
Cold stone steps.Cold stone steps.Will they lead me backWill they lead me back
To the village?To the village?
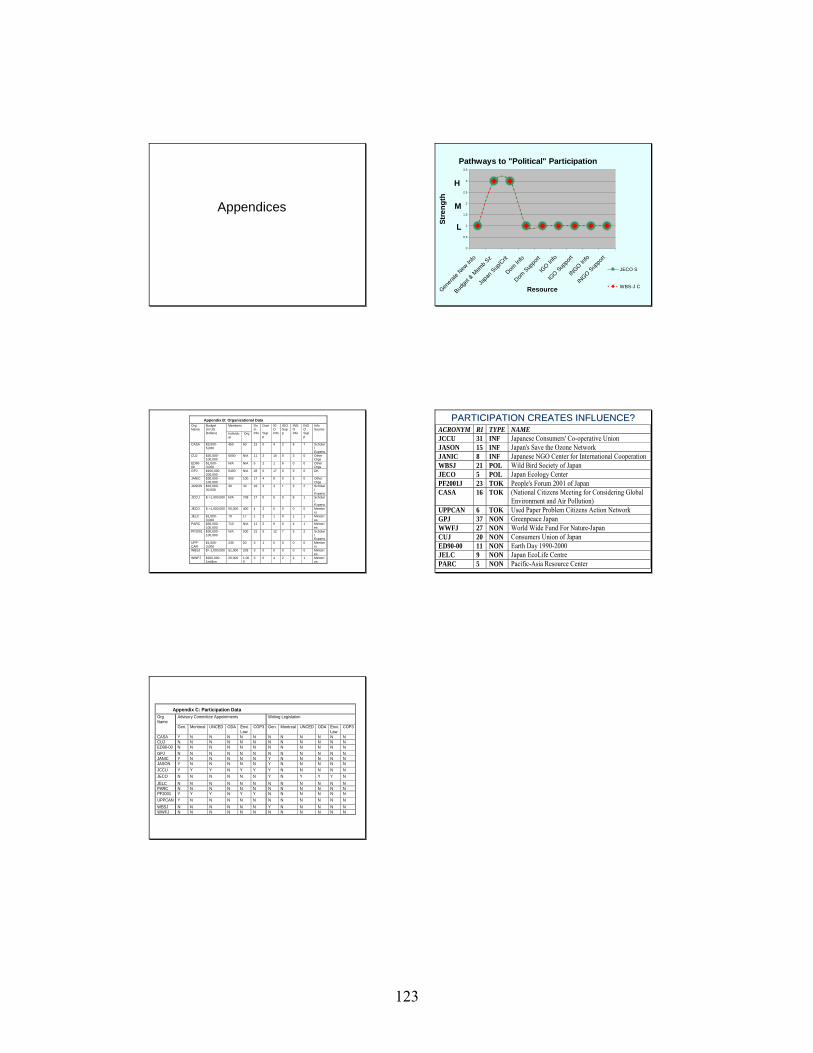
123
Appendices
Pathways to "Political" Participation
0
0.5
1
1.5
2
2.5
3
3.5
Genera
te New
Info
Budge
t & M
emb S
z
Japa
n Sup
/Crit
Dom In
fo
Dom Sup
port
IGO In
fo
IGO Sup
port
INGO In
fo
INGO S
uppo
rt
Resource
Stre
ngth
JECO S
WBS-J C
H
M
L
Appendix B: Organizational Data Members
Org Name
Budget (In US Dollars)
Individual
Org
Dom Info
Dom. Supp
IGO Info
IGO Supp
INGO Info
INGO Supp
Info Source
CASA $3,000-5,000
450 60 13 0 4 2 8 7 Scholar/ Experts
CUJ $30,000-100,000
6000 N/A 11 2 10 0 3 0 Other Orgs
ED90-00
$1,000-3,000
N/A N/A 5 2 1 6 0 0 Other Orgs
GPJ $100,000-200,000
5400 N/A 28 0 17 0 9 0 DK
JANIC $30,000-100,000
900 100 17 4 8 0 5 0 Other Orgs
JASON $10,000-30,000
30 40 16 3 3 1 3 2 Scholar/ Experts
JCCU $ >1,000,000 N/A 708 17 0 5 0 8 1 Scholar/ Experts
JECO $ >1,000,000 55,000 400 4 2 0 0 0 0 Members
JELC $1,000-3,000
70 17 1 2 1 0 1 1 Ministries
PARC $30,000-100,000
710 N/A 11 2 9 0 4 1 Ministries
PF2001 $30,000-100,000
N/A 500 31 5 12 7 5 2 Scholar/ Experts
UPP CAN
$1,000-3,000
230 20 3 1 0 0 0 0 Members
WBSJ $> 1,000,000 51,000 209 3 0 0 0 0 0 Ministries
WWFJ $200,000- 1million
20,000 1,000
3 0 4 2 2 1 Ministries
PARTICIPATION CREATES INFLUENCE?PARTICIPATION CREATES INFLUENCE?ACRONYM RI TYPE NAME JCCU 31 INF Japanese Consumers' Co-operative Union JASON 15 INF Japan's Save the Ozone Network JANIC 8 INF Japanese NGO Center for International Cooperation WBSJ 21 POL Wild Bird Society of Japan JECO 5 POL Japan Ecology Center PF2001J 23 TOK People's Forum 2001 of Japan CASA 16 TOK (National Citizens Meeting for Considering Global
Environment and Air Pollution) UPPCAN 6 TOK Used Paper Problem Citizens Action Network GPJ 37 NON Greenpeace Japan WWFJ 27 NON World Wide Fund For Nature-Japan CUJ 20 NON Consumers Union of Japan ED90-00 11 NON Earth Day 1990-2000 JELC 9 NON Japan EcoLife Centre PARC 5 NON Pacific-Asia Resource Center
Appendix C: Participation Data Advisory Committee Appointments
Writing Legislation
Org Name
Gen. Montreal UNCED ODA Envi. Law
COP3 Gen. Montreal
UNCED
ODA Envi.Law
COP3
CASA Y N N N N N N N N N N N CUJ N N N N N N N N N N N N ED90-00 N N N N N N N N N N N N GPJ N N N N N N N N N N N N JANIC Y N N N N N Y N N N N N JASON Y N N N N N Y N N N N N JCCU Y Y Y N Y Y Y N N N N N JECO N N N N N N Y N Y Y Y N
JELC N N N N N N N N N N N N PARC N N N N N N N N N N N N PF2001 Y Y Y N Y Y N N N N N N UPPCAN Y N N N N N N N N N N N WBSJ N N N N N N Y N N N N N WWFJ N N N N N N N N N N N N
124
CONCLUSIONS The purpose of the social networks workshop was to explore possible applications of social network analysis to regional carbon management. With this goal in mind, the Global Carbon Project invited a mix of researchers representing the broad spectrum of network theory. Presentations covered topics ranging from traditional empirical studies to innovative agent simulations. After much discussion three broad themes emerged from the workshop. 1. Regional carbon management requires that social network analysis be less descriptive and more applied. For example, it is well documented that social capital can have positive effects on innovation, rural development, market behavior, and household income. However, very little has been written that shows how social capital can be generated or networks can be managed to achieve such an outcome. The conclusion reached at the conference is that innovative applications of technology, such as public participation geographic information systems, can be used as focal points around which new networks can be knit and social capital generated. In the case of Hokkaido, the Global Carbon Project hopes to implement such a method to assist in the development of a biomass economy. 2. Social network analysis is too empirical to have an impact on policy formation because policy makers typically privilege computer modeling scenarios. To address this deficiency, new types of genetic algorithm based simulations were presented and discussed. One of the basic network processes that can be modeled via these algorithms is the evolution of a network structure after certain nodes are removed. This has applications in many realms from disease outbreaks in scale free networks to policy formation on carbon mitigation. The point is to figure out the marginal contribution of different network components to outcomes or processes over time. The contribution of actors to an outcome varies by their position in the network, such as hubs in disease outbreaks that act as the central vectors. It may also be of interest to model what happens to international regimes and CO2 emissions when certain countries or actors are removed from climate change policy networks. These types of models can also examine the effects of regional level social and economic conditions on environmental outcomes. This is done by embedding genetic algorithms within geographic information systems to model the effects of network structures on resource usage. 3. Cases of rural and urban development need to be made comparable in order to recommend future pathways to decarbonization. Qualitative Comparative Analysis was discussed as a methodology that would add rigor to the process of case comparison in low to middle range sample sizes of 10 to 50. For example, it would be useful to compare the structure of rural development networks across multiple cases that lead to sustainable land use management. One negative case of social network failure was presented on dust bowl recovery in the great plains of the United States. Another area of application could be an analysis of international and national level networks on non-governmental organization (NGO) effectiveness. For example, in the case of Japan, it was found by Broadbent, Tsujinaka and Ishio that the most effective NGOs did not derive their success from international networks, but from local networks.

125
APPENDIX I: INTERGOVERNMENTAL PANEL ON CLIMATE CHANGE RECOMMENDATIONS
Dear Mikiko:
It was a great pleasure to talk with you at Penelope Canan's workshop on social network analysis. As a follow-up to our discussion about scenarios, I wish to provide the following input that may be used for the IPCC Laxenburg workshop in June-July.
The SRES scenarios represent a large step forward in scenario design, especially in the use of storylines both to guide the development of and evaluate the results of future scenarios. However, the SRES scenarios are of only limited use in crafting scenarios that will be useful in assessments of vulnerability and adaptive capacity. Their limitations fall into two categories: the degree of aggregation and the small number of variables.
Just where scenarios are most needed in examining vulnerability and adaptive capacity -- the developing countries and especially LDCs -- the SRES scenarios are too aggregated and optimistic. Regions are simply too big for scenarios to be useful. Lumping Africa and Latin America makes even careful downscaling problematic. And the assumed growth rates for developing countries are unrealistic, as many commenters to the UNDP's Adaptation Policy Frameworks pointed out. Both these issues become magnified as scenario problems when one attempts to make century-long projections.
The small number of variables -- population and GDP per capita, with perhaps measures of technological progress and land use -- fail to account for many factors that have a material influence on development in general and vulnerability/adaptive capacity re climate change in particular. The Adaptation Policy Frameworks' Technical Paper on socioeconomic scenarios (Emilio LaRovere and I are the lead authors), describes five general categories of socioeconomic development essential for a realistic scenario: demography, economics, natural resource use, governance and policy, and culture. For any given area (region, country, sub-country area), a scenario likely would need to include multiple indicators. The way this might work at the global level is to specify a parsimonious set of indicators for use at the global and (more disaggregated) regional level; this parsimonious set can be enriched by other indicators as studies are performed for smaller areas, i.e., a "bottom-up" analysis conducted under the umbrella of a more "top-down" analysis.
Indicators for demographic analysis might include population size and density, age structure, location/urbanization, male/female ratio, migration rate, education (literacy rate), fuel used by households, housing with electricity, rate of poverty and extreme poverty, health characteristics (e.g., infant mortality), food security (e.g., diet, food sources).
Indicators for economic analysis (GDP per capita being a good indicator only in OECD-like countries) might include income, wealth, investment and savings, land tenure, food security, degree of industrialization and/or external market participation, infrastructure, labor force, and environmental impact of industrial activities.

126
Indicators for natural resource use (a category added at the strong recommendation of commenters) might include the amount/extent of natural resources, current uses and state of health or degradation (e.g., water quality, forest cover, deforestation rates, expansion/abandonment of agricultural lands, soil degradation, desertification), and the potential for further and different uses (considering sustainability).
Indicators for governance and policy might include environmental policies, extent of integration of economic and environmental policies, degree of government stability and/or civil strife, fraction of government budget devoted to social welfare, and planned state reforms (e.g., privatization, current and planned free-trade agreements).
Indicators for cultural analysis might include kinship and other networks of mutual aid, agricultural practices, degree of globalization, rate of consumerism, management of commons, and pathways of technological innovation/adoption.
The reference for this work is:
Malone, Elizabeth L. and Emilio L. LaRovere. 2005. "Assessing current and changing socioeconomic conditions." In Adaptation Policy Frameworks for Climate Change: Developing Strategies, Policies and Measures. Bo Lim, Erika Spanger-Siegfried, Ian Burton, Elizabeth L. Malone and Saleemul Huq, editors. Cambridge University Press, Cambridge, UK.
Best, Elizabeth
Elizabeth L. Malone, Ph.D. Senior Research Scientist Joint Global Change Research Institute

127
APPENDIX II: WORKSHOP CARBON BUDGET
In an effort to be responsible carbon citizens we have calculated the following carbon footprint for the workshop. This is a basic footprint based on just direct emissions from airplane and automobile travel. Options for offsetting this amount include planting trees, improving household fuel efficiency or donating money to an organization such as the carbonfund.org that will invest it in carbon offset projects.
Air
Mileage Travel to Tsukuba
Travel in Tsukuba
Travel to Hakone
Travel to Aiichi
Broadbent 13,089 55 40 75 479Cabrera 10,000 55 40 75 479Caniglia 12,618 55 40 75 479Dibble 13,544 55 40 75 479Frank Malone 13,544 55 40 75 479Kondoh 10124 55 40 75 Malone 13,544 55 40 75 479Obersteiner 11,374 55 40 Schienke 2,608 55 40 75 479Sonnett 10,000 55 40 75 479Sub-Total 110,445 550 400 675 3,832Canan 40 75 479Hartman 40 75 479Iino 318 40 Kainuma 10 Kameyama 40 Ojima 40 75 479Scholz 40 75 479Sugihara 40 Usui Aoyagi 40 Umemiya 40 75 479Yamagata 40 Yoshida 10 Sub-Total 0 318 420 375 2,444Total Air Mileage 110,445 miles at .18 kg CO2/mile 19,880 kg CO2Total Car Mileage 9,014 miles at .36 kg CO2/mile 3,245 kg CO2 Total Conference CO2 23,125 kg CO2Conference CO2/person 1,051 kg CO2/person
The car mileage figure is based on an average car returning 29mpg. Airplane emissions are very hard to estimate. The figure above is based upon long-haul flights in economy class for just CO2 emissions. However, there may be at least as much global warming effect from other aircraft emissions in the upper atmosphere, such as ozone created from NOx or condensation trails, as from CO2. Based on the estimation that a tree will sequester 650 kg of carbon over its lifetime, each conference participant would have to plant approximately two trees to offset their share of 1,051 kg of carbon dioxide emissions.
128
APPENDIX III: RELEVANT LITERATURE
Agarwal, Bina. 2001. “Participatory Exclusions, Community Forestry and Gender: An Analysis for South Asia and a Conceptual Framework”. World Development. 29 (10):1623-1648. The Association of American Geographers GCLP Research Team. 2003. Global Change and Local Places: Estimating, Understanding, and Reducing Greenhouse Gases. Cambridge University Press. Berkes, F. 2002. “Cross-scale institutional linkages: Perspectives from the bottom up”. The Drama of the Commons, (E. Ostrom, T. Dietz, N. Dolsak, P.C. Stern, S. Stonich and E.U. Weber, eds.) National Academy Press, Washington, DC, pp. 293-321.
Burt, Ronald. 1982. Toward a Structural Theory of Action. New York: Academic Press.
Burt, Ronald. 1987. “Social Contagion and Innovation: Cohesion Versus structural Equivalence”. American Journal of Sociology 92(6): 1287-1335. Burt, Ronald. 1993. “The Social Structure of Competition”. Explorations in Economic Sociology, edited by Richard Swedberg. Sage, New York, pp. 65-103. Canan, P and Michael Hennessy. 1989. “Tourism, the Growth Machine and the Selling of Culture.” Sociological Perspectives. vol. 32, No.2:227-243. Canan, P. and Michael Hennessy. 1982. “The Moloka’i Databook: Community Values and Energy Development”. Univ. Hawaii: Department of Urban and Regional Planning. Canan, Penelope and Nancy Reichman. 2002. Ozone Connections: Expert Networks in Global Environmental Governance. Greenleaf. Caniglia, B.S. 2004. “Human Behavior & Land Use”. Oklahoma’s Environment: Pursuing a Responsible Balance. Oklahoma City: The Oklahoma Academy. Dibble, Catherine. 2001. “Beyond Data: Handling Spatial and Analytical Contexts with Genetics Based Machine Learning”. Chapter 3, Spatial Evolutionary Modeling, Oxford University Press. Fernandez, Roberto M. and Roger V. Gould. “A Dilemma of State Power: Brokerage and Influence in the National Health Policy Domain”. American Journal of Sociology, Volume 99, Number 6 (May 1994): 1455 – 91. Harrington, John. 2003. “Altering Attitudes in the Name of Carbon Fixation”. Oklahoma Conservation Commission. January 6, 2003. Oklahoma Carbon Sequestration Enhancement Act.

129
Mats Lindgren and Hans Banhold. 2003. Scenario Planning: The Link Between Future and Strategy. New York : Palgrave Macmillan.
Moody, James and Douglas R. White. “Social Cohesion and Embeddedness: A Hierarchical Conception of Social Groups”. American Sociological Review, 2003. Moloch, Harvey. 1976. "The City as Growth Machine: Towards a Political Economy of Place." American Journal of Sociology 82(2): 309-352. Perrow, Charles. 1996. Complex Organizations: A critical Essay. McGraw Hill. Porter, Michael. 1998. Competitive Strategy: Techniques for Analyzing Industries and Competitors. Free Press. Worster, Donald. 1982. Dust Bowl: The Southern Plains in the 1930s. New York: Oxford University Press.