proceedings of the international conference on frontiers...
TRANSCRIPT

Advances in Intelligent Systems and Computing 247
Proceedings of the International Conference on Frontiers of Intelligent Computing: Theory andApplications (FICTA) 2013
Suresh Chandra SatapathySiba K. UdgataBhabendra Narayan Biswal Editors

Advances in Intelligent Systems and Computing
Volume 247
Series Editor
Janusz Kacprzyk, Warsaw, Poland
For further volumes:
http://www.springer.com/series/11156

Suresh Chandra Satapathy · Siba K. UdgataBhabendra Narayan BiswalEditors
Proceedings of theInternational Conferenceon Frontiers of IntelligentComputing: Theory andApplications (FICTA) 2013
ABC

EditorsSuresh Chandra SatapathyDepartment of Computer Science
and Engineering,Anil Neerukonda Institute of Technology
and Sciences,Vishakapatnam, Andhra Pradesh,India
Siba K. UdgataUniversity of Hyderabad,Hyderabad, Andhra Pradesh,India
Bhabendra Narayan BiswalBhubaneswar Engineering College,Bhubaneswar, Odisa,India
ISSN 2194-5357 ISSN 2194-5365 (electronic)ISBN 978-3-319-02930-6 ISBN 978-3-319-02931-3 (eBook)DOI 10.1007/978-3-319-02931-3Springer Cham Heidelberg New York Dordrecht London
Library of Congress Control Number: 2013951279
c© Springer International Publishing Switzerland 2014This work is subject to copyright. All rights are reserved by the Publisher, whether the whole or part of thematerial is concerned, specifically the rights of translation, reprinting, reuse of illustrations, recitation, broad-casting, reproduction on microfilms or in any other physical way, and transmission or information storageand retrieval, electronic adaptation, computer software, or by similar or dissimilar methodology now knownor hereafter developed. Exempted from this legal reservation are brief excerpts in connection with reviewsor scholarly analysis or material supplied specifically for the purpose of being entered and executed on acomputer system, for exclusive use by the purchaser of the work. Duplication of this publication or partsthereof is permitted only under the provisions of the Copyright Law of the Publisher’s location, in its cur-rent version, and permission for use must always be obtained from Springer. Permissions for use may beobtained through RightsLink at the Copyright Clearance Center. Violations are liable to prosecution underthe respective Copyright Law.The use of general descriptive names, registered names, trademarks, service marks, etc. in this publicationdoes not imply, even in the absence of a specific statement, that such names are exempt from the relevantprotective laws and regulations and therefore free for general use.While the advice and information in this book are believed to be true and accurate at the date of publication,neither the authors nor the editors nor the publisher can accept any legal responsibility for any errors oromissions that may be made. The publisher makes no warranty, express or implied, with respect to the materialcontained herein.
Printed on acid-free paper
Springer is part of Springer Science+Business Media (www.springer.com)

Preface
This AISC volume contains the papers presented at the Second InternationalConference on Frontiers in Intelligent Computing: Theory and Applications(FICTA-2013) held during 14–16 November 2013 organized by BhubaneswarEngineering College (BEC), Bhubaneswar, Odisa, India.
FICTA-2013 is the second edition of FICTA 2012 which is aimed to bringresearchers from academia and industry to report, deliberate and review thelatest progresses in the cutting-edge research pertaining to intelligent computingand its applications to various engineering fields. FICTA 2012 was conducted byBEC and was a big success in achieving its target.
FICTA-2013 had received a good number of submissions from the differentareas relating to intelligent computing and its applications and after a rigor-ous peer-review process with the help of our program committee members andexternal reviewers finally we accepted 63 papers.
The conference featured many distinguished keynote address by eminentspeakers like Dr. K.P.N. Murthy, University of Hyderabad, India, Dr. M. PrasadBabu, Andhra University, Vishakhapatnam, Dr. Naeem Hannoon, MultimediaUniversity, Malaysia, Dr. Swagatam Das, ISI Kolkata.
We take this opportunity to thank authors of all submitted papers for theirhard work, adherence to the deadlines and patience with the review process.The quality of a referred volume depends mainly on the expertise and dedica-tion of the reviewers. We are indebted to the program committee members andexternal reviewers who not only produced excellent reviews but also did thesein short time frames. Special thanks to Ms Pritee Parwekar, Jaypee Instituteof Information Technology, Nodia for timely support in doing extensive reviewwork.
We would also like to thank Bhubaneswar Engineering College (BEC),Bhubaneswar having coming forward to support us to organize the second editionof this conference in the series. Our heartfelt thanks are due to Er. Pravat Ran-jan Mallick, Chairman, KGI, Bhubaneswar for the unstinted support to makethe conference a grand success. Er. Alok Ranjan Mallick, Vice-Chairman, KGI,Bhubaneswar and Chairman of BEC deserve our heartfelt thanks for continuing
VI Preface
to support us from FICTA 2012 onwards. It is due to him FICTA 2013 couldbe organized in BEC campus for second time. Needless to say Mr. Alok hasbeen the source of inspiration from the very conceptualization of this conferenceseries. We are amazed to note the enthusiasm of all faculty, staff and studentsof this young college BEC to organize the conference in such a professional way.Involvements of faculty co-ordinators and student volunteer are praise worthy inevery respect. We are hopeful that this intention of conducting such high levelof conferences will go a long way to make BEC to carve the niche to become aprestigious engineering college in the country. We are confident that in futuretoo we would like to organize many more international level conferences in thisbeautiful campus. We would also like to thank our sponsors for providing all thesupport and financial assistance.
We thank Prof. P.K. Dash, SOA University, Bhubaneswar and Prof. GanapatiPanda, Dy Director, IIT Bhubaneswar for providing valuable guidelines andinspirations to overcome various difficulties in the process of organizing thisconference as Honorary General Chairs of this Conference. We extend our heart-felt thanks to Prof. P.N. Suganthan, NTU Singapore for guiding us being theGeneral chair of the conference. Dr. B.K. Panigrahi, IIT Delhi and Dr. SwagatamDas, ISI Kolkota deserves special thanks for being with us from the beginning tothe end of this conference, without their support this conference could never havebeen successful. We would also like to thank the participants of this conference,who have considered the conference above all hardships. Finally, we would like tothank all the volunteers who spent tireless efforts in meeting the deadlines andarranging every detail to make sure that the conference can run smoothly. Allthe efforts are worth and would please us all, if the readers of this proceedingsand participants of this conference found the papers and conference inspiringand enjoyable.
Our sincere thanks to all press print & electronic media for their excellentcoverage of this conference.
Volume Editors
November 2013 Dr. Suresh Chandra SatapathyDr. Siba K. Udgata
Dr. Bhabendra Narayan Biswal

Organization
Organizing Committee
Chief Patron
Er. Pravat Ranjan Mallick,Chairman, KGI, Bhubaneswar
Patron
Er. Alok Ranjan Mallick,Vice-Chairman, KGI, BhubaneswarChairman, BEC, Bhubaneswar
Organizing Secretary
Prof B.N. Biswal,Director (A &A), BEC, Bhubaneswar
Honorary Chairs
Dr. P.K. Dask, SMIEEE,FNAE, Director(Research),SOA University, Bhubaneswar, IndiaDr. Ganapati Panda, SMIEEE, FNAE,Deputy Director, IIT, Bhubaneswar, India
General Chairs
Dr. P.N. Suganthan,NTU, SingaporeDr. Swagatam Das.ISI, Kolkota

VIII Organization
Steering Committee Chair
Dr B.K. Panigrahi, IIT, Delhi, India
Program Chairs
Dr. Suresh Chandra satapathy,ANITS, Vishakapatnam, IndiaDr. S.K. Udgata,University of Hyderabad, IndiaDr B.N. Biswal,Director (A &A), BEC, Bhubaneswar, India
International Advisory Committee/Technical Committee
P.K. Patra, IndiaSateesh Pradhan, IndiaJ.V.R Murthy, IndiaT.R. Dash, KambodiaMaurice Clerc, FranceRoderich Gross, EnglandSangram Samal, IndiaK.K. Mohapatra, IndiaL. Perkin, USASumanth Yenduri, USACarlos A. Coello Coello, MexicoDipankar Dasgupta, USAPeng Shi, UKSaman Halgamuge, AustraliaJeng-Shyang Pan, TaiwanX.Z. Gao, FinlandJuan Luis Fernandez Martınez,
CaliforniaOscar Castillo, MexcicoLeandro Dos Santos Coelho, BrazilHeitor Silverio Lopes, BrazilRafael Stubs Parpinelli, BrazilS.S. Pattanaik, IndiaGerardo Beni, USANamrata Khemka, USAG.K. Venayagamoorthy, USAK. Parsopoulos, GreeceZong Woo Geem, USALingfeng Wang, ChinaAthanasios V. Vasilakos, Athens
S.G. Ponnambalam, MalaysiaPei-Chann Chang, TaiwanYing Tan, ChinaChilukuri K. Mohan, USAM.A. Abido, Saudi ArabiaSaeid Nahavandi, AustraliaAlmoataz Youssef Abdelaziz, EgyptHai Bin Duan, ChinaDelin Luo, ChinaM.K. Tiwari, IndiaA.Damodaram, IndiaOscar Castillo, MexcicoJohn MacIntyre, EnglandRafael Stubs Parpinelli, BrazilJeng-Shyang Pan, TaiwanP.K. Singh, IndiaSachidananda Dehuri, IndiaP.S. Avadhani, IndiaG. Pradhan, IndiaAnupam Shukla, IndiaDilip Pratihari, IndiaAmit Kumar, IndiaSrinivas Sethi, IndiaLalitha Bhaskari, IndiaV. Suma, IndiaPritee Parwekar, IndiaPradipta Kumar Das, IndiaDeviprasad Das, IndiaJ.R. Nayak, India

Organization IX
Organizing committee
Dr. Sangram Samal, HOD, (Aeronautical Engineering)Dr. P.P. Das, HOD,(Civil Engineering)Prof. R.K. Behuria, HOD, (Mechanical Engineering)Prof. P.M. Dash, HOD, (Electrical and Electronics Engineering)Prof. M.K. Swain, HOD, (Computer Science Engineering)Prof. A.K. Sutar, HOD, (Electronics and Telecommunication Engineering)Prof. Debasish Panda, HOD, (Dept. of Science and Humanities)Miss. Ankita Kanungoo, Dept. of Electrical and Electronics EngineeringMiss. Sonam Mohapatra, Dept. of Mechanical EngineeringMiss. Rasmita Behera, Dept. of Electrical and Electronics EngineeringMiss. Priyanka Rath, Dept. of Mechanical EngineeringMiss. Sourya Snigdha Mohapatra, Dept. of Civil EngineeringMrs. Susmita Nanda. Dept. of Electronics and Telecommunication Engineering
Contents
Fuzzy Systems
Application of Fuzzy c-Means Clustering for Polymer DataMining for Making SAW Electronic Nose . . . . . . . . . . . . . . . . . . . . . . . 1Prabha Verma, R.D.S. Yadava
Quantitative Identification of Volatile Organics by SAWSensor Transients – Comparative Performance Analysisof Fuzzy Inference and Partial-Least-Square-RegressionMethods . . . . . . . . . . . . . . . . . . . . . . . . . . . . . . . . . . . . . . . . . . . . . . . . . . . . . . . . 9Prashant Singh, R.D.S. Yadava
Effective Routing Protocol in Cognitive Radio Ad HocNetwork Using Fuzzy-Based Reliable CommunicationNeighbor Node Selection . . . . . . . . . . . . . . . . . . . . . . . . . . . . . . . . . . . . . . . 17Srinivas Sethi, Sangita Pal
A Self-tuning Fuzzy PI Controller for Pure IntegratingProcesses . . . . . . . . . . . . . . . . . . . . . . . . . . . . . . . . . . . . . . . . . . . . . . . . . . . . . . . 25Dharmana Simhachalam, Rajani K. Mudi
Implementing Fuzziness in the Pattern Recognition Processfor Improving the Classification of the Patterns BeingRecognised . . . . . . . . . . . . . . . . . . . . . . . . . . . . . . . . . . . . . . . . . . . . . . . . . . . . . 33Sapna Singh, Daya Shankar Singh
Fuzzy Self-tuning of Conventional PID Controllerfor High-Order Processes . . . . . . . . . . . . . . . . . . . . . . . . . . . . . . . . . . . . . . . 41Ritu Rani De (Maity), Rajani K. Mudi
Design of Fuzzy Logic Power System Stabilizerin Multi-machine Power System . . . . . . . . . . . . . . . . . . . . . . . . . . . . . . . . 49M. Megala, C. Cristober Asir Rajan
XII Contents
A Fuzzy C Mean Clustering Algorithm for AutomatedSegmentation of Brain MRI . . . . . . . . . . . . . . . . . . . . . . . . . . . . . . . . . . . . 59Geenu Paul, Tinu Varghese, K.V. Purushothaman, N. Albert Singh
Fuzzy Type – Ahead Keyword Search in RDF Data . . . . . . . . . . . . 67Selvani Deepthi Kavila, Ravi Ravva, Rajesh Bandaru
Human Emotion Classification Using Fuzzy and PCAApproach . . . . . . . . . . . . . . . . . . . . . . . . . . . . . . . . . . . . . . . . . . . . . . . . . . . . . . . 75Soumya Ranjan Mishra, B. Ravikiran, K. Sai Madhu Sudhan,N. Anudeep, G. Jagdish
Machine Learning and Ann
Application of Artificial Neural Networks and Rough SetTheory for the Analysis of Various Medical Problemsand Nephritis Disease Diagnosis . . . . . . . . . . . . . . . . . . . . . . . . . . . . . . . . 83Devashri Raich, P.S. Kulkarni
Optimisation Using Levenberg-Marquardt Algorithmof Neural Networks for Iris . . . . . . . . . . . . . . . . . . . . . . . . . . . . . . . . . . . . . 91Asim Sayed, M. Sardeshmukh, Suresh Limkar
Neural Networks – A Case Study in Gene Identification . . . . . . . . 99V. Bhaskara Murthy, G. Pardha Saradhi Varma
Breast Cancer Diagnosis: An Intelligent Detection SystemUsing Wavelet Neural Network . . . . . . . . . . . . . . . . . . . . . . . . . . . . . . . . . 111V. Dheeba, N. Albert Singh, J. Amar Pratap Singh
Efficient UMTS Location Update and ManagementBased on Wavelet Neural Networks . . . . . . . . . . . . . . . . . . . . . . . . . . . . . 119J. Amar Pratap Singh, J. Dheeba, N. Albert Singh
Discrimination between Alzheimer’s Disease, Mild CognitiveImpairment and Normal Aging Using ANN Based MR BrainImage Segmentation . . . . . . . . . . . . . . . . . . . . . . . . . . . . . . . . . . . . . . . . . . . . 129Tinu Varghese, R. Sheela Kumari, P.S. Mathuranath, N. Albert Singh
Modified Mean Square Error Algorithm with Reduced Costof Training and Simulation Time for Character Recognitionin Backpropagation Neural Network . . . . . . . . . . . . . . . . . . . . . . . . . . . . 137Sapna Singh, Daya Shankar Singh, Shobhit Kumar
A Novel Approach for Odia Part of Speech Tagging UsingArtificial Neural Network . . . . . . . . . . . . . . . . . . . . . . . . . . . . . . . . . . . . . . . 147Bishwa Ranjan Das, Srikanta Patnaik

Contents XIII
Fractional Fourier Transform Based Features for MusicalInstrument Recognition Using Machine Learning Techniques . . . 155D.G. Bhalke, C.B. Rama Rao, D.S. Bormane
Longitudinal Evaluation of Structural Changes inFrontotemporal Dementia Using Artificial Neural Networks . . . . 165R. Sheela Kumari, Tinu Varghese, C. Kesavadas, N. Albert Singh,P.S. Mathuranath
Content Based Image Retrieval Using Machine LearningApproach . . . . . . . . . . . . . . . . . . . . . . . . . . . . . . . . . . . . . . . . . . . . . . . . . . . . . . . 173Palepu Pavani, T. Sashi Prabha
Hand Gesture Detection and Recognition Using Affine-Shift,Bag-of-Features and Extreme Learning Machine Techniques . . . . 181M. Kranthi Kiran, T. ShyamVamsi
Comparative Study of Machine Learning Algorithmfor Intrusion Detection System . . . . . . . . . . . . . . . . . . . . . . . . . . . . . . . . . 189K. Sravani, P. Srinivasu
Evolutionary Computation Techniques and ItsApplications
Grammatical Swarm Based-Adaptable Velocity UpdateEquations in Particle Swarm Optimizer . . . . . . . . . . . . . . . . . . . . . . . . . 197Tapas Si, Arunava De, Anup Kumar Bhattacharjee
Performance of Teaching Learning Based OptimizationAlgorithm with Various Teaching Factor Values for SolvingOptimization Problems . . . . . . . . . . . . . . . . . . . . . . . . . . . . . . . . . . . . . . . . . 207M. Ramakrishna Murty, J.V.R. Murthy, P.V.G.D. Prasad Reddy,Anima Naik, Suresh Chandra Satapathy
Efficient Clustering of Dataset Based on DifferentialEvolution . . . . . . . . . . . . . . . . . . . . . . . . . . . . . . . . . . . . . . . . . . . . . . . . . . . . . . . 217Anima Naik, Suresh Chandra Satapathy
Numerical Optimization of Novel Functions Using vTLBOAlgorithm . . . . . . . . . . . . . . . . . . . . . . . . . . . . . . . . . . . . . . . . . . . . . . . . . . . . . . 229S. Mohankrishna, Anima Naik, Suresh Chandra Satapathy,K. Raja Sekhara Rao, B.N. Biswal
Sensitivity Analysis of Load-Frequency Control of PowerSystem Using Gravitational Search Algorithm . . . . . . . . . . . . . . . . . . 249Rabindra Kumar Sahu, Umesh Kumar Rout, Sidhartha Panda

XIV Contents
Privacy Preserving Distributed Data Mining withEvolutionary Computing . . . . . . . . . . . . . . . . . . . . . . . . . . . . . . . . . . . . . . . . 259Lambodar Jena, Narendra Ku. Kamila, Sushruta Mishra
Boundary Searching Genetic Algorithm: A Multi-objectiveApproach for Constrained Problems . . . . . . . . . . . . . . . . . . . . . . . . . . . . 269Shubham J. Metkar, Anand J. Kulkarni
Security Analysis of Digital Stegno Images Using GeneticAlgorithm . . . . . . . . . . . . . . . . . . . . . . . . . . . . . . . . . . . . . . . . . . . . . . . . . . . . . . 277G. Praneeta, B. Pradeep
Applications of Intelligent Techniques to ComputerNetworks, Security and Distributed Systems
Probability and Priority Based Routing Approachfor Opportunistic Networks . . . . . . . . . . . . . . . . . . . . . . . . . . . . . . . . . . . . . 285Kiran Avhad, Suresh Limkar, Anagha Kulkarni
D&PMV: New Approach for Detection and Preventionof Misbehave/Malicious Vehicles from VANET . . . . . . . . . . . . . . . . . 293Megha Kadam, Suresh Limkar
On the Use of MFCC Feature Vector Clustering for EfficientText Dependent Speaker Recognition . . . . . . . . . . . . . . . . . . . . . . . . . . . 305Ankit Samal, Deebyadeep Parida, Mihir Ranjan Satapathy,Mihir Narayan Mohanty
A Survey on Power Aware Routing Protocols for MobileAd-Hoc Network . . . . . . . . . . . . . . . . . . . . . . . . . . . . . . . . . . . . . . . . . . . . . . . 313Samrat Sarkar, Koushik Majumder
A New Trust Based Secure Routing Scheme in MANET . . . . . . . . 321Mousumi Sardar, Koushik Majumder
IWDRA: An Intelligent Water Drop Based QoS-AwareRouting Algorithm for MANETs . . . . . . . . . . . . . . . . . . . . . . . . . . . . . . . 329Debajit Sensarma, Koushik Majumder
Design and Performance Analysis of D-STATCOM forNon-linear Load Composite Compensation . . . . . . . . . . . . . . . . . . . . . . 337Gokulananda Sahu, Kamalakanta Mahapatra, Subrat Kumar Sahu
AODV Based Black-Hole Attack Mitigation in MANET . . . . . . . . 345Subhashis Banerjee, Mousumi Sardar, Koushik Majumder
Path Planning Strategy for Mobile Robot Navigation UsingMANFIS Controller . . . . . . . . . . . . . . . . . . . . . . . . . . . . . . . . . . . . . . . . . . . . 353Prases Kumar Mohanty, Dayal R. Parhi
Contents XV
Speech Emotion Recognition Using Regularized DiscriminantAnalysis . . . . . . . . . . . . . . . . . . . . . . . . . . . . . . . . . . . . . . . . . . . . . . . . . . . . . . . . 363Swarna Kuchibhotla, B.S. Yalamanchili, H.D. Vankayalapati,K.R. Anne
An Extensive Selection of Features as Combinationsfor Automatic Text Categorization . . . . . . . . . . . . . . . . . . . . . . . . . . . . . 371Aamir Sohail, Chaitanya Kotha, Rishanth Kanakadri Chavali,Krishna Meghana, Suneetha Manne, Sameen Fatima
Performance Investigation of DMV (Detecting MaliciousVehicle) and D&PMV (Detection and Prevention ofMisbehave/Malicious Vehicles): Future Road Map . . . . . . . . . . . . . . 379Megha Kadam, Suresh Limkar
Performance Analysis of OFDM Based DAB Systems UsingBCH-FEC Coding Technique . . . . . . . . . . . . . . . . . . . . . . . . . . . . . . . . . . . 389Arun Agarwal, Kabita Agarwal
A Study of Incomplete Data – A Review . . . . . . . . . . . . . . . . . . . . . . . 401S.S. Gantayat, Ashok Misra, B.S. Panda
Application of Sensor in Shoe . . . . . . . . . . . . . . . . . . . . . . . . . . . . . . . . . . . 409Pritee Parwekar, Akansha Gupta, Shrey Arora
Robot Assisted Emergency Intrusion Detection and Avoidancewith a Wireless Sensor Network . . . . . . . . . . . . . . . . . . . . . . . . . . . . . . . . 417Pritee Parwekar, Rishabh Singhal
Interaction between Internet Based TCP Variantsand Routing Protocols in MANET . . . . . . . . . . . . . . . . . . . . . . . . . . . . . 423Sukant Kishoro Bisoy, Prasant Kumar Patnaik
Symbolic Data Analysis for the Development of ObjectOriented Data Model for Sensor Data Repository . . . . . . . . . . . . . . . 435Doreswamy, Srinivas Narasegouda
Fault Detection in Sensor Network Using DBSCANand Statistical Models . . . . . . . . . . . . . . . . . . . . . . . . . . . . . . . . . . . . . . . . . . 443Doreswamy, Srinivas Narasegouda
Fast SSIM Index for Color Images EmployingReduced-Reference Evaluation . . . . . . . . . . . . . . . . . . . . . . . . . . . . . . . . . . 451Vikrant Bhateja, Aastha Srivastava, Aseem Kalsi
A Novel Weighted Diffusion Filtering Approach for SpeckleSuppression in Ultrasound Images . . . . . . . . . . . . . . . . . . . . . . . . . . . . . . 459Vikrant Bhateja, Gopal Singh, Atul Srivastava
XVI Contents
Detection of Progression of Lesions in MRI Using ChangeDetection . . . . . . . . . . . . . . . . . . . . . . . . . . . . . . . . . . . . . . . . . . . . . . . . . . . . . . . 467Ankita Mitra, Arunava De, Anup Kumar Bhattacharjee
Optimal Covering Problem for a MANET through GeometricTheory . . . . . . . . . . . . . . . . . . . . . . . . . . . . . . . . . . . . . . . . . . . . . . . . . . . . . . . . . 475Jagadish Gurrala, Jayaprakash Singampalli
Data Minning
Hierarchical Divisive Clustering with Multi View-Point BasedSimilarity Measure . . . . . . . . . . . . . . . . . . . . . . . . . . . . . . . . . . . . . . . . . . . . . 483S. Jayaprada, Amarapini Aswani, G. Gayathri
Discovery of Knowledge from Query Groups . . . . . . . . . . . . . . . . . . . . 493Sunita A. Yadwad, M. Pavani
D-Pattern Evolving and Inner Pattern Evolving for HighPerformance Text Mining . . . . . . . . . . . . . . . . . . . . . . . . . . . . . . . . . . . . . . . 501B. Vignani, Suresh Chandra Satapathy
A Fast Auto Exposure Algorithm for Industrial ApplicationsBased on False-Position Method . . . . . . . . . . . . . . . . . . . . . . . . . . . . . . . . 509B. Ravi Kiran, G.V.N.A. Harsha Vardhan
Web Technologies and Multi Media Applications
Legacy to Web 2.0 . . . . . . . . . . . . . . . . . . . . . . . . . . . . . . . . . . . . . . . . . . . . . . 517Hemant Kumbhar, Raj Kulkarni, Suresh Limkar
A Bio-Chaotic Block Cryptosystem for Privacy Protectionof Multimedia Data . . . . . . . . . . . . . . . . . . . . . . . . . . . . . . . . . . . . . . . . . . . . . 527Musheer Ahmad, Sonia Gupta, A.K. Mohapatra
Some Popular Usability Evaluation Techniques for Websites . . . . 535Sharmistha Roy, Prasant Kumar Pattnaik
A Secure Lightweight and Scalable Mobile PaymentFramework . . . . . . . . . . . . . . . . . . . . . . . . . . . . . . . . . . . . . . . . . . . . . . . . . . . . . 545Shaik Shakeel Ahamad, Siba K. Udgata, Madhusoodhnan Nair
Service Oriented Architecture Based SDI Model for EducationSector in India . . . . . . . . . . . . . . . . . . . . . . . . . . . . . . . . . . . . . . . . . . . . . . . . . . 555Rabindra K. Barik, Arun B. Samaddar
Author Index . . . . . . . . . . . . . . . . . . . . . . . . . . . . . . . . . . . . . . . . . . . . . . . . . . . 563

S.C. Satapathy, S.K. Udgata, and B.N. Biswal (eds.), FICTA 2013, Advances in Intelligent Systems and Computing 247,
1
DOI: 10.1007/978-3-319-02931-3_1, © Springer International Publishing Switzerland 2014
Application of Fuzzy c-Means Clustering for Polymer Data Mining for Making SAW Electronic Nose
Prabha Verma and R.D.S. Yadava
Sensor & Signal Processing Laboratory, Department of Physics, Faculty of Science, Banaras Hindu University, Varanasi - 221005, India
{pverma.bhu,ardius}@gmail.com, [email protected]
Abstract. Polymers provide chemical interfaces to electronic nose sensors for detection of volatile organic compounds. An electronic nose combines a proper-ly selected set of sensors (array) with pattern recognition methods for generat-ing information rich odor response patterns and extracting chemical identities. Each sensor in the array is functionalized by a different polymer for diversely selective sorption of target chemical analytes. Selection of an optimal set of po-lymers from a long list of potential polymers is crucial for cost-effective high performance development of electronic noses. In this paper we present an ap-plication of fuzzy c-means clustering on partition coefficient data available for target vapors and most prospective polymers for selection of minimum number of polymers that can create maximum discrimination between target chemical compounds. The selection method has been validated by simulating a polymer coated surface acoustic wave (SAW) sensor array for monitoring fish freshness.
Keywords: Fuzzy c-means clustering, polymer selection, SAW electronic nose, fish quality monitoring, pattern recognition.
1 Introduction
Electronic nose is an electronic instrument that sniffs odor causing volatile organic compounds (VOCs) in target samples and creates chemical fingerprints for identifica-tion. Its operational paradigm mimics mammalian smell sensing organ [1], [2]. An electronic nose instrument measures odor responses by using an array of chemical microelectronic sensors and combines multivariate data processing capability of pat-tern recognition methods [3], [4]. Microelectronic sensors such as surface acoustic wave (SAW) oscillators or MEMS cantilevers need polymeric interfaces for chemical selectivity. A proper selection of polymers is crucial for encoding information about the target chemicals in sensor array responses. The objective in polymer selection is that the selected set provides adequate chemical interaction possibilities with target chemical molecules without excessive overlap. Mutually orthogonal interaction diver-sity between vapor molecules and polymer set is vital for successful operation of electronic nose system [5], [6], [7], [8], [9].
In the present work we demonstrate application of fuzzy c-means (FCM) clustering technique for determining an optimal subset of polymers for SAW sensor array from a
2 P. Verma and R.D.S. Yadava
larger set of prospective polymers. The analysis is based on calculated partition coef-ficient data by using LSER relation and experimentally determined solvation parame-ters of polymers and target vapors. The analysis needs a prototype detection target. For this, we targeted establishing freshness or spoilage of fish. Fish is a highly con-sumed food product. Monitoring fish freshness or spoilage is of significant concern for ascertaining its fitness for consumption, nutritional content and taste [10]. As the fish meat loses its freshness it starts decomposing and emitting biogenic amines and other hazardous compounds dangerous to the health [11], [12], [13]. The validation of FCM method for polymer selection is done by simulating SAW sensor data based on selected polymers and analyzing response patterns by principal component analysis.
2 Volatile Organics for Fish Signature
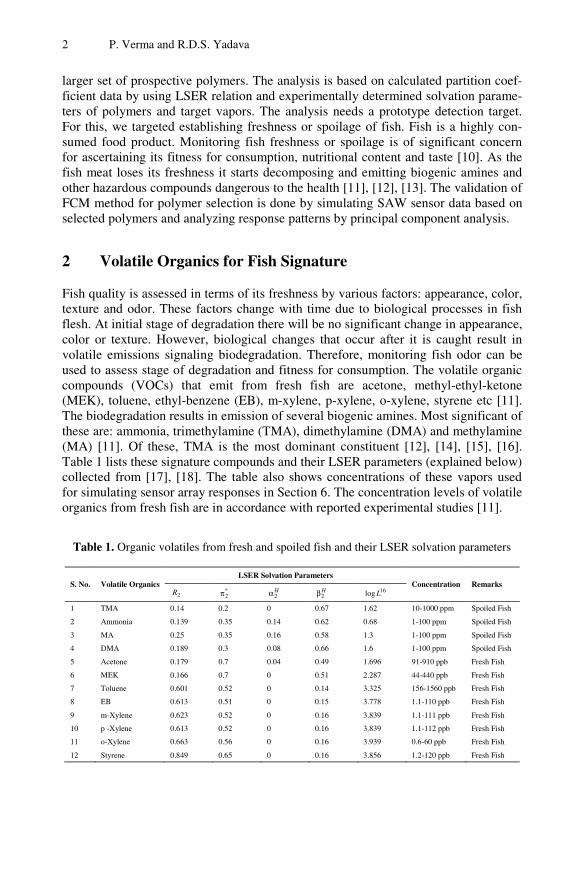
Fish quality is assessed in terms of its freshness by various factors: appearance, color, texture and odor. These factors change with time due to biological processes in fish flesh. At initial stage of degradation there will be no significant change in appearance, color or texture. However, biological changes that occur after it is caught result in volatile emissions signaling biodegradation. Therefore, monitoring fish odor can be used to assess stage of degradation and fitness for consumption. The volatile organic compounds (VOCs) that emit from fresh fish are acetone, methyl-ethyl-ketone (MEK), toluene, ethyl-benzene (EB), m-xylene, p-xylene, o-xylene, styrene etc [11]. The biodegradation results in emission of several biogenic amines. Most significant of these are: ammonia, trimethylamine (TMA), dimethylamine (DMA) and methylamine (MA) [11]. Of these, TMA is the most dominant constituent [12], [14], [15], [16]. Table 1 lists these signature compounds and their LSER parameters (explained below) collected from [17], [18]. The table also shows concentrations of these vapors used for simulating sensor array responses in Section 6. The concentration levels of volatile organics from fresh fish are in accordance with reported experimental studies [11].
Table 1. Organic volatiles from fresh and spoiled fish and their LSER solvation parameters
S. No. Volatile Organics LSER Solvation Parameters
Concentration Remarks 2R *
2π H2α H
2β 16log L
1 TMA 0.14 0.2 0 0.67 1.62 10-1000 ppm Spoiled Fish
2 Ammonia 0.139 0.35 0.14 0.62 0.68 1-100 ppm Spoiled Fish
3 MA 0.25 0.35 0.16 0.58 1.3 1-100 ppm Spoiled Fish
4 DMA 0.189 0.3 0.08 0.66 1.6 1-100 ppm Spoiled Fish
5 Acetone 0.179 0.7 0.04 0.49 1.696 91-910 ppb Fresh Fish
6 MEK 0.166 0.7 0 0.51 2.287 44-440 ppb Fresh Fish
7 Toluene 0.601 0.52 0 0.14 3.325 156-1560 ppb Fresh Fish
8 EB 0.613 0.51 0 0.15 3.778 1.1-110 ppb Fresh Fish
9 m-Xylene 0.623 0.52 0 0.16 3.839 1.1-111 ppb Fresh Fish
10 p -Xylene 0.613 0.52 0 0.16 3.839 1.1-112 ppb Fresh Fish
11 o-Xylene 0.663 0.56 0 0.16 3.939 0.6-60 ppb Fresh Fish
12 Styrene 0.849 0.65 0 0.16 3.856 1.2-120 ppb Fresh Fish

Application of Fuzzy c-Means Clustering for Polymer Data Mining 3
3 Prospective Polymers for Sensor Coating
Table 2 shows a set of 12 commercially available polymers whose LSER parame-ters are available and which have known chemical affinities for the target vapors listed in Table 1. These data were collected from published reports [17], [20], [21], [22].
Table 2. Potential polymers and their LSER solvation parameters
4 LSER and K-Matrix
LSER equation for the partition coefficient vp CCK /= for a given vapor and poly-
mer combination is written as [17], [18]
+β+α+π++= ∗ 162222log lLogbasrRcK HH (1)
where solubility parameters basr , , , and l are associated with the polymer
and βαπ∗ HHR 2222 , , , and 16log L are the complimentary solubility parameters
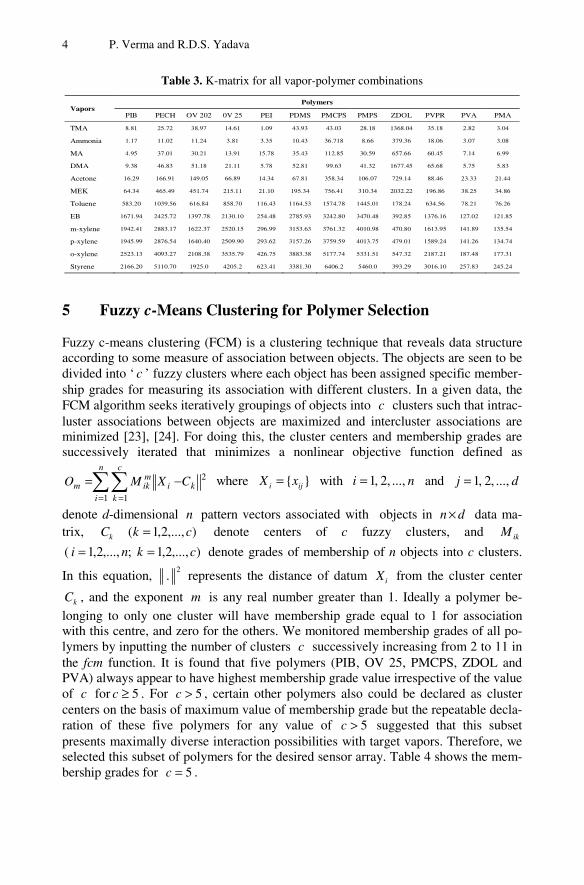
associated with the vapor. The logarithm on the left hand side is with respect to base 10. By using the LSER equation (1) and the solvation parameter values given in Tables 1 and 2, partition coefficients (K) for different vapor-polymer pairs were calculated as shown in Table 3. The table shows vapors in rows and polymers in col-umns. With 12 target vapors and 12 potential polymers this table defines a 1212× multivariate data matrix which is commonly referred to as K-matrix. The K-matrix can be viewed as data for vapors as objects where each vapor is represented by a set of value realizations by 12 polymers as variables. Also, the transpose of K-matrix
TK can be interpreted as data for the polymers as objects represented by 12 vapors as variables.
S. No. Polymers
Solvation Parameter Mass Density
pρ
(g.cm-3) c r s a b l
1 PIB -0.77 -0.08 0.37 0.18 0 1.02 0.918
2 PECH -0.75 0.1 1.63 1.45 0.71 0.83 1.36
3 OV202 -0.39 -0.48 1.3 0.44 0.71 0.81 1.252
4 OV25 -0.846 0.177 1.287 0.556 0.44 0.885 1.15
5 PEI -1.58 0.495 1.516 7.018 0 0.77 1.05
6 PDMS 0.18 -0.05 0.21 0.99 0.1 0.84 0.965
7 PMCPS -0.12 0.02 1.65 2.71 0.38 0.72 1
8 PMPS -0.2 -0.03 0.97 1.11 0.1 0.86 1.12
9 ZDOL -0.49 -0.75 0.61 1.44 3.67 0.71 1.8
10 PVPR -0.57 0.67 0.83 2.25 1.03 0.72 1.01
11 PVA -0.698 0.193 1.595 1.886 0 0.495 1.283
12 PMA -0.617 0.257 1.472 1.656 0 0.475 1.263
4 P. Verma and R.D.S. Yadava
Table 3. K-matrix for all vapor-polymer combinations
5 Fuzzy c-Means Clustering for Polymer Selection
Fuzzy c-means clustering (FCM) is a clustering technique that reveals data structure according to some measure of association between objects. The objects are seen to be divided into ‘ c ’ fuzzy clusters where each object has been assigned specific member-ship grades for measuring its association with different clusters. In a given data, the FCM algorithm seeks iteratively groupings of objects into c clusters such that intrac-luster associations between objects are maximized and intercluster associations are minimized [23], [24]. For doing this, the cluster centers and membership grades are successively iterated that minimizes a nonlinear objective function defined as
2
1 1
= =
−=n
i
c
kki
mikm CXMO where }{ iji xX = with ni ..., ,2 ,1= and dj ..., ,2 ,1=
denote d-dimensional n pattern vectors associated with objects in dn × data ma-trix, kC ),...,2,1( ck = denote centers of c fuzzy clusters, and ikM
),...,2,1 ;,...,2,1 ( ckni == denote grades of membership of n objects into c clusters.
In this equation, 2
. represents the distance of datum iX from the cluster center
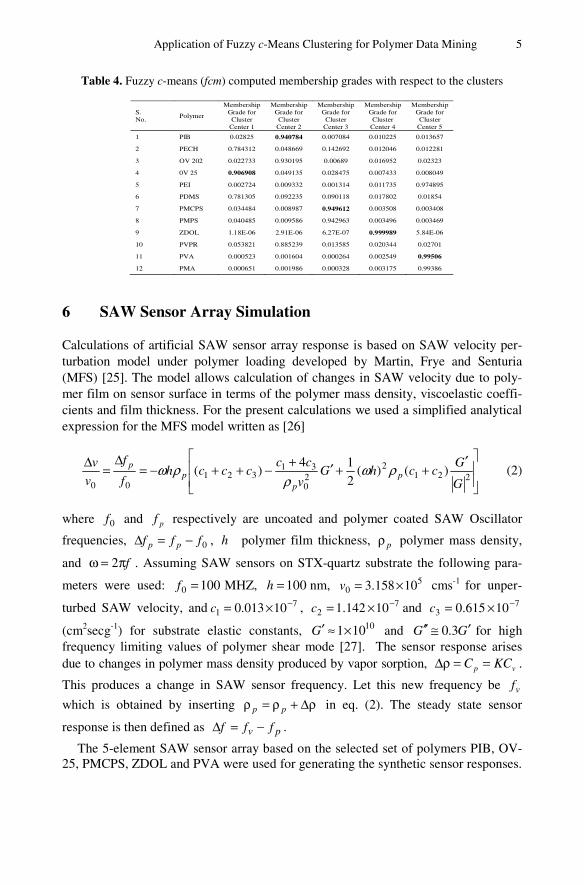
kC , and the exponent m is any real number greater than 1. Ideally a polymer be-longing to only one cluster will have membership grade equal to 1 for association with this centre, and zero for the others. We monitored membership grades of all po-lymers by inputting the number of clusters c successively increasing from 2 to 11 in the fcm function. It is found that five polymers (PIB, OV 25, PMCPS, ZDOL and PVA) always appear to have highest membership grade value irrespective of the value of c for 5≥c . For 5>c , certain other polymers also could be declared as cluster centers on the basis of maximum value of membership grade but the repeatable decla-ration of these five polymers for any value of 5>c suggested that this subset presents maximally diverse interaction possibilities with target vapors. Therefore, we selected this subset of polymers for the desired sensor array. Table 4 shows the mem-bership grades for 5=c .
Vapors Polymers
PIB PECH OV 202 0V 25 PEI PDMS PMCPS PMPS ZDOL PVPR PVA PMA
TMA 8.81 25.72 38.97 14.61 1.09 43.93 43.03 28.18 1368.04 35.18 2.82 3.04
Ammonia 1.17 11.02 11.24 3.81 3.35 10.43 36.718 8.66 379.36 18.06 3.07 3.08
MA 4.95 37.01 30.21 13.91 15.78 35.43 112.85 30.59 657.66 60.45 7.14 6.99
DMA 9.38 46.83 51.18 21.11 5.78 52.81 99.63 41.32 1677.45 65.68 5.75 5.83
Acetone 16.29 166.91 149.05 66.89 14.34 67.81 358.34 106.07 729.14 88.46 23.33 21.44
MEK 64.34 465.49 451.74 215.11 21.10 195.34 756.41 310.34 2032.22 196.86 38.25 34.86
Toluene 583.20 1039.56 616.84 858.70 116.43 1164.53 1574.78 1445.01 178.24 634.56 78.21 76.26
EB 1671.94 2425.72 1397.78 2130.10 254.48 2785.93 3242.80 3470.48 392.85 1376.16 127.02 121.85
m-xylene 1942.41 2883.17 1622.37 2520.15 296.99 3153.63 3761.32 4010.98 470.80 1613.95 141.89 135.54
p-xylene 1945.99 2876.54 1640.40 2509.90 293.62 3157.26 3759.59 4013.75 479.01 1589.24 141.26 134.74
o-xylene 2523.13 4093.27 2108.38 3535.79 426.75 3883.38 5177.74 5331.51 547.32 2187.21 187.48 177.31
Styrene 2166.20 5110.70 1925.0 4205.2 623.41 3381.30 6406.2 5460.0 393.29 3016.10 257.83 245.24
Application of Fuzzy c-Means Clustering for Polymer Data Mining 5
Table 4. Fuzzy c-means (fcm) computed membership grades with respect to the clusters
6 SAW Sensor Array Simulation
Calculations of artificial SAW sensor array response is based on SAW velocity per-turbation model under polymer loading developed by Martin, Frye and Senturia (MFS) [25]. The model allows calculation of changes in SAW velocity due to poly-mer film on sensor surface in terms of the polymer mass density, viscoelastic coeffi-cients and film thickness. For the present calculations we used a simplified analytical expression for the MFS model written as [26]
′++′+−++−=
Δ=Δ
2212
20
31321
00
)()(2
14)(
G
GcchG
v
ccccch
f
f
v
vp
pp
p ρωρ
ρω (2)
where 0f and pf respectively are uncoated and polymer coated SAW Oscillator
frequencies, 0fff pp −=Δ , h polymer film thickness, pρ polymer mass density,
and fπ=ω 2 . Assuming SAW sensors on STX-quartz substrate the following para-
meters were used: 1000 =f MHZ, 100=h nm, 50 10158.3 ×=v cms-1 for unper-
turbed SAW velocity, and 71 10013.0 −×=c , 7
2 10142.1 −×=c and 73 10615.0 −×=c
(cm2secg-1) for substrate elastic constants, 10101×≈′G and GG ′≅′′ 3.0 for high frequency limiting values of polymer shear mode [27]. The sensor response arises due to changes in polymer mass density produced by vapor sorption, vp KCC ==ρΔ .
This produces a change in SAW sensor frequency. Let this new frequency be vf
which is obtained by inserting ρΔ+ρ=ρ pp in eq. (2). The steady state sensor
response is then defined as pv fff −=Δ .
The 5-element SAW sensor array based on the selected set of polymers PIB, OV- 25, PMCPS, ZDOL and PVA were used for generating the synthetic sensor responses.
S. No.
Polymer
Membership Grade for Cluster
Center 1
Membership Grade for Cluster
Center 2
Membership Grade for Cluster
Center 3
Membership Grade for Cluster
Center 4
Membership Grade for Cluster
Center 5
1 PIB 0.02825 0.940784 0.007084 0.010225 0.013657
2 PECH 0.784312 0.048669 0.142692 0.012046 0.012281
3 OV 202 0.022733 0.930195 0.00689 0.016952 0.02323
4 0V 25 0.906908 0.049135 0.028475 0.007433 0.008049
5 PEI 0.002724 0.009332 0.001314 0.011735 0.974895
6 PDMS 0.781305 0.092235 0.090118 0.017802 0.01854
7 PMCPS 0.034484 0.008987 0.949612 0.003508 0.003408
8 PMPS 0.040485 0.009586 0.942963 0.003496 0.003469
9 ZDOL 1.18E-06 2.91E-06 6.27E-07 0.999989 5.84E-06
10 PVPR 0.053821 0.885239 0.013585 0.020344 0.02701
11 PVA 0.000523 0.001604 0.000264 0.002549 0.99506
12 PMA 0.000651 0.001986 0.000328 0.003175 0.99386
6 P. Verma and R.D.S. Yadava
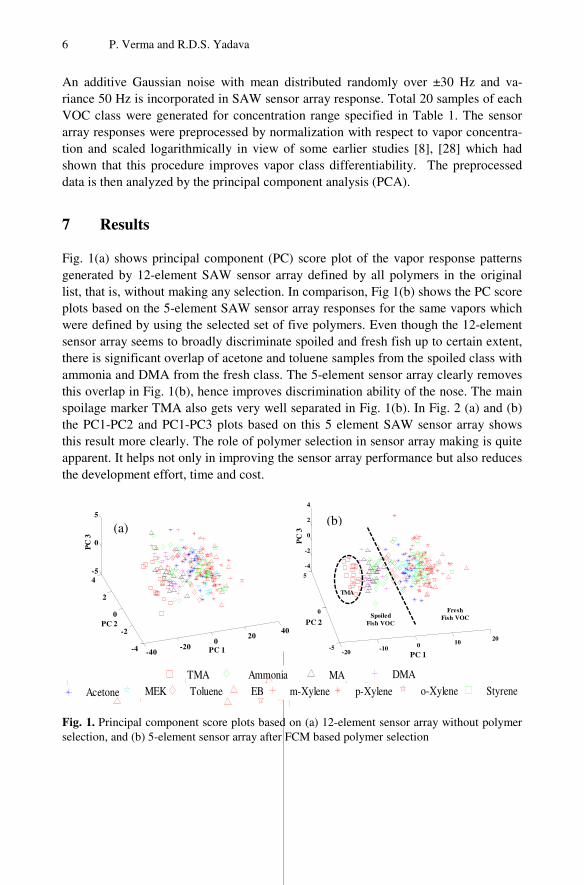
An additive Gaussian noise with mean distributed randomly over ±30 Hz and va-riance 50 Hz is incorporated in SAW sensor array response. Total 20 samples of each VOC class were generated for concentration range specified in Table 1. The sensor array responses were preprocessed by normalization with respect to vapor concentra-tion and scaled logarithmically in view of some earlier studies [8], [28] which had shown that this procedure improves vapor class differentiability. The preprocessed data is then analyzed by the principal component analysis (PCA).
7 Results
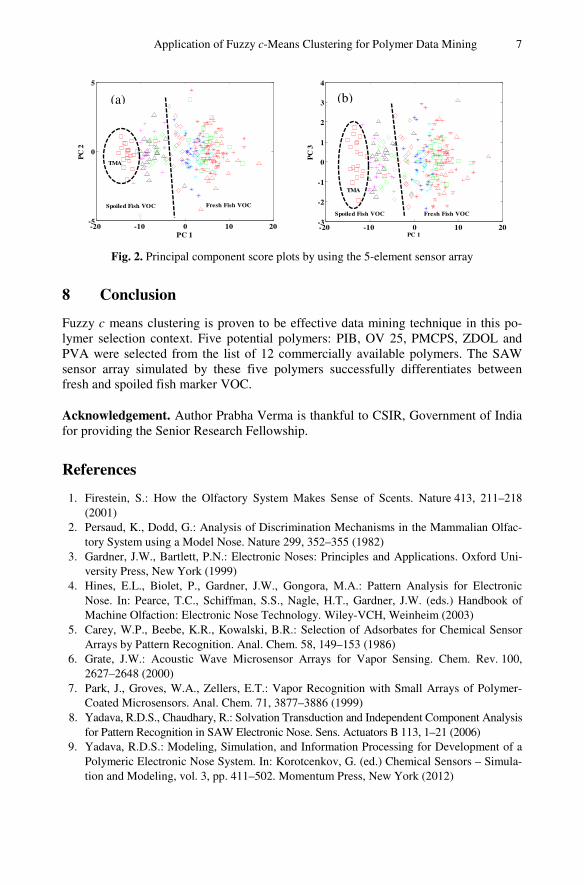
Fig. 1(a) shows principal component (PC) score plot of the vapor response patterns generated by 12-element SAW sensor array defined by all polymers in the original list, that is, without making any selection. In comparison, Fig 1(b) shows the PC score plots based on the 5-element SAW sensor array responses for the same vapors which were defined by using the selected set of five polymers. Even though the 12-element sensor array seems to broadly discriminate spoiled and fresh fish up to certain extent, there is significant overlap of acetone and toluene samples from the spoiled class with ammonia and DMA from the fresh class. The 5-element sensor array clearly removes this overlap in Fig. 1(b), hence improves discrimination ability of the nose. The main spoilage marker TMA also gets very well separated in Fig. 1(b). In Fig. 2 (a) and (b) the PC1-PC2 and PC1-PC3 plots based on this 5 element SAW sensor array shows this result more clearly. The role of polymer selection in sensor array making is quite apparent. It helps not only in improving the sensor array performance but also reduces the development effort, time and cost.
Fig. 1. Principal component score plots based on (a) 12-element sensor array without polymer selection, and (b) 5-element sensor array after FCM based polymer selection
TMA MA DMAAmmoniaTolueneAcetone MEK p-Xylenem-XyleneEB Styreneo-Xylene
-40-20
020
40
-4
-2
0
2
4-5
0
5
PC 1
PC 2
PC
3
(a)
-20-10 0 10
20
-5
0
5
-4
-2
0
2
4
PC 1
PC 2
PC
3
TMA
FreshFish VOCSpoiled
Fish VOC
(b)
Application of Fuzzy c-Means Clustering for Polymer Data Mining 7
Fig. 2. Principal component score plots by using the 5-element sensor array
8 Conclusion
Fuzzy c means clustering is proven to be effective data mining technique in this po-lymer selection context. Five potential polymers: PIB, OV 25, PMCPS, ZDOL and PVA were selected from the list of 12 commercially available polymers. The SAW sensor array simulated by these five polymers successfully differentiates between fresh and spoiled fish marker VOC.
Acknowledgement. Author Prabha Verma is thankful to CSIR, Government of India for providing the Senior Research Fellowship.
References
1. Firestein, S.: How the Olfactory System Makes Sense of Scents. Nature 413, 211–218 (2001)
2. Persaud, K., Dodd, G.: Analysis of Discrimination Mechanisms in the Mammalian Olfac-tory System using a Model Nose. Nature 299, 352–355 (1982)
3. Gardner, J.W., Bartlett, P.N.: Electronic Noses: Principles and Applications. Oxford Uni-versity Press, New York (1999)
4. Hines, E.L., Biolet, P., Gardner, J.W., Gongora, M.A.: Pattern Analysis for Electronic Nose. In: Pearce, T.C., Schiffman, S.S., Nagle, H.T., Gardner, J.W. (eds.) Handbook of Machine Olfaction: Electronic Nose Technology. Wiley-VCH, Weinheim (2003)
5. Carey, W.P., Beebe, K.R., Kowalski, B.R.: Selection of Adsorbates for Chemical Sensor Arrays by Pattern Recognition. Anal. Chem. 58, 149–153 (1986)
6. Grate, J.W.: Acoustic Wave Microsensor Arrays for Vapor Sensing. Chem. Rev. 100, 2627–2648 (2000)
7. Park, J., Groves, W.A., Zellers, E.T.: Vapor Recognition with Small Arrays of Polymer-Coated Microsensors. Anal. Chem. 71, 3877–3886 (1999)
8. Yadava, R.D.S., Chaudhary, R.: Solvation Transduction and Independent Component Analysis for Pattern Recognition in SAW Electronic Nose. Sens. Actuators B 113, 1–21 (2006)
9. Yadava, R.D.S.: Modeling, Simulation, and Information Processing for Development of a Polymeric Electronic Nose System. In: Korotcenkov, G. (ed.) Chemical Sensors – Simula-tion and Modeling, vol. 3, pp. 411–502. Momentum Press, New York (2012)
-20 -10 0 10 20-5
0
5
PC 1
PC
2
Spoiled Fish VOC Fresh Fish VOC
TMA
(a)
-20 -10 0 10 20-3
-2
-1
0
1
2
3
4
PC 1
PC
3
TMA
Spoiled Fish VOC Fresh Fish VOC
(b)
8 P. Verma and R.D.S. Yadava
10. Mahboob, S., Hussain, B., Alkahem, H.F., Al-Akel, A.S., Iqbal, Z.: Volatile Aroma Com-ounds and Organoleptic Comparisons of Meat from Wild and Culured Cirrhina Mrigala and cyprinus carpio. Adv. in Nat. and App. Sci. 3, 113–126 (2009)
11. Phan, N.T., Kim, K.H., Jeon, E.C., Kim, U.H., Sohn, J.R., Pandey, S.K.: Analysis of Vola-tile Organic Compounds Released during Food Decaying Processes. Env. Monit. As-sess. 184, 1683–1692 (2012)
12. Sadok, S., Uglow, R.F., Haswell, S.J.: Determination of Trimethylamine in Fish by Flow Injection Analysis. Anal. Chim. Acta 321, 69–74 (1996)
13. Shalaby, A.R.: Significance of Biogenic Amines to Food Safety and Human Health. Food Res. Inter. 29, 675–690 (1996)
14. Dyer, W.J.: Amines in Fish Muscle: I. Colorometric Determination of Trimethylamine as the Picrate Salt. J. Fish. Res. Bd. Can. 6, 351–358 (1945)
15. Tarr, H.L.A.: Trimethylamine Formation in Relation to the Viable Bacterial Population of Spoiling Fish Muscle. Nature 142, 1078–1078 (1938)
16. Bota, G.M., Harrington, P.B.: Direct Detection of Trimethylamine in Meat Food Products using Ion Mobility Spectrometry. Talanta 68, 629–635 (2006)
17. Abraham, M.H.: Scales of Solute Hydrogen Bonding: Their Construction and Application to Physicochemical and Biochemical Process. Chem. Soc. Rev. 22, 73–83 (1993)
18. Grate, J.W., Abraham, M.H., Wise, B.M.: Design and Information Content of Arrays of Sorption-based Vapor Sensors using Solubility Interactions and Linear Solvation Energy Relationships. In: Ryan, M.A., Shevade, A.V., Taylor, C.J., Homer, M.L., Blanco, M., Stetter, J.R. (eds.) Computational Methods for Sensor Material Selection, pp. 193–218. Springer Science, Business Media, New York (2009)
19. Ho, C.K., Lindgren, E.R., Rawlinson, K.S., McGrath, L.K., Wright, J.L.: Development of a Surface Acoustic Wave Sensor for In-Situ Monitoring of Volatile Organic Compounds. Sensors 3, 236–247 (2003)
20. Matatagui, D., Marti, J., Fernandez, M.J., Fontecha, J.L., Guturrez, J., Gracia, I., Cane, C., Horrilio, M.C.: Chemical Warfare Agents Simulants Detection with an Optimized SAW Sensor Array. Sens. and Actu. B 154, 199–205 (2011)
21. Santiuste, J.M., Dominguez, J.A.G.: Study of Retention Interactions of Solute And Stationary Phase in the Light of the Solvation Model Theory. Ana. Chi. Acta 405, 335–346 (2000)
22. Sanchez, I.C., Rodgers, P.A.: Solubility of Gases in Polymers. Pure & App. Chem. 62, 2107–2114 (1990)
23. Bezdek, J.C.: Pattern Recognition with Fuzzy Objective Function Algorithm. Plenum Press, New York (1981)
24. Chiu, S.: Fuzzy Model Identification Based on Cluster Estimation. J. of Inte. Fuzzy Syst. 2, 267–278 (1994)
25. Martin, S.J., Frye, G.C., Senturia, S.D.: Dynamics and Response of Polymer-Coated Sur-face Acoustic Wave Devices: Effect of Viscoelastic Properties and Film Resonance. Ana. Chem. 66, 2201–2219 (1994)
26. Yadava, R.D.S., Kshetrimayum, R., Khaneja, M.: Multifrequency Characterization of Vis-coelastic Polymers and Vapor Sensing based on SAW Oscillators. Ultrasonics 49, 638–645 (2009)
27. Ferry, J.D.: Viscoelastic properties of polymer. John Wiley and Sons, Newyork (1980) 28. Jha, S.K., Yadava, R.D.S.: Preprocessing of SAW Sensor Array Data and Pattern Recogni-
tion. IEEE Sen. J. 9, 1202–1208 (2009)
S.C. Satapathy, S.K. Udgata, and B.N. Biswal (eds.), FICTA 2013, Advances in Intelligent Systems and Computing 247,
9
DOI: 10.1007/978-3-319-02931-3_2, © Springer International Publishing Switzerland 2014
Quantitative Identification of Volatile Organics by SAW Sensor Transients ‒ Comparative Performance Analysis of Fuzzy Inference and Partial-Least-Square-
Regression Methods
Prashant Singh1 and R.D.S. Yadava2
1 Department of Physics, College of Engineering, Teerthanker Mahaveer University, Moradabad - 244001, India [email protected]
2 Sensors and Signal Processing Laboratory, Department of Physics, Faculty of Science, Banaras Hindu University, Varanasi-221005, India [email protected], [email protected]
http://www.ardius.org
Abstract. We present a comparative performance analysis between three me-thods (fuzzy c-means and fuzzy subtractive clustering based fuzzy inference systems and partial-least-square regression) for simultaneous determination of vapor identity and concentration in gas sensing applications. Taking poly-isobutylene coated surface acoustic wave sensor transients for measurements we analyzed simulated data for seven volatile organic compounds by applying these methods as a function of polymer film thickness. The sensor transients were represented by discrete wavelet approximation coefficients. It is found that PLS regression performs most optimally for both discrimination between vapor identities and simultaneous estimation of their concentration.
Keywords: SAW sensor transients, quantitative recognition, discrete wavelet decomposition, fuzzy inference system, partial-least-square regression.
1 Introduction
Measurements of single sensor transients provide an alternate method for vapor detec-tion and identification to the conventional electronic nose systems based on an array of sensors functionalized for broad range of chemical selectivities [1-7]. Detection of volatile organic compounds (VOCs) is important for several applications like bomb detection, environment monitoring, chemical hazard detection, breath analysis for disease biomarkers, food quality monitoring etc. [8-11]. The conventional electronic nose is analogous functioning of human nose where olfactory receptor neurons gener-ate response patterns at vapor inhalation which is processed by brain for identifica-tion. Transient sensors do not have a biological parallel, but sensor transients carry richer information compared to electronic nose array sensors as they capture complete signal generation kinetics (from first contact to steady state) in contrast to array sensors record only equilibrium responses. Besides, a single transient sensor may discriminate several vapors by utilizing vapor specific variations in sorption kinetics.

10 P. Singh and R.D.S. Yadava
This feature may help in reducing system hardware complexity. Both approaches however are faced with similar data processing challenges for extraction of chemical signatures from multivariate time series and equilibrium response patterns [1].
Recently, we carried out a series of simulation studies based on polymer coated SAW sensor transients for vapor recognition [12-16] as well as for simultaneous con-centration estimation [17]. Earlier, we had applied fuzzy c-means clustering based Sugeno-type fuzzy inference system (FCM-FIS) for quantitative identification of seven volatile organic compounds by polyisobutylene (PIB) coated SAW sensor tran-sients [17]. It was found that the accuracy of the results depends on the polymer film thickness and its viscoelastic properties. There is an optimum region for film thick-ness ( 36.0/18.0 3 <πϕ< ) where both the classification rate and the concentration
estimates were most accurate. The deterioration occurred at both (higher and lower) thickness ends. This was analyzed to be related to the large range of partition and diffusion coefficients associated with the vapors. By eliminating the fastest diffusing vapor data from the analysis the results improved substantially. This raised a question whether FCM-FIS can be relied for analyzing data with wide variations in vapor sorption and diffusion parameters. With motivation to determine most optimal me-thod for quantitative recognition by SAW sensor transients we present in this paper a comparison of three methods. These are: fuzzy c-means clustering and fuzzy subtrac-tive clustering based Sugeno-fuzzy inference systems (FCM-FIS and FSC-FIS), and partial-least-square-regression (PLSR).
2 Transient Data and Preprocesssing
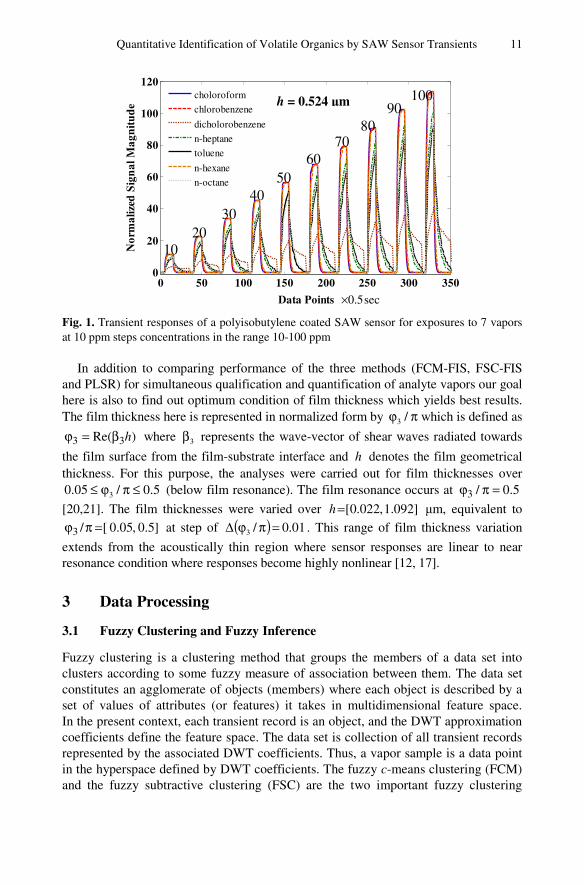
SAW sensor parameters, target volatile organics and transient data generation used in the present analysis are the same as described in [17]. In brief, a polyisobutylene (PIB) coated SAW oscillator sensor operating at 100 MHz was used for calculating transient responses to step-function like vapor exposure. Detection of 7 volatile or-ganic compounds: chloroform (200, 260), chlorobenzene (4680, 230), o-dichlorobenzene (22500, 5.49), n-heptane (1200, 48), toluene (1000, 35), n-hexane (180, 160), n-octane (955, 38) with concentrations varied over [10-300] ppm at step of 10 ppm were targeted for study. The numbers in parenthesis are partition coeffi-cient K and diffusion coefficient (D×10-11 cm2s-1) of these vapors in PIB. The vapor sorption and desorption times are 5 and 10 sec respectively with each time series con-taining 31 time points at 0.5 sec interval. The film thickness was taken to be
nm 524=h which is equivalent to 24.0/3 =πϕ . The data generation included an
additive noise source with uniform frequency fluctuations within 2 ppm. The transient responses are shown in Fig. 1.
Data preprocessing was done by wavelet transform method. Discrete wavelet transform with Daubechies-4 basis was used for decomposition up to 2nd level. The coefficients of approximation were used as features and the coefficients of detail were discarded as noise. The original transient data in each response contained 35 points. After 2nd level decomposition each transient is represented by 11 approximation coef-ficients. The wavelet decomposition is known to be an effective method for reducing data size and noise for time varying signals [19]. We have used this method for representation in almost all our previous studies on transient analysis [12-17].
Quantitative Identification of Volatile Organics by SAW Sensor Transients 11
0 50 100 150 200 250 300 3500
20
40
60
80
100
120
Data Points
Nor
mal
ized
Sig
nal
Mag
nitu
de
choloroform
chlorobenzene
dicholorobenzene
n-heptane
toluene
n-hexane
n-octane
h=0.524 μmh = 0.524 μm
sec5.0×
10 20
30 40
50 60
70 80
100 90
Fig. 1. Transient responses of a polyisobutylene coated SAW sensor for exposures to 7 vapors at 10 ppm steps concentrations in the range 10-100 ppm
In addition to comparing performance of the three methods (FCM-FIS, FSC-FIS and PLSR) for simultaneous qualification and quantification of analyte vapors our goal here is also to find out optimum condition of film thickness which yields best results. The film thickness here is represented in normalized form by πϕ /3 which is defined as
)Re( 33 hβ=ϕ where 3β represents the wave-vector of shear waves radiated towards
the film surface from the film-substrate interface and h denotes the film geometrical thickness. For this purpose, the analyses were carried out for film thicknesses over
5.0/05.0 3 ≤πϕ≤ (below film resonance). The film resonance occurs at 5.0/3 =πϕ
[20,21]. The film thicknesses were varied over ]092.1 ,022.0[=h μm, equivalent to
]5.0 ,05.0 [ /3 =πϕ at step of ( ) 01.0 /3 =πϕΔ . This range of film thickness variation
extends from the acoustically thin region where sensor responses are linear to near resonance condition where responses become highly nonlinear [12, 17].
3 Data Processing
3.1 Fuzzy Clustering and Fuzzy Inference
Fuzzy clustering is a clustering method that groups the members of a data set into clusters according to some fuzzy measure of association between them. The data set constitutes an agglomerate of objects (members) where each object is described by a set of values of attributes (or features) it takes in multidimensional feature space. In the present context, each transient record is an object, and the DWT approximation coefficients define the feature space. The data set is collection of all transient records represented by the associated DWT coefficients. Thus, a vapor sample is a data point in the hyperspace defined by DWT coefficients. The fuzzy c-means clustering (FCM) and the fuzzy subtractive clustering (FSC) are the two important fuzzy clustering

12 P. Singh and R.D.S. Yadava
methods. The clustering algorithm results in cluster centres and membership values for different data points to belong to different clusters.
Fuzzy c-Means Clustering. The fuzzy c-means clustering is an iterative method where it selects an initial fuzzy pseudo-partition and repeats the process, then com-putes the centroid of each cluster using fuzzy partition and it updates the fuzzy parti-tion until it gets no change in centroid [21]. This method is based on minimizing the objective function defined as
1
1
1
2
2)(
2)(
)1(
−
=
−
+
−
−=
c
j
m
tjk
tikt
ikvx
vx u (1)
where iku is the membership value of kx in cluster i (i = 1,...c) and ( )ci v ti ,...1)( = is
the cluster center [21-22].
Fuzzy Subtractive Clustering. Fuzzy clustering is a clustering technique that com-bines the data in feature space by certain fuzzy logic. The fuzzy clusters are defined as accumulation of different classes in a specific region in data space. In subtractive clus-tering method, each data point is specified to a potential )( ip and calculating its vector
distance ji xx − from all other data points, assuming that it belongs to a cluster of
radius ar , and then assigning the potential ip as
−α−=
j
xxi
jiep2
with 2
4
ar=α (2)
where the positive constant α represents cluster radii in probability metric and sum-mation extends over all data points. The data point with highest potential is selected as the first cluster center. Next, the second cluster center is determined in similar manner after excluding the data points associated to the first cluster. The process is continued until all residual data points are within ar of a cluster center [23-24].
Fuzzy Inference System. FIS system makes use of the cluster centres and member-ship grades for building fuzzy if (premise) - then (consequence) rules for inference making where both premise and consequence are characterized by fuzzy or linguistic elements [24]. The FIS utilizes the fuzzy logic, fuzzy if-then rules and membership function for decision making. The output of the FIS system is obtained as the weighted average of all the output rules
===
N
ii
N
iii wzw
11 Output (3)
where N is the number of rules [23-24].
Quantitative Identification of Volatile Organics by SAW Sensor Transients 13
3.2 Partial-Least-Square Regression
Regression analysis is to develop a mathematical model for quantitative relationship between sensor response as independent variable and vapor concentration as depen-dent variable so that by observing the sensor output the concentration of vapor could be predicted. In effect, regression analysis generates calibration curves from the measured data [25]. A regression analysis method aims to achieve best fit model as per some criteria for ‘goodness of fit’. The regression relation is defined as a matrix equation BXY = between dependent variable matrix Y (concentration in rows and vapor classes in columns) and response matrix X (a time series associated with each element in Y ) where the matrix of regression coefficients B are determined by some least square solution [26-28].
3.3 MatLab Implementation
The total data is divided into the training and test sets with equal number of samples for each. The data processing was done in MatLab environment by using functions ‘genfis2’ for FSC, ‘genfis3’ for FCM and ‘plsregress’ for PLSR based on the wavelet transformed data matrices. The output data )(Y structure is defined in the form that
the first column represents concentration and the remaining columns represent class information in [0, 1] format (1 for true, 0 for false). The input data )(X contains
DWT approximation coefficients as predictors with rows corresponding to samples and columns to variables (wavelet approximation coefficients). The class and concen-tration data in Y matrix is used as response variables.
The input arguments for genfis2 and genfis3 were set for Sugeno type FIS with the input from FSC and FCM clustering. The input data matrix in the training phase con-sisted of 105 samples × 11 DWT coefficients corresponding to 15 samples from each of 7 vapor classes. The output matrix consists of 105 samples × 8 (concentration + class) parameters. The 1st column of the output matrix contained estimated vapor con-centrations, and the rest 7 columns contained vapor class assignments. The output in training phase is an FIS model. The test data is evaluated by using function ‘evalfis’ which takes the FIS model created by genfis2 or genfis3 as its input. The output from evalfis is 8105× matrix with the first column containing concentration and the next 7 columns containing class membership grades. The class membership grades were then converted to crisp class label assignments according to the highest grade value.
The plsregress computes a partial-least-squares regression of Y on X in terms of latent variables (or PLS components) XS such that its covariance with response scores YS is maximum. The structure ‘stats’ in the plsregress output contains the vapor information according to specified data matrix except the first row which define the intercepts and equivalent to PLSB [29].
The relative system performances in regard to concentration estimation were eva-luated on the basis of root average relative-mean-squared-error (hereafter referred to as RMSE) defined as
2/1
1 1k
2
actual)(
actual)(estimated)(11
−== =
C
i
M
ik
ikik
i
i
c
cc
MCRMSE (4)
14 P. Singh and R.D.S. Yadava
where Mi denotes the number of samples of i-th class, C denotes the number classes, and estimated)(ikc and actual)(ikc are the estimated and the actual concentrations
respectively. Eq. (4) defines average over all test samples of all vapor classes.
4 Results
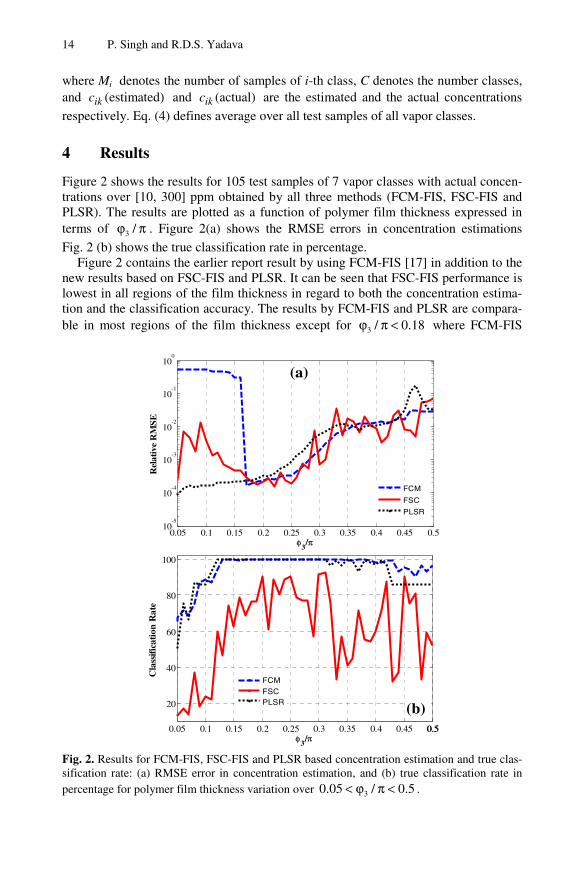
Figure 2 shows the results for 105 test samples of 7 vapor classes with actual concen-trations over [10, 300] ppm obtained by all three methods (FCM-FIS, FSC-FIS and PLSR). The results are plotted as a function of polymer film thickness expressed in terms of πϕ /3 . Figure 2(a) shows the RMSE errors in concentration estimations
Fig. 2 (b) shows the true classification rate in percentage. Figure 2 contains the earlier report result by using FCM-FIS [17] in addition to the
new results based on FSC-FIS and PLSR. It can be seen that FSC-FIS performance is lowest in all regions of the film thickness in regard to both the concentration estima-tion and the classification accuracy. The results by FCM-FIS and PLSR are compara-ble in most regions of the film thickness except for 18.0/3 <πϕ where FCM-FIS
0.05 0.1 0.15 0.2 0.25 0.3 0.35 0.4 0.45 0.50.5
20
40
60
80
100
φ3/π
Cla
ssifi
cati
on R
ate
FCMFSCPLSR (b)
0.05 0.1 0.15 0.2 0.25 0.3 0.35 0.4 0.45 0.510
-5
10-4
10-3
10-2
10-1
100
φ3/π
Rel
ativ
e R
MS
E
FCM
FSC
PLSR
(a)
Fig. 2. Results for FCM-FIS, FSC-FIS and PLSR based concentration estimation and true clas-sification rate: (a) RMSE error in concentration estimation, and (b) true classification rate in percentage for polymer film thickness variation over 5.0/05.0 3 <πϕ< .

Quantitative Identification of Volatile Organics by SAW Sensor Transients 15
performance deteriorates. It was found in [17] that this was because of vapors having large variation in partition coefficients and diffusion coefficients. In contrast, we notice here that the PLSR performance consistently well in this region too. This leads us to conclude that PLSR is more robust and accurate under wide variations in analyte characteristics.
As regards optimum film thickness we can see that for fuzzy methods yield best re-sults in the film thickness region 36.0/18.0 3 <πϕ< as found before in [17], whereas
PLSR shows consistently high performance for film thicknesses only a little below resonance condition. Near film resonance, the performances of fuzzy methods also deteriorate. Figure 2 contains the earlier report result by using FCM-FIS [17] in addi-tion to the new results based on FSC-FIS and PLSR. It can be seen that FSC-FIS performance is lowest in all regions of the film thickness in regard to both the concen-tration estimation and the classification accuracy. The results by FCM-FIS and PLSR are comparable in most regions of the film thickness except for 18.0/3 <πϕ where
FCM-FIS performance deteriorates.
5 Conclusion
In conclusion, we find that for simultaneous determination of vapor identities and estimates of their concentration by using SAW sensor transients the PLSR should be the method of choice as it yields consistently high results and is robust against varia-tions in film and analytes parameters. FCM-FIS yields comparable results for film thicknesses beyond 18.0/3 >πϕ , whereas FSC-FIS performs poorly.
References
1. Yadava, R.D.S.: Modeling, Simulation and Information Processing for Development of a Polymeric Electronic Nose System. In: Korotcenkov, G. (ed.) Chemical Sensors – Simula-tion and Modelling, ch. 10, pp. 411–502. Momentum Press, New York (2012)
2. Vilanova, X., Llobet, E., Alcubilla, R., Sueiras, J.E., Correig, X.: Analysis of the Conduc-tance Transient in Thick-Film Tin Oxide Gas Sensors. Sens. Actuat. B 31, 175–180 (1996)
3. Llobet, E., Brezmes, J., Vilanova, X., Sueiras, J.: Qualitative and Quantitative Analysis of Volatile Organic Compounds Using Transient and Steady-State Responses of Thick-Film Tin Oxide Gas Sensor Array. Sens. Actuat. B 41, 13–21 (1997)
4. Hines, E.L., Llobet, E., Gardner, J.W.: Electronic noses: A review of signal processing techniques. IEE Proc. Circuits, Devices System 156, 297–309 (1999)
5. Osuna, R.G., Nagle, H.T., Schiffman, S.S.: Transient Response Analysis of an Electronic Nose Using Multi-Exponential Models. Sens. Actuat. B 61, 170–182 (1999)
6. Hoyt, S., McKennoch, S., Wilson, D.M.: Transient Response Chemical Discrimination Module. Proc. of IEEE Sensors 1, 376–381 (2002)
7. Phaisangittisagul, E., Nagle, H.T.: Sensor Selection for Machine Olfaction Based on Tran-sient Feature Extraction. IEEE Trans. Instrum. Meas. 57, 369–378 (2008)
8. Pearce, T.C., Schiffman, S.S., Nagle, H.T., Gardner, J.W.: Handbook of Machine Olfac-tion. Wiley-VCH, Weinheim (2003)
9. Francesco, F.D., Fuoco, R., Trivella, M.G., Ceccarini, A.: Breath Analysis: Trends in Techniques and Clinical Applications. Microchem. J. 79, 405–410 (2005)
10. Tothil, I.E.: Rapid and On-Line Instrumentation for Food Quality Assurance. CRC Press (2003)