proceedings - cibnor.gob.mx · proceedings of the nineteenth biennial pronghorn antelope workshop...
TRANSCRIPT

PROCEEDINGS
of the
NINETEENTH BIENNIAL
PRONGHORN ANTELOPE WORKSHOP
Edited by Jorge Cancino
La Paz, Baja California Sur, Mexico
March 13 – 17, 2000
Chair
Jorge Cancino

TABLE OF CONTENTS Preface … … … … … … … … … … … … … … … … … … … … … … … … … … … … … … . i Summary of Pronghorn Workshop held to date … … … … … … … … … … … … …
iii
List of attendees … … … … … … … … … … … … … … … … … … … … … … … … .… …
iv
List of reviewers … … … … … … … … … … … … … … … … … … … … … … … … … … .
vii
General addresses
Discurso de apertura … … … … … … … … … … … … … … … … … … … … … … … … . José María Reyes Gómez
1
Opening speech … … … … … … … … … … … … … … … … … … … … … … … … … … . Lorie Mc Cracken (Translation)
4
Pronghorn Province and States Status Report … … … … … … … … … … … … … .
7
Technical papers
Sonoran pronghorn recovery: habitat enhancements to increase fawn survival … … … … … … … … … … … … … … … … … … … … … … … … … … … … … … . John J. Hervert, Jill L. Bright, Linden A. Piest, Mark T. Brown and Robert S. Henry
19
Relationships between nutrition and behavior in a captive group of pronghorn … … … … … … … … … … … … … … … … … … … … … … … … … … … … … Mary Robinson, Margaret Wild, and John Byers
28
Analysis of reintroduced pronghorn populations in arizona using mitochondrial dna markers … … … … … … … … … … … … … … … … … … … … … ... Olin E. Rhodes, Jr., Erin P. Reat, James R. Heffelfinger, and James C. DeVos, Jr.
45
Sensitivity analysis as a guide for population management of pronghorn … … Patryce Avsharian, and John A. Byers
55
A validation of Arizona's landscape-level pronghorn habitat model … … … … .. Cindy L. Ticer, and Richard A. Ockenfels.
63
New Strategies for pronghorn food habit studies … … … … … … … … … … … … .. Michael C. Hansen, James D. Yoakum, William H. Pyle, and Robert G. Anthony.
71
Pronghorn populations in Chihuahua, determined by aerial censuses … … … . Danae Azuara, Rodrigo Medellin, Carlos Manterola, and Manuel Valdes
95
Posters and Abstracts
Genetic variation among pronghorn populations using mitochondrial DNA control region as a molecular marker … … … … … … … … … … … … … … … … … . Amor, Dalia; Oliver Ryder; Rob Ramey; and Rodrigo Medellin
106
History and management of Yellowstone National Park pronghorn … … … … .. Wendy E. Clark.
107
Capture, hand rearing and captive management of peninsular pronghorn … .. Jorge Cancino, Ramón Castellanos, and Victor Sánchez
108
Alternative capture technique for the peninsular pronghorn … … … … … … … ... Jorge Cancino, Ramón Castellanos, and Victor Sánchez
109
Reintroducción y monitoreo de berrendos en el estado de Coahuila … … … .. Guadarrama, Enrrique; and Manuel Valdés.
110
“Unidos para la Conservación” pronghorn rescue program in the states of Chihuahua and Coahuila … … … … … … … … … … … … … … … … … … … … … … .. Carlos Manterola
111
Sonoran pronghorn home ranges and habitat use … … … … … … … … … … ...… Jill L. Bright, John J. Hervert, Linden A. Piest, Mark T. Brown and Robert S. Henry.
112
Biotic and abiotic factors affecting quality and quantity of habitat of the peninsular pronghorn (Antilocapra americana peninsularis) in the Biosphere Reserve “El Vizcaino’, Baja California Sur, Mexico … … … … … … … … … … … .. Fernando González and Jorge Cancino
113
Effect of birth date on survival of neonatal pronghorn in the northern Great Basin … … … … … … … … … … … … … … … … … … … … … … … … … … … … … … .... Michael a. Gregg, Martin Bray, Kevin M. Kilbride, and Michael R. Dunbar
115
Evaluation of aerial line transect for estimating pronghorn populations in Oregon … … … … … … … … … … … … … … … … … … … … … … … … … … … … … … . Donald G. Whittaker, Walker A. Van Dyke, and Stuart L. Love
116
Monitoring a translocated pronghorn population in the northwestern Coahuila, Mexico … … … … … … … … … … … … … … … … … … … … … … … … … ... Paola Miranda Almazán and Alfonso Martínez Muñoz
117

Nutritional values of some plants ingested by peninsular pronghorn … … … .... Jorge Cancino.
118
Programa de Conservación y Aprovechamiento del Berrendo en México. Two posters attached … … … … … … … … … … … … … … … … … … … … … … … .... Dirección General de Vida Silvestre – Subcomité Técnico Consultivo.
120
19th Biennial Pronghorn Antelope Workshop Agenda … … … … … … … … … … .
121
Business meeting
Agenda … … … … … … … … … … … … … … … … … … … … … … … … … … … … ...
127
Minute … … … … … … … … … … … … … … … … … … … … … … … … … … … … … .
128
19TH Biennial Pronghorn Antelope Workshop i
PREFACE
The Northwest Biological Research Center and the Dirección General de
Vida Silvestre of the National Institute of Ecology hosted the 19th Pronghorn Antelope Workshop in La Paz, Baja California Sur, Mexico during March 13-17, 2000. A total of 42 persons participated in the workshop. The representation was as follows: 28 came from United States and 14 were from Mexico. There were 15 participants from state agencies, 11 from non-governmental organizations, 9 from federal agencies, and 7 from universities. Unfortunately, there were no Canadian or tribal representatives. There was vast support from personal of the Arizona Game and Fish Department, especially with the status reports and with the workshop correspondence in the United States.
There was no record kept of questions and discussion after the presentations or at the business meeting. These proceedings are mainly in the format of each paper, however, the editor assumes full responsibility for minor changes in the transcriptions.
The 20th Biennial Pronghorn Antelope Workshop will be held in the spring of 2002 in Kearney, Nebraska (tentative location). Jeff Abegglen, Wildlife Biologist with the US Forest Service is the Chairperson. The workshop will be Co-sponsored by the Nebraska Game & Parks Commission and the U.S. Forest Service.
Jorge Cancino.
Chair.
19TH Biennial Pronghorn Antelope Workshop iii
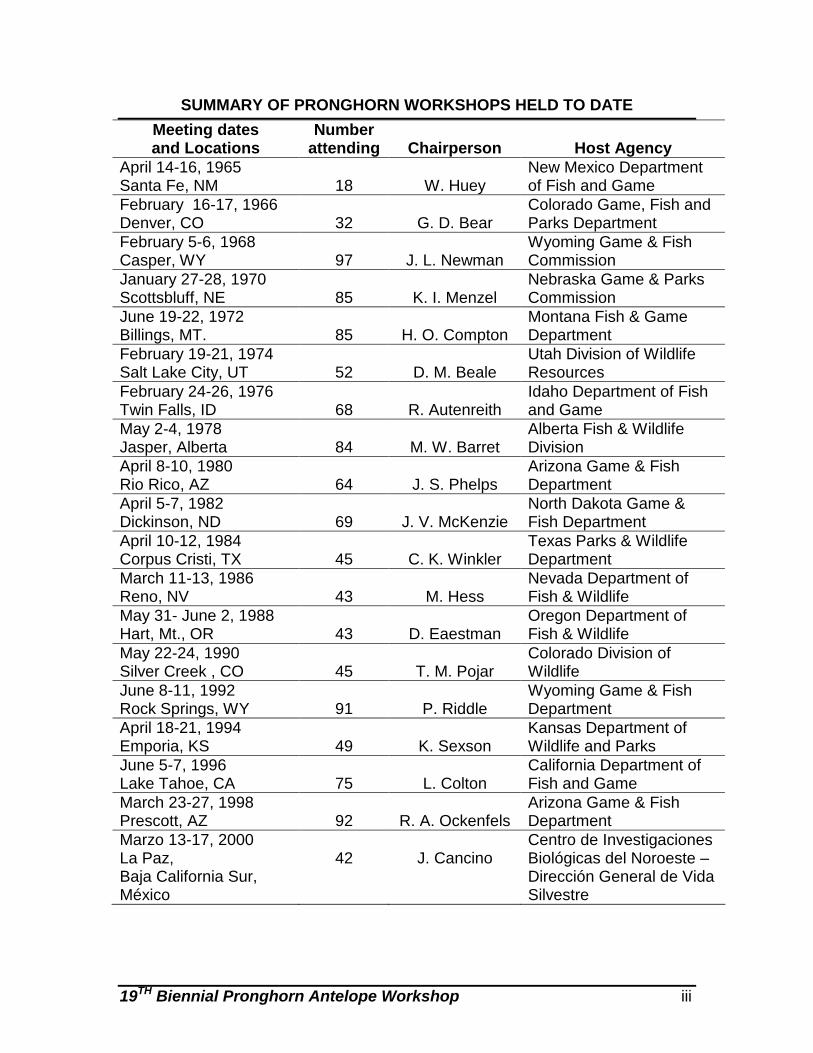
SUMMARY OF PRONGHORN WORKSHOPS HELD TO DATE Meeting dates and Locations
Number attending
Chairperson
Host Agency
April 14-16, 1965 Santa Fe, NM
18
W. Huey
New Mexico Department of Fish and Game
February 16-17, 1966 Denver, CO
32
G. D. Bear
Colorado Game, Fish and Parks Department
February 5-6, 1968 Casper, WY
97
J. L. Newman
Wyoming Game & Fish Commission
January 27-28, 1970 Scottsbluff, NE
85
K. I. Menzel
Nebraska Game & Parks Commission
June 19-22, 1972 Billings, MT.
85
H. O. Compton
Montana Fish & Game Department
February 19-21, 1974 Salt Lake City, UT
52
D. M. Beale
Utah Division of Wildlife Resources
February 24-26, 1976 Twin Falls, ID
68
R. Autenreith
Idaho Department of Fish and Game
May 2-4, 1978 Jasper, Alberta
84
M. W. Barret
Alberta Fish & Wildlife Division
April 8-10, 1980 Rio Rico, AZ
64
J. S. Phelps
Arizona Game & Fish Department
April 5-7, 1982 Dickinson, ND
69
J. V. McKenzie
North Dakota Game & Fish Department
April 10-12, 1984 Corpus Cristi, TX
45
C. K. Winkler
Texas Parks & Wildlife Department
March 11-13, 1986 Reno, NV
43
M. Hess
Nevada Department of Fish & Wildlife
May 31- June 2, 1988 Hart, Mt., OR
43
D. Eaestman
Oregon Department of Fish & Wildlife
May 22-24, 1990 Silver Creek , CO
45
T. M. Pojar
Colorado Division of Wildlife
June 8-11, 1992 Rock Springs, WY
91
P. Riddle
Wyoming Game & Fish Department
April 18-21, 1994 Emporia, KS
49
K. Sexson
Kansas Department of Wildlife and Parks
June 5-7, 1996 Lake Tahoe, CA
75
L. Colton
California Department of Fish and Game
March 23-27, 1998 Prescott, AZ
92
R. A. Ockenfels
Arizona Game & Fish Department
Marzo 13-17, 2000 La Paz, Baja California Sur, México
42
J. Cancino
Centro de Investigaciones Biológicas del Noroeste – Dirección General de Vida Silvestre
______________________________________________________________ 19TH Biennial Pronghorn Antelope Workshop iv
Attendance register
Jeffrey S. Abegglen Wildlife Biologist Pine Ridge Ranger District Nebraska National Forest Oglala National Grassland Chadron, NE (308) 432-4475
Patryce Avsharian Department of Biological Sciences University of Idaho Moscow, ID 83844-3051
Danae Azuara Unidos para la Conservación Prado Norte 324 Lomas de Chapultepec México, 11000, D. F.
Jose Bernal Stoopen Dirección General de Vida Silvestre Instituto Nacional de Ecolgía Av. Revolución 1425 Col. Tlacopac Del. Alvaro Obregón México, D. F.
Kim Brinkley Animal keeper Los Angeles Zoo 534 W Doran St Glendale, CA 91203
Jorge Cancino Centro de Investigaciones Biológicas del Noroeste Mar Bermejo195 Col. Playa Palo de Santa Rita La Paz, 23090, Baja California Sur México
Matt Carling Department of Biological Sciences University of Idaho Moscow, Id 83844-3051
Ramón Castellanos Reserva de la Biosfera El Vizcaíno Dom. Conocido: Casa de la Fauna Guerrero Negro, Baja California Sur México
Wendy Clark Wildlife Biologist Yellowstone National Park Ycr. Box 168 Yell. Nat. Park, WY 82190
Dalia A. Conde Unidos para la Conservación Prado Norte 324 Lomas de Chapultepec México, 11000, D. F.
Jim deVos Chief of Research Arizona Game and Fish Dept. 2221 W Greenway Rd Phoenix, AZ 85023
Steve Flinders Utah Division of Wildlife 1594 W. North Temple Salt Lake City, Utah 84114
________________________________________________________________ 19TH Biennial Pronghorn Antelope Workshop v
Steve Friedland Zoological Society of San Diego
Mike Gregg Wildlife Biologist U.S.F.W.S. P.O. Box 111 Lakeview, OR 97630
Enrique Guadarrama Unidos para la Conservación Prado Norte 324 Lomas de Chapultepec México, 11000, D. F.
Jim Heffelfinger Arizona Game and Fish Dept 555 N Greasewood Tucson, AZ 85745
John Hervert Arizona Game and Fish Department 9140 East County 10 ½ Street Yuma, AZ 85365
Robb D. Hitchcock North American Pronghorn Foundation 1905 CY Ave. Casper, WY 82604
Jeff Holland Los Angeles Zoo 5333 Zoo Drive Los Angeles, CA 90027
William Jensen North Dakota Game and Fish Dept. 100 N Bismarck Expressway Bismarck, ND 58501
Carlos Manterola Unidos para la Conservación Prado Norte 324 Lomas de Chapultepec México, 11000, D. F.
Lorie Mc Cracken Pronatura, Presa 206 -8, San Jerónimo México, 10200, D.F.
William H. McLean Arizona Antelope Foundation 8896 E. Shasta Dr. Gold Canyon, AZ 85219
Rodrigo Medellín Instituto de Ecología Universidad Nacional Autónoma de México. Circuito Interior s/n Ap. Postal 70-275 México, 04510, D. F.
John R. Morgart U.S. Fish and Wildlife Service Cabeza Prieta N.W.R. 1611 North Second Avenue Ajo, AZ 85321
Richard Ockenfels Arizona Game and Fish Deptment 2221 W Greenway Rd Phoenix, AZ 85023
Thomas Pojar Colorado Division of Wildlife 317 W Prospect Rd. Ft. Collins, CO 80526
Mary Robinson University of Idaho 1315 Linda Lane #3 Moscow ID 83843
______________________________________________________________ 19TH Biennial Pronghorn Antelope Workshop vi
José María Reyes Gómez Dirección General de Vida Silvestre Instituto Nacional de Ecolgía Av. Revolución 1425 Col. Tlacopac Del. Alvaro Obregón México, D. F.
Olin E. Rhodes, Jr. Department of Forestry & Natural Resources Purdue University West Lafayette, IN 47909
William Rudd Wyoming Game and Fish Department 351 Astle Ave. Green River, WY 92935
Oliver Ryder Center for Reproduction of Endangered Species Post Office Box 551 San Diego, Ca 92112
Victor Sánchez Reserva de la Biosfera El Vizcaíno Dom. Conocido: Casa de la Fauna Guerrero Negro, Baja California Sur México
Cindy Ticer Arizona Game and Fish Department 3701 N Lynx Lake Dr Prescott Valley AZ 86314
Donald Tiller U.S. Fish and Wildlife Service Cabeza Prieta N.W.R. 1611 North Second Avenue Ajo, AZ 85321
Jim Torland Oregon Department of Fish & Wildlife 3701 West 13th The Dalles OR 97058
Liliana Valle SEMARNAP- Chihuahua Melquiades Alanis 5645 Col. Porfirio Díaz Cd. Juárez, 32320, Chihuahua.
Manuel Valdez Unidos para la Conservación Prado Norte 324 Lomas de Chapultepec México, 11000, D. F.
Don Whittaker Oregon Depart. of Fish and Wildlife P.O. Box 59 2501 SW First Ave Portland OR 97207
Jason E. Zimmer University of Wyoming 460 ½ North 11th St. Laramie, WY 82072
________________________________________________________________ 19TH Biennial Pronghorn Antelope Workshop vii
Manuscript Reviewers
Gerardo Ceballos Instituto de Ecología Universidad Nacional Autónoma de México.
Andrew DeWoody Institute of Environmental and Human Health Texas Tech University Lubbock, TX 79409-1163
Sue Fairbanks Department of Biology University of Nebraska Omaha, NE 68182-0040
Oz Garton Fish and Wildlife Resources University of Idaho P.O.Box 4411 Moscow, ID 83844-1136
Jim Heffelfinger Arizona Game and Fish Deptment 555 N Greasewood Tucson, AZ 85745
Paul Krausman The University of Arizona Tucson, AZ 85721
Scott L. Kronberg Animal and range Sciences South Dakota State University Brookings, SD 57007
Thomas E. Lee Jr. Department of Biology Abilene Christian University Abilene, TX 79699
Raymond M. Lee. Foundation for North American Wild Sheep. 720 Allen Ave. Cody, Wyoming, 82414.
Eric Mellink Centro de Investigación Científica y de Educación Superior de Ensenada Ensenada, Baja California.
Dennis Murray Depart. of Fish and Wildlife Resources University of Idaho Moscow, ID 83844
Richard Ockenfels Arizona Game and Fish Deptment 2221 W Greenway Rd Phoenix, AZ 85023
Thomas Pojar Colorado Division of Wildlife 317 W Prospect Rd. Ft. Collins, CO 80526
James R. Purdue Illinois State Museum 1011 East Ash Street Springfield, Il 62703
Ricardo Rodríguez Estrella Centro de Investigaciones Biológicas del Noroeste Apdo. Postal. 128 La Paz, 23000, Baja California Sur. México
Harley G. Shaw P. O. Box 370 Chino Valley Arizona 86323
________________________________________________________________ 19TH Biennial Pronghorn Antelope Workshop 1
SR. DIRECTOR DEL CIBNOR, Dr. Mario Martínez García SR. DELEGADO DE LA SEMARNAP EN B. C. S., Lic. Carlos Fernando Aceves García SR. PRESIDENTE DE LA FUNDACIÓN NORTEAMERICANA DEL BERRENDO, Robb Hitchcock DISTINGUIDOS INVESTIGADORES Y REPRESENTANTES DE LAS AGENCIAS ESTATALES SEÑORAS Y SEÑORES:
Agradezco la hospitalidad de nuestros amigos de Baja California Sur y a todos quienes han hecho posible que hoy nos encontremos aquí en La Paz con motivo de la realización de la XIX Reunión Bianual del Berrendo.
En México, hace algunos meses tuvimos el gusto de participar en la presentación de un libro del autor Lane Simonian, titulado “La Defensa de la Tierra del Jaguar: Una Historia de la Conservación en México”. En esta historia de la conservación, México, Estados Unidos y Canadá han desarrollado esquemas de cooperación para la conservación de más de 65 especies compartidas. Una de estas especies, sin duda alguna, es el berrendo.
El berrendo para el caso específico de México y sus poblaciones de las 3 subespecies reconocidas, localizadas actualmente en pequeños grupos aislados en los estados de Coahuila, Chihuahua, Sonora y Baja California Sur, representan un patrimonio invaluable y con varias potencialidades para su manejo y recuperación.
Como todos ustedes saben, las poblaciones del berrendo en México han experimentado una alarmante disminución. Por ejemplo, para el caso del berrendo mexicano sus poblaciones se han reducido en un 81.9 %, principalmente en lo que corresponde al Altiplano Central Mexicano, con ambientes como las zonas áridas con tipos de vegetación de pastizal y matorral espinoso de los estados de Coahuila y Durango extendiéndose hacia el sur hasta Tehuacán, Puebla; en la actualidad, solo se cuenta con registros de su distribución en 10 regiones de Chihuahua y tanto en el “Valle de Colombia” y rancho “El Novillo”, Coahuila, dada la exitosa reintroducción que realizó la agrupación Sierra Madre y Unidos para la Conservación en coordinación con la Dirección General de Vida Silvestre y el New México Game a Fish Department.
Por otra parte, se cuenta con un hato reproductivo de 21 ejemplares del berrendo peninsular, 7 de ellos ya nacidos en cautiverio durante este ciclo. Cabe destacar que este proyecto esta vinculado a las acciones de conservación incluidas en el Plan de Manejo de la Reserva de la Biosfera “El Vizcaino”, en el que participan también el CIBNor, Ford Motor Company y el Nuevo Centro de Población Ejidal "Lagunitas"
______________________________________________________________ 19TH Biennial Pronghorn Antelope Workshop 2
Así también, el IMADES ha desarrollado proyectos de investigación sobre la ecología de las poblaciones del berrendo sonorense en la Reserva de la Biosfera “El Pinacate y Gran Desierto de Altar”, en los que participa el Arizona Game and Fish Department.
Actualmente la Dirección General de Vida Silvestre, desarrolla esquemas de participación social para el desarrollo sustentable con base a la evaluación de las poblaciones del berrendo sonorense en coordinación con el Centro Cinegético Integrado.
Desde hace más de 10 años, diversas autoridades federales y estatales, academia, iniciativa privada, así como organizaciones no gubernamentales, han buscado evitar la extinción del berrendo por medio de acciones de investigación científica, reintroducciones, conservación del hábitat y manejo, aún cuando sus esfuerzos han sido un tanto aislados y sus logros con diversos grados de éxito.
En un afán de integración y ordenamiento de conocimientos, recursos y esfuerzos, se convocó a una reunión de trabajo para el establecimiento de bases sobre Conservación, Investigación y Manejo del Berrendo, que tuvo verificativo en 1999, en la Unidad de Manejo Integral de la Vida Silvestre “San Cayetano”, Estado de México, participando autoridades federales y estatales, iniciativa privada, organizaciones no gubernamentales, instituciones de investigación y de enseñanza superior.
Resultado de esta reunión, se logró la conformación de un grupo de trabajo que aprobó el Proyecto para la Conservación, Manejo y Aprovechamiento del Berrendo en México (PREP del Berrendo), que en breve presentaremos en México y se formalizo asimismo el “Subcomité Técnico Consultivo para la Conservación, Manejo y Aprovechamiento del Berrendo en México”.
Estimados Señores y Señoras, amigos invitados, la constitución de éste Subcomité y su Programa de Trabajo, contribuyen cabalmente al cumplimiento de una de las tres grandes estrategias de trabajo de nuestra institución, la cual está orientada a alcanzar una efectiva contención del deterioro del medio ambiente y su biodiversidad.
Los enormes retos que implican el dar respuesta exitosa a esta estrategia, reconocemos que solo será posible en la medida en que los diversos sectores de la población se comprometan y hagan causa común en temas, que en consenso, estimemos son prioritarios para su atención. Por ello, el trabajo realizado anteriormente sobre el tema berrendo, sirve hoy de base para el lanzamiento de esta importante iniciativa, la cual es producto de una amplia consulta y participación social.

______________________________________________________________ 19TH Biennial Pronghorn Antelope Workshop 3
Es de destacar, que esta participación, se ha realizado de manera desinteresada y mediante recursos, en la mayoría de las veces propios, por lo tanto, deberemos diseñar los mecanismos que nos permitan establecer un fondo financiero, administrado por el mismo Subcomité, con el cual se atiendan y desarrollen proyectos y acciones prioritarias encaminadas al cumplimiento de los objetivos y metas planteadas.
Esto nos alienta y estimula por cuanto sabemos, que estamos todos comprometidos en una tarea de largo plazo, ya que los procesos ambientales y la permanencia de las especies de flora y fauna silvestre, no reconocen ni obedecen a tiempos administrativos. Por eso, hago un llamado a todos ustedes para que hagan suya esta y otras iniciativas semejantes para asegurar la continuidad y el éxito.
Una señal de que todos habremos cumplido con nuestra tarea, será ver correr en el altiplano y pastizales de México al Berrendo.
Agradezco a todos ustedes su entusiasmo, confianza y participación desinteresada. Estoy seguro que los resultados de este 19 Taller Bianual sobre Berrendos nos será de estimulo para continuar las tareas que nos permitan transitar hacia un desarrollo sustentable.
Biol. José María Reyes Gómez
______________________________________________________________ 19TH Biennial Pronghorn Antelope Workshop 4
Dr. Mario Martínez, Director of CIBNOR Lic. Carlos Fernando Aceves García, SEMARNAP Delegate Distinguished Researchers and State Agency Representatives Ladies and Gentlemen
I thank the hospitality of our friends of Baja California Sur and all of
those that have made possible our encounter here in La Paz, to celebrate the XIX Biannaul Pronghorn Workshop.
Some months ago, we had the pleasure in México to participate in the
presentation of Lane Simonian´s book “The Defense of the Land of the Jaguar: A History of the Conservation in Mexico”. In this conservation history, México, the United States and Canada have developed joint collaborative efforts for the conservation of more than 65 shared species. One of this shared species, is the pronghorn, indeed.
The pronghorn, and its 3 recognized subspecies in Mexico, currently
located in small and isolated groups in the states of Coahuila, Chihuahua, Sonora and Baja California Sur, represent an invaluable heritage for our country, an inheritance with strong posibilities for its management and recovery.
As we all know, pronghorn populations in Mexico have dramatically
decreased. For example, the numbers of A. a. mexicana have decreased 81.9%, mainly throughout the Mexican central plains, which are characterized by arid areas with thorny bushes and grasslands in the states of Coahuila and Durango, extending south down to Tehuacán, Puebla. Presently, this subspecies is reported in only 10 locations of Chihuahua and in the “Valle de Colombia” and in “El Novillo” Ranch, in the state of Coahuila, as a result of a successfull reintroduction coordinated by Sierra Madre and Unidos para la Conservación with the Dirección General de Vida Silvestre and the New México Game a Fish Department.
On the other hand, there is a captive breeding herd of 25 individuals of
the peninsular pronghorn, 7 of them born in captivity during this cycle. This breeding project is entailed with the conservation actions included in the Management Plan of the Biosphere Reserve “El Vizcaíno”, in which CIBNor, Ford Motor Company and the New Population Center Ejidal "Lagunitas", are participating actively.
IMADES has also developed long-term studies concerning the
population ecology of the sonorensis subspecies in the “El Pinacate y Gran Desierto de Altar” Biosphere Reserve, in which the Arizona Game and Fish Department is involved.
________________________________________________________________ 19TH Biennial Pronghorn Antelope Workshop 5
The Dirección General de Vida Silvestre is developing social opportunities for the sustainable use of the pronghorn based on evaluations of the populations of the sonorensis subespecies in coordination with the Centro Cinegético Integrado.
During the last decades, several federal and state agencies, the
academia, the private sector and different non-governmental organizations, have worked together to prevent the pronghorn extinction. Numerous scientific studies, habitat conservation and management activities and reintroductions, have been developed and, although they have been somewhat isolated, they have showed different levels of success.
In 1999, a workshop for the Conservation, Research and Management of
the Pronghorn in Mexico was conducted at the San Cayetano Wildlife Station, in the State of México with the participation of several representatives from federal and state agencies, the private sector, non-governmental organizations, universities and research centers. The goal of this workshop was to integrate and organize the available knowledge, human and economic resources and conservations efforts developed for the pronghorn in Mexico.
This workshop was extremely successful. First, a working group approved
the Conservation, Management and Sustainable Use Project for the Pronghorn in Mexico, a national recovery strategy that will soon be officially presented in Mexico. Secondly, during the meeting, the Technical Advisory Subcommittee for the Conservation, Management and Sustainable Use of the Pronghorn in Mexico, was established.
Dear Ladies and Gentlemen, invited friends, the creation of this
subcommittee and the approval of its Working Program, fully meets one of the three major working strategies of our institution, which is oriented towards stoping effectively the deterioration of the environment and the biological diversity.
We recognize that the accomplishment of this strategy will only be
possible through the strong commitment and active participation of the diferent sectors of our society. Based on this fact, the different initiatives that have been developed for the pronghorn set the basis for the release of an important initiative that could only result from a wide public consultation and strong social participation.
It is extremely important to akcnowledge that this participation has been
developed taking only into consideration the continuity of the species and that in most cases has been supported through the resources of each institution. Because of this, it is necessary to identify an effective mechanism to create a finantial trust to be administered by the pronghorn subcomittee, which will help to
______________________________________________________________ 19TH Biennial Pronghorn Antelope Workshop 6
develop successfully the priority actions in order to accomplish the project´s goals and objectives.
This encourages and stimulate us, because we are all committed to a
long term goal, because the environment processes and the survival of the flora and fauna , do not recognize, nor obey administrative periods. This is why I urge you to participate actively in this and other initiatives to assure their continuity and success.
We will succeed in our efforts when we see the running free through
the plains and through the pasture grounds of Mexico. I wish to thank your enthusiasm, trust and willing participation. I am
sure that the results of this 19th Biannual Workshop of the Pronghorn will stimulate all of us to continue the tasks that will allow us to accomplish the conservation of our natural resources through sustainable development programs.
Translator: Lorie Mc Cracken
________________________________________________________________ 19TH Biennial Pronghorn Antelope Workshop 7
PRONGHORN PROVINCE AND STATE STATUS REPORT
CINDY L. TICER, Research Branch, Arizona Game and Fish Department, 2221
W. Greenway Road, Phoenix, AZ 85023-4312, USA JAMES, C DEVOS, JR., Research Branch, Arizona Game and Fish Department,
2221 W. Greenway Road, Phoenix, AZ 85023-4312, USA Abstract: We sent standardized questionnaires to 19 western states in the United States, 3 Canadian provinces, and Mexico to collect 1999 pronghorn (Antilocapra americana) population, survey, and hunt information. We received responses from 18 of the 19 western U. S. states, 1 Canadian province, and 2 from Mexico. We clarified information over the phone and summarized information by topic and management strategy.
PROCEEDINGS PRONGHORN ANTELOPE WORKSHOP 19: 7-18
Key words: Antilocapra americana, data, hunt, management strategies, population, questionnaires, survey.
INTRODUCTION
The Western Association of Fish and Wildlife Agencies (WAFWA) sanctions the Biennial Pronghorn Workshop to advance management and research on pronghorn (Antilocapra americana). To ensure that data pertaining to pronghorn survey and harvest are recorded in a consistent, retrievable manner, a standardized questionnaire was developed and sent to 19 U. S. states, 3 Canadian provinces, and contacts in Baja California Sur, Sonora, and Chihuahua. Eighteen U. S. states, 1 province, and 2 entities in Mexico responded.
POPULATION ESTIMATES AND SURVEY METHODOLOGY
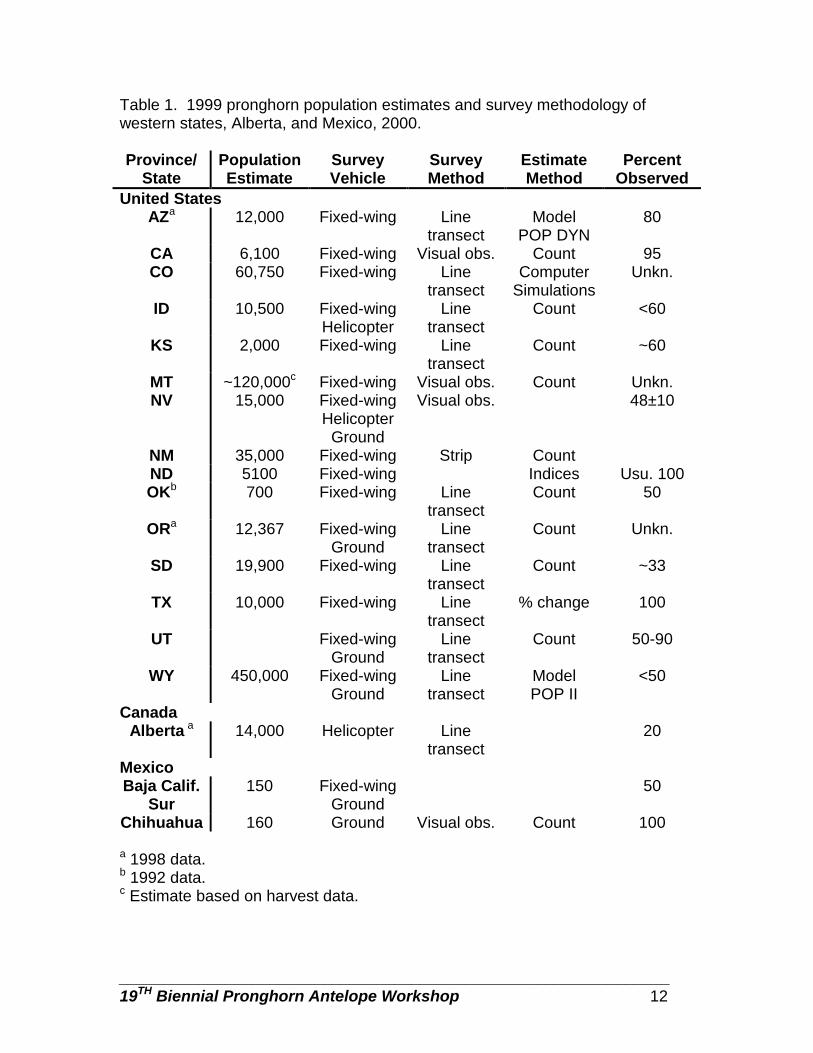
Population estimates ranged from 150 in Baja California Sur, Mexico to 450,000 in Wyoming (Table 1). Alaska, Hawaii, and Washington reported that they have no pronghorn. With the exception of Chihuahua, Mexico, which used ground surveys exclusively, most surveys were conducted using fixed-wing aircraft. Idaho and Nevada used helicopter surveys in conjunction with fixed-wing surveys and Nevada, Oregon, Utah, Wyoming, and Baja California Sur used both ground and fixed-wing surveys (Table 1). The most common survey
________________________________________________________________ 19TH Biennial Pronghorn Antelope Workshop 8
method used was line transects, however, California, Nevada, Montana, and Chihuahua, Mexico used direct counts and New Mexico used a strip transect (Table 1). Most states used survey counts and/or population models to derive population estimates (Table 1). Observation rates varied by method and by state and ranged from “unknown” in Colorado, Montana, and Oregon to 100% in North Dakota, Texas, and Chihuahua, Mexico (Table 1).
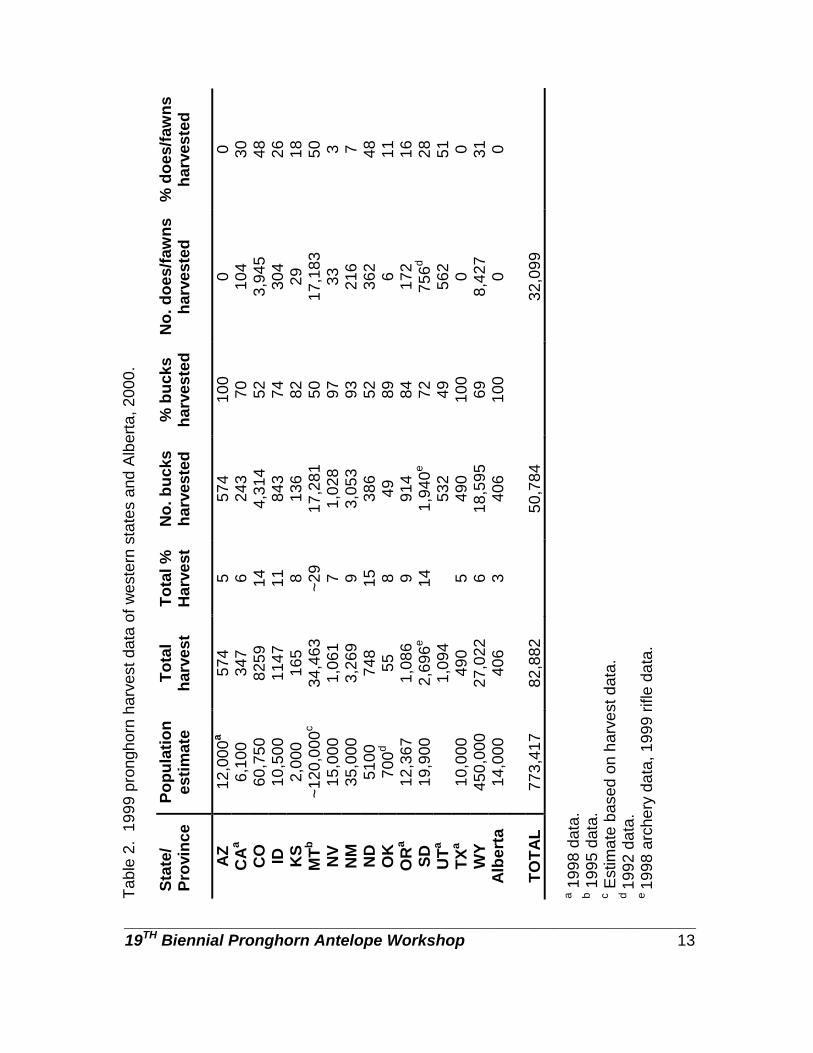
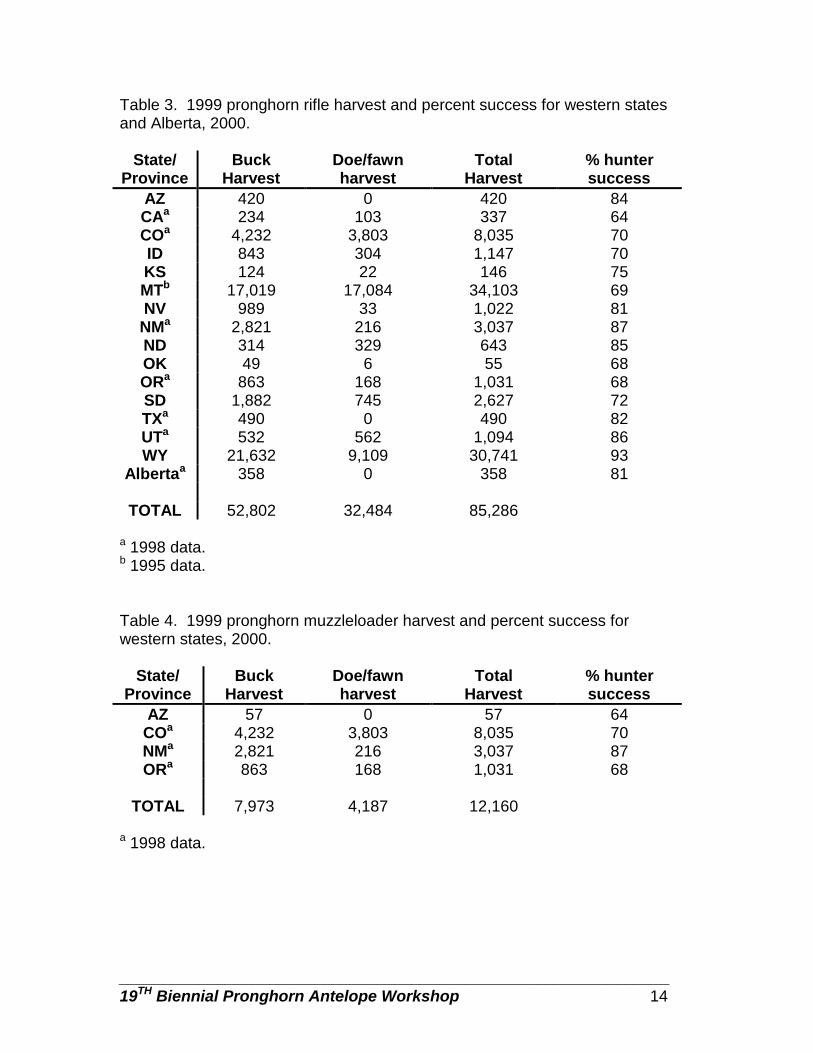
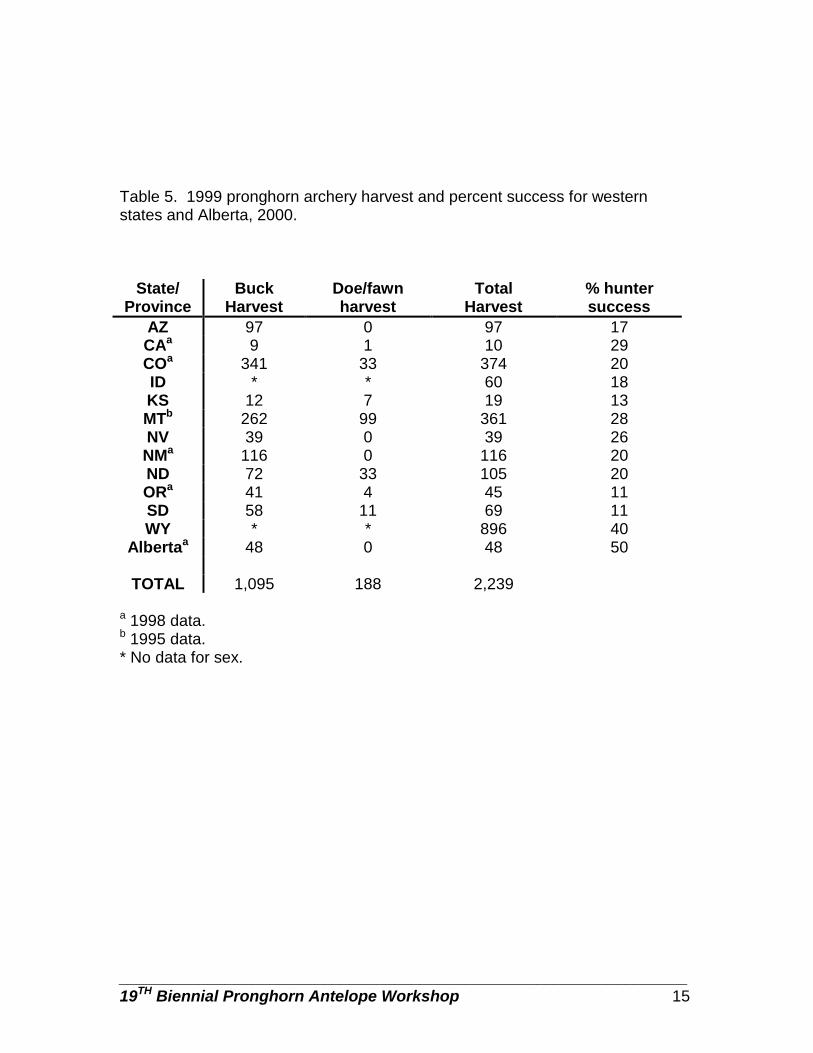
HARVEST SUMMARY
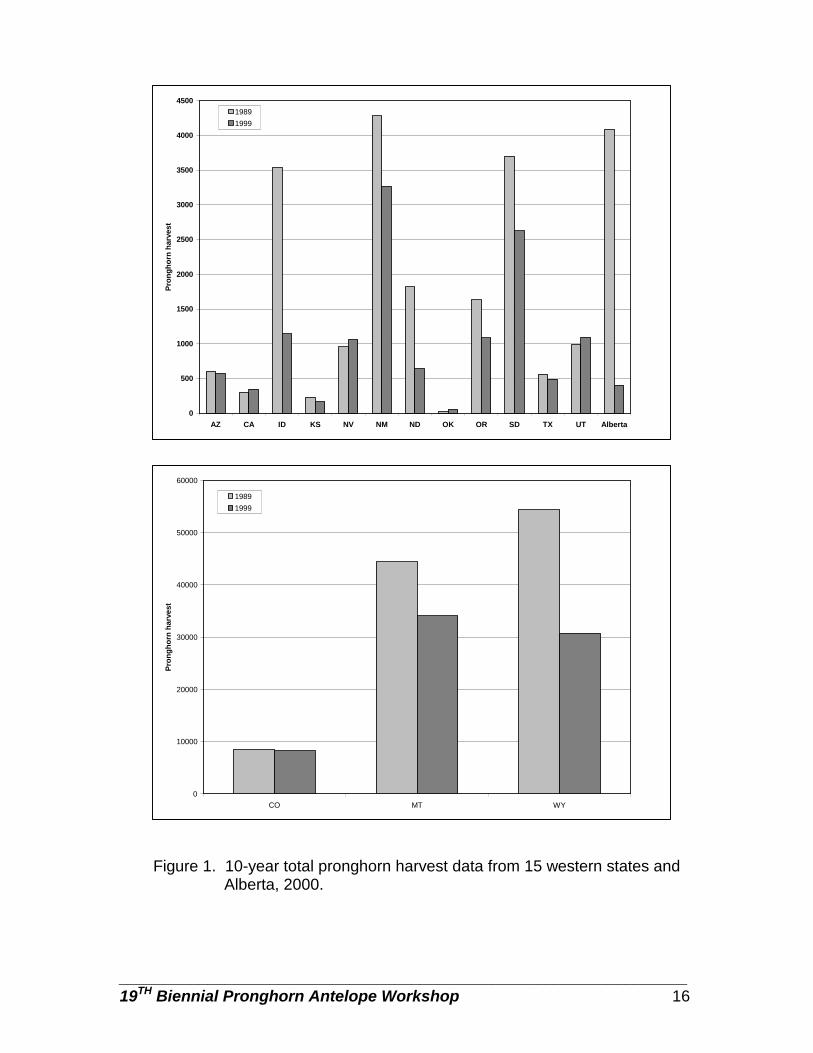
We used harvest data and population estimates to estimate percent population harvested for each respondent (Table 2). The mean percent of pronghorn populations harvested ranged from 5% in Arizona and Texas to ~29% in Montana (Table 2). Pronghorn are not hunted in Baja California Sur and Chihuahua, Mexico. Arizona, Texas, and Alberta were the only respondents that did not harvest does/fawns (Table 2). Where does and fawns were harvested, the percent harvest ranged from 3 to 50%. Except for the states in Mexico, all respondents offered rifle hunts with at least a 64% hunter success rate (Table 3). Wyoming rifle hunt success can be >100% because more than 1 pronghorn may be harvested by a hunter. Only 5 states (Arizona, Colorado, New Mexico, Oregon, and Wyoming) offered muzzleloader-only hunts. Wyoming had a very short muzzleloader season, but no harvest data were provided, Kansas and Alberta did allow muzzleloaders to be used during the general rifle season. Muzzleloader hunter success ranged from 64% in Arizona to 87% in New Mexico (Table 4). Most respondents offered archery-only hunts; percent success ranged from 11% in Oregon and South Dakota to 50% in Alberta (Table 5). We asked the respondents to provide an estimate of pronghorn harvest for 1989 and 1999. In those jurisdictions with the largest harvest (>1,000) all experienced a sharp decline in harvest. Idaho, North Dakota, and Alberta had harvest declines >50%. Wyoming and Montana had the greatest decline with Wyoming having a decline of nearly 25,000 animals harvested (Figure 1). States with smaller populations and harvest (<1,000) were more stable with some showing slight increases in populations. Total hunter numbers and total hunter days trends were similar in most states. SEASON STRUCTURE
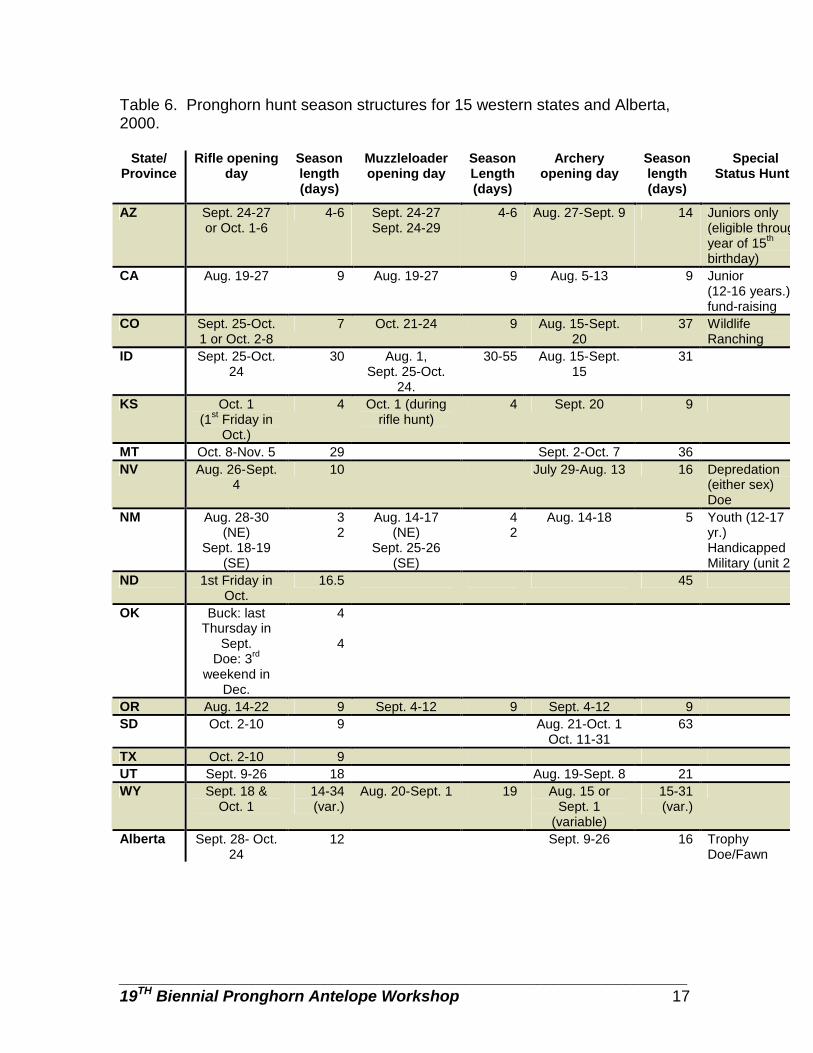
Hunt season structure varied by jurisdiction (Table 6). Many muzzleloader hunts occurred in conjunction with rifle or archery hunts and/or had their own season following the rifle hunt. Most archery hunts opened prior to firearm hunts, with the exception of Oregon whose archery hunt opened following their firearm hunt and Oregon whose archery hunt occurred just before and following the firearm hunt.

________________________________________________________________ 19TH Biennial Pronghorn Antelope Workshop 9
MANAGEMENT STRATEGIES
Non-resident hunters
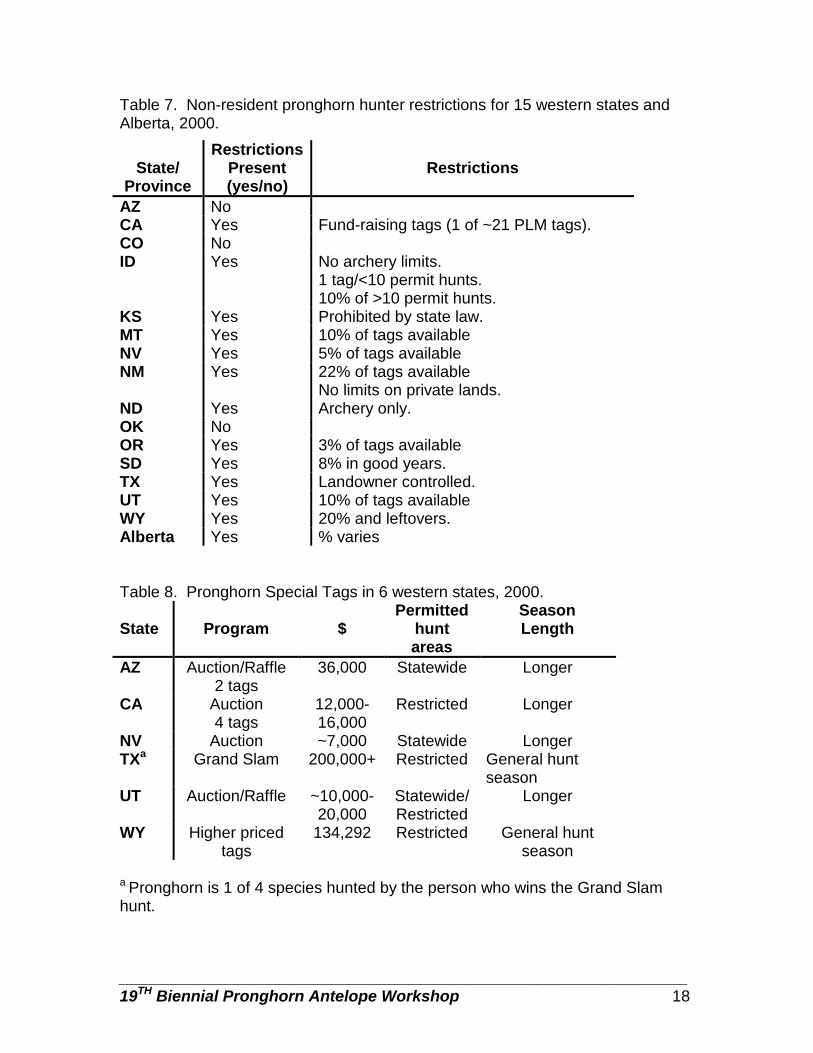
Most respondents (81%) imposed pronghorn hunt restrictions on non-resident hunters, New Mexico promoted non-resident hunters, and the remaining jurisdictions neither promoted nor restricted non-resident hunters (Table 7). Restrictions varied from a maximum of 3% - 22% of the tags allocated to non-residents. North Dakota offers an archery-only season for non-residents. Partnership programs
Most respondents had a partnership program to address wildlife-landowner conflicts. Arizona, Colorado, New Mexico, and Wyoming developed habitat partnership committees and programs comprised of agency personnel and stakeholders to foster communication, enhance cooperation with beneficial projects, and to reduce conflict. In addition, New Mexico designed a landowner sign-up system that distributed 3,380 permits to 800 participating landowners, opening 3 million acres of private land to public hunters.
Several states have landowner compensation programs. California, through their Private Lands Management Program, issues tags (21 in 1999) to landowners that market them. Colorado uses 5% of their pronghorn license revenue to fund The Wildlife Ranching Program where a landowner signs a contract with the Division of Wildlife agreeing to improve habitat for wildlife on their private property. In return, the landowners are issued permits for times outside the regular hunt pronghorn season. Harvest quotas are established and the landowner and agency personnel agree on license numbers. Applications for 60% of the licenses are given to the landowner to market. Kansas has a Walk-In-Hunting Program in which they lease private land and landowners are also provided half-priced permits. Nevada’s Landowner Compensations Tag Program provides each landowner with 1 buck tag for every 50 pronghorn on their private land. Utah developed a big game habitat program that generates habitat authorization fees through a license. Wyoming reimburses landowners for damage on their private lands and also provides them with coupons worth $11.00/pronghorn harvested on their property.
Special Tags
Arizona, California, Nevada, Texas, Utah and Wyoming offered special tag programs to generate revenue for pronghorn management (Table 8). All states, but Wyoming offer these tags through auctions or raffles. Wyoming raises the cost of 30% of authorized tags by $100.00 each, with the proceeds (varied from $7,000 - $200,000 in 1999; Table 8) designated to pronghorn management. Hunters are restricted to specific areas in California, Texas, Wyoming, and some of the tags in Utah. Hunters in the remaining states can hunt statewide. Arizona,
________________________________________________________________ 19TH Biennial Pronghorn Antelope Workshop 10
California, Nevada, and Utah provide for longer hunts with special tags; Texas and Wyoming restrict special tag hunts to the general season. Harvest Pressure Management
All respondents limit opportunity to harvest pronghorn. Arizona uses pre-hunt buck:doe and fawn:doe ratios to establish harvest quotas. Generally, permits decrease when pre-hunt buck:doe ratios are < 25:100 and doe:fawn ratios are < 30:100; and increase if buck:doe ratios are > 30:100 and fawn:doe ratios are > 40:100. New Mexico varies permits to maintain a buck:doe ratio (20:100), but also consider landowner tolerance. Oregon used their summer fawn:doe ratio and population trend data, Utah used buck:doe:fawn ratios, and Nevada used only buck:doe ratios to establish quotas. Idaho used harvest trend data and age structure of harvested animals whereas Kansas used population trend data. California (6% of winter population size), Montana, and Alberta used population estimates to determine harvest levels. Predator Control Programs
Arizona, Montana, Utah, Baja, and Chihuahua conducted some form of predator control program for pronghorn. Although Alberta did not have an organized control program they encourage coyote control through liberal trapping and hunting seasons. Arizona provided $23,000 in a contract with USDA-APHIS for predator control via aerial gunning of coyotes prior to fawning season. Montana also aerially guns coyotes in selected areas prior to fawning season. Utah conducts predator control in certain units when deemed necessary. Baja conducts coyote control around their captive pronghorn management facilities during fawning season and Chihuahua use depredation control. Current Research
Arizona, California, Colorado, North Dakota, Wyoming, and Baja California Sur were currently conducting pronghorn research projects. In northern Arizona, there were 2 separate projects identifying habitat limitations of pronghorn. These projects are pre-treatment studies to evaluate the effects of fenceline modification on pronghorn movements. Arizona is also conducting taxonomic, disease, and mineral requirement studies. The U. S. Fish and Wildlife Service has funded studies on the effects of military overflights on Sonoran pronghorn behavior and fawning on the Barry Goldwater Experimental Range. Research on Sonoran pronghorn in southwestern Arizona continued relative to forage enhancement and pronghorn habitat use on disturbed military sites.
California has been investigating survey methodology and seasonal pronghorn distribution. Colorado has been evaluating the habitat selection and population dynamics of a pioneering pronghorn population. North Dakota has been developing a descriptive analysis of pronghorn range and habitat use.
________________________________________________________________ 19TH Biennial Pronghorn Antelope Workshop 11
Wyoming is conducting 2 research projects with a 3rd slated to begin in 2000. The first is a study designed to identify movement corridors of a small pronghorn population that summers within Teton National Park, but migrates >330 km to winter. The second is a fawn mortality study in central Wyoming to identify the cause of fawn losses to identify how mortality patterns change with time and are linked to habitat conditions. The 3rd study will occur on Warren Air Force Base in Cheyenne to provide information about pronghorn that live on the base. Baja California Sur has ongoing research on Peninsular pronghorn nutritional requirements, habitat, and health status.
Other Management Programs
Nevada is attempting to improve pronghorn water availability as a step towards improving habitat for transplants. Oregon has been evaluating their aerial line transect for estimating abundance. Kansas has been investigating human dimensions and landowner desires related to pronghorn. In Wyoming, a statewide Wyoming Game and Fish working group was formed in 1999 to bring more management attention to pronghorn. This internal group is made up of interested biologists and wardens and its purpose is to help guide research and management. The group is currently working on a rewrite of the pronghorn techniques manual, evaluating differential fawn sex ratios observed in harvest and trapping data, reviewing and updating population model parameters, and identifying research needs.
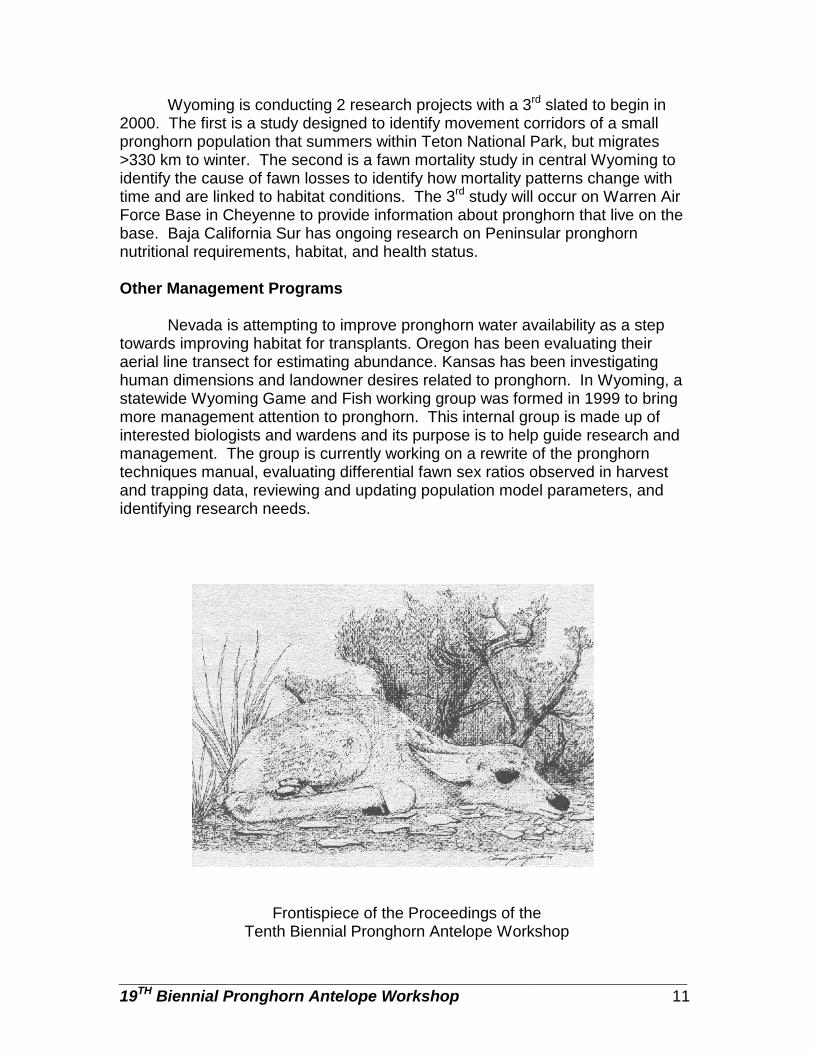
Frontispiece of the Proceedings of the Tenth Biennial Pronghorn Antelope Workshop
______________________________________________________________ 19TH Biennial Pronghorn Antelope Workshop 12
Table 1. 1999 pronghorn population estimates and survey methodology of western states, Alberta, and Mexico, 2000. Province/
State Population Estimate
Survey Vehicle
Survey Method
Estimate Method
Percent Observed
United States AZa 12,000 Fixed-wing Line
transect Model
POP DYN 80
CA 6,100 Fixed-wing Visual obs. Count 95 CO 60,750 Fixed-wing Line
transect Computer
Simulations Unkn.
ID 10,500 Fixed-wing Helicopter
Line transect
Count <60
KS 2,000 Fixed-wing Line transect
Count ~60
MT ~120,000c Fixed-wing Visual obs. Count Unkn. NV 15,000 Fixed-wing
Helicopter Ground
Visual obs. 48±10
NM 35,000 Fixed-wing Strip Count ND 5100 Fixed-wing Indices Usu. 100 OKb 700 Fixed-wing Line
transect Count 50
ORa 12,367 Fixed-wing Ground
Line transect
Count Unkn.
SD 19,900 Fixed-wing Line transect
Count ~33
TX 10,000 Fixed-wing Line transect
% change 100
UT Fixed-wing Ground
Line transect
Count 50-90
WY 450,000 Fixed-wing Ground
Line transect
Model POP II
<50
Canada Alberta a 14,000 Helicopter Line
transect 20
Mexico Baja Calif.
Sur 150 Fixed-wing
Ground 50
Chihuahua 160 Ground Visual obs. Count 100
a 1998 data. b 1992 data. c Estimate based on harvest data.
Tabl
e 2.
199
9 pr
ongh
orn
harv
est d
ata
of w
este
rn s
tate
s an
d A
lber
ta, 2
000.
Sta
te/
Pro
vinc
e
Pop
ulat
ion
estim
ate
Tota
l ha
rves
t To
tal %
H
arve
st
No.
buc
ks
harv
este
d
% b
ucks
ha
rves
ted
N
o. d
oes/
faw
ns
harv
este
d
% d
oes/
faw
ns
harv
este
d
AZ
12,0
00a
574
5 57
4 10
0 0
0 C
Aa
6,10
0 34
7 6
243
70
104
30
CO
60
,750
82
59
14
4,31
4 52
3,
945
48
ID
10,5
00
1147
11
84
3 74
30
4 26
K
S
2,00
0 16
5 8
136
82
29
18
MTb
~120
,000
c 34
,463
~2
9 17
,281
50
17
,183
50
N
V
15,0
00
1,06
1 7
1,02
8 97
33
3
NM
35
,000
3,
269
9 3,
053
93
216
7 N
D
5100
74
8 15
38
6 52
36
2 48
O
K
700d
55
8 49
89
6
11
OR
a 12
,367
1,
086
9 91
4 84
17
2 16
S
D
19,9
00
2,69
6e 14
1,
940e
72
756d
28
UTa
1,
094
53
2 49
56
2 51
TX
a 10
,000
49
0 5
490
100
0 0
WY
45
0,00
0 27
,022
6
18,5
95
69
8,42
7 31
A
lber
ta
14,0
00
406
3 40
6 10
0 0
0
TO
TAL
773,
417
82,8
82
50
,784
32,0
99
a 1
998
data
. b 1
995
data
. c E
stim
ate
base
d on
har
vest
dat
a.
d 19
92 d
ata.
e
1998
arc
hery
dat
a, 1
999
rifle
dat
a.
________________________________________________________________ 19TH Biennial Pronghorn Antelope Workshop 13
______________________________________________________________ 19TH Biennial Pronghorn Antelope Workshop 14
Table 3. 1999 pronghorn rifle harvest and percent success for western states and Alberta, 2000.
State/ Province
Buck Harvest
Doe/fawn harvest
Total Harvest
% hunter success
AZ 420 0 420 84 CAa 234 103 337 64 COa 4,232 3,803 8,035 70 ID 843 304 1,147 70 KS 124 22 146 75 MTb 17,019 17,084 34,103 69 NV 989 33 1,022 81 NMa 2,821 216 3,037 87 ND 314 329 643 85 OK 49 6 55 68 ORa 863 168 1,031 68 SD 1,882 745 2,627 72 TXa 490 0 490 82 UTa 532 562 1,094 86 WY 21,632 9,109 30,741 93
Albertaa 358 0 358 81
TOTAL 52,802 32,484 85,286
a 1998 data. b 1995 data.
Table 4. 1999 pronghorn muzzleloader harvest and percent success for western states, 2000.
State/ Province
Buck Harvest
Doe/fawn harvest
Total Harvest
% hunter success
AZ 57 0 57 64 COa 4,232 3,803 8,035 70 NMa 2,821 216 3,037 87 ORa 863 168 1,031 68
TOTAL 7,973 4,187 12,160
a 1998 data.
________________________________________________________________ 19TH Biennial Pronghorn Antelope Workshop 15
Table 5. 1999 pronghorn archery harvest and percent success for western states and Alberta, 2000.
State/ Province
Buck Harvest
Doe/fawn harvest
Total Harvest
% hunter success
AZ 97 0 97 17 CAa 9 1 10 29 COa 341 33 374 20 ID * * 60 18 KS 12 7 19 13 MTb 262 99 361 28 NV 39 0 39 26 NMa 116 0 116 20 ND 72 33 105 20 ORa 41 4 45 11 SD 58 11 69 11 WY * * 896 40
Albertaa 48 0 48 50
TOTAL 1,095 188 2,239
a 1998 data. b 1995 data. * No data for sex.
________________________________________________________________ 19TH Biennial Pronghorn Antelope Workshop 16
0
10000
20000
30000
40000
50000
60000
CO MT WY
Pro
ngho
rn h
arve
st
19891999
Figure 1. 10-year total pronghorn harvest data from 15 western states and Alberta, 2000.
0
500
1000
1500
2000
2500
3000
3500
4000
4500
AZ CA ID KS NV NM ND OK OR SD TX UT Alberta
Pro
ngho
rn h
arve
st
19891999
________________________________________________________________ 19TH Biennial Pronghorn Antelope Workshop 17
Table 6. Pronghorn hunt season structures for 15 western states and Alberta, 2000.
State/ Province
Rifle opening day
Season length (days)
Muzzleloader opening day
Season Length (days)
Archery opening day
Season length (days)
Special Status Hunts
AZ Sept. 24-27 or Oct. 1-6
4-6 Sept. 24-27 Sept. 24-29
4-6 Aug. 27-Sept. 9 14 Juniors only (eligible through year of 15th birthday)
CA Aug. 19-27 9 Aug. 19-27 9 Aug. 5-13 9 Junior (12-16 years.)fund-raising
CO Sept. 25-Oct. 1 or Oct. 2-8
7 Oct. 21-24 9 Aug. 15-Sept. 20
37 Wildlife Ranching
ID Sept. 25-Oct. 24
30 Aug. 1, Sept. 25-Oct.
24.
30-55 Aug. 15-Sept. 15
31
KS Oct. 1 (1st Friday in
Oct.)
4 Oct. 1 (during rifle hunt)
4 Sept. 20 9
MT Oct. 8-Nov. 5 29 Sept. 2-Oct. 7 36 NV Aug. 26-Sept.
4 10 July 29-Aug. 13 16 Depredation
(either sex) Doe
NM Aug. 28-30 (NE)
Sept. 18-19 (SE)
3 2
Aug. 14-17 (NE)
Sept. 25-26 (SE)
4 2
Aug. 14-18 5 Youth (12-17 yr.) Handicapped Military (unit 29)
ND 1st Friday in Oct.
16.5 45
OK Buck: last Thursday in
Sept. Doe: 3rd
weekend in Dec.
4
4
OR Aug. 14-22 9 Sept. 4-12 9 Sept. 4-12 9 SD Oct. 2-10 9 Aug. 21-Oct. 1
Oct. 11-31 63
TX Oct. 2-10 9 UT Sept. 9-26 18 Aug. 19-Sept. 8 21 WY Sept. 18 &
Oct. 1 14-34 (var.)
Aug. 20-Sept. 1 19 Aug. 15 or Sept. 1
(variable)
15-31 (var.)
Alberta Sept. 28- Oct. 24
12 Sept. 9-26 16 Trophy Doe/Fawn
________________________________________________________________ 19TH Biennial Pronghorn Antelope Workshop 18
Table 7. Non-resident pronghorn hunter restrictions for 15 western states and Alberta, 2000.
State/
Province
Restrictions Present (yes/no)
Restrictions
AZ No CA Yes Fund-raising tags (1 of ~21 PLM tags). CO No ID Yes No archery limits.
1 tag/<10 permit hunts. 10% of >10 permit hunts.
KS Yes Prohibited by state law. MT Yes 10% of tags available NV Yes 5% of tags available NM Yes 22% of tags available
No limits on private lands. ND Yes Archery only. OK No OR Yes 3% of tags available SD Yes 8% in good years. TX Yes Landowner controlled. UT Yes 10% of tags available WY Yes 20% and leftovers. Alberta Yes % varies
Table 8. Pronghorn Special Tags in 6 western states, 2000. State
Program
$
Permitted hunt areas
Season Length
AZ Auction/Raffle 2 tags
36,000 Statewide Longer
CA Auction 4 tags
12,000-16,000
Restricted Longer
NV Auction ~7,000 Statewide Longer TXa Grand Slam 200,000+ Restricted General hunt
season UT Auction/Raffle ~10,000-
20,000 Statewide/ Restricted
Longer
WY Higher priced tags
134,292 Restricted General hunt season
a Pronghorn is 1 of 4 species hunted by the person who wins the Grand Slam hunt.
________________________________________________________________ 19TH Biennial Pronghorn Antelope Workshop 19
SONORAN PRONGHORN RECOVERY: HABITAT ENHANCEMENTS TO INCREASE FAWN SURVIVAL
JOHN J. HERVERT, Arizona Game & Fish Dept., 9140 E. 28th Street, Yuma, AZ 85365 JILL L. BRIGHT, Arizona Game & Fish Dept., 9140 E. 28th Street, Yuma, AZ 85365 LINDEN A. PIEST, Arizona Game & Fish Dept., 9140 E. 28th Street, Yuma, AZ 85365 MARK T. BROWN, Arizona Game & Fish Dept., 9140 E. 28th Street, Yuma, AZ 85365 ROBERT S. HENRY, Arizona Game & Fish Dept., 9140 E. 28th Street, Yuma, AZ 85365 Abstract: Sonoran pronghorn (Antilocapra americana sonorensis) are listed as endangered. From 1994 to1998, fawn recruitment has varied from zero fawns in 1996 and 1997 to 33 per 100 does in 1998. Fawn mortality occurs during 2 time periods: late spring and summer. Recruitment is correlated with the amount and timing of rainfall. During the spring, nutritious forage is necessary for increased energy demands of lactating females and newly weaned fawns. When winter rains are above normal, and corresponding forage conditions are good, fawns survive at least through spring. The second period of high fawn morality was noted during July and August. This is most likely due to increasingly higher temperatures, reduction and desiccation of forage, and increased water needs of fawns. Recruitment of fawns is key to recovery of Sonoran pronghorn. In this paper, we outline our proposal to provide additional and longer lasting forage through habitat manipulations and irrigation. Increased nutritious forage and supplemental water at critical times, when does are lactating and fawns are foraging for themselves, may increase fawn recruitment.
PROCEEDINGS PRONGHORN ANTELOPE WORKSHOP 19:27 Key words: Antilocapra americana sonorensis, fawn recruitment, habitat manipulations, rainfall, recovery, Sonoran pronghorn. INTRODUCTION Sonoran pronghorn (Antilocapra americana sonoriensis) are 1 of 5 subspecies of pronghorn antelope and are found only in southwestern Arizona and parts of west-central Sonora, Mexico. Sonoran pronghorn were listed as endangered in
________________________________________________________________ 19TH Biennial Pronghorn Antelope Workshop 20
1967 by the U.S. Fish and Wildlife Service. Current estimates indicate there are < 142 individuals in the United States (U.S.) (Bright et al. 1999). In the U.S., they inhabit the harsh Sonoran Desert where summer temperatures often exceed 40o C and rainfall averages < 130 mm. Sonoran pronghorn habitat consists of the wide, flat, alluvial valleys dominated by creosote (Larrea tridentata) and bursage (Ambrosia spp.) and the more complex bajadas on lower slopes of mountains. Small ephemeral washes bordered by paloverde (Cercidium spp.) and ironwood (Olneya tesota) flow from the bajadas into the valleys and provides forage resources and thermal protection. In Arizona, Sonoran pronghorn are found on the Cabeza Prieta National Wildlife Refuge (CPNWR), Organ Pipe Cactus National Monument (OPCNM), Barry M. Goldwater Range (BMGR), and some adjacent public and state lands south of Interstate 8.
Their historical range has been altered and fragmented by human
activities, such as damming and diverting large rivers for agriculture, construction of highways and fences, livestock grazing, settlement, recreation and some military activities (USFWS 1998). Low-level Border Patrol flights relative to illegal immigration may also impact pronghorn. These types of activities have reduced the amount and quality of habitat available to Sonoran pronghorn, possibly leading to low population levels.
Although Sonoran pronghorn range has been reduced by numerous past
and ongoing human activities (construction of roads, recreation, etc.), available data indicate that reproductive success and fawn survival are largely governed by environmental factors, not by current land-use practices. No differences in mortality rates were detected between the heavily use BMGR and the largely protected CPNWR / OPCNM area (Hervert et al. 2000). However there are significant correlations between fawn mortality and the amount and timing of rainfall (Hervert et al. 2000). Availability of nutritious forage for lactation and young fawns, which is dependent on rainfall, is critical.
Sonoran pronghorn diet has been studied through microhistological
analysis of fecal pellets collected from 1994 through 1998. These analyses have shown that forbs and shrubs make up the majority of Sonoran pronghorn diets (Hervert et al. 2000). Forbs are selected when they are available, such as in wet summers. Browse makes up the main component of their diet when forbs are not available, such as during droughts. Nutritional analysis indicate that forbs contain large amounts of protein, as well as being highly digestible and providing preformed water, while shrubs are high in fat (Hughes and Smith 1990, Fox 1997). Numerous studies of pronghorn feeding habits in other parts of the country confirm that nutritious forbs are the most selected forage items for pronghorn when they are available (Beale and Smith 1970, Yoakum 1990).
Availability of preferred food items for pronghorn is dependent on the timing and amount of rainfall. All desert plants respond to moisture input, but annual plants are triggered by rainfall. Normal periods of rainfall in the Sonoran
________________________________________________________________ 19TH Biennial Pronghorn Antelope Workshop 21
desert follow a bimodal pattern, occurring as convective thundershowers in the summer and long cyclonic storms in the winter. Winter storms are the primary stimulant of plant productivity, much of it in the form of winter ephemeral plant growth (Patten 1978). Adequate winter rains are needed to sustain winter annuals into spring and early summer, when females need nutritious forage for the high energy demands of lactation and weaned fawns need quality forage for growth.
Additionally, a good summer monsoon season is needed to produce
sufficient quantities of summer annuals and promote new growth on perennials, without which fawns will be unable to maintain body weight and will subsequently die. Summer monsoons also provide ephemeral sources of free standing water.
Sonoran pronghorn use certain areas of the BMGR on a much more
frequent basis than surrounding areas (deVos 1989; Hervert et al. 1997a, 2000). These are areas that have been disturbed by military activities (e.g. HE Hill, targets, and runways), creating a more open habitat, favorable to pronghorn. In addition, the disturbed soil surface, which holds water runoff better than surrounding flat areas, promotes increased herbaceous plant growth preferred by pronghorn. Availability of late season quality forage and free standing water, which collects in clay bottomed bomb craters, allow pronghorn to occupy these areas longer and in larger groups than otherwise expected (Hervert et al. 1997b). Additionally, more fawns were associated with the pronghorn groups occupying the BMGR than were observed in other areas (unpubl data).
Using what we have learned through observations of pronghorn use and
fawn survival on the disturbed areas on the BMGR, and knowledge of pronghorn behavior, feeding habits and nutritional requirements, we propose, through habitat manipulations, to provide areas favorable to pronghorn, during periods critical to fawn survival. By creating open habitats, with plentiful food and water, we expect to increase fawn survival. PROPOSED METHODS SITE SELECTION
Habitat enhancement sites will be located within current pronghorn range based on several factors. The main considerations for locating sites are: 1) areas that pronghorn are known to favor during winter and spring; 2) areas with soil types conducive to forb growth; 3) areas with existing road accessibility; and 4) areas without land use conflicts, such as military use or wilderness (Table 1).
Sonoran pronghorn are nomadic animals, covering > 900 km2 throughout
the year (Hervert et al 2000). Using the last 5 years of radio telemetry data, areas that pronghorn typically use during the winter and spring months will be determined. In addition, habitat enhancement sites may be placed in areas that pronghorn normally pass through enroute to their preferred summer habitats,

________________________________________________________________ 19TH Biennial Pronghorn Antelope Workshop 22
such as at the base of bajadas or near chain-fruit cholla (Opuntia fulgida) areas. Additional sites in summer habitats may be considered during droughts.
In addition to selecting areas that pronghorn should frequent, habitat
enhancement sites must also be in soils that are conducive to forage growth and persistence. Sandy soils allow deeper penetration of moisture and allow roots to penetrate farther underground. Tevis (1958) found that the onset of wilting and drying of ephemeral forage was delayed by 2 weeks in areas of sandy dunes compared to adjacent heavier soiled flat areas. Even a slight piling of windblown sand in the flat areas produced better conditions of water penetration and retention. HABITAT MANIPULATIONS
Most habitat enhancement sites will typically cover an area of 1 km2, which is based on the size of the disturbed areas preferred by pronghorn on BMGR. Some areas are designed along existing roads and will only be 500-m long and approximately 30-m wide on one side of the road. Creosote Thinning: Creosote bush has increased in the Sonoran and Chihuahuan deserts from 1910 to 1950 and continues to increase in density and area (Buffington and Herbel 1965, Herbel et al. 1985). As creosote and associated woody species increase, forage production decreases (Anderson et al. 1957). Likewise, when woody plant populations are removed or thinned, forage production increases (Scifres et al. 1979, Jacoby et al. 1982, Morton et al. 1990, Morton and Melgoza 1991).
In addition, studies of pronghorn habitat cite visually open areas with low vegetative structure averaging < 64 cm and < 35% shrub cover as optimal for pronghorn (Yoakum 1974, 1980; O’Gara and Yoakum 1992, Ockenfels et al. 1994, Lee et al. 1998). Sonoran pronghorn use creosote flats less than expected based on availability during dry years and as expected in wet years (Hervert et al. 2000). Pronghorn may avoid creosote flats because visibility is restricted and forage is limited in this vegetation type (Arizona Game and Fish Department 1981). Duerr et al. (1999) found that Sonoran pronghorn selected areas with less cover of large shrubs than was generally available and that they seemed to avoid the dominant large shrub, creosote bush, on the tactical ranges.
Thinning large creosote bushes in the habitat enhancement sites is
expected to make the areas more structurally preferable for pronghorn and to increase forage production from both natural rainfall and watering. Creosotes would not be removed in desert washes, on desert pavement terraces, or in areas where they are already sparse. Creosote will be removed by burning individual plants using a propane torch. Brown and Minnich (1986) found that creosote bushes are poorly adapted to relatively low intensity fire, as evidenced by limited sprouting and reproduction. Many creosote shrubs with living foliage after burning died later as a result of basal cambium damage.
________________________________________________________________ 19TH Biennial Pronghorn Antelope Workshop 23
Annual Forage Irrigation: Water will be trucked to each site receiving this treatment or a well will be drilled. Wells will be drilled on the northeastern edge of the Mohawk Dunes site and the western edge of the Granite Mountain site. These 2 areas are far from good roads, and pronghorn are expected to use the sites for long periods of time. A water truck will serve the three Aztec Hills plots. A pipeline and sprinkler system will be used to convey the water from the well or a holding tank, to each irrigated plot. Water will be applied frequently enough to promote forage growth and keep existing forage alive as long as possible while pronghorn are in the area or until summer rains relieve the need for watering. Depending on natural rainfall, watering could begin in November, and continue through May or June. Additional watering may be necessary in July and August if summer drought conditions prevail and the pronghorn stay near the plots. We anticipate applying up to 13 cm of water throughout the watering cycle. Approximately 0.75 ha within each plot (10 plots total) will receive this treatment. Watering will be done at night, when evaporation loss will be minimized and pronghorn are least likely to be disturbed.
This additional water should promote growth and sustain production of winter annuals into late spring and early summer while pronghorn are in the general area. Mortality of winter annuals is not associated with the onset of reproduction, but occurs when moisture reserves in the soil are depleted, through high temperatures and evaporation (Forseth et al. 1984). Given heavy rains from late season storms, vegetative and reproductive growth may continue for extended periods, and some annuals can “perennate” and live for 2 years (Forseth et al. 1984). Tevis (1958) found that when 5 cm of water was sprinkled on a dying population of mature ephemerals, all living individuals revived completely and resumed extensive growth and flowering. Perennial Forage Irrigation: Preferred perennial forage species such as white ratany (Krameria grayi), wire lettuce (Stephenomeria spp.) and silverbush (Ditaxis spp.) will be irrigated with the same sprinkler system used to grow annuals. These perennial shrubs sustain pronghorn when annual forage is not available, and given additional water, they may stay green and more palatable. Existing plants will be watered and additional perennials may be established from seed (local sources only). Free Standing Water: In addition to forage improvements, we propose to provide a temporary supply of free standing water at some habitat enhancement sites during the time pronghorn are using the area and water use is deemed beneficial for fawn survival. The water would be stored underground in a single length of buried polyvinyl chlorine (PVC) pipe, 61 cm in diameter and 6.5-m in length. The pipe would have a capacity of 1700 liters. The pipe would be filled by water truck and would be connected to a 76 cm deep walk-in drinker. The entire system would be buried 76 cm in the ground. There would be a valve between the PVC pipe and the walk-in trough allowing the system to be turned off.
________________________________________________________________ 19TH Biennial Pronghorn Antelope Workshop 24
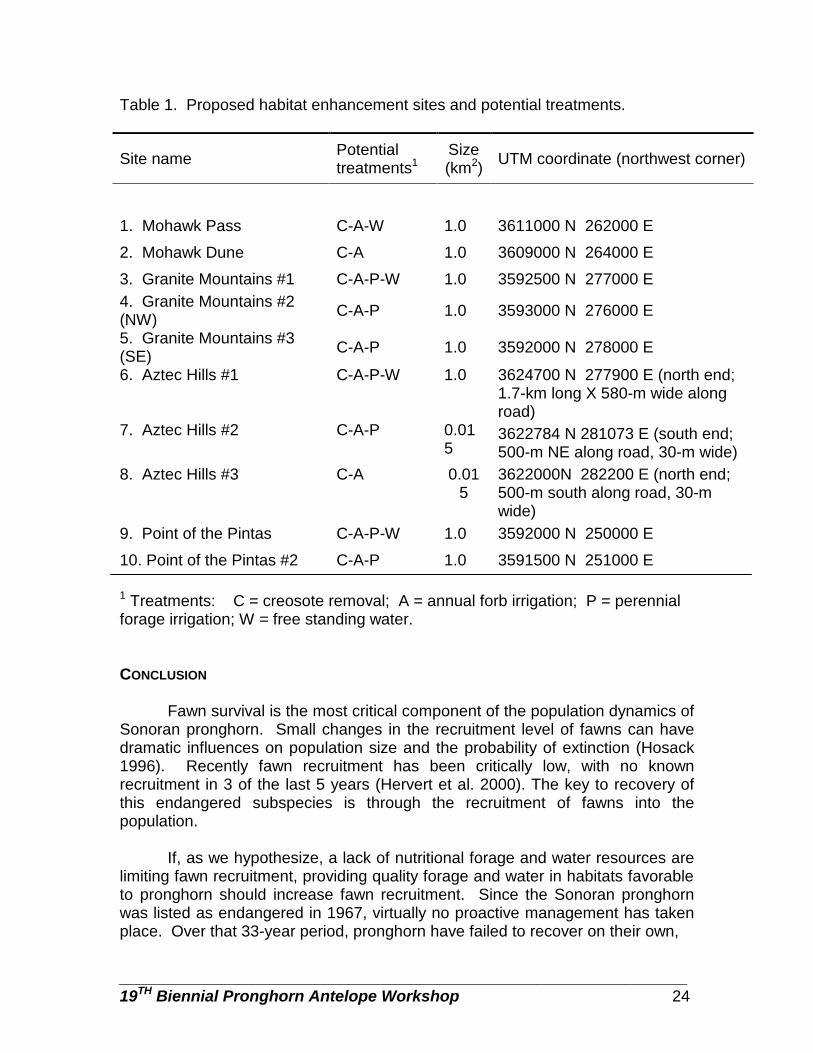
Table 1. Proposed habitat enhancement sites and potential treatments.
Site name Potential treatments1
Size (km2) UTM coordinate (northwest corner)
1. Mohawk Pass C-A-W 1.0 3611000 N 262000 E
2. Mohawk Dune C-A 1.0 3609000 N 264000 E
3. Granite Mountains #1 C-A-P-W 1.0 3592500 N 277000 E 4. Granite Mountains #2 (NW) C-A-P 1.0 3593000 N 276000 E
5. Granite Mountains #3 (SE) C-A-P 1.0 3592000 N 278000 E
6. Aztec Hills #1 C-A-P-W 1.0 3624700 N 277900 E (north end; 1.7-km long X 580-m wide along road)
7. Aztec Hills #2 C-A-P 0.015
3622784 N 281073 E (south end; 500-m NE along road, 30-m wide)
8. Aztec Hills #3 C-A 0.015
3622000N 282200 E (north end; 500-m south along road, 30-m wide)
9. Point of the Pintas C-A-P-W 1.0 3592000 N 250000 E
10. Point of the Pintas #2 C-A-P 1.0 3591500 N 251000 E
1 Treatments: C = creosote removal; A = annual forb irrigation; P = perennial forage irrigation; W = free standing water. CONCLUSION
Fawn survival is the most critical component of the population dynamics of Sonoran pronghorn. Small changes in the recruitment level of fawns can have dramatic influences on population size and the probability of extinction (Hosack 1996). Recently fawn recruitment has been critically low, with no known recruitment in 3 of the last 5 years (Hervert et al. 2000). The key to recovery of this endangered subspecies is through the recruitment of fawns into the population.
If, as we hypothesize, a lack of nutritional forage and water resources are
limiting fawn recruitment, providing quality forage and water in habitats favorable to pronghorn should increase fawn recruitment. Since the Sonoran pronghorn was listed as endangered in 1967, virtually no proactive management has taken place. Over that 33-year period, pronghorn have failed to recover on their own,
________________________________________________________________ 19TH Biennial Pronghorn Antelope Workshop 25
and there is no reason to expect they will in the future. In order to ensure their continual survival, meaningful habitat management strategies are needed now.
LITERATURE CITED ANDERSON, D., L.P. HAMILTON, H.G. REYNOLDS AND R.R. HUMPHREY. 1957.
Reseeding desert grassland ranges in southern Arizona. (Revised) Arizona Agricultural Experiment Station Bulletin 249.
ARIZONA GAME AND FISH DEPARTMENT. 1981. The Sonoran Pronghorn. Special
Report Number 10. Arizona Game and Fish Department, Phoenix, AZ. 55 pp.
BEALE, D.M. AND A.D. SMITH. 1970. Forage use, water consumption, and
productivity of pronghorn antelope in western Utah. Journal of Wildlife Management 34:570-583.
BRIGHT, J.L., J.J. HERVERT, L.A. PIEST, R.S. HENRY AND M.T. BROWN. 1999.
Sonoran pronghorn 1998 aerial survey summary. Nongame and Endangered Wildlife Program Technical Report 152. Arizona Game and Fish Department, Phoenix, AZ.
BROWN, D.E. AND R.A. MINNICH. 1986. Fire and changes in creosote bush scrub
of the western Sonoran desert, California. American Midland Naturalist 116(2):411-422.
BUFFINGTON, L.C. AND C.H. HERBEL. 1965. Vegetation changes on a semidesert
grassland range. Ecological Monographs 35:139-164. DUERR, A., M.A. MCLEOD AND E.L. SMITH. 1999. Sonoran pronghorn use of 2
tactical ranges on the Barry M. Goldwater Range. Luke Air Force Base Contract Number F41624-94-D-8016.
DEVOS, J.C. 1989. Evaluation of Sonoran Pronghorn movements around military
activity sites on the Barry M. Goldwater Air Force Range. Arizona Game and Fish Department, Phoenix, Arizona.
FORSETH, I.N., J.R. EHLERINGER, K.S. WERK AND C.S. COOK. 1984. Field water
relations of Sonoran desert annuals. Ecology 65(5):1436-1444. FOX, L.M. 1997. Nutritional content of forage in Sonoran pronghorn habitat,
Arizona. M.S. Thesis, Univ. Arizona, Tucson. 228pp.
________________________________________________________________ 19TH Biennial Pronghorn Antelope Workshop 26
HERBEL, C.H., H.L. MORTON AND R.P. GIBBENS. 1985. Controlling shrubs in the arid southwest with tebuthiuron. Journal of Range Management 36:149-151.
HERVERT, J.J., J.L. BRIGHT, M.T. BROWN, L.A. PIEST AND R.S. HENRY. 2000.
Sonoran Pronghorn Population Monitoring: 1994-1998. Nongame and Endangered Wildlife Program Technical Report 162. Arizona Game and Fish Department, Phoenix, AZ.
HERVERT J.J., L.A. PIEST, W. BALLARD, R.S. HENRY, M.T. BROWN AND S. BOE.
1997a. Sonoran Pronghorn Population Monitoring: Progress Report. Nongame and Endangered Wildlife Program Technical Report 126. Arizona Game and Fish Department, Phoenix, AZ.
HERVERT, J.J., R.S. HENRY, AND M.T. BROWN. 1997b. Preliminary investigations
of Sonoran pronghorn use of free-standing water. Proceedings of a Symposium on Environmental, Economic and Legal Issues Related to Rangeland Water Development. The Center for the Study of Law, Science and Technology, Arizona State University, Tempe, Arizona. Pp. 126 – 137.
HOSACK, D.A. 1996. Population Viability Analysis Workshop for the Endangered
Sonoran Pronghorn (Antilocapra americana sonoriensis) in the United States. Draft. 22pp.
HUGHES, K.S. AND N.S. SMITH. 1990. Sonoran pronghorn use of habitat in
southwest Arizona. Final Report 14-16-009-1564 RWO #6. AZ. Coop. Fish & Wildl. Research Unit, Tucson, AZ. 58 pp.
JACOBY, P.W., R.D. UECKERT, AND F.S. HARTMAN. 1982. Control of creosotebush
(Larrea tridentata) with pelleted tebuthiuron. Weed Science 30:307-310. LEE, R.M., J.D. YOAKUM, B.W. O'GARA, T.M. POJAR, AND R.A. OCKENFELS, eds.
1998. Pronghorn Management Guides. 18th Pronghorn Antelope Workshop, Prescott, AZ. 110pp.
MORTON, H.L. AND A. MELGOZA. 1991. Vegetation changes following brush
control in creosotebush communities. Journal of Range Management 44(2):133-139.
MORTON, H.L., F.A. Ibarra-F, M.H. Martin-R and J.R. Cox. 1990. Creosotebush
control and forage production in the Chihuahuan and Sonoran Deserts. Journal of Range Management 43(1):43-48.
________________________________________________________________ 19TH Biennial Pronghorn Antelope Workshop 27
OCKENFELS, R.A., A.A. ALEXANDER, C.L. DOROTHY TICER AND W.K. CARREL. 1994. Home ranges, movement patterns and habitat selection of pronghorn in central Arizona. Arizona Game and Fish Department Technical Report 13. 80 pp.
O’GARA, B.W. AND J.D. YOAKUM, editors. 1992. Pronghorn management guides.
Proceedings Pronghorn Antelope Workshop 15 (suppl.) 101 pp. PATTEN, D.T. 1978. Productivity and production efficiency of an upper Sonoran
desert ephemeral community. American Journal of Botany 65(8):891-895.
SCIFRES, C.J., J.L. MUTZ AND W.T. HAMILTON. 1979. Control of mixed brush with
tebuthiuron. Journal of Range Management 32:155-158. TEVIS JR., L. 1958. A population of desert ephemerals germinated by less than
one inch of rain. Ecology 39(4):688-695. U.S. FISH AND WILDLIFE SERVICE. 1998. Final Revised Sonoran Pronghorn
Recovery Plan. Albuquerque, New Mexico. 70 pp. YOAKUM, J.D. 1974. Pronghorn habitat requirements for sagebrush-grasslands.
Proceedings Pronghorn Antelope Workshop 6:16-24. YOAKUM, J.D. 1980. Habitat management guides for the American pronghorn
antelope. U.S. Bureau of Land Management Technical Note 347. Denver, CO. 78 pp.
YOAKUM, J.D. 1990. Food habits of the pronghorn. Proceedings Pronghorn
Antelope Workshop 14:102-110
________________________________________________________________ 19TH Biennial Pronghorn Antelope Workshop 28
RELATIONSHIPS BETWEEN DIET QUALITY AND FECAL NITROGEN,
FECAL DIAMINOPIMELIC ACID AND BEHAVIOR IN A CAPTIVE GROUP OF PRONGHORN.
MARY ROBINSON, Department of Biological Sciences, University of Idaho, Moscow, ID 83844-3051. MARGARET WILD, Colorado Division of Wildlife, 317 W. Prospect, Fort Collins, CO 80526. JOHN BYERS, Department of Biological Sciences, University of Idaho, Moscow, ID 83844-3051. Abstract: Both behavior and fecal indices have been suggested as measures of diet quality of wild ruminants; however, their accuracy and applicability in measuring the diet quality of pronghorn have not been evaluated. We investigated the fecal and behavioral response of 10 captive pronghorn females (Antilocapra americana) to reductions in the availability of high quality forage. Low quality forage, consisting of over 98% mature cheatgrass brome (Bromus tectectorum), was available in excess at all times. Intake of high quality forage was reflected in the total fecal output by the group and by the concentration of N and DAPA (diaminopimelic acid) in the feces. Fecal N and DAPA did not accurately reflect changes in body weight. However, fecal N and DAPA may be useful in monitoring trends in the diet quality of pronghorn. The rate of aggressive interactions was inversely related to diet quality. However, the relationship between the time devoted to feeding and the availability of high quality forage was more complex.
PROCEEDINGS PRONGHORN ANTELOPE WORKSHOP 19:28-44 Key words: aggression, Antilocapra americana, behavior, nitrogen, DAPA, forage quality, forage quantity, pronghorn.
Changes in body condition measures, such as body weight, are expressions of energy and matter balances and reflect attempts by animals to use resources to the best advantage (Gates and Hudson 1981). An accurate measure of diet quality for free-ranging ruminants has proved ellusive (Leslie and Starkey 1985; Irwin et al. 1993; Wehausen 1995; Kucera 1997). Considerable effort has been directed towards the development of indices between population condition and diet and fecal nutrient levels (Holechek et al. 1982; Leslie and Starkey 1985).
Fecal nitrogen (N) is correlated with various measures of diet quality such
as dietary N, energy, and intake and has been used to assess the quality of diets
________________________________________________________________ 19TH Biennial Pronghorn Antelope Workshop 29
of wild ruminants (e.g., Erasmus et al. 1978; Wofford et al. 1985; Osborn and Jenks 1998). However the reliability of fecal N as an index of diet quality may be compromised by secondary plant compounds such as tannins (Rhoades and Cates 1976; Zucker 1983; Freeland et al. 1985; Robbins et al. 1987) which can decrease N absorption and hence elevate fecal N.
Another fecal index is diaminopimelic acid (DAPA). DAPA is an amino
acid found almost exclusively in bacterial cell walls (Work and Dewey 1953; Purser and Buechler 1966) and its concentration increases in the rumen pool as a function of increasing bacterial mass (Leslie et al. 1989). Low levels of dietary energy in the diet may limit microbial growth and hence should be detected by decreases in fecal DAPA. Fecal DAPA has been found to vary with season (Mauty et al. 1976; Kie and Burton 1984; Kucera 1997), species of ruminant (Leslie et al. 1989), and intake (Hodgman et al. 1996). Unlike fecal N, fecal DAPA is not thought to be compromised by factors such as secondary plant compounds (Nelson and Davitt 1984).
Implicit in the use of fecal indices is the assumption that daily fecal output is constant or that changes do not affect the concentration of the index in the feces (Leite and Stuth, 1990). However fecal progesterone concentrations in baboons (Papio cynocephalus cyncocephalus) have been shown to be inversely related to the total fecal output (Wasser et al. 1993). Changes in total fecal output may occur due to either changes in diet composition or forage availability. In the presence of such changes, fecal indices may over- or underestimate dietary quality (Belonje and Van den Berg 1980; Leite and Stuth 1990; Miller et al. 1991; Kucera 1997). No information exists regarding the effect of total fecal output on the concentrations of N or DAPA in the feces of pronghorn (Antilocapra americana). Before the accuracy of fecal indices in measuring diet can be fully evaluated more knowledge relative to fecal output is required (Leite and Stuth 1990).
Social and non-social interactions may also influence or be influenced by
nutrition. Any organism has a limited amount of resources and time available to devote to foraging, growth, maintenance and reproduction (Pianka 1994). Several researchers have reported increases in foraging behavior (and corresponding decreases in rumination and other behaviors) in various ruminants in response to decreases in forage availability (Arnold 1960a,b 1962; Miller 1971; Geist 1971) and quality (Arnold 1960b, Forchhammer 1995; Kronberg and Malechek 1997). The relationships between feeding and diet quality in pronghorn are largely unknown.
The primary interactions among pronghorn females involve assertions of dominance or aggressive takeover of feeding sites (Byers 1997). In the presence of seasonal variations in food abundance, the rate of agonistic interactions seems to be held constant in pronghorn groups through the modification of group sizes (Byers 1997). If this is the case, then in pronghorn groups of constant size, with temporally varying food abundance, we would expect to see changes in the

________________________________________________________________ 19TH Biennial Pronghorn Antelope Workshop 30
rate of agonistic interactions. In other species, under less than optimal conditions, it is often the low ranking animals which first show signs of impaired function such as lowered disease resistance or greater weight loss (Rowell 1966; Demarest et al. 1997). However among pronghorn females no significant fitness advantages of high social rank have been detected (Byers 1997; Dennehy 1997).
The possibility exists that in a species such as pronghorn, in which
predation of healthy adults is low (Byers 1997), predator avoidance strategies may have a negligible effect on activity and therefore activity may accurately reflect habitat quality and population health.
The specific questions addressed by this study were: 1) are changes in
the availability of high quality forage by pronghorn females reflected in changes in total fecal output, 2) are N and DAPA levels in feces good measures of diet quality in pronghorn females, 3) does the time devoted to feeding by pronghorn females vary inversely with the quality of their diet, 4) does diet quality influence the occurrence of other behaviors in pronghorn females, and 5) does social rank influence the quality of a female’s diet?
METHODS
We conducted the study during June, July, and August 1998, at the Foothills Wildlife Research Facility, Fort Collins, Colorado. Ten captive female pronghorn were kept together in a 1.5ha pasture containing a wooden shelter, water and a trace mineral block. The animals ranged in age from seven to three years. All were bottle-raised in captivity. None of the animals were pregnant or had bred in the previous year. The animals’ normal diet consisted of ad libitum alfalfa hay (approx. 0.35kg/animal/day) and a pelleted ration (approx. 1kg/animal/day; Baker and Hobbs 1985) fed at 0800h and distributed between 3 and 10 feeding troughs respectively. The pasture vegetation was composed almost entirely of mature cheatgrass brome (Bromus tectectorum), and was specifically chosen for its unpalatable forage to provide as little additional nutrients as possible while allowing the animals, as far as is possible in captivity, the expression of their full suite of behaviors. The animals had been housed in the pasture in previous years and were allowed to adapt to the pasture for 3 days prior to the commencement of the study and to remove any palatable vegetation.
For sampling purposes, we divided the summer into 5 two-week periods or diets. The study consisted of two restricted feeding levels (75%, 50%) preceded and followed by ad libitum feeding. We measured the intake of alfalfa and pellets during the first ad libitum feeding and used it to calculate, by weight, the 75% and 50% feeding levels. The first week of each diet was an adjustment period (the first adjustment period was shortened to 3 days as the only change in their normal diet/lifestyle involved a change of pasture and the increased presence of a keeper in the field) and the second week was the sampling period during which time we measured, as described below, the forage composition, each animal’s
________________________________________________________________ 19TH Biennial Pronghorn Antelope Workshop 31
body weight and behavior, and daily fecal output by the group. We also collected fecal samples from each animal.
We monitored the composition and abundance of pasture vegetation at weekly intervals using the canopy cover method (Daubenmire 1959). Forty 20 x 30cm plots were evenly spaced throughout the pasture and marked by tent pegs driven level with the ground. We then estimated the area of each plot, and hence the total pasture area, occupied by bare ground, cheatgrass, and non-cheatgrass forages.
The animals had previously been trained to stand on a platform for weighing and were weighed between 0500 and 0600h on the first day of the study and on the final day of each diet.
We collected samples of alfalfa and pellets in the middle of each sampling week and froze them for future analysis of nitrogen in the Wildlife Habitat Laboratory at Washington State University. We analyzed nitrogen levels using the Kjeldahl method according to AOAC guidelines (1990). We estimated dietary nitrogen (N) for the group each day based on the N content of the pellets and alfalfa. No estimate could be made of the contribution of pasture vegetation to dietary N intake.
We collected fecal samples during each sampling week. During
observation periods, defecation by individuals was recorded and, after the animal had moved a sufficient distance away to prevent undue disturbance, we collected approximately 20 grams of feces using forceps or latex gloves. The samples were stored in plastic Whirl PakTM bags at -20oC within 4 hours of collection and later analyzed for nitrogen and DAPA (according to Davitt and Nelson 1984). Where possible, one fecal sample was collected per animal per day and only the last 3 fecal samples collected per diet from each animal were analyzed.
We monitored the daily total fecal output of the group by hand collecting
and weighing all feces in the pasture prior to feeding the animals at 0800h. To test the accuracy of total fecal output estimates, an independent observer, at times unknown to the collector, watched the animals defecating and on a diagram noted the position of the sample in the pasture. The following morning, after the collection of feces from the pasture was completed, the number of missed samples was recorded. We calculated the total amount of N and DAPA excreted by the group per day by multiplying the mean fecal N or DAPA concentration (g/kg) for a particular day by the total amount of feces (kg) collected on that day.
We collected activity budget data during sampling weeks between 0600 and 2100h using instantaneous point sampling at 5-minute intervals for 1hour periods (Altmann 1974). Over the course of each sampling week a total of 45 hours of observations were collected and these consisted of three replicates of each hour (e.g., data was collected between 1500 and 1600h 3 times during
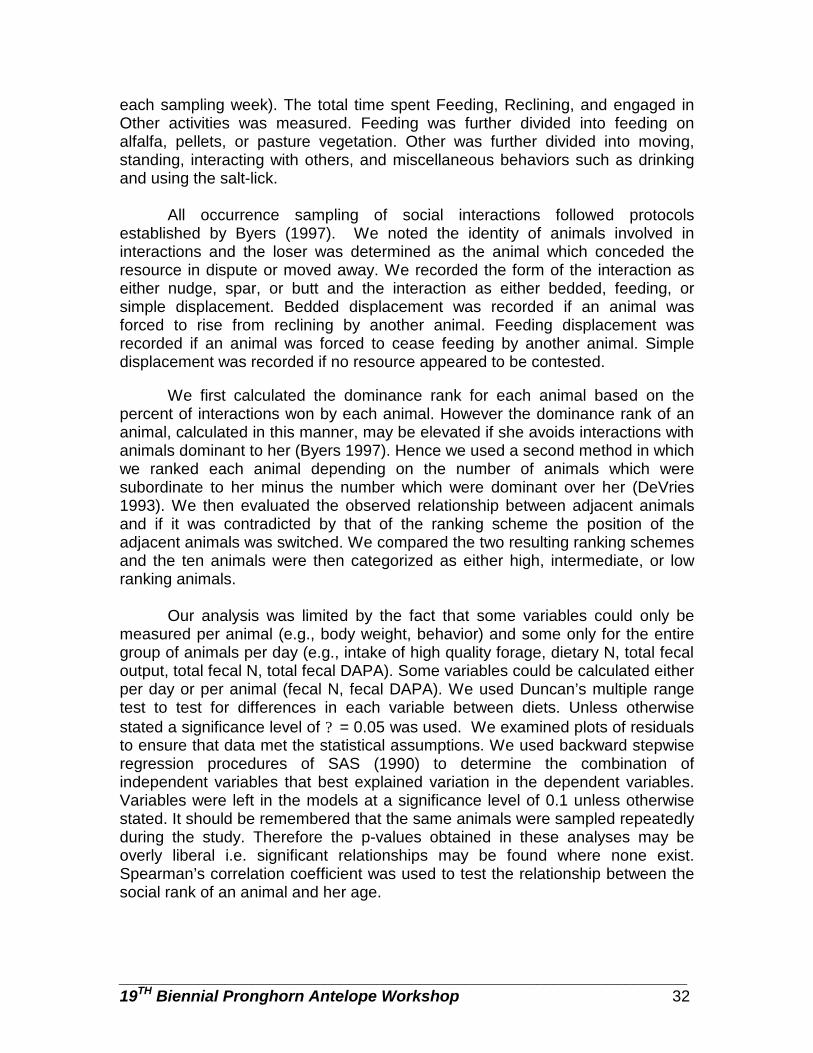
________________________________________________________________ 19TH Biennial Pronghorn Antelope Workshop 32
each sampling week). The total time spent Feeding, Reclining, and engaged in Other activities was measured. Feeding was further divided into feeding on alfalfa, pellets, or pasture vegetation. Other was further divided into moving, standing, interacting with others, and miscellaneous behaviors such as drinking and using the salt-lick.
All occurrence sampling of social interactions followed protocols
established by Byers (1997). We noted the identity of animals involved in interactions and the loser was determined as the animal which conceded the resource in dispute or moved away. We recorded the form of the interaction as either nudge, spar, or butt and the interaction as either bedded, feeding, or simple displacement. Bedded displacement was recorded if an animal was forced to rise from reclining by another animal. Feeding displacement was recorded if an animal was forced to cease feeding by another animal. Simple displacement was recorded if no resource appeared to be contested.
We first calculated the dominance rank for each animal based on the percent of interactions won by each animal. However the dominance rank of an animal, calculated in this manner, may be elevated if she avoids interactions with animals dominant to her (Byers 1997). Hence we used a second method in which we ranked each animal depending on the number of animals which were subordinate to her minus the number which were dominant over her (DeVries 1993). We then evaluated the observed relationship between adjacent animals and if it was contradicted by that of the ranking scheme the position of the adjacent animals was switched. We compared the two resulting ranking schemes and the ten animals were then categorized as either high, intermediate, or low ranking animals.
Our analysis was limited by the fact that some variables could only be
measured per animal (e.g., body weight, behavior) and some only for the entire group of animals per day (e.g., intake of high quality forage, dietary N, total fecal output, total fecal N, total fecal DAPA). Some variables could be calculated either per day or per animal (fecal N, fecal DAPA). We used Duncan’s multiple range test to test for differences in each variable between diets. Unless otherwise stated a significance level of ? = 0.05 was used. We examined plots of residuals to ensure that data met the statistical assumptions. We used backward stepwise regression procedures of SAS (1990) to determine the combination of independent variables that best explained variation in the dependent variables. Variables were left in the models at a significance level of 0.1 unless otherwise stated. It should be remembered that the same animals were sampled repeatedly during the study. Therefore the p-values obtained in these analyses may be overly liberal i.e. significant relationships may be found where none exist. Spearman’s correlation coefficient was used to test the relationship between the social rank of an animal and her age.

________________________________________________________________ 19TH Biennial Pronghorn Antelope Workshop 33
RESULTS Relationship between Intake and Output
Daily intake of high quality forage (pellets and alfalfa) and dietary N by the group of ten animals during the last 3 days of each diet differed significantly among all diets (Table1; Fig 1). The proportion of fecal samples missed by the collector was found to be <1.5% (N = 42 pellet groups). Daily fecal output by the group also differed significantly with diet (Table 1; Fig 1). Daily fecal output (Output) by the group was related to their daily high quality forage intake (Intake) by the equation: Estimated Output = 3.01 + 0.507 Intake, (R2 = 0.569, P = 0.0012, N = 15). Intake of pasture vegetation could not be measured during the study and hence its contribution to dietary N and fecal output remain unknown. However, from our observations, the animals only ingested very small quantities of the pasture vegetation with non-cheatgrass forages being preferred. We estimated that non-cheatgrass forages accounted for less than 0.5% of the total pasture area and less than 0.6% of the total vegetation cover in all diets, except in the first ad libitum when non-cheatgrass forages accounted for 6.5% of the total pasture area and 7.2% of the total vegetation. Throughout the study, bare ground and cheatgrass accounted for >10% and >75% of the total pasture area, respectively.
Diet Quality and Fecal N, DAPA
All but two animals lost weight during the 75% diet. By the end of the second ad libitum diet only two animals were more than 0.6 kg lighter than at the start of the study. All others were within 0.6 kg of their original weight (first ad libitum) or had exceeded it. By the end of the third ad libitum diet, all animals had regained weight lost during the 50% diet and all were heavier than at the commencement of the study.
Duncan’s multiple range test identified significant differences in dietary N
and in the mean fecal N and DAPA levels per animal per diet (Table 1; Fig 2). Body weight was only very poorly (r2 = 0.085 P = 0.1251 N= 50) described by the equation: Estimated Body weight = 37.643 + 4.222 * (fecal N) – 8.934 * (fecal DAPA). We calculated mean daily fecal N and DAPA concentrations for the group for each of the last 3 days of each diet. We also calculated the total amount of fecal N and DAPA excreted, on those days (Fig 2). Caution should be used when interpreting mean daily values because it was not always possible to collect a fecal sample from each animal every day, hence the mean fecal N and DAPA levels for some days are based on samples from 7, 8, or 9 animals instead of 10. The best fitted line for daily dietary N (r2 = 0.194 P = 0.0014 N= 15) using the variables measured per day, fecal N, fecal DAPA, total fecal N, and total fecal DAPA was found to be: Estimated Dietary N = - 4.97 + 2.264 * (fecal N) + 0.04387 * (fecal DAPA), where variables were left in the model at a significance level of ? = 0.05.
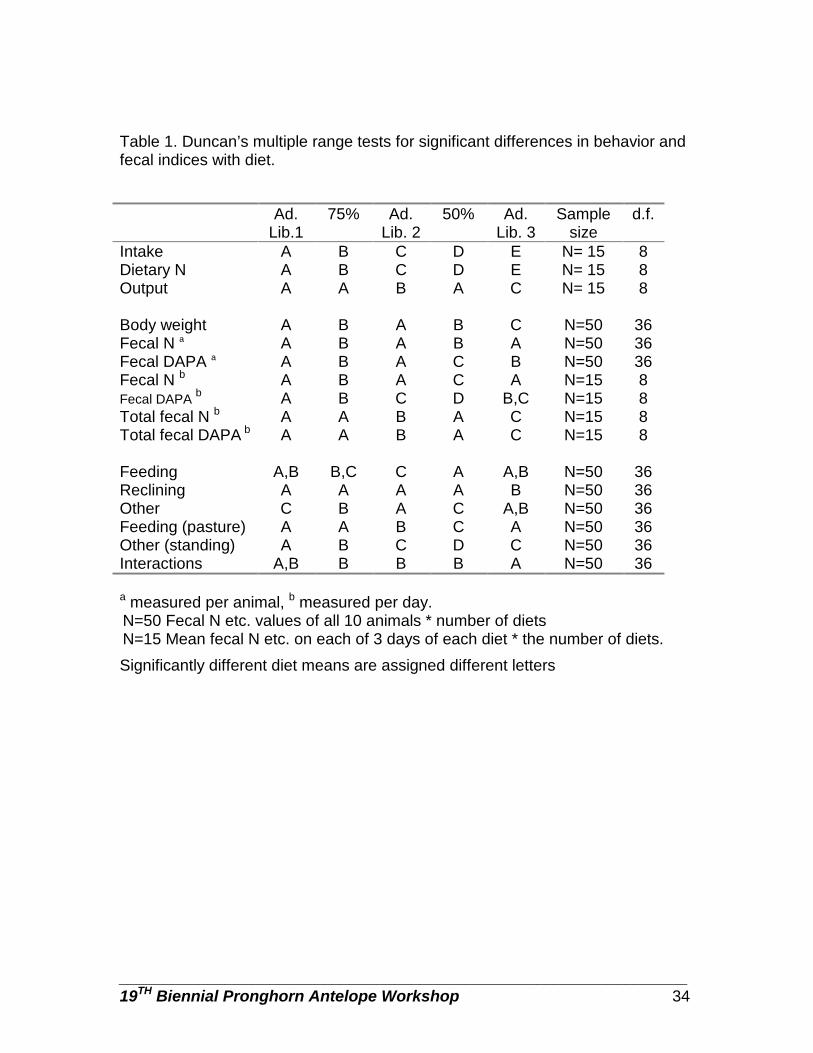
________________________________________________________________ 19TH Biennial Pronghorn Antelope Workshop 34
Table 1. Duncan’s multiple range tests for significant differences in behavior and fecal indices with diet. Ad.
Lib.1 75% Ad.
Lib. 2 50% Ad.
Lib. 3 Sample
size d.f.
Intake A B C D E N= 15 8 Dietary N A B C D E N= 15 8 Output A A B A C N= 15 8 Body weight A B A B C N=50 36 Fecal N a A B A B A N=50 36 Fecal DAPA a A B A C B N=50 36 Fecal N b A B A C A N=15 8 Fecal DAPA b A B C D B,C N=15 8 Total fecal N b A A B A C N=15 8 Total fecal DAPA b A A B A C N=15 8 Feeding A,B B,C C A A,B N=50 36 Reclining A A A A B N=50 36 Other C B A C A,B N=50 36 Feeding (pasture) A A B C A N=50 36 Other (standing) A B C D C N=50 36 Interactions A,B B B B A N=50 36 a measured per animal, b measured per day. N=50 Fecal N etc. values of all 10 animals * number of diets N=15 Mean fecal N etc. on each of 3 days of each diet * the number of diets.
Significantly different diet means are assigned different letters

________________________________________________________________ 19TH Biennial Pronghorn Antelope Workshop 35
Figure 1: Mean daily fecal output and mean daily intake of high quality forage (pellets and alfalfa) with diet. Bars represent standard errors.
Figure 2: Measures of diet quality in pronghorn compared. All measures, except body weight, were calculated as the mean daily values for the group per diet. Body weight is the mean body weight of the group at the end of each diet. Bars represent standard errors.
0
2
4
6
8
10
12
14
16
Ad lib.1 75% Ad lib.2 50% Ad lib. 3
Diet
Kg
IntakeOutput
0
50
100
150
200
250
Ad lib. 1 75% Ad lib. 2 50% Ad lib. 3
D iet
Body Weight D ietary NFecal N Total Fecal NFecal DAPA Total Fecal DAPA
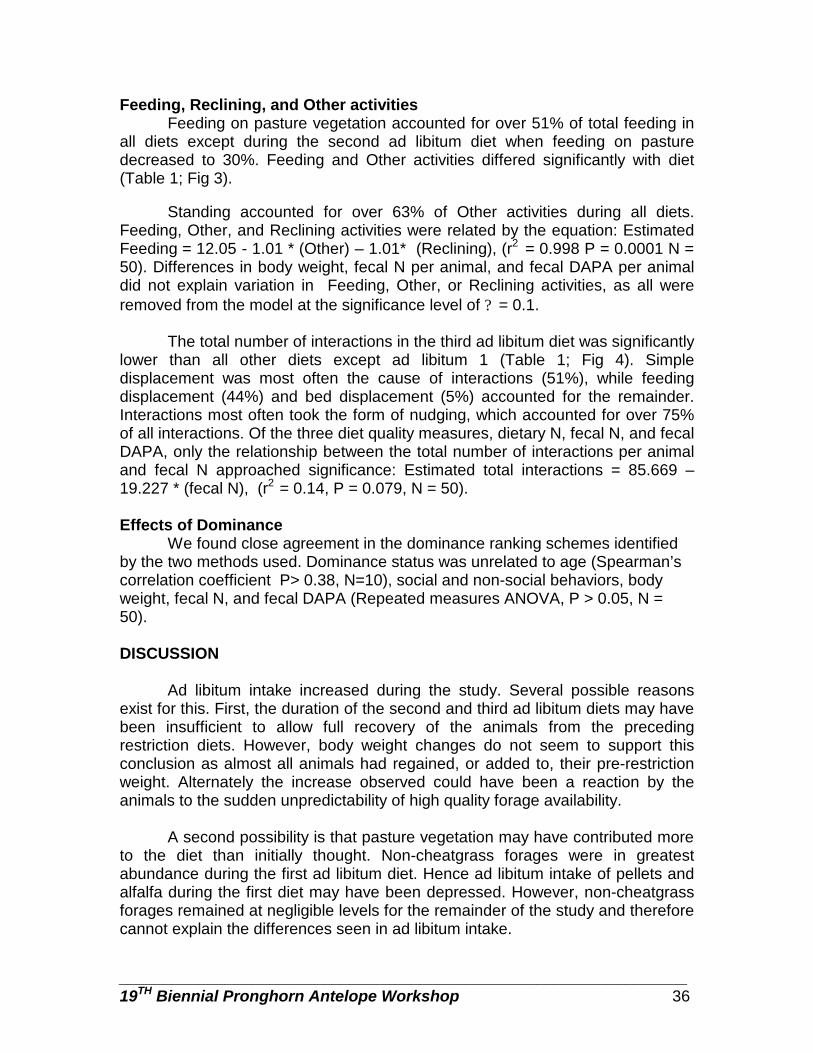
________________________________________________________________ 19TH Biennial Pronghorn Antelope Workshop 36
Feeding, Reclining, and Other activities Feeding on pasture vegetation accounted for over 51% of total feeding in
all diets except during the second ad libitum diet when feeding on pasture decreased to 30%. Feeding and Other activities differed significantly with diet (Table 1; Fig 3).
Standing accounted for over 63% of Other activities during all diets. Feeding, Other, and Reclining activities were related by the equation: Estimated Feeding = 12.05 - 1.01 * (Other) – 1.01* (Reclining), (r2 = 0.998 P = 0.0001 N = 50). Differences in body weight, fecal N per animal, and fecal DAPA per animal did not explain variation in Feeding, Other, or Reclining activities, as all were removed from the model at the significance level of ? = 0.1.
The total number of interactions in the third ad libitum diet was significantly
lower than all other diets except ad libitum 1 (Table 1; Fig 4). Simple displacement was most often the cause of interactions (51%), while feeding displacement (44%) and bed displacement (5%) accounted for the remainder. Interactions most often took the form of nudging, which accounted for over 75% of all interactions. Of the three diet quality measures, dietary N, fecal N, and fecal DAPA, only the relationship between the total number of interactions per animal and fecal N approached significance: Estimated total interactions = 85.669 – 19.227 * (fecal N), (r2 = 0.14, P = 0.079, N = 50). Effects of Dominance
We found close agreement in the dominance ranking schemes identified by the two methods used. Dominance status was unrelated to age (Spearman’s correlation coefficient P> 0.38, N=10), social and non-social behaviors, body weight, fecal N, and fecal DAPA (Repeated measures ANOVA, P > 0.05, N = 50).
DISCUSSION
Ad libitum intake increased during the study. Several possible reasons exist for this. First, the duration of the second and third ad libitum diets may have been insufficient to allow full recovery of the animals from the preceding restriction diets. However, body weight changes do not seem to support this conclusion as almost all animals had regained, or added to, their pre-restriction weight. Alternately the increase observed could have been a reaction by the animals to the sudden unpredictability of high quality forage availability.
A second possibility is that pasture vegetation may have contributed more
to the diet than initially thought. Non-cheatgrass forages were in greatest abundance during the first ad libitum diet. Hence ad libitum intake of pellets and alfalfa during the first diet may have been depressed. However, non-cheatgrass forages remained at negligible levels for the remainder of the study and therefore cannot explain the differences seen in ad libitum intake.
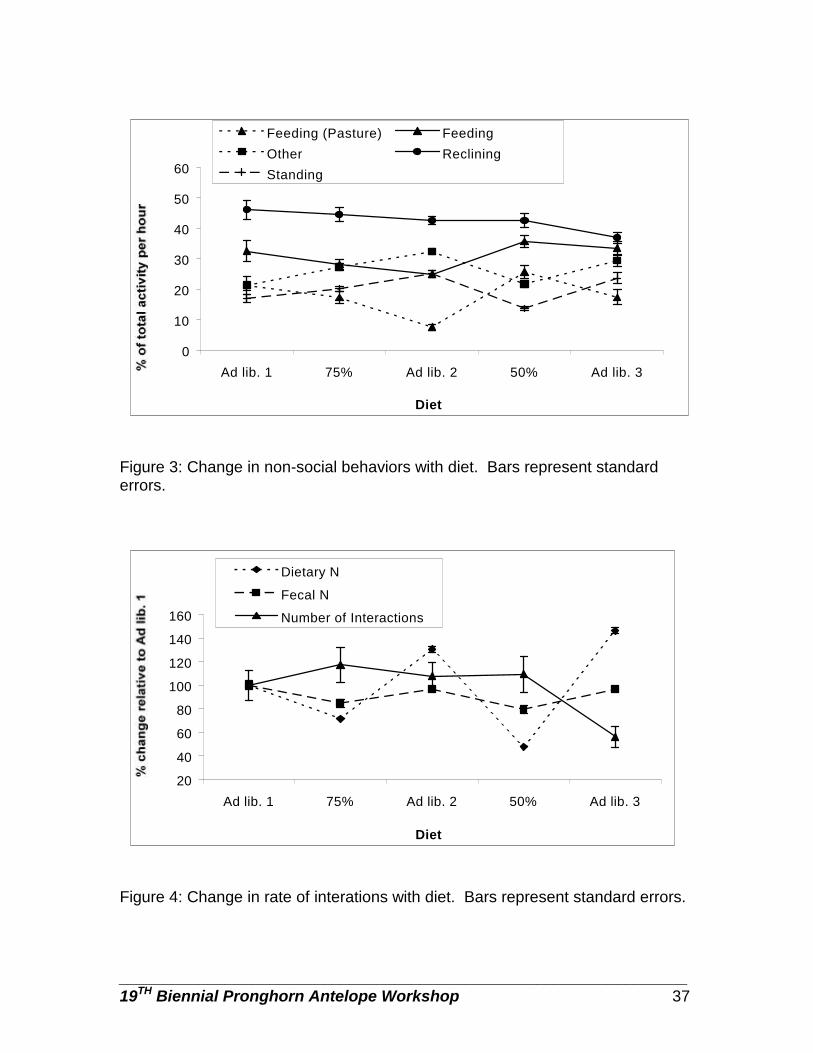
________________________________________________________________ 19TH Biennial Pronghorn Antelope Workshop 37
Figure 3: Change in non-social behaviors with diet. Bars represent standard errors.
Figure 4: Change in rate of interations with diet. Bars represent standard errors.
0
10
20
30
40
50
60
Ad lib. 1 75% Ad lib. 2 50% Ad lib. 3
Diet
Feeding (Pasture) FeedingOther RecliningStanding
20
40
60
80
100
120
140
160
Ad lib. 1 75% Ad lib. 2 50% Ad lib. 3
Diet
Dietary N
Fecal N
Number of Interactions
________________________________________________________________ 19TH Biennial Pronghorn Antelope Workshop 38
Third, daily temperature may have influenced intake. High summer temperatures have been shown to reduce intake in captive white-tailed deer (Wheaton and Brown 1983). Daily temperature means for each of the diets were 63.5, 72, 75, 69, 790 F respectively. As the first ad libitum diet coincided with the coolest mean temperature and the third ad libitum diet with the highest, if temperature influenced intake, we would expect the opposite relationship to that observed. Hence temperature is not thought to be responsible for the changes seen in intake.
Fourth, seasonal variations in intake and body weight have been
documented in many ruminant species (e.g. Ozoga and Verme 1970; Loudon 1991), even in captivity where food is provided ad libitum in pens (Moen 1978; Wheaton and Brown 1983; Wild unpublished data). Intake for non-reproducing female white-tailed deer has been shown to reach a minimum in early June and peak in December (Moen 1978). Therefore, dietary intake may have increased over the summer as part of normal seasonal variation.
We found a significant relationship between daily fecal output and intake
of high quality forage. In this study the availability of high quality forage was limiting but at no time were the animals limited in their access to forage per se due to the presence of pasture vegetation. Palatability of forages has been shown to influence intake, and limitations to intake, due to palatability, are known to differ between animal species (Dynes 1996). Therefore, in pronghorn, forage palatability, and not simply its availability, may be of greater importance and hence fecal output may be more variable in pronghorn than in less descerning ruminants. A cholesterol metabolite, cholestanone, in the feces of female baboons is positively correlated with dietary fiber and Wasser et al (1993) suggested that, in the presence of profound variations in dietary fiber, it may be appropriate to express fecal progestogens, and presumably other fecal measures, by cholestanone concentrations. We did not test for the presence of cholestanone in pronghorn feces.
Fecal N and DAPA levels were poor predictors of body weight but
moderately good predictors of daily dietary N. The inability of fecal N and DAPA to monitor body weight agrees with findings by Kucera (1997). Kucera (1997) suggested that fecal indices reflect what an animal ate recently and body condition measures, such as body weight, reflect dietary and energetic factors over months or even between seasons. Therefore, it may be naive to expect fecal indices measured over short periods of time to reflect population condition at that time. Kucera (1997) did find that fecal N and DAPA reflected growth of vegetation and this seems to be supported by our findings that fecal N and DAPA are related to dietary N. We may have found a stronger relationship between dietary N and fecal N and DAPA had the contribution of pasture vegetation been included in our estimates of dietary N. Expressing fecal N and DAPA levels as the total amount excreted by the group did not improve the predictive equations. This may suggest that N and DAPA excretion rates change in response to
________________________________________________________________ 19TH Biennial Pronghorn Antelope Workshop 39
changes in fecal output and hence their concentrations in the feces are independent of changes in fecal output.
We hypothesized that the time devoted to feeding would be inversely
related to the availability of high quality forage. This however was not the case. The time devoted to feeding during the 75% diet appears to have been limited by the time devoted to standing. One possibility for this limitation is that the 75% diet coincided with the fourth of July celebrations. Events such as a hot air balloon race and fireworks may have lead to a heightened alertness among the animals resulting in them spending more time standing and alert. Alternately, when on the 75% diet, the best energetic strategy for the animals may have been to conserve energy. The 50% diet may have been sufficiently severe that they could not conserve enough energy by standing and so were forced to forage resulting in the feeding/standing pattern observed. The results of this study suggest that there is a threshold level of nutrition at which feeding behavior is modified.
In wild pronghorn groups, interaction rates appear to be relatively constant
(Byers 1997). We found that the total number of interactions did appear to vary with diet and were best described by fecal N levels (p = 0.079). Similar to findings by Byers (1997) high ranking females appear to have slightly, although non-significantly, elevated rates of interactions relative to subordinates. This suggests that subordinates may avoid interactions and/or dominant animals may seek interactions. No clear relationship occurred between rank and body weight, dietary N, or fecal indices. This suggests that high social status does not confer greater fitness on the individual and agrees with results of previous studies (Byers 1997; Dennehy 1997).
MANAGEMENT IMPLICATIONS
The results of this study suggest that the assumption of constant total
fecal output, in selective feeders such as pronghorn, may be invalid. Further research should focus on measuring more fully the relationship between intake and fecal output levels, the existence of such a relationship in the wild, and the influence of this relationship on specific fecal indices. Based on the results of this study it appears that fecal N and DAPA may be useful in monitoring diet quality in pronghorn. However, the resultant effects of diets of varying quality on the health of wild pronghorn populations requires further study.
The rate of energy intake (or feeding) has been suggested as a measure
of the relative fitness of a forager (Hanks 1981; Morse and Fritz 1987). If, as suggested by the results of this study, there is a threshold level of nutrition at which feeding behavior is modified then the measurement of feeding or any other behavior as an index of diet quality may only be possible where extreme or sudden changes in diet quality occur.
________________________________________________________________ 19TH Biennial Pronghorn Antelope Workshop 40
ACKNOWLEDGEMENTS
We would like to thank Tom Pojar, Dan Baker, N. Thompson Hobbs, and Liz Wheeler for assistance during the design and implementation of the study. We would also like to thank Bruce Davitt, and Chris Williams for assistance with fecal sample and data analysis. Thanks also to Sue Fairbanks for reviewing an early draft of this manuscript and to the Max McGrath Wildlife Foundation grant for funding this study.
LITERATURE CITED ALTMANN, J. 1974. Observational study of behavior: sampling methods. Behavior
49:225-265. AOAC (ASSOCIATION OF ANALYTICAL CHEMISTS). 1990. Official methods of analysis
of official analytical chemists. Assocation of Analytical Chemists Arlington, Virginia.
ARNOLD, G.W. 1960a. The effect of the quantity and quality of pasture available
to sheep on their grazing behaviour. Australian Journal of Agricultural Research 11:1034-1043.
ARNOLD, G.W. 1960b. Selective grazing by sheep of two forage species at
different stages of growth. Australian Journal of Agricultural Research 11:1026-1033.
ARNOLD, G.W. 1962. The influence of several factors in determining the grazing
behavior of Border Leicester X Merino sheep. Journal of British Grassland Society 17:41-51.
BAKER, D.L. AND N.T. HOBBS. 1985. Emergency feeding of mule deer during
winter: Tests of a supplemental ration. Journal of Wildlife Management 49:934-942.
BELONJE,P.C. AND A. VAN DEN BERG 1980a. The use of fecal analysis to estimate
the phosphorus intake by grazing sheep. I. The use of pool instead of individual samples. Onderstepoort J. Vet. Res. 17:163-167.
BYERS, J.A. 1997. American Pronghorn:Social adaptations & the ghosts of
predators past. University of Chicago Press, Chicago.
DAUBENMIRE, R. 1959. A canopy-coverage method of vegetation analysis. Northwest Science 33: 43-61.
________________________________________________________________ 19TH Biennial Pronghorn Antelope Workshop 41
DAVITT, B.B. AND J.R. NELSON. 1984. Methodology for the determination of DAPA in feces of large ruminants. In Proceedings of the Western States and Provinces Elk Workshop, (Ed. by R.W. Nelson) Edmonton, Alberta. Pp.133-147.
DEMAREST, D.W., R.M. KAMINSKI, AND L.A. BRENNAN 1997. Body-mass, survival,
and pairing consequences of winter-diet restriction in wood ducks. Journal of Wildlife Management 61:822-832.
DENNEHY J.J.1997. Influence of Social Dominance Rank on Diet Quality
Pronghorn Females. Behavioral Ecology 12:177-181. DEVRIES, H., W.J. NETTO, AND P.L.H. HANEGRAAF. 1993. Matman: a program for
the analysis of sociometric matrices and behavior transition matrices. Behaviour 125:157-175.
DYNES, R.A.. 1996. The animal: options for managing intake. Australian Journal
of Agricultural Research 47:277-287. ERASMUS, T., B.L. PENZHORN, AND N. FAIRALL. 1978. Chemical composition of
faeces as an index of veld quality. South African Journal of Wildlife Research 8:19-23.
FORCHHAMMER, M.C. 1995. Sex, age, and seasonal variation if the foraging
dynamics of muskoxen,Ovibos moschatus, in Greenland. Canadian Journal of Zoology 73:1344.
FREELAND, W.J., P.H. CALCOTT, AND D.P. GEISS. 1985. Allochemicals, minerals
and herbivore population size. Biochemistry and Systems Ecology 13:195-206.
GATES, C.C., AND R.J. HUDSON. 1981. Weight dynamics of Wapiti in the boreal
forest. Acta Theriologica 26:467-518. GEIST, V. 1971. Mountain Sheep: a study in behavior and evolution. University of
Chicago Press, Chicago, IL. HANKS, J. 1981. Characterization of population condition. Pages 47-74 in C.W.
Fowler and T.D. Smith editors. Dynamics of large mammal populations. A Wiley-Interscience publication, New York.
HODGMAN,T.P., B.B. DAVITT, AND J.R. NELSON, 1996. Monitoring mule deer diet
quality and intake with fecal indices. J. Range. Manage. 49(3):215-222.

________________________________________________________________ 19TH Biennial Pronghorn Antelope Workshop 42
HOLECHEK, J.I., M.V. VAVRA, AND R.D. PIEPER, 1982. Botanical composition determination of range herbivore diets: a review. Journal of Range Management 35:309-315.
IRWIN, L.L., J.G. COOK, D.E.MCWHIRTER, S.G. SMITH, AND E.B. ARNETT. 1993.
Assessing winter dietary quality in Bighorn Sheep via fecal nitrogen. Journal of Wildlife Management 57:413-421.
KIE, J.G. AND T.S. BURTON. 1984. Dietary quality, fecal nitrogen and 2,6
diaminopimelic acid in black-tailed deer in Northern California. USDA Forest Service, Res. Note PSW-364. Berkeley, Calif.
KRONBERG, S.L. AND J.C. MALECHEK. 1997. Relationships between nutrition and
foraging behavior of free-ranging sheep and goats. Journal of Animal Science 75:1756-1763.
KUCERA, T.E. 1997. Fecal indicators, diet, and population parameters in mule
deer. Journal of Wildlife Management 61:550-560. LEITE, E.R. AND J.W. STUTH, 1990. Value of multiple fecal indices for predicting
diet quality and intake of steers. Journal of Range Management 43:139-143.
LESLIE, D.M. JR., AND E.E. STARKEY, 1985. Fecal indices to dietary quality of
cervids in old-growth forests. Journal of Wildlife Management 49:142-146. _______, J.A. JENKS, M. CHILELLI, AND G.R. LAVIGNE. 1989. Nitrogen and
diaminopimelic acid in deer and moose feces. Journal of Wildlife Management 53:216-218.
LOUDON, A.S.I. 1991. Nutritional physiology of some Asian ruminants. Pages 403-
425 in Proceedings of the 7th International Symposium on Ruminants: Physiological aspects of digestion and metabolism in ruminants.
MAUTY, W.W., H. SILVER, J.B. HOTTER, H.H. HAYES, AND W.E. ARBON JR. 1976.
Digestibility and related nutritional data for seven northern deer browse species. Journal of Wildlife Management 40:630-638.
MILLER, D.R. 1971. Seasonal changes in the feeding behavior of Barren-ground
Caribou on the Taiga winter Range. In V. Geist and F. Walther editors. The behavior of ungulates and its relation to management 24:744-755
MILLER, M. W., HOBBS, N. T., AND M.C. SOUSA. 1991. Detecting stress responses
In Rocky Mountain bighorn sheep (Ovis canadensis canadensis): reliability of cortisol concentrations in urine and feces. Canadian Journal of Zoology 69:15-24.
________________________________________________________________ 19TH Biennial Pronghorn Antelope Workshop 43
MOEN, A.N. 1978. Seasonal changes in heart rates, activity, metabolism, forage
intake in white-tailed deer. Journal of Wildlife Management 42:715-738. MORSE,D.H. AND FRITZ, R.S.1987. The consequences of foraging for reproductive
success. In: Foraging Behavior (Ed. by Kamil, A.C., Krebs, J.R., & Pulliam, H.R.), pp. 443-455. New York; Plenum Press.
NELSON, J.R. AND B.B. DAVITT. 1984. A regional cooperative DAPA research and
development program. Pages 148-163 in R.W.Nelson. Proceedings of the Western States and Provinces Elk Workshop. Edmonton, Alberta.
OSBORN, R.G. AND J.A. JENKS. 1998. Assessing dietary quality of white-tailed deer using fecal indices: effects of supplemental feeding and area. Journal of Mammalogy 79:437-447.
OZOGA, J.J. AND L.J. VERME. 1970. Winter feeding patterns of penned white-tailed
deer. Journal of Wildlife Management 34:431-439. PIANKA, E.R. 1994. Evolutionary ecology. Fifth edition. HarperCollins College
Publishers. PURSER, D.B., AND S.M. BUECHLER. 1966. Amino acid composition of rumen
organisms. Journal of Dairy Science 49:81-84. RHOADES, D.F. AND R.G. CATEY 1976. Toward a general theory of plant
antiherbivore chemistry. Pages168-213. J.W. Wallace and R.L. Mansell editors. Vol. 10 Biochemical interactions between plants and insects: Recent advances in phytochemistry. Plenum New York, New York.
ROBBINS, C.T., T.A. HANLEY, A.E. HAGERMAN, O.HJELJORD, D.L. BAKER, D.L.
SCHWARTZ, AND W.W. MAUTZ. 1987. Role of tannins in defending plants against ruminants: reduction in protein availability. Ecology 68:98-107.
ROWELL, T.E. 1966. Social organisation of primates. In Morris. Primate Ecology.
London. STATISTICAL ANALYSIS SYSTEMS 1990. Procedures guide for personal computers,
Sixty third edition. Statistical Analysis Systems Institute, Cary, N.C. WASSER, S.R., R. THOMAS, P.P. NAIR, C. GUIDRY, J. SOUTHERS, J. LUCAS, D.E.
WILDT, AND S.L. MONFORT. 1993. Effects of dietary fibre on fecal steroid measurements in baboons (Papio cynocephalus cynocephalus). Journal of Reproduction and Fertilization 97:569-574.
________________________________________________________________ 19TH Biennial Pronghorn Antelope Workshop 44
WASSER, S.R., R. THOMAS, P.P. NAIR, C. GUIDRY, J. SOUTHERS, J. LUCAS, D.E. WILDT, AND S.L. MONFORT. 1993. Effects of dietary fibre on fecal steroid measurements in baboons (Papio cynocephalus cynocephalus). Journal of Reproduction and Fertilization 97:569-574.
WEHAUSEN, J.D. 1995. Fecal measures of diet quality in wild and domestic
ruminants. Journal of Wildlife Management 59:816-823. WHEATON, C. AND R.D. BROWN. 1983. Feed intake and digestive efficiency of
south Texas white-tailed deer. Journal of Wildlife Management 47:442-450.
WOFFORD, H., J.L. HOLECHEK, M.L. GALYEAN, J.D. WALLACE, AND M. CARDENAS.
1985. Evaluation of fecal indices to predict cattle diet quality. Journal of Range Management 38:450-455.
WORK, E. AND D.L. DEWEY. 1953. The distribution of 2,6 diaminopimelic acid
among various micro-organisms. Journal of General Microbiology 9:394-406.
ZUCKER, W.V. 1983. Tannins: does structure determine function? An ecological
perspective. American Naturalist 121:335-365.
________________________________________________________________ 19TH Biennial Pronghorn Antelope Workshop 45
ANALYSIS OF REINTRODUCED PRONGHORN POPULATIONS IN
ARIZONA USING MITOCHONDRIAL DNA MARKERS
OLIN E. RHODES, JR., Department of Forestry and Natural Resources, Purdue University, West Lafayette, IN 47907, USA
ERIN P. REAT, Department of Forestry and Natural Resources, Purdue University, West Lafayette, IN 47907, USA
JAMES R. HEFFELFINGER, Arizona Game and Fish Department, 555 North Greasewood Road, Tucson, AZ 85745, USA
JAMES C. DEVOS, JR., Arizona Game and Fish Department, 2221 W. Greenway Road, Phoenix, AZ 85023, USA Abstract: Genetic diversity was examined in pronghorn (Antilocapra americana) to assess relationships among Arizona populations sharing common reintroduction or translocation sources. Ninety-seven Arizona pronghorn were analyzed for mitochondrial DNA (mtDNA) haplotype variation via restriction enzyme analysis and four composite haplotypes were revealed. Comparative analyses of Arizona pronghorn populations that shared founders from Montana, Wyoming, Texas, or central Arizona were performed. In addition, analyses of differences in haplotype frequency were performed specifically for populations in the northwestern and southeastern sections of the state because these populations are thought to be composed entirely of reintroduced pronghorn. Tests for differences in haplotype frequencies among populations sharing founders were performed using Monte Carlo simulation. Populations which received translocated animals from Texas, Wyoming, or Montana showed no significant variability in haplotype frequencies. Haplotype frequencies were significantly different among populations that received reintroductions from central Arizona only when a population which also received pronghorn from Montana, was included in analyses. Overall, populations in southeastern Arizona differed significantly from each other in haplotype frequencies. However, populations within southeastern Arizona with common reintroduction sources (e.g., Texas or central Arizona only) were not different in haplotype frequencies. Populations sampled in northwestern Arizona were not different from each other in haplotype frequencies despite the wide array of sources (central Arizona, Montana, Wyoming, Colorado, and Utah) used to restock that region. Our results suggest that whenever possible, genetic data should be used to plan future reintroductions of pronghorn in Arizona.
PROCEEDINGS PRONGHORN ANTELOPE WORKSHOP 19:45-54
Key Words: Antilocapra americana, mitochondrial DNA, polymerase chain reaction, reintroduction.

________________________________________________________________ 19TH Biennial Pronghorn Antelope Workshop 46
Numerous genetic studies of reintroduced organisms document increased colonization success by individuals that most closely resemble the original genetic stocks of the region (Ellsworth et al. 1994, Leberg et al. 1994, Rhodes et al. 1995, Nedbal et al. 1997, Serfass et al. 1998). Thus, selection of source populations which closely correspond to current or historical genetic stocks of recipient populations could increase the probability of successful restocking events and may help to preserve remnants of native stocks. To manage wildlife populations at this level of resolution, baseline data on genetic diversity of potential source populations and existing remnant populations are needed (Avise 1989, Serfass et al. 1998, Williams et al. 2000).
Declines in pronghorn numbers around the turn of the century both isolated and extirpated populations and stimulated the Arizona Game and Fish Department (AGFD) to initiate a series of pronghorn reintroductions beginning in the 1920s. Continuing through the present, these reintroductions were designed to help bolster small populations and to repopulate historic pronghorn ranges. Pronghorn used in Arizona reintroductions came from central Arizona, as well as from other states such as Montana, Wyoming, Colorado, Utah, and Texas (Lee 1988).
Although successful in reestablishing pronghorn populations in Arizona, these reintroductions may have compromised the phylogeographic relationships of pronghorn throughout the state. For example, pronghorn north of the Grand Canyon (northwestern Arizona; Game Management Units [GMU] 12A, 12B, 13A & 13B; Figure 1) are believed to have been extirpated by the early twentieth century and repopulated with reintroductions from central Arizona, Colorado, Wyoming, Montana, and Utah (Alexander 2000). All present-day pronghorn within northwestern Arizona are believed to be direct descendents from these translocations. Likewise, pronghorn are believed to have been extirpated from southeastern Arizona by the early 1930s, and all pronghorn populations in this region of the state were established through reintroductions from Texas and central Arizona (Hoffmeister 1986).
Reat et al. (1999) examined mitochondrial haplotype diversity of 389 pronghorn distributed across the southeastern, central, and northern portions of their range in Arizona. Their research indicated that Arizona pronghorn exhibited 4 haplotypes, 3 observed previously in North American pronghorn and 1 unique to Arizona. In addition, their research revealed that 1 haplotype, which occurs at a relatively low frequency throughout most of the United States, was the common haplotype in Arizona. The research presented herein is an extension of the work of Reat et al. (1999) with emphasis on reintroduced pronghorn populations in Arizona. Our goal was to determine whether reintroduced Arizona pronghorn populations that shared a common source (either from a reintroduction or translocation) differed in their haplotype distributions. Additionally, we examined regional pronghorn populations in the northwestern and southeastern portions of the state to determine whether haplotype distributions in these population could be explained by their reintroduction history.

______________________________________________________________ 19TH Biennial Pronghorn Antelope Workshop 47
Figure. 1. Pronghorn samples were obtained from 10 Game Management Units in northwestern, central, and southeastern Arizona during the 1996 and 1997 hunting seasons. Game management unit numbers are provided within regions. STUDY AREA AND METHODS Collection kits, consisting of sample bags and instructions for tissue collection, were mailed to hunters that obtained permits to harvest pronghorn in Arizona during the 1996 and 1997 hunting seasons. In 1996, 755 kits were mailed to hunters throughout the state. In 1997, 334 kits were mailed to

________________________________________________________________ 19TH Biennial Pronghorn Antelope Workshop 48
hunters that drew tags for areas under-represented in the 1996 sampling effort. The hunters were asked to collect liver and muscle tissue in the field and place the samples on wet ice. Hunters then dropped the samples off at collection stations located throughout Arizona at major highway intersections. In addition to roadside collections, samples were collected at AGFD regional offices and by Wildlife Managers in the field. Archived samples from the AGFD were also used to bolster sample numbers from critical areas. Following collection, samples were cataloged and placed in liquid nitrogen for storage until they could be transported to Purdue University, where they were stored at -75ºC until analysis.
Following genomic DNA extraction, mitochondrial DNA (mtDNA) was analyzed for haplotype variation using a technique whereby a 2290 base-pair (bp) segment of the ND-2 gene region was amplified using standard polymerase chain reaction (PCR) protocols (Saiki et al. 1988, Lee et al. 1994). Cycling times and temperatures were as follows: 1) initial denaturation for 2 min at 95ºC, 2) denaturation for 1 min at 95ºC, 3) annealing for 1 min at 52ºC, 4) extension for 2.5 min at 72ºC, 5) final extension for 7 min at 72ºC, and 6) soak at 4ºC. Steps 2-4 were repeated 40 times. Each fragment was amplified using the primers 562 (5´ TAA GCT ATC GGG CCC ATA CC 3´) and 452 (5´ ACT TCA GGG TGC CCA AAG AAT CA 3´; Lee et al. 1994).
The resulting amplified DNA fragments were digested to completion according to manufacturer’s recommendations using 1 unit of each of the following restriction enzymes: Aci-I, Bsp-1286, Hha-I, Hinf-I, Rsa-I, Ssp-I . The digested fragments were then electrophoresed on 1%-2% agarose gels (Sambrook et al. 1989), separating the fragments according to size, and producing a scorable pattern. An EcoR-I, Hind-III-digested lambda DNA marker was used for size determination on each agarose gel. Gels were stained with ethidium bromide, and a permanent electronic record of these patterns was stored using a Stratagene Eagle-Eye II™ gel documentation system. Data were analyzed for population haplotype frequency differentiation among sampling locations using the Monte Carlo simulation (Roff and Bentzen 1989) program found in the Restriction Enzyme Analysis Package (REAP, McElroy et al. 1992). Each Monte Carlo simulation was run with 1,000 iterations to test the hypothesis that differences in haplotype frequencies among populations were different than would be expected under random conditions. Significance values were based on an alpha of ? ?0.05 and critical probability values were adjusted to P ? ?0.004 to account for multiple comparisons using the Dunn-Sidak method. To assess the impact of past relocations, populations were grouped for analysis based on known reintroduction histories. These analyses were employed for: 1) populations that had reintroductions from Wyoming, Montana, or Texas; 2) populations that received reintroductions from central Arizona [GMU 5B; Figure 1]; 3) populations in southeastern Arizona; and 4) populations in the northwestern Arizona (Figure 1; Table 1).
________________________________________________________________ 19TH Biennial Pronghorn Antelope Workshop 49
RESULTS
During the 1996 and 1997 collection efforts, 405 individual pronghorn were sampled throughout the state of Arizona (1996, n = 351; 1997, n = 54). This represented approximate return rates of 46.5% in 1996 and 16.2% in 1997, based on the number of collection kits mailed to hunters. Of the 405 samples collected, 97 were used in analyses of haplotype frequency differentiation among GMUs which had received pronghorn reintroductions. Samples were analyzed from: GMU 4A (n = 13), GMU 5B (n = 15), GMU 12A (n = 1), GMU 12B (n = 2), GMU 13A (n = 13), GMU 13B (n = 6), GMU 30A (n = 22), GMU 31 and 32 (n = 15), GMU 34B (n = 4), and GMU 35A/B (n = 7) (Figure 1).
All restriction enzymes proved informative, except Rsa-I which was monomorphic. Aci-I , Bsp-1286, Hha-I, and Hinf-I each resulted in 2 distinct fragment patterns; Ssp-I produced 3 distinct fragment patterns (Reat et al. 1999). From these individual fragment patterns, 4 composite haplotypes were observed in Arizona’s pronghorn, including 1 haplotype (K), that has not previously been described. The remaining 3 haplotypes (A, C, J) were observed previously in North American pronghorn (Lee 1992, Lee et al. 1994).
Populations that received translocated animals from Texas, Wyoming, or Montana showed no significant variability in haplotype frequencies (Table 1). Populations which received pronghorn from Colorado (GMUs 12A & 13B) could not be tested for haplotype differentiation, as only 1 individual was collected from GMU 12A (Table 2). Haplotype frequencies were significantly different among GMUs that received reintroductions from central Arizona (GMU 5B) only when GMU 13A, which also received pronghorn from Montana, was included (Table 1). Likewise, of those populations that received pronghorn from central Arizona, only the GMU 13A population was significantly different in haplotype frequency from its source. Overall, populations in southeastern Arizona differed significantly in haplotype frequencies (Table 1). However, populations within southeastern Arizona that shared reintroduction sources (e.g., Texas or central Arizona) were not different from each other in haplotype frequencies. Populations sampled in northwestern Arizona were not different in haplotype frequencies despite the wide array of sources (central Arizona, Montana, Wyoming, Colorado, and Utah) used to restock the region (Table 1). DISCUSSION Our data indicated that, in general, pronghorn populations that shared a common source were similar in haplotype frequency. For example, subsets of Arizona pronghorn populations that received reintroductions from either Montana, Wyoming, or Texas were similar in haplotype frequencies. Our comparisons of haplotype frequencies among populations that shared central Arizona as a source indicated that for all comparisons, except those in which pronghorn from
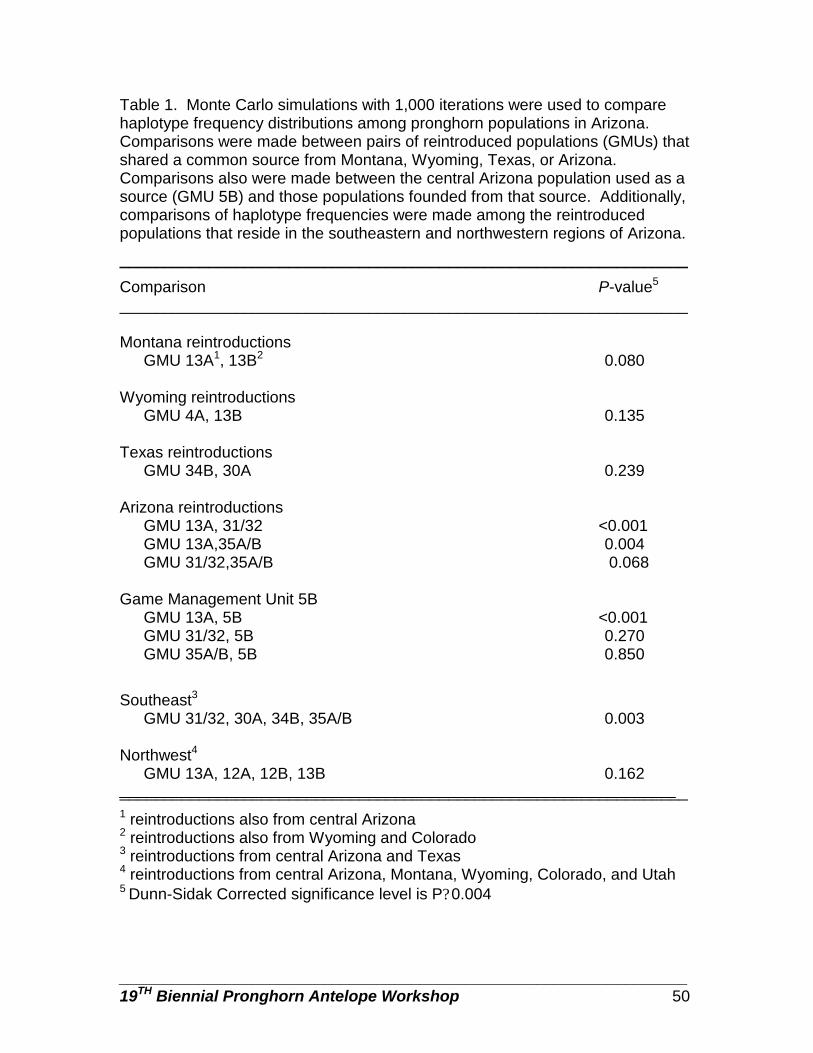
________________________________________________________________ 19TH Biennial Pronghorn Antelope Workshop 50
Table 1. Monte Carlo simulations with 1,000 iterations were used to compare haplotype frequency distributions among pronghorn populations in Arizona. Comparisons were made between pairs of reintroduced populations (GMUs) that shared a common source from Montana, Wyoming, Texas, or Arizona. Comparisons also were made between the central Arizona population used as a source (GMU 5B) and those populations founded from that source. Additionally, comparisons of haplotype frequencies were made among the reintroduced populations that reside in the southeastern and northwestern regions of Arizona.
________________________________________________________________
Comparison P-value5 ________________________________________________________________ Montana reintroductions GMU 13A1, 13B2 0.080 Wyoming reintroductions GMU 4A, 13B 0.135 Texas reintroductions GMU 34B, 30A 0.239 Arizona reintroductions GMU 13A, 31/32 <0.001 GMU 13A,35A/B 0.004 GMU 31/32,35A/B 0.068 Game Management Unit 5B GMU 13A, 5B <0.001 GMU 31/32, 5B 0.270 GMU 35A/B, 5B 0.850
Southeast3 GMU 31/32, 30A, 34B, 35A/B 0.003 Northwest4 GMU 13A, 12A, 12B, 13B 0.162 ________________________________________________________________ 1 reintroductions also from central Arizona 2 reintroductions also from Wyoming and Colorado 3 reintroductions from central Arizona and Texas 4 reintroductions from central Arizona, Montana, Wyoming, Colorado, and Utah 5 Dunn-Sidak Corrected significance level is P? 0.004

________________________________________________________________ 19TH Biennial Pronghorn Antelope Workshop 51
Table 2. Composite haplotype frequencies based on PCR-RFLP analysis of the 2.3 kb ND-2 gene region of mtDNA in Arizona pronghorn populations. Sample sizes (n) are provided for each of 10 Game Management Units analyzed in Arizona. Data were collected during the fall hunting seasons of 1996 and 1997.
GMU n A C J K
4A 13 0.615 0.308 0.000 0.077
5B 15 0.533 0.200 0.000 0.267
12A 1 1.000 0.000 0.000 0.000
12B 2 0.000 1.000 0.000 0.000
13A 13 0.000 1.000 0.000 0.000
13B 6 0.167 0.667 0.167 0.000
30A 22 0.500 0.500 0.000 0.000
31/32 14 0.852 0.000 0.000 0.143
34B 4 0.000 1.000 0.000 0.000
35A/B 7 0.430 0.285 0.000 0.285
Average 9.7 0.410 0.496 0.016 0.076
GMU 13A were included, haplotype frequencies were similar among populations. Additionally, of those populations that were established using pronghorn from central Arizona, only the pronghorn population residing in GMU 13A was significantly different from its source in haplotype frequency. The aberrant haplotype frequencies in GMU 13A are most likely due to the high frequency of the C haplotype (common in non-Arizona pronghorn) and the total absence of the K haplotype (unique to Arizona) in pronghorn from that GMU (Table 2).
The southeastern and northwestern regions of Arizona are considered to be inhabited totally by reintroduced stock. Thus, significant differences in haplotype frequencies among pronghorn populations in southeastern Arizona are likely a consequence of differences between the Texas (K haplotype absent) and central Arizona (K haplotype present) source populations used to restock the region. Pairwise comparisons of populations sharing the same sources in the southeastern region of the state (i.e., central Arizona stock versus Texas stock) were non-significant. Differences in haplotype frequencies within the southeastern region populations are probably a consequence of historic differences between reintroduction sources (i.e., Texas versus Arizona), despite the evidence that the (A) haplotype is the common haplotype for both sources. Alternatively, the wide variety of sources and ubiquitous placement of pronghorn used to restock the Arizona Strip, as well as low samples sizes in GMUs 12A and 12B, probably contributed to the lack of observable differentiation among

________________________________________________________________ 19TH Biennial Pronghorn Antelope Workshop 52
pronghorn populations sampled in that region.
Several researchers have used genetic tools to assess the colonization success of reintroduced populations relative to the success of remnant populations residing in their vicinity (Ellsworth et al. 1994, Leberg et al. 1994, Nedbal et al. 1997). In some instances, remnant genetic material has clearly been maintained even in the presence of repeated translocations of individuals with different genetic characteristics (Ellsworth et al. 1994). In other cases, there is evidence that reintroduced populations have maintained the genetic characteristics of their source populations, even many generations after the reintroduction event (Leberg et al. 1994). Our analysis of reintroduced pronghorn populations indicate that Arizona populations sharing a common source do retain the genetic characteristics of those sources, despite the effects of sampling error (founder effect) during the translocation events and random changes in gene frequencies over time (genetic drift) after establishment.
Our results may not seem surprising given that many of the focal study populations were established in areas where pronghorn were assumed to have been extirpated. However, our data do serve to support the premise that pronghorn were extirpated in northwestern and southeastern Arizona. In particular, the absence of the K haplotype in northwestern Arizona (which received no intraArizona translocations) and, the presence of the K haplotype in all GMU’s in southeastern Arizona except GMUs 30A and 34B (which received pronghorn from Texas only) suggest that the current genetic distributions of these regional populations were primarily influenced by their reintroduction sources.
MANAGEMENT IMPLICATIONS Data on regional gene frequency distributions offer wildlife managers the opportunity to select source populations for reintroduction programs that are appropriate to their management goals. For instance, our data suggest that a genetic legacy of past reintroductions is maintained in Arizona's current pronghorn populations. Thus, it is clear that decisions pertaining to pronghorn sources have long lasting genetic impacts and that pronghorn reintroductions have probably changed the distribution of genetic diversity in the Arizona population. Alternatively, Arizona has a unique opportunity to preserve pronghorn stocks native to the state (e.g., K haplotype) as they make decisions regarding source populations for future translocations. In addition, using the haplotype frequency data generated in this research, Arizona biologists can make informed decisions regarding future translocations of pronghorn in the state. ACKNOWLEDGEMENTS
Thanks to all the volunteers from Arizona Game and Fish Department, Arizona State University, University of Arizona, Northern Arizona University,
________________________________________________________________ 19TH Biennial Pronghorn Antelope Workshop 53
Yavapai College, Grand Canyon University, Pima Community College, and the Arizona Antelope Foundation who helped operate the sample collection stations, especially R. Barkhurst, J. Beals , D. N. Cagle, A. Fuller, J. Galaway, J. Goodwin, J. Hanna, B. Henry, J. Hervert, C. A. Jones, M. A. McKenzie, R. M. Lee, A. Munig, J. B. Pickrell, P. Shaw, J. Simmons, J. Vassel, B. F. Wakeling, and many others. The Southern Arizona Bowhunting Chapter of Safari Club International provided funding for necessary field supplies. We thank Purdue University for providing funding in support of this research and we express our appreciation to B. Shen for his assistance with laboratory analyses. Our appreciation goes to all the Arizona Game and Fish Department Employees who went out of their way to collect samples from far reaching areas. We also thank Richard Ockenfels for information on pronghorn movements and population fragmentation. Arizona pronghorn hunters played an integral role in sample collection, sometimes going far out of their way to return samples in good condition. This is a contribution of the Federal Aid in Wildlife Restoration Act Project W-53-M and W-78-R of the Arizona Game and Fish Department.
LITERATURE CITED ALEXANDER, A. 2000. History of pronghorn transplants in Arizona. Proceedings of
the 17th Biennial Pronghorn Antelope Workshop:112-113 AVISE, J. C. 1989. A role for molecular genetics in the recognition and
conservation of endangered species. Trends in Ecology and Evolution 4:279-281.
ELLSWORTH, D. L., R. L. HONEYCUTT, N. J. SILVY, J. W. BICKHAM, AND W. D.
KLIMSTRA. 1994. Historical biogeography and contemporary patterns of mitochondrial DNA variation in white-tailed deer from the southeastern United States. Evolution 48:122-136.
HOFFMEISTER, D. F. 1986. Mammals of Arizona. Arizona Game and Fish
Department and University of Arizona Press. Tucson, USA. LEBERG, P. L., P. W. STANGEL, H. O. HILLESTAD, R. L. MARCHINTON, AND M. H.
SMITH. 1994. Genetic structure of reintroduced wild turkey and white-tailed deer populations. Journal of Wildlife Management 58:698-711.
LEE, R. M. 1988. Arizona state report. Proceedings of the 13th Biennial
Pronghorn Antelope Workshop. 13:5-11. LEE, T. E., JR. 1992. Mitochondrial DNA and allozyme analysis of pronghorn
populations on North America. Dissertation, Texas A&M University, College Station, USA.
________________________________________________________________ 19TH Biennial Pronghorn Antelope Workshop 54
______, J. W. BICKHAM, AND M. D. SCOTT. 1994. Mitochondrial DNA and allozyme analysis of North American pronghorn populations. Journal of Wildlife Management 58:307-318.
MCELROY, D., P. MORAN, E. BERMINGHAM, AND I. KORNFELD. 1992. REAP: An integrated environment for the manipulation and phylogenetic analysis of restriction data. Journal of Heredity 83:157-158.
NEDBAL, M. A., R. L. HONEYCUTT, S. G. EVANS, R. M. WHITING, JR., AND D. R. DIETZ.
1997. Northern bobwhite restocking in east Texas: a genetic assessment. Journal of Wildlife Management 61:854-863.
REAT, E. P., O. E. RHODES, JR., J. R. HEFFELFINGER, AND J. C. DEVOS, JR.. 1999.
Regional genetic differentiation in Arizona pronghorn. Proceedings of the 18th Biennial Pronghorn Antelope Workshop 18: 25-31.
RHODES, O. E., JR., D. J. BUFORD, M. MILLER, AND R. S. LUTZ. 1995. Genetic
structure of reintroduced Rio Grande turkeys in Kansas. Journal of Wildlife Management 59:771-775.
ROFF, D., AND P. BENTZEN. 1989. The statistical analysis of mitochondrial DNA
polymorphisms: ? 2 and the problem of small samples. Molecular Biology and Evolution 6:539-545.
SAIKI, R. K., D. H. GELFAND, S. STOFFEL, S. J. SCHARF, R. HIGUCHI, G. T. HORN, K. B. MULLIS, AND H. A. ERLICH. 1988. Primer-directed enzymatic amplification of DNA with a thermostable DNA polymerase. Science 239:487-491.
SAMBROOK, J., E. F. FRITSCH, AND T. MANIATIS. 1989. Molecular cloning: a
laboratory manual. Cold Spring Harbor Laboratory Press. Plainview, New York, USA.
SERFASS, T. L., J. M. NOVAK, P. E. JOHNS, R. P. BROOKS, AND O. E. RHODES, JR.
1998. Genetic variation among river otter populations in North America: Considerations for reintroduction projects. Journal of Mammalogy 79:736-746.
WILLIAMS, R. N., O. E. RHODES, JR., AND T. L. SERFASS. 2000. Assessment of
genetic variance among source and reintroduced fisher populations. Journal of Mammalogy 81:895-907.
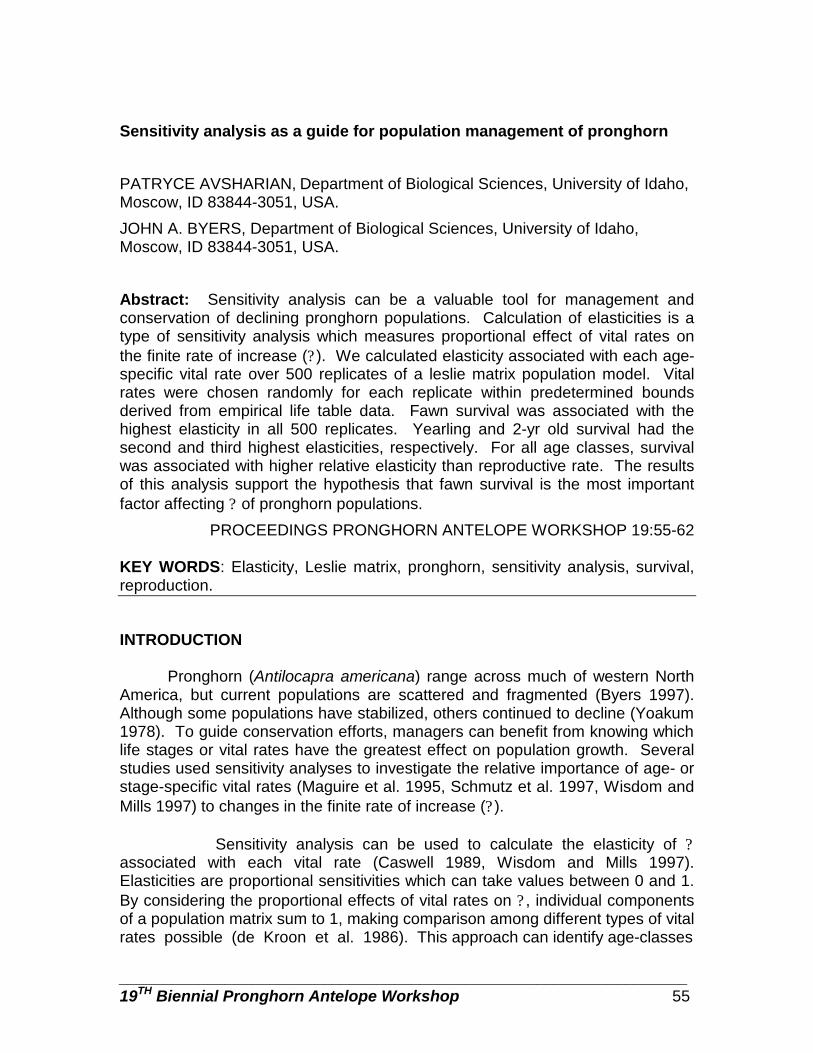
________________________________________________________________ 19TH Biennial Pronghorn Antelope Workshop 55
Sensitivity analysis as a guide for population management of pronghorn
PATRYCE AVSHARIAN, Department of Biological Sciences, University of Idaho, Moscow, ID 83844-3051, USA.
JOHN A. BYERS, Department of Biological Sciences, University of Idaho, Moscow, ID 83844-3051, USA.
Abstract: Sensitivity analysis can be a valuable tool for management and conservation of declining pronghorn populations. Calculation of elasticities is a type of sensitivity analysis which measures proportional effect of vital rates on the finite rate of increase (? ). We calculated elasticity associated with each age-specific vital rate over 500 replicates of a leslie matrix population model. Vital rates were chosen randomly for each replicate within predetermined bounds derived from empirical life table data. Fawn survival was associated with the highest elasticity in all 500 replicates. Yearling and 2-yr old survival had the second and third highest elasticities, respectively. For all age classes, survival was associated with higher relative elasticity than reproductive rate. The results of this analysis support the hypothesis that fawn survival is the most important factor affecting ? of pronghorn populations.
PROCEEDINGS PRONGHORN ANTELOPE WORKSHOP 19:55-62
KEY WORDS: Elasticity, Leslie matrix, pronghorn, sensitivity analysis, survival, reproduction.
INTRODUCTION Pronghorn (Antilocapra americana) range across much of western North America, but current populations are scattered and fragmented (Byers 1997). Although some populations have stabilized, others continued to decline (Yoakum 1978). To guide conservation efforts, managers can benefit from knowing which life stages or vital rates have the greatest effect on population growth. Several studies used sensitivity analyses to investigate the relative importance of age- or stage-specific vital rates (Maguire et al. 1995, Schmutz et al. 1997, Wisdom and Mills 1997) to changes in the finite rate of increase (? ).
Sensitivity analysis can be used to calculate the elasticity of ? associated with each vital rate (Caswell 1989, Wisdom and Mills 1997). Elasticities are proportional sensitivities which can take values between 0 and 1. By considering the proportional effects of vital rates on ? , individual components of a population matrix sum to 1, making comparison among different types of vital rates possible (de Kroon et al. 1986). This approach can identify age-classes

________________________________________________________________ 19TH Biennial Pronghorn Antelope Workshop 56
and vital rates which should be targeted by managers to affect population growth most effectively. Using a Leslie matrix approach, we test the hypothesis that fawn survival will have a larger effect on ? than adult survival or fertility. METHODS Parameter Estimation We used data from the literature to estimate pronghorn age-specific survival and reproduction. To encompass the range of possible values, we selected the highest and lowest estimate available for each vital rate. Age-specific survival (Sx) was obtained from life table data compiled by Byers (unpublished data) and Mitchell (1980) from a total of four populations. We defined Sx as the finite rate of survival during the age interval x to x+1, where Sx = (nx-dx)/nx. Although reports of age-specific adult Sx in the literature were limited, estimates of fawn survival were more abundant (Ellis 1972, Pyrah 1976, Beale 1978, Vriend and Barret 1978, Neff and Woolsey 1980). However, as a large proportion of fawn mortality occurs within the first few weeks after birth (Barrett 1978, Autenrieth 1980), we did not use estimates of fawn mortality based on mid-summer surveys. Only fawn counts conducted within a few days of birth provide accurate measures of early post-natal fawn survival. Reproductive effort in ungulates is generally high (Case 1978, Robbins 1993), and may reach an extreme in pronghorn (Byers and Moodie 1990). Byers (1997) found that fecundity of pronghorn on the National Bison Range in Montana is invariant, with all females producing twins each year. Studies of other populations reported fawning rates as low as 1.8 - 1.9 fawns/adult female (Ellis 1972, Beale 1978). We defined age-specific reproduction (Rx) as the number of female fawns/female/year. Since considerable data suggest a 1:1 sex ratio in pronghorn (Edwards 1958, Pyrah 1976, Mitchell 1980, Byers 1997), we obtained Rx by multiplying the total number of fawns/female by 0.5. To establish the upper and lower bounds of vital rates, we used the highest and lowest estimates available from the literature (Table 1). After defining the bounds of Rx and Sx, We used these values to parameterize the elements of age-specific fertility (Fi) and survival (Pi) in a Leslie matrix population model (Table 2). Wisdom and Mills (1997) recommended this procedure to evaluate elasticity over a realistic range of vital rates. Model description.
To determine elasticities of each vital rate, we used ELASTIC6, a DOS-based program written by L. S. Mills. Parameter estimates from the literature were used to specify the upper and lower bounds on vital rates, incorporating possible variation between populations and environmental conditions (Table 1). Randomly selected values from within the specified bounds were parameterized in a post-birth pulse Leslie matrix model (Caswell 1989, Wisdom and Mills 1997). The top row matrix elements contained age-specific fertilities (Fi), which were
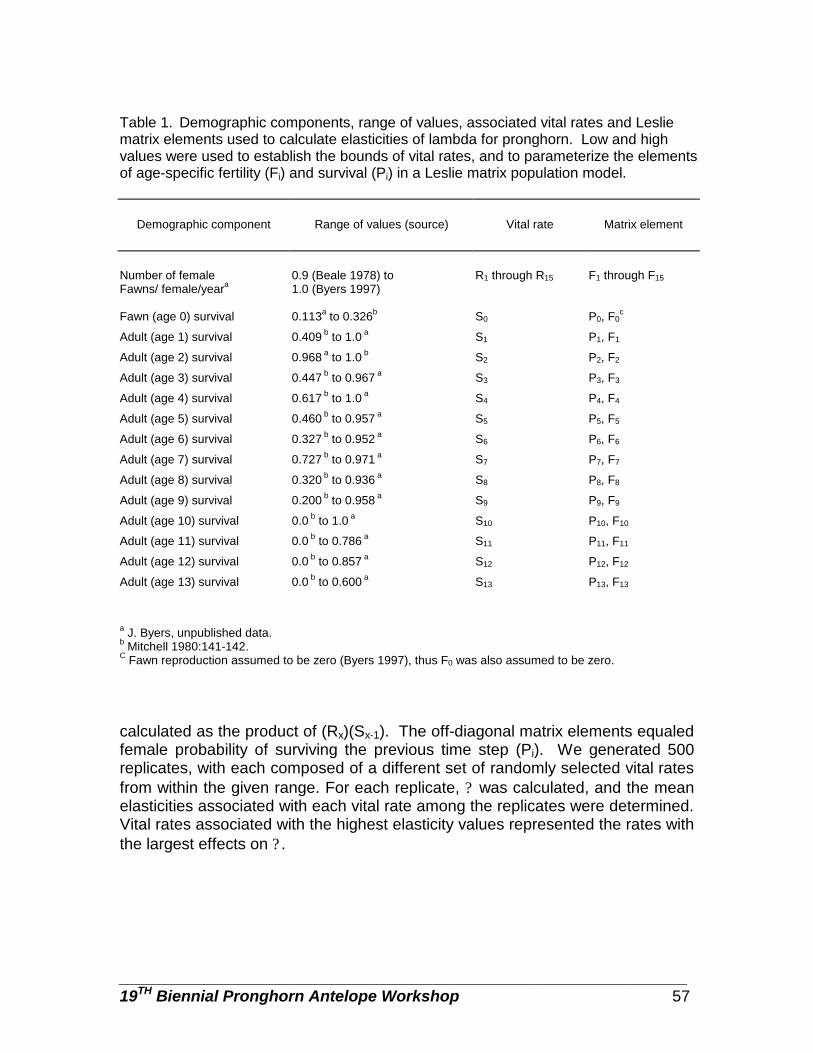
________________________________________________________________ 19TH Biennial Pronghorn Antelope Workshop 57
Table 1. Demographic components, range of values, associated vital rates and Leslie matrix elements used to calculate elasticities of lambda for pronghorn. Low and high values were used to establish the bounds of vital rates, and to parameterize the elements of age-specific fertility (Fi) and survival (Pi) in a Leslie matrix population model.
Demographic component Range of values (source) Vital rate Matrix element
Number of female Fawns/ female/yeara
0.9 (Beale 1978) to 1.0 (Byers 1997)
R1 through R15 F1 through F15
Fawn (age 0) survival 0.113a to 0.326b S0 P0, F0c
Adult (age 1) survival 0.409 b to 1.0 a S1 P1, F1
Adult (age 2) survival 0.968 a to 1.0 b S2 P2, F2
Adult (age 3) survival 0.447 b to 0.967 a S3 P3, F3
Adult (age 4) survival 0.617 b to 1.0 a S4 P4, F4
Adult (age 5) survival 0.460 b to 0.957 a S5 P5, F5
Adult (age 6) survival 0.327 b to 0.952 a S6 P6, F6
Adult (age 7) survival 0.727 b to 0.971 a S7 P7, F7
Adult (age 8) survival 0.320 b to 0.936 a S8 P8, F8
Adult (age 9) survival 0.200 b to 0.958 a S9 P9, F9
Adult (age 10) survival 0.0 b to 1.0 a S10 P10, F10
Adult (age 11) survival 0.0 b to 0.786 a S11 P11, F11
Adult (age 12) survival 0.0 b to 0.857 a S12 P12, F12
Adult (age 13) survival 0.0 b to 0.600 a S13 P13, F13
a J. Byers, unpublished data. b Mitchell 1980:141-142. C Fawn reproduction assumed to be zero (Byers 1997), thus F0 was also assumed to be zero. calculated as the product of (Rx)(Sx-1). The off-diagonal matrix elements equaled female probability of surviving the previous time step (Pi). We generated 500 replicates, with each composed of a different set of randomly selected vital rates from within the given range. For each replicate, ? was calculated, and the mean elasticities associated with each vital rate among the replicates were determined. Vital rates associated with the highest elasticity values represented the rates with the largest effects on ? .

________________________________________________________________ 19TH Biennial Pronghorn Antelope Workshop 58
Table 2. Estimates of the lower (a) and upper (b) bounds on age-specific fertility (Fi) and survival (Pi) for pronghorn. Estimates are organized in a post-birth pulse Leslie matrix, with Fi along the top row and Pi down the sub-diagonal. Lower-bound matrix (a) contains values of 0 for columns 11-15.
a 0 0.368 0.871 0.402 0.555 0.414 0.294 0.654 0.288 0.180 0.113 0 0 0 0 0 0 0 0 0 0 0.409 0 0 0 0 0 0 0 0 0 0 0.968 0 0 0 0 0 0 0 0 0 0 0.447 0 0 0 0 0 0 0 0 0 0 0.617 0 0 0 0 0 0 0 0 0 0 0.460 0 0 0 0 0 0 0 0 0 0 0.327 0 0 0 0 0 0 0 0 0 0 0.727 0 0 0 0 0 0 0 0 0 0 0.320 0 0 0 0 0 0 0 0 0 0 0.200 0 0 0 0 0 0 0 0 0 0 0 0 0 0 0 0 0 0 0 0 0 0 0 0 0 0 0 0 0 0 0 0 0 0 0 0 0 0 0 0 b 0 1.000 1.000 0.967 1.000 0.957 0.952 0.971 0.936 0.958 1.000 0.786 0.857 0.600 0.33
0 0.326 0 0 0 0 0 0 0 0 0 0 0 0 0 0 0 1.000 0 0 0 0 0 0 0 0 0 0 0 0 0 0 0 1.000 0 0 0 0 0 0 0 0 0 0 0 0 0 0 0 0.967 0 0 0 0 0 0 0 0 0 0 0 0 0 0 0 1.000 0 0 0 0 0 0 0 0 0 0 0 0 0 0 0 0.957 0 0 0 0 0 0 0 0 0 0 0 0 0 0 0 0.952 0 0 0 0 0 0 0 0 0 0 0 0 0 0 0 0.971 0 0 0 0 0 0 0 0 0 0 0 0 0 0 0 0.936 0 0 0 0 0 0 0 0 0 0 0 0 0 0 0 0.958 0 0 0 0 0 0 0 0 0 0 0 0 0 0 0 1.000 0 0 0 0 0 0 0 0 0 0 0 0 0 0 0 0.786 0 0 0 0 0 0 0 0 0 0 0 0 0 0 0 0.857 0 0 0 0 0 0 0 0 0 0 0 0 0 0 0 0.600 0
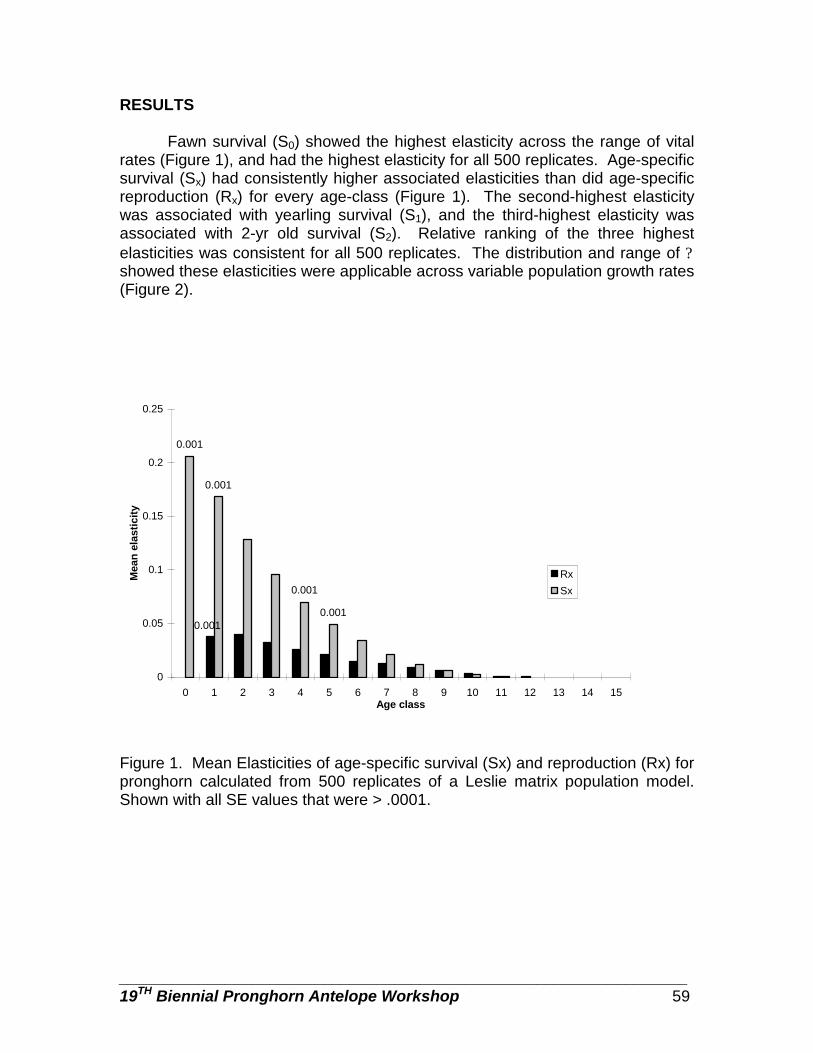
________________________________________________________________ 19TH Biennial Pronghorn Antelope Workshop 59
RESULTS
Fawn survival (S0) showed the highest elasticity across the range of vital rates (Figure 1), and had the highest elasticity for all 500 replicates. Age-specific survival (Sx) had consistently higher associated elasticities than did age-specific reproduction (Rx) for every age-class (Figure 1). The second-highest elasticity was associated with yearling survival (S1), and the third-highest elasticity was associated with 2-yr old survival (S2). Relative ranking of the three highest elasticities was consistent for all 500 replicates. The distribution and range of ? showed these elasticities were applicable across variable population growth rates (Figure 2).
0.0010.001
0.001
0.001
0.001
0
0.05
0.1
0.15
0.2
0.25
0 1 2 3 4 5 6 7 8 9 10 11 12 13 14 15Age class
Mea
n el
astic
ity
RxSx
Figure 1. Mean Elasticities of age-specific survival (Sx) and reproduction (Rx) for pronghorn calculated from 500 replicates of a Leslie matrix population model. Shown with all SE values that were > .0001.
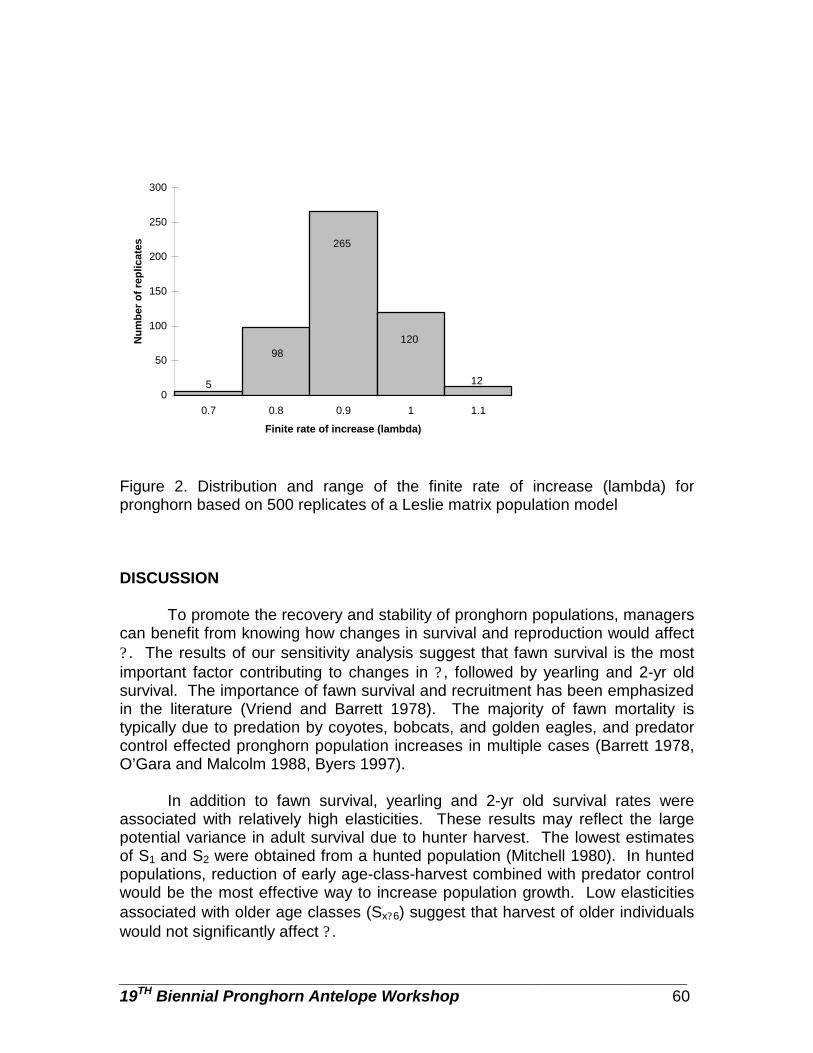
________________________________________________________________ 19TH Biennial Pronghorn Antelope Workshop 60
265
12098
5 120
50
100
150
200
250
300
0.7 0.8 0.9 1 1.1
Finite rate of increase (lambda)
Num
ber
of r
eplic
ates
Figure 2. Distribution and range of the finite rate of increase (lambda) for pronghorn based on 500 replicates of a Leslie matrix population model DISCUSSION
To promote the recovery and stability of pronghorn populations, managers can benefit from knowing how changes in survival and reproduction would affect ? . The results of our sensitivity analysis suggest that fawn survival is the most important factor contributing to changes in ? , followed by yearling and 2-yr old survival. The importance of fawn survival and recruitment has been emphasized in the literature (Vriend and Barrett 1978). The majority of fawn mortality is typically due to predation by coyotes, bobcats, and golden eagles, and predator control effected pronghorn population increases in multiple cases (Barrett 1978, O’Gara and Malcolm 1988, Byers 1997). In addition to fawn survival, yearling and 2-yr old survival rates were associated with relatively high elasticities. These results may reflect the large potential variance in adult survival due to hunter harvest. The lowest estimates of S1 and S2 were obtained from a hunted population (Mitchell 1980). In hunted populations, reduction of early age-class-harvest combined with predator control would be the most effective way to increase population growth. Low elasticities associated with older age classes (Sx? 6) suggest that harvest of older individuals would not significantly affect ? .
________________________________________________________________ 19TH Biennial Pronghorn Antelope Workshop 61
Before changing management plans to incorporate the results of elasticity analysis, it is important to consider the underlying assumption that vital rates are measured accurately (Schmutz et al 1997). In our analysis of pronghorn, the range of possible vital rates may have been underestimated due to scarcity of demographic data. In particular, fecundities of pronghorn under poor environmental conditions are not known, but are currently under investigation (M. Robinson, pers. comm). With accurate estimation of vital rates, sensitivity analysis is a valuable tool for managers that can guide allocation of future management and research efforts.
ACKNOWLEDGMENTS
We thank E.O. Garton for useful suggestions during the preparation of this
mnuscript. We are grateful to L.S. Mills fir the use if his computer program for data analyses LITERATURE CITED AUTENRIETH, R. 1980. Vulnerability of pronghorn fawns to predation. Proc
Biennial Pronghorn Antelope Workshop. 9:77-79. BARRETT, M. W. 1978. Pronghorn fawn mortality in Alberta. Proc. Biennial
Pronghorn Antelope Workshop. 8:429-444. BEALE, D. M. 1978. Birth rate and fawn mortality among pronghorn antelope in
western Utah. Proc. Biennial Pronghorn Antelope Workshop. 8:445-448. BYERS, J. A. 1997. American pronghorn: social adaptations and the ghosts of
predators past. University of Chicago Press, Chicago. 300pp. BYERS, J. A. AND J. D. MOODIE. 1990. Sex-specific maternal investment in
pronghorn, and question of a limit on differential provisioning in ungulates. Behav. Ecol. Sociobiol. 26:157-64.
CASE, T. J. 1978. On the evolution and adaptive significance of postnatal growth
rates in the terrestrial vertebrates. Q. Rev. Biol. 53:243-82. CASWELL, H. 1989. Matrix population models. Sinauer Publishers, Sunderland,
Mass. 328pp. DE KROON, H., A. PLAISIER, J. VAN GROENENDAEL, AND H. CASWELL. 1986.
Elasticity: the relative contribution of demographic parameters to population growth rate. Ecology. 67:1427-1431.
________________________________________________________________ 19TH Biennial Pronghorn Antelope Workshop 62
EDWARDS W. C. 1958. A study of the reproductive potential and ovarian structures in the pronghorn antelope, Antilocapra americana (Ord.) in Wyoming. M.S. Thesis. University of Wyoming. 63pp.
ELLIS. J. 1972. Observations of pronghorn population dynamics. Proc. Antelope
States Workshop. 5:55-65. MAGUIRE, L. A., G. F. WILHERE, AND Q. DONG. 1995. Population viability analysis
for red-cockaded woodpeckers in the Georgia Piedmont. J. Wildl. Manage. 59:533-542.
MITCHELL, G. J. 1980. The pronghorn antelope in Alberta. Alberta Department
of Lands and Forests Fish and Wildlife Division. 165pp. NEFF, D. J. AND N. G. WOOLSEY. 1980. Coyote predation on neonatal fawns on
Anderson Mesa, Arizona. Proc. Biennial Pronghorn Antelope Workshop. 9:80-97.
O’GARA, B. W., AND MALCOLM, J. 1988. Pronghorn fawn mortality related to
limited coyote control on the National Bison Range. Proc. Biennial Pronghorn Antelope Workshop. 13:61-70.
PYRAH, D. 1976. Pronghorn population characteristics in central Montana. Proc.
Biennial Pronghorn Antelope Workshop 7:54-61. ROBBINS, C. T. 1993. Wildlife feeding and nutrition, Second Edition. Academic
Press, New York. SCHMUTZ, J.A., R. F. ROCKWELL, AND M. R. PETERSEN. 1997. Relative effects of
survival and reproduction on the population dynamics of emperor geese. J. Wildl. Manage. 61:191-201.
VRIEND , H. G. AND M. W. BARRETT. 1978. Low pronghorn recruitment- is it an
issue? Proc. Biennial Pronghorn Antelope Workshop. 8:360-379. WISDOM, J. J., AND L. S. MILLS. 1997. Sensitivity analysis to guide population
recovery: prairie-chickens as an example. J. Wildl. Manage. 61:302-312. YOAKUM, J. D. 1978. Pronghorn. Pages 103-121 in J. L. Schmidt and D. L.
Gilbert, eds. Big game of North America, ecology and management. Stackpole Books, Harrisburg. 494pp.
________________________________________________________________ 19TH Biennial Pronghorn Antelope Workshop 63
A VALIDATION OF ARIZONA'S LANDSCAPE-LEVEL PRONGHORN
HABITAT MODEL
CINDY L. TICER, Research Branch, Arizona Game and Fish Department, 2221
W. Greenway Road, Phoenix, AZ 85023-4312, USA RICHARD A. OCKENFELS, Research Branch, Arizona Game and Fish
Department, 2221 W. Greenway Road, Phoenix, AZ 85023-4312, USA Abstract: Results of an earlier pronghorn (Antilocapra americana) habitat analysis (Ockenfels et al. 1996a) indicated that a model developed to evaluate landscape-scale pronghorn habitat identified useable pronghorn habitat. The model separated relative levels of quality with reasonable consistency, however, its ability to discern higher quality from more moderate habitat was low. Assessment of the habitat model in a different area of the state seemed necessary to determine reliability. We were able to validate the model during a project in a shortgrass prairie of northern Arizona, using locations from 29 radiocollared pronghorn acquired during a 2-year period. We compared proportion of pronghorn locations in each habitat rating class with proportion of the study area in each rating class. Non-random use of rated sections (2.6 km2) by pronghorn occurred (P < 0.001); 82% of locations occurred in sections evaluated as moderate quality habitat. Sections rated as moderate or higher were sections pronghorn used above availability, whereas sections rated as lower quality than moderate were used less than available. The model is appropriate for identifying suitable habitat at a landscape level.
PROCEEDINGS PRONGHORN ANTELOPE WORKSHOP 19:63-70 Key words: Antilocapra americana, habitat analysis, habitat, landscape, model, pronghorn, shortgrass prairie.
Habitat loss, particularly loss of movement corridors from fences used to
control livestock movements within pastures and along highways, and habitat degradation from long-term vegetative community changes due to livestock overuse and fire suppression have greatly impacted pronghorn populations (Ockenfels et al. 1994). In fact, as a result of habitat loss and degradation, some Arizona pronghorn populations have been extirpated (Nelson 1925, Knipe 1944, deVos 1999), or isolated.
The Arizona Game and Fish Department has identified and mapped
Arizona pronghorn populations since the early 1920s (Nelson 1925, Knipe 1944) and has conducted aerial surveys since 1946. However, an assessment of pronghorn habitat quality, occupied and potential, was not systematically evaluated until 1994-96 (Ockenfels et al. 1996b) when a landscape-level habitat model was developed. This Statewide Pronghorn Habitat Evaluation Model used
________________________________________________________________ 19TH Biennial Pronghorn Antelope Workshop 64
5 key pronghorn habitat variables (topographic ruggedness, vegetative structure and species richness, water availability, human disturbance, and fence density and structure) to determine statewide habitat quality of potential pronghorn habitat. Potential pronghorn habitat was determined using slope (<20%) and general vegetation type (i.e., grasslands). Accuracy of this model was tested in 4 state Game Management Units (GMU) where pronghorn locations were overlaid onto an evaluated map of each GMU. Most (73.3%, 92.0%, 98.5%, and 95.6%) pronghorn locations occurred in sections rated as high, moderate, or low quality classes. Furthermore, using this evaluation method, we were able to identify habitat factors that decreased the quality of potential pronghorn habitat.
In 1997, we initiated a 2-year study in northern Arizona to evaluate the utility of this model in another area using radiomarked pronghorn. Also, it was important to establish validity of the model in this area because we needed to refer to the habitat factors identified as problems during the evaluation as a starting point to make habitat enhancement recommendations for another aspect of this project.
If the model was valid, we predicted that radiomarked pronghorn would use high-quality sections more than they were available and would avoid sections evaluated as low quality. If the model was invalid, we predict that no relationship between pronghorn use and habitat rating would occur. Establishing validity of the model in this area was necessary to confirm and further determine habitat quality enhancement recommendations for the area.
STUDY AREA
The study area was located on the Colorado Plateau in north-central
Arizona at an elevation of 1,676-1,829 m and included 2 adjacent ranches that comprised approximately 182 km2 of predominantly private land. The southern end of the study area consisted of mixed sections of state and private lands.
This area was typically arid; precipitation averaged <19cm and ranged
from <25 - 51 cm annually, most of which occurred during summer (July - September) monsoons (Thybony and Thomas 1998). Terrain consisted of flats and gentle, rolling hills bisected longitudinally by steep-walled Cataract Canyon, a major drainage to the Colorado River.
Vegetation was predominately Shortgrass Plains Grassland integrating
with Great Basin Grassland (Brown 1994: 115-119). Blue grama (Bouteloua gracilis) and ring muhly (Muhlenbergia torreyi) were dominant grasses. Salt-bush (Atriplex spp.), buckwheat (Eriogonum sp.), winter-fat (Eurotia lanata), rabbitbrush (Chrysothamnus spp.), and snakeweed (Gutierrezia sarothrae) were common shrub species. Extensive stands of rabbitbrush or snakeweed dominated poorer-condition sites. Big sagebrush (Artemisia tridentata) dominated much of the northern periphery. Tall shrubs, such as mexican cliffrose
________________________________________________________________ 19TH Biennial Pronghorn Antelope Workshop 65
(Cowania mexicana) and mountain mahogany (Cercocarpus montanus), and juniper (Juniperus spp.) trees occurred along Cataract Canyon. Southern and eastern boundaries consisted mainly of juniper woodlands.
Using the landscape-level model, the majority of this study area was
evaluated as moderate quality pronghorn habitat. Problems identified in this area included high densities of low- to-the-ground (<40.6cm) fences, low vegetative diversity, dense tall shrub stands, and inaccessible water sources.
METHODS
We captured, radiocollared, and eartagged adult pronghorn in March
1997, November 1998, and February 1999, using a net-gun fired from a helicopter (Firchow et al. 1986). During the first year, we aerially located pronghorn weekly during fawning season (March-July) and twice monthly the remainder of the year. Following the first year, 04/ pronghorn twice monthly using a hand-held receiver. Locations were plotted on U.S. Geological Survey (USGS) 7.5-min topographic maps. Universal Transverse Mercador (UTM) coordinates were recorded to the nearest 0.1 km for each location. Aerial and ground locations were combined and their coordinates transferred into a geographic information system (GIS).
We used GIS technology to assess pronghorn use of the evaluated habitat
types. First, we extracted the study area from the 1996 statewide habitat evaluation database, determined km2, and calculated percent area of each habitat quality class present. Next, we overlaid a GIS-developed cover of pronghorn locations onto the study area map (Fig. 1). We then calculated proportion of locations within each habitat quality class as our measure of pronghorn use.
We compared proportion of locations in each habitat quality rating class
against availability with Chi-square contingency table analysis. We used a contingency table rather than goodness of fit analysis because we only estimated the expected distribution (Thomas and Taylor 1990). When the contingency table indicated a significant difference between the 2 distributions, Bonferroni simultaneous confidence intervals were calculated to determine which rating classes were selected or avoided (Neu et al. 1974, Byers et al. 1984). If selection or avoidance was determined for a cell, we used a Jacobs' D to indicate direction and magnitude of nonrandom use for that rating score (Jacobs 1974).
RESULTS
We captured, radiocollared, and eartagged 29 adult pronghorn (11F, 6M-
1997, 7F-1998, and 5F-1999). We acquired 1,647 locations between March 1997 and March 1999.
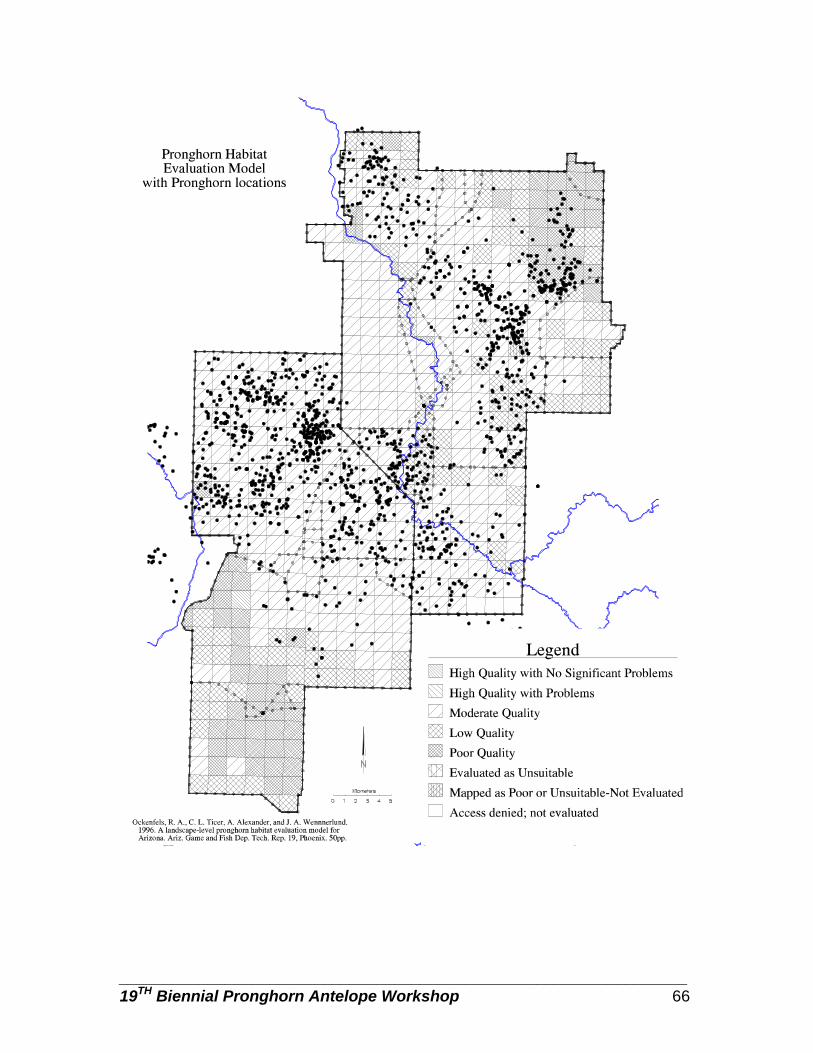
________________________________________________________________ 19TH Biennial Pronghorn Antelope Workshop 66
________________________________________________________________ 19TH Biennial Pronghorn Antelope Workshop 67
Non-random (X2 = 140.52, df = 2, n = 1,220) use by pronghorn of available sections occurred (Table 1). Sections rated as moderate quality or high quality with problems were used more than available, whereas sections rated as low or poor quality were used less than available. In this study area, 94.5% of pronghorn locations occurred in sections rated as moderate (82%) or low (11.6%), quality classes (Fig. 1). We did not document pronghorn use of high quality with no significant problems habitat class probably because only 1 section of such habitat existed within this study area. Only 18.8% of pronghorn locations occurred in habitat evaluated as low and poor quality classes.
DISSCUSSION
We conclude that the statewide pronghorn habitat evaluation model
adequately evaluated potential pronghorn habitat in shortgrass prairie of northern Arizona, at a landscape level. Similar to pronghorn habitat use in a shortgrass prairie of central Arizona (Ockenfels et al. 1994, 1996a), pronghorn in this study selected for habitat evaluated as moderate or better and avoided habitat evaluated lower than moderate quality.
We found that pronghorn use of habitat evaluated as poor was likely a
combination of individualistic animal use and scale of the evaluation. Only 2 of 29 collared pronghorn used the Poor quality habitat in the northeastern portion of the study area. These pronghorn were often located in juniper woodlands, tall (>46cm) sagebrush shrublands, and small grassy openings within this area. Pronghorn also occasionally used peripheral areas of poor quality habitat, which may have been location measurement scale error. We visually examined 3 of these low and poor quality areas where locations appeared most numerous and clustered. We found the vegetation and terrain to be suitable for pronghorn since the vegetation was a grassland without tall (>45.7cm) shrubs and terrain was gentle (<10%). However, low (<40.6cm), to-the-ground fences and mixed vegetation within the scale of the experimental unit (i.e., 2.6 km2) resulted in a reduced overall evaluation score of many sections. A to-the-ground, woven-wire fence ran along the periphery of several sections, resulting in a decreased evaluation score of these sections. Juniper woodlands and sagebrush flats that occurred in the northeastern corner of the study area were dissected by a series of finger-like grassy draws. We determined that 2 collared pronghorn used these draws for access. However, many locations from these 2 pronghorn also were located in the woodlands and shrublands.
We believe this model can be used as a management tool to conduct
landscape-scale assessments of potential pronghorn habitat. The model will assist land managers in identifying landscape-scale habitat problems of an area currently occupied by pronghorn or by aiding in identification of unoccupied pronghorn habitat area for possible re-introduction.
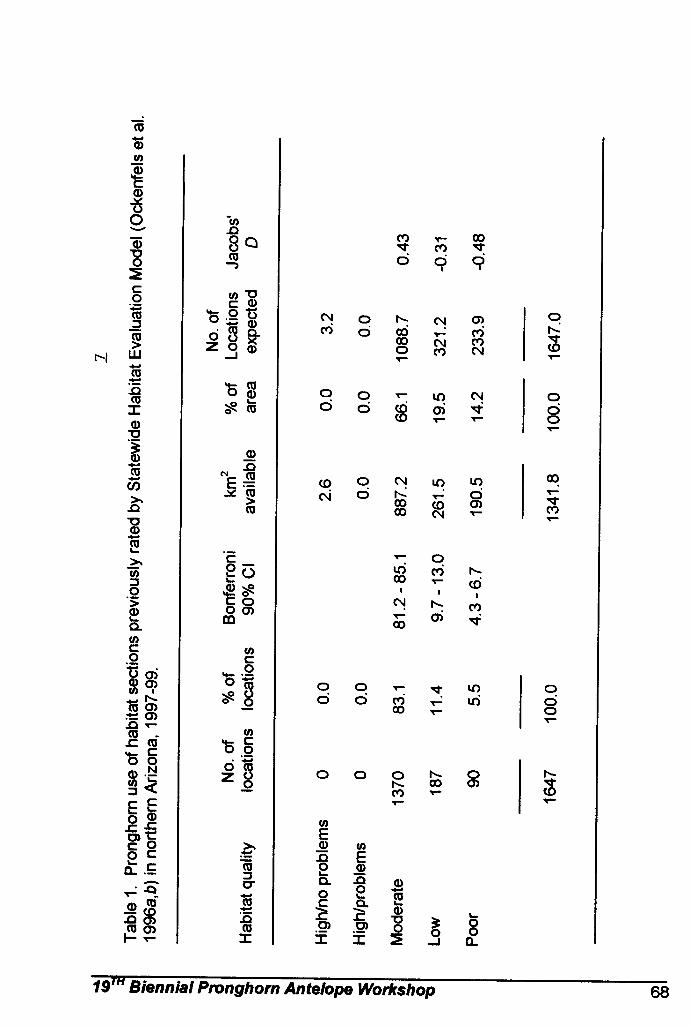
________________________________________________________________ 19TH Biennial Pronghorn Antelope Workshop 69
ACKNOWLEDGEMENTS Babbitt Ranches, Inc., President Billy Cordasco graciously provided us
opportunity to conduct this study on deeded and leased lands. David W. Hunt coordinated aerial support for pronghorn captures. John Hervert, Bob Birkeland, Amber A. Munig, Wade Zarlingo, Larry Phoenix, Billy Cordasco, James D. Babbitt, Mark McCullough, and Lee Leudecker assisted with capture operations. Volunteers Dr. Robert Kreycik and Dr. Clancy Gansberg provided veterinary assistance during captures. Bob Birkeland, Neil Lawson, Wade Zarlingo, Heather Whitlaw, MariAnn Koloszar, Andi Rogers, and student interns Phil James and Carl Daniels assisted in data collection. Bill Carrel and MariAnn Koloszar provided aerial location support. Sue Boe provided GIS and technical support. James C. deVos Jr., Ted McKinney and Amber A. Munig reviewed this manuscript.
Funding for this project was provided by Babbitt Ranches Inc., and
Federal Aid in Wildlife Restoration Act Project F-78-R of the Arizona Game and Fish Department. LITERATURE CITED ARIZONA GAME AND FISH DEPARTMENT. 1996. Wildlife 2000. Arizona Game and
Fish Department, Phoenix, USA. BROWN, D. E., editor. 1994. Biotic Communities: southwestern United States
and northwestern Mexico. University of Utah Press, Salt Lake City. BYERS, C. R., R. K. STEINHORST, AND P. R. KRAUSMAN. 1984. Clarification of a
technique for analysis of utilization-availability data. Journal of Wildlife Management 48:1050-1053.
DEVOS, J. C., JR. 1999. Status and management needs of pronghorn in Arizona.
Pronghorn Antelope Workshop Proceedings 18:7-15. FIRCHOW, K. M., M. R. VAUGHN, AND W. R. MYTTON. 1986. Evaluation of the
hand-held net gun for capturing pronghorns. Journal of Wildlife Management 50:320-322.
JACOBS, J. 1974. Quantitative measurements of food selection. Oecologia
14:413-417. KNIPE, T. 1944. The status of the antelope herds of northern Arizona. Arizona
Game and Fish Commission Federal Aid Project Report, Phoenix, Arizona, USA.
________________________________________________________________ 19TH Biennial Pronghorn Antelope Workshop 70
NELSON, E. W. 1925. Status of the pronghorn antelope: 1922-1924. U.S. Department of Agriculture Bulletin 1346, Washington, D.C., USA.
NEU, C. W., C. R. BYERS, AND J. M. PEEK. 1974. A technique for analysis of
utilization-availability data. Journal of Wildlife Management 38:541-545. OCKENFELS, R. A., A. ALEXANDER, C. L. DOROTHY TICER, AND W. K. CARREL. 1994.
Home ranges, movement patterns, and habitat selection of pronghorn in central Arizona. Arizona Game and Fish Department Technical Report 13, Phoenix, Arizona, USA.
_____, C. L. TICER, A. ALEXANDER, AND J. A. WENNERLUND. 1996a. A landscape-
level pronghorn habitat evaluation model for Arizona. Arizona Game and Fish Department Technical Report 19, Phoenix, Arizona, USA.
_____, C. L. TICER, A. ALEXANDER, AND J. A. WENNERLUND. 1996b. Statewide
evaluation of pronghorn habitat in Arizona. Arizona Game and Fish Department Federal Aid Final Report, Phoenix, USA.
THOMAS, D. L., AND E. J. TAYLOR. 1990. Study designs and tests for comparing
resource use and availability. Journal of Wildlife Management 54:322-330.
THYBONY, S., AND K. THOMAS. 1998. Coconino Plateau Babbitt Ranches
Biological Assessment.
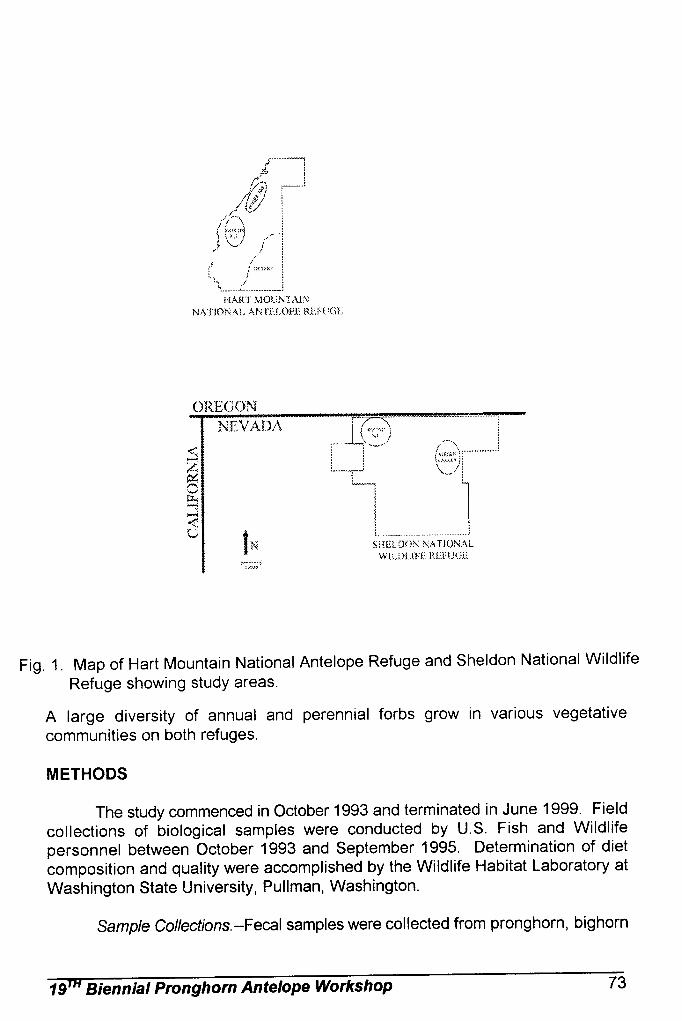
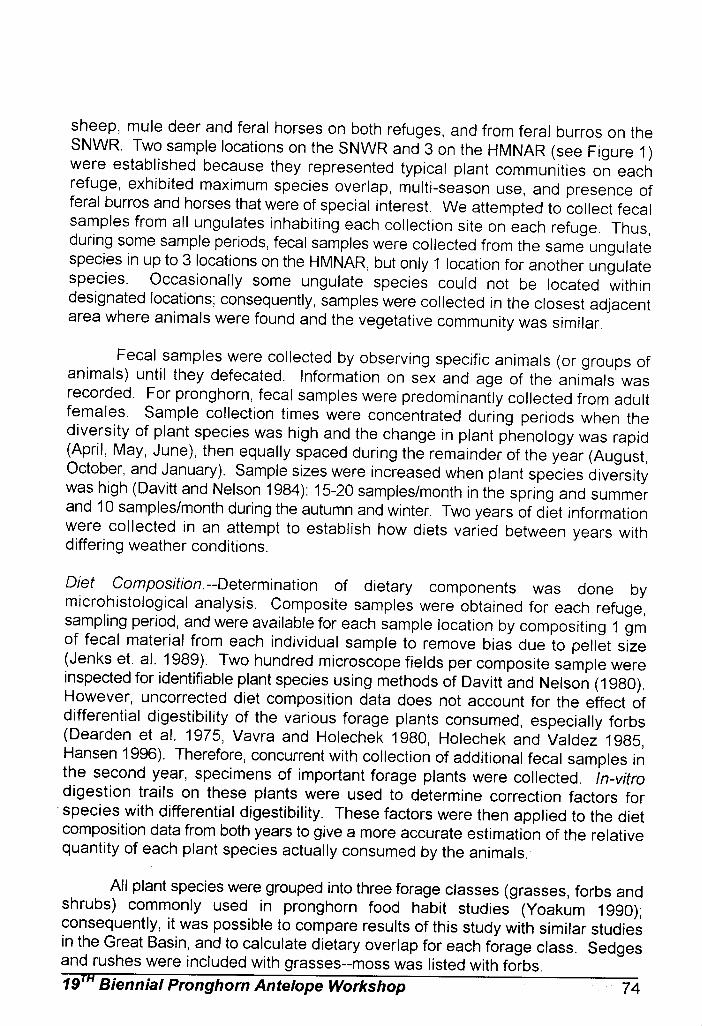
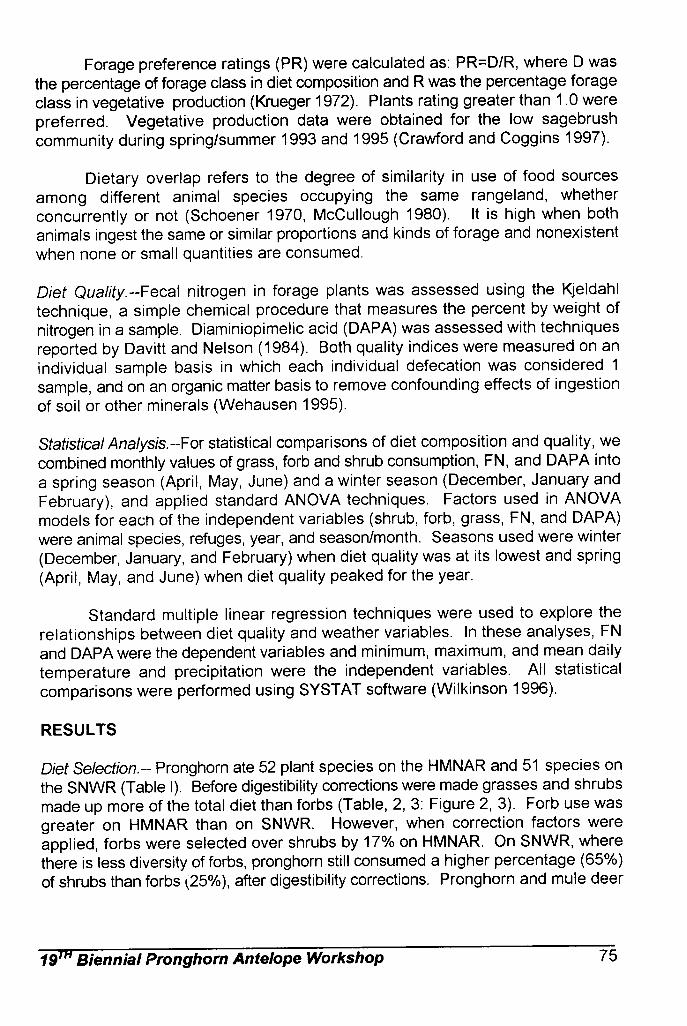
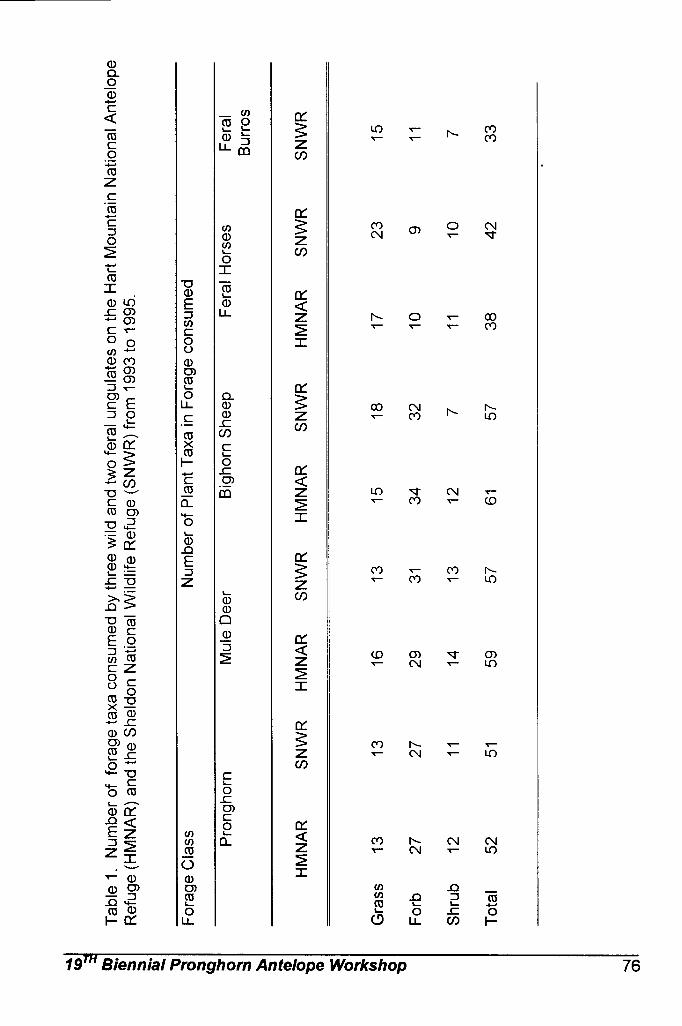
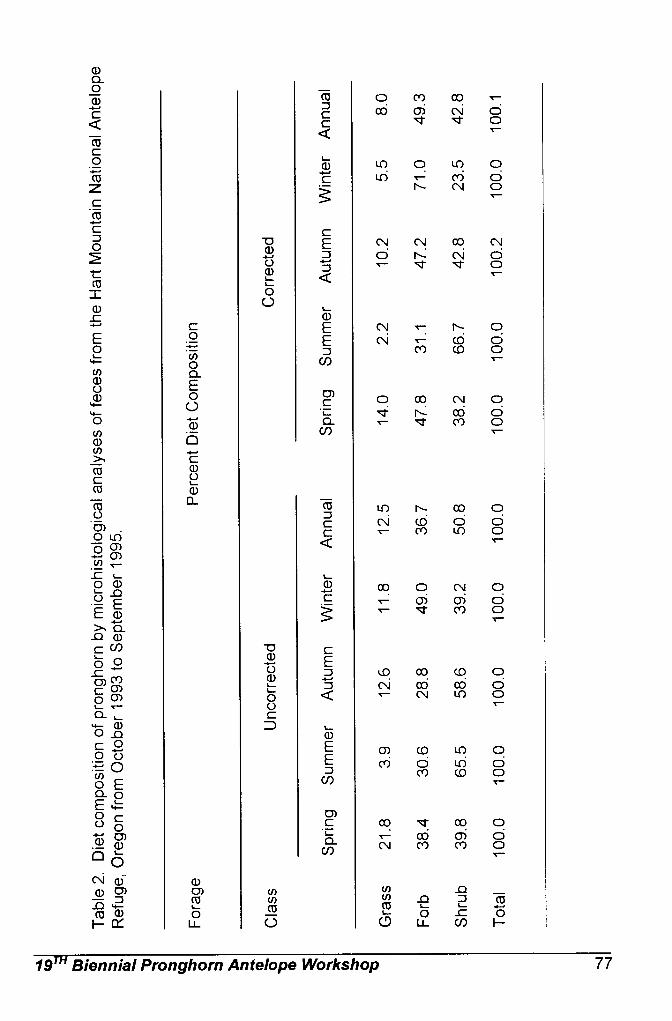
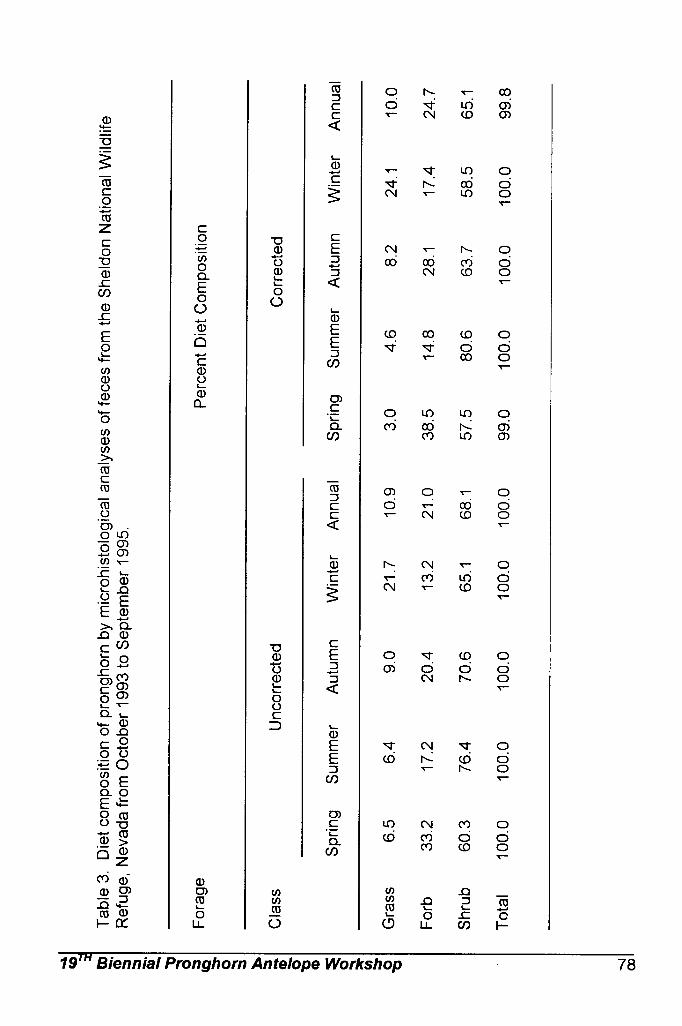

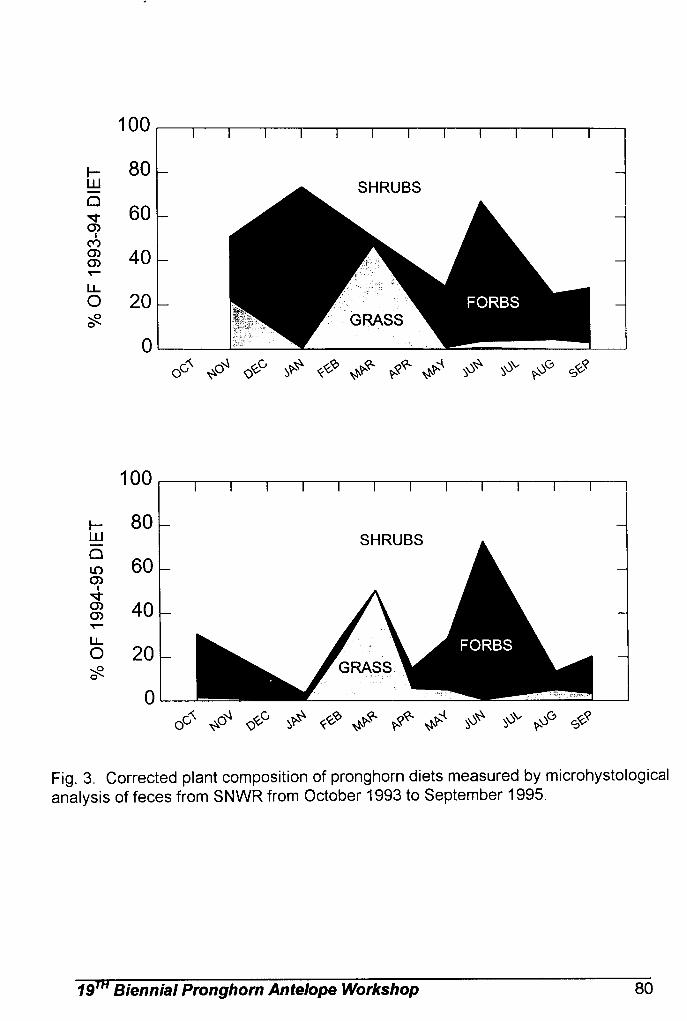
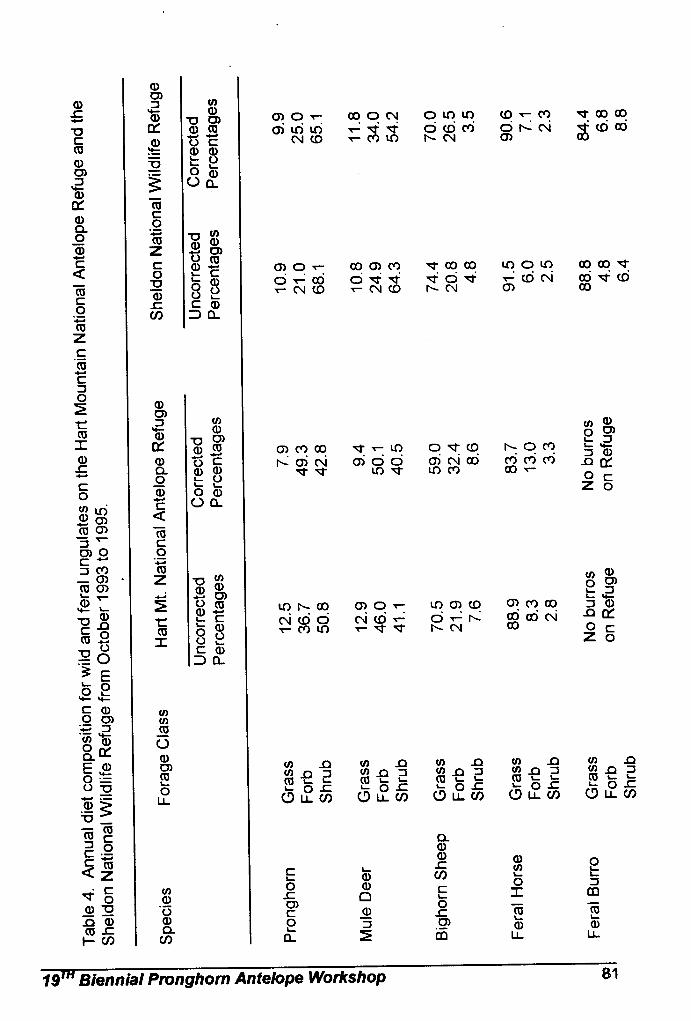
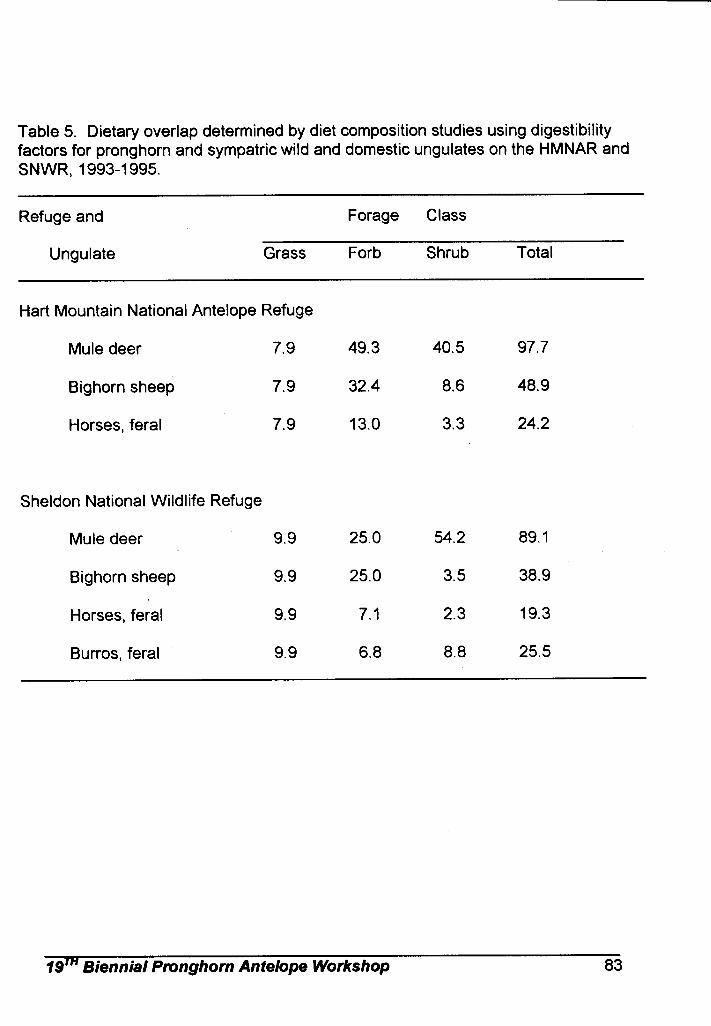
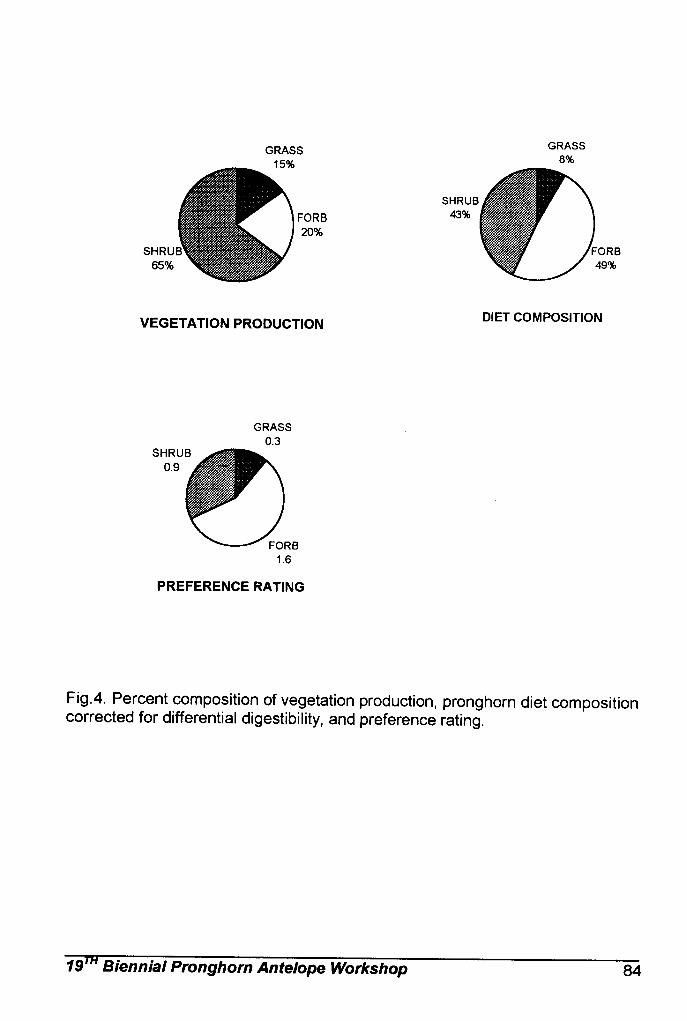
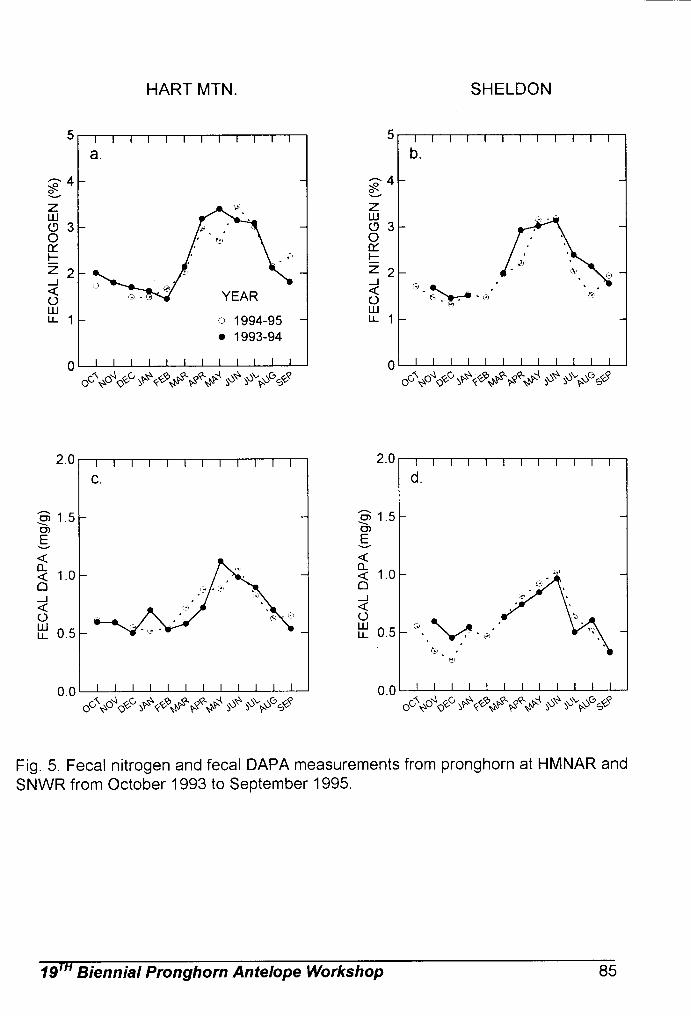
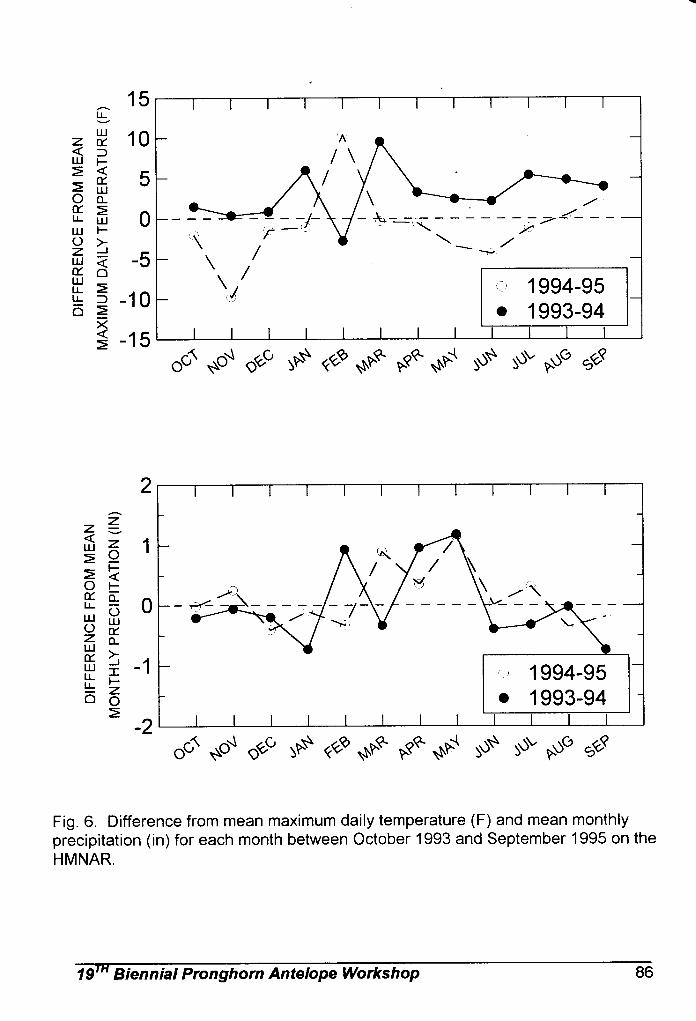
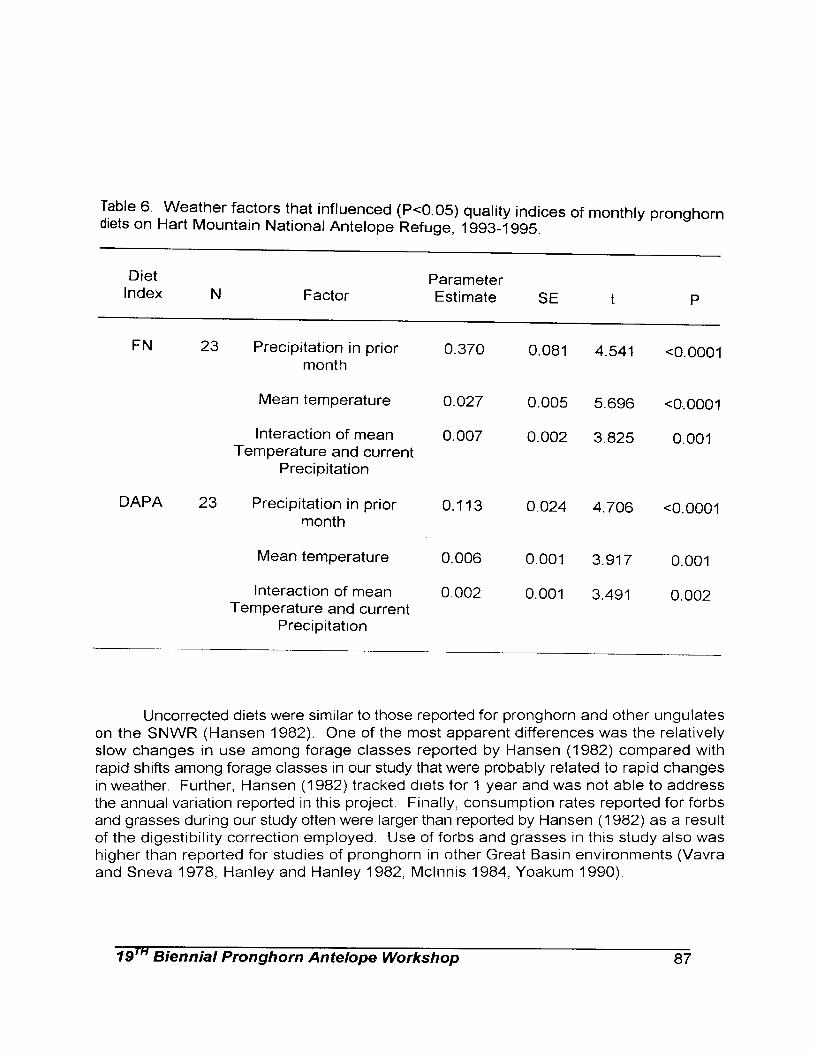
________________________________________________________________ 19TH Biennial Pronghorn Antelope Workshop 95
PRONGHORN (Antilocapra americana mexicana) POPULATIONS IN
CHIHUAHUA, ESTIMATED BY AERIAL SURVEYS. DANAE AZUARA, Instituto de Ecología, Universidad Nacional Autónoma de
México, Ap. Postal 70-275 C. P. 04510 RODRIGO A. MEDELLIN, Instituto de Ecología, Universidad Nacional Autónoma
de México, Ap. Postal 70-275 C. P. 04510 México D.F. CARLOS MANTEROLA, Unidos para la Conservación A.C. Prado Norte 324,
Lomas de Chapultepec, C.P. 11000, México D.F. MANUEL VALDES, Unidos para la Conservación A. C. Prado Norte 324, Lomas
de Chapultepec, C. P. 11000, México D.F. Abstract: The ongoing survey of the remaining pronghorn populations in Mexico is a solid basis to plan actions and to assess priorities for the National Pronghorn Recovery Program. The state of Chihuahua contains at least 50% of the total Mexican pronghorn. Aerial surveys of Pronghorn antelope in Chihuahua have been carried out the last three years by Unidos para la Conservación in collaboration with the Instituto de Ecología, Universidad Nacional Autónoma de México. The aerial surveys were carried out following a fixed strip transect method. Our estimates vary from 282 to 564 pronghorn for Chihuahua depending on different opinions on the method’s detection reliability. The groups were found in three main areas that are isolated form each other. Most of the pronghorn were in the large central area, the remainder in two small regions, La Perla and Casas Grandes. La Perla, which we recognized as an important breeding area since the onset of the study, and has continuously been monitored from 1997 to 1999, shows fewer antelope every year, namely 57, 34 and 26 individuals. The monitoring of these populations, habitat studies, usage of GIS, and so on, will soon provide us with the necessary information to plan a conservation and management strategy that will allow the species to escape from local extinction.
Proceedings Pronghorn Antelope Workshop 19:95-105
Key Words: Mexican pronghorn, distribution, population size, population structure, endangered species, game species, Chihuahua. Pronghorn populations originally extended from southeast Alberta and Saskatchewan, to the north of Valle de México, California and Baja California, occupying the big flat lands in western North America (Hall 1981). Before the arrival of Spanish conquerors, pronghorn populations reached approximately 50 million individuals. By 1929 its populations were drastically
________________________________________________________________ 19TH Biennial Pronghorn Antelope Workshop 96
reduced to barely 20,000 individuals (Yoakum 1980). The main causes for this reduction were habitat loss and fragmentation, and overexploitation through hunting (O’Gara 1978). During that year in the United States of America, programs to manage and recover this species began and have been very successful. In Mexico, pronghorn populations distributed from the northernmost states, where they were very abundant, to the flatland north of the Valle de México (Leopold 1959). Nowadays Mexican pronghorn is naturally distributed in three areas: Vizcaíno desert in Baja California, Pinacate desert in Sonora and other (southeastern) areas in Sonora and in the state of Chihuahua. Surveys carried out in 1984 estimated minimal Mexican pronghorn populations as follows: 307 individuals in Chihuahua, 63 eastwards to Sierra del Pinacate Sonora, and 64 in El Vizcaíno in Baja California. National population did not exceed 434 pronghorn (González-Romero & Lafón, 1993) and, as a result, the species is now officially labeled as endangered (Diario Oficial de la Federación, 1994). González Romero and Lafón T. (1993) report that Mexican pronghorn population has decreased its size in approximately 82% in the last sixty years, due to loss and fragmentation of habitat caused by urbanization, agriculture advance, overgrazing and illegal hunting.
Compared to the other pronghorn sites, the state of Chihuahua contains the greatest proportion of Mexican pronghorn, being of major importance to the conservation of this species. In order to establish a properly planned conservation strategy, the populations in Chihuahua are being studied. The main objective of this study is to find out its current distribution, size, and structure. METHODS The potential area of distribution in which we carried out the surveys was obtained using the most recent records, information provided by ranch owners, vegetation maps, and a survey flight done in 1995 in collaboration with the Secretaría de la Defensa Nacional (SEDENA).
To estimate Chihuahua’s pronghorn population size we used data from aerial surveys carried out from 1997 to 1999 in three different areas (Fig. 1 and 2). i) La Perla (surveyed in 1997, 1998 and 1999). ii) The Central Area (part of it, El Sueco Corridor was flown in 1997, and the area was surveyed almost completely in 1999), and iii) Casas Grandes (surveyed in 1997). The surveys were done following the New Mexico Department of Game and Fish strip transect method, (Tom Sansom, pers. com.) which consists in flying approximately at 250ft. above ground, at a 90 – 100 miles/hr speed, for three to four hours beginning at sunrise or late in the afternoon when sun rays fall slanted on the ground. The flights are done in a north-south, south-north direction (ondulated pattern) always with the sun on the side. To avoid double counting we flew areas as large
________________________________________________________________ 19TH Biennial Pronghorn Antelope Workshop 97
as possible, trying to delimit the transects with barriers such as highways or Sierras, so the probability of animals moving from one survey area to another would be reduced. All observations were georeferenced and later mapped. If we counted identical or very similar groups in near areas in consecutive flights, we eliminated one of the groups from the analysis. Flights were not performed when conditions were cloudy, windy or very hot, to avoid resulting biases (Lee et al., 1998). Most surveys were done in September or October when fawn were young enough to be easily recognized, yet old enough to be running with their mothers.
To estimate the population size we considered different scenarios: 1) The
animals we counted represent a 100% of the animals present in the surveyed area (Tom Samson pers. com.). 2) The counted antelope represent 50% of the actual number for the surveyed area (Raymond Lee, pers. com.). We used the 1997 count of the Sueco area with lower density and more surveyed area being confident of not overestimating the numbers. RESULTS Geographic distribution. In “La Perla” animals were found in all three years between Rancho La Palma and Rancho Mesteñas, most of them being found in ranches El Mimbre and El Liberal. In the “Casas Grandes” area, they were found in the ranch called El Cuervo. The largest numbers of pronghorn were found in the Central area in four sites: “El Sueco Corridor”, “El Veinticuatro”, “Tres Castillos” and “Tosesihua” (Fig. 2).
Some not quantified impacts and barriers to pronghorn movements were recognized, which help us explain the fragmented pronghorn distribution and understand part of the problematic these populations are suffering. Some human and natural impacts, were identified during field work (Fig. 3) like: o Menonites agriculture, which transform and reduce pronghorn habitat and
represent barriers for their movements. o Ejidos, that are, in Chihuahua, small properties with a higher density of
fences and human population than big private properties. o Sheep presence, that some authors consider to be pronghorn competitors
(Lee et. al. 1998). o Salt flats in which almost no vegetation grows and get flooded. o An Ejido called Julimes that we have been informed by land owners
poaches pronghorn. o Predators like coyotes were seen in most of the flights, and we were
informed about the presence of mountain lions in these areas, both of which represent threats to fawns.
________________________________________________________________ 19TH Biennial Pronghorn Antelope Workshop 98
o Finally, highways like the one from Chihuahua City to Ciudad Juaréz and the border contribute to fragment the area. Populations size and structure. The lowest estimated population of pronghorn in Chihuahua, taking in account the data from 1997, 98 and 99 is 282. If we consider that only fifty percent of the real number of animals was detected, we would have an estimated population size of 564. There are still some areas not surveyed in which more pronghorn are likely to be found. For example, due to time constrains, 15% of the Central Area was not surveyed.
The number of bucks, does, fawns, not identified and total pronghorn found in each area are shown in figure 4. The area with the highest number of sighted pronghorn is by far “El Sueco Corridor” with 137, registered in 1997. In 1999, when only about 45% of the Sueco corridor was surveyed, we counted 64 animals. We assumed that the population in this area has not changed because the calculated densities do not vary significantly between years (approximately 0.033 / km2 in 1997, and 0.035 / km2 in 1999).
El Sueco, Tosesihua and La Perla were the sites that had the largest numbers of fawns. However, the proportion of fawns in El Sueco, in relation to the total pronghorn observed, was very small (0.06 fawns per doe).
Since 1997, we identified “La Perla” as an important breeding area, and monitored it for three years. During this period the population seemed to be decreasing from 61, to 3 4 and 26. Buck numbers have consistently decreased each year. The number of does was the same the first two years and in 1999 that figure decreased to almost half of what was observed in prior years. Fawn numbers decreased in 1998 and increased again in 1999 to almost one half of the 1997 count. (Fig. 5.)
The fawn:doe:buck ratio (Table 1) suggests that all areas have poor, very poor or no recruitment rate except for La Perla in 1997 (0.83 fawn per doe, considered good) and 1999 (0.62 fawn per doe considered fair) (sensu Trueblood 1971). The average fawn: doe ratio of 0.32, for the three years, at La Perla is higher than ratios calculated in 1977 and 1998 for the same area, in 1977 and 78, 0.17 and 0.11, respectively (Treviño 1978).
For maximum recruitment a 1:4 buck:doe ratio is suggested (Lee et al.
1998). In the Tosesihua area the ratios are close to that one, while in Casas Grandes, El Veinticuatro and La Perla 1999 the relation is near 1:2. The ratios for El Sueco and Tres Castillos were approximately 1:3 and 1:7 respectively.
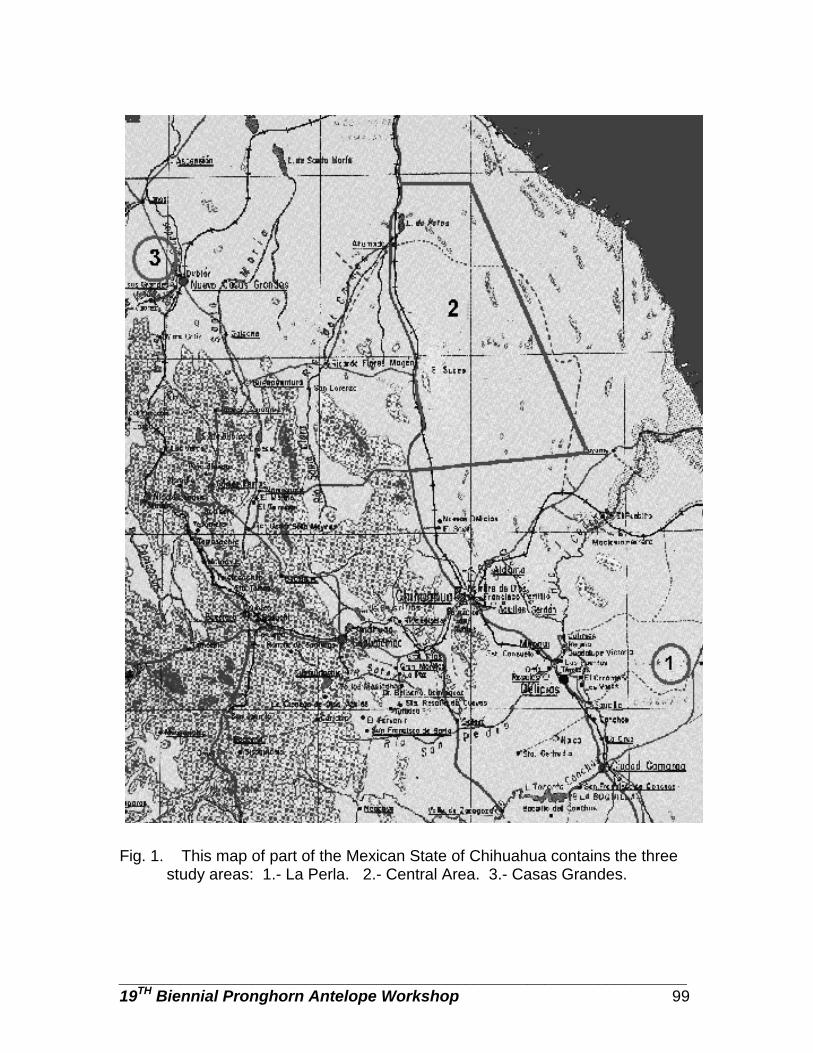
________________________________________________________________ 19TH Biennial Pronghorn Antelope Workshop 99
Fig. 1. This map of part of the Mexican State of Chihuahua contains the three study areas: 1.- La Perla. 2.- Central Area. 3.- Casas Grandes.
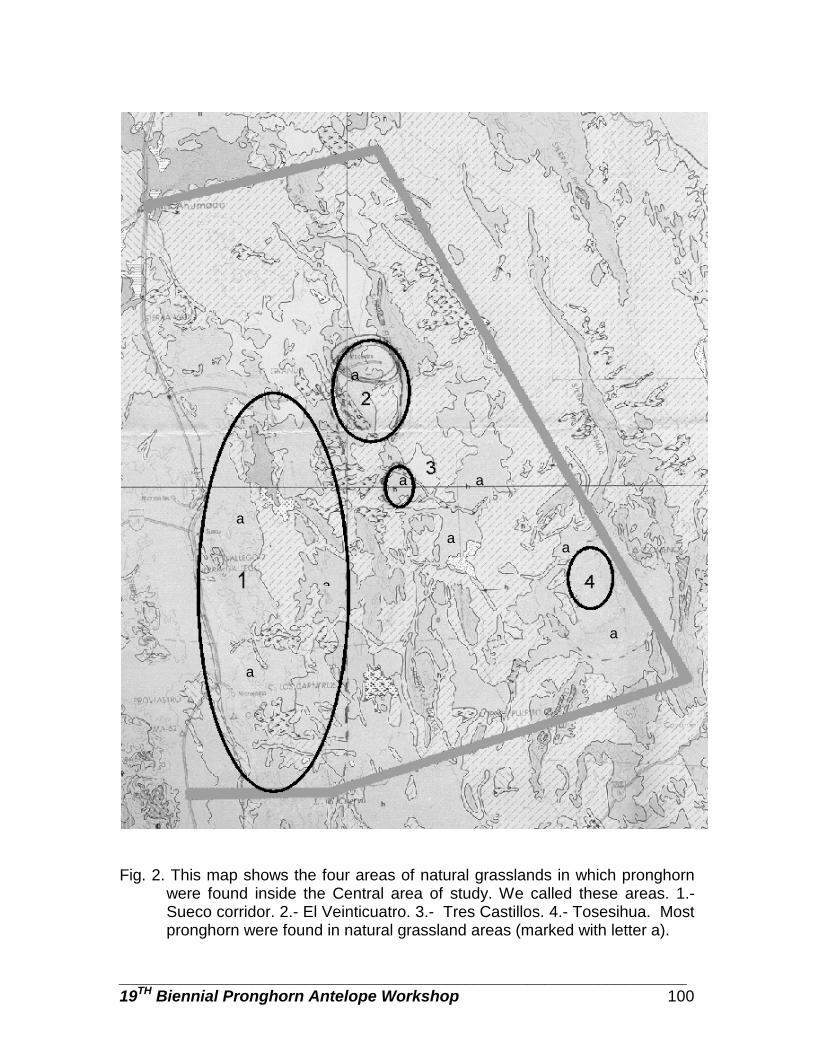
________________________________________________________________ 19TH Biennial Pronghorn Antelope Workshop 100
Fig. 2. This map shows the four areas of natural grasslands in which pronghorn
were found inside the Central area of study. We called these areas. 1.- Sueco corridor. 2.- El Veinticuatro. 3.- Tres Castillos. 4.- Tosesihua. Most pronghorn were found in natural grassland areas (marked with letter a).
a
a
a
a
a
a a
a a
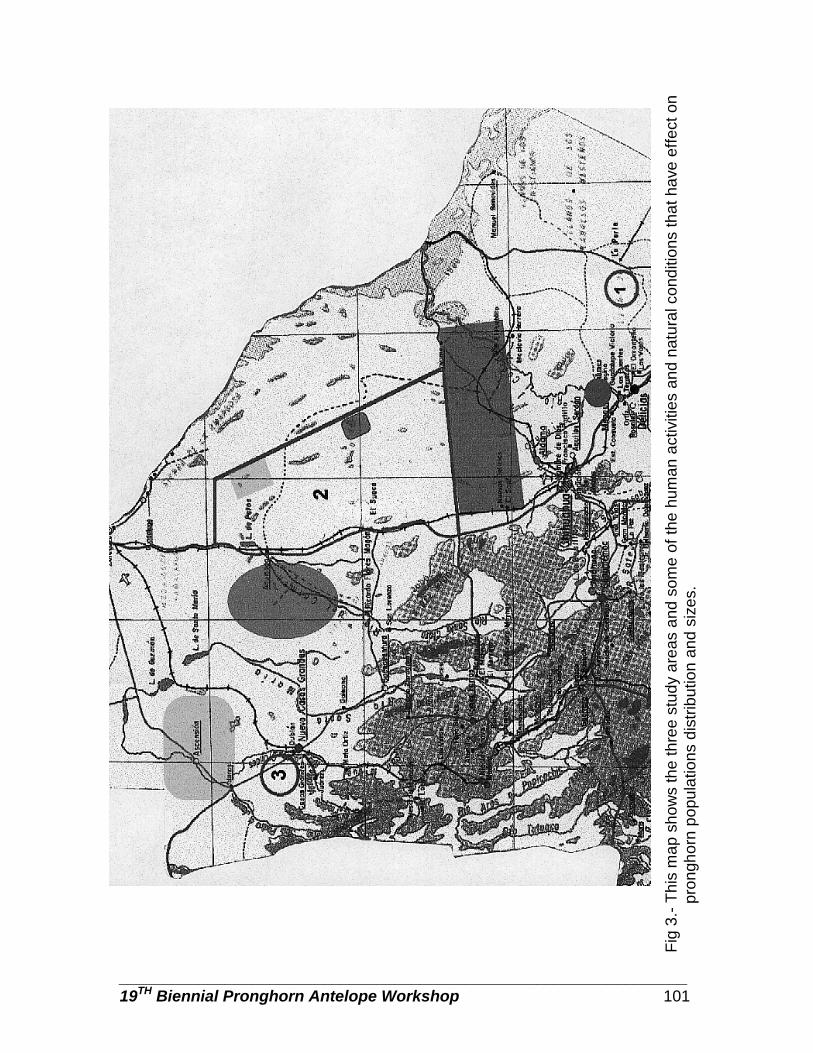
________________________________________________________________ 19TH Biennial Pronghorn Antelope Workshop 101
Fig
3.- T
his
map
sho
ws
the
thre
e st
udy
area
s an
d so
me
of th
e hu
man
act
iviti
es a
nd n
atur
al c
ondi
tions
that
hav
e ef
fect
on
pro
ngho
rn p
opul
atio
ns d
istri
butio
n an
d si
zes.
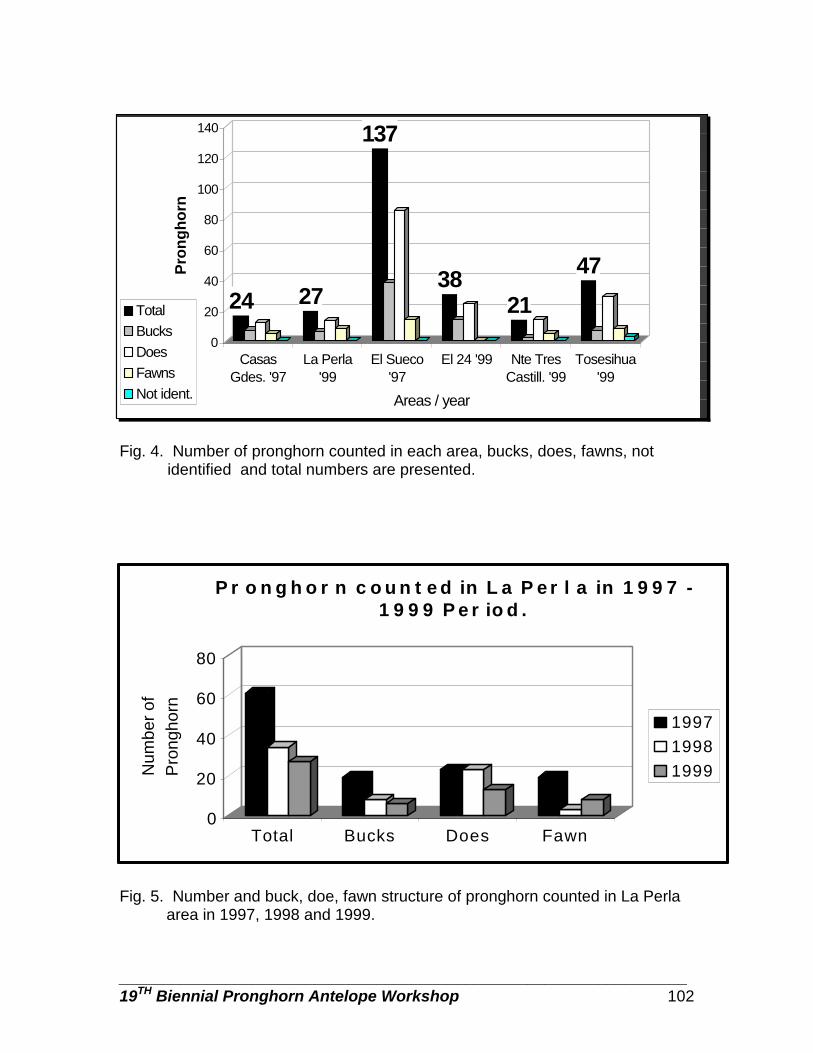
________________________________________________________________ 19TH Biennial Pronghorn Antelope Workshop 102
Fig. 4. Number of pronghorn counted in each area, bucks, does, fawns, not
identified and total numbers are presented.
Fig. 5. Number and buck, doe, fawn structure of pronghorn counted in La Perla
area in 1997, 1998 and 1999.
24 27
137
3821
47
0
20
40
60
80
100
120
140
Pro
ngho
rn
CasasGdes. '97
La Perla'99
El Sueco'97
El 24 '99 Nte TresCastill. '99
Tosesihua'99
Areas / year
TotalBucksDoesFawnsNot ident.
0
20
40
60
80
Num
ber o
f P
rong
horn
Total Bucks Does Fawn
P r o n g h o r n c o u n t e d in L a P e r l a in 1 9 9 7 - 1 9 9 9 P e r io d .
199719981999
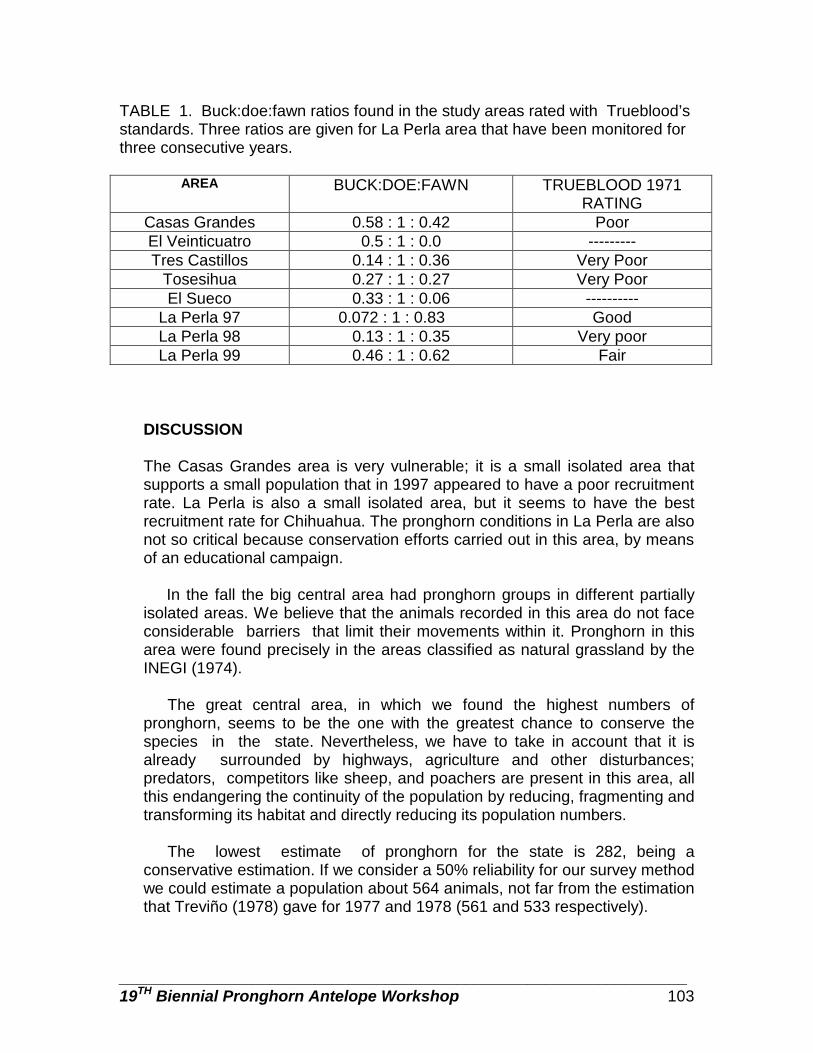
________________________________________________________________ 19TH Biennial Pronghorn Antelope Workshop 103
TABLE 1. Buck:doe:fawn ratios found in the study areas rated with Trueblood’s standards. Three ratios are given for La Perla area that have been monitored for three consecutive years.
AREA BUCK:DOE:FAWN TRUEBLOOD 1971 RATING
Casas Grandes 0.58 : 1 : 0.42 Poor El Veinticuatro 0.5 : 1 : 0.0 --------- Tres Castillos 0.14 : 1 : 0.36 Very Poor
Tosesihua 0.27 : 1 : 0.27 Very Poor El Sueco 0.33 : 1 : 0.06 ----------
La Perla 97 0.072 : 1 : 0.83 Good La Perla 98 0.13 : 1 : 0.35 Very poor La Perla 99 0.46 : 1 : 0.62 Fair
DISCUSSION The Casas Grandes area is very vulnerable; it is a small isolated area that supports a small population that in 1997 appeared to have a poor recruitment rate. La Perla is also a small isolated area, but it seems to have the best recruitment rate for Chihuahua. The pronghorn conditions in La Perla are also not so critical because conservation efforts carried out in this area, by means of an educational campaign.
In the fall the big central area had pronghorn groups in different partially isolated areas. We believe that the animals recorded in this area do not face considerable barriers that limit their movements within it. Pronghorn in this area were found precisely in the areas classified as natural grassland by the INEGI (1974).
The great central area, in which we found the highest numbers of pronghorn, seems to be the one with the greatest chance to conserve the species in the state. Nevertheless, we have to take in account that it is already surrounded by highways, agriculture and other disturbances; predators, competitors like sheep, and poachers are present in this area, all this endangering the continuity of the population by reducing, fragmenting and transforming its habitat and directly reducing its population numbers. The lowest estimate of pronghorn for the state is 282, being a conservative estimation. If we consider a 50% reliability for our survey method we could estimate a population about 564 animals, not far from the estimation that Treviño (1978) gave for 1977 and 1978 (561 and 533 respectively).

________________________________________________________________ 19TH Biennial Pronghorn Antelope Workshop 104
The number of pronghorn counted in La Perla seems to be falling from one year to the next. It could be that the first year was a very good one for the population in this place, because of the presence of researchers studying them (all through the breeding season) and a good year in terms of precipitation. The next two years there was no presence of researchers to “passively defend” the area from poachers and predators. Recruitment rates found are quite low, but higher in average to the ones found by Treviño in 1977 and 1978. It may be that natural recruitment in Chihuahua is not as good as in other areas or that it is very variable according to climatic conditions and both studies were carried out in poor rain years. RECOMMENDATIONS. Management practices for Chihuahua’s state pronghorn populations should urgently seek to increase the number of animals recruited each year, and also try to reach a buck:doe relation that improves the population growth rate. Specific short-term plans and recommendations include: o Implement active vigilance programs in fawning areas such as the rolling hills areas in: La Perla, the southern part of El Sueco Corridor, Tosesihua, Tres Castillos and El Veinticuatro. o Survey the rest of pronghorn potential areas in Chihuahua like Janos and Benavides. o Monitor in other seasons (spring, summer or winter) or use telemetry to find out how pronghorn move throughout the year. o Monitor as many populations as possible, at least La Perla and the parts of the central area in which we have found pronghorn. o Start habitat evaluations. o Usage of GIS to study agriculture and desertification expansion, population dynamics, and so on; as a tool to justify conservation decision-making processes. o Evaluate the need of predator control in fawning areas. o Promote educational projects among local inhabitants. o Carry on constant informative meetings with ranch owners. o Reevaluate the objectives and methods, considering new information.
All these points are part of the National Pronghorn Recovery Program that aims at building a long-term and efficient conservation and recovery strategy for Mexican pronghorn populations.
ACKNOWLEDGEMENTS We would like to thank CEMEX, Fondo Mexicano para la Conservación de la Naturaleza, World Wildlife Fund, Eduardo Iñigo, Dirección
________________________________________________________________ 19TH Biennial Pronghorn Antelope Workshop 105
General de Vida Silvestre, Felipe Ramírez, Tom Sansom, Santiago Gonzales, NMDG&F, Asociación Sierra Madre, Ranch Owners, Sandy Lanham, Alberto Lafón, Dalia Conde, for their support, and Eric Mellink and Gerardo Ceballos for their comments and suggestions. LITERATURE CITED DIARIO OFICIAL DE LA FEDERACIÓN. 1994. Norma Oficial Mexicana NOM-
159-ECOL-1994 que determina las especies y subespecies de flora y fauna silvestres terrestres y acuáticas en peligro de extinción, amenazadas, raras y las sujetas a protección especial, y que establece especificaciones para su protección. Lunes 16 de mayo, 1-60.
González-Romero A. y A. Lafón. 1993. Distribución y estado actual del
berrendo (Antilocapra americana) en México. Pp. 409-420. En: Medellín R. A. y G. Ceballos (eds). Avances en el estudio de los mamíferos de México. Publicaciones Especiales, Vol. 1, Asociación Mexicana de Mastozoologia, A.C. México, D. F.
Hall, E. R.. 1981. The mammals of North America. John Wiley and Sons, New
York. Instituto Nacional de Estadística Geografía e Informática (INEGI). 1974. Carta
de uso de suelo y vegetación, Chihuahua, Escala 1:1000,000. Lee, R. M., J. D. Yoakum, B. W. O’Gara, T. M. Pojar and R. A. Ockenfels, (eds.)
1998. Pronghorn Management Guides. 18th Pronghorn Antelope Workshop, Prescott, Arizona. 110 pp.
Leopold, A. S. 1959. Wildlife of Mexico. The University of California Press,
Berkeley, 568pp. O’Gara B. W. 1978. Antilocapra americana. Mamm. Species. 90: 1-7. Treviño J. C. 1978. Numbers and distribution of Pronghorn-Antelope in
Chihuahua. Master Diss. New Mexico State University, Las Cruces, Nuevo México, 58 pp.
Trueblood, R. W. 1971. Statewide wildlife survey and inventory. Pittman-
Robertson Job Prog. Rep., W-130-R-2. Montana. Fish and Game Dep., Helena. 26 pp.
Yoakum, J. 1980. Habitat Management guides for the American Pronghorn
Antelope. U.S. Department of Interior Bureau of Land Management, Denver Service Center, Denver, Colorado.
________________________________________________________________ 19TH Biennial Pronghorn Antelope Workshop 106
GENETIC VARIATION AMONG PRONGHORN (Antilocapra americana) POPULATIONS.
DALIA AMOR C. Unidos para la Conservación, A.C., México City. OLIVER A. RYDER, Center for Reproduction of Endangered Species, Zoological Society of San Diego, CA, U.S.A. ROB RAMEY, University of Colorado Boulder, CO, 80309-0334, U.S.A. RODRIGO A. MEDELLIN, Instituto de Ecología, U.N.A.M., Mexico City Abstract: Mexican pronghorn populations have been declining drastically in the last century as a result of habitat fragmentation and loss, predation and poaching. The latest census data indicates there are approximately 1000 individuals representing three subspecies. Of the three, the peninsular pronghorn subspecies is the most threatened, comprising only 10% of the total number of pronghorn present in Mexico. In order to ensure the survival of this species, conservation management of the remaining populations is necessary. One key element to contribute towards this management is the analysis of genetic variation found among pronghorn subspecies and populations. This will help to understand their recent demographic history, the effects of range reduction on gene flow and genetic variation. To accomplish this goal, we compared genetic variation between Mexican and USA populations using the mitochondrial d-loop control region as a molecular marker. The majority of DNA samples from México that were obtained for these studies were extracted from horns, bone marrow, old tissue, hair, and feces, all of which were collected by non-invasive methods. Oligonucleotide primers designed to amplify the d-loop control region were used in PCR reactions to produce a 500 base pair product. The sequence from 93 individuals from México and USA was obtained including representatives of all five subspecies. We found 29 haplotypes, which indicates a high level of variation, suggesting that reported severe population bottlenecks during the last Century did not strongly reduce the genetic variability within the species. We have found a low level of genetic differentiation between the populations. The data that we obtain in this study shows signs of a rapid population explosion of the pronghorns populations, as a result of the extinction of many of their predators and competitors during the megafauna extinction, and the prairie expansion during the Holocene. The results obtained from this study will help to understand the recent evolutionary history of the pronghorn populations, and will be valuable for making management decisions designed to reestablish populations of the endangered subspecies in Mexico.
PROCEEDINGS PRONGHORN ANTELOPE WORKSHOP 19:106 Key words: Molecular genetics, subspecies, population biology, bottleneck, management, mitochondrial DNA.
________________________________________________________________ 19TH Biennial Pronghorn Antelope Workshop 107
HISTORY AND MANAGEMENT OF YELLOWSTONE NATIONAL PARK
PRONGHORN WENDY E. CLARK. Wildlife Biologist Yellowstone Center for Resources P.O. Box 168, Yellowstone National Park, WY 82190 Abstract: Unregulated commercial hunting outside the Yellowstone National Park (YNP) boundary was largely responsible for extirpating pronghorn from the area north of the park by the early 1920's and isolating the Yellowstone population at the upstream limit of its former distribution. Increased protection from poaching within the park, along with favorable climatic conditions and predator control actions allowed pronghorn and other ungulates to increase in number during the first half of the century. These increases resulted in an apparent reversal of National Park Service (NPS) management policy, which had stressed full preservation and protection of all ungulate species. Between the 1940's and the late 1960's, park managers, concerned about impacts of increasing ungulate numbers on habitat, attempted to maintain the pronghorn population between 125 and 150 animals by shooting and by trapping and transplantation. Pronghorn from Yellowstone were used to augment or re-establish decimated pronghorn populations in several western states. In 1968 the NPS again implemented a policy change, ceasing its program of aggressive population control, and allowing all wildlife populations to exist without human interference to the maximum extent possible. The Yellowstone pronghorn population at this time numbered less than 200 animals, and remained so until 1983 when it began to increase. After reaching a high of nearly 600 animals in 1991, the population has declined in recent years to around 200 pronghorn. Human activity, intraspecific competition, habitat changes, and predators have all been suggested as possible contributing factors to the recent decline. The NPS has recently initiated a cooperative research effort to examine the factors influencing pronghorn numbers. These studies are intended to form the beginning of a comprehensive evaluation of the factors influencing the Yellowstone pronghorn population and an estimation of the likelihood of persistence of the population. This information will also be used to review the potential effectiveness of various proposed management strategies.
PROCEEDINGS PRONGHORN ANTELOPE WORKSHOP 19:107

________________________________________________________________ 19TH Biennial Pronghorn Antelope Workshop 108
CAPTURE, HAND REARING AND CAPTIVE MANAGEMENT OF PENINSULAR PRONGHORN.
JORGE CANCINO. Centro de Investigaciones Biológicas del Noroeste. La Paz, 23000, Baja California Sur, Mexico. RAMÓN CASTELLANOS. Reserva de la Biosfera “El Vizcaíno”. Guerrero Negro, 23940, Baja California Sur, Mexico VICTOR SÁNCHEZ. Reserva de la Biosfera “El Vizcaíno”. Guerrero Negro, 23940, Baja California Sur, Mexico Abstract. Capture and hand rearing of peninsular pronghorn fawns was carried out early 1998 (2 males: 3 females), 1999 (3 males: 1 female), and 2000 (5 males: 2 females),. After these, captive management include since transfer of the first weaned youngsters, to care and to observe the animals, general complement feeding, coyote control, irrigation system, training some animals, and to capture wild adults. All these activities are developed in a large enclosure ranging 1,400x1,850m. There is a division with a double fence (wire netting and electric) and other single wire fences for pronghorn handling. The facilities includes a 405 m3 water storage, an observation tower and cabins. Some of the activities are described with detail. Nowadays there are 33 captive peninsular pronghorns: 18 males and 15 females. First captive births of peninsular pronghorn were early 2000, including triplets.
PROCEEDINGS PRONGHORN ANTELOPE WORKSHOP 19:108 Key words: Capture, hand rearing, captive management, peninsular pronghorn.
________________________________________________________________ 19TH Biennial Pronghorn Antelope Workshop 109
ALTERNATIVE CAPTURE TECHNIQUE FOR THE PENINSULAR
PRONGHORN. RAMÓN CASTELLANOS. Reserva de la Biosfera “El Vizcaíno”. Guerrero Negro, 23940, Baja California Sur, Mexico JORGE CANCINO. Centro de Investigaciones Biológicas del Noroeste. La Paz, 23000, Baja California Sur, Mexico. VICTOR SÁNCHEZ. Reserva de la Biosfera “El Vizcaíno”. Guerrero Negro, 23940, Baja California Sur, Mexico Abstract. Capture of wild peninsular pronghorn adults is described. The technique used was supported by a irrigation system, captive hand reared fawns and an observation tower. The main structure of the trap consists of a divided fence (1400x1850m) installed for capturing wild adults and captive reproduction. One side of this fence can be opened or closed as needed, in a mayor dimension than a door. A general diagram is included. There are two main “baits” used: a) Green vegetation yearlong promoted by the irrigation system, and b) the hand-reared captive animals. Other important element is the use of the tower to spot the entrance of wild pronghorn to the trap, and to coordinate the capture action. Obviously optic and radio equipment was unavoidable.
PROCEEDINGS PRONGHORN ANTELOPE WORKSHOP 19:109 Key words: Capture, fence, peninsular pronghorn, irrigation system.

________________________________________________________________ 19TH Biennial Pronghorn Antelope Workshop 110
REINTRODUCCIÓN Y MONITOREO DE BERRENDOS
EN EL ESTADO DE COAHUILA.
ENRIQUE GUADARRAMA, Asesorías Biológicas. A.C., Museo de la Fauna en Monterrey N. L. Abstract: Unidos para la Conservación A. C. (U.P.C.) inicia el Programa “El Retorno del Berrendo” en 1993, año en que inicia pláticas con el New México Department of Game & Fish para establecer un programa de colaboración internacional para reintroducir la especie al estado de Coahuila. Después de la evaluación de las áreas de captura y trasplante, se eligió el Valle Colombia, en el NW de Coahuila, que ocupa un área aproximada de 230,000 hectáreas y en el cual se estimó una superficie de pastizales para el manejo del Berrendo de 55,743 ha. En 1996 se realizó la primera traslocación de 65 Berrendos procedentes de Carrizoso, Nuevo México y se estableció un programa de monitoreo para observar su adaptación y distribución en el área de liberación. Debido al éxito de ésta, se realizó una segunda traslocación de 85 Berrendos. Actualmente se da seguimiento a los grupos de Berrendos establecidos dentro del Valle Colombia mediante monitoreos terrestres y aéreos para evaluar el éxito de las traslocaciones y el proceso de dispersión de algunos grupos fuera del Valle.
PROCEEDINGS PRONGHORN ANTELOPE WORKSHOP 19:110

________________________________________________________________ 19TH Biennial Pronghorn Antelope Workshop 111
“UNIDOS PARA LA CONSERVACIÓN” PRONGHORN RESCUE PROGRAM
IN THE STATES OF CHIHUAHUA AND COAHUILA. Carlos Manterola, Unidos para la Conservación A. C.
Abstract: Unidos para la Conservaci6n, A.C. (UPC), is a Mexican non-profit private association founded in August 7, 1992, with the goal to preserve Mexican natural resources, to assist and develop programs that would allow their continuity by applying an efficient financial and scientific structure, as well as it's promotion."The Return of the Pronghorn", is the name of UPC's program for the conservation of the pronghorn in Mexico. This program started giving support to other projects already existing such as the one in the state of Baja California Sur with the Centro de Investigaciones Biologicas del Noroeste and the Reserve of El Vizcaino; and the other in Sonora, with the Centro Ecologico de Sonora. In February 1996 and January 1998, with the support of the New Mexico Department of Game and Fish, UPC reintroduced this species to Coahuila with herds from the south of New Mexico. Since then this herd has been monitored by air and land. In collaboration with the UNAM and some landowners, during 1997, 1998 and 1999 air and land monitoring has been carried out in Chihuahua obtaining information of the status of the pronghorn populations and its habitat. We are also collaborating with the UNAM in the genetic study of the introduced animals and the pronghorns surviving in Chihuahua, Sonora and El Vizcaino in Baja California Sur. This study will let us establish new alternatives for the management of this species. All these actions have been carried out with the support of different institutions and companies.
PROCEEDINGS PRONGHORN ANTELOPE WORKSHOP 19:111
________________________________________________________________ 19TH Biennial Pronghorn Antelope Workshop 112
SONORAN PRONGHORN HOME RANGES AND HABITAT USE
JILL L. BRIGHT, Arizona Game and Fish Dept., 9140 E County 10 1/2 Street, Yuma, AZ 85365 JOHN J. HERVERT, Arizona Game and Fish Dept., 9140 E County 10 1/2 Street, Yuma, AZ 85365 LINDEN A. PIEST, Arizona Game and Fish Dept., 9140 E County 10 1/2 Street, Yuma, AZ 85365 MARK T. BROWN, Arizona Game and Fish Dept., 9140 E County 10 1/2 Street, Yuma, AZ 85365 ROBERT S. HENRY. Arizona Game and Fish Dept., 9140 E County 10 1/2 Street, Yuma, AZ 85365 Abstract: The current range of Sonoran pronghorn (Antilocapra americana sonoriensis) in the United States is limited to southwestern Arizona. Vegetation is described as either the Lower Colorado River Valley or Arizona Upland subdivisions of the Lower Sonoran Desert Life Zone (Brown 1982). We studied home ranges and habitat use of radio-collared Sonoran pronghorn from 1994 - 1999. Habitat was classified primarily by topographic features into 5 categories: flats, bajadas, hills, washes and other. Habitat associations of pronghorn were recorded on weekly aerial telemetry flights. We used estimates of the expected proportions of habitat types from Wright and DeVos's (1986) study in the same area, which were derived by plotting random points. Seasons were based on local temperature and precipitation patterns. Observed use was compared to expected use by seasons using chi-square tests. We also mapped the distribution of chain-fruit cholla (Opuntia fulgida) and compared use of these areas to areas lacking this species. The results of these analyses will be presented.
PROCEEDINGS PRONGHORN ANTELOPE WORKSHOP 19:112 Key words: Sonoran pronghorn, habitat, bajada, chain-fruit cholla, home range.
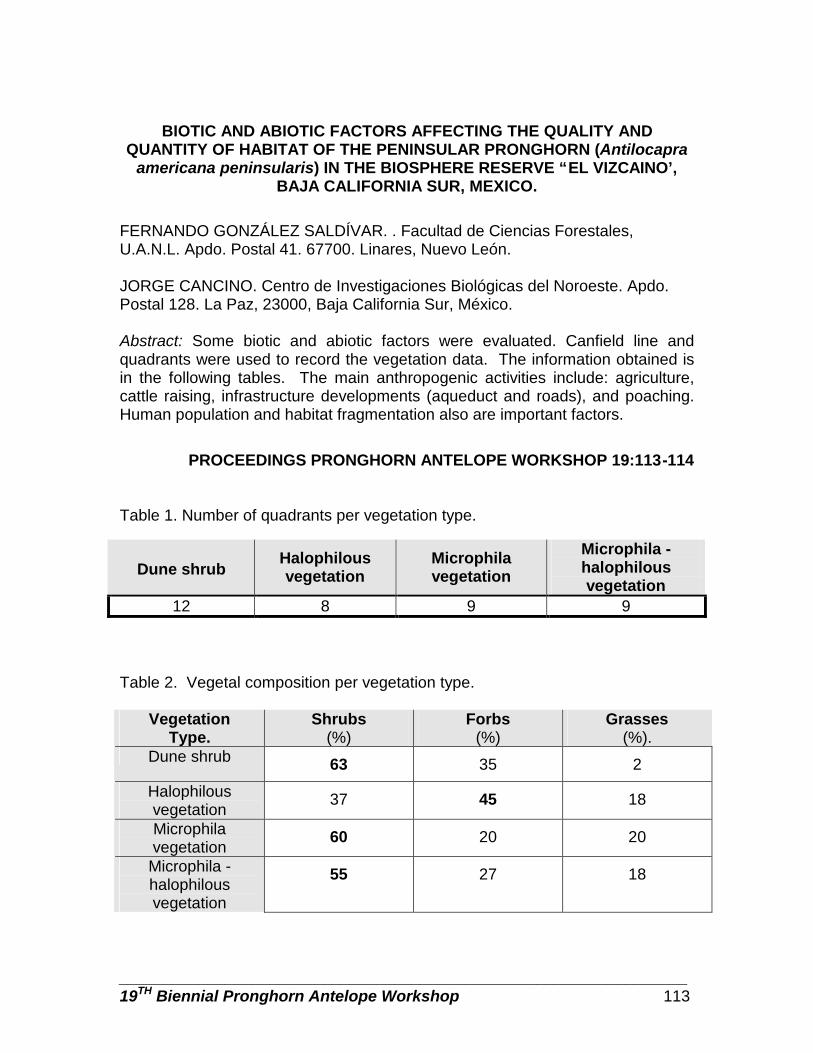
________________________________________________________________ 19TH Biennial Pronghorn Antelope Workshop 113
BIOTIC AND ABIOTIC FACTORS AFFECTING THE QUALITY AND QUANTITY OF HABITAT OF THE PENINSULAR PRONGHORN (Antilocapra
americana peninsularis) IN THE BIOSPHERE RESERVE “EL VIZCAINO’, BAJA CALIFORNIA SUR, MEXICO.
FERNANDO GONZÁLEZ SALDÍVAR. . Facultad de Ciencias Forestales, U.A.N.L. Apdo. Postal 41. 67700. Linares, Nuevo León.
JORGE CANCINO. Centro de Investigaciones Biológicas del Noroeste. Apdo. Postal 128. La Paz, 23000, Baja California Sur, México. Abstract: Some biotic and abiotic factors were evaluated. Canfield line and quadrants were used to record the vegetation data. The information obtained is in the following tables. The main anthropogenic activities include: agriculture, cattle raising, infrastructure developments (aqueduct and roads), and poaching. Human population and habitat fragmentation also are important factors.
PROCEEDINGS PRONGHORN ANTELOPE WORKSHOP 19:113-114 Table 1. Number of quadrants per vegetation type.
Dune shrub Halophilous vegetation
Microphila vegetation
Microphila - halophilous vegetation
12 8 9 9 Table 2. Vegetal composition per vegetation type.
Vegetation Type.
Shrubs (%)
Forbs (%)
Grasses (%).
Dune shrub 63 35 2
Halophilous vegetation
37 45 18
Microphila vegetation
60 20 20
Microphila - halophilous vegetation
55 27 18
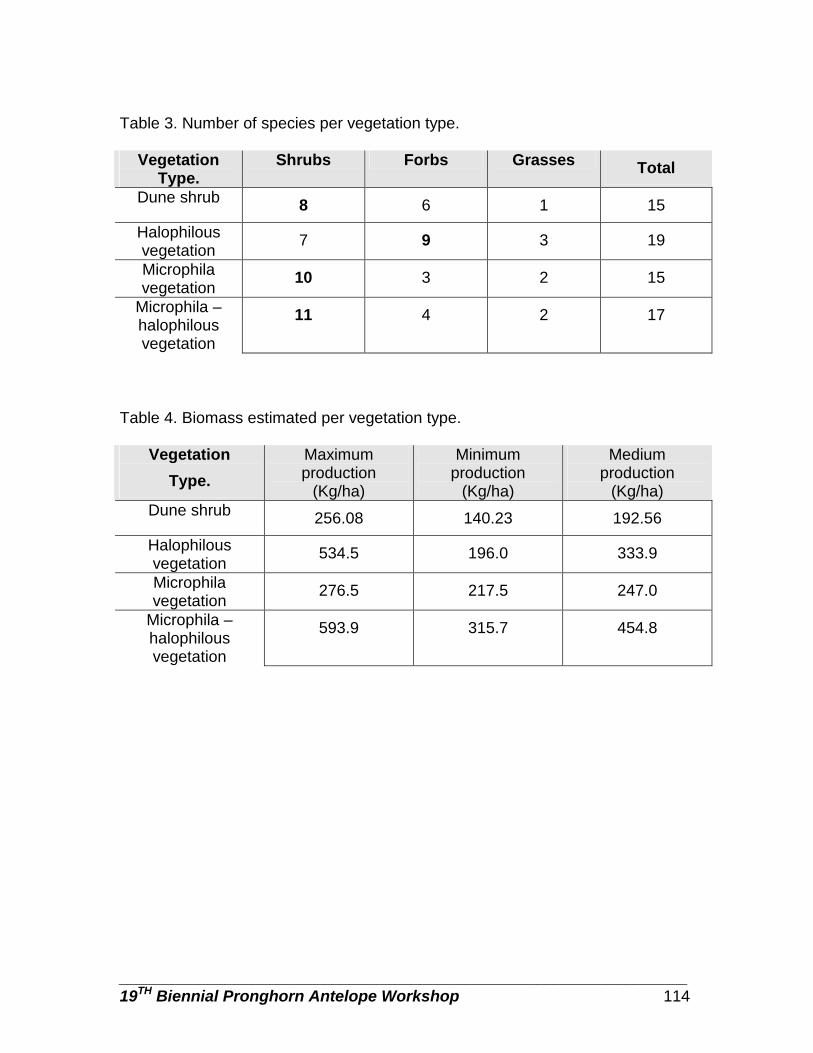
________________________________________________________________ 19TH Biennial Pronghorn Antelope Workshop 114
Table 3. Number of species per vegetation type.
Vegetation Type.
Shrubs Forbs Grasses Total
Dune shrub 8 6 1 15
Halophilous vegetation
7 9 3 19
Microphila vegetation
10 3 2 15
Microphila – halophilous vegetation
11 4 2 17
Table 4. Biomass estimated per vegetation type.
Vegetation
Type.
Maximum production
(Kg/ha)
Minimum production
(Kg/ha)
Medium production
(Kg/ha) Dune shrub 256.08 140.23 192.56
Halophilous vegetation
534.5 196.0 333.9
Microphila vegetation
276.5 217.5 247.0
Microphila – halophilous vegetation
593.9 315.7 454.8
________________________________________________________________ 19TH Biennial Pronghorn Antelope Workshop 115
EFFECT OF BIRTH DATE ON PREDATION OF NEONATAL PRONGHORN IN
THE NORTHERN GREAT BASIN. MICHAEL A. GREGG, U.S. Fish and Wildlife Service, Sheldon National Wildlife Refuge Complex, Biological Investigations Unit, P.O. Box 111, Lakeview, OR 97630, USA MARTIN BRAY, U.S. Fish and Wildlife Service, Hart Mountain National Antelope Refuge, P.O. Box 111, Lakeview, OR 97630, USA KEVIN M. KILBRIDE, U.S. Fish and Wildlife Service, Vancover Field Station, 9317 Hwy 99, Suite D, Vancouver, WA 98665 USA MICHAEL R. DUNBAR, U.S. Fish and Wildlife Service, Sheldon National Wildlife Refuge Complex, Biological Investigations Unit, P.O. Box 111, Lakeview, OR 97630, USA Abstract: The northern Great Basin represents an important area of the pronghorn (Antilocapra americana) range. However, limited information exists about factors influencing fawn survival. Birth date can affect fawn survival of other ungulates, but it has not been examined in pronghorn. We investigated causes and timing of fawn mortality and the effect of birth date on survival at Hart Mountain National Antelope Refuge in southeastern Oregon during 1996-99. One hundred forty-nine fawns (<1 to 7 days old at capture) were marked and monitored from mid-May to mid-July during the 4-year study. We estimated survival of marked fawns with the Kaplan-Meier estimator modified for staggered entry and used the Weibull survival model to identify factors related to fawn mortality. Eighty-six percent (128/149) of the marked fawns died during the monitoring period. Average age at death was 7.3 days and 124 (97%) of the fawns that died were <21 days old. Predation accounted for 82% (105/128) of the fawn deaths. Coyote (Canis latrans) predation was the greatest single cause of mortality each year. Disease and starvation were minor factors and accounted for only 6 deaths. No mortalities attributed to exposure were diagnosed during the 4-year study. Female fawns lived longer than male fawns (P = 0.048). Birth date affected fawn survival where fawns born during the peak parturition period lived longer than those born during the non-peak period (P = 0.0001). Of 21 surviving fawns, 17 (81%) had birth dates during peak parturition. Results suggest that birth synchrony in pronghorn may be an important factor in fawn survivability.
PROCEEDINGS PRONGHORN ANTELOPE WORKSHOP 19:115 Key words: birth date, birth synchrony, coyote, fawn, Great Basin, mortality, predation, pronghorn, sex, survival.
________________________________________________________________ 19TH Biennial Pronghorn Antelope Workshop 116
EVALUATION OF AERIAL LINE TRANSECT FOR ESTIMATING
PRONGHORN POPULATIONS IN OREGON.
DONALD G. WHITTAKER. Oregon Department of Fish and Wildlife, 2501 SW First Avenue PO Box 59, Portland, OR 97207, USA.
WALKER A VAN DYKE. Oregon Department of Fish and Wildlife, 3814 Clark Blvd., Ontario, OR 97914, USA.
STUART L. LOVE. Oregon Department of Fish and Wildlife, 3814 Clark Blvd., Ontario, OR 97914, USA.
ABSTRACT: We evaluated the use of Aerial Line Transect, Wyoming method, for estimating pronghorn antelope abundance in Oregon. Surveys were conducted in 2 Oregon big game units during May 1998 and 1 unit during May 1999. Data were collected according to protocols developed by Wyoming Game and Fish (Guenzel 1997) and analyzed using DISTANCE (Buckland et al. 1993). We found this technique provided reasonable estimates of population size for the density range found in Oregon, which is much lower than found in other states already utilizing the technique. However, confidence intervals around estimates were larger than desired. In addition, application in lower density areas was more expensive compared to traditional survey methods because additional effort was required to obtain adequate sample size for desired precision estimates. Comparison with historic trend counts and management implications will be discussed.
PROCEEDINGS PRONGHORN ANTELOPE WORKSHOP 19:116 Key words: aerial transect, Antilocapra americana, low density, Oregon, pronghorn, survey
________________________________________________________________ 19TH Biennial Pronghorn Antelope Workshop 117
MONITORING A PRONGHORN (Antilocapra americana mexicana) POPULATION REINTRODUCED TO THE NORTHEASTERN OF MEXICO
E. PAOLA MIRANDA ALMAZÁN. Facultad de Ciencias Forestales, U.A.N.L. Apdo. Postal 41. 67700. Linares, Nuevo León. ALFONSO MARTÍNEZ MUÑOZ. Facultad de Ciencias Forestales, U.A.N.L. Apdo. Postal 41. 67700. Linares, Nuevo León.
Abstract: The pronghorn (Antilocarpra americana mexicana), an endemic ruminant species of North America is classified as an endangered species. This study covering three years (1995-1998) was conducted to evaluate the factors determining the success of reintroduction of pronghorn in the Mexican State of Coahuila. Vegetation characteristics, botanical composition of the pronghorn diet and birth and mortality rates were monitored. One hundred and seventeen vegetation species belonging to 32 different species were identified. Greatest diversity was obtained in the natural grass community (0.77), followed by halophyte grass community (0.74) and rosetophyll shrubs (0.53). Fifty-nine vegetation species were identified in the pronghorn diet and the poisonous plants: Solanum rostratum and Solanum eleagnifolium were determined in the pronghorn diet all-year round, though percentages consumed varied with season (0.96 % in wet season versus 11.2 % in dry season). Of the total diet consumed by the pronghorns, forbs ranked highest (75 %) while grasses and shrubs were eaten in almost similar quantities (12.5 % of each). Births averaged 0.17 ± 0.075 and 4 and 3 deaths were recorded in 1996 and 1998, respectively. Competition with cattle for grazing would occur under drought conditions. It is concluded that the pronghorn will continue to be endangered despite these translocation programmes. Further studies to evaluate supplementation strategies during critical times, to promote forb development and the dynamics of interaction with other ruminant animal species in the same rangeland, are necessary
PROCEEDINGS PRONGHORN ANTELOPE WORKSHOP 19:117 Key words: Diet composition, habitat condition, pronghorn, translocation

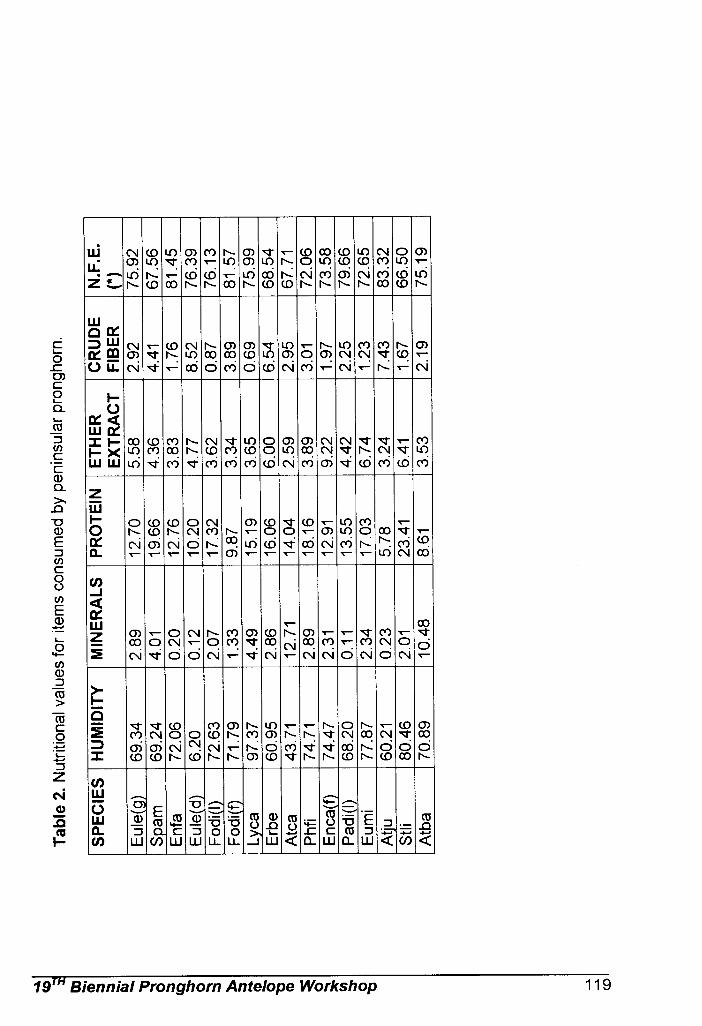
________________________________________________________________ 19TH Biennial Pronghorn Antelope Workshop 120
PROGRAMA DE CONSERVACIÓN Y APROVECHAMIENTO
DEL BERRENDO EN MÉXICO. DIRECCIÓN GENERAL DE VIDA SILVESTRE. Av. Revolución 1425, Col Tlacopac, Del. Alvaro Obregón, México, D.F. SUBCOMITE TECNICO CONSULTIVO PARA LA CONSERVACION, MANEJO Y APROVECHAMIENTO SUSTENTABLE DEL BERRENDO EN MEXICO. Av. Sauzales # 44. Col. Granjas Coapa. México, 14330, D.F. This project contains goals, objectives and actions focused to resolve the pronghorn situation in Mexico, using protection, reproduction, recovery strategies, and reintroduction in potential areas. Each action or strategy will depend on the local and regional characterísts and problems, and should consider the social and economic development, the subspecies biological and ecological characteristics, and the factibility of national and international agreements which should involve the several social sectors (e.g. academic, private initiative, users and non guvernamental organitations), to search viable conservation alternatives, and in its opportunity, the sustainable use. Este proyecto plantea una serie de metas, objetivos y acciones encaminadas a resolver la problemática del berrendo en México, a través de una estrategia de protección, reproducción, recuperación y reintroducción en áreas potenciales. Las acciones para el desarrollo de esta estrategia dependerán de las características y problemática local y regional, y deberán considerar el desarrollo socioeconómico, las características biológicas y ecológicas de cada subespecie, y la creación de convenios nacionales e internacionales con la participación de diferentes sectores de la sociedad (e.g. académico, particulares, usuarios e instituciones no gubernamentales), para la búsqueda de alternativas viables de conservación y, en su momento, aprovechamiento sustentable.
PROCEEDINGS PRONGHORN ANTELOPE WORKSHOP 19:120 Notes: - Other participants are: Africam Safari, Bioparque Estrella, Environmental
Flying Services, Espacios Naturales y Desarrollos Sustentables, Fish and Wildlife Services, Fondo Mexicano para la Conservación de la Naturaleza, Los Angeles Zoo, and Wyoming Fish and Game Department.
- Current web page is: www.berrendo.org.mx
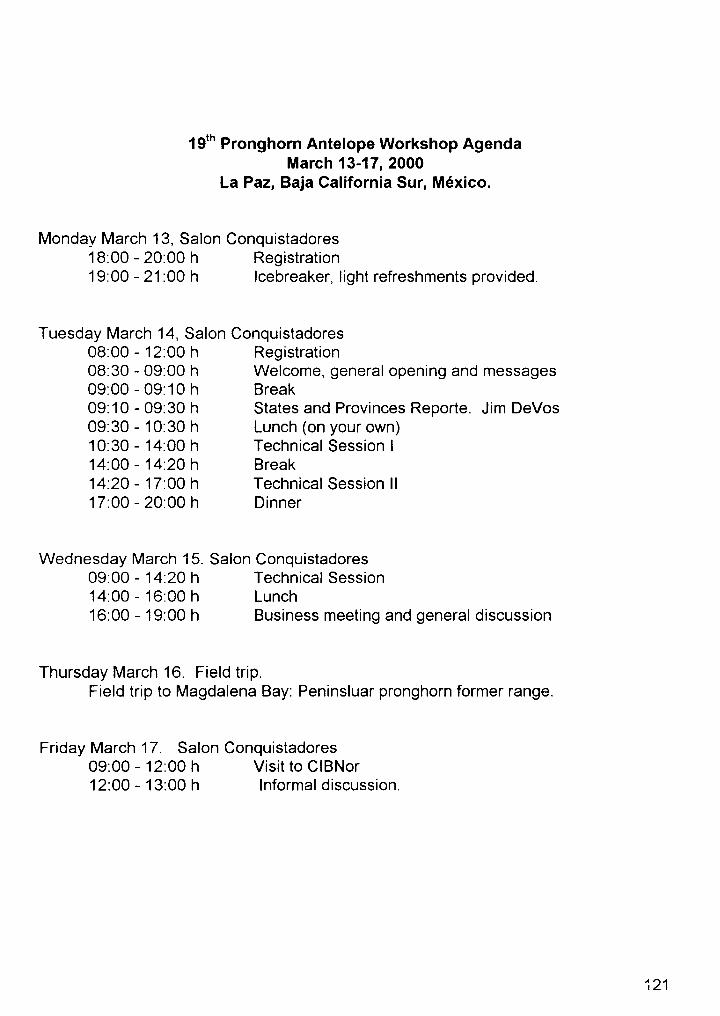

________________________________________________________________ 19TH Biennial Pronghorn Antelope Workshop 122
WORKSHOP AGENDA
19th Biennial Pronghorn Antelope Workshop
March 13-17, 2000. Los Arcos Hotel.
La Paz, B.C.S., México.
Monday March 13, Conquistadores Room.
18:00 - 20:00 h Registration. Merchandise sales. 19:00 - 21:00 h Icebreaker, light refreshments provided.
Tuesday March 14, Conquistadores Room. 08:00 - 12:00 h Registration. 09:00 - 09:30 h Welcome, general opening and messages. Dr. Mario Martínez García, Director General. CIBNor, S.C. Lic. Enrique Provencio. President. Instituto Nacional de Ecología. 09:30 - 09:40 h Cofee break. 09:40 - States and Provinces Report. Jim deVos. - 12:40 h Technical Session I: Nutrition and Genetic. 12:40 - 14:00 h Lunch (on your own). 14:00 - 17:00 h Technical Session II: Management. Poster presentation. 18:30 - 20:00 h Dinner (included in your registration). Wednesday March 15.
09:00 - 12:00 h Technical Session III: Habitat and Miscellaneous. 12:00 - 13:00 h Lunch (on your own).
13:00 - 16:00 h Business meeting and general discussion. Thursday March 16. Field trip.
Field trip to Magdalena Bay: Peninsluar pronghorn former range. Friday March 17.
09:00 Visit to CIBNor
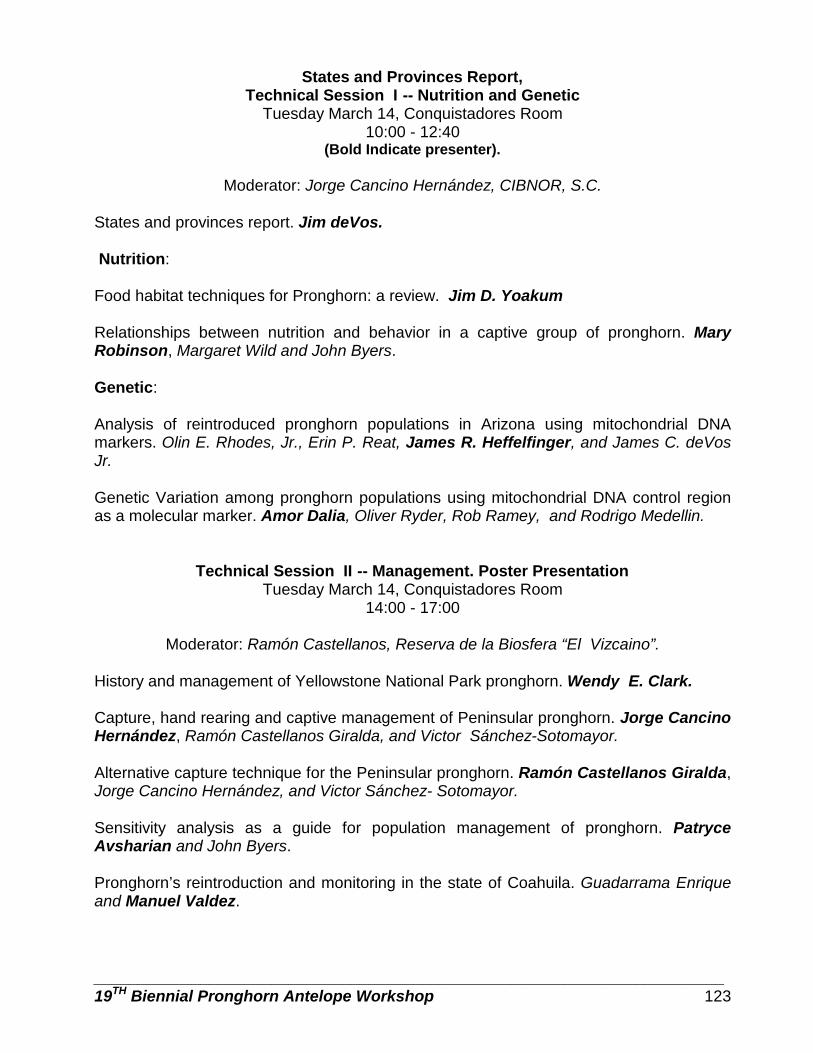
_______________________________________________________________________ 19TH Biennial Pronghorn Antelope Workshop 123
States and Provinces Report, Technical Session I -- Nutrition and Genetic
Tuesday March 14, Conquistadores Room 10:00 - 12:40
(Bold Indicate presenter).
Moderator: Jorge Cancino Hernández, CIBNOR, S.C. States and provinces report. Jim deVos. Nutrition: Food habitat techniques for Pronghorn: a review. Jim D. Yoakum Relationships between nutrition and behavior in a captive group of pronghorn. Mary Robinson, Margaret Wild and John Byers. Genetic: Analysis of reintroduced pronghorn populations in Arizona using mitochondrial DNA markers. Olin E. Rhodes, Jr., Erin P. Reat, James R. Heffelfinger, and James C. deVos Jr. Genetic Variation among pronghorn populations using mitochondrial DNA control region as a molecular marker. Amor Dalia, Oliver Ryder, Rob Ramey, and Rodrigo Medellin.
Technical Session II -- Management. Poster Presentation Tuesday March 14, Conquistadores Room
14:00 - 17:00
Moderator: Ramón Castellanos, Reserva de la Biosfera “El Vizcaino”. History and management of Yellowstone National Park pronghorn. Wendy E. Clark. Capture, hand rearing and captive management of Peninsular pronghorn. Jorge Cancino Hernández, Ramón Castellanos Giralda, and Victor Sánchez-Sotomayor. Alternative capture technique for the Peninsular pronghorn. Ramón Castellanos Giralda, Jorge Cancino Hernández, and Victor Sánchez- Sotomayor. Sensitivity analysis as a guide for population management of pronghorn. Patryce Avsharian and John Byers. Pronghorn’s reintroduction and monitoring in the state of Coahuila. Guadarrama Enrique and Manuel Valdez.

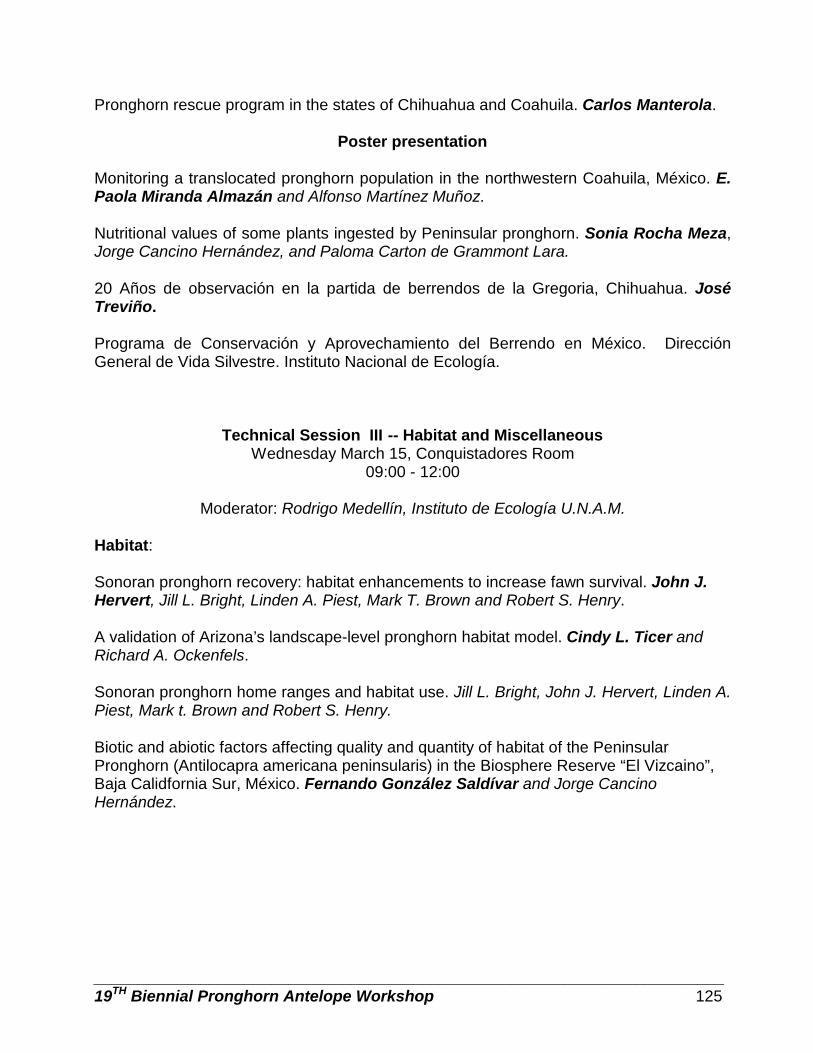
_______________________________________________________________________ 19TH Biennial Pronghorn Antelope Workshop 125
Pronghorn rescue program in the states of Chihuahua and Coahuila. Carlos Manterola.
Poster presentation Monitoring a translocated pronghorn population in the northwestern Coahuila, México. E. Paola Miranda Almazán and Alfonso Martínez Muñoz. Nutritional values of some plants ingested by Peninsular pronghorn. Sonia Rocha Meza, Jorge Cancino Hernández, and Paloma Carton de Grammont Lara. 20 Años de observación en la partida de berrendos de la Gregoria, Chihuahua. José Treviño. Programa de Conservación y Aprovechamiento del Berrendo en México. Dirección General de Vida Silvestre. Instituto Nacional de Ecología.
Technical Session III -- Habitat and Miscellaneous Wednesday March 15, Conquistadores Room
09:00 - 12:00
Moderator: Rodrigo Medellín, Instituto de Ecología U.N.A.M. Habitat: Sonoran pronghorn recovery: habitat enhancements to increase fawn survival. John J. Hervert, Jill L. Bright, Linden A. Piest, Mark T. Brown and Robert S. Henry. A validation of Arizona’s landscape-level pronghorn habitat model. Cindy L. Ticer and Richard A. Ockenfels. Sonoran pronghorn home ranges and habitat use. Jill L. Bright, John J. Hervert, Linden A. Piest, Mark t. Brown and Robert S. Henry. Biotic and abiotic factors affecting quality and quantity of habitat of the Peninsular Pronghorn (Antilocapra americana peninsularis) in the Biosphere Reserve “El Vizcaino”, Baja Calidfornia Sur, México. Fernando González Saldívar and Jorge Cancino Hernández.
_______________________________________________________________________ 19TH Biennial Pronghorn Antelope Workshop 126
Miscellaneous: Effect of birth date on survival of neonatal pronghorn in the northern Great Basin. Michael A. Gregg, Martin Bray, Kevin M. Kilbride, and Michael R. Dunbar. Pronghorn populations in Chihuahua, determined by aerial censuses. Azuara Danae, Rodrigo Medellín and Carlos Manterola. Evaluation of aerial line transect for estimating pronghorn populations in Oregon. Donald G. Whittaker, Walter A Van Dyke, and Stuart L. Love.

_______________________________________________________________________ 19TH Biennial Pronghorn Antelope Workshop 127
BUSINESS MEETING AGENDA
19th BIENNIAL PRONGHORN ANTELOPE WORKSHOP
Old business
1. IUCN update. 2. National Pronghorn Antelope Interpretative Center. 3. Bylaw Changes. 4. Management Guidelines on Internet and BLM Intranet. 5. Spanish Version Management Guidelines. 6. Proceedings from previous PAW's (17th and 18th).
New business 7. Biennial Pronghorn Workshop Award(s). 8. Biennial Antelope States Workshop page. 9. Peninsular pronghorn workshop. 10. New issues. 11. Date and place for next PAW 12. 19th Biennial Pronghorn Workshop Reconnaissances. 13. General topics.
128
BUSINESS MEETING 19th BIENNIAL PRONGHORN ANTELOPE WORKSHOP
LA PAZ, BAJA CALIFORNIA SUR, MEXICO
MARCH 15, 2000
The business meeting was called to order by Chair Jorge Cancino at 13:00hrs. Meeting minutes were taken by Lorie Mc Cracken and Ramón Castellanos. Delegates were present from Arizona, Baja California Sur, Colorado, Chihuahua, Idaho, Nebraska, North Dakota, Oregon, Utah, and Wyoming. Also present were representatives from U.S.A. and Mexican federal agencies, from non-governmental organizations, and Mexican and U.S.A. universities. A complete list of participants and their affiliation is in the Attendance register on pages iv-vi of this Proceedings.
Old business
1. IUCN update. Kim Brinkley from the Los Angeles Zoo indicated that a studbook for
pronghorn is proposed. She also mentioned that the TAG (Taxonomic Advisory Group) recommended that a pronghorn SSP (Survival Species Plan) be developed. The discussion pointed out that SSPs are management and breeding cooperative programs including all the captive animals as a population. These programs are coordinated by AAZA (American Association of Zoos and Aquariums) to enhance management (genetics and demographics) of small captive populations.
Jim deVos from Arizona asked for more information about the
recommendation and asked about the benefits of this approach. Kim Brinkley and Jeff Holland (L.A.Zoo) explained that it is specific to
captive herd conservation and helps focus funds, scientific support, and collaborative work with local or federal agencies on these animals. No action taken. 2. National Pronghorn Antelope Interpretative Center.
Tom Pojar (Colorado) and Robb Hitchcock (North American Pronghorn Foundation) explained the proposal to establish a National Pronghorn Antelope Interpretative Center. The general objetive is to increase awareness of pronghorn. There was mention about the funds search for this year and about the support the Foundation offers for different pronghorn projects. No action taken.
129
3. Bylaw Changes. Richard Ockenfels (Arizona) commented about the previous Business Meeting review of the Bylaws and the changes that were made. He pointed out that the new Bylaws start on the page 111 of the 18th P.A.W. Proceedings and asked for comments.
Rodrigo Medellín (from U.N.A.M.) remarked that México is listed as another state and would have only one vote in this manner. Richard clarified that México has 4 votes; one for each of the states with pronghorn. There was general discussion about voting rights and it was pointed out that representatives for other categories (universities or federal agencies) lacked voting ability. Richard suggested to put off the voting, but Jim deVos (from Arizona) pointed out that the Pronghorn Workshop is sanctioned by the Western Association of Fish and Wildlife Agencies (WAFWA) and that only member states-provinces are afforded voting rights. No action taken. 4. Management Guidelines on Internet and BLM Intranet.
Richard Ockenfels presented the 1998 Pronghorn Management Guidelines and ask if it could be included in the NAPF website. The objective is to be available for more people. The attendees supported the proposal and added that this document should be readily available to the public. Richard will make sure that the document is provided to any appropriate website (for example, federal or state pages) when requested to do so. 5. Spanish Version of the Management Guidelines.
Jorge Cancino commented about the utility of this document to managers in Mexico. He reports that translation to Spanish is progressing (about 60 % complete) and that the Subcomité Técnico Consultivo Nacional para el Manejo, Conservación y Aprovechamiento Sustentable del Berrendo (the National Subcommittee for the Conservation of Pronghorn) will print the translation. Jorge also pointed out the necessity of some modifications to the guidelines to adapt them to the conditioins in Mexico. No action taken. 6. Proceedings from previous PAW's (17th and 18th).
Jorge Cancino and Richard Ockenfels presented the 18th Pronghorn Antelope Workshop Proceedings. They commented that John Fisher (from California) is in charge of the 17th Pronghorn Antelope Workshop Proceedings and that they were expected soon. Bylaws states that chairperson has to prepare and distribute the proceedings of the Workshop for which they are responsible. Extra copies of the 18th Pronghorn Antelope Workshop Proceedings are available from Richard Ockenfels.
Richard mentioned that he and some people from the U. S. Fish and
Wildlife Service have the complete set of the Proceedings and propose a data base to be available for those people who would benefit from access to these documents.
It is recommendable that the Proceedings of the 19th Pronghorn
Workshop should be published in a year. No action taken.
130
New business 7. Biennial Pronghorn Workshop Award(s).
Item proposed by Jim deVos. He suggets the creation of a Pronghorn Workshop Awards Committee. The idea is to create a mechanism to recognize people who have made significant contributions to pronghorn or pronghorn habitat conservation, management, and research. It was decided that the current chair of the Workshop would appoint such a committee. This will be enacted at the next Pronghorn Workshop 8. Biennial Antelope States Workshop page.
There was some discussion on the need to develop a website for the Biennial Pronghorn Antelope Workshop. After considerable discussion, it was decided that this was not practical at this time, and that notice of the workshop would be included in the North American Pronghorn Foundation’s website. The Chair has the responsibility to pass the information on to NAPF. Richard Ockenfels asked if the Foundation had the resourses to improve their webpage, and Robb Hitchcock (President) answered that they did and were working on it.
9. Peninsular pronghorn workshop.
Jorge Cancino led a discussion about the need for a special workshop to assist in developing a Recovery Plan for the peninsular subspecies. Jorge said he will continue to work to develop this workshop at some time in the future. 10. New issues.
Ramón Castellanos (from El Vizcaino Biosphere Reserve, Baja California Sur) asked about the possibilities of obtaining an airplane, like a Cessna 182, in order to conduct surveys and to monitor the different pronghorn populations that inhabit northern Mexico. Jim deVos indicated that on occaison that narcotics agencies from the States seize aircraft that are transporting narcotics. It may be possible that one of these aircraft could be made available for this purpose and suggested that someone from a Mexican federal agency (possibly PROFEPA) could explore the opportunity to have one of these aircraft made available. Robb Hitchcock recommended that someone should contact the different airplane manufacturers to see if it was possible to make a plane available through a donation. He suggested that a joint request (U.S. and Mexico) be prepared as this would show international cooperation for work with endangered species. 11. Date and place for next PAW
Jim deVos helped Jorge Cancino with this matter. Jim commented that the last 3 meetings were in south, and that if a northern state would host the meeting, it would facilitate participation from biologists in the northern states and provinces. Jim asked if there was a volunteer to host the 20th Biennial Pronghorn Workshop. He asked if Don Whittaker from Oregon and Jeff Abegglen from Nebraska were interested in being the host.
131
Don Whittaker explained that his agency is in charge of another workshop (Deer-Elk Workshop) but he would ask his Director. Jeff Abegglen will also see if his agency would be willing to host this workshop.
Jim deVos suggested that the decision should be postponed until we
hear from both of these states. 12. 19th Biennial Pronghorn Workshop Acknowledgements.
José Maria Reyes (from Mexico City, Dirección General de Vida Silvestre) passed out acknowledgement to attendees. 13. General topics.
Don Whittaker ask about the deadline for the complete manuscripts for the proceedings. Jorge Cancino answered that an announcement will be sent, but about 5 months from the date of the meeting was the timeframe the reviewers suggested. Note: After the meeting, Chair Jorge Cancino informally passed the English version of the Pronghorn National Program poster to Robb Hitchcock for use at the National Pronghorn Antelope Interpretative Center.
Submitted by Lorie Mc Cracken, Pronatura, March, 2000 Edited by Jorge Cancino, June 2001