process cleanliness control in battery cell manufacturing · pdf file1 process cleanliness...
TRANSCRIPT

EUROPEAN LI-ION BATTERY ADVANCED
MANUFACTURING FOR ELECTRIC VEHICLES
Process cleanliness control in
battery cell manufacturing
A Way to Improve Increase Lithium-Ion Battery Quality, Production Yield and Safety
1
Process cleanliness control in
battery cell manufacturing
A way to increase Lithium-Ion battery quality, yield, safety…
During the production of Li-ion batteries, numerous parameters are responsible for the
contamination of the battery elements. Those contaminants are not clearly identified and their
impact on the battery performance is not known. However, decreasing scrap rates, improving
battery yield, safety and performance represents some key parameters to optimize production.
The goal is to detect the contamination occurring during the production of the battery and
determine if there is an effect on performance. A partnership between SAFT and Entegris was
developed to achieve this objective. The association between a high level battery manufacturer
and an expert in contamination control solutions enables to bring more data on critical
contaminants at the manufacturing stage and their impact on the battery.
In the ELIBAMA project, several performance indicators were identified through the topic of
clean manufacturing:
Reduction of the cell scrap rate,
Reduction of particle contamination during manufacturing,
Improvement of the ISO class of the dry room at SAFT Bordeaux.
State of the art
In the battery industry, there is no open discussion in the industry about the search of
contaminants due to a poor knowledge of the identification of critical contaminants during the
production associated to a large variety of materials used at the cathode and a lack of standards
for this industry. Manufacturing plants developed their own knowledge on process and return
on experience. Effort has not yet been made to move toward contamination control solutions
such as in the semi-conductor industry for example. In the semi-conductor industry, the
production of micro chip is composed of several hundred process steps; each step is carefully
monitored and controlled to ensure the wafer surfaces are contamination-free in order to reach
a maximum yield; cost reduction drives this industry. A clean production lays on various
parameters such as good housekeeping (FIFO, tidy up…), input substitution (introduction of less
toxic material, renewable materials…), better process control (procedure, equipment
instructions…), equipment modification (run the process at higher efficiency), technology
change.

2
In the battery industry, all contaminants do not have to be removed because they are not all
critical so a selection has to be done. Many efforts have been made by the scientific community
to understand the nature and sources of battery failure; it is an indirect way to track the critical
contamination that will affect the performance resulting to battery waste. Among the
contaminants that are known, we can classify them in 2 large categories: ionic contamination
and particulate contamination.
- Particulate contamination: this is mostly represented by the metallic particles
which were well known for some time as harmful contaminants. In 1991, Sony is the first
manufacturer to report metallic contamination attributed to the welding step; they observed a
large amount of Ni, Cu and Fe that created battery safety issue and resulted into a massive recall
and battery loss [1]. Other manufacturers also claim some contamination problem during
production [2]. Metallic particles are active materials and can create self discharge or other
faradaic reactions (especially at the cathode) compared to non metallic particles that are not
reactive to the potential and will be less harmful. Moreover they are quite hard and are well
known to generate short circuits either when enrolled between electrodes and separator or
generated by the process (welding, contact of materials with stainless steel rolls). In this case,
particles have to be controlled. However, the solutions implemented are not well described and
depend on various parameters such as process, materials…
- Ionic contamination: the main contaminant is moisture. This factor probably
remains the most studied one because it has a detrimental effect on the battery performance.
H2O is affecting the ageing of materials and is generating HF in the electrolyte. HF is a common
source of contamination described in the literature for many years [3]. H2O reacts with LiPF6
salt in electrolyte according to the following equations which represent the hydrolysis of LiPF6
Equations 1 to 3 are linked to the hydrolysis of LiPF6 (eq. 1,2,3):
LiPF6 + H2O → LiF + 2HF + POF3 (1)
POF3 + H2O → POF2(OH) + HF (2)
POF2(OH) + H2O → POF(OH)2 + HF (3)
Several papers reported the correlation between HF generation during battery cycling with
capacitance fading either at the positive or negative electrodes [4,5]. The nature of the fading
depends on the nature of the materials. In the case of positive electrode, dissolution of active
material by HF occurs and a more pronounced performance degradation is observed.
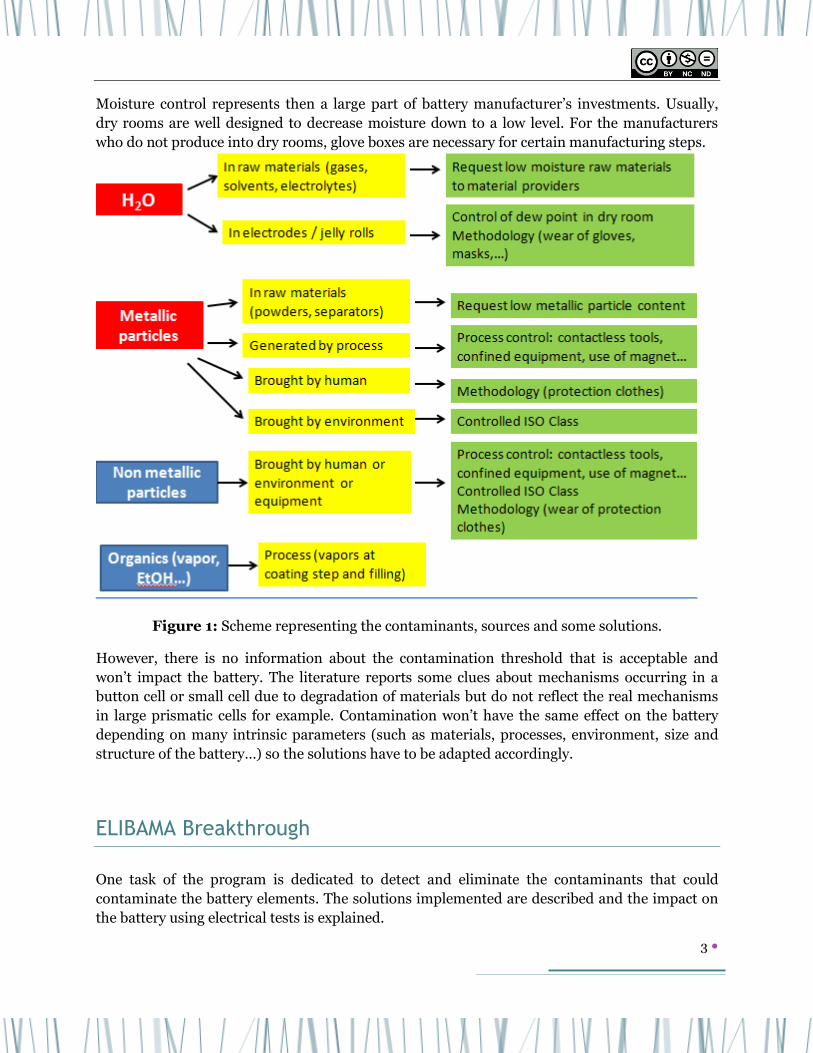
Contamination in the battery industry is not well known even if some efforts and attempts have
been developed to limit it through numerous methods and techniques. Some examples are listed
in the scheme below (Figure 1). The parameters in the red boxes are the most critical. The
yellow box tells where the contamination could be found while the green boxes are some
examples of solutions. The sources of contamination and their solutions depend on the
manufacturing plants.
3
Moisture control represents then a large part of battery manufacturer’s investments. Usually,
dry rooms are well designed to decrease moisture down to a low level. For the manufacturers
who do not produce into dry rooms, glove boxes are necessary for certain manufacturing steps.
Figure 1: Scheme representing the contaminants, sources and some solutions.
However, there is no information about the contamination threshold that is acceptable and
won’t impact the battery. The literature reports some clues about mechanisms occurring in a
button cell or small cell due to degradation of materials but do not reflect the real mechanisms
in large prismatic cells for example. Contamination won’t have the same effect on the battery
depending on many intrinsic parameters (such as materials, processes, environment, size and
structure of the battery…) so the solutions have to be adapted accordingly.
ELIBAMA Breakthrough
One task of the program is dedicated to detect and eliminate the contaminants that could
contaminate the battery elements. The solutions implemented are described and the impact on
the battery using electrical tests is explained.

4
a. Audit of manufacturing plants To control the Process Cleanliness during cell manufacturing, SAFT and Entegris used
the SAFT Quality System (reasoning and tools) which are commonly used in many industries. A
general approach and a methodology have been developed between the 2 partners to detect the
most critical sources of contamination, whatever the technologies and processes being used.
During one year, the methodology has been tested to define if the goal was achieved; as this was
proven to be successful, the methodology has been also applied to the CEA pilot line.
One of the tools used is the Ishikawa diagram represented in Figure 2. The parameters
that could bring contamination are listed in Figure 2 and classified in different factors (man,
machine, media, method, materials, and measurement).
Figure 2: Ishikawa diagram: example of the potential contaminants listed by process.
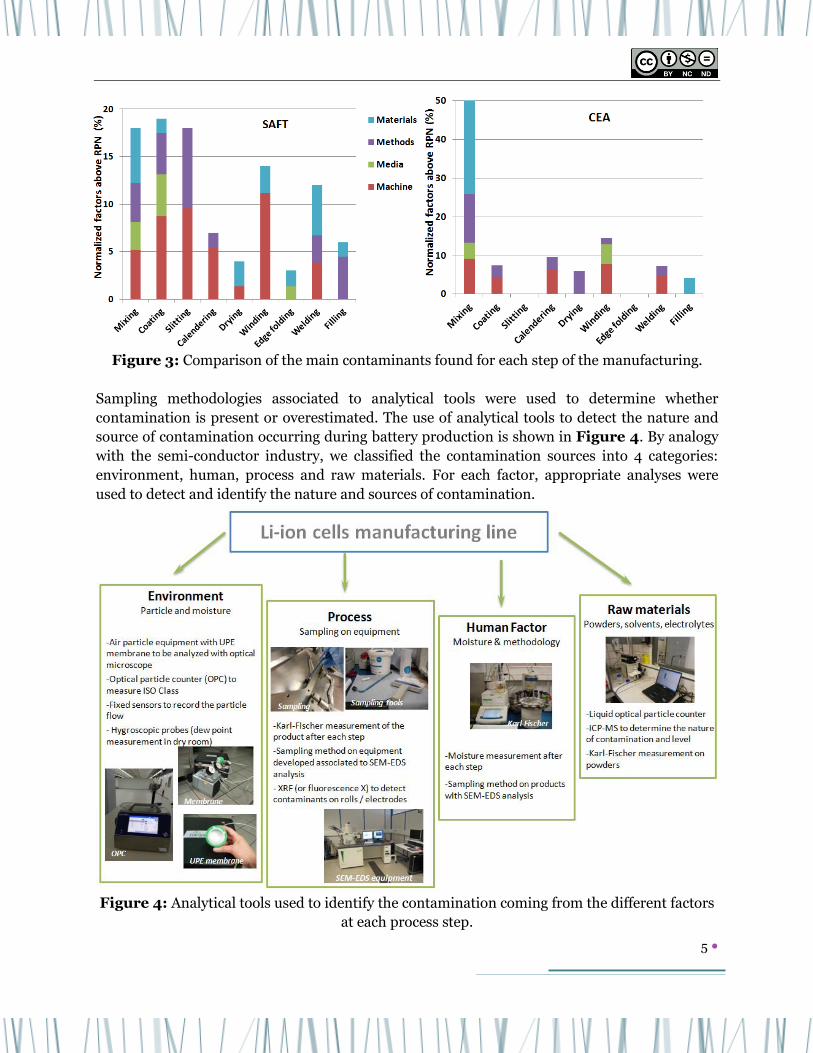
The different parameters described in the Ishikawa diagram are reported into a Failure Mode
and Effect Analysis document and are rated depending on the volume production, process, raw
materials… Figure 3 represents the comparison for both sites of the most potential harmful
contaminants at each process step. The criteria and rating have been specified by production
teams to calculate the Risk Priority Number, that represents a threshold. The parameters with a
number above the RPN represent the ones that will be investigated during the audit. It is clear
that the contamination has not been taken into account the same way depending on the
production site. However, few similar trends can be observed such as the impact of man and
measurement is negligible. The electrode fabrication steps (from mixing to drying) represent the
main contribution in comparison to the cell assembly steps (from winding to filling) and this
trend is more pronounced in the case of the CEA.
5
Figure 3: Comparison of the main contaminants found for each step of the manufacturing.
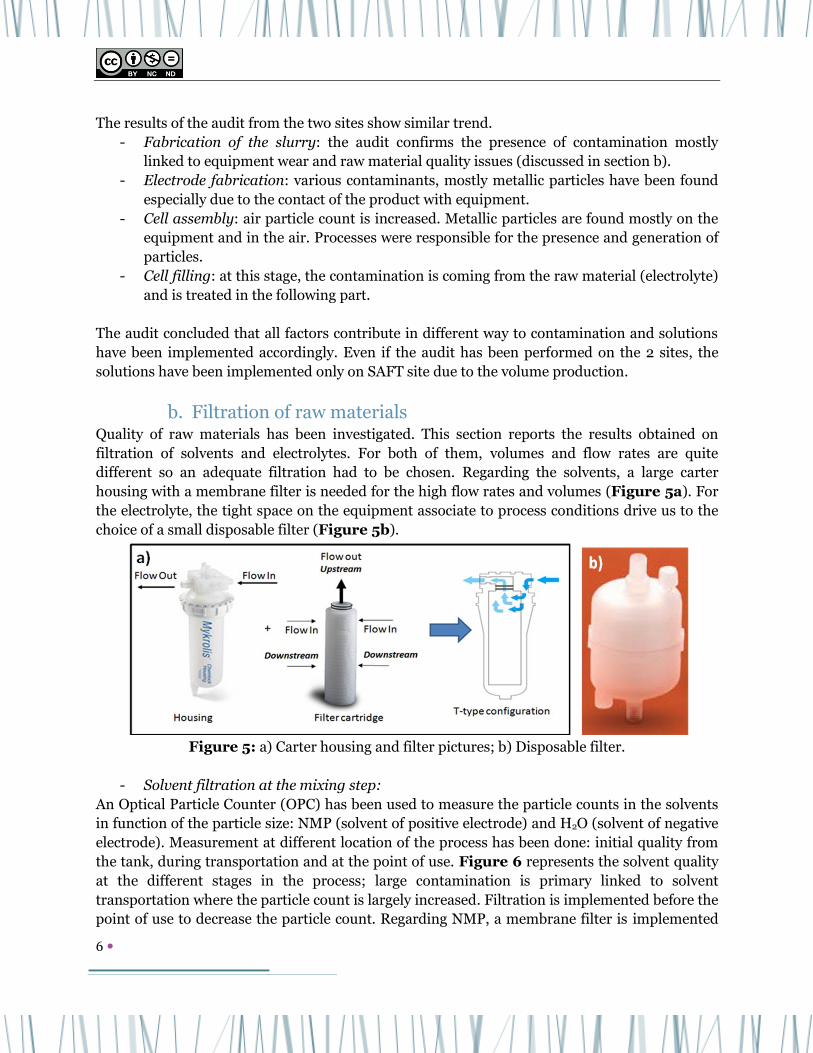
Sampling methodologies associated to analytical tools were used to determine whether
contamination is present or overestimated. The use of analytical tools to detect the nature and
source of contamination occurring during battery production is shown in Figure 4. By analogy
with the semi-conductor industry, we classified the contamination sources into 4 categories:
environment, human, process and raw materials. For each factor, appropriate analyses were
used to detect and identify the nature and sources of contamination.
Figure 4: Analytical tools used to identify the contamination coming from the different factors
at each process step.
6
The results of the audit from the two sites show similar trend.
- Fabrication of the slurry: the audit confirms the presence of contamination mostly
linked to equipment wear and raw material quality issues (discussed in section b).
- Electrode fabrication: various contaminants, mostly metallic particles have been found
especially due to the contact of the product with equipment.
- Cell assembly: air particle count is increased. Metallic particles are found mostly on the
equipment and in the air. Processes were responsible for the presence and generation of
particles.
- Cell filling: at this stage, the contamination is coming from the raw material (electrolyte)
and is treated in the following part.
The audit concluded that all factors contribute in different way to contamination and solutions
have been implemented accordingly. Even if the audit has been performed on the 2 sites, the
solutions have been implemented only on SAFT site due to the volume production.
b. Filtration of raw materials Quality of raw materials has been investigated. This section reports the results obtained on
filtration of solvents and electrolytes. For both of them, volumes and flow rates are quite
different so an adequate filtration had to be chosen. Regarding the solvents, a large carter
housing with a membrane filter is needed for the high flow rates and volumes (Figure 5a). For
the electrolyte, the tight space on the equipment associate to process conditions drive us to the
choice of a small disposable filter (Figure 5b).
Figure 5: a) Carter housing and filter pictures; b) Disposable filter.
- Solvent filtration at the mixing step:
An Optical Particle Counter (OPC) has been used to measure the particle counts in the solvents
in function of the particle size: NMP (solvent of positive electrode) and H2O (solvent of negative
electrode). Measurement at different location of the process has been done: initial quality from
the tank, during transportation and at the point of use. Figure 6 represents the solvent quality
at the different stages in the process; large contamination is primary linked to solvent
transportation where the particle count is largely increased. Filtration is implemented before the
point of use to decrease the particle count. Regarding NMP, a membrane filter is implemented
7
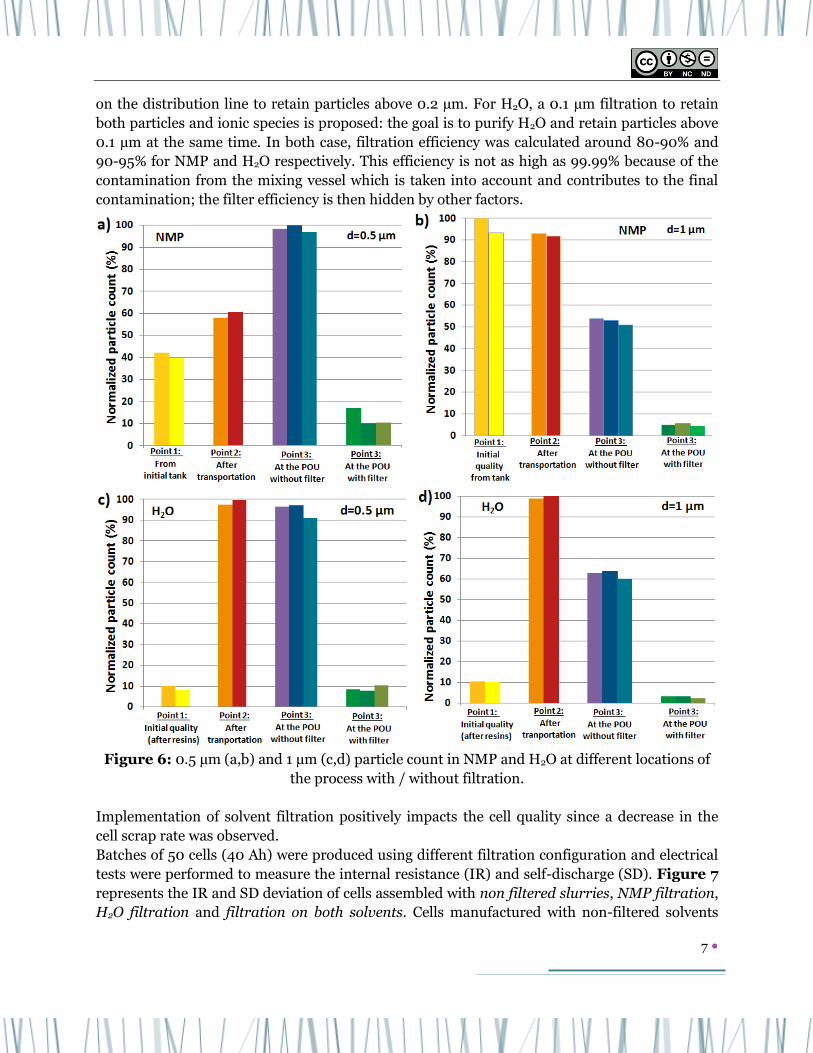
on the distribution line to retain particles above 0.2 µm. For H2O, a 0.1 µm filtration to retain
both particles and ionic species is proposed: the goal is to purify H2O and retain particles above
0.1 µm at the same time. In both case, filtration efficiency was calculated around 80-90% and
90-95% for NMP and H2O respectively. This efficiency is not as high as 99.99% because of the
contamination from the mixing vessel which is taken into account and contributes to the final
contamination; the filter efficiency is then hidden by other factors.
Figure 6: 0.5 µm (a,b) and 1 µm (c,d) particle count in NMP and H2O at different locations of
the process with / without filtration.
Implementation of solvent filtration positively impacts the cell quality since a decrease in the
cell scrap rate was observed.
Batches of 50 cells (40 Ah) were produced using different filtration configuration and electrical
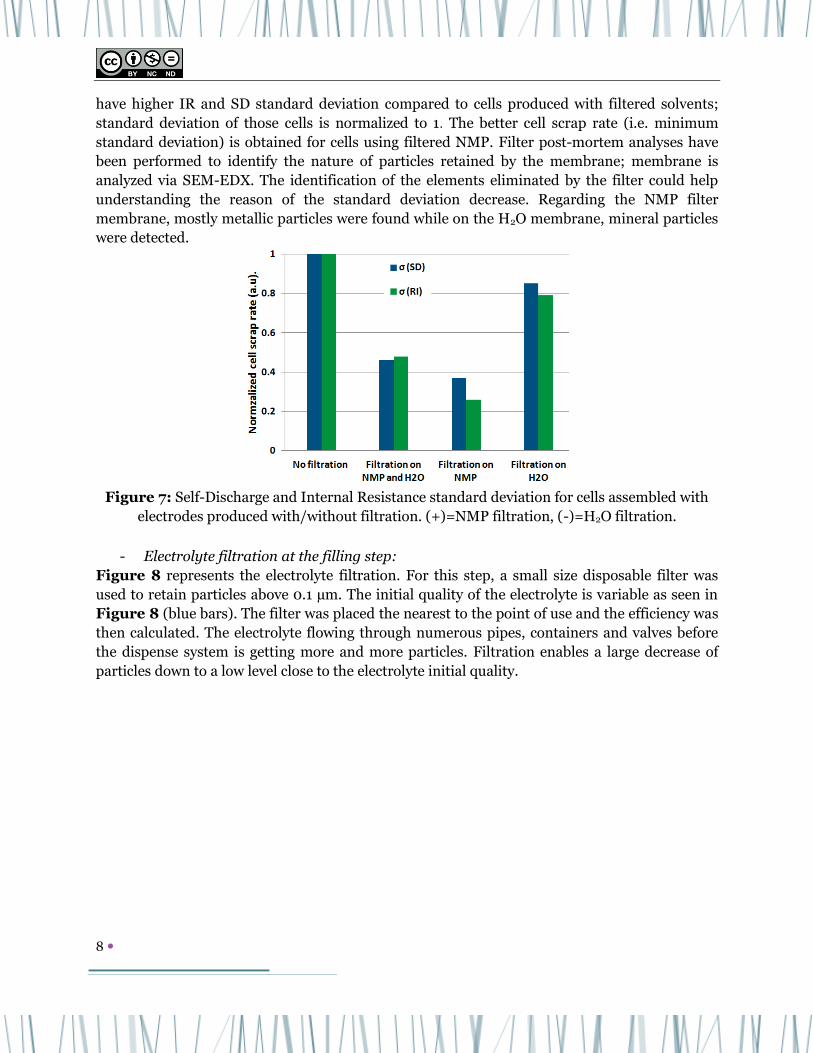
tests were performed to measure the internal resistance (IR) and self-discharge (SD). Figure 7
represents the IR and SD deviation of cells assembled with non filtered slurries, NMP filtration,
H2O filtration and filtration on both solvents. Cells manufactured with non-filtered solvents
8
have higher IR and SD standard deviation compared to cells produced with filtered solvents;
standard deviation of those cells is normalized to 1. The better cell scrap rate (i.e. minimum
standard deviation) is obtained for cells using filtered NMP. Filter post-mortem analyses have
been performed to identify the nature of particles retained by the membrane; membrane is
analyzed via SEM-EDX. The identification of the elements eliminated by the filter could help
understanding the reason of the standard deviation decrease. Regarding the NMP filter
membrane, mostly metallic particles were found while on the H2O membrane, mineral particles
were detected.
Figure 7: Self-Discharge and Internal Resistance standard deviation for cells assembled with
electrodes produced with/without filtration. (+)=NMP filtration, (-)=H2O filtration.
- Electrolyte filtration at the filling step:
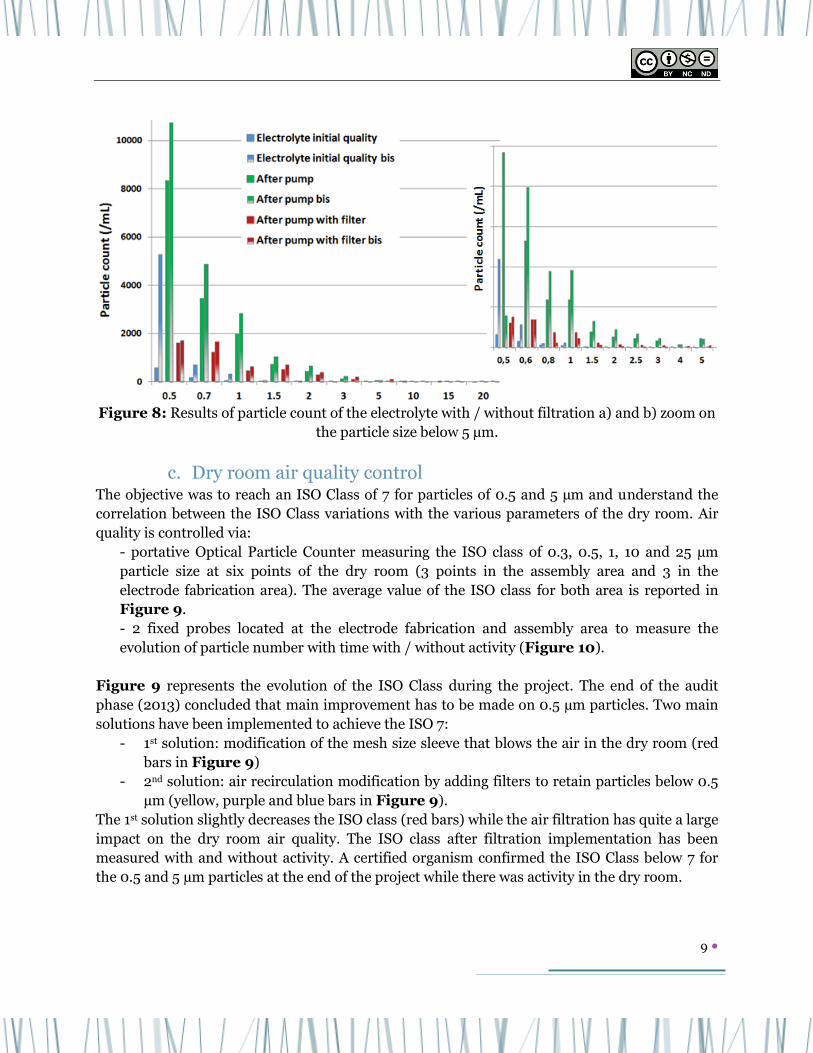
Figure 8 represents the electrolyte filtration. For this step, a small size disposable filter was
used to retain particles above 0.1 µm. The initial quality of the electrolyte is variable as seen in
Figure 8 (blue bars). The filter was placed the nearest to the point of use and the efficiency was
then calculated. The electrolyte flowing through numerous pipes, containers and valves before
the dispense system is getting more and more particles. Filtration enables a large decrease of
particles down to a low level close to the electrolyte initial quality.
9
Figure 8: Results of particle count of the electrolyte with / without filtration a) and b) zoom on
the particle size below 5 µm.
c. Dry room air quality control The objective was to reach an ISO Class of 7 for particles of 0.5 and 5 µm and understand the
correlation between the ISO Class variations with the various parameters of the dry room. Air
quality is controlled via:
- portative Optical Particle Counter measuring the ISO class of 0.3, 0.5, 1, 10 and 25 µm
particle size at six points of the dry room (3 points in the assembly area and 3 in the
electrode fabrication area). The average value of the ISO class for both area is reported in
Figure 9.
- 2 fixed probes located at the electrode fabrication and assembly area to measure the
evolution of particle number with time with / without activity (Figure 10).
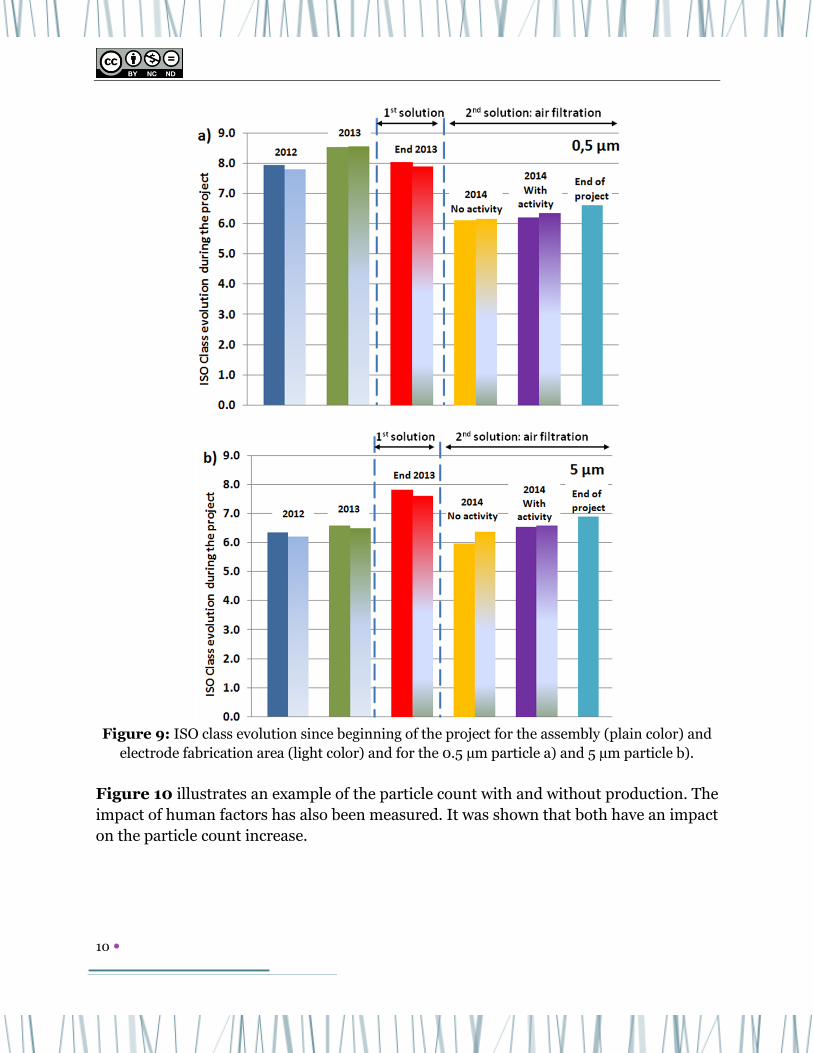
Figure 9 represents the evolution of the ISO Class during the project. The end of the audit
phase (2013) concluded that main improvement has to be made on 0.5 µm particles. Two main
solutions have been implemented to achieve the ISO 7:
- 1st solution: modification of the mesh size sleeve that blows the air in the dry room (red
bars in Figure 9)
- 2nd solution: air recirculation modification by adding filters to retain particles below 0.5
µm (yellow, purple and blue bars in Figure 9).
The 1st solution slightly decreases the ISO class (red bars) while the air filtration has quite a large
impact on the dry room air quality. The ISO class after filtration implementation has been
measured with and without activity. A certified organism confirmed the ISO Class below 7 for
the 0.5 and 5 µm particles at the end of the project while there was activity in the dry room.
10
Figure 9: ISO class evolution since beginning of the project for the assembly (plain color) and
electrode fabrication area (light color) and for the 0.5 µm particle a) and 5 µm particle b).
Figure 10 illustrates an example of the particle count with and without production. The
impact of human factors has also been measured. It was shown that both have an impact
on the particle count increase.

11
Figure 10: Impact of production on particle count variation of 0.5 a) and 5 µm b) in the
electrode fabrication and cell assembly area.
d. Statistical analysis on cell performances
Figure 11 shows the implementation time line of the different clean manufacturing
solutions at SAFT Bordeaux and/or Nersac. In order to check if these solutions have an
impact on cell performances, statistical analysis has been performed all along the
project.
Figure 11: Implementation time line
Many cylindrical cells (more than 30000) were performed since the beginning of the
project, with different nominal capacity values, ranging from 30 to 45 Ah.
Statistical analysis on cell performances (initial capacity, internal resistance, self-
discharge) has shown that these solutions have no impact on capacity and self-
discharge, but only on self-discharge. Indeed, as illustrated in Figure 12 below, dry
12
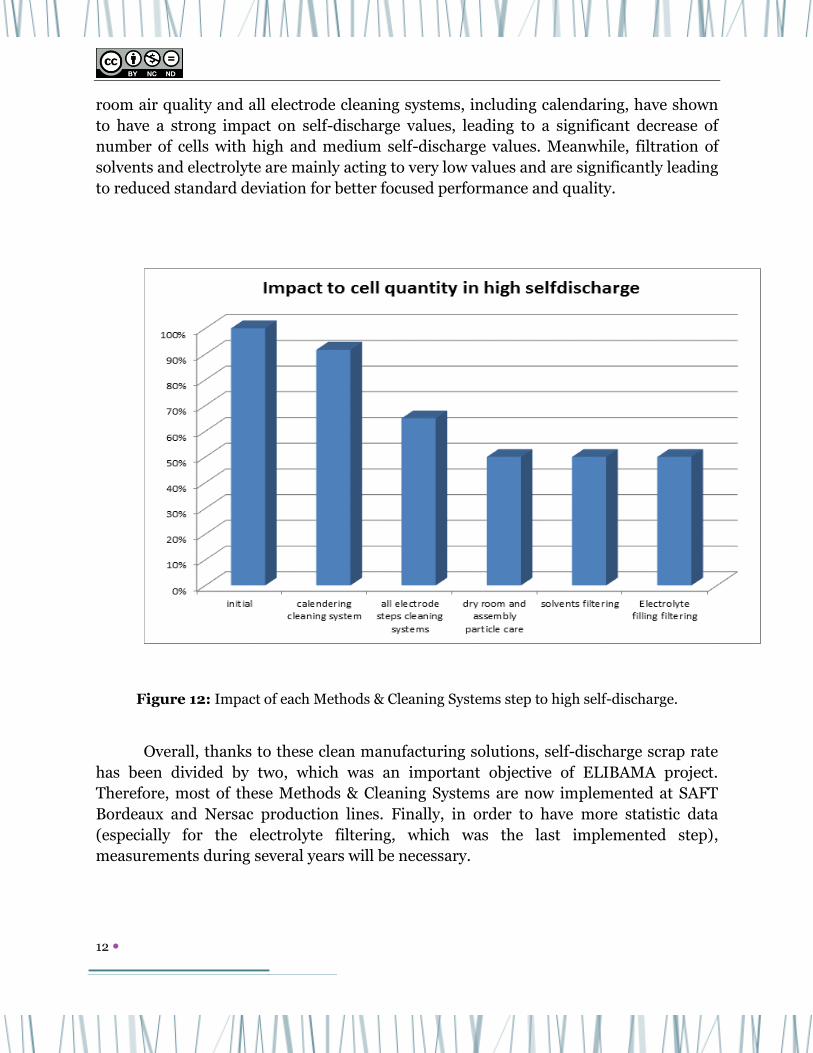
room air quality and all electrode cleaning systems, including calendaring, have shown
to have a strong impact on self-discharge values, leading to a significant decrease of
number of cells with high and medium self-discharge values. Meanwhile, filtration of
solvents and electrolyte are mainly acting to very low values and are significantly leading
to reduced standard deviation for better focused performance and quality.
Figure 12: Impact of each Methods & Cleaning Systems step to high self-discharge.
Overall, thanks to these clean manufacturing solutions, self-discharge scrap rate
has been divided by two, which was an important objective of ELIBAMA project.
Therefore, most of these Methods & Cleaning Systems are now implemented at SAFT
Bordeaux and Nersac production lines. Finally, in order to have more statistic data
(especially for the electrolyte filtering, which was the last implemented step),
measurements during several years will be necessary.
13
Conclusion The methodology developed during the program between SAFT and Entegris appears to be quite
accurate to determine the sources of contamination and enables to implement solutions when
needed. Different solutions were implemented: work methodology, process modification and
filtration solutions were among the major changes. By analogy with the semi-conductor
industry, contaminants are classified in environment, material, process, human factor.
Filtration solutions of raw materials (solvents and electrolytes) were implemented and a positive
impact of the filtration solutions on the cell scrap rate was measured; a cell scrap rate decrease
higher than 50% was calculated with solvent filtration. This observation indicates that the
particles contained in the solvents and in slurries will be responsible for some performance
deviation due to different factors.
Another important objective was to decrease the ISO Class from the starting point of the project
(ISO Class > 8) and decreases it to 7 for the 0.5 and 5 µm. This objective was reached at the end
of the project with an ISO Class of 6.9 and 6.4 respectively for the 0.5 and 5 µm. A major
modification of the dry room air entrance was performed and the
In this project, we demonstrated that contamination control is an important parameter to take
into account to improve scrap rate. Contamination control solutions were then efficient to
improve this key factor.
Perspectives for the future
Raw material filtration has been proven to be efficient for the battery industry. However, the
filtration system needs to be adapted according to the volume of production. The solution
implemented resulting in a yield improvement shows there is room for battery cost decrease.
A complex model for the return on investment can be developed by the battery manufacturer
depending on the volume production, battery size, manufacturing cost…
Figure 13 is an example of solutions developed for raw materials that increase battery
performance either in term of scrap rate (like in this project), battery life time (use of purifier to
remove HF from the electrolyte) or in term of solvent waste decrease (NMP recycling).

14
Figure 13: Contamination control solutions developed for raw materials.
References
[1] http://batteryuniversity.com/learn/article/lithium_ion_safety_concerns
[2] http://www.carscoops.com/2013/04/mitsubishi-discovers-cause-of-melted.html
[3] D. Aurbach, B. Markovsky, G. Salitra, E. Markevich, Y. Talyossef, M. Koltypin, L. Nazar, B. Ellis, D. Kovacheva, J. Power Sources, 165 (2007) 491-499.
[4] J. Vetter, P. Novak, M.R. Wagner, C. Veit, K.C. Möller, J.O. Besenhard, M. Winter, M. Wohlfart-Mehrens, C. Vogler, A. Hammouche, J. Power Sources, 147 (2005) p. 269-281.
[5] K. Xu, “Nonaqueous Liquid Electrolytes for Lithium-Based Rechargeable Batteries”, Chem. Rev., 104
(2004) p. 4303-4417.
[6] http://www.dehumid-itswa.com/english/products.htm
[7] http://fr.afprofilters.com/classification-des-filtres.html
Contacts
SAFT: Julien Bréger
Entegris: Cristelle Herriot
The ELIBAMA project is granted by the European Commission under the “Nanosciences,
nanotechnologies, materials & new production technologies” (NMP) Themeof the 7th
Framework Programme for Research and Technological Development.