process mass spectrometry in biotechnology as well as provide real-time information regarding...
TRANSCRIPT

Process Mass Spectrometryin Biotechnology
Part of Thermo Fisher Scientific

The use of online process analytical technology (PAT) has recentlybecome a high-profile endeavor in the biotechnology industry. Yet, fermentation scientists have been using Thermo Scientific processmass spectrometers since the early 1980s to reliably monitor thecomposition of gas streams into and out of fermentors and bioreactors.These accurate measurements enable pre-screening for possiblecontamination as well as provide real-time information regarding culturerespiration and the availability of nutrients. To further advance processeswithin the industry, a more advanced gas analysis technology platform is now available. The new Thermo Scientific Prima PRO process mass spectrometer encompasses the latest design techniques for fault-tolerant operation, ensuring high reliability for closed-loop control in harsh industrial environments.
Thermo Scientific Prima PRO Process Mass Spectrometer:The Next Generation Begins
Backed by more than 30 years of gas analysis success, the Prima PROprocess mass spectrometer is a PAT tool designed to provide invaluableinformation during every stage of the process. From design and scale-upto full production, the next-generation gas analyzer facilitates a number of biotechnology processes and enables staff to more easily:• Perform a fast check for contamination prior to inoculation• Optimize transfer of inoculum from the seed tank• Monitor metabolic activity• Provide input to state equations, enabling timely estimates
(without requiring sample withdrawal) of:– Viable cell mass– Glucose consumption rate– Substrate concentration– Alcohol production rate– Product inhibition
• Provide data for training neural networks and hybrid models• Identify and quantify species that require removal for
environmental compliance• Monitor changes in kLa, enabling control of:
– Agitation RPM– Sparge flow– Sparge oxygen concentration
• Detect and quantify drift in dissolved oxygen probes• Monitor metabolic indicators:
– Methanol– Ethanol– Acetone– Ammonia
• Identify new molecular species that might also indicate specific metabolism.
Best of all, the Prima PRO process mass spectrometer enables all ofthese processes without compromising sterility. It significantly increasesproductivity and reduces maintenance by enabling up to 60 fermentorsand bioreactors to be monitored with a single analyzer.
New Model Delivers Strong ROI
• Fast (1 to 20 seconds per point) online gas analysis for accuratetracking of process dynamics
• Comprehensive and provides more data for advanced process control (APC) models
• Stable with a 30- to 90-day calibration interval (automated)• Reliable, fault-tolerant design for availability of >99.7%• Small footprint with no large shelter required; standard A/C sufficient • Minimal maintenance requirements reduce operating costs
Field-Proven Technology with a Worldwide Installation Base
Process Optimization at the Speed of Mass Spectrometry.

Principles of Operation
The Prima PRO process mass spectrometer is a high-performance gasanalyzer based on a powerful and flexible scanning magnetic sector massspectrometer. The platform has been designed to deliver superior analyticalperformance with high reliability and minimal maintenance requirements.
Mass spectrometers operate by ionizing neutral sample gasmolecules, and the resulting charged particle components are separatedaccording to their molecular weight. In most commercial gas analysismass spectrometers, ionization is achieved by bombarding the gassample with an electron beam produced by a hot filament. To preventcollisions, the various ions are separated in a vacuum.
The technique chosen to separate the ions in the Prima PRO processmass spectrometer is the scanning magnetic sector where the trajectoryof the ions is controlled by a variable magnetic field. Ions of interest aresequentially collected onto a single detector, enabling the analyzer toscan the whole gas sample to accurately quantify known constituentsand identify unknown ones. The detector assembly combines a FaradayCup detector that measures gas concentrations at percentage and highppm levels and a Secondary Electron Multiplier (SEM) detector thatanalyzes low ppm and ppb concentrations.The output signal from the scanning magnetic sector is a series of flat-
topped peaks, each with amplitude proportional to the number of ions ateach mass. Perfectly symmetrical peaks are readily achieved using thePrima PRO process mass spectrometer. Accurate intensity measurementsdo not rely on accurate mass peak jumping since each peak provides alarge target with consistent amplitude. Since even relatively large errorsin mass position will not result in any significant errors in amplitudemeasurement, the Prima PRO process mass spectrometer’s magneticsector is intrinsically fault-tolerant. In addition, the sector’s relatively highenergy ion beam (1kV typical) is not easily deflected by the inevitable localsurface charges and/or insulating layers that result from contamination,
further enhancing the Prima PRO process mass spectrometer’s fault-tolerant nature when compared to the very low ion energy of alternativequadrupole technology. Finally, the system’s high energy ensures thatextraction from the ionization region is faster than a low-energy quadrupole,resulting in reduced ion-molecule interaction and improved linearity.Long-term reproducibility to 0.01% relative can easily be achieved.
Multi-Stream Inlets
Most Prima PRO process mass spectrometers are equipped with a rapidmulti-stream sampler (RMS), a highly reliable device that switchessample streams without compromising the quality of the samplepresented to the analyzer. Known for rock solid reliability, the RMS hasproven to switch streams six million times a year, year after year, withlittle or no maintenance. In fact, a single Prima PRO process massspectrometer is capable of monitoring up to 60 fermentors and/orbioreactors. The stepper-motor driven RMS diverts one sample stream at a time to the mass spectrometer and, in turn, records the flow for eachstream. The RMS can also be heated to +120°C (+248°F) and has beendesigned to ensure rapid response to polar species such as methanol,ethanol and ammonia.
Figure 2: Analyzer assembly with 64-port rapid multi-stream sampler that is known to switch streams six million times a year yet requires little to no maintenance.
Figure 1: Analyzer section—operating principles and peak profile
Ion Intensity
32 44
Laminated Magnetic Core
VacuumChamber
TurboDrag Pump
Cold-CathodeVacuum Gauge
Sample Gas Inlet(1 mbar)
QuadrupoleLens
DetectorDeflection
FaradayDetector
S.E.M.Detector
Ion Source

Prima PRO Process Mass Spectrometer: Versatile, Reliable and Easy-to-Maintain
The versatile Prima PRO process mass spectrometer enables optimization of a number ofbiotechnology processes to improve overall product quality as well as increase product yield.From bench to pilot to full-scale production, it facilitates every stage of the scale-up processand minimizes the risks associated with the complex manufacturing of: • Bioenergy• Industrial enzymes• Biomaterials• Biomass• Food additives• Vitamins• Pharmaceuticals– Prophylactics– Vaccines– Growth factors– Monoclonal antibodies– Hormones– Fusion proteins– Cytokines– Antibiotics– Insulin– Thrombolytics
This modern process mass spectrometer is also engineered for ease-of-use and has minimalmaintenance requirements to help increase productivity and profitability.
Fermentation has many important uses in industry and, strictly speaking, describes anaerobicprocesses. Industrial fermentation generally refers to the breakdown of organic substances and re-assembly into other substances using living cells that operate in a highly oxygenated growthmedium. Microbial fermentation refers to the archaea that often thrive in extreme conditions,bacteria, fungi and protozoa. The term cell culture often refers to higher order cells such as plant,insect and mammalian. The distinction between microbial fermentation and cell culture isimportant from a process control perspective since hardy bacteria need less protection fromprocess variation than mammalian cells which require tight control of temperature, pH and the sheer forces produced by agitation and aeration. Control of dissolved carbon dioxide is alsoimportant in cell culture control. Based on its advanced gas analysis technology platform, thePrima PRO process mass spectrometer is designed to provide real-time information, enablingtighter process control during industrial fermentation and cell culture.
Imagine a Gas Analyzer that Can Pay You Back in Days.
Industrial Fermentation and Cell Culture

When compared to traditional small molecule synthesis, biologicalprocesses are very complicated. Each cell is capable of carrying outthousands of chemical reactions per second and, often times, only onereaction will result in the target molecule. How the reactions progresswill be determined by a host of factors such as temperature, availabilityof nutrients, the amount of accumulated waste products, availableoxygen, the concentration of enzymes that promote reactions and theamino acid building blocks from which proteins are made. With a simplefermentor, the growth medium is loaded following sterilization and thebroth is inoculated with cells. Relatively stable sparge gas flow rates and impeller rotation rates are maintained to ensure sufficient oxygenavailability throughout the medium. Once the cells start to multiply,excess heat is removed by cooling water and adjustments of pH aremade using acidic and basic reagents. Dissolved oxygen (DO2) ismonitored continuously and manual assays are performed to assess cell
density and substrate composition. If DO2 falls below a predeterminedlevel, an additional shot of oxygen can be added by opening the oxygenvalve for a brief period. In mammalian cell culture, a similar controlmethodology is used for dissolved carbon dioxide (DCO2). Statisticalprocess control (SPC) tools are used to determine if the process followsan appropriate trajectory based on data that is manually entered fromthe lab assays. These data are also used to determine the appropriatetime to harvest. Under these circumstances, batch-to-batch variation can be significant and an order of magnitude difference is not unusual.With pharmaceutical products, if the recovered active pharmaceuticalingredient (API) falls below a certain quality standard, the entire batchmust be scrapped. Clearly, the Prima PRO process mass spectrometerwith its highly reliable online PAT provides lab personnel with the toolsneeded to considerably improve product quality and increase profitability.
Figure 3: Simple bioreactor control
Surfactants
Sodium Carbonate
Glucose
DO2
CO2 O2 Air
DCO2
pH
Jacket Temperature
L-Glutamine
Serum
Cells
Jacket Cooling
FC
Acidic Reagent
Basic Reagent
Agitation
ProgrammableLogic Controller
(PLC)
Human-MachineInterface
(HMI)
Host PC
FC Flow Controller
Simple Bioreactor Control

Most bacteria used for biological production require water, carbon,nitrogen and a source of energy before they can grow and divide. As previously stated, they also have temperature, pH and gaseousrequirements. The nutrients are provided in a complex growth mediumthat may include a number of natural products (see Fig. 4) or the mediacan be chemically defined for processes where natural batch-to-batchvariation will present a problem. Both types of media are designed toprovide the most appropriate concentration of nutrients to encouragerapid logarithmic growth until a target cell density has been achieved. At this point, the primary carbon source should be depleted to force thecells to switch to a secondary source that promotes product formation.Additional components can be included that either inhibit or induceparticular metabolic pathways in order to maximize product formationand minimize accumulation of toxic byproducts.
Process Scale-Up
A typical scenario for process development uses multiple benchtopbioreactors or fermentors with capacities in the one to 10 liter (L) range.Various broth recipes are paired with different cell lines to determine themost robust and potent combination. Once the best candidate groupingsare selected, the process is scaled up to the 200L scale (the pilot-scale)where potential control variables are fully tested for permissible rangeand efficacy. In addition to pH, temperature, agitation RPM, DO2 andDCO2, potential control variables may also include:• Nutrient feed rates• Back pressure• Overlay gas composition• Sparge composition and flow rate.
Prima PRO Process Mass Spectrometer: Real-Time Monitoring and Control
To control nutrient feeds and gas compositions in real time, it isnecessary to either monitor the chemistry of the broth or the gascomposition of the reactor effluent in real time. Model-based advancedprocess control techniques can subsequently be used to make changes to these additional control variables in response to measured changes in certain output variables. Fourier Transform Near Infrared (FT-NIR)spectroscopy is a suitable technology for measuring liquidconcentrations. The best technology for making gas concentrationmeasurements is the magnetic sector mass spectrometer, a criticalcomponent of the Prima PRO process mass spectrometer thatsignificantly increases the analyzer's power and flexibility.
Track Batch Progress in Real Time.
Process Variables
Figure 4: Growth Media Constituents
GrowthMedia
Antifoaming Agents
Thiamine
Wheat Germ Meal
Beef Extract
Yeast
Growth Factors
Fish Meal
Soybean Meal
Corn Steep Liquor
Ammonia
Protein
Nitrate
Nitrogen Source
Lactose
Sucrose
Glucose
Fats
Hydrocarbons
Carbon Source
Water
Trace Elements
Phosphate
Calcium CarbonateBuffers
Inhibitors
Inducers
Amino Acids
Figure 5: Autoclavable Benchtop Fermentor

Multiple Skids Single Control Station
Glucose
FC
Surfactants
Sodium Carbonate
CO2 O2 Air
L-Glutamine
Serum
Cells
Jacket Cooling
FC
FCFCFC
Acidic Reagent
Basic Reagent
Agitation
ProgrammableLogic Controller
(PLC)
Human-MachineInterface
(HMI)
ThermoScientificPrima PRO
ProcessMass
Spectrometer
DistributedControl System
(DCS)
MSPCHYBRIDMODEL
(PLS, PCA,MPC, ANN)
FC Flow Controller
DO2
DCO2
pH
Jacket Temperature
L-Glutamine
Glucose
Total Proteins
Ammonia
Cell Density
Oxygen
Nitrogen
CO2
Argon
MeOH
RQ...
FT-NIR
Figure 6: Advanced bioreactor with Model Predictive Control (MPC) that is enabled by the Prima PRO process mass spectrometer
Dynamic Modeling
The most frequently used methods for determining cell mass, productconcentration (titer) and substrate concentration rely on the use ofdifferential equations. These ‘state equations’ are interdependent andmust be solved simultaneously to produce valid results based on initialconditions and real-time measurements. The initial conditions includeinitial mass of substrate (the primary carbon source), starting cell massand broth volume. The real-time measurements include oxygen uptakerate (OUR), carbon dioxide evolution rate (CER), respiration quotient (RQ)and measured dissolved oxygen. The outputs from the models aretypically used to track progress of each batch by comparing the resultswith the known trajectory of a ‘Golden Batch’ which provides an idealprofile for optimum product formation. This methodology ensures thatlimiting conditions and/or contamination can be identified and correctedas quickly as possible.
Advanced Control Techniques
There are several emerging advanced methods for implementing ModelPredictive Control (MPC), including hybrid combinations of formal(deterministic) models and Artificial Neural Networks (ANN). Essentially,the ANN models fill in the gaps where first-principle analysis fails. ANNs are so called because their structure is based on layers ofinterconnected nodes, similar in structure to the neurons of the brain.These networks model behavior based on historical performance. The large training data sets often show that outcomes are the result ofprocess variables falling within a range. While it might be very difficultto derive a formal explanation of the linkage, these relationships can still be used for process control. The Prima PRO process massspectrometer enables extended analysis of the bioreactor effluent, andsubsequently provides the data necessary to train these neural networks.Other mathematical modeling techniques include Principle ComponentAnalysis (PCA) and Partial Least Squares (PLS) regression, both of whichare mathematical procedures for investigating patterns and relationshipsin large data sets. By facilitating data compilation, the Prima PRO processmass spectrometer is a key component in successful MPC implementation.
Advanced Bioreactor
Advanced Bioreactor Monitoring
Pinpoint Contamination and Maximize Viable Cell Mass to Fuel Profits.
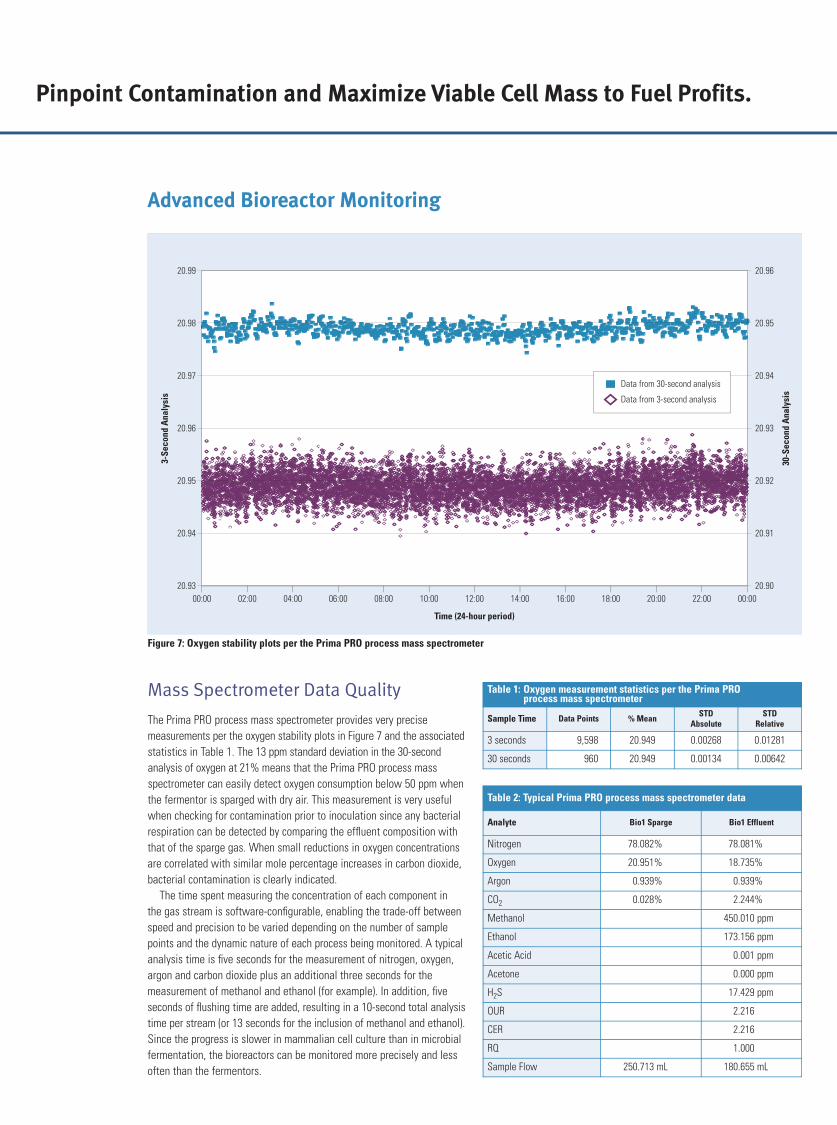
Mass Spectrometer Data Quality
The Prima PRO process mass spectrometer provides very precisemeasurements per the oxygen stability plots in Figure 7 and the associatedstatistics in Table 1. The 13 ppm standard deviation in the 30-secondanalysis of oxygen at 21% means that the Prima PRO process massspectrometer can easily detect oxygen consumption below 50 ppm whenthe fermentor is sparged with dry air. This measurement is very usefulwhen checking for contamination prior to inoculation since any bacterialrespiration can be detected by comparing the effluent composition withthat of the sparge gas. When small reductions in oxygen concentrationsare correlated with similar mole percentage increases in carbon dioxide,bacterial contamination is clearly indicated. The time spent measuring the concentration of each component in
the gas stream is software-configurable, enabling the trade-off betweenspeed and precision to be varied depending on the number of samplepoints and the dynamic nature of each process being monitored. A typicalanalysis time is five seconds for the measurement of nitrogen, oxygen,argon and carbon dioxide plus an additional three seconds for themeasurement of methanol and ethanol (for example). In addition, fiveseconds of flushing time are added, resulting in a 10-second total analysistime per stream (or 13 seconds for the inclusion of methanol and ethanol).Since the progress is slower in mammalian cell culture than in microbialfermentation, the bioreactors can be monitored more precisely and lessoften than the fermentors.
Figure 7: Oxygen stability plots per the Prima PRO process mass spectrometer
00:00 02:0020.93
20.94
20.99
20.98
20.97
20.96
20.95
20.90
20.91
20.96
20.95
20.94
20.93
20.92
04:00 06:00 08:00
Time (24-hour period)
3-Se
cond
Ana
lysi
s
30-S
econ
d A
naly
sis
22:0020:0018:0016:0014:0012:0010:00 00:00
Data from 30-second analysis
Data from 3-second analysis
Table 2: Typical Prima PRO process mass spectrometer data
Analyte Bio1 Sparge Bio1 Effluent
Nitrogen 78.082% 78.081%
Oxygen 20.951% 18.735%
Argon 0.939% 0.939%
CO2 0.028% 2.244%
Methanol 450.010 ppm
Ethanol 173.156 ppm
Acetic Acid 0.001 ppm
Acetone 0.000 ppm
H2S 17.429 ppm
OUR 2.216
CER 2.216
RQ 1.000
Sample Flow 250.713 mL 180.655 mL
Table 1: Oxygen measurement statistics per the Prima PRO process mass spectrometer
Sample Time Data Points % Mean STDAbsolute
STDRelative
3 seconds 9,598 20.949 0.00268 0.01281
30 seconds 960 20.949 0.00134 0.00642
Oxygen Uptake Rate (OUR)
The oxygen concentration of the sparge gas and reactor effluent that is provided by the Prima PRO process mass spectrometer are sent to aprocess control computer. The data are combined with flow measurementsand batch volume for the computation of culture oxygen uptake:
The real-time calculation of the OUR is often used to determine theviable cell density in seed tanks, enabling determination of theappropriate time for inoculation.
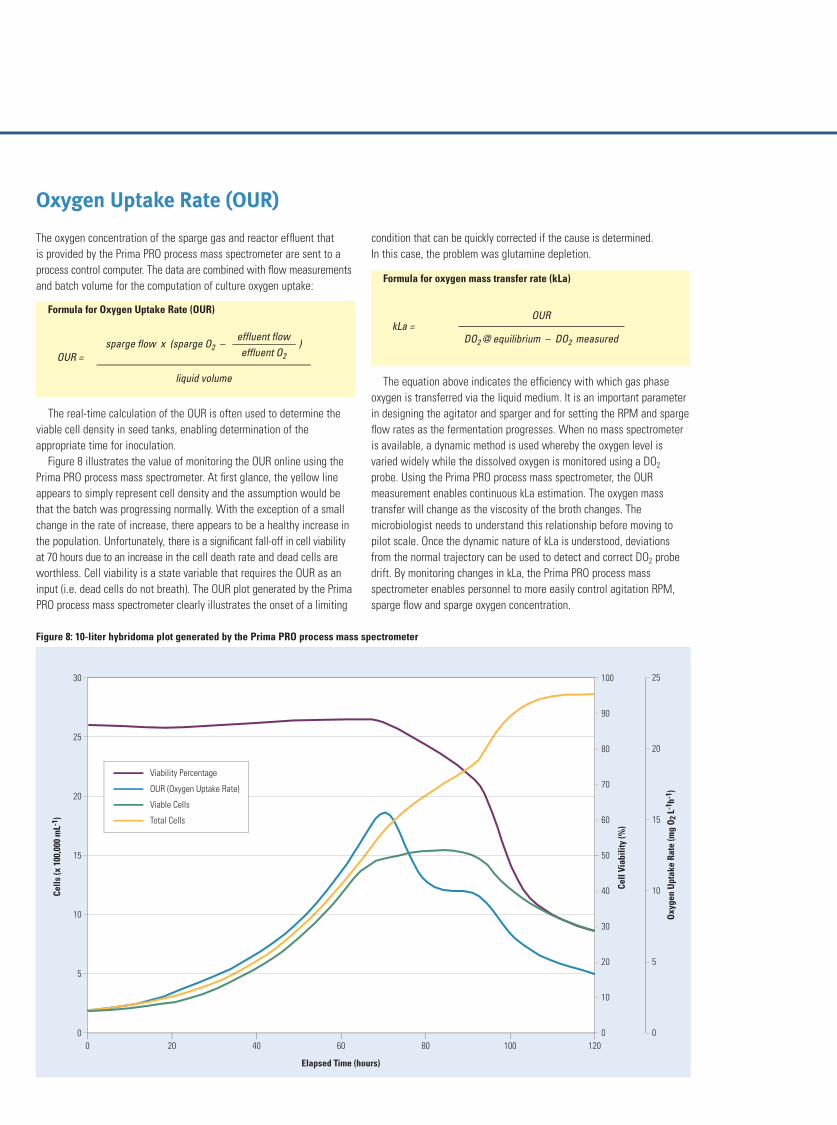
Figure 8 illustrates the value of monitoring the OUR online using thePrima PRO process mass spectrometer. At first glance, the yellow lineappears to simply represent cell density and the assumption would bethat the batch was progressing normally. With the exception of a smallchange in the rate of increase, there appears to be a healthy increase inthe population. Unfortunately, there is a significant fall-off in cell viabilityat 70 hours due to an increase in the cell death rate and dead cells areworthless. Cell viability is a state variable that requires the OUR as aninput (i.e. dead cells do not breath). The OUR plot generated by the PrimaPRO process mass spectrometer clearly illustrates the onset of a limiting
condition that can be quickly corrected if the cause is determined. In this case, the problem was glutamine depletion.
The equation above indicates the efficiency with which gas phaseoxygen is transferred via the liquid medium. It is an important parameterin designing the agitator and sparger and for setting the RPM and spargeflow rates as the fermentation progresses. When no mass spectrometeris available, a dynamic method is used whereby the oxygen level isvaried widely while the dissolved oxygen is monitored using a DO2
probe. Using the Prima PRO process mass spectrometer, the OURmeasurement enables continuous kLa estimation. The oxygen masstransfer will change as the viscosity of the broth changes. Themicrobiologist needs to understand this relationship before moving topilot scale. Once the dynamic nature of kLa is understood, deviationsfrom the normal trajectory can be used to detect and correct DO2 probedrift. By monitoring changes in kLa, the Prima PRO process massspectrometer enables personnel to more easily control agitation RPM,sparge flow and sparge oxygen concentration.
OUR =
liquid volume
sparge flow x (sparge O2 – )effluent floweffluent O2
kLa = OUR
DO2 @ equilibrium – DO2 measured
Formula for Oxygen Uptake Rate (OUR)
Formula for oxygen mass transfer rate (kLa)
0 200
5
30
25
20
15
10
0
10
20
30
40
50
60
70
80
90
100
40 60 80
Elapsed Time (hours)
Cells
(x 1
00,0
00 m
L-1 )
Cell
Viab
ility
(%)
5
0
10
15
20
25O
xyge
n U
ptak
e Ra
te (m
g O
2 L-1
h-1 )
100 120
OUR (Oxygen Uptake Rate)
Viable Cells
Total Cells
Viability Percentage
Figure 8: 10-liter hybridoma plot generated by the Prima PRO process mass spectrometer
Monitor Up to 60 Fermentors and Bioreactors with a Single Analyzer.
Carbon Dioxide Evolution and Cellular Respiration
The most important variable calculated from vent gas analysis is theRespiration Quotient (RQ). It is the function of two distinct types of activity present in both fermentation and cell culture: growth andmaintenance. RQ is defined as the carbon dioxide evolution rate (CER)divided by the OUR. The Prima PRO process mass spectrometer providestimely estimations of RQ that can be used to determine the currentmetabolic activity and potentially to enable closed-loop control of certainvariables, including the Glucose Feed Rate (GFR).
The equation for fermentations that do not fix gaseous nitrogen is:
The nitrogen and argon ratios that are present correct for the partialpressure changes that occur due to saturation with water vapor and the resulting dilution of the bioreactor effluent.
An example where RQ equals one is the oxidation of glucose for energy production during the growth phase:
An example where RQ equals 0.7 is derived from the oxidation ofstearic acid which often provides energy during the productive phase offungal fermentations. The result comes from 18 molecules of CO2 dividedby 26 molecules of O2:
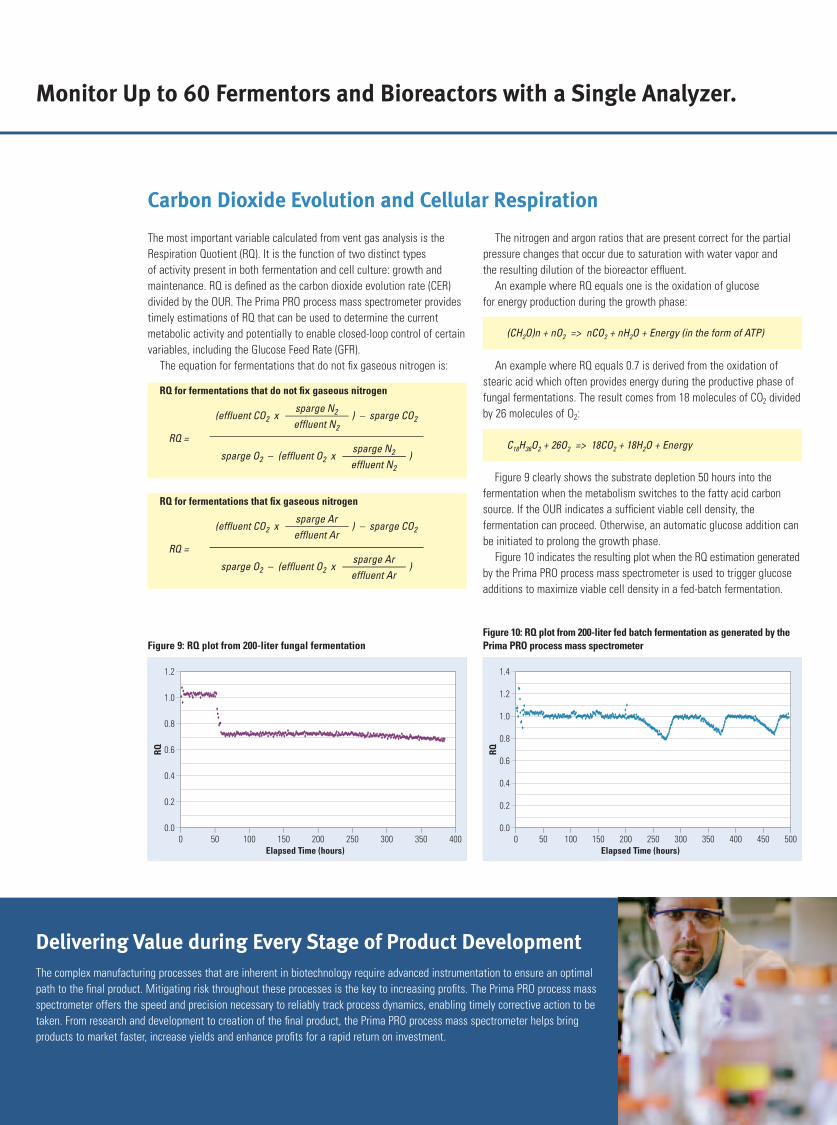
Figure 9 clearly shows the substrate depletion 50 hours into thefermentation when the metabolism switches to the fatty acid carbonsource. If the OUR indicates a sufficient viable cell density, thefermentation can proceed. Otherwise, an automatic glucose addition canbe initiated to prolong the growth phase.
Figure 10 indicates the resulting plot when the RQ estimation generatedby the Prima PRO process mass spectrometer is used to trigger glucoseadditions to maximize viable cell density in a fed-batch fermentation.
Delivering Value during Every Stage of Product DevelopmentThe complex manufacturing processes that are inherent in biotechnology require advanced instrumentation to ensure an optimalpath to the final product. Mitigating risk throughout these processes is the key to increasing profits. The Prima PRO process massspectrometer offers the speed and precision necessary to reliably track process dynamics, enabling timely corrective action to betaken. From research and development to creation of the final product, the Prima PRO process mass spectrometer helps bringproducts to market faster, increase yields and enhance profits for a rapid return on investment.
RQ =
(effluent CO2 x ) – sparge CO2sparge N2
effluent N2
sparge O2 – (effluent O2 x )sparge N2
effluent N2
RQ for fermentations that do not fix gaseous nitrogen
(CH2O)n + nO2 => nCO2 + nH2O + Energy (in the form of ATP)
C18H36O2 + 26O2 => 18CO2 + 18H2O + Energy
RQ =
(effluent CO2 x ) – sparge CO2sparge Areffluent Ar
sparge O2 – (effluent O2 x )sparge Areffluent Ar
RQ for fermentations that fix gaseous nitrogen
Figure 9: RQ plot from 200-liter fungal fermentation
00.0
0.2
1.2
1.0
0.8
0.6
0.4
50 100 200Elapsed Time (hours)
RQ
400150 300250 350
Figure 10: RQ plot from 200-liter fed batch fermentation as generated by thePrima PRO process mass spectrometer
00.0
0.2
1.4
1.2
1.0
0.8
0.6
0.4
50 100 200Elapsed Time (hours)
RQ
500150 300250 450400350


Process Mass Spectrometry in Biotechnology
© 2010 Thermo Fisher Scientific Inc. All rights reserved. Results may vary under different operating conditions. Specifications, terms and pricing are subject to change. Not all products are available in all countries. Please consult your local sales representative for details. Literature Code: PI.2076.0710
Process Instruments www.thermoscientific.com/primapro
14 Gormley Industrial Avenue, Unit 14Gormley, Ontario L0H 1G0 CANADA
Unit 702-715, 7/F Tower WestYonghe Plaza No. 28, Andingmen East StreetBeijing 100007 CHINA
A-101, ICC Trade Tower, Senapati Bapat RoadPune 411016 Maharashtra INDIA
Ion Path, Road Three, WinsfordCheshire CW7 3GA UNITED KINGDOM
1410 Gillingham LaneSugar Land, TX 77478 USA
+1 (905) 888-8808+1 (905) 888-8828 fax
+86 (10) 8419-3588+86 (10) 8419-3580 fax
+91 (20) 6626 7000+91 (20) 6626 7001 fax
+44 (0) 1606 548700+44 (0) 1606 548711 fax
+1 (800) 437-7979+1 (713) 272-0404+1 (713) 272-4573 fax