process modeling and optimization in ras design
TRANSCRIPT

Economic Implications for Commercial Operations
Prepared For the Aquaculture Innovation Workshop – Nov 5-6, Comox
Process Modeling and
Optimization in RAS Design
Presented by Karl Williaume

Resource Flow in a RAS Facility
2 1-Nov-12
Challenging economics of commercial-scale facilities
require operating costs to be minimized.

Resource Flow Diagram for RAS Facility
3 1-Nov-12
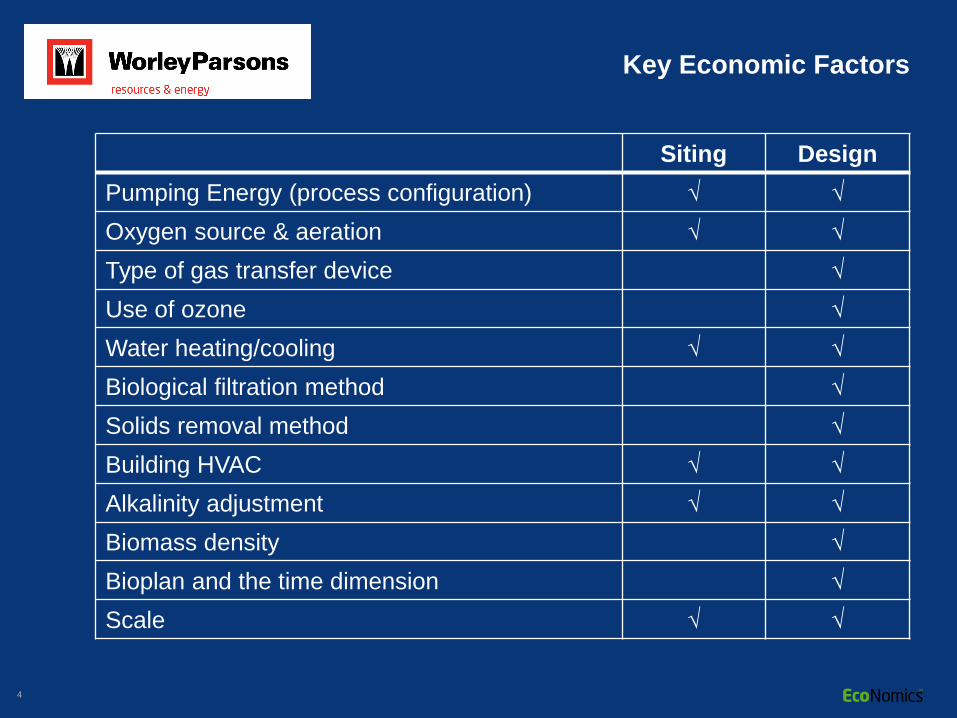
Key Economic Factors
Siting Design
Pumping Energy (process configuration) √ √
Oxygen source & aeration √ √
Type of gas transfer device √
Use of ozone √
Water heating/cooling √ √
Biological filtration method √
Solids removal method √
Building HVAC √ √
Alkalinity adjustment √ √
Biomass density √
Bioplan and the time dimension √
Scale √ √
4 1-Nov-12

RAS Resource Flow Diagram
5 1-Nov-12

Pumping Energy
Efficiency of Hydraulic Layout
6 1-Nov-12

Pumping Energy
7
Solids Removal
Biofilter
Gas Exchange
LHO
Conventional
FSB
Configuration
Solids Removal
Biofilter (MBBR)
Gas Exchange
LHOMBBR
Configuration

Oxygen / Ozone Supply Choices
8 1-Nov-12
Lo Press O3 Gen
O3 Gen
LHO
Cone
O3 Gen
LHOor or
Pressure Devices Low Head Oxygenator
Diffusion
LHOor or
O3 Gen LHOor or
PSA
VSA
LOX

9 1-Nov-12
Cost of Oxygen
Source Operating Cost
Cost with Capital
Depreciation
Notes
LOX $0.35/kg $0.35/kg Plus tank rental (minor)
Onsite (Contract) VPSA
$0.22/kg $0.22/kg Includes rental
Owned PSA $0.071/kg $0.11/kg Purity 88%
Owned VSA , (low press)
$0.038/kg $ .094/kg
0.5 kWh/kg @ 93%
Owned VSA , (high press)
$0.045/kg $0.103/kg
Owned VSA (supplier 2) (low press)
$0.021/kg $.062/kg
0.28 kWh/kg @ 93%

Water Heating/Cooling
Influent / effluent heat
recovery
Heat Pumps
Geothermal systems
Waste heat from nearby
industrial facilities
10 1-Nov-12
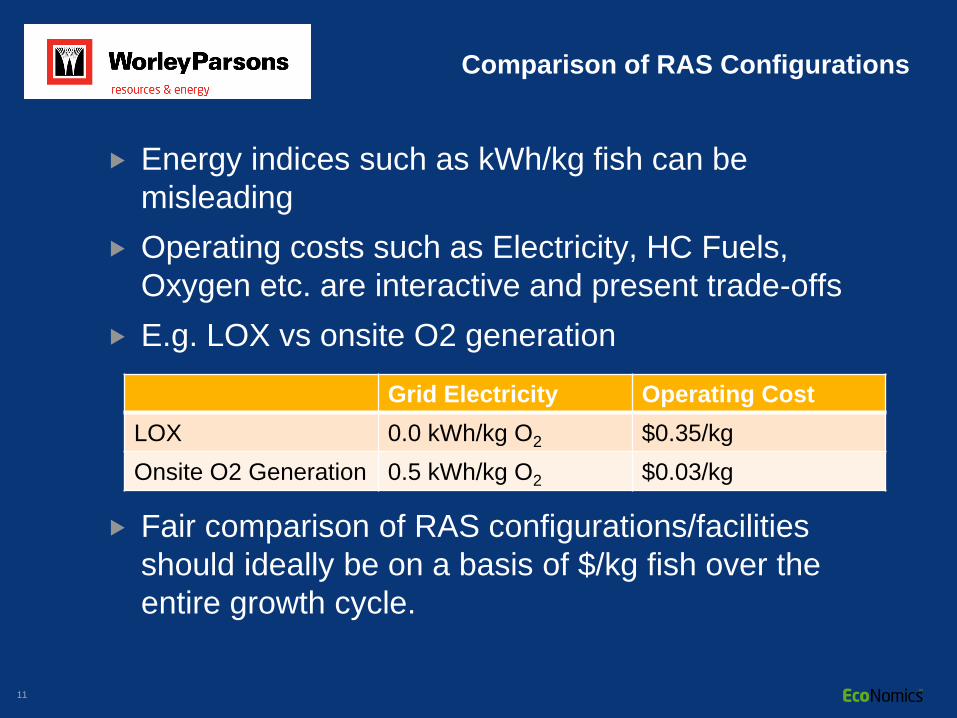
Comparison of RAS Configurations
Energy indices such as kWh/kg fish can be
misleading
Operating costs such as Electricity, HC Fuels,
Oxygen etc. are interactive and present trade-offs
E.g. LOX vs onsite O2 generation
Fair comparison of RAS configurations/facilities
should ideally be on a basis of $/kg fish over the
entire growth cycle.
11 1-Nov-12
Grid Electricity Operating Cost
LOX 0.0 kWh/kg O2 $0.35/kg
Onsite O2 Generation 0.5 kWh/kg O2 $0.03/kg

Impact of Bioplan
12 1-Nov-12

Loading Variability
13 1-Nov-12

Process Modeling with RASbook
14 1-Nov-12

WP Preferred Configuration for
Atlantic Salmon Production
15 1-Nov-12

Operating Costs – Optimized Configuration
16 1-Nov-12
Component $/kg Fish (HOG)
Smolts 0.45
Feed 1.96
Oxygen (LOX) 0.01
Electricity 0.22
Fuels 0.00
Chemicals 0.13
Repair & Maintenance 0.39
Labour 0.36
Other 0.30
Subtotal 3.82

Comparative Impacts
Parameter Comparison
Case
Optimized Case Impact ($/kg
HOG)
Oxygen Supply LOX + LHO VSA + LHO - 0.32
CO2 Stripping Diffused Air
(MBBR)
Packed Tower - 0.05
Biomass Density Nom 60 kg/m3 Nom 90 kg/m3
- 0.52
Power Source $0.12/kWh $0.06/kWh - 0.22
Biofilter Type Conventional
FBR
Optimized MBBR - 0.05
17 1-Nov-12
Other impacts of note: Alkalinity, temperature, enhanced solids removal,
use of ozone

Conclusions
Challenging economics of land-based production
requires careful consideration of certain key cost
factors
– At the site selection stage (power cost, alkalinity, etc)
– At the design stage (scale, biomass density, O2 source,
process configuration)
The only way to do a “fair” comparison of alternatives
is to estimate the $/kg fish impacts for the site in
question, considering day by day operation over
complete cycles.
18 1-Nov-12