processing and properties of carbon nanotube/poly(methyl methacrylate) composite films
TRANSCRIPT

Processing and Properties of Carbon Nanotube/Poly(methyl methacrylate) Composite Films
Jing Liu,* Asif Rasheed, Marilyn L. Minus, Satish Kumar
School of Polymer, Textile and Fiber Engineering, Georgia Institute of Technology, Atlanta, Georgia 30332-0295
Received 21 January 2008; accepted 23 July 2008DOI 10.1002/app.29372Published online 22 December 2008 in Wiley InterScience (www.interscience.wiley.com).
ABSTRACT: A systematic study of the reinforcement ofsingle-walled carbon nanotubes (SWNTs), multiwalledcarbon nanotubes, and vapor-grown carbon nanofibers(VGCNFs) in poly(methyl methacrylate) (PMMA) isreported. SWNT/PMMA composite films with variousSWNT concentrations (from 0.5 to 50 wt % with respect tothe weight of PMMA) were processed from nitromethane.Two types of SWNTs were used: SWNT-A, which con-tained 35 wt % metal catalyst, and SWNT-B, which con-tained about 2.4 wt % metal catalyst. Properties ofdifferent nanotubes containing composites were comparedwith 15 wt % carbon nanotubes (CNTs). Property enhance-ment included electrical conductivity, mechanical proper-ties, and solvent resistance. The thermal degradation ofPMMA in the presence of CNTs in air and nitrogen envi-
ronments was studied. No variation in the thermal degra-dation behavior of PMMA/CNT was observed innitrogen. The peak degradation temperature increased forthe composites in air at low CNT loadings. Dynamic andthermomechanical properties were also studied. At a 35wt % SWNT loading, a composite film exhibited good me-chanical and electrical properties, good chemical resist-ance, and a very low coefficient of thermal expansion.Property improvements were rationalized in terms of thenanotube surface area. Composite films were also charac-terized with Raman spectroscopy. VVC 2008 Wiley Periodicals,Inc. J Appl Polym Sci 112: 142–156, 2009
Key words: mechanical properties; nanocomposites;thermal properties
INTRODUCTION
Typically, carbon nanotubes (CNTs) exist as single-walled carbon nanotubes (SWNTs),1,2 double-walledCNTs,3,4 and multiwalled carbon nanotubes(MWNTs).5 Another type of important carbon nanofil-ler is vapor-grown carbon nanofiber (VGCNF), whichwas developed in the 1980s.6–8 CNTs have anisotropicelectrical,9 optical,10 mechanical,11 and thermal prop-erties.12 A number of studies have been reported ondispersing CNTs in poly(methyl methacrylate)(PMMA) by solution13,14 and melt processing15 andvia in situ polymerization.16,17 The reported propertyimprovements in CNT/PMMA composites vary overa very wide range. For instance, in one study, an 8 wt% SWNT loading resulted in a 100% enhancement ofthe tensile modulus,15 whereas in another case, only a2 wt % SWNT loading was needed to achieve a 100%enhancement in the tensile modulus.18 The additionof less than a 0.1 wt % SWNT loading to PMMA
fibers has been shown to increase the low-tempera-ture (�150�C) modulus from 5 to 7 GPa, whereas attemperatures above the glass-transition temperature(Tg), the modulus essentially remained unchanged.The author attributed these changes to PMMA/SWNT cohesive interactions at low temperatures andnot to any morphological changes in PMMA.18 DrawnPMMA fibers containing a 1 wt % SWNT loadingexhibited a dramatic increase in the strain at failure(700%) in comparison with neat PMMA fibers of asimilar draw ratio.19 Functionalized SWNTs have alsobeen used to reinforce PMMA matrix.20 SWNTsdoped with SOCl2 have been used as a reinforcementcomponent.21 In a pristine SWNT/PMMA composite, apercolation threshold as low as 0.17 wt % was found,with the conductivity value reaching 1700 S/m. WhenSWNTs were doped with SOCl2, the percolation thresh-old did not change, but the saturation conductivityreached about 10,000 S/m, and the toughness increasedto 6 GJ/m3, which is 30 times the toughness of purePMMA. PMMA composites with MWNTs as well asVGCNFs have also attracted significant atten-tion.16,17,22–27 In this article, a systematic structural, proc-essing, and property study of the reinforcement ofSWNTs,MWNTs, andVGCNFs in PMMA is reported.
EXPERIMENTAL
Two types of SWNTs, obtained from Unidym, Inc.(Menlo Park, CA), were used without further
Journal of Applied Polymer Science, Vol. 112, 142–156 (2009)VVC 2008 Wiley Periodicals, Inc.
*Present address: Department of Chemistry, University ofWisconsin, 800 West Main Street, Whitewater, WI 53190
Correspondence to: S. Kumar ([email protected]).
Contract grant sponsor: Air Force Office of ScientificResearch.

purification (SWNT-A, lot R0231 with 35 wt % metalcatalyst, and SWNT-B, lot XO021UA with 2.4 wt %metal catalyst). MWNTs were obtained from IljinNanotech Co. (Seoul, Korea), and VGCNFs (PR-24-HT) were obtained from Applied Sciences, Inc.(Cedarville, OH). Thermogravimetric analysis (TGA)of these CNTs in air at a heating rate of 10�C/minshowed the decomposition temperatures of SWNT-A, SWNT-B, MWNTs, and VGCNFs to be 422, 570,626, and 738�C, respectively. PMMA (molecularweight in the range of 95,000 to 150,000 g/mole)was obtained from Cyro Industries (Parsippany, NJ)and also used as received. Nitromethane and toluenewere obtained from Sigma–Aldrich Co. (St. Louis,MO) and also used as received.
CNTs were dispersed in nitromethane by sonica-tion (Branson 3510 sonicator, Branson UltrasonicCorp., Danbury, CT) for a certain amount of time(typically 24–48 h) until an optically homogeneoussolution was achieved. To this uniform SWNT/nitro-methane dispersion, a PMMA/nitromethane solutionwas added and mixed by stirring. The optically ho-mogeneous PMMA/SWNT/nitromethane solutionwas cast onto a glass substrate to form 20–25-lm-thick films. A control PMMA film was also preparedwith the same procedure. The resulting films weredried in vacuo at 80�C for 2 days. Table I summa-rizes the experimental conditions for preparingPMMA, SWNT-A/PMMA, and SWNT-B/PMMAfilms with different SWNT loadings. Similar process-ing conditions were used for MWNT and VGCNFcomposites.
For scanning electron microscopy (SEM), filmswere cut with a blade. Images were obtained ongold-coated cross sections of the films with a Leo1530 scanning electron microscope (LEO, Oberko-chen, Germany). Transmission electron microscopy(TEM) was conducted with a Hitachi HF-2000 (To-kyo, Japan) (operated at 200 kV). For TEM specimen
preparation, the SWNT powders were sonicated inethanol for 10 min, and then a droplet of the disper-sion was placed on the lacey carbon-coated coppergrids with a loop. The SWNT-B/PMMA compositefilm (3.53 mg) was soaked in toluene (4 mL) for 5days to completely disintegrate the film, and thenadditional toluene (20 mL) was used to dilute adrop of the suspension. A droplet of the diluted sus-pension was collected on a TEM grid with a loop.An RSA III (Rheometrics Scientific, Piscataway, NJ)was used to measure the tensile properties and thedynamic mechanical properties. The gauge length,film width, and strain rate for the tensile tests were15 mm, 5 mm, and 10%/min, respectively. Dynamicmechanical analysis was conducted at 0.1, 1.0, and10.0 Hz with a temperature increment of 2�C/min.The Tg values of the films were measured by bothdifferential scanning calorimetry (DSC; DSC100, TAInstruments) and dynamic mechanical analysis. Thecoefficient of thermal expansion (CTE) was deter-mined with thermomechanical analysis (TMA Q400,TA Instruments, New Castle, DE) at a stress of 0.35MPa on 8-mm-long and 2-mm-wide films at a heat-ing rate of 5�C/min. TGA (TGA 2950, TA Instru-ments) of various films was conducted in air (or innitrogen) at a heating rate of 10�C/min. In-planedirect-current (dc) electrical conductivity was meas-ured by the four-probe method. The Raman spectrawere collected on a Holoprobe Research Ramanmicroscope made by Kaiser Optical Systems, Inc.(Ann Arbor, MI), using a 785-nm excitation wave-length (the laser energy (Elaser) ¼ 1.58 eV).
RESULTS AND DISCUSSION
A previous dispersion study using different sol-vents28 has shown that a uniform CNT dispersioncan be obtained in nitromethane. Optical micro-graphs of SWNT-B/nitromethane and SWNT-B/
TABLE IRecipe and Preparation Conditions for the PMMA, SWNT-A/PMMA, and SWNT-B/
PMMA Composite Films
SWNT-A/SWNT-B (wt %)
SWNT-A/SWNT-B (mg)
PMMA(mg)
Nitromethane(mL)
Sonicationtime (h)
Stirringtime (h)
0 0 300 15 0 40.5 1.5 300 15 24 41 3 297 15 24 45 15 285 20 48 4
10a 30 270 40 48 415a 45 255 60 48 420 75 225 100 48 435 105 195 140 48 450 150 150 200 48 4
a Concentration at which the SWNT-A/PMMA composite samples were alsoprepared.
CNT/PMMA COMPOSITE FILMS 143
Journal of Applied Polymer Science DOI 10.1002/app

PMMA/nitromethane showed homogeneous nano-tube dispersions at the micrometer scale (Fig. 1). Forsamples containing 0.5 or 1.0 wt % SWNT, the soni-cation time was 24 h. However, for composite sam-ples containing higher nanotube loadings, a 24-hsonication time was not sufficient to achieve a homo-geneous dispersion, and so in these cases, 48 h ofsonication was used. The ratio of SWNT-B to nitro-methane and the sonication time were kept the samefor the composites with SWNT-B loadings higherthan 1.0 wt %. Similarly, uniform dispersions ofother nanotubes were also obtained with a sonica-tion time of 48 h (micrographs not shown). SWNT-B/PMMA films were prepared with a layer-by-layer
method. First, 50 mL of an SWNT-B/PMMA/nitro-methane solution was cast onto the glass substrate,and the solvent was allowed to evaporate at roomtemperature (25�C). After 12 h, another 50-mL solu-tion was cast onto this film and allowed to dry, andthis eventually resulted in the final film. For exam-ple, samples with 20, 35, or 50 wt % nanotubes havetwo, three, or four layers, respectively.A high-resolution TEM image of as-received
SWNT-A powder is given in Figure 2. The typicalsize of the metal catalyst in SWNT-A was about 4nm. SEM images of cross sections of PMMA/SWNT-A composite films (Fig. 3) show uniform nanotubedispersions in the PMMA matrix. According to the
Figure 1 Optical micrographs of SWNT-B/nitromethane and SWNT-B/PMMA/nitromethane dispersions. [Color figurecan be viewed in the online issue, which is available at www.interscience.wiley.com.]
144 LIU ET AL.
Journal of Applied Polymer Science DOI 10.1002/app

mechanical properties for SWNT-A/PMMA compo-sites listed in Table II, the elongation to break ofSWNT-A/PMMA composite films was lower thanthat of the control PMMA film. This is consistentwith studies on CNT composite films with polyacry-lonitrile (polyacrylonitrile (PAN))29 and PVA.29,30
For the composite with a 10 wt % nanotube concen-
tration, the tensile modulus was almost 3 times thatof the pure PMMA.The storage modulus (E0) and tan d curves for
PMMA and SWNT-A/PMMA composite films aregiven in Figure 4. Based on the tan d peak position,Tg of the composite films with a 10 or 15 wt % nano-tube loading was 129�C, whereas that of the control
Figure 2 TEM images of SWNT-A powder (low and high magnifications).
Figure 3 SEM images of cross sections of (a–c) SWNT-A/PMMA composite films at SWNT-A loadings of 0, 10, and 15wt %, respectively, and (d) SWNT-A powder (scale bar ¼ 1 lm).
CNT/PMMA COMPOSITE FILMS 145
Journal of Applied Polymer Science DOI 10.1002/app

PMMA film was 121�C. Tan d peaks of the compos-ite films also became broader and their magnitudesdecreased in comparison with the pure PMMA film.The magnitude of the tan d peak for the PMMAfilm, SWNT-A/PMMA (10 wt %) film, and SWNT-A/PMMA (15 wt %) film was 1.78, 0.58, and 0.42,respectively. The decrease in the tan d magnitudefor the composite films suggests suppression ofPMMA molecular motion in the presence ofCNTs.31–33 For 10 and 15 wt % SWNT-A/PMMAcomposite films, the electrical conductivity valueswere 920 and 1430 S/m, respectively (Table III).
SEM images of cross sections of SWNT-B/PMMAcomposite films at various SWNT loadings are givenin Figure 5(a–h). An SEM image of as-receivedSWNT-B powder is also given in Figure 5(i). High-resolution TEM images of as-received SWNT-B pow-der are given in Figure 6(a,b), and an SWNT-B/
PMMA (5 wt %) composite film dissolved in tolueneis shown in Figure 6(c,d). From these TEM images,we can see that there is no clear evidence of PMMAwrapping or covering SWNT-B bundles. In the liter-ature, several different polymer coatings on SWNTshave been reported. These include PAN,34 polycar-bonate,35 and polystyrene.19 The polymer coatingbehavior suggests good interaction between thepolymer and SWNTs. This may suggest that thePMMA–SWNT interaction is weaker than the SWNTinteraction with PAN, polystyrene, or polycarbonate.However, further work is needed to confirm this.For both SWNT-A/PMMA and SWNT-B/PMMA
composites, Figures 3, 5, and 6 show that the SWNTstructures were still intact even after sonication.However, HR-TEM images in Figure 6 show theeffect of nanotube cutting/shortening by sonication.Figure 6(a,b) shows SWNTs before sonication, with
TABLE IITensile Properties and Densities of the PMMA, SWNT-A/PMMA, and
SWNT-B/PMMA Composites
SWNT-B(wt %)
Tensilemodulus (GPa)
Tensilestrength (MPa)
Elongation atbreak (%)
Densitymeasured (g/cm3)
0 1.8 � 0.1 50 � 8 3.5 � 0.5 1.011 2.3 � 0.2 53 � 9 2.8 � 0.3 1.035 3.4 � 0.2 56 � 10 2.5 � 0.4 1.02
10 4.4 � 0.2 63 � 8 2.5 � 0.7 1.065.1 � 0.3a 51 � 11a 0.9 � 0.2a 1.05a
15 5.3 � 0.2 71 � 1 2.4 � 0.2 1.034.1 � 0.2b 23 � 12b 0.6 � 0.3b 1.07b
20 5.8 � 0.2 80 � 9 2.1 � 0.5 1.0335 6.7 � 0.5 105 � 8 2.5 � 0.2 1.0150 5.7 � 0.1 86 � 8 1.8 � 0.1 1.01
a SWNT-A/PMMA (10 wt %) composite film. At a 10 wt % filler loading, the SWNTcontent was 6.5 wt %, and the rest (3.5 wt %) was iron catalyst.
b SWNT-A/PMMA (15 wt %) composite film. At a 15 wt % filler loading, the SWNTcontent was 9.7 wt %, and the rest (5.3 wt %) was iron catalyst.
Figure 4 E0 and tan d behavior of PMMA and SWNT-A/PMMA composite films as a function of temperature: (a) aPMMA film, (b) SWNT-A/PMMA (10/90), and (c) SWNT-A/PMMA (15/85). [Color figure can be viewed in the onlineissue, which is available at www.interscience.wiley.com.]
146 LIU ET AL.
Journal of Applied Polymer Science DOI 10.1002/app

no ends visible, whereas after sonication, SWNTends could be observed [Fig. 6(c,d)]. Previous workon PAN/SWNT composite fibers has also shown byboth SEM and TEM studies that nanotube structuresremain intact even after long sonication times,34,36
although their length decreases.The electrical conductivity values of SWNT-B/
PMMA composite films with different nanotube
loadings are given in Table III. Because the densitiesof PMMA and SWNTs were comparable, the volumefraction of SWNT-B was taken to be the same as itsweight fraction. The inset of Figure 7 is a plot of theconductivity as a function of the SWNT-B volumefraction (V), from which a percolation volume (Vc)of 0.5% was obtained. A plot of the electrical con-ductivity as a function of V � Vc (Fig. 7) gave anexponent of 1.73, which suggested three-dimensionalpercolation behavior.SWNT-A/PMMA films exhibited higher electrical
conductivity than SWNT-B/PMMA composites.Because of the higher metal catalyst content inSWNT-A versus SWNT-B, at the same as-receivedSWNT powder loadings in the PMMA compositefilms, the SWNT-A samples contained a loweramount of nanotubes than SWNT-B. The metal cata-lyst in SWNT-A/PMMA also contributed to the elec-trical conductivity. Literature reports show thatcarbon-coated iron carbide nanoparticles (typicalmetal catalysts for SWNT samples) that are approxi-mately 100 nm in size and are embedded in poly(vi-nyl chloride) have a percolation value of 2.2 wt %.37
The size of the metal catalyst in SWNT-A was about
TABLE IIIElectrical Conductivity Values of the SWNT-B/PMMAComposite Films at Different SWNT-B Concentrations
SWNT-B (wt %) Electrical conductivity (S/m)
0 1.0 � 10�14 62
0.5 7.9 � 10�5
1 75 126
10 456 (920)a
15 854 (1430)a
20 143535 357450 5783
a The electrical conductivities of the SWNT-A/PMMAcomposites are given in parentheses for comparison.
Figure 5 SEM images of cross sections of (a–h) SWNT-B/PMMA composite films at SWNT-B concentrations of 0.5, 1.0,5.0, 10.0, 15.0, 20.0, 35.0, and 50.0 wt %, respectively, and (i) SWNT-B powder.
CNT/PMMA COMPOSITE FILMS 147
Journal of Applied Polymer Science DOI 10.1002/app

4 nm, as determined from a TEM image (Fig. 2). ForSWNT-A/PMMA (10/90), the catalyst concentrationin the composite was about 3.5 wt % in PMMA,whereas for the 15 wt % SWNT-A/PMMA sample,the catalyst concentration in the composite was 5.3wt %. According to the previously cited iron carbidestudy, the amount of metal catalyst in both the 10and 15 wt % SWNT-A/PMMA composites (3.5 and5.3 wt %, respectively) was already above the perco-lation value. These two electrically conductive net-works (SWNT-A and metal catalyst) interplayedwith each other in PMMA, and this resulted inhigher electrical conductivity than that of SWNT-B/PMMA with the same total filler loading. Becausethe 15% SWNT-A filler contained only 9.7 wt %nanotubes (and 5.3 wt % catalyst), the higher electri-cal conductivity of this sample (1430 S/m) can evenbe compared to that of samples containing 10 wt %SWNT-B (456 S/m). This further confirms the electri-cal conductivity contribution from the catalyst.
The tensile properties of PMMA and SWNT-B/PMMA composites as well as their density valuesare given in Table II. The elongation at breakdecreased with the addition of SWNT-B. However,the elongation at break was significantly higher forSWNT-B/PMMA versus SWNT-A/PMMA. We con-clude that the presence of the metal catalyst inSWNT-A was the main reason for the lower elonga-
tion at break in the PMMA/SWNT-A composites.The tensile modulus and tensile strength of the com-posite films were higher than those of the controlPMMA film. With a 35 wt % SWNT-B loading, thetensile modulus and tensile strength of the compos-ite reached a maximum. Under the current process-ing scheme, this is the optimum nanotube loading
Figure 6 TEM images of (a,b) SWNT-B powder and (c,d) an SWNT-B/PMMA (5 wt % SWNT-B loading) composite film.
Figure 7 Electrical conductivity of SWNT-B/PMMA com-posites. [Color figure can be viewed in the online issue,which is available at www.interscience.wiley.com.]
148 LIU ET AL.
Journal of Applied Polymer Science DOI 10.1002/app

for reinforcing PMMA. The properties of a 35% CNTcontaining PMMA film could be favorable in com-parison with the properties of a 60/40 PAN/SWNTfilm (tensile modulus ¼ 10.9 GPa, tensile strength ¼103 MPa, elongation to break ¼ 1.6%, CTE ¼ 1.7ppm/�C, in-plane dc electrical conductivity ¼ 1.5 �104 S/m)29 and those of 100% CNT films processedfrom sulfuric acid (tensile modulus ¼ 8 GPa, tensilestrength ¼ 30 MPa, elongation to break ¼ 0.5%, in-plane dc electrical conductivity ¼ 1 � 105 S/m)38 andprocessed from nitric acid (tensile modulus ¼ 5 GPa,tensile strength ¼ 74 GPa, elongation to break ¼ 3%,in-plane dc electrical conductivity ¼ 1.2 � 104 S/m).39
We also note that the tensile modulus of the CNT filmsis consistent with theoretical predictions.40
Tan d of the PMMA and composite films as afunction of temperature is given in Table IV. For agiven SWMT-B/PMMA composite, the tan d peakposition shifted to a higher temperature upon thetest frequency increasing, and its magnitude
decreased. At a given frequency, the tan d peak posi-tion shifted to a higher temperature and its magni-tude decreased with increasing SWNT-B loading.The decrease in the tan d magnitude suggests thesuppression of PMMA molecular motion aboveTg.
31–33 Tg activation energies calculated from tan dversus temperature plots at three frequencies withan Arrhenius equation [f ¼ A exp(�DH/RT), where fis the frequency, A is a constant, DH is the activationenergy, T is the temperature, and R is the gas con-stant] for various samples are listed in Table IV. Theactivation energies of the SWNT-B/PMMA compo-sites were comparable to that of the PMMA film.Dimensional stability data determined with ther-
momechanical analysis at a stress of 0.35 MPa and aheating rate of 5�C/min are plotted in Figure 8. TheCTEs of PMMA and SWNT-B/PMMA composites at30 and 105�C are listed in Table V. The compositefilms exhibited smaller CTEs than pure PMMA. APMMA film containing 50% CNTs exhibited a room-temperature CTE of 2 ppm/�C, whereas at the sametemperature, the in-plane CTE of a 100% PMMAfilm was 50 ppm/�C. For a 1% length change under0.35-MPa stress, the temperature increased from116�C for pure PMMA to 211�C for SWNT-B/PMMA with a 50 wt % SWNT-B loading. Tg valuesof PMMA and composite films obtained from DSCare given in Table VI. In both heating and cooling
TABLE IVTan d Peak Temperature (P) and Tan d Peak Magnitude (M) Values for the PMMA and SWNT-B/PMMA Films at
Different Frequencies and Calculated Activation Energies
SWNT-B (wt %)
0.1 Hz 1 Hz 10 HzActivation
energy (kJ/mol)P (�C) M P (�C) M P (�C) M
0 113 1.99 121 1.74 124 1.00 4975 114 0.85 122 0.72 124 0.48 52310 115 0.43 123 0.40 128 0.33 44915 123 0.43 130 0.35 137 0.32 44420 124 0.35 129 0.29 138 0.28 43635 128 0.21 133 0.20 137 0.19 50150 128 0.20 132 0.15 140 0.15 479
Figure 8 Thermal expansion of PMMA and SWNT-B/PMMA films as a function of temperature under 0.35-MPastress. The SWNT-B concentration were as follows: (a) 0,(b) 1, (c) 5, (d) 10, (e) 15, (f) 20, (g) 35, and (h) 50 wt %.[Color figure can be viewed in the online issue, which isavailable at www.interscience.wiley.com.]
TABLE VCTEs and Temperatures at a 1% Length Change forPMMA and the SWNT-B/PMMA Composite Films
SWNT-B(wt %)
CTE (10�6/�C) Temperatureat a 1% lengthchange (�C)At 30�C At 105�C
0 50 152 1161 32 137 1195 18 50 127
10 11 80 13315 9 47 14420 8 42 14435 3 24 18350 2 10 211
CNT/PMMA COMPOSITE FILMS 149
Journal of Applied Polymer Science DOI 10.1002/app
cycles, a composite film containing 50% CNTs exhib-ited a Tg that was about 6 to 7�C higher than thatfor the pure PMMA film. As expected, the tan dpeak temperature values corresponding to thePMMA glass transition (Table IV) were higher thanthose obtained from DSC. Based on the dynamic me-chanical data, Tg of a 50% CNT containing compos-ite film was about 15�C higher than that of thecontrol PMMA film (Table IV). This was comparableto the behavior of a PAN/SWNT (60/40) film, forwhich an increase of about 15�C was obtainedaccording to the dynamic mechanical data.29 Bycomparison, we note that a PAN/SWNT fiber con-taining 10 wt % SWNTs exhibited a Tg that was40�C higher than that of the control PAN fiber.33
The decrease in the tan d peak magnitude withincreasing CNT concentration was similar to behav-ior reported for PAN29 and PVA.41
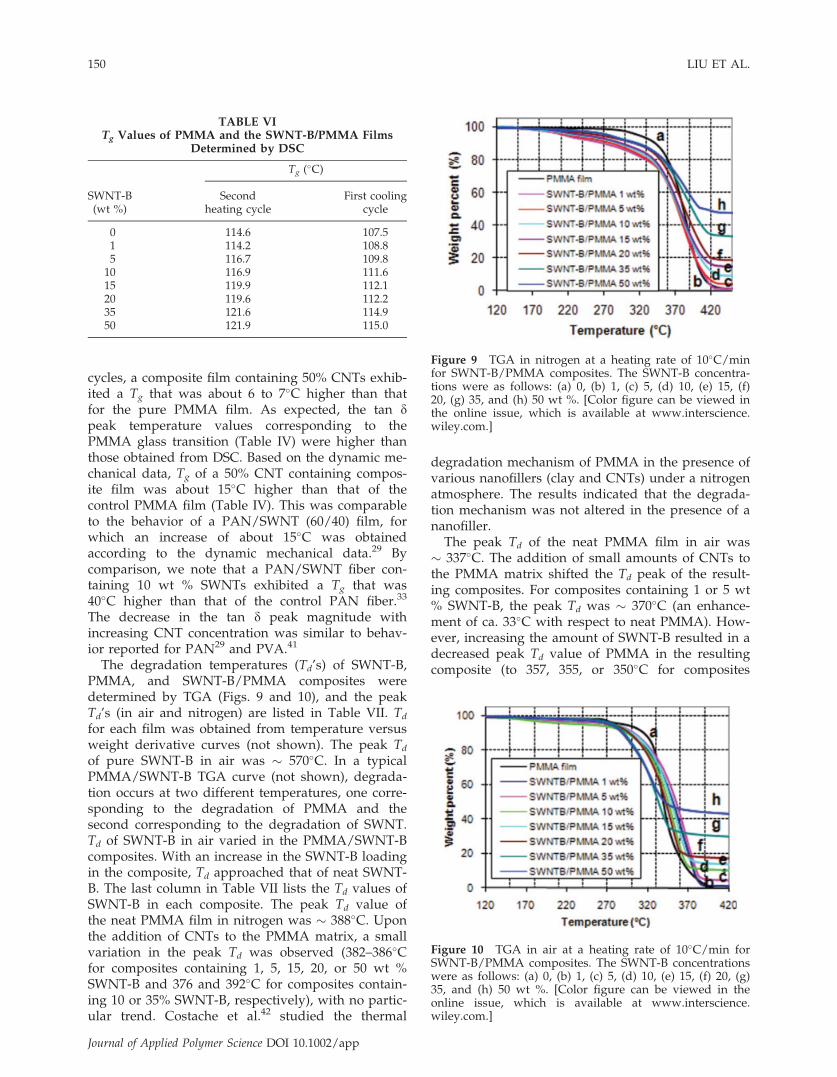
The degradation temperatures (Td’s) of SWNT-B,PMMA, and SWNT-B/PMMA composites weredetermined by TGA (Figs. 9 and 10), and the peakTd’s (in air and nitrogen) are listed in Table VII. Td
for each film was obtained from temperature versusweight derivative curves (not shown). The peak Td
of pure SWNT-B in air was � 570�C. In a typicalPMMA/SWNT-B TGA curve (not shown), degrada-tion occurs at two different temperatures, one corre-sponding to the degradation of PMMA and thesecond corresponding to the degradation of SWNT.Td of SWNT-B in air varied in the PMMA/SWNT-Bcomposites. With an increase in the SWNT-B loadingin the composite, Td approached that of neat SWNT-B. The last column in Table VII lists the Td values ofSWNT-B in each composite. The peak Td value ofthe neat PMMA film in nitrogen was � 388�C. Uponthe addition of CNTs to the PMMA matrix, a smallvariation in the peak Td was observed (382–386�Cfor composites containing 1, 5, 15, 20, or 50 wt %SWNT-B and 376 and 392�C for composites contain-ing 10 or 35% SWNT-B, respectively), with no partic-ular trend. Costache et al.42 studied the thermal
degradation mechanism of PMMA in the presence ofvarious nanofillers (clay and CNTs) under a nitrogenatmosphere. The results indicated that the degrada-tion mechanism was not altered in the presence of ananofiller.The peak Td of the neat PMMA film in air was
� 337�C. The addition of small amounts of CNTs tothe PMMA matrix shifted the Td peak of the result-ing composites. For composites containing 1 or 5 wt% SWNT-B, the peak Td was � 370�C (an enhance-ment of ca. 33�C with respect to neat PMMA). How-ever, increasing the amount of SWNT-B resulted in adecreased peak Td value of PMMA in the resultingcomposite (to 357, 355, or 350�C for composites
TABLE VITg Values of PMMA and the SWNT-B/PMMA Films
Determined by DSC
SWNT-B(wt %)
Tg (�C)
Secondheating cycle
First coolingcycle
0 114.6 107.51 114.2 108.85 116.7 109.8
10 116.9 111.615 119.9 112.120 119.6 112.235 121.6 114.950 121.9 115.0
Figure 9 TGA in nitrogen at a heating rate of 10�C/minfor SWNT-B/PMMA composites. The SWNT-B concentra-tions were as follows: (a) 0, (b) 1, (c) 5, (d) 10, (e) 15, (f)20, (g) 35, and (h) 50 wt %. [Color figure can be viewed inthe online issue, which is available at www.interscience.wiley.com.]
Figure 10 TGA in air at a heating rate of 10�C/min forSWNT-B/PMMA composites. The SWNT-B concentrationswere as follows: (a) 0, (b) 1, (c) 5, (d) 10, (e) 15, (f) 20, (g)35, and (h) 50 wt %. [Color figure can be viewed in theonline issue, which is available at www.interscience.wiley.com.]
150 LIU ET AL.
Journal of Applied Polymer Science DOI 10.1002/app

containing 10, 15, or 20% SWNT-B, respectively).The peak Td of composites containing 35 or 50%SWNT-B was lower than that of the neat PMMA.
Studies have been reported with bothincreases27,42–52 and decreases20,53–55 in the polymerTd upon the addition of CNTs. The enhancement ofthe decomposition temperature in a nanocompositewith respect to the neat polymer has been inter-preted as due to an interaction between the polymerand CNTs, in which the nanofiller acts as a restric-tion site, resulting in reduced segmental mobility ofthe polymer chains. The reduced mobility in turnassists in preventing scission of chains driven bythermal excitation.56 No clear explanation is avail-able for the decrease in the decomposition tempera-ture. The enhancement of the peak Td has also beenexplained in terms of a tortuous path effect.57 It hasbeen proposed that during the thermal degradationof clay/polymer nanocomposites, a protective sur-face barrier layer consisting of accumulated clay pla-telets with a small amount of carbonaceous char isformed.58 Kashiwagi et al.57 observed a network
structure of accumulated CNTs after thermal degra-dation of the polymer. The network could increasethe integrity of the protective layer and act as a bar-rier for the gas phase to diffuse into the bulk. Fur-ther studies are needed to fully understand theeffects of nanomaterials on the polymer Td.The peak positions for the radical breathing mode
(RBM), disorder-induced feature (D band), tangentialmode (G band), and D-band overtone (G0 band) forall the composites are given in Table VIII. Both theRBM and D band positions remained almost thesame for SWNT-B and SWNT-B/PMMA composites,whereas the G and G0 bands upshifted upon theaddition of SWNT-B into the PMMA matrix. Theshifts of the G (or G0) band were almost the samefor all the composite films, regardless of the SWNT-B concentrations, in comparison with the SWNT-Bpowder. The full width at half-maximum (fwhm) ofthe G band (Table VIII) decreased with the SWNT-Bloading increasing. Lefrant et al.13 observed that Gband widths decreased upon the addition of SWNTsinto the PMMA matrix. The authors hypothesized
TABLE VIITd Values of Each Component in the SWNT-B/PMMA Composites and Residues at
800�C Determined by TGA in Air and Nitrogen Environments at a HeatingRate of 10�C/min
SWNT-B (wt %)
Td of PMMA (�C)
Td of SWNT-B inPMMA/SWNT-B
in air (�C)
In air In nitrogen
Td Residue (%) Td Residue (%)
0 337 0.1 388 0.1 —1 370 0.4 386 1.0 5015 370 0.3 382 4.1 508
10 357 0.5 376 9.0 50915 357 0.4 385 14.1 52520 350 0.6 383 18.2 52935 333a 1.1 392 32.5 53850 326a 1.2 386 46.7 559
100 2.6 — 570
a There was also a shoulder at about 295�C.
TABLE VIIIRaman Band Positions of Various Bands and fwhm Values of the G Band
of SWNT-B and the SWNT-B/PMMA Composites
SWNT-B(wt %)
RBM(cm�1)
D band(cm�1)
G bandG0 band(cm�1)Position (cm�1) fwhm (cm�1)
0.5 266.7 1308.1 1593.1 29 2597.21 266.4 1308.7 1593.0 30 2597.15 266.4 1309.0 1592.8 29 2597.3
10 266.5 1309.5 1592.5 28 2597.915 267.2 1309.7 1592.2 27 2596.020 266.5 1308.4 1592.0 24 2596.335 267.0 1309.5 1592.5 25 2596.950 267.5 1308.6 1592.2 23 2596.0
100 266.5 1308.8 1589.0 24 2587.7
CNT/PMMA COMPOSITE FILMS 151
Journal of Applied Polymer Science DOI 10.1002/app

that the decrease in the G band width was causedby PMMA intercalation into SWNT bundles. At thesame time, an upshift in RBM was observed whenSWNTs were embedded into the PMMA matrix,although in our case RBM remained the same andthe G band width increased after SWNTs were em-bedded into the PMMA matrix. Dresselhaus andEklund59 concluded that the greater the pressure onSWNTs, the wider the G band. In our case, it maybe reasonable to consider that the pressure onSWNTs from the surrounding polymer matrix washigher at lower SWNT loadings, and so a broader Gband was found. With the nanotube content increas-ing, the pressure on SWNTs caused by the sur-rounding polymer matrix decreased, and thisresulted in the decreased width of the G band. Top-ological defects have also been reported to affect theG band width.60 However, in our case, samples con-taining low nanotube concentrations were sonicatedfor less time, and yet these samples showed the
broadest G band, whereas the G band width of thesamples containing high nanotube concentrationsthat underwent longer sonication times was compa-rable to that of the G band width of the pristinenanotube sample that underwent no sonication.Therefore, we conclude that the G band width varia-tions in our case were not related to the topologicalvariations but perhaps were related to the pressuredifferences in different samples.The solvent resistance of PMMA and SWNT-B/
PMMA composite films was examined by theimmersion of these films into toluene for 30 min atroom temperature. The films were removed fromtoluene and dried in a vacuum oven at 80�C for4 days to remove any traces of toluene. The weightchanges in PMMA and SWNT-B/PMMA compositesby their exposure to toluene for 30 min are given inTable IX. With increasing SWNT-B loadings, theweight loss based on the weight of the whole filmdecreased. The time that it took for the various sam-ples to completely disintegrate is also listed in TableIX. For 35 and 50 wt % samples, it took about 8 hfor the films to completely disintegrate. Thedecreased weight loss with increasing nanotubeloading indicated increased solvent resistance of thecomposite in comparison with pure PMMA. Fromthese observations, we conclude that the polymercloser to the CNTs takes longer to dissolve than thepolymer farther away from them. Similar solvent re-sistance behavior has also been reported for PAN/CNT films29 and fibers.33,34
SEM images of cross sections of MWNT/PMMAand VGCNF/PMMA composites are shown in Fig-ure 11. Both MWNTs and VGCNFs dispersed uni-formly in the PMMA matrix. In addition, Figure 11shows that even after sonication, the MWNT andVGCNF structures were still intact. As mentionedearlier, work on PAN/MWNT and PAN/VGCNF
TABLE IXToluene Resistance of PMMA and the SWNT-B/PMMA
Composites
SWNT-B(wt %)
Weight loss (%)
Time in whichthe film
disintegratedcompletely intoluene (h)
Based on thewhole film
weight (tolueneexposure¼ 30 min)
Based on thePMMA weight
(tolueneexposure¼ 30 min)
0 40.1 40.1 31 30.0 30.3 45 16.6 17.5 4
10 11.4 12.6 415 7.7 9.1 620 5.8 7.2 635 3.7 5.7 850 3.0 5.9 8
Figure 11 SEM images of sections of (a) MWNT/PMMA (15/85 weight ratio) and (b) VGCNF/PMMA (15/85 weightratio).
152 LIU ET AL.
Journal of Applied Polymer Science DOI 10.1002/app

composite fibers also showed that nanotube struc-tures remained intact after sonication.34,36 The me-chanical properties of various films are compared inTable X. At the same filler loading, SWNT-B had thehighest reinforcement efficiency. MWNT andVGCNF composites exhibited moderate enhance-ments in tensile modulus and tensile strength. Thedifference in the reinforcing efficiency of SWNT-Aand SWNT-B can be attributed to the presence of themetal catalyst in SWNT-A. The difference in thereinforcing efficiency of SWNT-B, MWNTs, andVGCNFs can be attributed to the differences in theirdiameters. The average diameter of SWNTs used inthis study was in the range of 1–2 nm, whereas forthe MWNTs, it was about 10–20 nm. The diameterof VGCNFs was in the range of 50–150 nm. A higherdiameter nanotube results in a lower interfacial areabetween the nanofiller and the surrounding matrix,hence reducing the reinforcing efficiency. Electricalconductivity values for various films are also com-pared in Table X. Electrical conductivities of SWNTcomposite films were about 2 orders of magnitudehigher than those of MWNT and VGCNF compositefilms. In a separate study, the surface areas of vari-ous CNT powders were measured with nitrogen gasadsorption and were analyzed with BET.61 Experi-mentally determined surface area values were as fol-lows: SWNT-A, 434 m2/g; SWNT-B, 795 m2/g;MWNTs, 161 m2/g; and VGCNFs, 41 m2/g. The me-chanical property improvements and solvent resist-
ance behavior of different types of CNTs followedthe surface area trends.Tan d peak positions at different frequencies
for PMMA, SWNT-A/PMMA, SWNT-B/PMMA,MWNT/PMMA, and VGCNF/PMMA containing 15wt % CNT loadings are given in Table XI. At a giventest frequency, the magnitude of the tan d peakdecreased and the peak temperature increased in theorder of PMMA, VGCNF/PMMA, MWNT/PMMA,SWNT-A/PMMA, and SWNT-B/PMMA films. Tg’sdetermined by the tan d peak position at a frequencyof 1 Hz were 121, 123, 123, 129, and 130�C forPMMA, VGCNF/PMMA, MWNT/PMMA, SWNT-A/PMMA, and SWNT-B/PMMA, respectively. Theglass transition activation energies are listed in TableXI. The activation energies of the CNT/PMMA com-posites were comparable to that of the PMMA film.As discussed previously, solvent resistance was
examined through the dipping of the samples intotoluene for 30 min at room temperature, and theweight loss is listed in Table XII. At the same CNTloading, SWNT-B/PMMA exhibited the highest sol-vent resistance, as evidence by a small loss of weight(7.7 and 10.8% for SWNT-B- and SWNT-A-contain-ing composites, respectively) in comparison with asubstantially higher weight loss for composites ofMWNTs and VGCNFs (23.9 and 27.2%, respec-tively). The thermal degradation behavior of PMMA,SWNT-A/PMMA, SWNT-B/PMMA, MWNT/PMMA, and VGCNF/PMMA composites in air is
TABLE XTensile Properties and Electrical Conductivity Values of the SWNT-A-, SWNT-B-,
MWNT-, and VGCNF-Reinforced PMMA Composites with 15 wt % CNT
Sample
Tensilemodulus(GPa)
Tensilestrength(MPa)
Elongationat break
(%)
Electricalconductivity
(S/m)
PMMA film 1.8 � 0.1 50 � 8 3.5 � 0.5 10 � 10�14 62
SWNT-A/PMMA (15/85) 4.1 � 0.2 23 � 12 0.6 � 0.3 1430SWNT-B/PMMA (15/85) 5.3 � 0.2 71 � 1 2.4 � 0.2 854MWNT/PMMA (15/85) 3.5 � 0.6 54 � 12 1.7 � 0.4 15VGCNF/PMMA (15/85) 3.2 � 0.1 62 � 21 1.9 � 0.6 6
TABLE XITan d Peak Temperature (P) and Tan d Peak Magnitude (M) Values for PMMA and the CNT/PMMA Films (15/85) at
Different Frequencies and Calculated Activation Energies
Sample
0.1 Hz 1 Hz 10 Hz Activationenergy(kJ/mol)P (�C) M P (�C) M P (�C) M
PMMA 113 1.99 121 1.74 124 1.00 497VGCNF/PMMA (15/85) 119 1.34 123 1.24 130 0.96 538MWNT/PMMA (15/85) 120 0.82 123 0.74 131 0.72 519SWNT-A/PMMA (15/85) 124 0.73 129 0.56 136 0.38 514SWNT-B/PMMA (15/85) 123 0.43 130 0.35 137 0.32 444
CNT/PMMA COMPOSITE FILMS 153
Journal of Applied Polymer Science DOI 10.1002/app

compared in Table XIII and Figure 12. PMMAdegraded at � 357�C in air in the SWNT-B/PMMAfilm, whereas it degraded at 374�C in the VGCNF/PMMA film. All four composites had Td values com-parable to that of the control PMMA film in nitro-
gen, and this indicates that the presence of CNTsdoes not affect PMMA degradation in nitrogen (Ta-ble XIII). The composite films also exhibited asmaller CTE than pure PMMA (Table XIV). TheCTEs of various films followed this order: PMMA >
TABLE XIIToluene Resistance Values of Various Films
Sample
Weight loss (%)
Time in which thefilm disintegratedcompletely intoluene (h)
Based on the wholefilm weight (tolueneexposure ¼ 30 min)
Based on thePMMA weight
(tolueneexposure ¼ 30 min)
PMMA 40.1 40.1 3SWNT-B/PMMA (15/85) 7.7 9.1 6SWNT-A/PMMA (15/85) 10.8 12.7 6MWNT/PMMA (15/85) 23.9 28.1 3VGCNF/PMMA (15/85) 27.2 32.0 3
TABLE XIIITd Values of Various Films Determined by TGA at a
Heating Rate of 10�C/min
Sample
Td (�C)
PMMA
Filler (CNT)in air
Inair
Innitrogen
PMMA 337 388 —SWNT-A/PMMA (15/85) 346 382 422SWNT-B/PMMA (15/85) 357 376 570MWNT/PMMA (15/85) 357 387 626VGCNF/PMMA (15/85) 374 384 738
Figure 12 TGA in air at a heating rate of 10�C/min for(a) a PMMA film, (b) SWNT-A/PMMA (15/85), (c)SWNT-B/PMMA (15/85), (d) MWNT/PMMA (15/85),and (e) VGCNF/PMMA (15/85). [Color figure can beviewed in the online issue, which is available atwww.interscience.wiley.com.]
TABLE XIVCTEs and Temperatures at a 1% Length Change for
Various Films
CTE(10�6/�C)
Temperatureat a 1% lengthchange (�C)
At30�C
At105�C
PMMA 50 152 116VGCNF/PMMA (15/85) 35 151 120MWNT/PMMA (15/85) 30 93 126SWNT-A/PMMA (15/85) 18 67 137SWNT-B/PMMA (15/85) 9 47 144
Figure 13 Thermal expansion of composite films as afunction of temperature under 0.35-MPa stress at a heatingrate of 5�C/min: (a) a VGCNF/PMMA film (15/85), (b)MWNT/PMMA (15/85), (c) SWNT-A/PMMA (15/85),and (d) SWNT-B/PMMA (15/85). [Color figure can beviewed in the online issue, which is available atwww.interscience.wiley.com.]
154 LIU ET AL.
Journal of Applied Polymer Science DOI 10.1002/app

VGCNF/PMMA > MWNT/PMMA > SWNT-A/PMMA > SWNT-B/PMMA (Fig. 13). For a 1%length change under 0.35-MPa stress, the tempera-ture increased from 119�C for VGCNF/PMMA to144�C for SWNT-B/PMMA. The results indicate thatthe composite containing SWNT-B had the highestdimensional stability.
CONCLUSIONS
On the basis of the dispersion study, nitromethanewas employed as the solvent to process CNT/PMMA composites. SWNT-A (35.0 wt % catalyst)/PMMA, SWNT-B (2.4 wt % catalyst)/PMMA,MWNT/PMMA, and VGCNF/PMMA compositefilms with 15 wt % CNT loadings were processed.SWNT-B/PMMA composites with CNT loadings of0.5, 1, 5, 10, 15, 20, 35, and 50 wt % were processed.For all these compositions, CNT dispersed uniformlyinto the PMMA matrix as evidenced by opticalmicrographs and SEM images. Relatively poor me-chanical properties and dimensional stability ofSWNT-A composites versus SWNT-B/PMMA com-posites were attributed to the presence of catalyticmetal impurities. With the SWNT-B loading increas-ing, the dimensional stability (� 96% reduction inCTE with a 50 wt % SWNT-B loading) and the sol-vent resistance were enhanced. As expected, theelectrical conductivity of SWNT-B/PMMA increasedwith an increasing SWNT-B loading, with percola-tion at 0.5 vol % CNTs. The tensile modulus and thetensile strength did not increase linearly withincreasing nanotube loading; they reached the maxi-mum values with 35 wt % SWNT-B. The tensileproperties and electrical conductivity values of thePMMA/CNT composites could be compared to theproperties of PAN/CNT films and 100% CNT buckypaper.
Among the various CNT/PMMA composites stud-ied in this article, the SWNT-B/PMMA compositefilm exhibited the highest enhancement of the tensilemodulus, tensile strength, dimensional stability, andsolvent resistance, and it was followed by compo-sites of SWNT-A, MWNTs, and VGCNFs. AnSWNT-A-reinforced PMMA composite had the high-est electrical conductivity among these four CNT/PMMA composites. The higher electrical conductiv-ity in the SWNT-A composites versus the SWNT-Bcomposites was due to the additional conductivitynetwork formed by the metal catalyst. Td of PMMAin nitrogen did not vary significantly in the compo-sites, indicating that CNTs by themselves did notaffect the PMMA decomposition. Property improve-ments in various composites followed the trendsobserved for the CNT surface areas.
References
1. Bethune, D. S.; Kiang, C. H.; Devries, M. S.; Gorman, G.;Savoy, R.; Vazquez, J.; Beyers, R. Nature 1993, 363, 605.
2. Iijima, S.; Ichihashi, T. Nature 1993, 363, 603.3. Sugai, T.; Yoshida, H.; Shimada, T.; Okazaki, T.; Shinohara, H.
Nano Lett 2003, 3, 769.4. Bandow, S.; Takizawa, M.; Hirahara, K.; Yudasaka, M.; Iijima,
S. Chem Phys Lett 2001, 337, 48.5. Iijima, S. Nature 1991, 354, 56.6. Minus, M. L.; Kumar, S. JOM 2005, 57, 52.7. Carneiro, O. S.; Covas, J. A.; Bernardo, C. A.; Caldeira, G.;
Van Hattum, F. W. J.; Ting, J. M.; Alig, R. L.; Lake, M. L. Com-pos Sci Technol 1998, 58, 401.
8. Uchida, T.; Anderson, D. P.; Minus, M. L.; Kumar, S. J MaterSci 2006, 41, 5851.
9. Bae, D. J.; Kim, K. S.; Park, Y. S.; Suh, E. K.; An, K. H.; Moon,J. M.; Lim, S. C.; Park, S. H.; Jeong, Y. H.; Lee, Y. H. Phys RevB 2001, 64, 233401.
10. Bozovic, I.; Bozovic, N.; Damnjanovic, M. Phys Rev B 2000, 62,6971.
11. Popov, V. N.; Van Doren, V. E.; Balkanski, M. Solid StateCommun 2000, 114, 395.
12. Che, J.W.; Cagin, T.; Goddard,W.A.Nanotechnology 2000, 11, 65.13. Stephan, C.; Nguyen, T. P.; de la Chapelle, M. L.; Lefrant, S.;
Journet, C.; Bernier, P. Synth Met 2000, 108, 139.14. Abraham, J. K.; Philip, B.; Witchurch, A.; Varadan, V. K.;
Reddy, C. C. Smart Mater Struct 2004, 13, 1045.15. Haggenmueller, R.; Gommans, H. H.; Rinzler, A. G.; Fischer, J.
E.; Winey, K. I. Chem Phys Lett 2000, 330, 219.16. Jia, Z. J.; Wang, Z. Y.; Xu, C. L.; Liang, J.; Wei, B. Q.; Wu, D.
H.; Zhu, S. W. Mater Sci Eng A 1999, 271, 395.17. Sung, J. H.; Kim, H. S.; Jin, H. J.; Choi, H. J.; Chin, I. J. Macro-
molecules 2004, 37, 9899.18. Du, F. M.; Fischer, J. E.; Winey, K. I. J Polym Sci Part B: Polym
Phys 2003, 41, 3333.19. Sabba, Y.; Thomas, E. L. Macromolecules 2004, 37, 4815.20. Ramanathan, T.; Liu, H.; Brinson, L. C. J Polym Sci Part B:
Polym Phys 2005, 43, 2269.21. Skakalova, V.; Dettlaff-Weglikowska, U.; Roth, S. Synth Met
2005, 152, 349.22. Jin, Z. X.; Pramoda, K. P.; Goh, S. H.; Xu, G. Q. Mater Res
Bull 2002, 37, 271.23. Jin, Z.; Pramoda, K. P.; Xu, G.; Goh, S. H. Chem Phys Lett
2001, 337, 43.24. Park, S. J.; Cho, M. S.; Lim, S. T.; Cho, H. J.; Jhon, M. S. Mac-
romol Rapid Commun 2003, 24, 1070.25. Hwang, G. L.; Shieh, Y. T.; Hwang, K. C. Adv Funct Mater
2004, 14, 487.26. Gorga, R. E.; Cohen, R. E. J Polym Sci Part B: Polym Phys
2004, 42, 2690.27. Zeng, J. J.; Saltysiak, B.; Johnson, W. S.; Schiraldi, D. A.;
Kumar, S. Compos B 2004, 35, 173.28. Liu, J.; Liu, T.; Kumar, S. Polymer 2005, 46, 3419.29. Guo, H.; Sreekumar, T. V.; Liu, T.; Kumar, S. Polymer 2005,
46, 3001.30. Zhang, X. F.; Liu, T.; Sreekumar, T. V.; Kumar, S.; Moore, V.
C.; Hauge, R. H.; Smalley, R. E. Nano Lett 2003, 3, 1285.31. Li, K.; Gao, X. L.; Roy, A. K. Mech Adv Mater Struct 2006, 13,
317.32. Pryamitsyn, V.; Ganesan, V. Macromolecules 2006, 39, 844.33. Sreekumar, T. V.; Liu, T.; Min, B. G.; Guo, H.; Kumar, S.;
Hauge, R. H.; Smalley, R. E. Adv Mater 2004, 16, 58.34. Chae, H. G.; Minus, M. L.; Kumar, S. Polymer 2006, 47, 3494.35. Fornes, T. D.; Baur, J. W.; Sabba, Y.; Thomas, E. L. Polymer
2006, 47, 1704.36. Chae, H. G.; Sreekumar, T. V.; Uchida, T.; Kumar, S. Polymer
2005, 46, 10925.
CNT/PMMA COMPOSITE FILMS 155
Journal of Applied Polymer Science DOI 10.1002/app

37. Shekhar, S.; Prasad, V.; Subramanyam, S. Mater Sci Eng B2006, 133, 108.
38. Sreekumar, T. V.; Liu, T.; Kumar, S. ChemMater 2003, 15, 175.39. Zhang, X. F.; Sreekumar, T. V.; Liu, T.; Kumar, S. J Phys
Chem B 2004, 108, 16435.40. Liu, T.; Kumar, S. Nano Lett 2003, 3, 647.41. Shaffer, M. S.; Windle, A. H. Adv Mater 1999, 11, 937.42. Costache, M. C.; Wang, D. Y.; Heidecker, M. J.; Manias, E.;
Wilkie, C. A. Polym Adv Technol 2006, 17, 272.43. Xiong, J. W.; Zheng, Z.; Qin, X. M.; Li, M.; Li, H. Q.; Wang, X.
L. Carbon 2006, 44, 2701.44. Li, J.; Tong, L. F.; Fang, Z. P.; Gu, A. J.; Xu, Z. B. Polym
Degrad Stab 2006, 91, 2046.45. McNally, T.; Potschke, P.; Halley, P.; Murphy, M.; Martin, D.;
Bell, S. E. J.; Brennan, G. P.; Bein, D.; Lemoine, P.; Quinn, J. P.Polymer 2005, 46, 8222.
46. Moon, S. I.; Jin, F.; Lee, C.; Tsutsumi, S.; Hyon, S. H. Macro-mol Symp 2005, 224, 287.
47. Wang, B.; Sun, G. P.; Sun, G.; He, X. F.; Liu, J. J. Acta PolymSinica 2006, 3, 408.
48. Yang, J.; Lin, Y. H.; Wang, J. F.; Lai, M. F.; Li, J.; Liu, J. J.;Tong, X.; Cheng, H. M. J Appl Polym Sci 2005, 98, 1087.
49. Gao, J. B.; Itkis, M. E.; Yu, A. P.; Bekyarova, E.; Zhao, B.; Had-don, R. C. J Am Chem Soc 2005, 127, 3847.
50. Xia, H. S.; Song, M. Soft Matter 2005, 1, 386.51. Choi, Y. K.; Sugimoto, K. I.; Song, S. M.; Endo, M. Mater Lett
2005, 59, 3514.52. Xie, H. F.; Liu, B. H.; Yang, H.; Wang, Z. L.; Shen, J. Y.;
Cheng, R. S. J Appl Polym Sci 2006, 100, 295.53. Yang, S. Y.; Castilleja, J. R.; Barrera, E. V.; Lozano, K. Polym
Degrad Stab 2004, 83, 383.54. Xu, Y. S.; Ray, G.; Abdel-Magid, B. Compos A 2006, 37,
114.55. Probst, O.; Moore, E. M.; Resasco, D. E.; Grady, B. P. Polymer
2004, 45, 4437.56. Drozdov, A. D. Macromol Nanotechnol 2007, 43, 1681.57. Kashiwagi, T.; Grulke, E.; Hilding, J.; Harris, R.; Awad, W.;
Douglas, J. Macromol Rapid Commun 2002, 23, 761.58. Gilman, J. W. Appl Clay Sci 1999, 15, 31.59. Dresselhaus, M. S.; Eklund, P. C. Adv Phys 2000, 49, 705.60. Wu, G.; Dong, J. M. Phys Rev B 2006, 73, 245.61. Guo, H. Ph.D. Thesis, Georgia Institute of Technology, 2007.62. Brandrup, J.; Immergut, E. H.; Grulke, E. A.; Bloch, D. R. Poly-
mer Handbook; Wiley: New York, 1999.
156 LIU ET AL.
Journal of Applied Polymer Science DOI 10.1002/app