processing of geophysical exploration · pdf filestructural geological layers of earth crust...
TRANSCRIPT
79
PROCESSING OF GEOPHYSICAL EXPLORATION DATA CONDUCTED BY SEISMOACOUSTIC WAY ON THE BASIS OF “FUZZY LOGIC” METHOD
(Azerbaijan sector of Caspian sea “Goshadash” investigation area).
Farman Novruz Mammadov
M.Yuzbeyov 28, Baku, The Azerbaijan Republic ([email protected])
Ramila Eldar Mammadova
A.Huseynzadeh 64, Baku, The Azerbaijan Republic ([email protected])
ABSTRACT
The present article is devoted to processing and interpretation of data obtained from the geophysical exploration conducted by seismoacoustic way in the Caspian sea on the basis of “Fuzzy logic” method. Conducting “Fuzzy logic” seismoacoustic data processing and interpretation assumes considerable importance from the point of view of efficiency improvement. The following results have been achieved during the research work:
1) Accuracy in identification of non-homogeneous composition of structural geological layers of earth crust under the seabed has been achieved.
2) Clarity in depiction of tectonic distortions and contours of separation boundaries of homogeneous rocks of structure layers has been attained.
3) The accuracy of interpretation of seismoacoustic profile images and their quality have been improved.
4) The establishment of a database enabling the use of fuzzy logic and expert system has been possible.
Keywords: data processing, reflected waves, Interpretation, database, expert system

Processing of Geophysical Exploration Data Conducted by Seismoacoustic Way on the Basis of ‘Fuzzy Logic’ Method
80
1. Introduction
Oil and gas production in our modern world keeps advancing towards the depth of oceans and seas in the world. The conduct of geophysical exploration and research works in offshore conditions, processing and interpretation of obtained data require the implementation of innovative methods. Thus, the implementation of innovative technology and equipment as well as algorithms and programs during both exploration and research works in sea waters and processing the data are of great importance There is a great demand for upgrading calculation methods and geological interpretation means of geophysical data. The processing of seismoacoustic data based on the implementation of “Fuzzy logic “ method is of great significance from the point of view of accuracy achievement, mitigation of errors and improvement of the quality of profile images. In fact, the outlines of geological structure levels of the earth crust under seabed are not of homogeneous composition. Outlines of separation of sea water, silt, clay, sand, lime and etc.levels from each other turned to a compound structure and consist of this and other types of homogeneous rocks [3]. Finding out the ratio of mud to sand and others inside the separation outline of mudstones and sandstones by means of “Fuzzy logic” method contributes to the improvement of accuracy. Creation of database, investigation and recognition algorithms as well as establishment of expert systems for the implementation of rock types are the main stages of this method. Depicting seismoacoustic profiles with traces and studying spectral characteristics of these traces are essential while processing the initial data. As it is known, the number of pixels in the points of profile traces and amplitudes are the main characteristic parameters. The assessment and calculation of these parameters with high precision in creation of database via “Fuzzy logic” processing method plays a significant role. Another advantage of using this data processing and interpretation method is that, the distinction of anomalies and tectonic disorders unexplored in the research area is clearly shown, the possibility of defining the structure changes and assessing the rock type is high [2].
2. Traditional seismic-acoustiik investigation and interpretaion methods
Processing and interpretation of data obtained from the geophysical exploration conducted by seismoacoustic way in Azerbaijan sector of the Caspian sea aims at exploring geological structure levels of places with deep foundations, identifying anomalies and tectonic distortions. The geological structure levels of the earth crust under the seabed of the Caspian sea consist of approximately the same components
GAU Journal of Soc. & App. Sciences vol. 6, issue 10
81
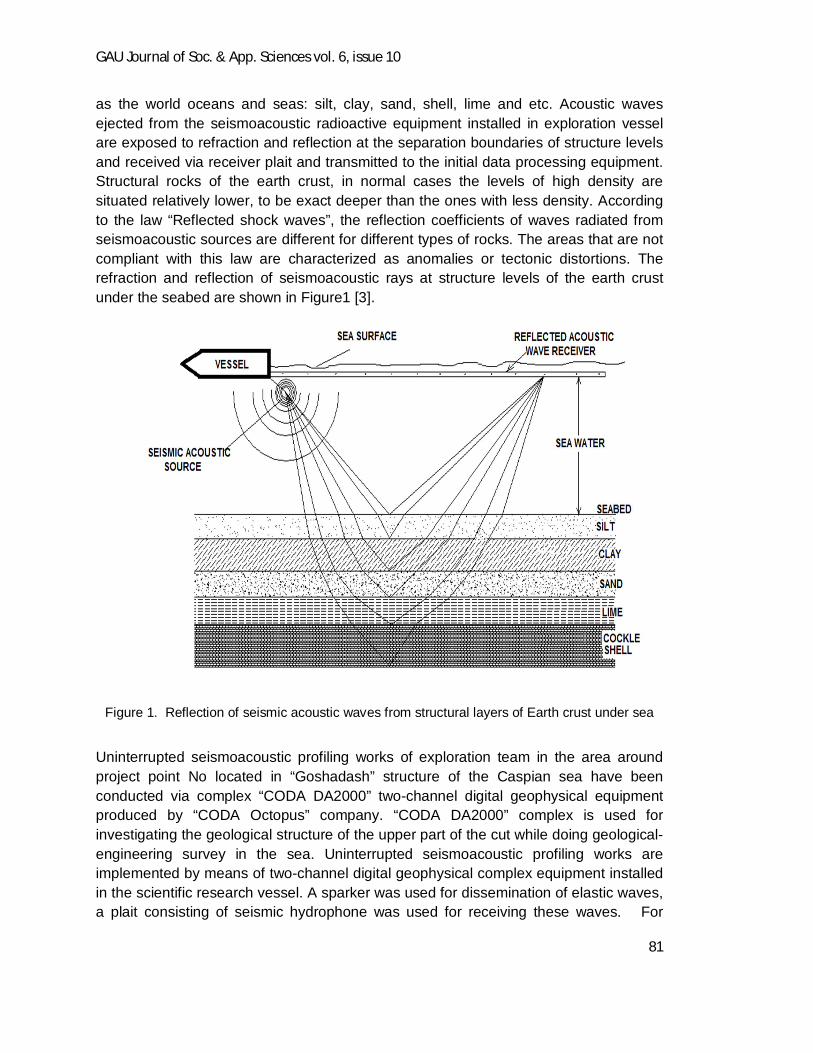
as the world oceans and seas: silt, clay, sand, shell, lime and etc. Acoustic waves ejected from the seismoacoustic radioactive equipment installed in exploration vessel are exposed to refraction and reflection at the separation boundaries of structure levels and received via receiver plait and transmitted to the initial data processing equipment. Structural rocks of the earth crust, in normal cases the levels of high density are situated relatively lower, to be exact deeper than the ones with less density. According to the law “Reflected shock waves”, the reflection coefficients of waves radiated from seismoacoustic sources are different for different types of rocks. The areas that are not compliant with this law are characterized as anomalies or tectonic distortions. The refraction and reflection of seismoacoustic rays at structure levels of the earth crust under the seabed are shown in Figure1 [3].
Figure 1. Reflection of seismic acoustic waves from structural layers of Earth crust under sea
Uninterrupted seismoacoustic profiling works of exploration team in the area around project point No located in “Goshadash” structure of the Caspian sea have been conducted via complex “CODA DA2000” two-channel digital geophysical equipment produced by “CODA Octopus” company. “CODA DA2000” complex is used for investigating the geological structure of the upper part of the cut while doing geological-engineering survey in the sea. Uninterrupted seismoacoustic profiling works are implemented by means of two-channel digital geophysical complex equipment installed in the scientific research vessel. A sparker was used for dissemination of elastic waves, a plait consisting of seismic hydrophone was used for receiving these waves. For
Processing of Geophysical Exploration Data Conducted by Seismoacoustic Way on the Basis of ‘Fuzzy Logic’ Method
82
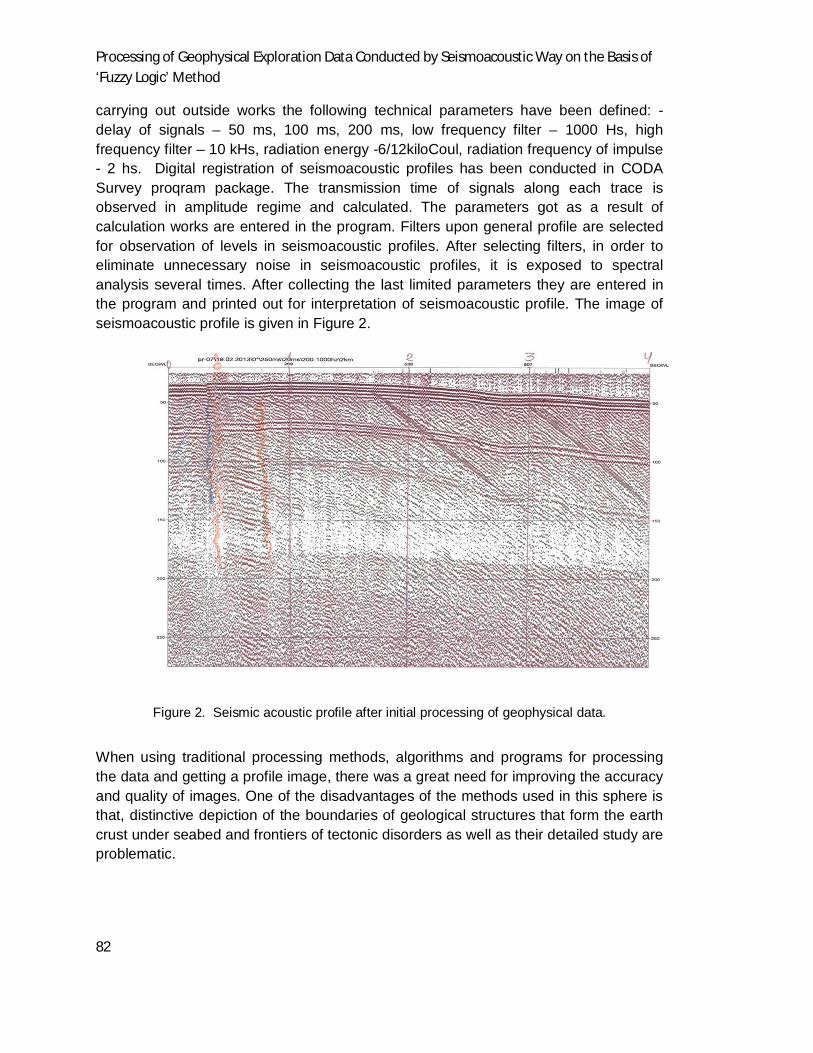
carrying out outside works the following technical parameters have been defined: - delay of signals – 50 ms, 100 ms, 200 ms, low frequency filter – 1000 Hs, high frequency filter – 10 kHs, radiation energy -6/12kiloCoul, radiation frequency of impulse - 2 hs. Digital registration of seismoacoustic profiles has been conducted in CODA Survey proqram package. The transmission time of signals along each trace is observed in amplitude regime and calculated. The parameters got as a result of calculation works are entered in the program. Filters upon general profile are selected for observation of levels in seismoacoustic profiles. After selecting filters, in order to eliminate unnecessary noise in seismoacoustic profiles, it is exposed to spectral analysis several times. After collecting the last limited parameters they are entered in the program and printed out for interpretation of seismoacoustic profile. The image of seismoacoustic profile is given in Figure 2.
Figure 2. Seismic acoustic profile after initial processing of geophysical data.
When using traditional processing methods, algorithms and programs for processing the data and getting a profile image, there was a great need for improving the accuracy and quality of images. One of the disadvantages of the methods used in this sphere is that, distinctive depiction of the boundaries of geological structures that form the earth crust under seabed and frontiers of tectonic disorders as well as their detailed study are problematic.

GAU Journal of Soc. & App. Sciences vol. 6, issue 10
83
3. What is reason and requirement of using “Fuzzy Logic” method
The visual selection and correlation of useful waves are carried out in the next stage. They are picked out in case the separate seismic boundaries have been formed as a result of selecting the sinphase arrows that are compliant with incoming time of single reflected wave and these boundaries match various levels of geological cut. In the next stage multiple reflected waves, refraction and slides are chosen. The creation of rated waves are aligned with most differing boundaries of acoustic solidity or refraction breakages are detected. Rated waves cause a difficulty in selecting useful signals and decreases the exploration depth. Disjunctive refractions are defined in accordance with protuberances in seabed relief, power of defraction waves and replacement in reflected boundaries. One of characteristic calculations of processing and interpretation processes is interactive conversion of agile time-space and vice versa space-time dimensions. The profile cut processed through filtering and correlation stages is shown in Figure 3.
Figure 3. The Interpreted seismic acoustic profile after processing and correction.
There is a great demand for improving the accuracy while processing data through implemented algorithms and programs and getting profile images as well as improving the quality of images. One of the disadvantages of the methods used in this sphere is that, there are problems in clear identification of separation outlines of geological structures of the earth crust under the seabed, counters of tectonic distortions and their detailed study. There is a great need for enhancement of calculation methods and the

Processing of Geophysical Exploration Data Conducted by Seismoacoustic Way on the Basis of ‘Fuzzy Logic’ Method
84
means of geological interpretation of geophysical data. The processing of seismoacoustic data based on the implementation of “Fuzzy logic “ method is of great significance from the point of view of accuracy achievement, mitigation of errors and improvement of the quality of profile images.
In fact, the boundaries of geological structure levels of the earth crust under the seabed are not of homogeneous composition. Outlines of separation of sea water, silt, clay, sand, lime and etc.levels from each other turned to a compound structure and consist of this and other types of homogeneous rocks. Finding out the ratio of mud to sand and others inside the separation outline of mudstones and sandstones by means of “Fuzzy logic” method contributes to the improvement of accuracy.
4. Creating of database according to travel time of reflecting acoustic waves on geological strucrures
The conduct of “Fuzzy logic” method for the purpose of defining the separation outlines of geological structure levels of the earth crust under the seabed has been substantiated the following way. In real circumstances the true values, to be exact, the values of interactive transition functions of geological levels in accordance with fuzzy logic vary between the interval of 0 and 1. The transition of layer structure formations from one to another at each transition level and getting the real value between the range of 0 and 1 by those true values is considered to be the main condition. According to these values it is possible to define the type of rock in the interactive transition boundaries of layers as well as in the so-called homogeneous parts. The actual quantity of researched rock types or true values is over four and is inserted in the database. Thus, after the silt and sand layers, further towards the depth lime, gravel, shell and other types of rocks are encountered. The determination of true values within the range of 0 and 1 at the separation outlines of structure levels enables to improve the accuracy of geophysical data processing and quality of images when doing geological interpretation. The depiction of exact contours of structure outlines is achieved with maximum accuracy via fuzzy-logic method. The application of this method is also efficient from tectonic distortions and anomalies point of view. The analysis of all these exploration results is utterly important for investigating the areas where it is planned to set up stationary installations and platforms and sketching 2D and 3D maps of those areas [1].
The acoustic or seismic impedance based on wave reflection method is calculated according to Z=vp formula [4, 6]. The symbol V signifies the dissemination speed of seismoacoustic waves in the environment and symbol p signifies the density of the environment. When transforming from environment with p1 density to the environment with density of p2, acoustic waves are exposed to refraction and reflection. The

GAU Journal of Soc. & App. Sciences vol. 6, issue 10
85
indication of R-seismic reflection coefficient with Z- acoustic impedances is as follows below:
12
12
ZZZZR
....................................(1)
The amplitude of waves refracted in the same order is equal to transmission coefficient of the environment and amplitude outcome of radiated acoustic waves. The transmission coefficient in normal case or the pressure of waves produced from the source or the ratio of waves disseminated in the environment:
12
12ZZ
ZT
................................(2)
The final amplitudes of reflected and radiated waves will be as follows below:
TZZZZ
ZZZZZZR
12
11
12
12121 .............(3)
The time it takes for a reflection from a particular boundary to arrive at the geophone is called the travel time. If the seismic wave velocity in the rock is known, then the travel time may be used to estimate the depth to the reflector. For a simple vertically traveling wave, the travel time from the surface to the reflector and back is called the Two-Way Time (TWT) and is given by the formula
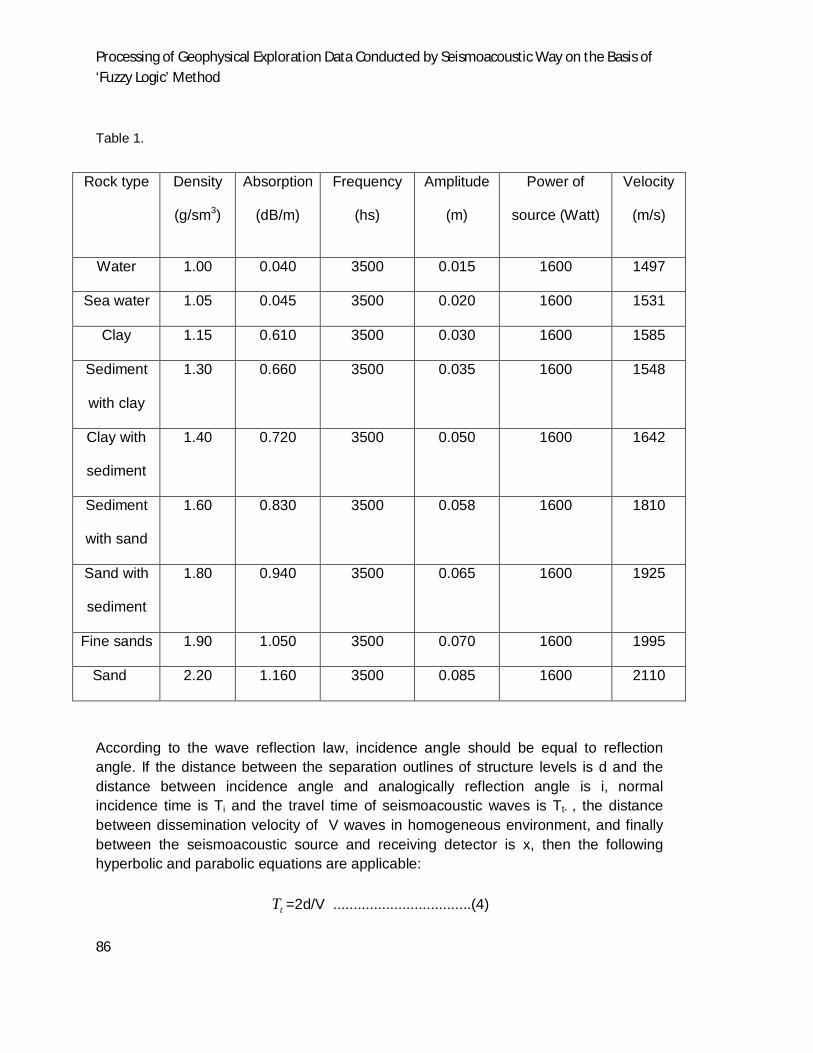
where is the depth of the reflector and is the wave velocity in the rock. The dissemination, absorption and other characteristic features of seismoacoustic waves in several types of rocks are shown in Table 1.
Processing of Geophysical Exploration Data Conducted by Seismoacoustic Way on the Basis of ‘Fuzzy Logic’ Method
86
Table 1.
According to the wave reflection law, incidence angle should be equal to reflection angle. If the distance between the separation outlines of structure levels is d and the distance between incidence angle and analogically reflection angle is i, normal incidence time is Ti and the travel time of seismoacoustic waves is Tt- , the distance between dissemination velocity of V waves in homogeneous environment, and finally between the seismoacoustic source and receiving detector is x, then the following hyperbolic and parabolic equations are applicable:
tT =2d/V ..................................(4)
Rock type Density
(g/sm3)
Absorption
(dB/m)
Frequency
(hs)
Amplitude
(m)
Power of
source (Watt)
Velocity
(m/s)
Water 1.00 0.040 3500 0.015 1600 1497
Sea water 1.05 0.045 3500 0.020 1600 1531
Clay 1.15 0.610 3500 0.030 1600 1585
Sediment
with clay
1.30 0.660 3500 0.035 1600 1548
Clay with
sediment
1.40 0.720 3500 0.050 1600 1642
Sediment
with sand
1.60 0.830 3500 0.058 1600 1810
Sand with
sediment
1.80 0.940 3500 0.065 1600 1925
Fine sands 1.90 1.050 3500 0.070 1600 1995
Sand 2.20 1.160 3500 0.085 1600 2110

GAU Journal of Soc. & App. Sciences vol. 6, issue 10
87
2222 /)4( VxdT .............................(5)
2222 / VxTT t (hyperbolic equation)
22 2/ VTxTT tt (parabolic approximation)
A series of apparently related reflections on several seismograms is often referred to as a reflection event. By correlating reflection events, it is possible to create an estimated cross-section of the geologic structure that generated the reflections.
5. Expert system formation for seismic-acoustic investigation method
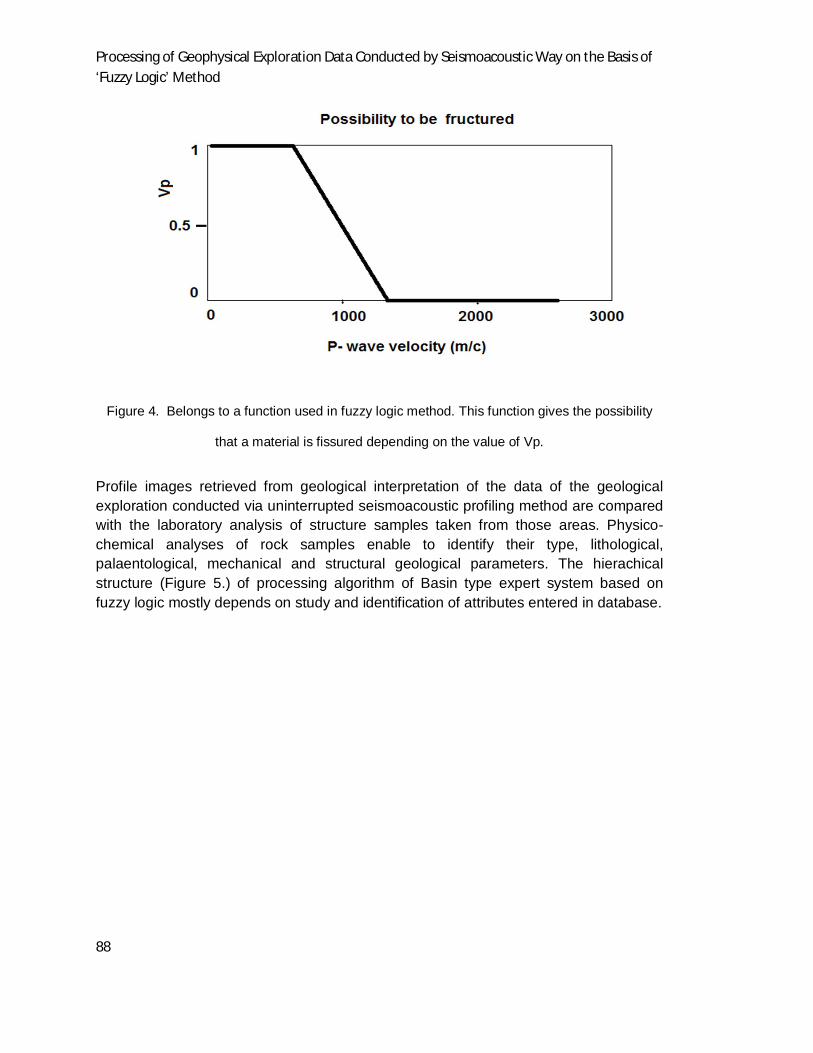
Interpretation of large surveys is usually performed with programs using high-end two and three dimensional computer graphics. In some cases, physical or empirical relations do not exist or correlations are not sufficiently representative to be used as described above. These cases can nevertheless be considered if a thematic expert drives the transformation processes. Using this approach, the expert has to define some rules, known from its own experience that will be the basis of the translation of geophysical parameters into soil characteristics [5]. Generally, and in the classical way of doing, the interpretation of geophysical data in terms of geological cross maps is carried out by these means. For making such operations less subjective, new methodologies based on fuzzy logic have been tested to replace expert’s interpretations. The principle consists of formulating the expert’s rules into mathematical functions that are then used to transform geophysical data into soil interpretation (Figure 4).
Creation of database, investigation and recognition algorithms as well as establishment of expert systems for the implementation of rock types are the main stages of this method. Depicting seismoacoustic profiles with traces and studying spectral characteristics of these traces are essential while processing the initial data. As it is known, the number of pixels in the points of profile traces and amplitudes are the main characteristic parameters. The image of traces of profile part provided in time scale is given in Figure 7. The assessment and calculation of these parameters with high precision in creation of database via “Fuzzy logic” processing method plays a significant role. By these digital figures the types of rock structures are defined at the recognition stage. Another advantage of using this data processing and interpretation method is that, the distinction of anomalies and tectonic disorders unexplored in the research area is clearly shown, the possibility of defining the structure changes and assessing the rock type is high ( Figure 4).
Processing of Geophysical Exploration Data Conducted by Seismoacoustic Way on the Basis of ‘Fuzzy Logic’ Method
88
Figure 4. Belongs to a function used in fuzzy logic method. This function gives the possibility
that a material is fissured depending on the value of Vp.
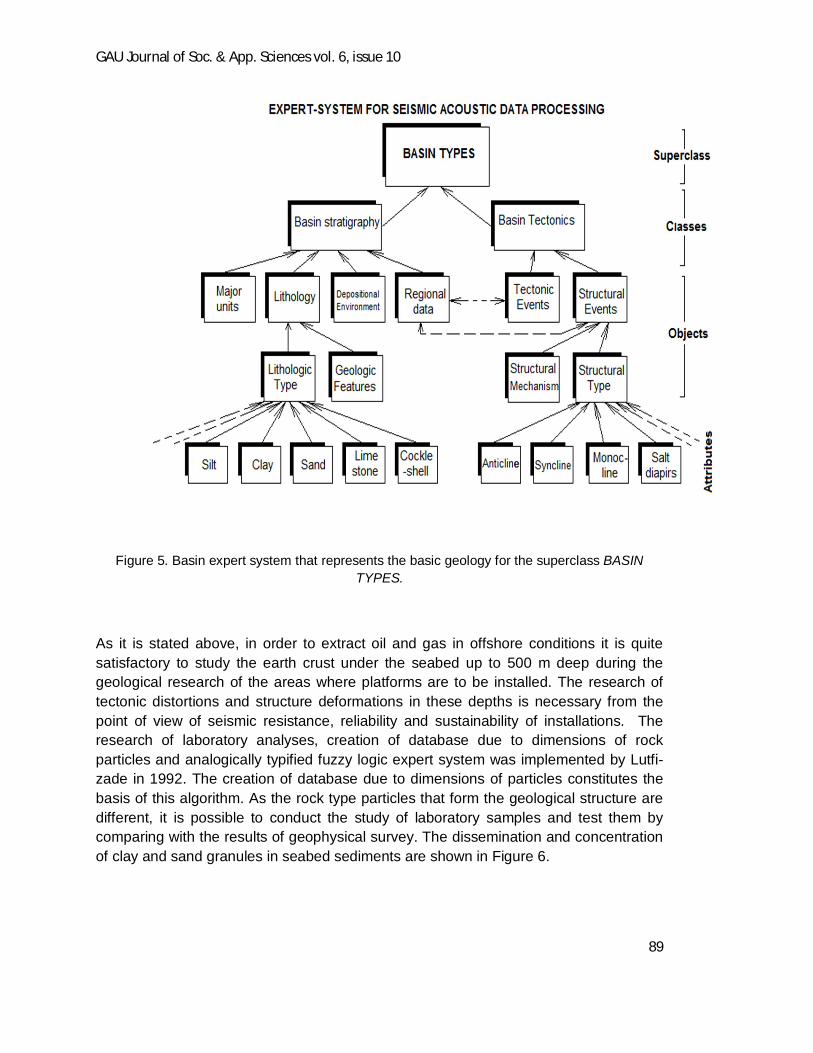
Profile images retrieved from geological interpretation of the data of the geological exploration conducted via uninterrupted seismoacoustic profiling method are compared with the laboratory analysis of structure samples taken from those areas. Physico-chemical analyses of rock samples enable to identify their type, lithological, palaentological, mechanical and structural geological parameters. The hierachical structure (Figure 5.) of processing algorithm of Basin type expert system based on fuzzy logic mostly depends on study and identification of attributes entered in database.
GAU Journal of Soc. & App. Sciences vol. 6, issue 10
89
Figure 5. Basin expert system that represents the basic geology for the superclass BASIN TYPES.
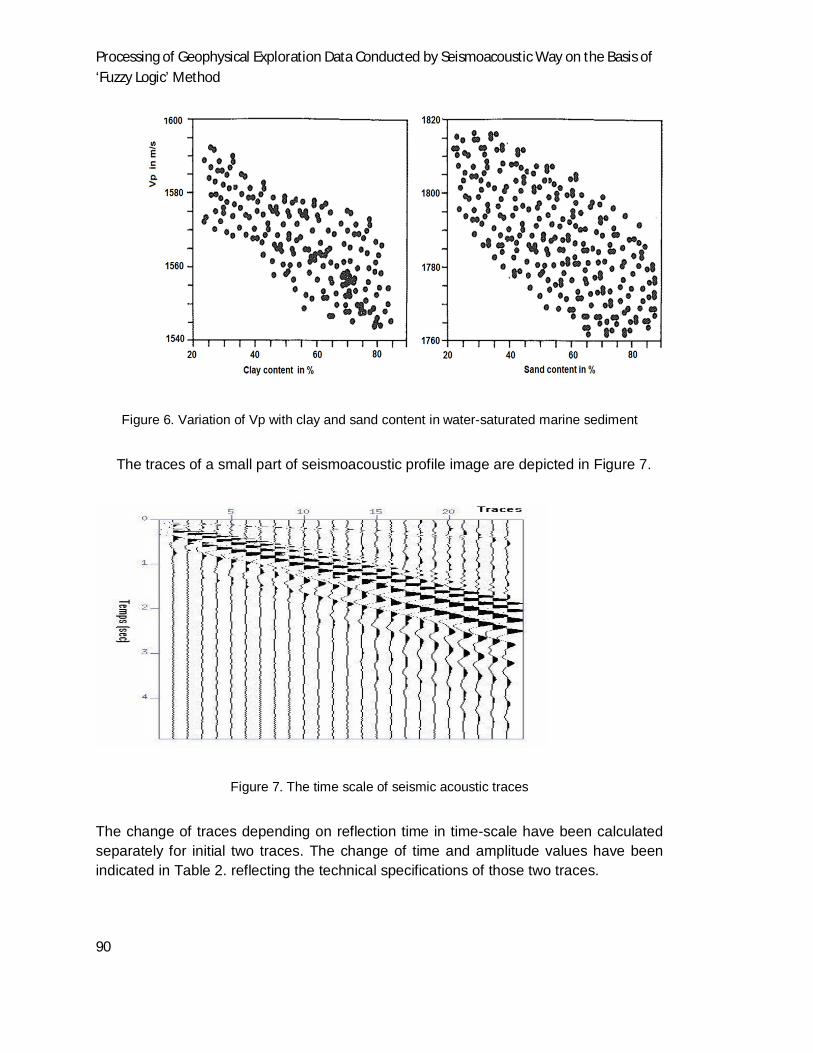
As it is stated above, in order to extract oil and gas in offshore conditions it is quite satisfactory to study the earth crust under the seabed up to 500 m deep during the geological research of the areas where platforms are to be installed. The research of tectonic distortions and structure deformations in these depths is necessary from the point of view of seismic resistance, reliability and sustainability of installations. The research of laboratory analyses, creation of database due to dimensions of rock particles and analogically typified fuzzy logic expert system was implemented by Lutfi-zade in 1992. The creation of database due to dimensions of particles constitutes the basis of this algorithm. As the rock type particles that form the geological structure are different, it is possible to conduct the study of laboratory samples and test them by comparing with the results of geophysical survey. The dissemination and concentration of clay and sand granules in seabed sediments are shown in Figure 6.
Processing of Geophysical Exploration Data Conducted by Seismoacoustic Way on the Basis of ‘Fuzzy Logic’ Method
90
Figure 6. Variation of Vp with clay and sand content in water-saturated marine sediment
The traces of a small part of seismoacoustic profile image are depicted in Figure 7.
Figure 7. The time scale of seismic acoustic traces
The change of traces depending on reflection time in time-scale have been calculated separately for initial two traces. The change of time and amplitude values have been indicated in Table 2. reflecting the technical specifications of those two traces.

GAU Journal of Soc. & App. Sciences vol. 6, issue 10
91
Table 2. Reflection period of waves for trace 1 and 2 and change of amplitude values.
Time
(in ms)
Amplitude value
Trace #1 Trace #2
2472 -9.19 -9.16
2474 -7.20 -6.68
2476 2.56 3.39
2478 19.17 19.85
2480 25.04 24.87
2482 21.84 20.24
2484 6.49 3.73
2486 -12.73 -15.25
2488 -24.78 -25.23
The calculation of xi and yi coordinates of traces N1 and N2 and interactive correlation coefficients ( a1, a2, a3, a4, a5 ) for five coefficients are shown in the following formulas:
a1=(x1y1+x2y2+x3y3+x4y4+x5y5)/5 ...........(a)
a2=(x1y0+x2y1+x3y2+x4y3+x5y4) /5 ..........(b)
a3=(x1y-1+x2y0+x3y1+x4y2+x5y3)/5........... (c)
a4=(x1y2+x2y3+x3y4+x4y5+x5y6)/5............ (d)
a5=(x1y3+x2y4+x3y5+x4y6+x5y7)/5............. (e)

Processing of Geophysical Exploration Data Conducted by Seismoacoustic Way on the Basis of ‘Fuzzy Logic’ Method
92
These calculation marks are formed by multiplying the main data by number 10e-3 and subtracting 2 decimal points. The dissemination of seismoacoustic waves with various Vp dissemination velocity in different rock layers and their change within the fuzzy range of 0 and 1 in non-homogeneous environment are shown in Figure 4.
References
1. Aliev R, and Aliev R, Soft Computing and its Application. World Scientific, New
Jersey, London, Singapure, Hong Kong, 2001.
2. Lutfizadeh A, From computing with numbers to computing with words-from
manipulation of measurements to manipulation of perceptions. IEEE Trans.
Circuits Syst. 1, Fundamental Theory and Applications, 4 (1999), pp. 105–119
3. Mammadov F, Increasing of efficiency of exchange operational technological
information of seismic acoustic profiling, Azerbaijan National Science
academician, Cybernetic Institute, pp. 56-60, 89-94, Baku, (2006).
4. Yilmaz Öz (2001). Seismic data analysis. Society of Exploration Geophysicists.
p. 4. ISBN 1-56080-094-1.
5. McCauley D, et al (2000). "Marine seismic surveys: A study of environmental
implications". APPEA: 692–708. Retrieved 8 March 2012.
6. Milkereit B, Eaton D, Salisbury M, Adam E, and Thomas Bohlen. 2003. 3D
Seismic Imaging for Mineral Exploration. Commission on Controlled-Source
Seismology: Deep Seismic Methods.
http://www.geophys.geos.vt.edu/hole/ccss/milkereitCCSS.pdf