processing of packing foams using heat melt compaction
TRANSCRIPT

44th International Conference on Environmental Systems ICES-2014-080 13-17 July 2014, Tucson, Arizona
Processing of Packing Foams Using Heat Melt Compaction
Linden Harris1, Richard Alba2, and Kanapathipillai Wignarajah3 CSS-Dynamac Corporation, Moffett Field, California, 94035
John Fisher4 NASA Ames Research Center, Moffett Field, California, 94035
Oscar Monje5 NASA Kennedy Space Center, Florida, 32899
Brandon Maryatt6 and James Broyan7 NASA Johnson Space Center, Houston, Texas, 77058
and
Gregory Pace8 Lockheed Martin, Moffett Field, California, 94035
Foam is used extensively as packing material for items sent to the International Space Station (ISS). Although lightweight, foam is bulky and can occupy a large fraction of the limited ISS volume. Four chemically distinct foams have been used on the ISS. In descending order of current usage, these are Plastazote > Zotek > Minicel > Pyrell. Processing foam with the Heat Melt Compactor (HMC), a solid waste treatment system, has been proposed to reduce the volume of foams stored on spacecraft. Prior to HMC testing, Thermogravimetric Analyses were conducted on the four foams as a precaution to ensure that the thermal decomposition temperatures were not within range of HMC operation (≤180°C). Pyrell was not tested with the HMC because it is known to release toxic compounds and comprises less than 1.5% of total foam usage on ISS resupply flights. Zotek, Minicel, Plastazote LD24FR (low density), and Plastazote LD45FR (high density) were processed with the HMC at 130, 150 and 170°C. Volume was reduced by 82.6% on average (n=19; std dev=4.88). Hydrocarbons and several other compounds emitted during foam processing were measured using a Total Hydrocarbon Analyzer and FTIR. Effects of process temperature and foam type on exhaust composition are discussed. Feeding of foams into the limited size opening of the HMC compaction chamber is likely to be a challenge, particularly in microgravity. Some suggestions are proposed to facilitate feeding foam into the HMC. Processing packing foam with the HMC has been shown to substantially reduce foam volume, and also has the potential benefit of producing radiation-shielding foam tiles.
1 Scientist I, NASA ARC Code SCB, 239-15 2 Engineer, NASA ARC Code SCB, 239-15 3 Senior Scientist, NASA ARC Code SCB, 239-15 4 Lead Engineer, NASA ARC Code SCB, 239-15 5 Chemist, NASA KSC Code ESC, ESC-24 6 Engineer, NASA JSC Code EC7 7 AES LRR Project Manager, NASA JSC Code EC7 8 Engineer, NASA ARC Code SCB, 239-15

International Conference on Environmental Systems
2
Nomenclature ARC = Ames Research Center FTIR = Fourier Transform Infrared Spectroscopy GCMS = Gas-Chromatography Mass-Spectrometry HMC = Heat Melt Compactor ISS = International Space Station JSC = Johnson Space Center KSC = Kennedy Space Center LPM = liters per minute NASA = National Aeronautics and Space Administration ppm = parts per million psia = pounds per square inch, absolute Tg = glass transition temperature TGA = Thermogravimetric Analysis THA = Total Hydrocarbon Analyzer
I. Introduction LASTIC foams (also called cellular plastics) typically consist of at least two phases – a solid polymer matrix and a gaseous phase derived from a blowing agent1. The solid polymer phase may be organic, organometallic,
or inorganic. There may be more than one solid phase, as is the case with polymer alloys and polymer blends. The blowing agent process can be physical, chemical, or both. Generally, the blowing agent is added to a heated, liquefied polymer causing the release of gas, which forms the cellular foam structure2. Foams range from flexible, to semi-flexible or semi-rigid, to rigid in nature. When the glass transition temperature (Tg) is below room temperature, foam tends to be flexible. Foams with higher Tg are more rigid. Flexible or semi-flexible foams are used in gaskets and the carpet industry, while rigid foams have applications in insulation and building construction. Both rigid and flexible foams are used in space environments, mainly for the purpose of protecting sensitive hardware parts and as filler packaging to maintain the full shape of a bag. Maintaining the overall bag shape allows for predictable strap mounting to vehicle structures. Foam rigidity is generally a function of the amount of void volume (gas cells/unit volume) and gas cell connectivity (open or closed cell). If individual gas cells are isolated from one another, it is called closed cell and it is generally more rigid. Foams selected for space environments have often been designed to be flame resistant through the use of flame retardant coatings or coverings. One of the most common flame retardants used is Nomex®‡. Foam selection is also guided by outgassing and frangibility. The limited available data regarding types of foam used on the International Space Station (ISS) are from foams that were launched to the ISS on the ATV3, HTV3, SpX-D, and SpX-1 flights. Table 1 shows volumes of foam launched by the four vehicles. On average 37% of the cargo volume was foam, predominantly Zotek and Minicel. Small amounts of Plastazote and very small amounts of Pyrell were also present. In the future, Plastazote is expected to make up the large majority of packing foams on flights to the ISS; Zotek will be the second-most common packing foam. Minicel and Plastazote are closed cell polyolefin foams. Minicel is cross-linked polyethylene. Plastazote is 98-99% polyethylene with 1-2% carbon black. Zotek is lightweight, closed cell polyvinylidene fluoride (PVDF) foam, based on Kynar® fluoropolymer3. Unlike the former three, Pyrell is open celled, polyurethane based,
and produced by fully cross-linking polyhydroxy polyols, isocyanates, polyesters, surfactants and catalysts. Thus, it is the most chemically complex of the four foams described. Plastazote has flame retardant capabilities, the specifics
‡ Nomex® is the trade name for a fire retardant produced by DuPont™. The chemical name is poly (m-phenylene terephthalimide).
P
Table 1. Weight, volume, and density of foam launched to the ISS on the ATV3, HTV3, SpX-D, and SpX-1 flights combined.
Type of Foam Volume (m3) Density (kg/m3)
Calculated Weight (kg)
Zotek 3.79 29.8 112.9 Minicel 1.41 28.1 39.6
Plastazote LD45FR 0.24 40.3 9.7 Plastazote LD25FR 0.11 23.0 2.5
Pyrell 0.08 36.3 2.7

International Conference on Environmental Systems
3
of which are proprietary. Zotek is auto-extinguishing, the details of which are also proprietary. Minicel and Pyrell are made flame retardant by a Nomex® covering. The substantial mass and volume of foam waste generated on ISS warrants investigation of a foam volume reduction method. Foam management on ISS is a challenge because some foam must be saved to package hardware that has been removed from vehicle systems and is planned to be returned to Earth for refurbishment. However, the majority of foam is not reused and it takes up considerable volume because it is uniquely and often oddly shaped for launch. Consequently, the voids in spent foam cannot be readily packed with other waste foam. ISS manages the foam problem utilizing the frequent visiting cargo vehicles for disposal. Explorations away from Earth will not have frequent or potentially any visiting vehicles for disposal. Reducing the foam over the course of a deep space mission can increase the habitable volume overtime4,5. Increasing the habitable volume for longer missions is a key exploration challenge because the spacecraft’s pressure, volume, and mass are highly constrained by existing and planned launch vehicle capability. Though longer term missions would not have the consistent resupply of items packed in foam, there would at least be an initial amount of foam packing supplies that are launched along with the crew. Due to the lesser amount of foam, foam processing on a longer term mission would need to be coupled with other waste processing, such as heat melt compaction of mixed solid waste, to be efficient. The Heat Melt Compactor (HMC) is a NASA Waste Management technology designed to compact, biologically stabilize, and recover water from solid waste produced on space missions6. This technology has been proposed as a method of processing excess packing foam on spacecraft. As foam does not contain water or pose a biological hazard to the crew, processing with the HMC would mainly serve the purpose of volume reduction. A potential secondary benefit of processing foam with the HMC would be using the product tiles to build a radiation-shielding wall around the edges of the vehicle, supplementing existing shielding in key areas of the vehicle. A major concern with HMC foam processing was that foams release toxic substances when heated. A simple method to study this potential hazard involves Thermogravimetric Analysis (TGA) characterization combined with Gas-Chromatography Mass-Spectrometry (GCMS), or Fourier Transform Infrared Spectroscopy (FTIR) characterization of the gases7. TGA of Zotek, Plastazote LD24FR, Plastazote LD45FR, and Pyrell demonstrated that thermal decomposition did not occur at HMC operating temperature (< 180°C). Pyrell showed thermal decomposition at 214°C, nearly 100 degrees lower than any other type of foam, and it is known to have the potential to release harmful compounds8. Since it also made up only a small percentage of foam used on ISS, it was decided that this foam would not be tested with the HMC. The likelihood of toxic gases being released by the remaining four foams during HMC processing was minimal. Yet, it was decided that all safety precautions including wearing respirators would be followed during experimentation.
II. Materials and Methods Minicel, Zotek, Pyrell, Plastazote LD24FR, and Plastazote LD45FR foam samples were provided by NASA
Johnson Space Center (JSC). These types of foam were chosen for testing because they are the flight-approved foams for ISS resupply missions. The foam samples were obtained from the Lockheed Martin facility located nearby JSC.
Foam compaction experiments were performed using the Generation I HMC, located at NASA Ames Research Center (ARC). The HMC features a cylindrical waste-processing chamber (8” diameter, 6.25” high), which houses a lower (“restraint”) piston and an upper (“compaction”) piston that compact waste in the mid-section of the chamber during processing. Small holes in the chamber sidewall open to a plenum region around the outside of the chamber. During processing, a sweep air flows around the plenum, which is kept at least slightly below atmospheric pressure. This draws volatile compounds from the waste during heating, which are then carried downstream for analysis and/or exhaust.
The waste-processing chamber is accessed via a 4” x 4” door on the front of the system. As foam samples were provided in large blocks, ranging from 6” to 36” on each dimension, pre-processing was necessary to load the samples into the HMC. Large blocks were cut into small pieces using razor blades, handsaws, or a band saw. The size of the small pieces was not strictly regulated, but was roughly 0.5-1 in3. Several runs also used larger and smaller than average pieces to test the effect that this had on foam processing. In Minicel samples, the layers of foam within large blocks were adhered by 3M™ Adhesive Transfer Tape 950. For two experiments, the layers of adhesive were cut out during pre-processing so that the adhesive was not included in the sample. Dimensions of each large block were measured before cutting it up to obtain the initial sample volume. Samples were also weighed before processing. Once cut, small foam pieces were loaded into the waste-processing chamber of the HMC.
The Gen I HMC has a processing chamber that can be evacuated. This feature is primarily used with wet trash processing. The Gen I HMC also uses pneumatic compaction and can apply pressure to the backside of the

International Conference on Environmental Systems
4
compaction piston independent of the processing chamber pressure. Each sample was compressed by the compaction piston at 55psia, and heated to 130°C, 150°C, or 170°C. After a temperature ramp up period of 73 minutes, samples were held at their maximum temperature for 72-96 minutes. During heating and a one-hour cool down period, a sweep air was drawn through the HMC at 0.2 LPM. Some experiments were performed using a plenum pressure of 3psia, while some were performed at 14psia.
After the HMC had cooled to a safe temperature, processed foam was removed in the form of a condensed tile. Figure 1 shows an example of Zotek foam before and after HMC processing at 130°C.
Tile weight, average thickness (based on four measurements), and diameter were measured. Tile volume was then calculated and compared to the initial sample volume using Equation (1). Initial sample volume was the volume of the original foam block before being cut in pre-processing.
%Volume Reduction = 1! Final VolumeInitial Volume
"
#$
%
&'*100% (1)
Initial and final sample densities were calculated using the weight and volume data, and compared using the following equation:
Densification Factor = Final DensityInitial Density
(2)
Gaseous exhaust from foam processing was analyzed using two methods: a real-time Total Hydrocarbon Analyzer (THA) (VIG Industries, Anaheim, CA, USA), and collected samples analyzed with FTIR. The THA was plumbed in line with the HMC exhaust tubing such that a sample stream could be pulled out of the exhaust at the specific sample pressure required by the instrument. Foam experiments used a relatively low sweep air flow rate. As a result, the exhaust did not provide enough sample pressure to the THA, and had to be supplemented with room air drawn in by a second pump upstream of the THA. The dilution factor was calculated using flow meters directly before and after the room air was drawn in. The remaining diluted exhaust stream was vented to the fume hood or
Figure 1. Zotek foam A) before, and B) after processing at 130°C in the Heat Melt Compactor.

International Conference on Environmental Systems
5
routed into a plastic Tedlar® sampling bag to be saved and sent to NASA Kennedy Space Center (KSC) for FTIR analysis.
The THA was calibrated directly prior to each experiment. However, after several experiments there were indications that the calibration may have been drifting throughout the runs. A calibration check protocol was then implemented, which consisted of analyzing a sample of zero air and a sample of 50ppm methane approximately midway into the experiment and again at the end of the experiment. The difference between the THA readout and the known concentration of hydrocarbons in the sample gas is referred to as the calibration offset value (e.g. if the THA read 16.5ppm when sampling zero air, the calibration offset value was +16.5ppm). This produced two calibration offset values at each of the two time points (offset values ranged from 10.5-38.5ppm). The two offset values were averaged to obtain one calibration offset value for each of the two time points. We assumed that the calibration offset made a linear progression from zero, at the beginning of the experiment, to its known value midway into the experiment, and from that value to the known value at the completion of the experiment. With that assumption, a calibration offset value was calculated for each THA data point (one data point was taken every five minutes throughout the course of each experiment). The difference between each THA readout and the corresponding calibration offset gave an “adjusted value” for each time point. This was finally multiplied by the dilution factor discussed above to obtain a calculated total hydrocarbon value. See Appendix A for an example of the calculations described above. The experimentalists acknowledge that due to uncertainty contained in the calibration offset and the assumptions necessary to make these calculations, we cannot rely heavily on the exact values presented as calculated total hydrocarbon values. General trends in raw total hydrocarbon data were found to be more useful when comparing results between experiments or over the course of each experiment.
Seventeen HMC exhaust samples were collected for FTIR analysis. Samples were taken from 13 different experiments. During three experiments, more than one sample was taken. Samples were collected using Tedlar® bags, which were inflated with HMC exhaust gas and shipped to KSC for analysis.
The 10-liter gas bags were filled with 7-8 liters of HMC sample so that the bags would not burst during transport from ARC to KSC. The bags were received and the composition of the HMC sample was determined from 20 second FTIR spectra using a DX-4030 FTIR spectraradiometer (Gasmet Technologies, Finland). The 0.4-liter cell was first purged with N2 to measure the background gas. The HMC samples were then introduced into the cell at 1 LPM and gas composition was recorded after 2 minutes, when the concentrations of the gases in the HMC sample were constant. The application (or method in GC terminology) measured the following gases simultaneously: water vapor, carbon dioxide, carbon monoxide, nitrous oxide, nitric oxide, methane, ethanol, methanol, 2-butanol, formaldehyde, acetaldehyde, hexanal, isovaleraldehyde, acetone, ammonia, toluene, pentane, acetic acid, formic acid, carbon disulfide, and dimethyl sulfide. The concentrations of the gases in the HMC samples are listed in Appendix B.
THA and FTIR results were compared. FTIR results gave concentrations of 21 compounds including the 12-14 most abundant hydrocarbons in the exhaust samples. The THA gives all readings in terms of methane equivalent concentration. In order to compare the two data sets, FTIR results were converted to methane equivalent concentrations. For each compound, a coefficient was calculated by dividing the molar mass of the compound by the molar mass of methane*. Each coefficient was then multiplied by the concentration of that compound, resulting in a methane equivalent concentration. Equation (3) represents the above verbal explanation. M indicates molar mass, and [brackets] indicate the concentration of the bracketed phrase.
M compound x( )
M CH4( )
!
"##
$
%&& * compound x[ ] =methane equivalent compound x[ ] (3)
For example, if 1.29ppm acetone (C3H6O) was measured, the calculation would be as follows:
58g /mol16g /mol!
"#
$
%&*1.29ppm = 4.69ppm methane equivalent (4)
* This method was advised by a technical expert on the THA model used in these experiments, based on his personal experience measuring methane equivalence of various hydrocarbons.

International Conference on Environmental Systems
6
The methane equivalent concentrations for all hydrocarbons were totaled. THA data that had been adjusted for calibration offsets was averaged over the period of time during which the Tedlar® bag sample was collected for FTIR analysis, and compared to the FTIR total concentration results. As both of these sampling systems are downstream of the point of HMC exhaust dilution, the dilution factor is not relevant for comparing FTIR and THA results.
The HMC regularly builds up food and plastic residue from mixed waste experiments on internal surfaces9. This residue was reheated during foam tests and may have contributed to hydrocarbon levels in the exhaust. Five “blank” runs were performed during the same time period as the foam experiments to determine if running the HMC with no waste sample gave off hydrocarbons. THA readout values from these five runs were within the same range as calibration offset values seen in other runs. It was somewhat difficult to differentiate background HMC hydrocarbons from the THA calibration drift. Additionally, background hydrocarbons would be expected to change based on frequency and characteristics of recent experiments that may have donated waste residue to the system. Due to these uncertainties, coupled with the fact that preliminary tests indicated background levels to be relatively low, it was decided not to attempt to incorporate background hydrocarbon data into foam hydrocarbon results.
III. Results Percent volume reduction and densification factor are presented for each type of foam at each process
temperature in Table 2. The average volume reduction across all tests was 82.6% (n=19; std dev=4.88). At 130°C, volume reduction in the four types of foam did not vary significantly (ANOVA, p=0.618). There was no apparent impact of process pressure on volume reduction, though there were not enough replicates of each test condition to perform statistical analysis. With Minicel, the only foam for which replicate tests were performed at two different temperatures, temperature had no significant effect on volume reduction (T-test, p=0.087). Although other foams were not tested in replicate at varying temperatures, preliminary testing indicated that there was not a substantial difference in volume reduction based on process temperature. The difference in foam weight before and after processing was negligible. Therefore, the percent volume reduction and densification factor for each run are directly proportionate. The relationships between foam type, temperature, and volume reduction results discussed above also apply to the densification factor.
As described in the methods section, total hydrocarbon values obtained from the THA were adjusted based on measured calibration offset values, and dilution factors. See Appendix A for a complete example of these calculations for one of the foam experiments. Calibration offset measurements were only performed in the later tests in the series. Therefore, raw THA data was found to be more useful for comparing data trends across all experiments. The dilution factor was not exactly the same through all experiments due to uncontrollable fluctuations in HMC system flow rates, although the experimental protocol did include manually adjusting flows where feasible to keep the dilution factor as consistent as possible. Since calibration offset values and dilution factors were found to
Table 2. Percent volume reduction and densification factors achieved by processing four different types of foam, each at three different temperatures, in the Heat Melt Compactor. N-values listed indicate the number of experiments performed for each foam and temperature combination.
Type of Foam Process Temp (oC)
Avg. Initial Density (kg/m3)
Avg. % Volume Reduction
Avg. Densification Factor
Plastazote LD45FR
130 (n=2) 43.3
79.7 5.1 150 (n=1) 79.7 4.9 170 (n=1) 81.9 5.5
Plastazote LD24FR
130 (n=2) 23.7
84.3 6.4 150 (n=1) 90.3 11.1 170 (n=0)
Zotek 130 (n=2)
32.5 76.6 4.4
150 (n=1) 78.4 4.6 170 (n=1) 74.4 3.9
Minicel 130 (n=4)
30.5 83.8 6.3
150 (n=1) 87.0 7.7 170 (n=2) 87.6 8.0
International Conference on Environmental Systems
7
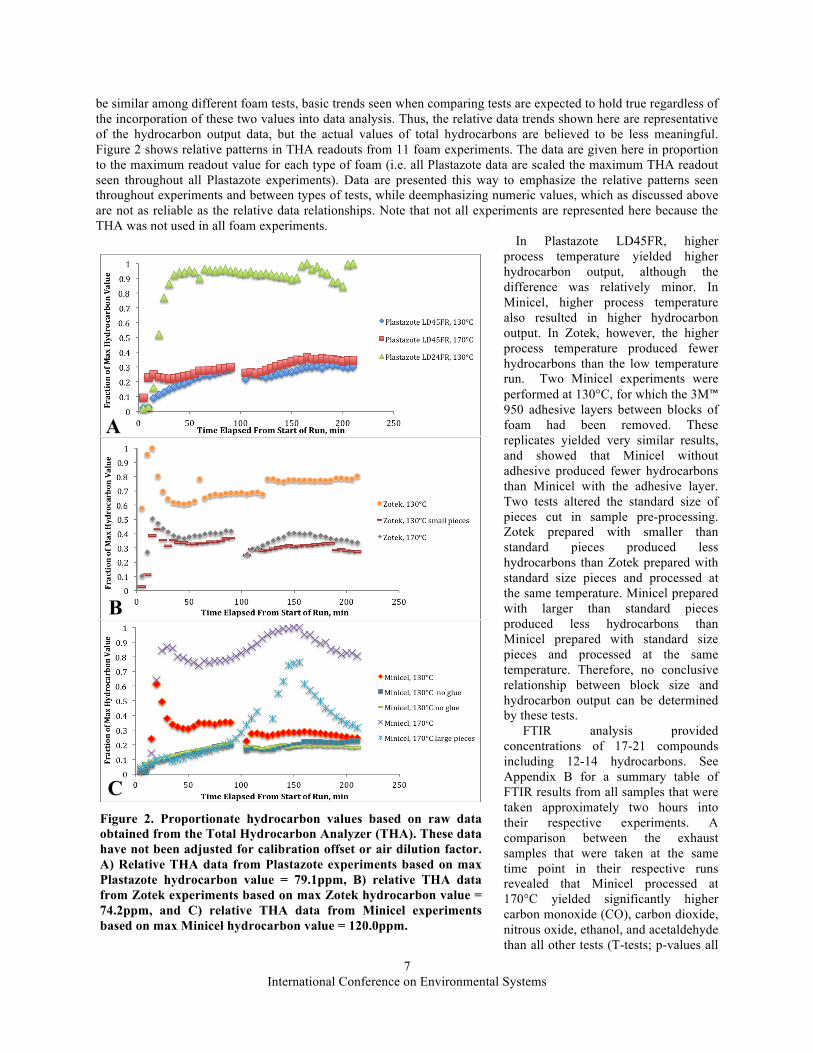
be similar among different foam tests, basic trends seen when comparing tests are expected to hold true regardless of the incorporation of these two values into data analysis. Thus, the relative data trends shown here are representative of the hydrocarbon output data, but the actual values of total hydrocarbons are believed to be less meaningful. Figure 2 shows relative patterns in THA readouts from 11 foam experiments. The data are given here in proportion to the maximum readout value for each type of foam (i.e. all Plastazote data are scaled the maximum THA readout seen throughout all Plastazote experiments). Data are presented this way to emphasize the relative patterns seen throughout experiments and between types of tests, while deemphasizing numeric values, which as discussed above are not as reliable as the relative data relationships. Note that not all experiments are represented here because the THA was not used in all foam experiments.
In Plastazote LD45FR, higher process temperature yielded higher hydrocarbon output, although the difference was relatively minor. In Minicel, higher process temperature also resulted in higher hydrocarbon output. In Zotek, however, the higher process temperature produced fewer hydrocarbons than the low temperature run. Two Minicel experiments were performed at 130°C, for which the 3M™ 950 adhesive layers between blocks of foam had been removed. These replicates yielded very similar results, and showed that Minicel without adhesive produced fewer hydrocarbons than Minicel with the adhesive layer. Two tests altered the standard size of pieces cut in sample pre-processing. Zotek prepared with smaller than standard pieces produced less hydrocarbons than Zotek prepared with standard size pieces and processed at the same temperature. Minicel prepared with larger than standard pieces produced less hydrocarbons than Minicel prepared with standard size pieces and processed at the same temperature. Therefore, no conclusive relationship between block size and hydrocarbon output can be determined by these tests.
FTIR analysis provided concentrations of 17-21 compounds including 12-14 hydrocarbons. See Appendix B for a summary table of FTIR results from all samples that were taken approximately two hours into their respective experiments. A comparison between the exhaust samples that were taken at the same time point in their respective runs revealed that Minicel processed at 170°C yielded significantly higher carbon monoxide (CO), carbon dioxide, nitrous oxide, ethanol, and acetaldehyde than all other tests (T-tests; p-values all
Figure 2. Proportionate hydrocarbon values based on raw data obtained from the Total Hydrocarbon Analyzer (THA). These data have not been adjusted for calibration offset or air dilution factor. A) Relative THA data from Plastazote experiments based on max Plastazote hydrocarbon value = 79.1ppm, B) relative THA data from Zotek experiments based on max Zotek hydrocarbon value = 74.2ppm, and C) relative THA data from Minicel experiments based on max Minicel hydrocarbon value = 120.0ppm.
A
B
C

International Conference on Environmental Systems
8
< 0.05). Concentration of CO in the exhaust of Minicel processed at 170°C was about 20 times greater than the level of CO yielded by Minicel processed at 130°C. For all types of foam, higher process temperatures resulted in higher output concentration of CO, with the exception of one Plastazote LD45FR test, which had a relatively high CO concentration at 130°C. The same Plastazote test also produced noticeably higher concentrations of ethanol, methanol, toluene, formic acid, and carbon disulfide than all other tests excluding Minicel at 170°C.
In order to compare FTIR results with THA results, FTIR data were converted to total methane equivalents, and THA data were adjusted based on the calibration offset value as described in the methods. In experiments where calibration offset tests were not performed, the calibration offset value was assumed to be 20ppm, the approximate average offset value across all tests, for the purpose of this data comparison. Samples for both analyses were diluted by the same amount, so dilution factor did not need to be taken into account when assessing the likeness of the two data sets. Table 3 shows a comparison of total hydrocarbons as determined by FTIR and THA for each of the runs where both analyses were performed. A T-test showed that FTIR results were not significantly different than THA results (p=0.51).
IV. Discussion The authors acknowledge that very few replicates were included in the HMC foam processing series. The HMC
test schedule requires that many types of experiments be done in a limited time frame. Often a preliminary look at each type of experiment is all that is feasible. The results presented in this paper provide a sense of the viability of processing packing foam with the HMC, but more replicate testing would be necessary if a higher level of data certainty were required.
As stated in the introduction, the main purpose of processing foam with the HMC is volume reduction. The average volume reduction across all tests was 82.6% (n=19; std dev=4.88). In other words, HMC processing could reduce the excess packing foam on ISS to less than one fifth of its original volume. This would substantially improve habitable volume availability on any exploration vehicle. This increase in habitable volume is particularly significant for the smaller exploration vehicles that are currently under study. No significant difference in volume reduction was observed between the various process temperatures. Therefore, lower temperature heating could be used to conserve energy, without sacrificing performance. Since closed cell foams were processed below their thermal degradation temperatures, it is likely that most cells remained intact and volume reduction was limited by the volume of foam cell void spaces. This could not be confirmed as foam manufacturers do not provide void volumes of their products. It is possible that temperatures lower that 130°C would achieve similar volume reduction, although that has not been tested. As the volume reduction at 130°C did not differ significantly among types of foam, one could expect similar results regardless of the type of foam in need of processing on ISS.
Although the data do not give a high degree of certainty, there were indications that higher process temperatures result in higher total hydrocarbons and carbon monoxide in the exhaust. This further supports the conclusion that
Table 3. Results comparison between FTIR and THA methods of hydrocarbon concentration analysis. Sample dilution factor is not taken into account, as it does not affect this comparison, but note that actual total hydrocarbon values would be higher than those listed here. In the fourth column, the results are compared as percentages to help display the degree of similarity between the two sets of data. 100% would indicate that the two methods yielded the same result.
Experiment Title FTIR Result (ppm)
THA Result (ppm)
(THA ÷ FTIR) * 100%
PALD45FR-4, 170°C 26.68 10 37.5% PALD24FR-3, 130°C 50.52 52.3 103.6%
Zotek-3, 130°C 37.77 37.5 99.2% Zotek-4, 130°C small pieces 17.69 9.2 52.1%
Zotek-5, 170°C 31.22 11.3 36.3% Minicel-5, 130°C no glue 16.38 2.9 17.4% Minicel-7, 130°C no glue 29.46 6.9 23.4%
Minicel-3, 170°C, 62-101min 58.24 74.2 127.3% Minicel-3, 170°C, 123-158min 102.41 97.9 95.6% Minicel-6, 170°C large pieces 78.42 54.2 69.1%

International Conference on Environmental Systems
9
lower process temperature (≤ 130°C) would be ideal for foam processing with the HMC, as it would limit off-gassing. Minicel samples that had 3M™ 950 tape layers removed gave off fewer hydrocarbons; therefore Minicel without adhesive would be more ideal for onboard processing. Indeed, more Minicel used on future space flights will use heat-sealing to bond layers together as oppose to adhesive. Two tests investigated the impact of sample block size on volume reduction and hydrocarbon results: a Zotek sample with smaller than nominal sample block size, and a Minicel sample with larger than nominal sample block size. The hydrocarbon results of these tests were contradictory, so a conclusion about the impact of sample block size could not be drawn.
Total hydrocarbon results obtained by THA and FTIR methods were comparable, reinforcing the reliability of both methods. The method of converting FTIR data to methane equivalents and the method of correcting for THA calibration drift both have potential room for error that could have contributed to discrepancies between the two data sets. However, these methods of calculation were determined to be the most accurate ways of representing the hydrocarbon data sets. Manufacturer service of the THA instrument is currently underway, with hopes of improving reliability of future results.
Composition of exhaust produced by HMC foam processing must be carefully considered before deemed safe for operation in an enclosed space such as a spacecraft. The impact of off-gassing must take into consideration not only composition and concentration of exhaust, but also dilution volume of the spacecraft, capacity of contaminant controls and air revitalization systems in use, and Spacecraft Maximum Allowable Concentrations of compounds in question.
For preliminary testing reported here, experimentalists pre-processed foam by cutting it into small pieces to allow loading into the HMC. This method would undoubtedly be problematic in a micro-g setting. Not only would the small pieces of foam be difficult to keep aggregated, but cutting foam with any serrated blade creates additional foam debris that would be impossible to control without employing a special chamber in which foam would be cut. The most promising solution to this problem requires changing the way the foam is made to begin with. If blocks of foam contained HMC-sized sections divided by perforated connections, foam could be torn apart by astronauts after serving its packing purpose, and then loaded into the HMC. Similarly, foam blocks could be made with “die cuts,” meaning cuts that leave a small layer of foam connected so that sections can easily be ripped apart after use. Tearing is expected to create less debris, particularly if perforations are widely spaced, and require less crew time compared to cutting the foam. Additionally, sections could be directly loaded into the HMC to avoid the challenge of keeping sample pieces grouped together. The door of the Generation II HMC will be 9” x 9”, as opposed to the 4” x 4” door of the current model. This will allow for larger foam samples to be loaded, and consequently require less cutting or tearing. Proposals for micro-g compatible pre-processing would need to be further refined and tested before attempted in a micro-g environment.
HMC product tiles are good candidates for use in the construction of radiation-shielding walls, as they are dense masses of organic material5,10. Specifically, hydrogen content in tiles is useful for passive radiation shielding. Although this proposition was made in reference to mixed waste HMC tiles, foam tiles could also serve this purpose because of their hydrogen content. Of course, testing would be required to quantify the ability of foam tiles to shield solar radiation, but the potential is substantial and should be considered when weighing the benefits of foam processing with the HMC.
V. Conclusion Physical space is extremely valuable on ISS, and all potential future spacecraft. Packing foam is crucial for
getting various items safely onboard, but once unpacked it serves no purpose and takes up considerable space. Processing packing foam with the Heat Melt Compactor has been shown to reduce volume by 82.6% (n=19; std dev=4.88), and can do so at relatively low temperature (130°C) and near-atmospheric pressure. Lower process temperature (130°C compared to 170°C) was shown to produce lower concentrations of exhaust hydrocarbons, which coupled with energy savings supports low temperature foam processing. This process also has the potential to produce radiation-shielding foam tiles. Not only could physical space be reclaimed, but the foam could be repurposed, which makes for a more efficient mission.

International Conference on Environmental Systems
10
Acknowledgments The work discussed in this paper is an accumulation of efforts by scientists and engineers at Ames Research
Center, Johnson Space Center, Kennedy Space Center, and Marshall Space Flight Center. Funding was provided by NASA Headquarters Advanced Exploration Systems Division. The authors thank Margaret Stackpoole and Jim Connolly of ARC for completing TGA testing on foams.
Appendix A Example of adjustment calculations converting raw Total Hydrocarbon Analyzer readouts to expected “actual”
hydrocarbon concentration using calibration offset values and the dilution factor. The data shown is from a Minicel experiment, with larger than average sample pieces, processed at 170°C and near-atmospheric pressure.
Time
Elapsed (min)
THA Readout
(ppm)
CH4 Offset
Zero Air
Offset
Avg. Offset
Offset per
Reading
Adjusted Reading (ppm)
Dilution Factor
Calculated TH Concentration
(ppm)
5 4.9 1.2 3.7 3.33 12.5 10 7.1 2.3 4.8 3.44 16.5 15 9.1 3.5 5.6 3.63 20.4 20 11 4.6 6.4 3.66 23.3 25 12.9 5.8 7.1 3.53 25.1 30 13.8 6.9 6.9 3.61 24.7 35 10.6 8.1 2.5 3.72 9.3 40 12 9.3 2.8 3.75 10.3 45 13 10.4 2.6 3.71 9.6 50 15.2 11.6 3.6 3.75 13.6 55 15.4 12.7 2.7 3.92 10.5 60 16.8 13.9 2.9 4.01 11.7 65 18.4 15.0 3.4 4.01 13.5 70 19.2 16.2 3.0 4.01 12.1 75 20.8 17.4 3.5 4.01 13.9 80 22 18.5 3.5 4.06 14.2 85 23.9 19.7 4.2 4.06 17.2 90 26.1 20.8 5.3 3.88 20.5 95 29.2 22.0 7.2 3.80 27.4
100 34.1 23.1 11.0 3.76 41.2 105 40.1 24.3 15.8 3.71 58.7 110 45.9 25.4 20.5 3.58 73.3 115 51.4 26.6 26.6 24.8 3.50 86.8 120 31.5 3.58 125 21.7 3.58 130 45.4 26.7 18.7 3.58 67.0 135 66.1 26.8 39.3 3.58 140.7 140 76.1 26.9 49.2 3.67 180.2

International Conference on Environmental Systems
11
145 89.1 27.1 62.0 3.75 232.7 150 90.7 27.2 63.5 3.75 238.2 155 91.7 27.3 64.4 3.71 238.9 160 73.9 27.4 46.5 3.79 176.3 165 68.5 27.5 41.0 3.96 162.2 170 64.6 27.6 37.0 3.96 146.3 175 59.9 27.8 32.2 3.96 127.3 180 54 27.9 26.1 3.96 103.5 185 51 28.0 23.0 4.18 96.2 190 47 28.1 18.9 4.27 80.8 195 44.2 28.2 16.0 4.19 67.0 200 41.5 28.3 13.2 4.19 55.2 205 40.1 28.4 11.7 4.19 48.9 210 38 28.55 28.6 9.5 4.19 39.6
38.5 18.6
Appendix B Summary of FTIR analysis of exhaust produced by HMC foam processing. All data shown here are from
samples for which collection began between 120 and 135 minutes into the experiment. Sample collection lasted 20 to 30 minutes.
Minicel-6
Minicel-3
Minicel-7
Minicel-5
Zotek-5
Zotek-4
Zotek-3
Zotek-1
PAL
D24FR
-3
PAL
D45FR
-4 PA
LD
45FR-3
PAL
D45FR
-1
Experim
ent T
itle
170 170 130 130
170 130 130 130
130
170 130 130
Process T
emperature (°C
)
1.25 1.26 1.25 1.28
1.24 1.24 1.26 1.32
1.28
1.24 1.27 1.97
Water
Vapor
% V
olume
0.41 0.41 0.09 0.09
0.06 0.06 0.08 0.06
0.06
0.07 0.06 0.11
Carbon
Dioxide
% V
olume

International Conference on Environmental Systems
12
241.86 218.08 10.87 8.81
8.69 3.17 2.25 1.37
4.21
5.92 2.43
29.36
Carbon
Monoxide
ppm
0.66 0.61 0.26 0.30
0.29 0.25 0.28 0.28
0.27
0.29 0.28 0.37
Nitrous
Oxide
ppm
0.00 0.51 0.66 0.07
0.53 0.88 0.06 0.39
0.75
0.67 0.15 0.00
Nitric
Oxide
ppm
2.29 2.04 1.69 1.73
1.51 1.44 1.35 1.30
0.42
2.08 1.55 2.39
Methane
ppm
4.31 3.38 0.89 0.06
0.63 0.41 0.00 0.18
1.63
0.84 0.00 2.45
Ethanol
ppm
0.32 4.13 2.24 0.63
3.11 2.02 0.00 1.15
4.76
2.19 0.00 5.72
Methanol
ppm
3.33 5.52 0.92 1.28
0.87 0.90 3.89 0.35
3.39
0.73 1.47 0.00
2-Butanol
ppm
0.11 0.00 0.03 0.04
0.06 0.00 0.00 0.05
0.00
0.00 0.00 0.00
Formaldehyde
ppm
2.93 3.13 0.30 0.05
0.47 0.00 0.00 0.00
0.07
0.29 0.00 0.65
Acetaldehyde
ppm
0.00 0.00 0.21 0.00
0.03 0.00 0.00 0.00
0.00
0.00 0.00 0.00
Hexanal
ppm

International Conference on Environmental Systems
13
1.53 0.89 0.00 0.00
0.34 0.00 0.00 0.00
0.00
0.21 0.00 0.00
Isovaleraldehyde
ppm
7.57 5.85 0.00 0.00
0.46 0.00 1.29 0.00
1.14
0.06 0.06 0.00
Acetone
ppm
1.43 0.33
32.64 6.31
0.83 0.38
12.19 0.21
0.32
1.73 4.39 0.32
Am
monia
ppm
0.00 0.00 1.55 0.99
1.68 0.95 0.00 2.00
1.50
1.54 0.63
42.51
Toluene
ppm
0.00 0.00 0.50 0.05
0.32 0.08 0.00 0.38
0.00
0.56 0.05 1.07
Pentane
ppm
0.44 0.93 0.83 0.31
0.31 0.30 1.42 0.48
0.33
0.23 0.15 0.00
Acetic
Acid
ppm
1.15
0.26 0.07
1.41
4.94
Formic
Acid
ppm
0.00
0.74 1.01
0.60
5.27
Carbon
Disulfide
ppm
3.39
1.97 0.00
0.54
0.00
Dim
ethyl Sulfide
ppm

International Conference on Environmental Systems
14
References 1Klempner, D., and Sendijarevic, V. (ed.), Polymeric Foams and Foam Technology, 2nd ed., Hanser Gardner Publications,
Inc., Cincinnati, 2004, Chap. 1. 2Banhart, J., “Manufacturing Routes for Metallic Foams,” Journal of the Minerals, Metals & Materials Society, Vol. 52, No.
12, 2000, pp. 22-27. 3“Zotefoams Zotek F,” URL: http://www.zotefoams.com/pages /us/zotek-f.asp [cited 11 April 2014]. 4Ewert, M. K., Broyan, J. L. “Mission Benefits Analysis of Logistics Reduction Technologies”, 43rd International
Conference of Environmental Systems, AIAA-2013-3383. 5Broyan, J. L., Chu, A., Ewert, M. K., “Logistics Reduction and Repurposing Technology for Long-Duration Space
Missions”, 44th International Conference of Environmental Systems, AIAA-2013-3383. 6Pace, G. S., Fisher, J., Delzeit, L., Alba, R. G., and Polonsky, A., “Development of a Plastic Melt Waste Compactor for
Human Space Exploration Mission – A Progress Report.” AIAA 2010-6010, July 2010. 7Cassel, B., and Sichima, W. J., “Characterization of Foams by Thermal Analysis,” Perkin Elmer Instruments, Application
Note PETech-26, Norwalk, CT, 2000. 8”Material Safety Data Sheet: Flexible Polyurethane Foam,” Ultra Clean Technologies, URL:
mailto:http://www.ultracleantech.com/downloads/dl/file/id/14/projectiles_material_safety_data_sheet_msds.pdf [cited 10 March 2014].
9Alba, R., Harris, L., Fisher, J., Wignarajah, K., Pace, G. “Performance of the Gen 1 Heat Melt Compactor and Lessons Learned to Enable Further Engineering Development.” AIAA 2013-3363, July 2013.
10Broyan Jr., J. L., M. K. Ewert. “Logistics Reduction and Repurposing Beyond Low Earth Orbit.” AIAA 2012-3445, July 2012.