processor driven integration of small farmers into … · regular communication channels. analysis...
TRANSCRIPT
PROCESSOR DRIVEN INTEGRATION OF SMALL FARMERS INTO VALUE CHAINS IN REPUBLIC OF SERBIA
Rade Popovic
2013

This paper carries the name of the author and should be used and cited accordingly. The findings, interpretations and conclusions are the authors’ own and should not be attributed to the Food and Agriculture Organization of the UN, its management, or any member countries. This paper was prepared within the “Cooperatives and alternatives” component of the Agrarian Structures Initiative, which is a regional program of FAO in Europe and Central Asia. More information on the Agrarian Structures Initiative and its projects is available at http://www.fao.org/europe/agrarian-structures-initiative/en/

Table of contents
1 EXECUTIVE SUMMARY ............................................................................................................1
2 INTRODUCTION ......................................................................................................................4
3 CONTEXT AND ENABLING ENVIRONMENT FOR THE DEVELOPMENT OF PROCESSOR-FARMER
RELATIONSHIPS ..............................................................................................................................5
3.1 OVERVIEW OF MAJOR PRODUCTION AND MARKET TRENDS .................................................................5
3.2 THE ROLES AND IMPORTANCE OF SMALL FARMERS AND SMALL AND MEDIUM SIZED AGRI-PROCESSORS ON THE
DOMESTIC MARKET AND EXPORTS OF FRESH AND PROCESSED FOOD AND PRODUCTS .........................................8
3.3 MAIN MARKETING CHANNELS AND TRENDS IN DEMAND FOR FARM PRODUCTS ........................................9
3.4 ENABLING ENVIRONMENT FOR SMALL FARM COMMERCIALIZATION AND THE DEVELOPMENT OF SMALL AND
MEDIUM SIZED AGRI-PROCESSING ENTERPRISES IN RURAL AREAS................................................................10
4 VALUE CHAIN PERSPECTIVE OF PROCESSOR-FARMER BUSINESS LINKAGES ..........................15
4.1 MARKET DEMAND PROJECTION AND CONSUMER BEHAVIOUR ............................................................20
4.2 VALUE ADDITION, PRICES, COSTS AND MARGINS ............................................................................22
4.3 CERTIFICATION AND QUALITY CONTROL .......................................................................................23
4.4 MANAGEMENT, MARKETING AND PROMOTION .............................................................................23
4.5 OVERALL ASSESSMENT OF VALUE CHAIN PERFORMANCE AND CONSTRAINTS FOR IMPROVED PROCESSOR-
FARMER LINKAGES .........................................................................................................................24
5 APPROACHES TO DEVELOPMENT OF PROCESSOR-FARMER BUSINESS LINKAGES ..................25
5.1 “VITAMIN”, VEGETABLE PROCESSOR ...........................................................................................25
5.2 SIRELA, DAIRY PROCESSOR .......................................................................................................27
5.3 ZDRAVO ORGANIC, ORGANIC FRUIT AND VEGETABLE PROCESSOR .......................................................30
6 CONCLUSIONS AND RECOMMENDATIONS ...........................................................................33

1
1 EXECUTIVE SUMMARY During the process of transition in many countries, many small farms are left at the side of the road by bigger food processors, retailers and exporters. This is also the case in Serbia, and in light of this, the objectives of this study are: to better understand the importance of small family farms and SMEs in Serbian agriculture, to better understand the main food sub sectors and the institutional environment, and to try to identify effective forms of vertical cooperation. The methodologies used to achieve these objectives include: literature reviews, use of published data, interviews with managers of SMEs and large food processing companies and retail chains, and case studies. Family farms own 84 percent of the total utilized agricultural area (UAA) and changes in farm structure are ongoing. The number of farms is decreasing while the average farm size, measured in hectares of UAA, has increased to 9.6 ha in the north and 3.6 ha on the south. Farms with 20 hectares or more of land are the fastest growing farm types. Small family farms are still very important and still account for 44 percent of UAA. They also own the majority of heads of livestock and fruit plantations. In terms of agricultural production by value, livestock is the most important with 40.3 percent. Arable crops account for 26.5 percent, fruit for 20 percent and vegetable production for 13.2 percent. Although decreasing in importance, the agricultural and food processing sectors, as a parts of the wider agribusiness sector, are still the main segment of the Serbian economy. In 2012, agriculture and the food processing industry accounted for 8.5 percent and 4.3 percent of GDP respectively. In terms of employment, they accounted for 20 percent and 3.8 percent respectively. Food sector exports accounted for 23.5 percent of all exports and there is a significant net export in the food trade. The most important exported agricultural and food products are: grains (35 percent), fruit (24 percent), oils and fats (12 percent) and sugar (11 percent). Meat, vegetables and dairy products are less important in terms of exports with an 18 percent total share. The importance of small and medium size enterprises (SME) in the food processing sector varies from industry to industry. According available data, SMEs are important in: fruit, vegetables, meat, dairy, and grains. In sugar and vegetable oil industries only large processing companies exist. Farmers in Serbia sell their agricultural products to: processing industry, green markets, retail chains, and direct sale. Household use of farm products is still high, especially for vegetables, fruit, pork, poultry and dairy products. Total demand for farm products on the national market is slowly changing as a result of several factors; namely, a decreasing population, aging consumers, and rural to urban migration. The market structure of the food supply chain went through a number of changes during transition. Some characteristics of that process are: privatization of the food processing and retailing sector, consolidation of companies through horizontal or vertical integration, investments in new technologies, diversification of food products, packaging, and improved quality of products and standards of food safety. In 2013, concentration in the retail sector measured in CR2 53.6 percent; or in CR5 70.5 percent. This has brought market power to retailers, which was previously the reserve of large food processors. Government policy on agriculture was highly unstable, inconsistent and unpredictable during the last decade’s transition period. It went through several phases from subsiding agricultural products to subsidies per area (ha) and livestock unit. The agrarian budget has stabilized at 4 percent in recent years. Institutional development is taking place in Serbia. Seven directorates have been organized, and developed, although some of them, such as the Directory of National Reference Laboratories, are still developing. The agricultural extension service is being restructured, but with 230 extension agents, coping with political and other burdens is still an issue.

2
Serbia has a free trade agreement with the EU, CEFTA countries, Russia, Belarus and Turkey. The main exporting partners for Serbian agriculture and food sectors are Europe Union and CEFTA countries, with 43 and 35 percent of total exports respectively in 2011. The same regions are the main partners for imports of food products with 41 and 14 percent shares respectively. Five types of food products (corn, cereals flour, vegetable oils, sugar and raspberries) present 45 percent of the total value of exported food products. The law on food safety has regulated the food sector since 2009. Food safety is the responsibility of the Directorate of National Reference Laboratories and the Directorate for Plant Protection, Agricultural Inspection and Sanitary Inspection. Since 1 June 2011 all food processing facilities have had to establish HACCP by law. During 2009 and 2010, the government adopted 22 new laws regulating agriculture and the food market, as well as a set of rulebooks on the quality for specific food products. There are some impediments to enforcing legal regulations; namely, the capacity of agricultural inspection is low, the process of development of some institutions is not finished, the restructuring of old institutions is not finished, and there are additional costs for agents in the food supply sector. Research projects performed by universities and other research institutions suffer from limitations including: too much orientation on basic research and a lack of demand driven research. Moreover, the transfer of knowledge and innovations through the extension service to farmers is poor and without regular communication channels. Analysis of the seven most important food sub sectors in Serbia helped to identify the main stakeholders in food supply chains. Market channels, household consumption and total consumption were more precisely defined. Projection of food demand, assuming a population decrease, stable income per capita and traditional consumer habits shows that demand will not change significantly in the near future. Comparing the consumption pattern of the average Serbian consumer with the average EU consumer, it is clear that the Serbian population use more wheat products, and fewer dairy products, meat, apples, vegetable oil and eggs. Consumption of sugar and potatoes are similar. Retail prices of food products in Serbia follow world market price trends, but with some difference in speed and size. The quality of food and food safety has increased significantly in the past decade, according results of independent testing. Purchasing habits have changed from small local shops to super- and megastore markets. Consumers in bigger urban areas are paying slightly higher prices for food than those in smaller urban or rural areas. Value chain analysis for seven food products, one from each of the analysed food sub sectors, shows that farmers have the highest shares in retail prices for fruit, vegetables, and pork, where there is no significant additional cost in the downstream supply chain. Producers’ margins are bigger than farmers’ shares for sugar, wheat flour and milk, where considerable costs of other inputs exist, as well as transport costs. The Accreditation Body of Serbia (ABS) is defined, by the new Law on Accreditation from 2010, as the institution responsible for: testing, calibration, inspection and certification of products, certification of management systems and certification of persons. Organic production is regulated by the Law on Organic Production from 2010 and the rulebook of control and certification of organic production. Seven domestic and international certification companies control organic production in Serbia. Across the food chain, risk management is weakest at farm level. Only bigger farmers insure their production and use subsidies that cower 40 percent of the insurance cost. Small family farms typically use

3
diversification as a main tool for production and price risk. There is a public warehouse system, which has been in operation since 2009. Farmers can use warehouse receipts as collateral for bank loans. The Serbian food market can be described as a successive oligopsony. Many farms with average to small quantities of products and without any cooperative initiatives exist on one side. The downstream food supply chain usually makes one or a small number of processing companies interested in buying agricultural products in a specific region, which is followed by a highly concentrated retail sector. Among numerous SMEs in the food sector, three were selected for case studies; namely, Vitamin, Sirela, and Zdravo Organic. Using interviews and questionnaires with managers, in-depth research was conducted to gain an understanding of how effective the linkages with local farmers are. The main motivations of SME food processors to initiate coordination with small farms were to secure market inputs and to increase the quality of inputs. Until now good examples of well established relations between SMEs and small family farms in Serbia could be found in the dairy, meat, fruit, vegetable and grain supply chains. On other side, there are no such relationships in the sugar and vegetable oil supply chains. Vertical coordination is a learning process that asks for flexibility from two sides, extension work and capital from the processor side and enforcement integrated in contract of production. The major recommendations for government actions and policy measures that can foster business linkages between SMEs in the food processing sector and small farmers are as follows:
It has been identified that some processors look forward to cooperating through middlemen who will subcontract with other farms. In the near future this can be replaced with farmers’ cooperatives. Serbia needs a new and flexible law on cooperatives. One set of policy measures, after enacting such a law, could be to educate and motivate farmers to organize cooperatives using financial or tax incentives.
Transparency and better understanding of the economic situation of all participants is necessary for improving cooperation. Implementing the Farm Data Accountancy Network will help to increase the transparency of farm economics. Further steps could be taken by governmental departments (Ministry of Agriculture, Ministry of Science) to support applied research projects in the food value chain.
With new legislation for the food sector, additional investments in SMEs will be necessary to satisfy additional and higher standards. Since IPARD measures will not be available for Serbia in the next few years, it will be the responsibility of the Ministry of Agriculture to continue with measures for investing in the processing and marketing of agriculture and fishery products, as was case in 2010 and 2011.
Completing the development of the National Reference Laboratories will increase trust not only between SMEs and farmers, but between all value chain actors.
A set of measures should be aimed at increasing competition along food chains.
The Ministry of Agriculture should continue to support food processors to present their products on international fairs, and put more in focus on SMEs.
The development of the extension service and its connection with universities could foster vertical coordination in food value chains.

4
2 INTRODUCTION Small family farms in Serbia have been neglected by politics and the processing industry for a number of decades. After World War II, the socialist government put aside family farms hoping they would decrease in number and significance over time. After privatization of the processing industry, those companies that survived started to avoid small farmers and become more oriented towards big farms as suppliers. In societies where cooperative action does not exist, mainly due to historical burdens, another effective way of connecting small family farms is through vertical cooperation with SMEs. The concept of this study is to better understand the position of small family farms in total agricultural production in Serbia and its involvement in vertical cooperation with SMEs. The main objectives are to estimate the significance of small family farms and SMEs in Serbian agriculture and in the main food sub sectors, institutional environment, and identification of effective forms of vertical cooperation. Various methodologies were used in this study, including the following: literature review, use of published data sources (printed, from the internet, or acquired by request), interviews and questionnaires with managers in SMEs, large food processing companies and retailers, as well as case studies. The study started by reviewing literature mainly from recently published reports on the Serbian food sector and specific food industries (a literature list is given in Appendix 1). This study relies heavily on data from the databases of: the Statistical office of the Republic of Serbia (RZS), the Ministry of Agriculture, Forestry and Water Management (MPSV), the Statistics Division of Food and Agriculture Organisation of the United Nations (FAOSTAT), the Serbian Business Registers Agency (APR), the United States Department of Agriculture – Foreign Affairs Service (USDA-FAS), the National Assembly of the Republic of Serbia, and the Serbian Investment and Export Promotion Agency (SIEPA). Visits and interviews with managers of two main retailing companies helped to illuminate the relationship between food processors and retailers. Interviews with food processors were used to obtain a better understanding of their position on the market and for case studies. The study is composed of four parts. The first part (Chapter 3) describes the situation in Serbian agriculture, as well as environmental and government policy, focusing on the 2003-2012 period. In the second part (Chapter 4) processor-farmer business linkages are assessed in six previously identified major food supply chains, focusing on 2011 (2011 was an average production year while farm production in 2012 was severely decreased by drought, and data on the agribusiness sector in 2012 is still not fully available). The third segment of the study (Chapter 5) gives additional insight into farmer-SME food processor relationships through the three case studies. The last part (Chapter 6) lists the findings of the study and recommendations for future activities and assistance needed to develop programmes.

5
3 CONTEXT AND ENABLING ENVIRONMENT FOR THE DEVELOPMENT OF
PROCESSOR-FARMER RELATIONSHIPS
3.1 OVERVIEW OF MAJOR PRODUCTION AND MARKET TRENDS The farming sector in Serbia is traditionally based on small family farms. According to the last agricultural census from 2012 there are 628 555 family farms and 2 567 farms as legal entities (Table1). From the total utilized agricultural area of 3.36 million ha, 84 percent is used by family farms and 16 percent by legal entities. Generally, two production regions exist with almost equal agricultural land areas. Farms in the northern plains region, which are 9.6 ha on average, are the main suppliers of cereals, oilseeds, sugar beet, pork and poultry. Smaller farms on in the southern, hilly region, which are 3.6 ha on average, are more oriented towards fruit, vegetables, milk, and beef production. Diversification is a main characteristic of almost all family farms. Table 1. Number of farms and utilized agriculture area (UAA) in 2012
Farms total
Family farms
Legal entity
UAA total (ha)
Family farms UAA (ha)
Legal entity UAA (ha)
Serbia total 631 122 628 555 2 567 3 355 859 2 816 424 539 435
Serbia - north 180 695 179 394 1 401 1 732 183 1 277 118 455 064
Average farm UAA - north 9.6 7.1 325
Serbia - south 450 427 449 161 1 166 1 623 676 1 539 306 84 372
Average farm UAA - south 3.6 3.4 72.4
Source: Statistical office of Republic of Serbia (RZS)
Family farms in Serbia (Table 2) own 91.7 percent of all cattle and 80 percent of pigs. From data in Table 2 it can be inferred that legal entities in northern Serbia have a significant share in pig production. It should be mentioned that after privatization some legal entities are eliminating livestock production and becoming specialized in crop production. Table 2. Cattle and pigs per farm type and region in 2012
Total Family farms
Legal entities
Share family farms
Share legal entities
Cattle
Serbia - north 305 464 245 926 59 538 27.1 percent 6.5 percent
Serbia - south 603 526 587 292 16 234 64.6 percent 1.8 percent Pigs
Serbia - north 1 598 393 1 020 916 577 477 30.0 percent 17.0 percent
Serbia - south 1 804 895 1 703 251 101 644 50.0 percent 3.0 percent
Source: RZS
The structure of family farms is changing over time with increasing significance of farms with bigger acreage. Between the two censuses in 2002 and 2012, the number of farms owning more than 20 ha tripled, and the UAA increased by five times. However, the share of small family farms, presented in Table 3 is still the most important. Share of farms with up to 10 ha UAA, in the total number of farms is especially significant and 92 percent of all farms belong to this type; owning 44 percent of UAA, 54 percent of cattle, 59 percent of pigs and 51 percent poultry. Even taking in account only farms with up to 5 ha, they are still important with a 77 percent share in the total number of farms. Those farms own 26 percent of UAA, 29 percent of cattle, 39 percent of pigs and 40 percent of poultry. In Serbia farms with less than 5 ha dominantly exist in the south.

6
Table 3. Structure of family farms in Serbia in 2012
No land Up to 2ha 2.01- 5ha 5.01-10ha 10.01-20ha
20.01-50ha
50.01-100ha
Over 100ha
Number of farms 9 486 293 667 184 637 89 749 32 486 12 922 4 243 1 365
Total UAA, ha 264 451 593 749 615 799 434 322 383 305 300 036 224 762
Cattle, number 4 406 72 582 184 830 233 053 180 203 106 923 31 171 20 050
Pigs, number 41 820 571 257 750 520 659 074 372 607 214 680 75 858 38 351
Poultry, number 937 536 5 375 421 4 340 016 3 037 025 1 482 297 730 423 704 149 44 463
Source: RZS
The structure of agricultural production in Serbia by value of final production in current prices for 2011 is presented in Chart 1. 2011 was an average production year, with average climate and market conditions. Livestock production is the most important part of Serbian agriculture with a 40.3 percent share. The value of crop production was 26.51 percent, excluding cereals and forage produced for livestock production. One fifth of the value of agricultural production came from fruit and 13.23 percent came from vegetable production.
Chart 1. Structure of the value of agricultural production in 2011
Source: RZS
According to official data from April 2013, 41 percent of Serbia’s population lives in rural areas. The number people employed in agriculture is high since family unpaid labour (supporting labour) is included. This indicates that there is hidden unemployment, which is especially pronounced in southern Serbia, where the majority of housewives are deemed employed as “supporting” employees in agriculture. Taking into account that small farms are dominant, on which hardly one labour unit can be fully employed throughout a year, it can be inferred that the real rate of unemployment in rural areas is much higher than the official data. The data in Chart 2 shows that over the last 10 years the unemployment rate in Serbia has been about 20 percent. Only in two cases was it significantly lower, that is, in 2003 and 2008, which was thanks to the boost in the total number of people employed in agriculture. The share of women in total agricultural labour was about 41 percent during this period.

7
Chart 2. Employment in agriculture and unemployment rate
0%
5%
10%
15%
20%
25%
30%
0
200
400
600
800
2003 2004 2005 2006 2007 2008 2009 2010 2011 2012
Tho
usa
nd
s
Farmers and family workers in agriculture Women as family workers in agriculture
Unemployment rate Farmers in total employed population
Source: RZS
Chart 3 shows that the number of people employed at legal entities in agricultural production decreased strongly, and almost halved between 2003 and 2006. A similar trend has continued since then, albeit at a slightly slower rate. The reasons for this are numerous, but the main reason is the old socialist type of cooperatives and agricultural enterprises going bankrupt during the privatization process. Reorganization after privatization added some jobs and the situation is similar in the food processing industry. Chart 3. Number of employees of farm-legal entities and the food processing industry
0
20
40
60
80
100
120
2003 2004 2005 2006 2007 2008 2009 2010 2011 2012
Tho
usa
nd
s
Farms - legal entities Manufacture of food products
Source: RZS
According to an OECD classification from 2006, the difference in monthly earnings between the rural and urban populations is significant. Average monthly payments for the rural work force for one quarter of 2011 and 2012 respectively were lower than labour payments in urban areas. This is shown in in Chart 4. Moreover, the rural population has fewer employment opportunities than the urban population. Being a low profit activity, especially on small farms, combined with fewer opportunities, and lower earnings means that rural families earn less than their urban counterparts.

8
Chart 4. Average monthly net earnings
0
5
10
15
20
25
30
35
40
45
50
2011 2012
Tho
usa
nd
s R
SD/m
on
th
Rural Urban Source: RZS
The contribution of Agriculture to GDP decreased rapidly between 2000 and 2007 (Chart 5) from 17.6 percent to 8.4 percent. The stagnation of other parts economy in the five years leading up to 2012 influenced the stabilization of agriculture’s contribution to GDP at 8.5 percent. A similar, but less intensive trend can be seen in the food industry. Its contribution to the economy decreased in same period from 5.9 percent to 4 percent, and stabilized after that at 4.3 percent on average.
Chart 5. Share of agriculture and food processing industry in GDP
0
2
4
6
8
10
12
14
16
18
2000 2001 2002 2003 2004 2005 2006 2007 2008 2009 2010 2011 2012
%
Agriculture Food and beverage Source: RZS
3.2 THE ROLES AND IMPORTANCE OF SMALL FARMERS AND SMALL AND MEDIUM SIZED AGRI-PROCESSORS ON THE DOMESTIC MARKET AND EXPORTS OF FRESH AND PROCESSED FOOD AND
PRODUCTS The food industry has been through a process of privatization in recent decades. Some capacities have been successfully privatized, but more were closed. Successful new owners are focused on developing the significant capital investments in modernizing and increasing capacities. There are a wide range of good examples in dairy, milling-bakery, confectionery, oilseed, meat, fruit, beverage, feed and processing industry. Also, at the same time a significant number of new small and medium sized food processing enterprises have emerged. The importance of small and medium sized agri-processors varies from branch to branch. The grain storage and milling industry consists of about 370 silos owned by milling companies, grain traders and cooperatives and the total capacity is estimated at 3.8 million tonnes. The flour that is produced is mainly used by 120 bakery industry companies and about 1 700 small bakeries. There are also six larger industrial pasta producers and about 600 small pasta producers. In the dairy sector, there are 180 SMEs that process about 50 percent of all milk produced. In the meat processing sector, about 900 legal entities exist and the
9
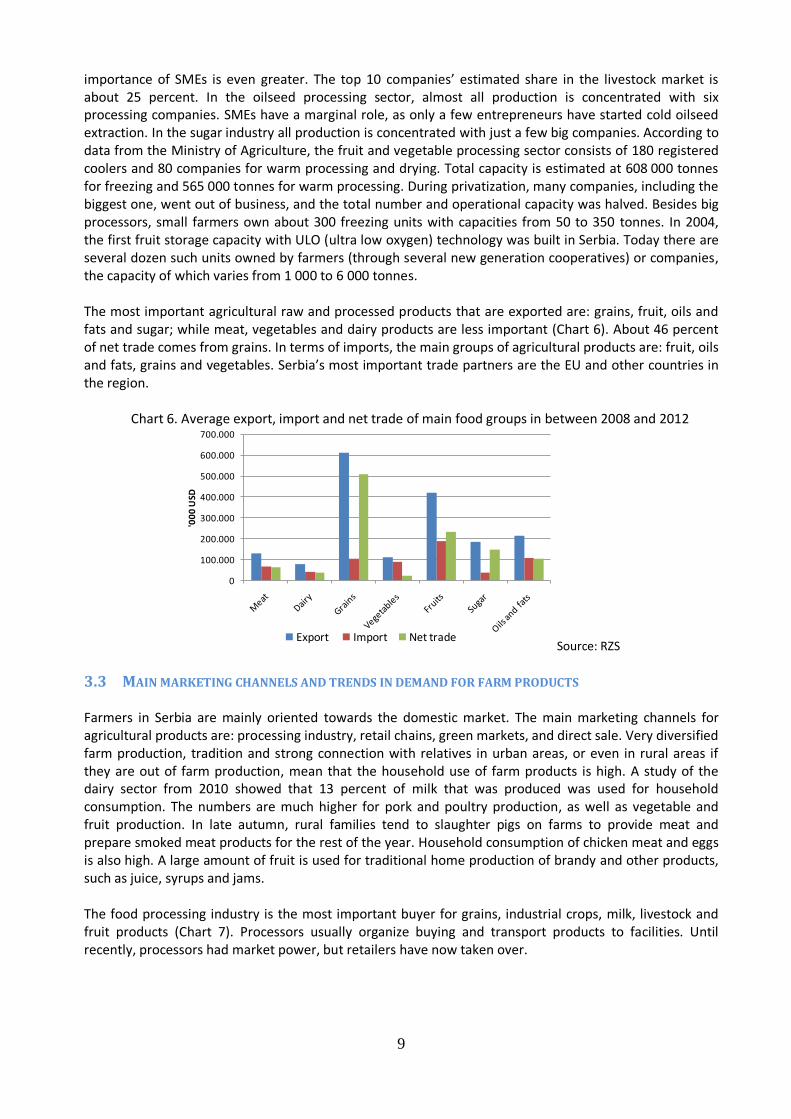
importance of SMEs is even greater. The top 10 companies’ estimated share in the livestock market is about 25 percent. In the oilseed processing sector, almost all production is concentrated with six processing companies. SMEs have a marginal role, as only a few entrepreneurs have started cold oilseed extraction. In the sugar industry all production is concentrated with just a few big companies. According to data from the Ministry of Agriculture, the fruit and vegetable processing sector consists of 180 registered coolers and 80 companies for warm processing and drying. Total capacity is estimated at 608 000 tonnes for freezing and 565 000 tonnes for warm processing. During privatization, many companies, including the biggest one, went out of business, and the total number and operational capacity was halved. Besides big processors, small farmers own about 300 freezing units with capacities from 50 to 350 tonnes. In 2004, the first fruit storage capacity with ULO (ultra low oxygen) technology was built in Serbia. Today there are several dozen such units owned by farmers (through several new generation cooperatives) or companies, the capacity of which varies from 1 000 to 6 000 tonnes. The most important agricultural raw and processed products that are exported are: grains, fruit, oils and fats and sugar; while meat, vegetables and dairy products are less important (Chart 6). About 46 percent of net trade comes from grains. In terms of imports, the main groups of agricultural products are: fruit, oils and fats, grains and vegetables. Serbia’s most important trade partners are the EU and other countries in the region.
Chart 6. Average export, import and net trade of main food groups in between 2008 and 2012
0
100.000
200.000
300.000
400.000
500.000
600.000
700.000
'00
0 U
SD
Export Import Net trade Source: RZS
3.3 MAIN MARKETING CHANNELS AND TRENDS IN DEMAND FOR FARM PRODUCTS Farmers in Serbia are mainly oriented towards the domestic market. The main marketing channels for agricultural products are: processing industry, retail chains, green markets, and direct sale. Very diversified farm production, tradition and strong connection with relatives in urban areas, or even in rural areas if they are out of farm production, mean that the household use of farm products is high. A study of the dairy sector from 2010 showed that 13 percent of milk that was produced was used for household consumption. The numbers are much higher for pork and poultry production, as well as vegetable and fruit production. In late autumn, rural families tend to slaughter pigs on farms to provide meat and prepare smoked meat products for the rest of the year. Household consumption of chicken meat and eggs is also high. A large amount of fruit is used for traditional home production of brandy and other products, such as juice, syrups and jams. The food processing industry is the most important buyer for grains, industrial crops, milk, livestock and fruit products (Chart 7). Processors usually organize buying and transport products to facilities. Until recently, processors had market power, but retailers have now taken over.

10
Chart 7. Values of agricultural products sold to processors and on green markets in 2011
0 10.000 20.000 30.000 40.000 50.000
Grains
Industrial crops
Dairy products
Livestock
Fruits
Vegetables
Poultry meat and eggs
Mill RSD
Green market Processing industry
Source: RZS
Larger farmers that are more focused on fruit and vegetable products, have the opportunity to sell products directly to retail chains. However, for this they have had to make additional investments in storage facilitates and in production technology to satisfy standards. Green markets in Serbia have a long tradition and they are very important for farmers, although a vast number of middlemen are present on them. Green markets are organized in cities and villages in buildings or open-air stalls. For use of stalls rent had to be paid, which is an additional burden on small farmers. Therefore, small farmers often use street sales, close to shopping areas. Based on value on a yearly basis, the most important products on green markets are vegetables (30 percent) and fruit (20 percent), followed by dairy (18 percent) and poultry products (15 percent). Recently, larger retailers have started to understand the importance of fresh vegetables and fruit products for increasing their customer base and revenue. Throughout the year and especially at the beginning of the season, retailers tend to lower their prices. Direct sale is another important market channel for farm products. The importance of this market channel in the dairy sector is equal to that of household use and it has similar importance in other product groups as well. Trying to ensure good quality food for their families, non-farm dwellers prefer to buy agricultural products directly from farmers from time to time. Total demand for farm products is changing for several reasons; namely, population decrease, income levels and consumers’ dietary habits and tastes. The population in Serbia is decreasing by 0.4 percent per year. Annual income per capita has increased over the last 10 years, but in the last five years has remained quite stable at EUR 4100. Rural to urban migration is continuing and is changing consumption patterns. For example, people living in rural areas tend to consume more dairy products than their urban counterparts and with rural-urban migration, per capita consumption is decreasing. The population is also aging, which is influencing the structure of food demand. Awareness of consumers and concern for food safety can shift consumption of products in some crisis periods, such as the first half of 2013 with afla-toxin in dairy products. During the crisis, processors were stuck with stocks of UHT milk and cheese.
3.4 ENABLING ENVIRONMENT FOR SMALL FARM COMMERCIALIZATION AND THE DEVELOPMENT OF
SMALL AND MEDIUM SIZED AGRI-PROCESSING ENTERPRISES IN RURAL AREAS Serbia has a positive external trade balance in most food products and agriculture is showing positive net trade. In the last five year period, average net trade was USD 1.1 billion, increasing at 14 percent per year. According data for 2011, the value of agriculture exports was about one quarter of the total market value of production. The potential of agriculture is huge, since average yields are still low and the structure of food supply chains and their elements have passed through significant changes in recent decades. The

11
main characteristics of this process have been: privatization of food processing and retail sectors, consolidation of companies on the market through horizontal and vertical integration, vertical coordination, diversification of food products, packaging and improved quality and standards for food safety. After privatization, a large number of food processing companies went bankrupt. This was inevitable in all food sectors, with smaller effects in dairy and oilseed processing sector. Examples of horizontal integration can be seen in the sugar, dairy, vegetable oil and grain sectors. Small and medium sized food companies started emerging in the 1990s and have been increasing in number in rural regions (especially between 2004 and 2010) (Chart 8). The closeness of input suppliers, cheaper labour and lower cost of real estate, were the main reasons for this trend. Supplier number is higher in dairy, fruit and vegetable processing, meat and grains. Owners of SMEs in the food sector developed good relationship with universities, particularly with faculties of technology for development and application of technologies in processing of agricultural products. Chart 8. Share of SMEs in the total number of companies and employees in the food, beverage and tobacco sector
0%
20%
40%
60%
80%
100%
2004 2005 2006 2007 2008 2009 2010
Number of SME Employees in SME Source: RZS
Consolidation is most obvious in the retail sector. The concentration rate for the two biggest retail chains CR2 increased from 37.6 to 53.6 percent between 2009 and 2013, taking into account the recent takeover of Mercator by Agrokor. Both Delhaize and Agrokor are foreign companies, while other foreign chains, Metro and Lidl are just entering market. Looking from a wider perspective, in the same period, CR5 of the retail sector increased from 57.1 to 70.5 percent, indicating a high concentration in retail sector in Serbia. Government policy on agriculture is characterised as highly unstable. Farmers tend not to be informed about current year measures on time, often after they should have made decisions about production plans. Agrarian policy has passed through three characteristic phases in recent years. In the first period, from 2001 to 2003, price support was the main measure, applied for some agriculture products (milk, soy, sunflower, sugar beet, wheat, etc). Export subsidies were introduced from 2003 for meat, dairy, fruit and vegetables and some others food products. From 2004 to 2006 price support was gradually decreased and replaced with investment and rural development measures. The importance of loan support to farmers has increased since 2004. Since 2007, payment based on area (per ha) and number of livestock were introduced. The agrarian budget has stabilized in recent years at about 4 percent. New agrarian institutions organized in the last decade include: the Veterinary Directorate, the Directorate for Plant Protection, the Water Management Directorate, the Agricultural Land Directorate, the Forestry Directorate, the Directorate of National Reference Laboratories and the Directorate for Agricultural Payment. Some of these institutions are still developing and the agricultural extension service is undergoing a restructuring process. Moreover, scientific institutions needed to be reformed and a register of farms has been established, although this is imprecise, since there are more farms than are registered. Some measures of agricultural policy resulted in farmers deciding to split up their land and continue their business as they used to.

12
Until now vertical coordination was only visible in the dairy supply chain. The reason for this is that dairy processors have a clear interest in securing the input market and the high quality of milk. In other food sectors, like vegetable oil and sugar, processors buy produce with farmers supplying them some inputs (seeds, fertilizer, and advisory services). In some cases processors and retailers coordinate on trademark products. Serbia’s trade policy is changing and is in the process of removing high border protection in trade with the EU. As of 1 January 2009, Serbia unilaterally applied an interim trade agreement with the EU. This means very low border protection for agricultural and food products in trade with the EU. It will remain from the beginning of 2014. Besides the EU, Serbia has free trade agreements with CEFTA countries (Albania, Bosnia and Herzegovina, Macedonia, Moldavia, UNMIK, Montenegro), as well as with Russia, Belarus and Turkey. Value added tax (VAT) on food is charged at two different rates, 8 percent and 20 percent (until November 2012 it was eight percent and 18 percent). The lower rate is for all agricultural products and basic food products (flour, vegetable oil, milk, meat, eggs, bread and dairy products). Sellers on green markets do not pay VAT, but competition with retail chains is high, resulting in decreased prices of food (especially fresh fruit and vegetables at the start of the season). Food safety is regulated by the Law on Food Safety from 2009. Responsibilities are shared between the Ministry of agriculture, forestry and water management and the Ministry of health. The Law established the Directorate of National Reference Laboratories, which together with the Directorate for Plant Protection and the Agricultural Inspection and Sanitary Inspection, controls food safety in Serbia. Agricultural extension stations, scientific institutes, universities and private laboratories are authorized to carry out some food safety tasks. All food products are controlled regularly at the border, and internal control is performed randomly by the Agricultural and Sanitary Inspectors. The Animal Identification Register has been established and is successfully operating. The quality of agricultural and food products is closely regulated by several rulebooks on quality of: meat and meat products, milk and milk products, honey and other bee products, quality and other requirements for beer, animal feed, raw coffee and coffee products, fish, crabs, shellfish, sea urchins, frogs, snails and their products and the Rulebook on Quality of fruit, vegetables and mushrooms. Since 1 June 2011 all food processing facilities have had to establish HACCP by Law of food safety. Opportunities to export food products to the EU have motivated some processors and traders to apply other required standards such as commercial (ISO, IFS, BRC, Halal, GOST-R, Global Gap etc.) or organic standards. For example in the dairy processing sector, since 2010, only “Mlekara Subotica” achieved standards, and has been granted approval to export to the EU. Other processors or traders in the fruit, meat and grain sector had to apply the necessary standards in order to reach a specific foreign market. The food market is regulated by a large number of new laws, which were adopted in the process of harmonization with EU regulations. During 2009, 15 laws regulating agriculture and the food market were adopted; namely, the Law on Food Safety, the Law on Public Warehouses for Agricultural Products, the Law on Plant Health, the Law on Agriculture and Rural Development, the Law on Livestock, the Law on Pesticides, the Law on Fertilizers, the Law on Brandy, the Law on Animal Welfare, the Law on Ethanol, the Law on Wine, the Law on Reproductive Material of Forest Trees, the Law on Genetically Modified Organisms and the Law Amendments to the Law on Agricultural Land and the Law on Protection of Plant Breeder’s Rights. In 2010, the Serbian government adopted seven more laws; namely, the Law on Forests, the Law on Waters, the Law on Beer, the Law on Registration on Crop Varieties, the Law on Organic Production, the Law on the Amendments to the Veterinary Law and the Law on Agriculture Extension and Expert Service.
13
The main institutional difficulties in implementing laws regulating agriculture and food products are in the capacities of agricultural inspections and the unfinished system of national reference laboratories. Besides that, short transition period and high costs create an additional burden for farmers and processors. There is still a lot of work to be finished in terms of enforcing these laws. For example, the Law on Agricultural Extension is not fully enforced because the process of advisor licensing and registration is unfinished and the Expert Advisory Board exists only formally. Agricultural research is performed by six Universities and numerous specialized agricultural Institutes. Research projects are financed, on a regular four-year basis by the Ministry of education, science and technical development. The main limitations of research results are: they are too oriented towards basic research, they lack demand driven research questions, the transfer of knowledge to the extension service and finally to farmers is poor and lacks regular communication channels. Innovations are visible in a growing number of varieties and packaging types of food products introduced mainly by larger processors. Some small and medium sized agro-processors have attempted vertical integration, focusing on traditional food products, or innovative distribution channels under pressure from large retailers. The Serbian Agricultural Advisory Service (AES) consists of 12 agricultural stations in Vojvodina and 22 in central Serbia, as well as the Institute for Application of Science in Agriculture (IPN), which coordinates the activities of agricultural stations. About 230 employees are working with farmers across Serbia. The agricultural extension service is financed by the Ministry of Agriculture from its annual budget. There are also some project-based possibilities for financing offered by the MPSV. Most advisors have technical knowledge but only a few of them are economists. In recent years, the United States Department of Agriculture (USDA) and the World Bank (WB) has supported farm management training courses for all advisors to improve their skills in terms of diagnosing farm problems and effective communication. The fact that there are many farmers that need advice, but only a small number of advisors, who are facing numerous obstacles, means that farmers that need advice do not always receive it. Private agricultural advisors also exist, although they serve mainly fruit and vegetable farmers who are able to pay their services. Serbia had a successful history of business organization and cooperatives until World War II. The post-war period was characterized by real cooperatives not being common. The Ministry of Agriculture and some foreign donors have encouraged farmers to organize cooperatives in recent decades, but without significant success. There are only a few fruit farmers that are members of a new generation of cooperatives, which have survived until now. Farmers’ associations have had more success but still have not achieved significant results. Until now, farmers’ associations have had several successes in negotiating with the government regarding subsidies. Processors from some food groups have succeeded in organizing several associations such as: the Association of Small and Medium-sized Milk Processors, the Association of Fruit and Vegetable processors, and the Association of Cold Storage of Fruits and Vegetables. These associations exist only formally, and have not developed much. The first significant government support measures to improve how agri-food chains function were started in 2004 and 2005. These measures were focused on investment in storage capacities for agricultural products. In 2005, government support provided 50 percent of the capital for building 10 brand new ULO cold storage units owned by farmers. In the process of preparation for Instruments for Pre-Accession Assistance and Rural Development (IPARD), the Serbian government financed two pilot measures, from which one is equivalent to 103 IPARD measure Investment in the processing and marketing of agriculture and fishery products. The main aims of this measure were the preparation for implementation of the IPARD programme and the habituation of potential users on new higher EU standards. In 2010 support to investments in 157 food and agriculture

14
processing companies was approved, with RSD 520 million in total. The programme continued in 2011 when 732 investments were supported with RSD 275 million. It is not yet clear when Serbia will have access to the IPARD programme. Activities on preparation for the next IPARD period (2014-2020) are not finished in Serbia, so this support will not be available until 2015 at the earliest.

15
4 VALUE CHAIN PERSPECTIVE OF PROCESSOR-FARMER BUSINESS LINKAGES
The food value chain generally shows the movement of food products along the supply chain and identifies the stakeholders and their value added activities. The meat sector is one of most important in Serbian agribusiness (Chart 9). Since production on farms is diversified the vast majority of 631 122 farms have one or more livestock enterprises. The number of livestock being kept has decreased significantly since the mid-1970s (number of cattle halved), and since the mid-1980s the number of pigs and chickens has decreased by 40 percent and 35 percent respectively. This decrease, particularly in the case of cattle and pigs, is due to depopulation and an aging population in rural areas. Farmers sell fattened cattle, pigs and poultry to slaughterhouses or small butcher’s shops or use them for self-consumption or direct sale. There are about 30 major slaughter plants and about 900 small slaughter houses. The slaughter of livestock on family farms, mainly chicken and pigs is widespread. Produced meat and meat products are used for family consumption, or sold to other consumers. Processors distribute meat and meat products to: the retail sector and directly through processor owned shops and HORECA sector. Some of the top processors such as Matijević, Topiko, Big Bull, Neoplanta and Bačka have their own networks of retailers, and sell directly to consumers. In recent years, Serbia has been importing slightly more meat and meat products than it has exported.
Chart 9. Meat flow diagram for 2011
Import of meat
and meat
products
20 mil. kg
Farm usage and direct sales
(46 mil. kg beef, 178 mil. kg pork and
48 mil. kg poultry)
Meat processing industry
(35 mil. kg beef, 93 mil. kg pork and
55 mil. kg poultry)
Direct sale
Farm
household
consumption
MeatMeat
products
Consumers
460 mil. kg
Retail HOREKA
Export of meat
and meat
products
15 mil. kg
Total livestock production – in live weight
(172 mil. kg cattle, 522 mil. kg pigs and 112 mil. kg poultry)
Input sector
Livestock farms
(with 542.000 cows and hefers, 485,000 sows and
gilts and 11,642,000 hens )
Direct
sale
(43% cattle,
34% pigs and
53% poultry)
(57% cattle,
66% pigs and
43% poultry)

16
The milk supply chain starts with the dairy farm and ends with the consumer (Chart 10). Input suppliers to dairy farms are less important than in other food chains, since farms tend to produce all their own feed and buy only premixes from feed companies. Veterinary service, medicines, insemination and dairy sundries are additional inputs with smaller shares in the cost of milk production. There are about 250 000 dairy farms in Serbia. Total milk production in 2011 was 1.434 billion litres, and counting milk for calves an additional 100 million litres should be added. Production is steady with very low seasonality during summer months. The main marketing channel for milk is the dairy industry with 68 percent, but self-consumption and direct sale are still strong with a 30 percent share. There are 190 dairy processors that collect and transport milk from farmers to processing facilities. Until now farmers have not organized any dairy cooperatives although the vast number of them own small herds from 1 to 5 cows. In light of this, some of the biggest processors (Mlekara Subotica, Imlek, Somboled, Mlekoprodukt) took the initiative and though various activities are supporting changes of farm sector structure. Using vertical downstream coordination they provide financial and advisory services and inputs to farmers, to secure input market and increase the quality of milk in the long run. Chart 10. Milk flow diagram for 2011
Import of milk
and dairy
products 87
mil. l
Farm usage and direct sales
427 mil. litres (30%)
Dairy processing industry
980 mil. litres (68%)
Direct sale of
fresh milk and
milk products
227 mil. l
Farm
household
consumption
200 mil. l
Liquid milk
(Yoghurt,
UHT and
pasteurised)
(69%)
Processing
losses
(2%)
Other
dairy
products
(29%)
Consumers
1,413 mil. litre
RetailFood
processingHOREKA
Export of
dairy
products
108 mil. l
Total raw milk production
1,434 million litres
Milk extra class
(EU standard)
150 mil. l
Milk below
EU standards
830 mil. lMilk for calves feed+
milk losses 25+2 mil. l
(2%)
Input sector
Dairy farms sector
(240.000 farms with 510.000 cows)
Direct
sale
The majority of dairy products are distributed through retailers, mainly in the form of liquid milk products. Whole milk powder and skimmed milk powder are inputs for the confectionary industry. The direct sale of milk from processors to consumers is a new market channel. Several years ago, the Sirela dairy, which processes 5 million litres of milk annually, developed a network of small dairy shops to sell its products. Some other small and medium sized dairy processors, facing longer payment terms and bigger rebates asked from big retailers, are also following this idea. Now, about 2 percent of all processed milk is sold through outlets owned by processors.

17
Average consumption of milk in Serbia is approximately 200 litres per capita per year. The main products are milk (ESL, pasteurised and UHT), yoghurt and other liquid fermented milk products. Consumption of milk is higher in rural areas than in urban, due to high self-consumption. The grain supply chain is the most important food system for Serbian agriculture exports. It is also the food value chain with the most stakeholders. Input suppliers can be divided in three groups; namely, those for seeds, mineral fertilizer and pesticides. Over the past decade almost all international seed companies have become operational in Serbia; including Pioneer, KWS, Lg, Syngenta and Monsanto. There are three domestic input suppliers; namely, the Institute for Field Crops and Vegetables, the Maize Research Institute Zemun Polje and Chemical Agrosava. From 800 million kilograms of mineral fertilizer Serbia imports half from Russia, Ukraine, Romania, Hungary and Croatia. There are two domestic pesticide suppliers (Galenika and Chemical Agrosava), and numerous international companies (Bayer, BASF, DuPont, etc.)
Chart 11. Grains flow diagram for 2011
Import of
grains
0.08 mil. t
Consumers
1.1 mil. t
RetailFood
processingHOREKA
Export of
grains
2.16 mil. t
Grain milling industry
1.2 mil. t
Input sector
Farms
(1.85 mill. ha planted with corn, wheat,
barley, oats and rye)
Total grains production
8,9 mil. tonnes (73% corn, 23% wheat, 3% barley)
Grain traders
2 mil. t
Livestock feed
4 mil. t
Losses
0.5 mil. t
Ending stock
1.9 mil. t
Opening stock
0.7 mil. t
Almost every farm produces some grain. Chart 11 shows that the most important grain is corn with a 73 percent share, wheat is second with 23 percent, while barley, oats and rye have marginal importance in total grain production. From 8.9 million tonnes of grain that was produced in 2011, most corn is stored at farms, and used as livestock feed. Losses are high because storage conditions on farms are poor, with rodents and insects destroying up to 10 percent of the yield. Grain traders buy up 2 million tonnes of grains for export, mainly to EU and CEFTA countries. Traders and milling companies own 370 storage facilities with a total capacity of 2.5 million tonnes. The grain milling industry processes about 1.2 million tonnes of wheat into flour and other products, for both the domestic market and for export. The human consumption of grains, mainly wheat, is estimated on 1.1 million tonnes per year. The vegetable oil supply chain is simpler and has fewer stakeholders (Chart 12). The average area planted with oilseeds is 340 000 hectares (10.5 percent of total arable land). Rapeseed is usually planted by larger farms, while sunflowers and soybeans are planted by all types of farms. In Serbia only six big processing

18
capacities are engaged in raw and refined vegetable oil production; namely, Victoriaoil, Soya protein, Dijamant, Vital, Nova Crnja and Sunce. The most important type of vegetable oil for processing is sunflower oil, which accounts for two-thirds of the total. Serbia is a net exporter of oilseeds and vegetable oil, where export is bigger than domestic consumption. Vegetable oil is not used for fuel production yet, because of low oil prices, although a production capacity does exist. Per capita consumption of vegetable oil in Serbia is lower than in EU countries and lower that the world average of 18.7 litres per capita per year (OECD estimate).
Chart 12. Vegetable oil flow diagram for 2011
Import of
vegetable oils
23 mil. kg
Consumers
106 mil. kg
RetailFood
processingHOREKA
Export of
vegetable oils
137 mil. kg
Vegetable oil processing industry
220 mil. kg (67% sunflower, 26% soybean, 7% rapeseed)
Input sector
Farms
(340,000 ha planted with oilseeds)
Total oilseeds production
917,398 tonns (48% soybean, 47% sunflower, 5% rapeseed)
Import of
oilseeds
39 mil. kg
Export of
oilseeds
72 mil. kg
Chart 13. Sugar flow diagram for 2011
Import of
sugar
5 mil. kg
Consumers
255 mil. kg
RetailFood
processingHOREKA
Export of
sugar
196 mil. kg
Sugar processing industry
476 mil. kg
Input sector
Farms
(56,000 ha planted with sugar beet)
Total sugar beet production
2,822,000 tonnes
Import of
sugar beet
11 mil. kg
Export of
sugar beet
433 mil. kg
Opening stock
15 mil. kg
Ending stock
45 mil. kg

19
The most simple supply chain is for sugar (Chart 13). Usually only bigger farms produce sugar beet since it requires special harvesting equipment. The average area planted with sugar beet is 60 000 hectares (2 percent of total arable land). In 2013 only two companies were engaged in sugar processing; namely, MC Group and Finanziaria Saccarifera Italo-Iberica, since the Greek company Hellenic Sugar is under the process of being sold to MC Group. Serbia is net exporter of sugar with over 40 percent production exported. Per capita sugar consumption is 35 kg per year, which is significantly above average global consumption. The fruit and vegetable supply chain in Serbia in 2011 is presented in Chart 14. The input sector in the fruit and vegetable value chain is important. All input suppliers can be separated into several groups; namely, agrochemical, seeds, fertilizer, extension, mechanisation and equipment for irrigation and hail protection. The number of suppliers in every group has increased over the past decade, as has the quality of inputs. Fruit and vegetables are produced by a large number of farms most of which have only small plots for self-consumption. Although not numbered, farmers with 1 hectare or even more than 10 hectares of orchards recently invested in new fruit production technologies. There are also examples of companies from other sectors of the economy that have invested in large fruit or vegetable production and vegetable production in greenhouses is growing. The majority of farms that were previously sate owned are struggling through the privatization process, usually without new investments. The total area covered by orchards is 240 000 hectares (5 percent of utilized agriculture land in Serbia). The three most important fruit varieties in terms of planted area are: plums, apples and sour cherries. Vegetable production occupies about 230 000 hectares, and potatoes account for 40 percent of this land. Other significant vegetables in terms of planted area are: cabbages, tomatoes, beans, onions and peppers.
Chart 14. Fruit and vegetable flow diagram for 2011
Farm usage
(35%)
Cold storage and processing
industry (20%)
Total production
1.63 mil. t fruits and 2.15 mil. t vegetables
Input sector
Fruit and vegetable farms
(240.000 ha fruits and 230.000 ha vegetables)
Green market
(20%)
Import of Fruits
182 mill. kg and
Vegetables 120
mil. kg
Consumers
1,35 mil. t Fruits and 1,72 mil. t Vegetables
RetailFood
processingHOREKA
Export of Fruits
377 mil. kg and
Vegetables 120
mil. kg
Losses
(15%)
Midleman
(10%)
The active processing sector has an annual capacity of about 300 million kg, which is significantly less than the total fruit and vegetable production. There are 20 companies that carry out hot processing of fruit and vegetables, and 20 plants for juice and concentrate production. The lack of storage and processing capacities can be inferred by out of season price fluctuations. Additional investment in new and storage

20
and processing capacities, as well as modernizing old ones, could reduce price fluctuation on the domestic market and create more export opportunities. Expansion in the retail sector, with increasing sales of fresh fruit and vegetables, happened with the development of modern supermarket chains. Green markets now have a smaller share in the retail market, although they are still an important channel. Middlemen bring fruit (apples and plums) and vegetables (watermelon, tomatoes, potatoes, peppers and cabbage) from production regions to urban areas in trucks. Losses are significant because of the highly perishable nature of fruit and vegetable products and a lack of good storage capacities on farms. Potato losses can be as high as 20 percent. More than 80 percent of households have freezers between 200 and 400 litres in capacity. This is one way that consumers try to balance price picks with some kind of locally grown fruit and vegetables.
4.1 MARKET DEMAND PROJECTION AND CONSUMER BEHAVIOUR Food demand is connected to the size of the population, per capita income and consumer habits. The population in Serbia is decreasing and according to projections it will fall by 0.4 percent a year until 2017. With lower per capita income, consumer habits are slowly changing. Per capita consumption of major food products in Serbia, presented in Chart 15, explains the nutritional habits of consumers. Compared to an EU citizen, an average Serbian citizen consumes considerably more wheat products, and fewer dairy products, meat, apples, vegetable oil and eggs. Consumption of sugar and potatoes are on similar level in Serbia and EU countries.
Chart 15. Consumption of major food products per capita in 2011
0 50 100 150 200 250 300
Milk, l
Eggs, unit
Wheat, kg
Potato, kg
Pork, kg
Sugar, kg
Poultry, kg
Apple, kg
Vegetable oil, l
EU Serbia
Source: FAOSTAT, RZS, MPSV
Retail price development (presented in Chart 16) followed world market price trends with some differences in speed and size. All major food product categories hit their peak prices in 2008. In the next two years prices decreased and the next price peak was seen in 2011. The price of food increased again in 2012 but only for pork, chicken and eggs. The dairy, meat and fruit and vegetable sectors were more concentrated during the socialist era. Promotion of entrepreneur initiatives and unsuccessful privatization that closed vast number of big processing capacities, opened a space for small and medium sized companies in those three sectors. Standards and the quality of products are increasing. The Serbian food sector has to make large adjustments to new legislation in order to synchronise it with EU laws, implying higher standards. According to results of laboratory testing done by National organizations of consumers in Serbia, the quality of food products increased significantly in the first decade of the 21st century, although in the last three years official control has been loosened.

21
Varieties of food products have diversified over the past decade. After privatization, diversification has been visible in several ways. There is a range of new products (functional products, organic etc), new technologies like ESL milk, new packaging sizes (single serve to family size) and new packaging materials.
Chart 16. Price development of major food products in Serbia in period 2007-2012
0
1
2
3
4
5
6
2007 2008 2009 2010 2011 2012
EUR
Milk, 1l Bread, 1kg Pork, boneless, 1kg
Chicken, whole, 1kg Egg, 10 unit
0
0,5
1
1,5
2
2007 2008 2009 2010 2011 2012
EUR
Potato, 1kg Apple, 1kg Vegetable oil, 1l Sugar, 1kg
Source: RZS
Until about two decades ago, most food products were purchased from small shops in local streets. The development of large domestic retail chains with super- and megastore formats, which have recently passed throughout ownership changes (mainly sold to international companies), has changed this old tradition. Today, the few surviving small shops – mainly thanks to their good locations – are only a minor market channel for food products. High consumption of fresh bread and pasteurised milk is still strong consumer habit that supports the existence of small local shops. Ten types and groups of food product accounts for over 60 percent of Serbian total export value of agricultural and food products. As seen in table 4, the value and share of exported food products has remained quite stable in recent years. Grains and products from cereals account for about one third of all exports. Fruit and fruit products are the second most important export products. The main exporting partners for Serbian agriculture and food sectors are the Europe Union and CEFTA countries, with 43 percent and 35 percent of total export respectively in 2011. Table 4. Values and shares of major exported agricultural and food products in 2011
Agricultural products Mill. USD % Food products Mill. USD %
Corn 456 17.2% Cereals flour, and products from flour 195 7.4%
Raspberries, frozen and fresh 183 6.9% Vegetable oils 189 7.1%
Wheat 95 3.6% Sugar 175 6.6%
Sour cherry, frozen and fresh 71 2.7% Live animals, meat and meat products 133 5.0%
Apples 66 2.5% Dairy products 90 3.4% Source: RZS
Future export opportunities for the Serbian food sector depend on two elements; namely, its ability to achieve higher food safety and quality standards and the development of the food industry. The development of livestock production is also crucial because if the previous negative trend continues it will lead to import dependence. Stronger production of value added food products could have export opportunities to: Russia, Ukraine, Kazakhstan, and CEFTA countries. After Croatian accession to EU in 2013 Serbia will have an opportunity to replace most of the previous Croatian food exports to the CEFTA region. Imports of food products from the EU and CEFTA countries account for 41 percent and 14 percent of all food imports respectively. Domestic market opportunities are in substitution of imported products, where
22
fruits and vegetables are the group with highest imported value. Other products of value significant that could be substituted with domestic production are: tobacco, wine, dairy and meat products.
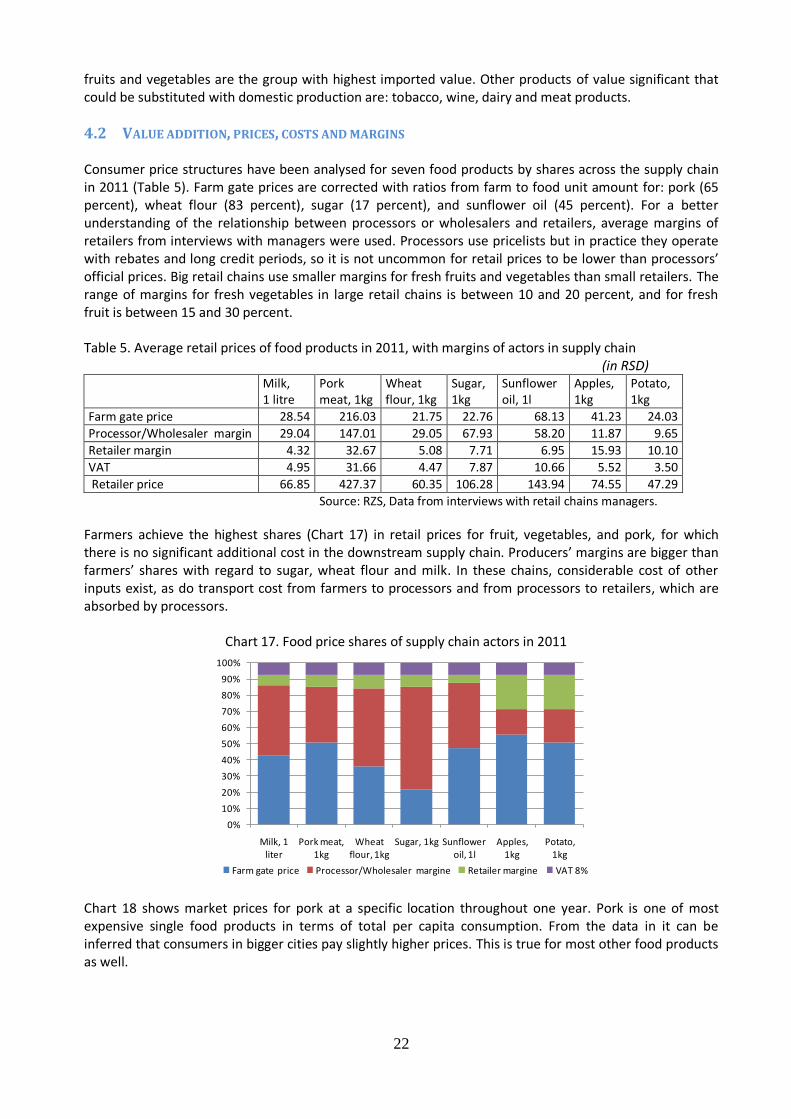
4.2 VALUE ADDITION, PRICES, COSTS AND MARGINS Consumer price structures have been analysed for seven food products by shares across the supply chain in 2011 (Table 5). Farm gate prices are corrected with ratios from farm to food unit amount for: pork (65 percent), wheat flour (83 percent), sugar (17 percent), and sunflower oil (45 percent). For a better understanding of the relationship between processors or wholesalers and retailers, average margins of retailers from interviews with managers were used. Processors use pricelists but in practice they operate with rebates and long credit periods, so it is not uncommon for retail prices to be lower than processors’ official prices. Big retail chains use smaller margins for fresh fruits and vegetables than small retailers. The range of margins for fresh vegetables in large retail chains is between 10 and 20 percent, and for fresh fruit is between 15 and 30 percent. Table 5. Average retail prices of food products in 2011, with margins of actors in supply chain
(in RSD)
Milk, 1 litre
Pork meat, 1kg
Wheat flour, 1kg
Sugar, 1kg
Sunflower oil, 1l
Apples, 1kg
Potato, 1kg
Farm gate price 28.54 216.03 21.75 22.76 68.13 41.23 24.03
Processor/Wholesaler margin 29.04 147.01 29.05 67.93 58.20 11.87 9.65
Retailer margin 4.32 32.67 5.08 7.71 6.95 15.93 10.10
VAT 4.95 31.66 4.47 7.87 10.66 5.52 3.50
Retailer price 66.85 427.37 60.35 106.28 143.94 74.55 47.29
Source: RZS, Data from interviews with retail chains managers.
Farmers achieve the highest shares (Chart 17) in retail prices for fruit, vegetables, and pork, for which there is no significant additional cost in the downstream supply chain. Producers’ margins are bigger than farmers’ shares with regard to sugar, wheat flour and milk. In these chains, considerable cost of other inputs exist, as do transport cost from farmers to processors and from processors to retailers, which are absorbed by processors.
Chart 17. Food price shares of supply chain actors in 2011
0%
10%
20%
30%
40%
50%
60%
70%
80%
90%
100%
Milk, 1 liter
Pork meat, 1kg
Wheat flour, 1kg
Sugar, 1kg Sunflower oil, 1l
Apples, 1kg
Potato, 1kg
Farm gate price Processor/Wholesaler margine Retailer margine VAT 8% Chart 18 shows market prices for pork at a specific location throughout one year. Pork is one of most expensive single food products in terms of total per capita consumption. From the data in it can be inferred that consumers in bigger cities pay slightly higher prices. This is true for most other food products as well.

23
Chart 18. Market prices of pork in Subotica, Belgrade, and Nis in 2011
300
320
340
360
380
400
420
440
jan feb mar apr maj jun jul avg sep okt nov dec
Subotica Beograd Nis Source: RZS
4.3 CERTIFICATION AND QUALITY CONTROL The Accreditation Body of Serbia (ABS) was officially founded as a non-profit organization in 2006 at the decision of Serbian government. The new Law on Accreditation from 2010 defined ABS as an institution with competency for: testing, calibration, inspection, certification of products, certification of management systems and certification of persons. ABS has 35 employees with 252 assessors and experts on its register of assessors and technical experts. In May 2012, the Accreditation body of Serbia signed a multilateral agreement with EU Organization for accreditation about recognition of accreditation. Organic production is regulated by the Law on Organic Production from 2010, which follows EU directive 834/2007. In July 2011 the rulebook of control and certification of organic production and methods of organic production was adopted. Seven certification companies control organic production in Serbia (Control Union Danube, Ecocert Balkan, Etko Panonia, Organic Control System, SGS-Beograd, Suolo e salute Balkan, TUV SUD Serbia). Since 1 June 2011 all food processors in Serbia have been obliged by the Law on Food Security to implement the standard for Hazard Analysis Critical Control Points (HACCP) and good manufacturing and hygienic practice. Now only small retailers are not fulfilling this regulation, as they are trying to avoid additional costs, while all bigger retail networks have implemented HACCP and accredited it. Larger food processing companies usually have accredited HACCP standard, while small enterprises only implement the HACCP standard.
4.4 MANAGEMENT, MARKETING AND PROMOTION Investment is a precondition for the development of new varieties food products. Following privatization, those food companies that had survived were challenged to invest in revitalisation and new technologies. New owners in successful food companies made investments, especially those in dairy, fruit and vegetable processing, and confectionary. As a result, a huge variety of new food products could be found on shop shelves, sometimes replacing previously imported products. Investments in the food sector have fallen sharply in recent years, which has checked the process of further revitalisation. SMEs are involved in making products that have fewer demands in terms of technology and in some cases are focused on traditional food products or niche markets. Actors in food supply chains use some risk management tools, although some other tools are still unavailable. Farmers are the most vulnerable actors in the supply chain and traditionally they use diversification of production to reduce risks. In the last decade the government has subsidized the insurance of crop and livestock production by 40 percent. Until now small farmers have not shown interest in insuring themselves and only larger farmers have purchased insurance policies. The reason for this is that larger farmers receive large discounts. Contracted sale is used for some crops including:

24
oilseeds, sugar beet and dairy. However, except for using finance and credit period for inputs, processors do not offer fixed prices in advance. Prices are usually set during or after the harvesting season by processors. This often causes farmers to protest. Serbia has a commodity exchange in Novi Sad, but there are still no options for hedging or price risk management. An indemnity fund was established at the end of 2009 and includes a system of public warehouses. Farmers can use warehouse receipts for stored agricultural commodities in public warehouses as collateral for bank loans. The Directorate for Commodity Reserves has acted several times to lower price variability. In harvest periods the Directorate buys agricultural products when market prices drop, and sells agricultural and food products when retail prices reach high levels. It has only a small or no result on the market since only small amounts are temporally removed from market. The Ministry of Agriculture actively organizes and supports the promotion of the agribusiness sector. Some activities are: publishing promotional material about Serbian agriculture in several foreign languages and participating in international fairs like Green Week in Berlin, International Fair of Food and Drinks in Moscow, and the International Agricultural Fair in Novi Sad. Food products are promoted on the domestic market, although this promotion is weak, and for now only large processors invest in such activities. Large retailers promote discounted food items on a weekly basis, which are almost always connected with additional discounts that the retailers receive from food processors. There is still no school milk scheme in place. In some cities local governments are promoting organic products and supporting organic lunch programmes in nurseries.
4.5 OVERALL ASSESSMENT OF VALUE CHAIN PERFORMANCE AND CONSTRAINTS FOR IMPROVED
PROCESSOR-FARMER LINKAGES The structure of the Serbian food market can be defined as a successive oligopsony. That is, there are many farms that produce small quantities of products and cooperatives are very rare. The downstream food supply chain means that usually only one or a small number of processing companies are interested in buying agricultural products in any specific region, which is followed by highly a concentrated retail sector. The extension service, which is in transition and has limited human resources and capital, cannot accelerate faster changes at farm level. A lack of vision, decisiveness and resources from policy makers in previous periods has caused additional constraints. The development of institutions that are necessary for an efficient food supply chain is still unfinished. The market power of retailers is probably the biggest problem for SMEs in the food processing sector. High pressure for rebates, and extremely long payment terms very often push SMEs into liquidity problems. Good examples of a new strategy for how SMEs should respond to the market power of retailers are two SMEs in the dairy processing sector; namely, Lazar and Sirela. These two dairies have each developed their own network of small dairy product shops to sell their products. Lazar has 35 shops in the region and it is developing. In the last two years they have entered upstream vertical integration, investing in a dairy farm with 500 cows.
25
5 APPROACHES TO DEVELOPMENT OF PROCESSOR-FARMER BUSINESS LINKAGES
Among numerous food companies contacted during the study, three SMEs were selected for in-depth case studies to gain additional ideas and understanding on how effective the linkages with local farmers are. The three companies selected were:
Vitamin, Horgoš: a vegetable processing company
Sirela, Bački Maglić: a dairy processor with 5.1 million litres of milk processed in 2012 and
Zdravo Organica, Selenča: a fruit and vegetable processor with increasing organic processing The main reason for choosing these companies for case studies was the fact that they cooperate with farmers. Moreover, Vitamin is a leading company in processing seasoning pepper, Sirela was the first SME to develop its own network of small shops for the distribution of dairy products on the Serbian market, and Zdravo Organica is a leading organic food processor.
5.1 “VITAMIN”, VEGETABLE PROCESSOR
Key facts in 2012:
Employees 117
Legal status Ltd.
Ownership Company for construction, engineering, and production Ferbild Ltd., Belgrade
Location municipality Kanjiža
Revenue RSD 442.5 million
Profit RSD 72.5 million
Market Domestic and international
Picture 1. Location of Vitamin
5.1.1 Background information The tradition of growing and milling seasoning pepper in the Horgoš region is over two centuries old. The name of this village became a synonym for the best quality seasoning pepper in Serbia. The food

26
processing company Vitamin from Horgoš was founded in 1947. During the process of privatization it was purchased by the current owner and since then development and expansion have taken place. In 2013, a large investment in new pepper mill was carried out, which doubled the capacity of company. Today, Vitamin is one of largest companies producing dried vegetables. Its capacity for processing fresh seasoning pepper is 6 000 tonnes. The company’s leading brand is seasoning pepper, which is offered to the market in several varieties: ground pepper, either red sweet and red hot, crushed hot pepper and oil extract of pepper – oleoresin. The company also dries and processes other kinds of vegetables (onions, parsley, carrot etc.), as well as medicinal herbs. Beside vegetables, Vitamin also produces tea bags, and a whole range of other spices and additives for use in the home and the meat processing industry. One of Vitamin’s unique points is that it is the sole producer of seasoning pepper seed in Serbia, with an annual capacity enough to plant 2 000 ha. As a leading domestic market company, in recent years it has focused more and more on export markets. In 2015 about 15 percent of revenue will come from foreign markets. The company’s main export markets are CEFTA countries, the EU and Russia. 5.1.2 Processor farmer relationship Cooperation with family farms has a long tradition. From its early years, Vitamin was a big processor of pepper, which was only produced on family farms and socially owned cooperatives. Today, seasoning pepper seed is produced on 20 family farms with which Vitamin has direct contract. Through contracts with 10 “cooperatives” and middlemen, Vitamin indirectly cooperates with an additional 1 000 family farms. The relationship is strictly formal through yearly contracts. All the rights and obligations of producers and farmers are defined. With farms that produce seed for seasoning pepper, Vitamin has direct contract. For those farms with which it has indirect cooperation, contracts are signed with “cooperatives” and middlemen. In both cases processors are responsible for:
Supplying seeds with parity 1 kg of seed = 100 kg of fresh pepper;
Supplying extension service to farmers throughout the season;
Regular control of production on farms;
Buying out all production from contracted acreage;
Transporting pepper from the farm to the processing facility;
Measuring quantity at facility scale;
Grading quality of delivered pepper in three levels, i, ii and iii grade;
Paying 50 percent of the contracted price after delivery and the remaining50 percent after 60 days.
From the other side farmers are responsible for:
Producing pepper on total contracted area;
Using only supplied seed;
Regularly informing Vitamin about the crop situation;
Keeping records of the agro-technical measures applied and allowed chemicals in a supplied record of production book;
Delivering all production to vitamin;
Taking care of the quality of harvested pepper.
Vitamin has a long tradition in cooperation with family farms. In the beginning, the initiative for cooperation came from the producer side, but for around ten years now it has not been unusual for farmers to contact processors and ask for cooperation. Farms that cooperate with Vitamin are not only from the Horgoš area, but from the broader region of Bačka. For processors it is more convenient to work directly with farms that are physically close and indirectly with farms that are 50-100 km away. Vitamin’s relationship with farmers is based on long term partnerships and producers are only rarely replaced.

27
5.1.3 Benefits for farmers and the processor For the majority of agricultural products in Serbia, prices usually become known in the harvesting period, or even later. For this reason, the two most important benefits for farmers that cooperate with Vitamin are that they have an assured market and that they know the price that they will receive for their products. The payment terms are an additional benefit since Vitamin Guarantees 50 percent at the time of delivery and the remaining 50 percent after 60 days. The processor provides all seed, and if farmers have problem with liquidity they are eligible to ask for advance payments throughout the production season. The production of seasoning pepper is labour intensive at all stages and employs a significant number of people in the local area. Vitamin benefits through cooperation by having a secured input market, as well as standardized high quality of inputs. Cooperation with farmers supports the development of the company. After privatization the new owners had a problem with old equipment. For example, the drying facility was in use for just two months a year, which caused low efficiency. The production bottleneck in the grinding facility was another problem. In this situation, where new investment was necessary, having a secured and stable input market was very valuable. 5.1.4 Issues and challenges According to a statement from the manager there are no significant issues with farmers. Some small challenges have appeared in recent years due to price increases of other field crops on the domestic and world markets. Farmers that have work force related problems, either because of lack of family or reliable paid labour, become motivated to replace vegetable production with some other less labour intensive production. 5.1.5 Future cooperation
Vitamin’s orientation on cooperation with local family farms in the future is not in doubt. Farms that contract production are mostly small with several or even less than 1 ha dedicated to vegetable production. For this reason, Vitamin prefers to maintain cooperation with farmers through middlemen.
5.2 SIRELA, DAIRY PROCESSOR Key facts in 2012:
Employees 109
Legal status Sole proprietorship
Ownership Family business
Location municipality Bački Petrovac
Revenue RSD 361 million
Profit RSD 0.13 million
Market Local

28
Picture 2. Location of Sirela dairy
5.2.1 Background information The company was founded by the present owner in 2001 as a sole proprietorship. In the beginning the capacity was about 500 litres per day, all of which came from one large local state owned farm. Since then the development of capacity has been constant and stable. In 2003, the focus moved to family dairy farms as suppliers. Several years later, the company made a significant investment in its own dairy farm with 100 cows. Lack of experience and good farm management made the investment unprofitable and the farm was sold soon. The second serious impediment that the company faced was a problem with retailers who asked for longer payment terms and bigger rebates. Sirela made the strategic decision to create its own network of 40 small dairy shops. In 2007 it began the process of introducing HACCP and ISO 9001 standards and the first standard certificates were awarded in 2010, which continues today. Today, Sirela is a family run business, which has a capacity of 20 000 litres milk per day. In 2012, its total milk intake was 5.1 million litres. As of 2013 Sirela had 124 employees in total, most of whom are engaged in the retail network (75). The processing plant has 18 employees and there are 18 in transport, 11 in management and two in security. Picture 3. Product range of Sirela

29
All production is marketed on the national market. The structure of revenues from Sirela’s own retail network shows that the nearby southern Bačka region is most important with a 70 percent share, followed by western Bačka with 20 percent and then Srem with 10 percent. Besides its own network, the idea for which was copied by some other SME dairies in Serbia, management stressed that the relation between quality and price is another unique feature of the Sirela dairy. It is well recognised by consumers and provides stable demand. 5.2.2 Processor farmer relationship Sirela has organized cooperation with 265 family dairy farms from southern and western Bačka regions. Among them are 10 large family farms that Sirela has equipped with milk coolers at its own cost, as well as 14 collecting stations also equipped with milk coolers, but with a bigger capacity. The turnover of dairy farms in this system of cooperation is very low. Average daily milk intake per farm is 53 litres. In the first years Sirela initiated cooperation with farmers. Recently, since larger dairies have stopped buying milk from small farms with 1 to 5 cows, those farmers have tried to initiate cooperation. Farmers’ motivation for cooperation can be summarized as: safe market channel, stability in payment, possibility to use subsidies (only with three or more cows), help from extension service provided from processor, free use of milk coolers, help in critical moments (lack of feed, fire damage etc.). Sirela makes contract with each farmer that supplies milk and it is also responsible for: buying all delivered milk, transporting milk from cooler to facility and checking quality of milk at least once a month at its own cost, applying for government subsidies (milk premiums) in the name of the farmer, paying for milk twice a month, and paying premiums as soon as the government pays them. According to the contracts, the farmers are responsible for: delivering milk of a certain quality as defined by the Rulebook on Milk Quality, transporting milk to collecting stations, taking care of milk hygiene and if any prohibited elements are discovered in the sample that can cause pollution of other milk in cooler or truck tank it has to pay for the contaminated product. 5.2.3 Benefits for farmers and the processor In a period when the largest dairy processors are abandoning the system of collecting stations and cooperation with small farmers, one of strongest benefits for those farmers is the secure market that SME dairies can offer. Other alternatives for small farmers are to process milk into cheese and sell it on green markets or at the farm gate. According to evidence from 2013, Sirela pays slightly higher prices for raw milk then most other SME dairies. Stability and prompt payment every 15 days is a second benefit for farmers. Farms with 10 or more cows can use quantity stimulation on regular prices. The benefits for the processor are a secured input supply market and the possibility for long term planning and development. Regular quality control and contracts mean that milk always meets quality standards. Stability in milk quality makes processing dairy products easier and brings consumers respect and trust. 5.2.4 Issues and challenges Milk is the most perishable agricultural product and the question of quality is very important. Educating farmers and investing in milking and cooling equipment is crucial for producing high quality milk. This process is already done by big dairy companies, while SME dairies are in the process of achieving this. As the manager of Sirela stressed, during the afla-toxin crisis, which is still ongoing, farmers have been educated, the first amounts of zeolit (toxin absorber) were supplied by Sirela and new equipment for detecting afla-toxin in milk was bought, but milk quality decreased as soon as controls were loosened. The situation is similar regarding water added to milk, and there need to be ways to control this and improve trust between farmers and the processor. Seasonality in milk production in Serbia is low but in some months farmers supply excessive amounts of milk, which consumers have no demand for. In such periods Sirela accepts extra milk and uses it to balance periods of lower supply.

30
5.2.5 Future cooperation Although some other SME milk processors have succeeded in building their own dairy farms, Sirela will stay focused on cooperating with family farms. After years in the dairy business, the managers pointed out that an entrepreneurial approach is more flexible and focused more on long term profit. Also, milk quality is hard to keep constant and it is not possible without strong control, further investments and well equipped laboratories.
5.3 ZDRAVO ORGANIC, ORGANIC FRUIT AND VEGETABLE PROCESSOR
Key facts in 2012:
Employees 32
Legal status Ltd.
Ownership Slovan progres 50 percent and Poslovni sistem Global seed 50 percent
Location municipality Bač
Revenue RSD 217 million
Profit RSD -51 million
Market Domestic and international
Picture 3. Location of Zdravo Organic
5.3.1 Background information Zdravo Organic was founded in 2002 for processing fruit and vegetables, as a subsidiary of two big companies; namely, Slovan progres, which is engaged in civil construction and Poslovni sistem Global seed, which operates in the agribusiness sector, with significant investments in organic milk and plant production. Since 2008 Zdravo Organic has been an autonomous business. The company employs 32 people and an additional 100 seasonal workers between 1 July and 31 January. The company owns 50 ha of fruit plantation (38 ha of apples and 12 ha of cherries). First standard that the company was accredited was Global Gaap in 2007. After that, it applied three more standards; namely, Quality Management

31
System ISO 9000, Environmental Management System ISO 14000, Food Safety Management System 22000, and Occupational Health and Safety Management System OHSAS 18000. Zdravo Organic’s range of products includes five groups: natural juices, compot program, vegetable salads, organic products (mainly juices) and brandies. The natural juices are produced from 100 percent fruit and some vegetables without adder water or sugar. The compot program includes: compotes, jams and marmalades from locally grown fruits. The vegetable salads are made from one or mixed vegetables. The organic program now produces juices from: tomato, beetroot, carrot, and apple and salad from beetroot. The exclusive brandy program encompasses five traditional kinds of brandies from local fruits.
Picture 3. Some products of Zdravo Organic
Market orientation is balanced between domestic and export markets. Natural juices are the main product on the export market through which the company earned 30 percent of its revenue in 2012. The achieved goal for 2013 was to increase the share of revenue from export to 50 percent. Another main portion of revenue comes from the domestic market, where the leading products are vegetable salads and sweet program products. Production of natural juices from locally grown fruit and vegetables, and organic juices and salad are the main products that differentiate this company from its competitors on the national market. 5.3.2 Processor farmer relationship The initiative for cooperation with family farms originates from Zdravo Organic, as an approach to secure the input market. Currently, about 50 percent of all inputs – mainly vegetables – come from family farms. The relationships between the company and farmers are defined by contracts. Due to the reluctance of management to provide an example of such a contract, the only available information was that the company has contracts with 24 farms. The company is in direct cooperation with these farms, although some of them subcontract production, so the total number of indirect cooperation is higher. For example, one farm in northern Bačka has a direct contract for cucumber production, while at the same time that farmer subcontracts production to 12 neighbouring farmers. Zdravo Organic cooperates with a total of 50 farms directly and indirectly. The rate of turnover of cooperating farms is marginal and the main group of farms that cooperate with the company was selected in the first year and has stayed the same. The manger pointed out that throughout cooperation both sides benefit from learning and can develop, and moreover, mutual trust is generated. 5.3.3 Benefits for farmers and the processor As in previous cases, farmers have benefited from contracted production. The most important benefits are the reliability of the market channel, contracted prices, and the fixed payment terms of 30 or 60 days. For vegetable producers there is another benefit; namely, they can use specialization and economies of scale as a way to lowering costs. Producers offer several ways to participate in the costs of production. At the beginning of the season, the company presents a list of inputs payable in parity once production is completed. This includes: seeds, fertilizers, allowed preparations for plant protection, and irrigation

32
systems. Since the farmers are widely spread from northern to southern Vojvodina, this means they are not obliged to pay transportation costs. The processor checks production on farms during announced and unannounced visits. Farmers have to use the same kind of seed and production practices to produce vegetables with a unified quality and shape. This makes processing easier and helps the processor maintain the quality of products. The quantity of production is never easy to forecast in agriculture, but processors with contracted production can somewhat balance good and bad production years, and assure the use of the processing plant at certain levels. 5.3.4 Issues and challenges The processor’s initiative helps to successfully connect links in the food value chain. In some cases cooperation starts with farmers that are new to vegetable production and in some cases with farmers that have been abandoned by bigger processors that went bankrupt during privatization. The quality of inputs is the biggest challenge for the processor and in order to ensure this, staff frequently visit farmers to supervise production practices. The processor collaborates with experts from the University of Novi Sad and the extension service to help the farmers with some specific issues. The 2012 drought motivated the processor to offer help to farmers with irrigation equipment, as a way to better control production risks. Another challenge was price settlement in contracts. The processor decided to use prices from the previous year and to take in account any significant market price deviation during the harvesting period. 5.3.5 Future cooperation Over the years, the farmers’ approach to doing business has become more flexible. A good example of this is 2012, which was extremely difficult for farmers due to the long drought. The company decided to share its losses with farmers and help them to maintain confidence in cooperation and maintain production in the next year. Until now Zdravo Organic has been satisfied with cooperation and the farms with which it has contracted production. In future, the management will put more emphasis on extension and regulating farms.

33
6 CONCLUSIONS AND RECOMMENDATIONS Concentration in the food processing and retailing sector and its acquisition from multinational companies has left small family farms on side road. Large processors and retailers are interested in business only with bigger farms that can provide the required amounts of agricultural products of a guaranteed quality. In such an environment, SMEs practice two strategic approaches. One is to be fully oriented to small and medium sized family farms, either directly or indirectly, and invest time and money in developing cooperation. The second approach is to go partially towards vertical integration, buying or building new farms and cooperating with small farms at the same time. Both approaches have their pros and cons. Those SMEs that invest in cooperation with farmers have more resources (human and capital) to specialize in their business, but need more time to actively work with farmers to improve the quality of inputs. SMEs that combine their own farm production and cooperation with farmers tend to increase input quality in the short term, although this is more costly and slows down specialization. Until now good examples of well established relationships between SMEs and small family farms in Serbia could be found in dairy, meat, fruit, vegetable and grain supply chains. On other side, such relationships do not exist in the sugar and vegetable oil supply chains. The main benefit for SME food processors of cooperating with small farmers is in secured input market. Without cooperation with farmers SMEs would suffer from vastly unstable amounts and quality of inputs. In the longer term, successful cooperation can become a source of development for all stakeholders in the value chain. Sourcing from small farmers instead of SME investment in farm production, decreases risk for processors and causes fewer liquidity related problems. Use of resources for specialisation lowers the cost of production. Generally, cooperation has a positive impact on income for both farmers and processors and improves the competitiveness of value chain. SMEs that cooperate with farmers are oriented mostly towards the domestic market, but some are strongly involved in exports, as it is case with Zdravo Organic and Vitamin. The majority of SMEs find it hard to receive prompt payments from Serbian retailers due to the market power of retailers. Cooperation is a learning process. Both sides have to be flexible, open to learning and often looking more for long term profit rather than short term benefits. All responsibilities of actors in cooperation have to be given in written contracts with effective consequences for those who derogate from the contract. Control of the production process, quality and quantity of agricultural products is a precondition for developing trust between processors and farmers. From the case studies it can be inferred that a few years is enough to build cooperation relationships and select farms. Significant involvement of extension work is necessary as well as some amount of capital. In the dairy chain, SMEs supply farmers with cooling tanks and in extreme situations feed and some other inputs. In the case of vegetable farms, processors supply farms with inputs like seeds, fertilizer, chemicals, irrigation equipment, and in some cases advance payments. The institutional environment influenced and stimulated cooperation between SMEs and farmers. Harmonization of regulation between the EU and Serbia has increased standards in food quality. New laws, especially the Law of Food Safety and set of rulebooks bring new definitions of food quality and narrow range of inputs quality, and food products. In light of this, SMEs had to react and invest in the input market to secure the quality of inputs according new regulations, to be able to produce quality food products. Expecting further improvement of quality standards will put more pressure on SMEs to increase vertical cooperation with farmers or alternatively to go towards vertical integration. From 2004 onward, several sets of government policies with varying degrees of success were aimed at supporting farms and SMEs.

34
Some processors look forward to cooperating through middleman, although in the future this could be replaced with farmers’ cooperatives. Serbia still does not have a good and flexible Cooperative Law. One set of policy measures could be, after enacting the Cooperative Law, to educate and motivate farmers in addition to financial or tax incentives to organize cooperatives. Transparency and better understanding of economics of all participants is necessary for improving cooperation. Implementation of the Farm Data Accountancy Network will help to increase the transparency of farm economics. Further steps could be taken by governmental support (Ministry of agriculture, Ministry of science) of applied research projects in food value chain. With new legislation additional investments from SMEs will be necessary to satisfy additional or higher standards. For example effluent treatment for almost all SME dairies in Serbia is a question that should be solved in the near future. Since IPARD measures will not be available for Serbia in the next few years it is the responsibility of the Ministry of agriculture to continue measures relating to investment in the processing and marketing of agricultural and fishery products, as was the case in 2010 and 2011. Completing the development of the National Reference Laboratories will increase trust not only between SMEs and farmers, but all value chain actors. SME processors are more flexible in vertical cooperation than exporters. An example of this is the situation with the most significant export fruit; namely, raspberries. Every year during harvesting season the same disagreement about price occurs between small farmers and cold storage companies which export raspberries. A set of measures should be aimed at increasing competition of food chains. The Ministry of Agriculture should continue support food processors to present their products on international fairs, and put more in focus on SMEs. The development of the extension service and its connection with universities could foster vertical coordination in food value chains.