procurem & finance day henning mohn 20mar14 - · pdf file... dnv r&d 2013/ chryssakis...
TRANSCRIPT

21/03/2014
1
DNV GL © 2013 JANUARY 2014 SAFER, SMARTER, GREENERDNV GL © 2013
JANUARY 2014
MARITIME
Energy Efficient and Green Solutions
1
Procurement and
Finance Day
20 March 2014
By Henning Mohn, Head of Section
Shipping Advisory, DNV GL Singapore
DNV GL © 2013 JANUARY 2014
Managing your risks is essential and also has several key benefits
2
� Eliminating unplanned expenses due to preventable accidents
� Safeguarding reputation through awareness and prevention
Prevention
� Reduced CAPEX costs by prioritizing spending on areas with high risks
� Reduced OPEX by appropriately dedicating resources to high risks
Costs
� Effective decision making based on clear understanding of risks
� Effective and streamlined auditing by focusing on risk exposure
Transparency
� Improved efficiency of resource by prioritizing high impact efforts
� Focusing on the areas of the organization that really matter
Prioritization

21/03/2014
2
DNV GL © 2013 JANUARY 2014
Quiz: Years to remember
� 2008
� 2015
� 2015+
� 2020-2025
� 2030
3
DNV GL © 2013 JANUARY 2014
Future Greenhouse Gas Emissions from Shipping
4
Source: DNV R&D 2013/ Chryssakis & Stahl
Status Quo
Realistic uptake of new fuels ex nuclear
Realistic uptake of new fuels incl nuclear

21/03/2014
3
DNV GL © 2013 JANUARY 2014
ECA: The largest challenge yet; but good for the local air quality
5
DNV GL © 2013 JANUARY 2014
6
2015 2020 20252016
Max 0.10%Sulphur in fuel for ECAoperations
Tier-3 NOxstandard for newbuildsin ECA operations(- 70%)
Max 0.50%Sulphur in fuel for worldwideoperations
2021?

21/03/2014
4
DNV GL © 2013 JANUARY 2014
7
RISKS:• Market &
Finance• Operational• Technology• Suppliers• Insurers• Yards• Class
2015 2020 20252016
Max 0.10%Sulphur in fuel for ECAoperations
Tier-3 NOxstandard for newbuildsin ECA operations(- 70%)
Max 0.50%Sulphur in fuel for worldwideoperations
2021?
DNV GL © 2013 JANUARY 2014
8
• LNG fuel
• HFO+ Scrubber
• Low-sulphur distillate
• LNG fuel
• Exhaust Gas Recirculation, EGR
• Selective Catalytic Reduction, SCR
• LNG fuel
• HFO+ Scrubber
• Low-sulphur distillate
• New solutions?
2015 2020 20252016
Max 0.10%Sulphur in fuel for ECAoperations
Tier-3 NOxstandard for newbuildsin ECA operations(- 70%)
Max 0.50%Sulphur in fuel for worldwideoperations
2021?

21/03/2014
5
DNV GL © 2013 JANUARY 2014
9
Share of LNG fuelled newbuildings:
Now: 48 LNG fuelled ships
2020-2022:1000 new LNG fuelled ships5-7 M tonsLNG/year*
*: DNV 2012
2015 2020 20252016
Max 0.10%Sulphur in fuel for ECAoperations
Tier-3 NOxstandard for newbuildsin ECA operations(- 70%)
Max 0.50%Sulphur in fuel for worldwideoperations
2021?
DNV GL © 2013 JANUARY 2014
30.38
38
35
30
0 10 20 30 40
% of worldgross tonnage
Number ofstates
Required for ratification
Required for ratification
Current status
Current status
The ballast water regulation are on the verge of realization. If an additional 6 % of world GT ratify, BW regulations will apply
10
4.6%
If additional 4.6 % of world gross tonnage accept regulations, regulations will apply
Ballast Water regulations accepted by 36 states, sufficient for regulation ratification
Current status on ratification of Ballast Water Regulations Comment
%
%

21/03/2014
6
DNV GL © 2013 JANUARY 2014
Years to remember
� 2008
� 2015: ECA
� 2015+: BWT
� 2020-2025: Global Sulphur cap
� 2030: 2x current need for maritime fuels
11
DNV GL © 2013 JANUARY 2014
ECA compliance options
12

21/03/2014
7
DNV GL © 2013 JANUARY 2014
Basically 3 options available:
LNG as fuel
13
…or fleet redeployment,i.e. give up trading in ECAs…
1
2
3
Scrubbers + HFO
Low sulphur fuel
DNV GL © 2013 JANUARY 2014
There are different options for dealing with ECAs, each with unique risk aspects making investment decisions difficult
14
The cheapest investment may be the most expensive option in the long-run
LNG Scrubber Fuel switch
Alternative options:
CAPEX,LNG availability,
tank size
CAPEX,corrosion (?)
Unit sizeHigh OPEXover time
Biofuels
Op
tio
nR
isk
Main options for most ships:
Methanol
Battery
Hydrogen
Other fuels?

21/03/2014
8
DNV GL © 2013 JANUARY 2014
0
2
4
6
8
10
12
2016 2017 2018 2019 2020 2021 2022 2023 2024 2025 2026 2027 2028 2029 2030 2031
[M
US
D]
Year
Cumulative discounted cost difference compared to baseline [MUSD]
LNG = MGO - 25% LNG = MGO - 40% LNG = MGO - 50%Scrubber + HFO MGO HFO
The business case for the LNG fuelled bulk vessel
15
FINANCIAL ANALYSIS
Indicates payback time of LNG investment compared to MGO and HFO + Scrubber
Explanation
Each line represents the additional cumulative costs of the respective configuration compared to baseline (HFO).
LNG has a high investment cost, but depending on the fuel price the operational savings can be significant.
An LNG price of 600 USD/tonne (LNG = MGO – 50%) ensures a payback time of 3.7 years compared to MGO and 4.5 years compared to Scrubber + HFO.
DNV GL © 2013 JANUARY 2014
Summary of possible LNG tank locations
16
TECHNICAL FEASIBILITY
Option 1 Option 2 Option 3 Option 4 Option 5 Option 6Location Front of
superstructureFront of
superstructureFront of
superstructureFront of
superstructureInside
superstructureAft of
superstructureDirection of the tanks
Vertical Vertical VerticalHorizontal
(transverse)Horizontal
(longitudinal)Vertical
# of tanks 1 2 3 3 1 2
Risk and impact on design
Tank entering the cargo area.Superstructure will need to be rearranged.
Tanks entering the engine room area.Engine room and superstructure will need to be rearranged.
Tanks entering the engine room area.Engine room and superstructure will need to be rearranged.
The engine room and superstructure will need to be rearranged.
Will occupy too much of the superstructure.
Not sufficient space for the required tank sizes(maximum 122 m3).
Feasibleoption?

21/03/2014
9
DNV GL © 2013 JANUARY 2014
53 confirmed LNG fuelled newbuilds
17
Year Type of vessel Owner Class
2014 Ro-Ro Norlines DNV
2014 Ro-Ro Norlines DNV2014 Patrol vessel Finish Border Guard GL2014 Car/passenger ferry Society of Quebec LR2014 Car/passenger ferry Society of Quebec LR2014 Car/passenger ferry Society of Quebec LR2014 Tug Buksér & Berging DNV
2014 PSV Harvey Gulf Int. ABS2014 PSV Harvey Gulf Int. ABS2014 PSV Harvey Gulf Int. ABS2014 PSV Harvey Gulf Int. ABS2014 Gas carrier SABIC BV2014 Gas carrier SABIC BV2014* Product tanker Bergen Tankers LR2014 General Cargo Egil Ulvan Rederi DNV
2014 General Cargo Egil Ulvan Rederi DNV2014 PSV Remøy Shipping DNV2014 Car/passenger ferry AG Ems GL2014* Car/passenger ferry AG Ems GL2014 Car/passenger ferry Samsoe Municipality DNV2014 Ro-Ro Sea-Cargo DNV2014 Ro-Ro Sea-Cargo DNV2015 PSV Siem Offshore DNV
2015 PSV Siem Offshore DNV2015 PSV Simon Møkster DNV2015 PSV Harvey Gulf Int. ABS2015 PSV Harvey Gulf Int. ABS
Year Type of vessel Owner Class
2015 LEG carrier Evergas BV
2015 LEG carrier Evergas BV2015 LEG carrier Evergas BV2015 Bulk ship Erik Thun LR2015 Container Ship Brodosplit DNV GL2015 Container Ship Brodosplit DNV GL2015 PSV Siem Offshore2015 PSV Siem Offshore2015 Container Ship TOTE Shipholdings ABS
2016 Container Ship TOTE Shipholdings ABS2016 Icebreaker Finnish Transport A. LR2016 PSV Siem Offshore2016 PSV Siem Offshore2016 Chemical tanker Terntank2016 Chemical tanker Terntank2016* Ro-Ro TOTE Shipholdings ABS2016* Ro-Ro TOTE Shipholdings ABS
2016 Car carrier UECC LR2016 Car carrier UECC LR2016 Car/passenger ferry Boreal Transport2016 Car/passenger ferry Boreal Transport2017 RoPax Brittany Ferries BV2017 Container Ship Crowley Maritime DNV GL2017 Container Ship Crowley Maritime DNV GL2018 Container Ship Matson Navigation DNV GL
2018 Container Ship Matson Navigation DNV GL
* Conversion project
Confirmed orderbook
Updated 07.03.2014Excluding LNG carriers and inland waterway vessels
DNV GL © 2013 JANUARY 2014
Existing and forecast of global LNG bunkering infrastructure
18
Existing Planned (Feasibility study, risk study, proposed locations, pending approval)
Proposed (currently being discussed)
* See detailed map
Europe*
BusanDubai
Singapore
Incheon
Nanjing
Wuhan
Buenos Aires
New York
Fourchon
Tadoussac
Tacoma
Duluth
GaolanHambantota
Turkish strait & Marmara Sea
JacksonvilleShanghai
Zhoushan
Santander
AlgecirasCartagena
ValenciaBarcelonaFerrol
SeattleVancouver
Sarnia
Mississippi river
Australia: Discussions
21/03/2014
10
DNV GL © 2013 JANUARY 2014
ECA compliance options, little more futuristic
19
DNV GL © 2013 JANUARY 2014
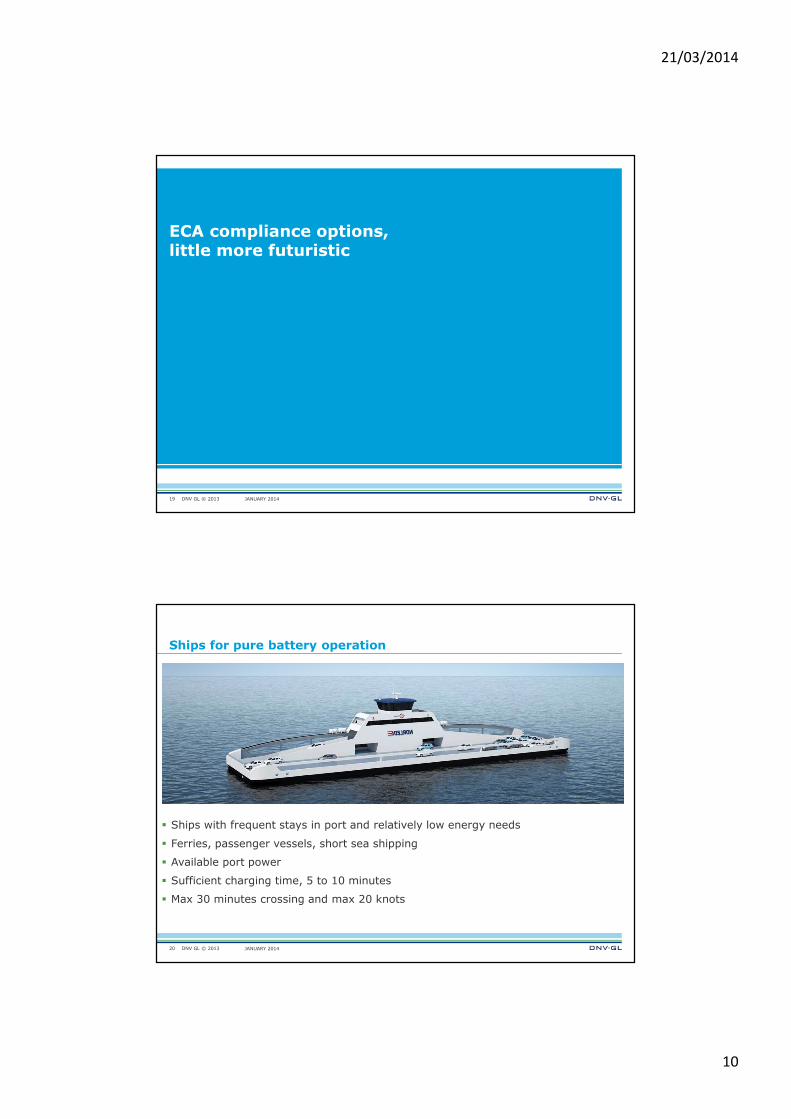
Ships for pure battery operation
� Ships with frequent stays in port and relatively low energy needs
� Ferries, passenger vessels, short sea shipping
� Available port power
� Sufficient charging time, 5 to 10 minutes
� Max 30 minutes crossing and max 20 knots
20

21/03/2014
11
DNV GL © 2013 JANUARY 2014
The battery in a hybrid ship will assist in powering the electric motors
AUXILIARIES
BATTERY
ENGINES
Photo: Thomas Førde, Stavanger Aftenblad
DNV GL © 2013 JANUARY 2014
Battery hybridization – low utilization
Typical Load Profile Diesel Engine - No battery
22
Optimal Load Factor
100%
50%
Tid
Optimal Load Factor
100%
50%
Tid
Optimized Load Profile Diesel Engine - Battery
Battery only
Battery only
� Batteries can reduce fuel
consumption, maintenance,
emissions of CO2, NOx, SOx and
particles
� Diesel engines run at optimal
load, when they first run
Battery-only mode
� In waiting situations
� In environmental sensitive areas
� In port

21/03/2014
12
DNV GL © 2013 JANUARY 2014
Alternative fuels - parameters
23
Fuel Consumption
(MTOE* in 2010)
Price
($/MTOE)
Flashpoint
(°C)
Heating value
(MJ/kg)
Density
(kg/m3)
Oil-based 4,028
7-8% for shipping
$600 (HFO)
$900 (MGO)
~60° 41.2 (HFO)
42.7 (MGO)
830-985
Natural Gas 2,858
(LNG: 250-300)
$250-$650 -188° 47.1
(LNG: 48.6)
0.763
LPG 275 $700-$750 -104° 46.5 505.4
Methanol 23 $970 11° 19.5 790
Ethanol 58 $950 16.6° 28.4 790
DME 3-5 $990-$1140 -41° 28.4 668
Synthetic fuels 15 N/A >101° 43.2 760-790
Biodiesel 18-20 $1000-$1200 >130° ~37.5 880
Biogas Very low N/A -188° ~48 ~0.76
Hydrogen Very low $1800-$2800 -253° 120.2 0.084
Nuclear 627 ~$450 - - -
Source: DNV R&I*) MTOE – million tonnes oil equivalents
DNV GL © 2013 JANUARY 2014
Engine technology and infrastructure
24
Source: DNV R&I

21/03/2014
13
DNV GL © 2013 JANUARY 2014
And of course,the good old Energy efficiency focus must still be in place!
25
DNV GL © 2013 JANUARY 2014
Throughout the project vessel visits, interviews & workshops reveal the performance in 6 areas
26
� Fuel quality and quantity� Bunkering procedures� Fuel sampling
� Fuel quality and quantity� Bunkering procedures� Fuel sampling
� Cargo operations� Thruster operations� Ventilation, HVAC, cooling/
freezing, lights, frequency drives� Insulation and heat losses � Misc. consumers
� Cargo operations� Thruster operations� Ventilation, HVAC, cooling/
freezing, lights, frequency drives� Insulation and heat losses � Misc. consumers
� Organizational setup, roles, responsibilities
� Policy, processes and procedures� Communication and training� Reporting, review and follow-up
� Organizational setup, roles, responsibilities
� Policy, processes and procedures� Communication and training� Reporting, review and follow-up
� Hull condition� Propeller condition� Autopilot & rudder� Trim and draft
� Hull condition� Propeller condition� Autopilot & rudder� Trim and draft
� Fleet planning and schedule assessment� Chartering/booking� Voyage execution� Speed management� Port efficiency� Cargo optimization
� Fleet planning and schedule assessment� Chartering/booking� Voyage execution� Speed management� Port efficiency� Cargo optimization
� Main Engine efficiency� Aux Engines efficiency
& utilization� Generator efficiency
� Main Engine efficiency� Aux Engines efficiency
& utilization� Generator efficiency
Management & OrganisationManagement & OrganisationFuel managementFuel management
ConsumersConsumersShip performanceShip performance
Voyage performanceVoyage performance Main and AUX enginesMain and AUX engines
21 March, 2014
Energy Management Advisory

21/03/2014
14
DNV GL © 2013 JANUARY 2014JANUARY 2014
27
� Prepare for the unexpected, rank risk and consequences also in your daily operations.
� The environmental scrutiny is increasing, andabatement solutions maturing
� Cost-issues are prudent
� Work systematically on energy efficiency initiatives, savings of 2-8% can mean ‘make it or break it’
� Proper purchasing routines is an important part of your cost-control initiatives
Conclusions
INCAT 2013