procurement & distribution interest group autumn symposium 2007
TRANSCRIPT

PROCUREMENT & DISTRIBUTION INTEREST
GROUP
Autumn Symposium 2007
http://www.pdig.org.uk/

Performance Management of Branded Medicines
PDIG Award
Kirsteen Docherty,
Procurement Services Manager,
UCLH Trust

Medicines Procurement
Free market Oligopoly Monopoly
Potential for Purchase/Contracting
Supplier Strategy
Generic Branded Branded
NationalSCEP
Trust or regional consortia• Therapeutic• P.I. tendering• Economies in
physical practice
Trust or regionalconsortia• P.I. tenders• Economies in
physical practice
Research Questionnaire Content (24 forms returned)
1. Consortia purchasing2. Multiple consortia purchasing3. Parallel Imports4. Volume discounts5. Benchmarking6. Tender paperwork7. Performance monitoring (inc savings and cost
pressures) and barriers to this8. Therapeutic switching9. Horizon scanning10. The future for branded medicines procurement

Consortia purchasing
% of Trusts who are part of a purchasing consortium
88%
8%4%
YesNo (Trust not located in a consortia area)No (No perceived benefit)
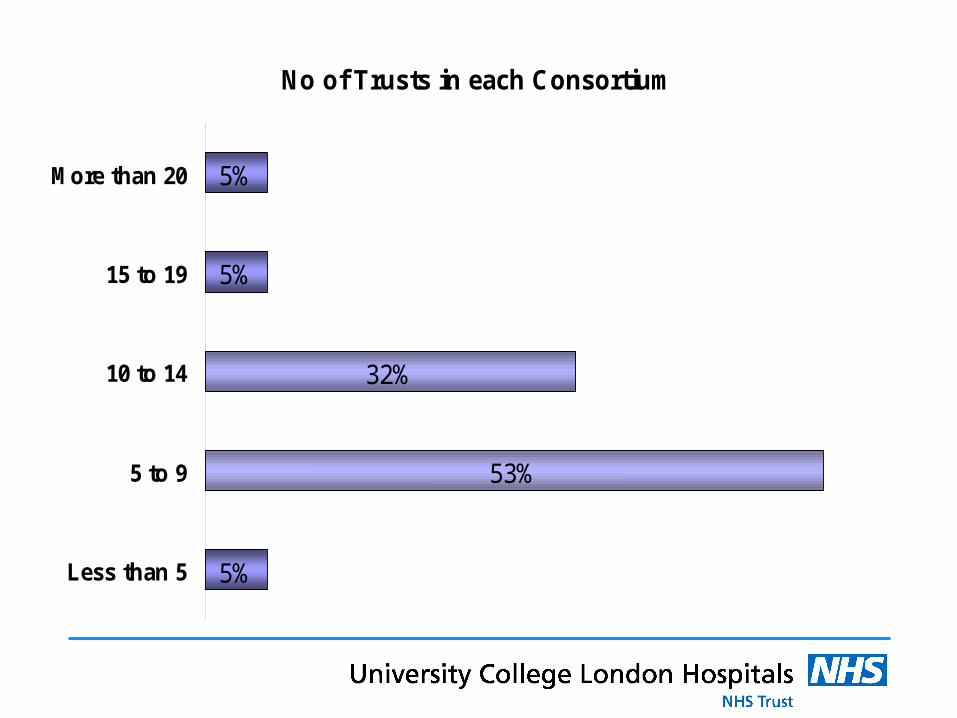
No of Trusts in each Consortium
5%
53%
32%
5%
5%
Less than 5
5 to 9
10 to 14
15 to 19
More than 20

Impact of size of purchasing organisation
SingleHospital Trust
Consortium Regional/ Division
National/Division
Purchasing Power
Size of Organisation
Ease of Co-ordination

22%
11%
17% 17%
33%
0-10% 10-25% 25-50% 50-75% 75%+
% of contracts tendered by consortium rather than individual trust

Reasons for not tendering all contracts as consortia?
0% 10% 20% 30% 40% 50% 60% 70%
Contract start and end dates do not coincide
Other
Award decisions more complex with more Trusts
Difficult to co-ordinate the different Trust
No perceived benefit for certain products
Different products used within the Trusts

Multiple consortium purchasing together
% of Trusts interested in becoming involved in multiple consortium purchasing.
Yes – 86% No – 14%

Respondents perceptions on effectiveness of multiple consortia purchasing
Price transparency
2, marginally effective
9%
3, fairly effective
23%
4, mostly effective
49%
5, highly effective
14%
1, not effective
5%
Achieve same price regardless of Trust size
1, not effective
0%
4, mostly effective
45%
5, highly effective
32%
2, marginally effective
9%
3, fairly effective
14%
Higher savings
1, not effective
5%
2, marginally effective
14%
3, fairly effective
23%4, mostly effective
44%
5, highly effective
14%
Reducing tender work load within Trusts
3, fairly effective
32%4, mostly effective
27%
5, highly effective
27%
1, not effective
5%
2, marginally effective
9%

Potential problems with multiple consortia purchasing?
54%
54%
29%
8%
17%
17%
0% 10% 20% 30% 40% 50% 60%
Other
Monitoring uptake of contract
Reluctance of Trusts to take part
Agreement on contract award
Adherence to contract award by individual trusts
Reluctance of companies to take part

Parallel Importing
% of Trusts who tender for parallel imports?
Yes – 83% No – 17%

Factors that may prevent the purchase of PI’s?
• Continuity of supply 54%
• Labelling/packaging 54%
• Counterfeiting 42%
• Reputation of supplier 8%
• Sourcing 4%
• Limited discounts available 4%

Volume Discounts
• Ability to take advantage of large volume discounts?Yes – 79% No – 21%
• Approx 50% of those who can take advantage stated this was because of access to a regional store

Benchmarking pricesFrequency of price benchmarking
Never37%
Quarterly21%
6 monthly4%
Yearly21%
Other17%

Reporting on procurement performance?
62% of respondents compile a yearly report on procurement performance.
Information included in the report;• Savings achieved 100%• Tendering work undertaken 80%• Further savings opportunities 80%• Work plan for next year 53%• Other 13%

Reporting on procurement performance?
Who is interested in seeing the report?
• Senior pharmacy managers 93%
• Finance director 87%
• CEO 33%
• Trust procurement mgr 27%
• Procurement hub 20%
• Other 13%

Savings
• 83% of respondents measured contract savings
• 34% were given a savings target per annum from the medicines budget
• 31% had medicines savings removed from the medicines budget

Price increases
1. 71% of respondents measured price increases
2. How often price increases are measured?
18%
18%
0%
12%
53%
2 monthly
Quarterly
6 monthly
Yearly
Other

Cost pressure analysis
Definition: Monitoring the medicines budget using price changes and volume changes.
43% of respondents use cost pressure analysis (30% of these use this for all branded medicines)

Who is cost pressure analysis work shared with?
• Finance director 80%
• Senior pharmacy mgr 70%
• Trust procurement mgr 20%
• Other 20%
• CEO 10%

Other performance monitoring tools
• Compilation and review of high expenditure 96% branded products e.g. Top 100.
• Value, number or % of high expenditure branded 71%products without a contract
• The number/ % of branded lines tendered per annum 25%
• The average % discount for branded lines as a whole 13%
• The average % discount for branded lines per company 4%
• The average % discount per therapeutic group 0%

Suggested other performance measurements
• Supplier performance monitoring
• Price tracking in relation to patent expiry
• Impact of entry of competitor products
• Opportunities for therapeutic switching

Barriers to measuring branded medicines contracting performance
0%
0%
25%
38%
46%
88%
0% 10% 20% 30% 40% 50% 60% 70% 80% 90% 100%
Other
Concerns about poorperformance
Data management skill
Inflexible IT systems
Low priority
Insufficient staffresources

Therapeutic Switching
• 83% of Trusts are currently involved in therapeutic switching
• For 73% of those Trusts the pharmacy procurement team are involved

Therapeutic switching, easy or difficult?
2, fairly easy24%
3, neither easy or hard
47%
4, fairly hard19%
5, very hard10%

Key problems with implementation of therapeutic switching
• Reluctance to change 50%• Clinical concerns 42%• Insufficient resources 42%• Industry funding (linked to product) 13%• Other 13%• Lack of clinical data 8%• Other priorities 4%• Insufficient savings 4%

Respondents views on future structures for branded medicines procurement
• Involvement of NPSG & PMSG 88%• Collaboration between Trust procurement, 83%
consortium and PaSA• Collaboration between Trusts in form of 67%
consortium• Multiple consortia purchasing 67%• CPH involvement 21%• NHS Supply Chain involvement 17%• Trusts supply dept involvement 17%

What are the current trends in branded pharmaceuticals management?
• More collaboration between Trusts and Consortium e.g. LPP. Trust contracting likely to decrease further.
• Increased use of branded medicine tendering
• Companies increasingly offer volume based frameworks

What are the current trends in branded pharmaceuticals management?
• Introduction of payback schemes e.g. Velcade.
• Increase in treatment of patients within their home environment
• Increase in development of biotech drugs – decreased competition, limited tender/negotiation opps.
• Encouragement of therapeutic switching across multi-consortia e.g. LPP.

Why are we contracting for branded medicines?
• Current PPRS profit cap model is not effective at controlling prices?
• OFT proposal for value/ evidence based pricing by NICE. Takes
branded medicine management work load from local and multi-consortia to national level.
• Reference pricing in New Zealand & Australia and cross product strategic agreements in New Zealand.
• Govt/PPRS and manufacturer price negotiations prior to product launch e.g. French model.